Embed Size (px)
Citation preview

The development of a harmonized pan-European charging infrastructure for Electric Vehicles: Policy- Initiative interaction between EU and Member States Master of Science Thesis in Industrial Ecology
MAGDA A. COLLADO Department of Energy and the Environment Division of Environmental System Analysis Division of Physical Resource Theory CHALMERS UNIVERSITY OF TECHNOLOGY Göteborg, Sweden, 2013 Report No. 2013:6


The development of a harmonized pan-‐European charging infrastructure for Electric Vehicles: Policy-‐ Initiative interaction between EU and Member States MAGDA COLLADO Cover photo: comic sketch on electric vehicle markets Artist: Henry Payne 2013, available at www.gocomics.com. Environmental Systems Analysis and Physical Resource Theory Department of Energy and Environment Chalmers University of Technology 412 96 Göteborg, SE Telephone: +46 (0) 31-‐772 1000

PREFACE
This is a Thesis of Masters of Science in Industrial Ecology under the joint degree programme of Erasmus Mundus. It represents the culmination of two years studies that began in Karl Franzens Universität (Austria) and concluded in Chalmers University of Technology (Sweden). The study is carried out at the Energy and Environment Department under the co-‐supervision of the Division of Environmental System Analysis and Division of Physical Resource Theory.

ACKNOWLEDGEMENTS
I would like to give special thanks to my tutors Frances Sprei and Steven Sarasini, who guided and supported me throughout this whole process. Special thanks also to all the teachers that inspired me during these two years. Thanks to the MIND members, fellow students and friends, with whom I have formed a special bonds. This work is dedicated to my mother Lissette and my brother Adiac for all their unconditional love, support and understanding.
This thesis is one milestone, of what I hope are many more to come….
"Think left and think right And think low and think high, Oh, the things you can think up,
If only you Try” —Dr. Seuss
ABSTRACT
Electric Vehicles have been appointed as a means of decarbonizing the personal transport sector without curbing mobility. A charging network that addresses driving range, allowing for extended circulation, must support this emerging technology. Unfortunately, lack of stable policy framework has led to the development of a heterogeneous charging technology of incompatible connector plugs, vehicle inlets and charging standards. The recently proposed EU Directive (COM (2013) 18) on the Deployment of Alternative Fuel Infrastructure addresses this technology and market fragmentation by setting Charge Point targets and standardizing plug types. The main aim of this thesis is to examine how current policies and initiatives in individual Member State are achieving EU policy objectives for a harmonized Pan-‐European charging network for EVs. The study uses an innovative method for policy analysis, the Balance Scorecard (BSC), which had to be adapted from its original framework. The complimentary aim of this thesis is to modify the BSC method and explore its utility for policy analysis. Three Member States and their capitals are used as study cases: Germany-‐Berlin, The United Kingdom-‐London and Sweden-‐Stockholm. The cases provide a good combination of charge point requirements and local automotive industry presence. Results show selected cases meet 69% of the Directive’s requirements. Germany and The UK both have defined policy for charging infrastructure, not so Sweden. Different policy approaches have led to different charging infrastructure characteristics, with Germany having the highest standardization. The standard Type 2 Connector is offered in 95% of the Fast Charge Points, but only in 25% and 0% of Slow and Fast DC Charge Points respectively. Having different Payment methods was identified as hindering public accessibility. German and UK existing national policy will have to be adapted to increase the targeted amount of Charge Points and ensure their common technical specifications. Sweden can formulate a policy that complies with requirements from the beginning. The BSC proved utility as multidimensional policy analysis method, aligning strategy and objectives between EU and Member States. The biggest strength is the systematic framework that allows for comparison between varying cases. The framework has Benchmarketing possibilities to study different cases of electromobility (e.g. EU leaders and laggards, or between EU, USA, Chinese cities.

TABLE OF CONTENTS 1 Introduction .................................................................................................................. 1
2 Methodology ................................................................................................................. 4
3 Literature Review ....................................................................................................... 6
4 Deriving an analytical framework for a Pan-‐EU Harmonized Charging Network based on the BSC .............................................................................................. 8
5 Technical Background ............................................................................................ 14 Historical development of Electrical vehicles ................................................................ 14 Types of Electric Vehicles ..................................................................................................... 15 Batteries ...................................................................................................................................... 16 Charging Infrastructure ......................................................................................................... 17 Development of a standardized charging infrastructure .......................................... 20
6 Results ......................................................................................................................... 22 EU Policy Interaction .............................................................................................................. 22 Case Study Results ................................................................................................................... 27 6.1.1 National Policy Framework Development .................................................................. 27 6.1.2 Charging Network .................................................................................................................. 33 6.1.3 Common Technical Specifications .................................................................................. 38 6.1.4 Total Directive Achievement ............................................................................................ 43
7 Discussion ................................................................................................................... 44 Utility and limitations of the BSC ........................................................................................ 46
8 Conclusions ................................................................................................................ 48 Harmonization of charging infrastructure according to EU Policy ........................ 48 Utility of the Balanced Scorecard ....................................................................................... 49
9 Recommendations and further research ......................................................... 50
10 Bibliography ........................................................................................................... 51
11 Annex ......................................................................................................................... 54 Annex 1. Relevant Annexes of Directive COM (2013) 18 ............................................ 54 Annex 2. Key Point Indicators (KPIs) for BSC ................................................................ 57 Annex 3 BSC Formulary ......................................................................................................... 61 Annex 5 BSC summary ........................................................................................................... 63 Annex 6. Charging Points database and calculations .................................................. 65

ACRONYMS LIST
AC Alternating Current BEV Battery Electric Vehicle BSC Balanced Scorecard-‐ strategic management tool CI Charging Infrastructure CP Charging Point DC Direct Current EC European Commission, governing body of the European Union EREV Extended Range Electric Vehicle EU European Union: economic and political union of 27 member states,
located primarily in Europe EV/EVs Electric Vehicle(s) EVSE Electric Vehicle Supply Equipment – equipment that provides for the
transfer of energy between electric utility power and an electric vehicle.
ICE Internal combustion engine. OEM Original Equipment Manufacturer – In this document, this term
refers to automobile manufacturers. OLEV Office for low Emission Vehicles: agency of the UK Government-‐
Transport PHEV Plug-‐in Hybrid Electric Vehicle – vehicle utilizing both a battery and
an internal combustion engine (ICE) powered by either gasoline or diesel.
PiP Plugged in Places Program UK United Kingdom


1
1 INTRODUCTION
“Transport is fundamental to our economy and society. Mobility is vital for the internal market and for the quality of life of citizens, as they enjoy their freedom to travel. Transport enables economic growth and job creation: it must be sustainable in the light of the new challenges we face” (European Commission, 2010, p.4). The transport sector accounts for 24% of the global greenhouse gas (GHG) emissions (EEA, 2011). The European Commission has proposed a reduction of 60% of GHG by 2050 with respect to 1990 levels. This poses a big challenge, considering 96% of EU’s transport depends on oil and its products (EC, 2010d). Priority has been set on reducing emissions from road transport (17% of GHG emissions). At EU level, actions have been taken by setting legislation on CO2 emission standard on new vehicles (Regulation (EC) No. 443/2009) and fuel GHG intensity (Directive 2009/30/EC). Member states are encouraged to develop their own policies and strategies that will contribute to the EU global targets. Electric Vehicles (EVs) are one of the current technologies that have the capacity to maintain increased transportation demands while reducing the CO2 of the sector, especially if the electricity is produced from renewable resources. However, even with governmental economic incentives, EVs only had a 0.09% market share in Western Europe in 2011 (Automotive Industry Data cited in Forbes, 2012). The OECD report on Green Vehicle Markets has identified various challenges for the automotive industry, including, the lack of predictable future policy in fuel selection. As regards EVs, actors have expressed concerns related to charging infrastructure, restricted driving range and refuelling times. (Beltramello, 2012) The EU has adopted a technology-‐neutral approach to climate policy, which allows market dynamics to determine the path to meet GHG emission targets. Azar and Sandén (2011) reason how elusive and confusing the concept of ‘technology-‐neutral’ can be. The transport and energy sector require large investments in infrastructure and special planning between different private and public actors, policy prescriptions can encourage a shift to sustainable industrial models by providing long-‐term stable framework (Murphy and Gouldson, 2000). The European Commission (EC) acknowledges infrastructure and technology changes require time to develop and be implemented, with today’s choices

2
determining the future transport system in 2050 (European Commission, 2010d). It can then be argued that the transport sector should be guided by unified and technology-‐specific policies that can be implemented in all of member states and go in hand with global trends. The magnitude of change required to make a transition to a low carbon transport system calls for a harmonized EU level regulatory framework guiding the development in the Member States. The EU still lacks such harmonized framework because different Member States promote different alternative fuels. So far most of the EU policy has focused on the development of vehicles and fuels, but not on building up the fuel infrastructure required to support the system. (European Commission, 2011c) This poses a grave problem for the supply side of the automotive industry because they lack political stability to invest on specific fuels and technologies. Recently, the European Commission tried to address this problem by issuing the Clean Power for Transport: A European Alternative Fuels Strategy. This includes a proposal for a new Directive (COM(2013) 18) to guide the harmonized development of charging infrastructure for EVs at a Pan-‐European level. It commands Member States to set up a minimum of charging points of common technical specifications. Member States will be faced with the challenge to set up both, a policy framework and the required physical infrastructure for recharging electric vehicles. This suggests that policies should interact and compliment each other at a multi-‐governmental level in order to achieve the EU’s vision of a sustainable transport system, partly based on electric vehicles. While there have been many studies on incentives for the purchase (demand side) of EVs in order to build up the market share (Axsen et al., 2009, Choo and Mokhtarian, 2004, Sprei et al., 2011, Sprei and Wickelgren, 2011), there has been little research on policy support for charging infrastructure. With this problem in mind, this study aims to examine how the current policies and initiatives in individual Member State are contributing to the achievement of EU policy for a harmonized Pan-‐European charging network for Electric Vehicles. The first stage of this study is to identify relevant initiatives and their supporting policies driving the development of the recharging infrastructure of selected individual Member States. The second stage is the use of the Balanced Scorecard, a strategic performance management tool, for policy analysis. There is currently a lack of systematic frameworks that allow for quantitative policy analysis on a multidimensional level. The use of the BSC for policy analysis is still an innovative application of

3
this tool; therefore a second aim of this thesis is to explore its utility for policy analysis. It is used to compare the performance of the national initiatives against the achievement of the strategic objectives of the new directive (COM(2013) 18). The study focuses on three Member States, which represent different degrees of charging point requirements and have a strong vehicle manufacturing market:
• The United Kingdom-‐London • Germany-‐Berlin • Sweden-‐ Stockholm
The results of this study should provide a clearer overview of the current state of development of the charging infrastructure of selected Member States. As a complementary aim, it is an exploration to adapt the BSC methodology for policy analysis. Policy makers and interested parties can use both the results and the adapted BSC methodology developed by this thesis as a policy performance management tool.

4
2 METHODOLOGY
The main aim of this study is to examine how the current policies and initiatives in individual Member States are contributing to the achievement of EU policy for a harmonized Pan-‐European charging network for Electric Vehicles. In order to meet this aim this thesis utilizes mixed methods, which allows collecting and analyzing qualitative and quantitative data within a single study (Creswell and Clark, 2007). The nature of the research requires both: qualitative measures to understand the development of the charging network and quantitative measures to determine the achievement of the policy.
Methods
This thesis study begins with the analysis of the new Directive on the deployment of alternative fuels infrastructure (COM(2013) 18), from this point forward referred to as the Directive. Determining the Member States achievement of the Directive’s requirements demands a multidimensional analysis. This led to the exploration of a method that could systematically analyse and compare different cases. The Balanced Scorecard is the quantitative analysis method used to determine the current state of achievement of EU Policy. The use of the BSC for policy analysis is still an innovative application of this tool; therefore this study itself will be an exploration of its utility as a policy analysis method. The qualitative method used is Document Analysis. This method is useful for analysing a wide variety of documents in order to collect qualitative data and generate quantitative data for further use with the quantitative method. The method is used to summarize current EU policy framework as well as Member State Policies and Initiatives1 driving the deployment a harmonized charging infrastructure. Information has been gathered from the data sets in Table 1, these were selected based on their reliability as the official governmental sources of the selected cases:
1 Initiatives is referred to in this study as the projects created by public authorities as 1 Initiatives is referred to in this study as the projects created by public authorities as the initial action for the development of charging infrastructure.

5
Table 1. Information data sets and sources: Data Set Source Information provided
Policy
Public online resources of the European Commission, National and Local governments sites
Existing or proposal for policy related to recharging infrastructure
Initiatives Printed or online sources of public projects
Description of the project, technology specifications, business model and user acceptance of initiatives
Charging Infrastructure Database
Official appointed charge point database (e.g. online charge point maps)
Quantities and specifications of the charging infrastructure
Information is gathered for and divided into hierarchical level, starting with a policy review at EU level and followed by National and Local policy. Data for the initiatives is collected and divided into national and local level. The report is structured into a Literature Review (section 3) of policy analysis methods and description of the Balanced Scorecard. Section 4 describes more in detail the development of the Balanced Scorecard and explains further on how it will be used as the quantitative method designed to achieve the main aim of this study. Results are shown in section 6: the policy information from the European Commission is used to build a policy network to better examine the interaction between them (section 6.1); the information gathered for the national and local level is used for the BSC (section 6.2). The final sections are Discussions (section 7) and Conclusions (section 8) followed by Recommendations and further research (section 9)
Study delimitations
The Directive requires Member States to adopt national policy frameworks for the market development of alternative fuels and their infrastructure, setting binding targets for the build-‐up of charging points of common technical specifications (Annex I.) Three case studies were selected for national and local levels. The following national level cases were selected primarily based on the required charge point target and presence of a local automotive industry. These member states provide a good mix of high, medium and low representation of these aspects:

6
• Germany (DE): has the highest overall required charge points target (1503,000) and biggest automotive industry employer and manufacturer in the EU (ACEA, 2012).
• United Kingdom (UK): has the third high charge point target with 1,221,00 and is the fourth largest EU automotive employer
• Sweden (SE): has the ninth highest charge point target and is the eight largest EU automotive employers.
The local cases are the capital municipalities of the previously mentioned national cases. All local cases have a local government, allowing them to establish their own set of policies and initiatives:
• State of Berlin • Greater London • Stockholm Municipality
3 LITERATURE REVIEW
Policy calls upon political science, engineering and economic thoughts to design and implement a problem-‐solving strategy. Evaluating a policy is a scientific analysis, which requires an analytical and systematic method of assessing the policy based on determined criteria. (Crabbé and Leroy, 2008) Crabbé and Leroy (2008) give examples of available environmental policy analysis methods, such as case-‐study evaluation, cost-‐benefit analysis, and impact assessment, among others. All these methods have proved success and limitations to policy analysis. These traditional methods offer mostly a qualitative or quantitative analysis of policy. However, they are not appropriate for the aim of the thesis because they lack a systematically analytical framework to grasp policy interaction between different strategic levels while linking outcomes to objectives. This led to search for a method outside the traditional political science toolbox and into the business and industrial management science, of which the Balanced Scorecard offered a promising framework. Kaplan and Norton (1996) introduced the Balanced Scorecard in 1992. The current framework is a performance measurement and strategic management system designed with the purpose to:
• Clarify and translate vision and strategy • Communicate and link strategic objectives and measures • Plan, set targets, and align strategic initiatives • Enhance strategic feedback and learning

7
The BSC, already highly successful in the private sector, has been increasingly adopted by the public sector as an aid to improve performance and increase accountability. However, public sectors face some difficulties when implementing a BSC (Sharma and Gadenne, 2011). Kaplan and Norton (2001) point out this might be due to the difficulty the public sector has in linking their mission and associated strategies. Therefore, they propose a modified BSC framework where the Mission becomes the highest strategic level of the scorecard (Figure 1). They point out the BSC should be elaborated to measure the outcomes that the strategy is trying to achieve and then link these to the initiatives that are supposed to deliver them. If the measurements created are future oriented, then the BSC becomes a performance and strategic management system. The BSC has been used mostly in the private business sector, where the original framework measures strategic performance throughout four main perspectives: financial, customer, learning and growth and internal business process. Because a business is profit driven, the BSC is crafted to measure the creation of value through revenue growth and productivity. In this case the main perspective is the financial one. For non-‐profit organizations, such as the public sector, the creators of the BSC suggest other perspectives such as the ones described in figure 1. Perspectives can be tailored to achieve better strategic management of the mission (Kaplan and Norton, 2001).
Figure 1 Three perspectives for Public Sector Agencies (Adapted from Kaplan and Norton, 2001, p. 101)

8
The BSC has also been applied as an ‘eco-‐controlling tool’, where a fifth perspective can be added for sustainability measurements. This is done in the case where the four standard perspectives cannot fully depict the sustainability strategy of more recent business models (Figge et al., 2002). There is evidence that the BSC framework can be modified for being used for Government agencies (Sharma and Gadenne, 2011, Kaplan and Norton, 2001, Chan, 2004) or to incorporate sustainability performance (Figge et al., 2002) into business practices. Adapting the four classic perspectives of the BSC can do this. The BSC creators developed the four perspectives mentioned initially as a template, however, the perspectives can be adapted to suit the strategy that is trying to be transmitted (Kaplan and Norton, 1996). With this in mind, one can say that the BSC might also be applied for policy analysis, however this requires modifications to the original methodology. The following section describes the modified BSC methodology used in this study.
4 DERIVING AN ANALYTICAL FRAMEWORK FOR A PAN-‐EU HARMONIZED
CHARGING NETWORK BASED ON THE BSC
This study will be based on an adapted BSC framework suggested by Kaplan and Norton (2001) for Non Profit Organizations (such as governmental agencies as in this case) Top management uses the BSC to measure the performance of all their business units; the multi-‐level alignment (both horizontal and vertical) created provides an overview of the overall performance of the company’s strategic goals. (Balanced Scorecard Institute, 2009). Similarly, in this study’s case the EU can be seen as top management (Figure 2), where the policy set at this level become the Vision and Mission for the development of the Electric Vehicle transport system. The strategy set forward by this policy must then be cascaded down the bottom tier levels. Member states must then align their own policy framework to meet the objectives of the EU. Likewise, the Local Government must be aligned to National Government. Finally, the initiatives are the projects in which the vision has to be put into practice. At this level, measuring the performance of the initiatives can determine how the strategy is being met.

9
Figure 2. Hierarchical levels of BSC for policy analysis
The BSC will be used to compare the performance of the national initiatives against the achievement of the strategic objectives of the new directive on the deployment of alternative fuel infrastructure ( COM(2013) 18). The perspectives of the BSC are defined according the Mission (strategy) of the European Commission as defined in the Directive. The following perspectives were selected based on the Legal Requirements of the Proposal (See Annex I for complete requirements):
• National policy for market development of alternative fuels: defined in Article. 3 and Annex I of the Directive, requires each Member State to adopt a national policy framework with the minimum requirements:
o Regulatory framework (building permits, parking lot permits, environmental performance of business certifications, fuel station concessions, etc.)
o Supporting policy measures (taxes, purchase incentives, public procurement etc.)
o Deployment and manufacturing support (Allocation of public budget)
o Research, technology development and demonstration (Allocation of public budget)
o Establish targets for deployment of alternative fuels and infrastructure
• Charging network: defined by Article. 4, Member States must ensure:
• Mission and Vision • Strategic Objectives EU
• National Policy Framework Member States
• Local Policy Framework Local
Governments • Operationalization of objectives • Charging Infrastructure characteristics
Initiatives

10
o Minimum number of recharging points (According to Annex II of the directive) put into place by 2020
o 10% of all recharging points must be publically accessible2 o Publicly accessible recharging points must be equipped with
intelligent metering systems o Minimum of two recharging points per vehicles available for full
recharging o Publicly accessible recharging points for intermittent topping-‐up
to overcome range anxiety.
• Common technical specifications: defined by Article 4 and Annex III of the directive:
Table 2. Directive standard connector specifications Charge Type Current Deadline Connector
Slow AC 2015 Type 2, Standard
EN62196-‐2:2012
Fast
AC 2017 Type 2, Standard
EN62196-‐2:2012
DC 2017 Type “Combo 2” EN
Standard to be adopted by 2014
According to the original BSC framework, for each perspective there should be a set of objectives, measures (Key Point Indicators, explained further on), targets and initiatives. The complete indicator framework for this study set can be found in Annex 2. The BSC is built using the Nine Steps to Success ™ approach suggested by the Balanced Scorecard institute: Step One: Assessment-‐ What is the EU’s Mission and Vision as regards Charging Network for Electric Vehicles? Step Two: Strategy -‐ Identify the strategic results that wish to be achieved by the EU. Mapping out the policies at EU level allows for a better understanding of the supporting policies, permitting the study to focus specifically on Directive COM(2013) 18. Step Three: Objectives -‐ use the strategic elements identified in step 1 and 2 to determine the strategic objectives that define the strategic intent.
2 “Publicly accessible” is defined by the Directive as a recharging point that provides non-‐discriminatory access to the users.

11
Step Four: Strategy Map-‐ the purpose of this step is to determine the cause-‐and-‐effect link between the strategic objectives and arrange them into the three strategic perspectives defined above. Step Five: Performance Measures-‐ strategic objectives are measured by Key Performance Indicators (KPIs). The KPIs have a defined baseline, goal (expected value), real value and achievement. Figure 3 shows how KPIs measure the accomplishment (A%) of a strategy based on how the current value (R) bridges the gap between the starting point (BL) and the objective’s target (G). The following equation (Eq 1) is used to calculate the percentage of achievement:
EQ. 1: 𝐴𝑐ℎ𝑖𝑒𝑣𝑒𝑚𝑒𝑛𝑡 𝐴% = !"#$ !"#$% ! !!"#$%&'$ !"!"#$ ! !!"#$%&'$ [!"]
× 100%
This level of achievement is called the Success Factor and it is classified according to its result, the colour scheme is used is as visual aid to identify the current state of the indicators:
Success Factor
Category Colour
Satisfactory 67-‐100%
Needs Improvement 33-‐66%
Not Satisfactory <33%
The original BSC framework requires a weight to be assigning to the KPIs, not all indicators are regarded as equally important for achieving the strategy. Different
A%
BL R G
Figure 3. Measuring KPIs

12
weights are assigned according top management/governing body’s consideration. This study has a framework of 17 KPIs; in order to avoid the researcher’s bias the total weight of 100% could be divided equally between all KPIs. All KPIs were assigned equal weight of 5%, except the following three, which have a 10% weight:
• 2.1-‐Current number of installed CP according to EU directive • 3.1-‐ Percentage of type 2 Slow CP • 3.2-‐ Percentage of type 2 Fast CP
This is done under the consideration that these three KPIs represent the main expected outcome of the directive and should therefore have higher weight. Step Six: Initiatives -‐ this step includes identifying the initiatives that have been set up at national level and even at local level. Step Seven: Performance Analysis-‐ All initiatives are analysed systematically using the same BSC framework. The BSC is built on Microsoft Excel and contains:
• Baseline: was set to 0 on all indicators in order to assume that 2013 is the starting point in all the study cases, allowing for more comparability.
• Expected value: direct input value, based on the target for the specific KPI, given by Directive or national and local policy.
• Real value: direct input value, based on the current state of the specific KPI.
• Achievement: directly calculated using the Excel conditional equation IF (Refer to Annex III for Excel formulas)
• Formula for % Weighted: directly calculated using the Excel conditional equation IF.
Step Eight: Alignment -‐ Cascading : A BSC is created for each Local Government (e.g. London in the UK) and its Member States. Then all the BSC for the individual Member State are united to form a BSC at EU level (represented only by the chosen countries). Cascading translates high-‐level strategy into lower-‐level objectives, measures, and operational details and is the key to policy alignment. This allows for a horizontal evaluation of the Member States performance and for a vertical evaluation of the integration to EU Policy.

13
Step Nine: Evaluation -‐ Strategy Results -‐ this section is the concluding part of the study. Suggestions are given based on the information gathered from the identified initiatives and policies. These suggestions feed from the advantages demonstrated by present initiatives and the gaps identified by policy at Member State level. The concluding suggestions should help in the development of a harmonized EU policy framework that promotes the development of the charging infrastructure necessary for a Pan-‐European EV transport system.

14
5 TECHNICAL BACKGROUND
The following chapter aims to give an overview of the technology behind electric vehicles in order to help the reader get familiar with the terminology that will be used here on.
Historical development of Electrical vehicles
The electric motor was invented in 1821 but it was not until 1893 that Varta Batteries produced the first battery electric vehicle, the Baker Runabout, in the USA. By 1901 New York’s elite were driving around on electric taxis (figure 4). (Larminie and Lowry, 2012)
Figure 3. New York 1901, Actress Lily Langtree taking a battery electric taxi.
EV manufacturers were the biggest carmakers in the USA, EVs made up to 34% of the vehicle fleet of Chicago, Boston and New York. They were preferred over internal combustion engines (ICEs) thanks to their reliable and instant start, whereas their contenders had to be cranked up manually (Koerth-‐Baker, 2012). Kirsch (2000) retells how at the beginning of the 20th century, manufacturers assumed their customers lacked the know-‐how and charging facilities to operate their own car, so they preferred a leasing business model. In 1911, the self-‐starter for the ICE had been invented and oil had become cheaper, increasing the appeal of ICE technology. Larminie and Lowry, (2012) point out some advantages the ICE has over EVs:

15
• Smaller volume and weight of engines thanks to higher specific energy 3 of Petrol over batteries.
• Fuelling time, recharging a battery could be up to 8 hours while a 45L petrol engine can be completely fuelled in minutes.
• Battery costs and lifespan: for the comparative range of 500km given by a 45L petrol, a battery would have to weigh 2.7 tones and cost €9,000 with a 5 year lifespan.
• Driving range: limited to an average 160 miles for a fully charged battery. These factors, among others, gave the ICE a significant advantage over the EV early on, turning it into the technology of choice that has dominated the road transport-‐system to this day.
Types of Electric Vehicles
The World Electric Vehicle Association (WEVA) defines an Electric Vehicle as one where “the torque is supplied to the wheels by an electric motor that is powered either solely by a battery, or in combination with an internal combustion engine using gasoline or diesel, or, by a fuel cell.” For the purpose of this study, from now on Electric Vehicle will refer specifically to three plug-‐in vehicle architecture types that require energy to be supplied by the grid.
3 Specific energy: also known as energy density, is the energy stored per unit of mass. The SI unit is J/kg , and in this context Wh/kg, where 1Wh=3600J
Figure 5. Electric drive arrangements (source: OLEV,2012)
16
PHEV: is equipped with a battery that can be charged directly by plugging it into the grid. The PHEV’s battery can provide enough energy to run the car solely on electricity for a certain range. Once the battery energy has ben consumed the vehicle runs on hybrid mode, with the power being provided by ICE and complimented by regenerative breaking. E-‐REV: also has both, battery pack and ICE. The vehicle is propelled with the electric motor, where the ICE serves as generator recharging the depleted batteries. Battery Electric Vehicle (BEV): also referred to as just Electric Vehicle or ‘pure’ Electrical Vehicle it is powered solely on electricity stored in on-‐board rechargeable batteries. It consists of an electric motor, battery pack and controller. The battery is recharged with electricity supply from a plug and battery-‐charging unit, which can be on-‐board or available at the charging point. The controller determines the vehicle speed by regulating the power delivered to the motor. Regenerative breaking can be used to recover kinetic energy and feed it back to the battery. There are several small vehicles commercially available, including electric bicycles and commuter vehicles (e.g. golf carts). Personal road transport vehicles include the Nissan LEAF, Tesla Model S, BMW ActiveE, Mitsubishi MiEV, Coda Sedan, and Smart ED. (Larminie and Lowry, 2012, Electric Drive Transportation Association, 2013).
Batteries
All EVs have a battery; they are the main limiting range performance (Larminie and Lowry 2012). Batteries are composed of interconnected electric cells, formed by positive and negative electrodes in an electrolyte. The chemical reactions in the cells produce DC electricity, reversing the current produces the opposite chemical reaction, returning charge to the battery. The most common battery is Lithium Ion (See Annex 4 for battery parameters). Battery performance is affected by the “driving behaviour” when operating an EV. When assessing batteries, the most common terms of reference are the following basic parameters:
• Voltage (V): the potential to deliver electrical power, usually 6V or 12V for EVs. The real voltage of a battery is determined by factors that include temperature and ‘state of charge’.

17
• Charge capacity (Ah): nominal electric charge that can be supplied by the battery, measured in Amp hour (Ah). Charge capacity decreases with faster discharge currents.
• Energy stored: measured in Watt per hours, it depends on the voltage and charge stored.
• Energy Efficiency: ratio between electrical energy supplied by the battery and that required charging it to its original state. Rapid charges and discharges decrease its energy efficiency. This parameter is the one used to compare between batteries.
• Battery life and deep cycles: measured by the capacity to undergo charge. EV batteries should be able to undergo deep cycle (discharge until 20% of its capacity) a few hundred times; the more deep cycle the less battery life.
Charging Infrastructure
An electric vehicle charging station, also known as electric recharge point, charge point and Electric Vehicle Supply Equipment (EVSE), is an infrastructure element that can supply electric energy to recharge all EVs with a battery (Fuel cell vehicles are not supported). From now on, the term used will be Charge Point (CP). Figure 6 shows the major components of an EV charging system. The charge stands or points, found in the form of pedestal-‐mounted box (Figure 7A) or wall-‐mounted (figure 7B), is equipped with a socket-‐outlet (Figure 6C). The charging cable must have a compatible charging plug (Figure 6D) and a charging connector (figure 6E) for the vehicle plug or inlet (figure 6F).
Figure 6. Recharging Infrastructure Components (Adapted from Chargepoint and Mennekes)
A CB D
E F

18
The previous image shows only one standardized charging system arrangement. However, there are different combinations currently in use, varying in charge mode, power level and plug types. The following is a summary of the terminology used to describe the characteristics of a charge point: Charge levels: is the nomenclature used mostly in the US by the Society of Automotive Engineers (SAE) that classifies the charging power levels based on voltage and time. Yilmaz and Krein (2013) summarize the standard in the following table: Table 3. Charging Power Levels based on SAE Standard
Charge Modes: international standard (used primarily in Europe) used to classify charging equipment configurations. The IEC 621964 applies to plugs, socket-‐outlets, connectors, inlets and cable assemblies for EVs: Table 4. Charging Modes Charging Mode Description Single-‐Phase Three-‐phase
Mode 1 AC supply network (mains) with standardized socket-‐outlets
16 A 3.7 kW
16A 11.0 kW
Mode 2 AC supply network. 5PWM module in the charging cable
32 A 7.4 kW
32 A 22.0 kW
Mode 3
AC supply network using an electric vehicle supply equipment.
PWM module in the charging station.
Interlocking in the vehicle and in the charging socket
63 A 14.5 kW
63A 43.5 kW
4 IEC 62196 is an international standard for set of electrical connectors and charging modes for electric vehicles and is maintained by the International Electrotechnical Commission (IEC). 5 Pulse width modulation: electronic controller to adjust charging rates according to battery's level

19
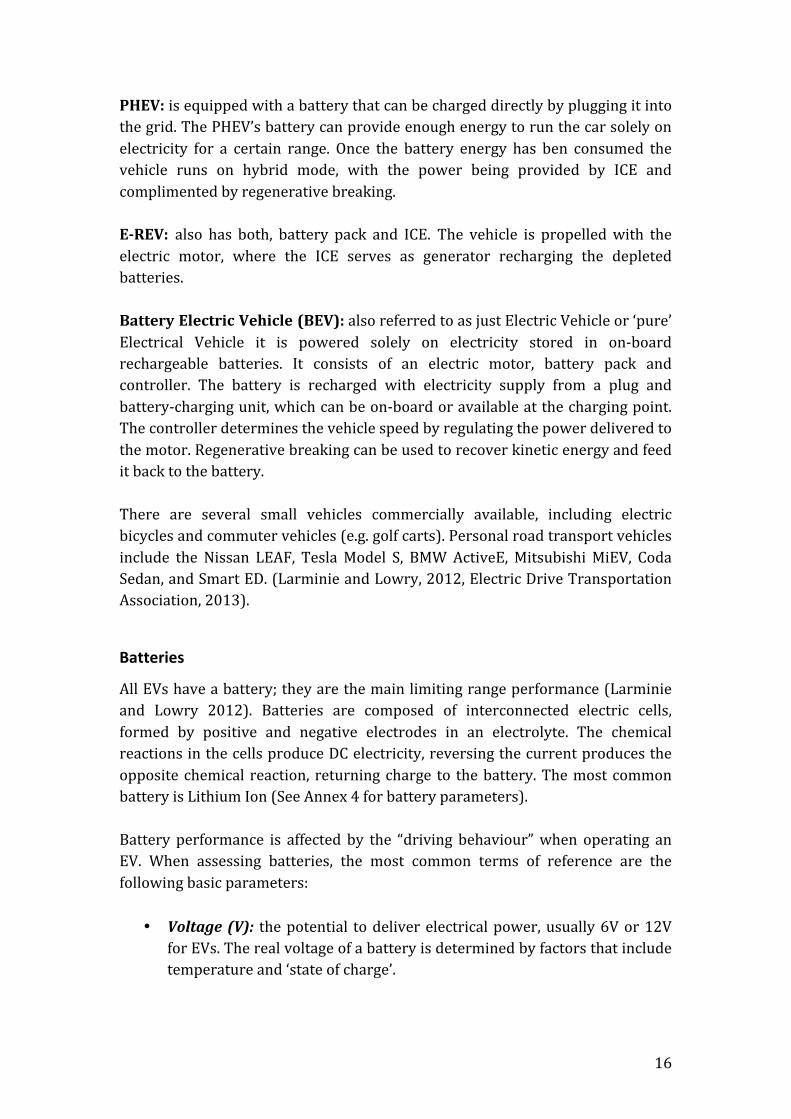
Modes 2 and 3 require a safety feature known as Control Pilot (CP), which establishes communication between the charging station and the vehicle. This features checks earthed conductor connection to the vehicle and adjusts charging accordingly, allowing the charging to begin. This monitoring system also terminates the charge process once the full charge has been reached or the charging station’s capacity has been exceeded. (Mennekes, 2012) Phases: electric power phases refer to the distribution of alternating current electric power. Single-‐phase is a system in which all the voltages of the supply vary in unison. A three-‐phase system is that in which maximum voltage is supplied in the form of three sequential currents. (Stevenson, 1982) Plug types: refers to the available connector configurations (Table 5). The IEC (2011) approved a standard (IEC 62196-‐2) for three plug types for AC and one in progress for DC (IEC 62196-‐2): Table 5. EV Plug types
Type Specification Standard Region Image
Type 1
Single phase vehicle coupler Available in AC, DC and Combo (AC/DC)
SAE J1772/2009 USA
AC and DC
Combo
Type 2
Single and three phase vehicle coupler Available in AC, DC and Combo
VDE-‐AR-‐E 2623-‐2-‐2
EU
AC and DC
Combo
Type 3
Single and three phase vehicle coupler equipped with safety shutters
EV Plug Alliance proposal
France and Italy
20
Type 4
Fast charge coupler Only available in DC
CHAdeMO Japan
Development of a standardized charging infrastructure
The previous section describes all the different configurations possible for Charge Points; plugs especially, have great physical difference between them. This lack of standardization has led to OEMs to manufacture EVs with different inlets, requiring different connectors on the charging infrastructure. On the contrary, ICE fuelling system is internationally standardized. Having a standardized recharging system also allows users to grow more familiar with a new technology. The ACEA6 (2011) published a position paper asking the EC to define a “clear roadmap” of policies for the development of the EV market in Europe. Furthermore, they asked for availability of appropriate harmonized recharging infrastructure and urged on the quick standardization of a common interface (vehicle-‐to-‐infrastructure), without which EVs cannot be successfully introduced in the market. Then again in 2012, they published another position paper urging a final agreement for an AC charging standard. The group suggested the Type 2/ Type 2 Combo to be the standard AC/DC (both on the vehicle inlet and Charge Point) charging interface used in the EU. Their suggestion was based on compatibility between AC/DC charging as well as the flexibility to be combined with fast DC charging in the short future. Furthermore, it is the only existing solution that can be used on both the vehicle and public infrastructure that is ready for all kinds of charging, ensuring EU-‐wide interoperability. The shape of the enclosure profile is similar to that of the SAE J1772, which allows for streamlining with US charging systems. (ACEA, 2012a) EURELECTRIC7 (2012) also urged the EC to define a common standard, agreeing with the ACEA on the use of the Type 2 plug and suggested the use of Mode 3. Both bodies agreed on the urgent need for a standard and cautioned the risk of market fragmentation and high costs (lack of economy of scale).
6 The European Automobile Manufacturers’ Association (ACEA) is an economic interest group representing the fifteen European car, truck and bus manufacturers at EU level 7 The Union of the Electricity Industry (EURELECTRIC) is the sector association that represents the common interests of the electricity industry at pan-‐European level, plus its affiliates and associates on several other continents. They currently represent the electricity industry in 32 European countries.
21
Brussels, January 7th 2013, the ACEA issued a press released in which they again cautioned not meeting the EU’s goal for electromobility due to lack of standardization. With a bad economic situation and declining vehicle sales, they lowered their EV market expectations from 3-‐10% to roughly 2-‐8% for 2020. According to the group, by then it was already too late for the current EVs in the market to have a common charging interface, however if vehicle manufacturers were to redesign upcoming fleets they desperately needed a stable policy framework. (ACEA, 2013b) Finally, on January 24th 2013 the EU launched the COM(2013) 17 Clean Fuel Strategy and COM(2013) 18 Directive on the deployment of alternative fuels infrastructure. With this policy package the EU put an end to the disparities and selected its winner: Type 2/ Type 2 Combo plug with Mode 3 charging. The German company Mennekes developed the Type 2 plug. It was selected under the premises that it is already the most widely in Germany, Italy and the UK. While other EU members, like France, favour the use Type 3 plug. The Directive sets binding targets that give manufacturers the security needed to determine the future technology trajectory and allow for economy of scale manufacturing. The Directive also established a target for an amount of standardized recharging infrastructure for individual Member States. Furthermore, it requires Member States present National Policy framework for alternative fuel market by December 2013. Commissioner Hedegaard (2013) endorsed the strategy stating “We can finally stop the chicken and the egg discussion on whether infrastructure needs to be there before the large scale roll-‐out of electric vehicles. With our proposed binding targets for charging points using a common plug, electric vehicles are set to hit the road in Europe. This is climate mainstreaming in action. And a win for the climate, businesses, consumers and jobs." The ACEA also welcomed the directive, pointing out a single common plug for all Member States should kick-‐start a stronger EV market uptake while giving clear direction for the future (ACEA, 2013a) The challenge for the EV sector in Europe now will be the deployment of such harmonized charging infrastructure for Pan-‐European electromobility. According to the EC, Member States can tap into EU support from TEN-‐T funds, cohesion and structural funds. The Commission argues that this change can be implemented without increasing taxes for public spending by changing local regulations, encouraging private sector investment and behaviour change.

22
6 RESULTS
EU Policy Interaction
The following section is a review of the policies influencing the development of Electric Vehicles within the European Union. In order to keep within the scope of the study, the policies will be identified specifically on their influence in the deployment of a standardized charging infrastructure network for EVs within Europe. Ideally, a proper policy framework will allow for EU and National support measures to help build up an internal market for a charging infrastructure network on the lowest tier, while maintaining enough coordination for a Union-‐wide mobility of EVs and achieving the goals on the highest level. Taking up on the strength of the BSC methodology, the first step is to determine mission and vision established for the future transport system, focused primarily on electrification. Graph 1. gives an overview of the top tier policy interaction that supports the development of a homogeneous pan-‐European EV charging infrastructure. The network shows how one policy instrument gives way to the other on a lower strategical level, for example Europe 2020 gives ways to the three Flagship Initiatives shown below.

23
Graph 1. EU level policy interaction
Policy Objective Target
Miss
ion
Visio
n
Smart, sustainable and inclusive growth for the European Union
1. Employment: 75% 20-‐64 year-‐olds employed 2. R&D: 3% EU's GDP 3. Climate change and energy sustainability: • GHG 20% lower than 1990 • 20% of energy from renewables • 20% increase in energy efficiency
Stra
tegi
c In
itiat
ives
Competitive transport system with increased mobility, remove market barriers, fuel growth and employment, reducing Europe's dependence on imported oil and cut carbon emissions in transport.
• 60% GHG reduction from Transport by 2050 • 10% market share of renewables in transport fuels • 0 conventionally fuelled cars in cities by 2050
Ope
ratio
nal P
rogr
ams
Long-‐term policy framework guiding coherent technological development on alternative fuels
• 795,000 CP • Type 2 plug • 8-‐9 million EVs
Support the build-‐up of alternative fuel infrastructure Common technical specifications and coverage to achieve Union-‐wide circulation of EVs
• MS Policy Framework for alternative fuels market • Minimum CP for EVs • 10% publically accessible RP • Type 2 AC (slow/fast charge) and Combo 2 DC (fast charge
Energy Efficiency Plan
COM(2011)109
EU2020: Europe’s Growth Strategy COM(2011)2020
Industrial Policy for the
Globalization Era COM(2010) 614
Innovation Union
COM(2010) 546
Resource Efficient Europe COM(2011)21
White Paper on Transport
COM(2011)144
Clean Power for Transport: EU Alternative Fuels Strategy
COM(2013)17
Directive on the Deployment of Alternative Fuel Infrastructure COM(2013)18
European Single Market
COM (2012)573

24
Mission and Vision From the previous graph we can see that Europe 2020: Europe’s Growth Strategy COM(2011) 2020 is the highest policy and sets the mission and vision, determining the strategic framework in which the succeeding policies should be developed. The European Commission (2010c) determined that in order to meet the Europe 2020 objective of sustainable, smart and inclusive European growth, they must achieve a series of five targets. Subsequently, the EC has also established 7 Flagship Initiatives designed to reach such targets. The targets column shows the three major sets of targets whose achievement can be linked to transport. These targets are addressed mainly by the following three Flagship Initiatives:
1. Resource efficient Europe: supports the shift towards a resource-‐efficient and low-‐carbon economy. It is relevant for the study because it supports policy in the area of climate change, energy, transport, industry and regional development. (European Commission, 2011a) This flagship initiative addresses more directly the climate change and energy sustainability targets. It introduces the need to present a transport system by 2050 that is low-‐carbon, resource-‐efficient, secure and competitive, while removing all internal market obstacles and promotes the development of clean technologies and modern transport networks
2. An industrial policy for the globalisation era: aims at integrating
policies in the area of competition, trade, innovation or energy. Section 4 of this initiative calls upon strengthening the EU Single Market by, among other things, improving the transport and energy infrastructure networks, allowing for cross-‐border integration. Furthermore, it points out the economic benefits that harmonization and standardization (European, international and national) can bring to economies of scales and competitiveness of the European Industry both locally and internationally (European Commission, 2010a). In this document, the Commission acknowledges standards as enablers of innovation, which should be supported by policy in order to foster emerging technologies (such as the electric vehicle) by reducing barriers and increase adoption on scales of economy.
3. Innovation Union: developed with the purpose of improving the European innovation system in order to create more products, services

25
and business models and with it more jobs and market growth. (European Commission, 2010b) Action plans under this initiative aim to make Europe a world-‐class science performer; remove innovation obstacles (expensive patenting, market fragmentation, standardization and skills shortages); and enable Innovation Partnerships between the European institutions, national and regional authorities and business. This initiative provides institutional support and financial support to innovators and the development of SMEs, notably sustainable business models.
Strategic Initiatives The policy interaction graph shows there is a high level of relationship between the EU Flagship Initiatives, as the synergy between them is what helps achieve the EU 2020 Strategy. Therefore, no single Flagship Initiative is held completely accountable for a single target, even if some might have bigger influence on a specific target than others. All of the previous Flagship Initiatives call upon a new transport system and set the supporting framework for the development of more concrete actions in the form of roadmaps. The following three are major enablers for the deployment of a harmonized charging network:
1. EU Single Market Act: key tool to achieve a highly competitive social market economy by allowing free movement of goods and services within Member States. It aims at removing barriers for the development of new technologies, including the transport system. A Single Market requires efficient, integrated and sustainable transport and energy infrastructure networks. This act thus enforces of the European standardization regulation (No. 1025/2012) in order to facilitate interoperability, both at European and international level.
2. Energy Efficiency Plan: the COM(2011) 109 relates to the 20% target
aimed at reducing primary energy consumption. It determines that transport consumes 32% of the final energy and thus has high saving potential. This plan requires that there is a 10% market share of renewable energy within the transport sector. (European Commission, 2011b). This plan also aims at increasing the renewable energy supply and eliminating trans border barriers for the electricity market.
26
It also retakes the Directive 2009/72/EC, which allows consumers to select the electricity supplier of their choice, regardless of the Member State in which they reside. It also requires that Member States provide intelligent metering systems that enable electricity consumers to have more active participation in the electricity supply market. Such metering systems should ensure European interoperability. This is a positive stimulus for the electrification of transport because it creates solid framework grounds regulating the electricity supply on which the recharging network must be built upon.
3. White Paper on Transport: this roadmap brings together the strengths
of the Flagship Initiatives and related policies and establishes the targets the transport sector must meet in order to achieve the upper level targets imposed by Europe 2020. The biggest targets related to electrification are the reduction of 60% of GHG from the sector, as well as eliminating conventionally fuelled vehicles from cities by 2050. It also addresses Directive’s 2009/28/EC requirement of having 10% market shares in transport fuels. Even when the EU operates under technology neutrality, these three targets set a very limiting technological path, in which natural gas and electricity prevail over the other forms of alternative fuels. (European Commission, 2010d)
Operational Programs The Commission’s latest efforts in developing a more sustainable passenger transport sector came with the proposal of more specific Directives COM (2013) 17 and COM (2013) 18. Both of these tackle the development of a harmonized infrastructure for alternative fuels. The first presents the vision of the Commission to establish a long-‐term framework that guides the strategic development of the infrastructure for alternative fuels supported by the EU, where electricity is signalled out to be one of the fuels of most importance. Directive COM(2013) 18 sets specific targets that all Member States must meet in regards to the alternative fuel infrastructure:

27
• Present a National Policy Framework for alternative fuel markets that complies with COM(2013) 18 by December 2013.
• Install a minimum of electric vehicle recharging points determined for each Member State (Annex I)
• Install a minimum of publicly accessible recharging points (10% of total) • Recharging points must be standardized according the following technical
specifications: The Directive’s binding targets are set to put an end to the disparities regarding recharging technologies for EVs within the EU.
Case Study Results
The following section is a result of an in depth document analysis in order to determine the current state of the charging infrastructure of the selected Member States. The Balanced Scorecard, as described in methodology, is used to systematically evaluate their level of achievement of the Directive on alternative fuel infrastructure.
6.1.1 National Policy Framework Development The Directive COM (2013) 18 requires EU Member States to set up a national framework that guides the development of on alternative fuels infrastructure, hence on of the BSC perspectives is the National Policy Framework. Graph 2 shows how the Member States and their local governments are achieving the directives requirements on this perspective. A more in depth description on National Policy Framework of the selected cases is given in the following section. (Refer to Annex 5 for the complete balanced scorecards for the individual cases). The Directive in its Annex I only specifies the minimum requirements that should be met by National Policy Framework, without establishing evaluation criteria. Therefore the KPIs have been formulated (see Annex II for methodology) to identify whether the Policy Framework includes these requirements and not to evaluate whether they are appropriate or not, as this is outside the scope of the study. From graph 2 we can observe the current policy framework for the selected cases have an overall high achievement of what is required by them from the Directive. However, all are lacking in terms of setting Charge Point Targets equal or higher to does of the directive.

28
Graph 2. National Policy Framework KPIs
Perspective KPI Achievement
UK London Germany Berlin Sweden Stockholm Average
National Policy
Framework (30%)
Existing Policy for charging infrastructure
100% 100% 100% 100% 50% 0% 75%
Regulated CP installation for developers
100% 100% 100% 100% 0% 0% 67%
Available supporting policy measures 100% 100% 100% 100% 100% 100% 100%
Available R&D economic support
100% 100% 100% 100% 100% 100% 100%
Available economic support for OEMs
100% 100% 100% 100% 0% 0% 67%
National CP target 1% NM 63% NM 0% NM 21%
29
6.1.1.1 The United Kingdom and London The development of electric vehicle sector in the UK is driven by the policy “Reducing greenhouse gases and other emissions from transport”. Decarbonizing the Transport sector is one of the measures identified to help meet the 80% GHG reduction binding targets set by the 2008 Climate Change Act8. (UK Government, 2012) As shown in graph 2, UK achieves 100% on Existing Policy for Charging Infrastructure. The UK government issued the Plug-‐In Vehicle Infrastructure Strategy “Making The Connection” in 2011. This strategy serves as the UK’s framework for the development of recharging infrastructure for plug-‐in vehicles and is carried out by the Office for Low Emission Vehicles (OLEV)9. The major initiative derived from this strategy is the Plugged-‐in-‐Places (PiP), a governmental match-‐funding programme for the installation of charging points. Funding was given to eight PiPs, including London, with which they expect to fund up to 8,500 charge points across the UK. (OLEV, 2013) The local level also achieves 100%, in 2009 the Greater London Authority delivered its own strategy “Electric Vehicle Delivery Plan for London” complemented by the “London’s Electric Vehicle Infrastructure Strategy” (Source London, 2013). The first strategy targets the development of the electric vehicle systems as a whole, while the second gives mores specific guidelines on the infrastructure rollout. There is a 100% achievement of Regulated provision of charge points at both national and local level. In the UK, the provision of charging points is regulated in the National Planning Policy, which requires a designated amount of parking spaces only for EVs, with a percentage of them having charge points installed (OLEV, 2011). Similarly, the London Plan 2011 requires that 1 in 5 public parking spaces provide an electrical charging point. Charge points are also be included in new building developments and those that are to be retrofitted. This includes the provision of charge points on on-‐street parking in residential areas with no designated parking (Greater London Authority, 2011).
8Legally binding Act to set a target for the year 2050 for the reduction of targeted greenhouse gas emissions 9 Cross-‐government partnership between Department of Transport (DfT), Department for Business, Innovation and Skills (BIS) and Department of Energy and Climate Change (DECC)

30
There is a 100% achievement regarding Available supporting policy measures, both at national and local level. At national level, OLEV provides funding for the purchase of electric vehicles, such as The Low Carbon Vehicle Public Procurement, Plug-‐in Van Grant, Plug-‐in Car Grant. At local level, in London, EVs are excluded from Congestion Charge (currently worth up to €1,666 10 a year). Households in the country can also ask for a differentiated electricity tariff for their charge point, preferential night rates of €6/unit compared to 10€/unit day rates (Source London, 2013, SSE, 2013). The previously mentioned supportive measures are given out by the OLEV, which has budget of over €480 million designated for the achievement of the UK strategy. Of these, approximately €98.4 million is given for low carbon vehicle technology R&D (including charging infrastructure). Up to €44.4 million is specifically assigned to the PiP programs for the manufacturing and installation of charge points. The Electric Vehicle Delivery Plan of London has a fund of €72, provided by local and governmental financial resources, plus €60 million fund for CENEX for all low carbon technology R&D and £20 million for Infrastructure development. With a high available economic support, both the UK and London achieve 100% in these indicators. With the PiP programs, the UK aims at supporting 8,500 charge points by 2015 (OLEV, 2011). This quantity stated in their strategy is the closest the UK has to a set target of Charge Points, below the minimum 1,221,000 required by the Directive. Therefore the UK scores 0% for National Charge Point Target. London has a higher target of 25000 charge points by 2015 (Source London, 2013). However, it is considered “Not Measureable” because the Directive requires this Charge Point target to be set at national level and not local.
6.1.1.2 Germany and Berlin The introduction of electromobility11 in German is driven by the need to meet the targets of the German Federal Government’s Integrated Energy and Climate Programme (IA-‐HEV, 2013). At a national level Germany scores 100% Existing Policy thanks to the National Development Plan for Electromobility (NEPE). The NEPE, established in 2009, aims at promoting research and development, market preparation and the market introduction of EVs in Germany (BMU, 2013). The office in charge of the development is the National Platform For Electromobility (NEP). 10 Exchange rate: €1.20-‐£1 11 Defined by the NEP as the system of electric drive vehicles and their charging infrastructure.

31
The NEPE establishes a systemic approach for the introduction of electromobility, where charging infrastructure is one part of the system. The first phase is the market preparation up to 2014 (NPE, 2010) during which the German Standardization Roadmap for Electromobility12 is used as a guiding framework for a standardized rollout of charging infrastructure in Germany (NPE, 2012). Germany’s goal is to build up charging infrastructure based on demand, starting at local or regional level (NEPE, 2009). To create this demand (BMVBS, 2013), eight pilot regions were selected in 2009 to host large-scale electromobility showcases “Modellregionen Elektromobilität” (Model Regions Electric Mobility”) Berlin also scores 100% on Existing Policy. As a result of the Model Regions program, the local government has adopted the “Berlin is going electric, Action Plan for Electromobility Berlin 2020”. This action plan led by the eMO-‐Berlin13 seeks to use Berlin as a living lab for the introduction of charging infrastructure. Regarding the Regulated Charge Point Installation, Germany and Berlin both achieve 100%. The National Development Plan for Electromobility requires there is designated parking spaces for EVs. The Standardization Roadmap for Electromobility seeks to standardized public charging points in order to make them user-‐friendlier. Berlin has controlled parking zones, including the low emission zones (LEZs), which provide a differentiated parking exclusively for EVs. (Senatsverwaltung für Stadtentwicklung und Umwelt Berlin, 2011) Both Germany and Berlin score 100% on Available supportive policy measures, Existing Policy. There is public procurement of EVs and supporting charging infrastructure (NEPE, 2009) plus tax exemption from the Company Car taxation. The NEPE has fund of two billion euros, with 500 million given by the Federal Government through the Second Economic Stimulus Package and the rest from industry. The BVBS14 provides a total 130 million euros for the eight Model Regions program. In Berlin, the eMO has 8 million euros available for the promotion and development of electromobility, including charging infrastructure (EMO-‐Berlin, 2012). Thus both national and local level has a 100% achievement on Available R&D economic support and available economic support for Manufacturing. 12 The Road map is a general agreement among all national actors of the electromobility sector working on standardization systematically across actors. 13 eMO is an agency of the Land of Berlin, operated by Berlin Partner GmbH and TS Technology Foundation Berlin 14The BMVS is the Federal Ministry of Transport, Building and Urban Development
32
Regarding Charge Points, Germany has set a national target of 9,500 (NPE, 2012b), which is 63% of the National Charge Point Target of 1,503,000 required by the directive.
6.1.1.3 Sweden and Stockholm Currently, Sweden does not have a specific policy for charging infrastructure. The “National Swedish EV Procurement”, introduced in 2009, focuses specifically on the introduction of EVs in Swedish fleets and not on infrastructure (Stockholms Stad and Vattenfall AB, 2013). In the beginning of 2013 Roadmap:Sweden was presented to the Minister for Enterprise, Annie Lööf. The roadmap is the first step towards a strategy for introducing electric vehicles and its supporting charging infrastructure on a large scale (Roadmap Sweden, 2013). The country achieves 50% on Existing Policy because it is currently in development. Similarly, Stockholm does not have a specific local policy nor is there one in the planning, thus it achieves 0% on this aspect. There is no Regulated CP installation, thus there is an overall 0% achievement on this aspect. Roadmap:Sweden is expected to address this issue, one of the proposals includes the provision of charge points in new developments while excluding them from the energy consumption of buildings. (Roadmap:Sweden, 2013) Sweden and Stockholm both score 100% on Supportive Policy Measures. These measures are focused on vehicle purchases; the main one is Swedish EV Procurement, but also clean vehicle premium rebate. The “pump law” introduced in 2006 requires gas stations to offer at least one alternative fuel, however 85% of the stations offer E85 (bioethanol) and not electricity (Clean Vehicle EU, 2013). Other policies include access to the ‘Miljözon’ (low emission zones) and reduced parking fees. (Trip et al., 2012). The EV procurement project was initiated in Stockholm; the city also offers EVs exemption from the Stockholm Congestion Charge and reduced parking (Stockholms Stad and Vattenfall AB, 2013) Regards, Available R&D Economic Support, both Sweden and Stockholm score 100% thanks to the Elbilupphandling. Those that make use of the procurement grant are also required to provide feedback information for evaluation and future development. The procurement program also includes public demonstrations and vehicle trials. (Stockholms Stad and Vattenfall AB, 2013). On a transnational level, the Green Highway is a EU funded project15 held in
15 European Regional Development Fund under the framework Interreg Sweden-‐Norway.

33
cooperation between Sweden and Norway 16 to install alternative fuel infrastructure along the 45-‐mile road between the two countries. (Greenhighway, 2013) There is a 0% achievement on Available Economic Support for Manufacturing, because there is no governmental fund specified for this purpose. ABB, Volvo and Vattenfall are carrying out the biggest R&D and manufacturing initiative. Finally, since Sweden does not have a set policy for electricity as an alternative fuel, the country also lacks a set target for the amount of charge points that should be installed. Both national and local level achieves 0% on National Charge Point Target.
6.1.2 Charging Network The following results are based on the requirements specified in Article 4 of the Directive COM(2013) 18. This section evaluates the charging network based on quantities and accessibility. Section 6.2.4 is an evaluation of the charging network based the technical specifications. The information on the charging network, quantities and technical specifications, is obtained from the most official online charge point registry appointed by each country (See Annex 6 for more references). These online sites are the ones recommended, by the national or local authorities, to EV drivers to search for a charge point that suits their needs. Graph 3 shows how the selected cases meet the requirements of the Charging Network. On average, the selected cases have a good achievement on 4 of the 7 indicators. The following section describes the individual indicators more in detail.
16 SWEET is cooperation between the municipalities of Sundsvall, Östersund and Trondheim.

34
Graph 3. Charging Network KPIs
Perspective KPI Achievement
UK London Germany Berlin Sweden Stockholm Average
Charging Network
(35%)
Current number of installed CP according to EU directive
0% NM 0% NM 0% NM 0%
CP with more than 2 connectors
100% 100% 100% 100% 100% 100% 100%
Total Number of Connectors available for current EVs
98% 100% 73% 77% 71% 100% 86%
Density of charge points within 100km 50% 100% 100% 100% 50% 100% 83%
Registered as Publicly Accessible CPs
NM NM NM NM NM NM NM
CP on Highways 100% 100% 100% 100% 100% 100% 100%
35
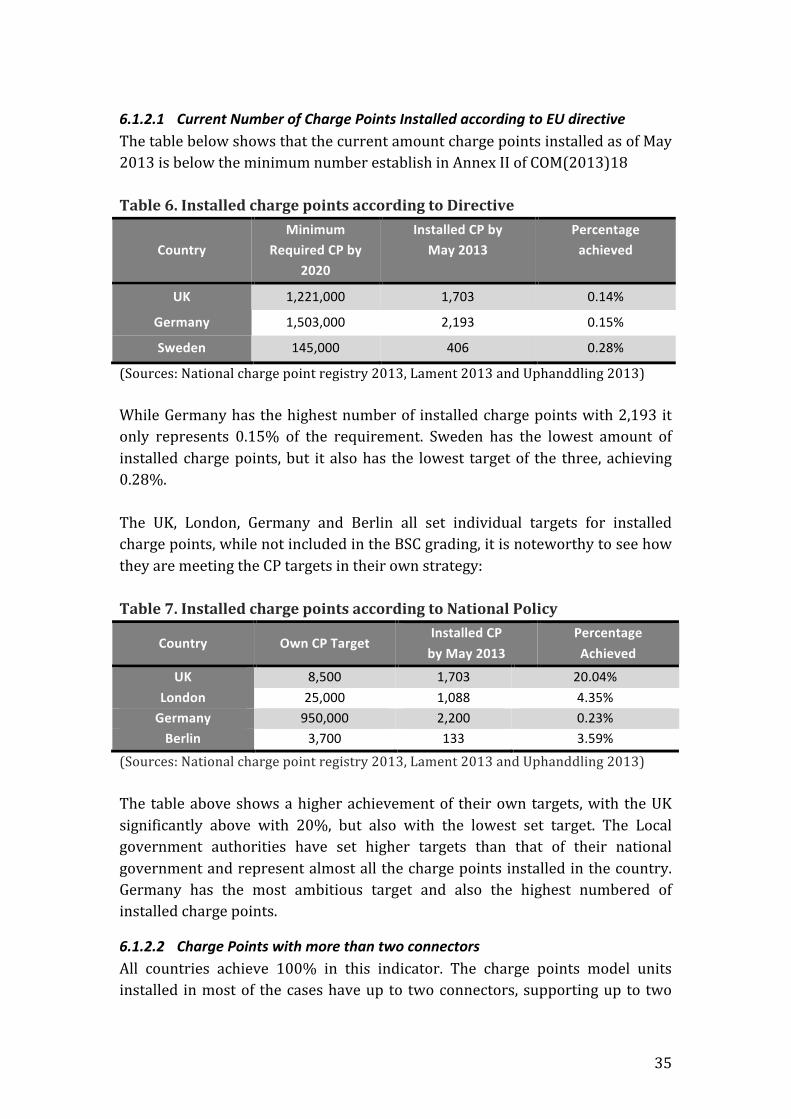
6.1.2.1 Current Number of Charge Points Installed according to EU directive The table below shows that the current amount charge points installed as of May 2013 is below the minimum number establish in Annex II of COM(2013)18 Table 6. Installed charge points according to Directive
Country Minimum
Required CP by 2020
Installed CP by May 2013
Percentage achieved
UK 1,221,000 1,703 0.14%
Germany 1,503,000 2,193 0.15%
Sweden 145,000 406 0.28%
(Sources: National charge point registry 2013, Lament 2013 and Uphanddling 2013) While Germany has the highest number of installed charge points with 2,193 it only represents 0.15% of the requirement. Sweden has the lowest amount of installed charge points, but it also has the lowest target of the three, achieving 0.28%. The UK, London, Germany and Berlin all set individual targets for installed charge points, while not included in the BSC grading, it is noteworthy to see how they are meeting the CP targets in their own strategy: Table 7. Installed charge points according to National Policy
Country Own CP Target Installed CP by May 2013
Percentage Achieved
UK 8,500 1,703 20.04% London 25,000 1,088 4.35% Germany 950,000 2,200 0.23% Berlin 3,700 133 3.59%
(Sources: National charge point registry 2013, Lament 2013 and Uphanddling 2013) The table above shows a higher achievement of their own targets, with the UK significantly above with 20%, but also with the lowest set target. The Local government authorities have set higher targets than that of their national government and represent almost all the charge points installed in the country. Germany has the most ambitious target and also the highest numbered of installed charge points.
6.1.2.2 Charge Points with more than two connectors All countries achieve 100% in this indicator. The charge points model units installed in most of the cases have up to two connectors, supporting up to two

36
vehicles simultaneously. This is also evidenced by the fact that there is more than double the amount of connectors than charge points (See Annex 6)
6.1.2.3 Density of charge points within 100km One of the ways of addressing the limited driving range of current EVs is through extensive charging networks. The following results are a qualitative assessment of the density of the charging network within a 100km radius. The UK has 50%, meaning average coverage in the overall country. Fig 7.A. Show there are areas with high concentration of charge points, but not equally distributed throughout the overall territory. London (Fig. 7.B.), however, has a very high density of Charge points and earns 100%
Figure 7. Charge point maps UK and London (source: www.sourcelondon.com and www.nationalchargepointregistry.com) Germany achieves 100% because it has high coverage in the overall territory (Figure 8.A.). Similarly, Berlin also achieves 100% with high coverage and distribution (Fig 8.B.).
A B
37
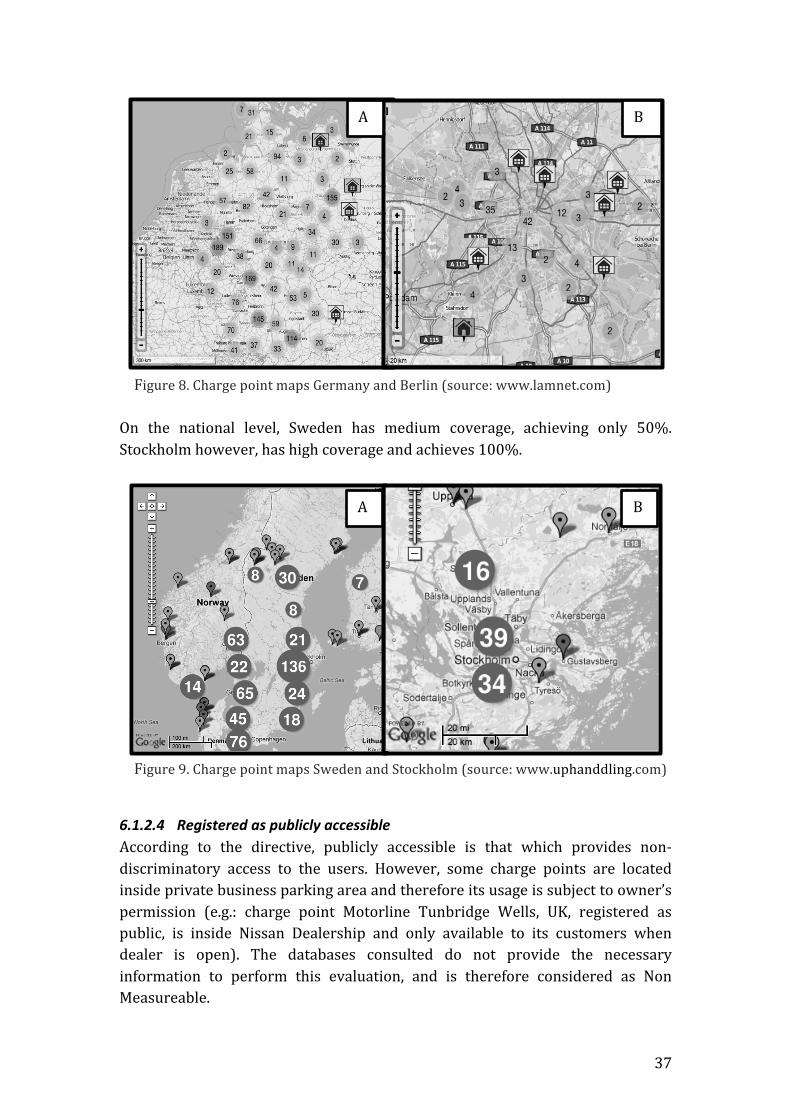
Figure 8. Charge point maps Germany and Berlin (source: www.lamnet.com) On the national level, Sweden has medium coverage, achieving only 50%. Stockholm however, has high coverage and achieves 100%.
Figure 9. Charge point maps Sweden and Stockholm (source: www.uphanddling.com)
6.1.2.4 Registered as publicly accessible According to the directive, publicly accessible is that which provides non-‐discriminatory access to the users. However, some charge points are located inside private business parking area and therefore its usage is subject to owner’s permission (e.g.: charge point Motorline Tunbridge Wells, UK, registered as public, is inside Nissan Dealership and only available to its customers when dealer is open). The databases consulted do not provide the necessary information to perform this evaluation, and is therefore considered as Non Measureable.
A B
A B

38
6.1.2.5 Charge points on highway Based on a qualitative assessment, all the selected cases score 100%, meaning that there are charge points located on highways. The specific number is hard to determine with the current databases
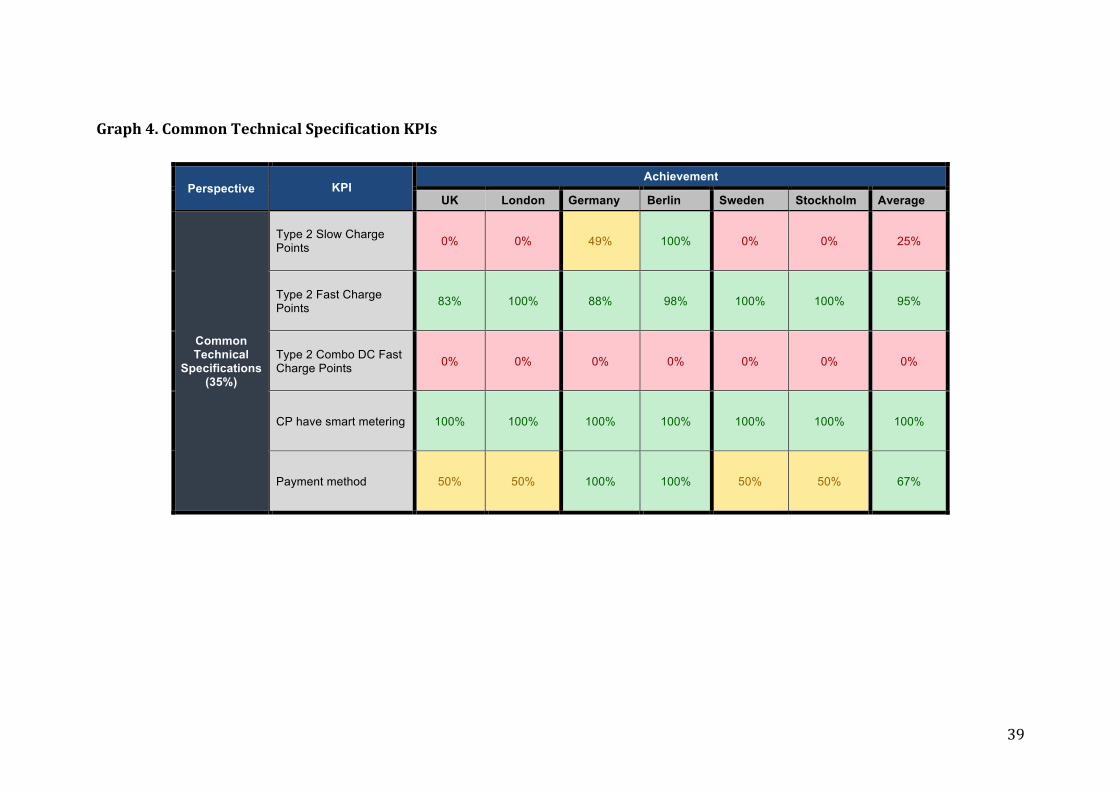
6.1.3 Common Technical Specifications This section tries to evaluate the EV charging infrastructure based on the technical specifications described in Annex III of the Directive. Graph 4 shows very mixed results; on average there is a high achievement Type 2 Fast Charge Points, CP Have Smart Metering and the Payment Method. However, on average slow charging is not standardized, there is only a 25% achievement of Type 2 Slow Charge Points. There is a 0% achievement of Type Combo 2 DC Fast Charge Points, meaning that of the DC fast charge points installed none meet the standard. When comparing the different Member States, Germany and Berlin have higher percentage of Charge Points that meet the required standard. As described in Annex II, the indicators Charge Points Have Smart Metering and Payment Method are qualitative indicators. For the first, 100% means smart metering is available, not that 100% of the CP have it. For the later, 50% means compatible payment method within the country and 100% if it is openly compatible with other countries as well.
39
Graph 4. Common Technical Specification KPIs
Perspective KPI Achievement
UK London Germany Berlin Sweden Stockholm Average
Common Technical
Specifications (35%)
Type 2 Slow Charge Points 0% 0% 49% 100% 0% 0% 25%
Type 2 Fast Charge Points 83% 100% 88% 98% 100% 100% 95%
Type 2 Combo DC Fast Charge Points 0% 0% 0% 0% 0% 0% 0%
CP have smart metering 100% 100% 100% 100% 100% 100% 100%
Payment method 50% 50% 100% 100% 50% 50% 67%
40
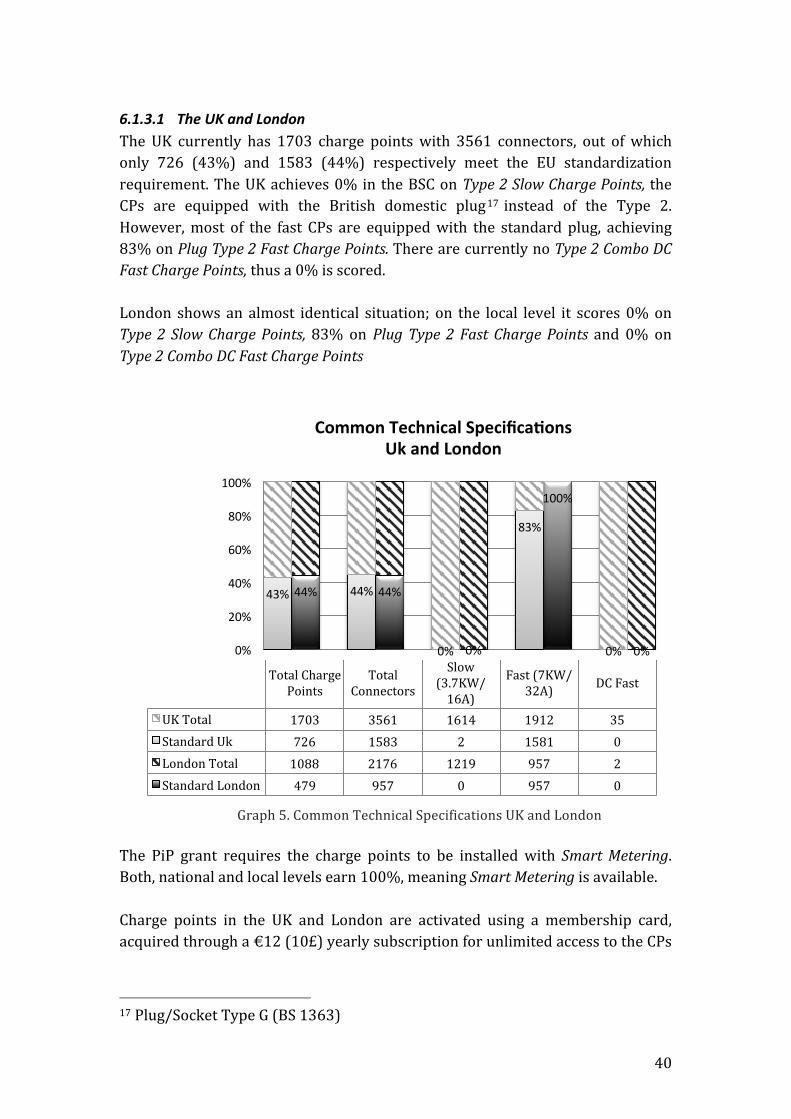
6.1.3.1 The UK and London The UK currently has 1703 charge points with 3561 connectors, out of which only 726 (43%) and 1583 (44%) respectively meet the EU standardization requirement. The UK achieves 0% in the BSC on Type 2 Slow Charge Points, the CPs are equipped with the British domestic plug17 instead of the Type 2. However, most of the fast CPs are equipped with the standard plug, achieving 83% on Plug Type 2 Fast Charge Points. There are currently no Type 2 Combo DC Fast Charge Points, thus a 0% is scored. London shows an almost identical situation; on the local level it scores 0% on Type 2 Slow Charge Points, 83% on Plug Type 2 Fast Charge Points and 0% on Type 2 Combo DC Fast Charge Points
Graph 5. Common Technical Specifications UK and London
The PiP grant requires the charge points to be installed with Smart Metering. Both, national and local levels earn 100%, meaning Smart Metering is available. Charge points in the UK and London are activated using a membership card, acquired through a €12 (10£) yearly subscription for unlimited access to the CPs
17 Plug/Socket Type G (BS 1363)
Total Charge Points
Total Connectors
Slow (3.7KW/16A)
Fast (7KW/32A) DC Fast
UK Total 1703 3561 1614 1912 35 Standard Uk 726 1583 2 1581 0 London Total 1088 2176 1219 957 2 Standard London 479 957 0 957 0
44% 44%
0%
100%
0%
43% 44%
0%
83%
0% 0%
20%
40%
60%
80%
100%
Common Technical Specifica0ons Uk and London

41
in the country (OLEV, 2013). Both score 50% on Payment Method because users of other countries not subscribed cannot access the CPs.
6.1.3.2 Germany and Berlin As observed on the graph below, 48% of the total charge points and 62% of all the connectors are the EU standard type. Almost half of all the slow charge points offer standard connector, scoring 49% on Type 2 Slow Charge Point. The standard connector is predominant for fast charging, with a score of 88% on Type 2 Fast Charge Point. However, there is 0% of Type 2 Combo DC Fast Charging. Berlin has an even higher percentage 98% of standardized Charge Points and Connectors. On the local level Berlin scores a high 100% and 98% on Type 2 Slow Charge Point and Type 2 Fast Charge Point respectively. Even so, there is no Type 2 Combo DC Fast Charging currently available, scoring 0%.
Graph 6. Common Technical Specifications Germany and Berlin
In all of Germany Smart Metering is to be included as standard in CPs (NEP, 2012a), also the installation of smart meters is obligatory in new developments (Österreichische Energieagentur, 2011). This also applies to the charging network of Berlin, thus both score 100%. Regards Payment Method, operators are to provide a combination of options, including direct payment (cash, prepaid or debit cards)(NEP, 2012b). Direct
Total Charge Points
Total Connectors
Slow (3.7KW/16AMP)
Fast(7KW/32Amp) DC Fast
Germany Total 2193 3283 2126 1129 28 Standard Germany 1052 2041 1043 998 0 Berlin Total 133 268 133 133 2 Standard Berlin 130 263 133 130 0
Chart Title
98% 98% 100% 98%
0%
48% 62%
49%
88%
0% 0%
20%
40%
60%
80%
100%
Common Technical Specifica0ons Germany and Berlin

42
payment allows all users to access the CP, earning both national and local level 100% on Payment Method.
6.1.3.3 Sweden and Stockholm Sweden has the lowest standardization, with only 8% of all charge points offering the standard connector. Most of the connectors offer slow charging, but none with the required standard, scoring 0% on Type 2 Slow Charge Point. On the contrary, it scores 100% on Type 2 Fast Charge Points. While DC fast charging is available there is 0% of Type 2 Combo DC Fast Charging currently available. Stockholm shows a similar distribution it scores 100% on Type 2 Fast Charge Points, but 0% on both Type 2 Slow Charge Point and Type 2 Combo DC Fast Charging.
Graph 7. Common Technical Specifications Sweden and London
Both levels score 100% on Smart Metering. By mandate, smart meters have been installed in the country since 2009 (Österreichische Energieagentur, 2011). Information for payment method is limited in Sweden. Public CPs operated by Forum unlocked with a text message via mobile phone. Users of Stockholm Parking can also pay both for parking and charging through the App EasyPark. Both options require a subscription and access to a mobile phone (Stockholm Parkering, 2013). The country code of the mobile number is a limitation to access public CPs, thus there is only 50% for Payment Method.
Total Charge Points
Total Connectors
Slow (3.7KW/16A)
Fas t(7KW/32A) DC Fast
Sweden Total 406 1265 1199 52 14 Standard Sweden 31 52 0 52 0 Stockholm Total 31 281 273 5 3 Standard Stockholm 1 5 0 5 0
Chart Title
8% 4% 0%
100%
0% 3% 2% 0%
100%
0% 0%
20%
40%
60%
80%
100%
Common Technical Specifica0ons Sweden and Stockholm

43
6.1.4 Total Directive Achievement While the previous result sections give a detailed explanation on the BSC scores, this section gives the overall score of the selected cases. Based on the selected cases, the current EU charging network complies with 69% of the requirements of the directive (Graph 8) On the national level, Germany leads with 73%. Correspondingly, Berlin also has the highest local achievement with 91%. Both Sweden and Stockholm are below average with 48% and 63% respectively.
Graph 8. Total ponderated achievement by country
The graph below shows the average achievement of the specific KPIs.
Graph 9. Total ponderated achievement by KPI
UK 59%
London 77%
Germany 73%
Berlin 91%
Sweden 48%
Stockholm 63%
Average 69%
0%
20%
40%
60%
80%
100%
Total Ponderated Achievement
75% 67%
100% 100%
67% 21%
0% 100%
86% 83%
0% 100%
25% 95%
0% 100%
67%
0% 50% 100% 150%
ExisHng Policy for charging infrastructure Regulated CP installaHon for developers
Available supporHng policy measures Available R&D economic support
Available economic support for OEMs NaHonal CP target
Current number of installed CP according to CP with more than 2 connectors
Total Number of Connectors available for Density of charge points within 50miles
Registered as Publicly Accesible CPs CP on Highways
Type 2 Slow Charge Points Type 2 Fast Charge Points
Type 2 Combo DC Fast Charge Points CP have smart metering
Payment method
Average Achievement of the KPIs

44
7 DISCUSSION
The results show that the current EU charging network, based on the selected cases, complies with 69% of the requirements of the Directive for Alternative Fuel Infrastructure. The results also show that 75% of the cases currently have an existing framework for charging infrastructure. However, all Member States have a lower Charge Point target than that of the directive. Regarding technical specifications, 95% of the Fast Charge Points offer the required Type 2 Connector. This is not the case for Slow and Fast DC charge points, when only 25% and 0% respectively meet the standard. The main drivers for the development of a harmonized charging infrastructure in Europe are the rigorous climate change and energy targets of Europe 2020, which require 20% GHG reduction, 20% increase of energy from renewables and 20% increase in energy efficiency. The EU policy interaction in section 6.1 illustrates how these targets placed at the highest strategic level have brought forward the development of a series of complimentary policies related to charging infrastructure. The policies become more specific as we go down a strategic level. Resource Efficient Europe, for example, aims at a low-‐carbon transport system by 2050 and identifies barriers to increased mobility under constrained natural resources. Subsequently, the derived White Paper on Transport sets more specific strategy to overcome some of these barriers, for example by requiring the phase-‐out of ‘conventionally fuelled vehicles’ from cities by 2050. Electric Vehicles were identified as one of the means to achieve this; however, the adoption of this new innovation requires a network of relations with the system it is introduced into (Kemp, 1993). This is why other policies, such as the European Single Market and the Energy Efficiency Plan have to compliment the White Paper on Transport. Each of these three instruments guides the development of one of the system components in which EVs must be introduced to. For example, the Energy Efficiency Plan sets the framework for the Energy Utility sector; stimulating the introduction of renewable energy and eliminating transborder barriers for the electricity market. Similarly, the European Single Market aims at facilitating interoperability of technology by enforcing standardization regulations. This mutual reinforcement creates solid framework grounds enabling the Directive for Alternative Fuel Infrastructure to focus specifically on stimulating the deployment of charging infrastructure. There is a low interaction between the EU level policy on charging infrastructure and that of Member States due to time difference. As of now, the deployment of charging infrastructure in the selected cases has been motivated by the need to support the introduction of Electric Vehicles to decarbonize the transport sector

45
in order to meet their own climate change targets. However, these targets were set foreseeing the legislation of EU2020. It can be seen as if there was a parallel development between the EU 2020 and its subsequent policies with the Member States initiatives, since planning began in 2009. All three countries have taken different approaches in their strategy to implement a charging network. The UK promotes charging infrastructure to stimulate and accommodate the growth of EVs in the country (Office for Low Emission Vehicles, 2011). This is especially true for London, which has a more ambitious charge point target. Evidence to their approach is the fact that there are zero CP installation costs for the user, which are paid for by the PiP program. One of the requirements however is that they own an EV, which can also be partly subsidized with the Plug-‐in-‐Vehicle grant, both programs are mutually reinforcing. Germany takes a slightly different approach. Instead of rolling out charging infrastructure to increase the appeal of EVs, they install them on a demand basis. Germany is currently in the first phase of their strategy: ‘market preparation’. The country uses showcase projects, such as Berlin, to demonstrate the benefits of electromobility and increase the demand through appeal. It is noteworthy to see that while Germany has a target more than 100 times higher than the UK (950,000 vs. 8,500), both countries have almost the same quantities of installed CP (2,200 vs. 1,703). This is evidence of the current first phase Germany is in, before continuing with a large-‐scale roll out after 2014. The biggest disparity is with Sweden, which claims a technology neutral approach to alternative fuels and lacks a specific strategy related to charging infrastructure. However, the Swedish “pump law” has favoured the development of bioethanol and neglected electricity for EVs (Clean Vehicle EU, 2013).
These different policy approaches can help explain the differences in the standardization of the charging infrastructure. Germany has the highest percentage of standardized charge points. This becomes more evident when one considers first, that the Type 2 standard connector is of German origin; and second, that the German approach with the first phase is to actually standardize the electromobility system before going forward with a full roll-‐out of infrastructure. Germany developed and approved a national standard on EV plugs early on, foreseeing the time required to develop a EU standard. The high percentage of Fast Plug Type 2 installed supports its EU selection based on the market. Fast Charging, prescribed as the primary charging option for public infrastructure (OLEV, 2011, NPE, 2009), requires investments of €770-‐ €2,310(Yilmaz and Krein, 2013), therefore one could assume the safest investment would be to install the only available standard plug in Europe, even if it was only for one Member State. Furthermore, the Type 2 plug was developed for the German automotive sector, currently the biggest automotive producer

46
and employer in the EU (ACEA, 2012b), the sector leader influenced the Type 2 adoption in other countries. Slow charge (3.7kW/16A) does not require a designated circuit and can be used for overnight charge. The lack of Type 2 connectors in Slow Charge Points is probably due to the fact that these are more expensive than the normal household connector (MENNEKES, 2013). Installing household connectors in slow charge points can be seen as safer investment and as a bridging solution for the initial EV stock. The lack of Rapid Charge Points in general can be due to the market insecurities on the technology. DC rapid charge is the most expensive option, up to €123,200 per charge point (Yilmaz and Krein, 2013), disruptive to the grid and without any legally published standard18. Both the EU and USA are in agreement of implementing the Combo-‐Charger for DC fast charging, expected to be feasible by 2017, by then the deployment should be regulated by the Directive with less market fragmentation to be expected. Similar characteristics of the charging infrastructure are evidence to similar policies between national and local level, especially between the UK and London and Germany and Berlin. The main strategy is set at national level but funding is given to local governments, with these having to create a similar strategy in order to tap into these funds.
Utility and limitations of the BSC
The Balanced Scorecard proved to be a useful tool for policy analysis, however its applicability depends on the intended use of the information it provides. This is because the BSC dashboard does not depict the extensive research required to give a value to the indicators. In this particular study, it attested useful to measure and compare the six cases based on a single Directive. The adapted BSC for policy maintains the original framework’s utility for creating alignment between and across different strategic levels by linking the Directive’s objectives to the specific initiatives that can achieve them. The BSC can be used for policy analysis if new perspectives are created to group and link objectives, targets and indicators. From experience, the most important aspect is to understand the expected outcomes of the policy and elaborating KPIs to portray them. For example, an initial perspective with KPIs on Climate Change was eliminated from the final framework version because it is out of the Directive’s specific scope. The Directive acknowledges the importance of increased use of renewable energy but does not set a comparable target for this. The KPI framework itself is both strength and a limitation; the success of a BSC lies in the selection of these. Having indicators is useful to systematically guide
18 Scheduled to be published by IEC by 2014.

47
the documentation and analysis of the information of different cases. This in turn also allows systematic measurement horizontally (same indicator in different countries) and vertical (same country and all indicators) as shown in graph 10. Having a KPI dashboard provide a fast general overview of the current achievement of the Directive, highlighting the objectives that have been met and those that require improvement. This is especially useful when measuring many countries, as it focuses on outcomes. .
Graph 10. Multidimensional BSC measurement
As mentioned before, having KPIs limits the amount of information to be presented. If the right KPIs are not selected the BSC will not accurately portray the policy’s outcome. Understanding policy outcomes may require a more extensive document analysis that cannot be depicted through simplified KPIs. In this case, the BSC can deliver a quick overview but does not provide in-‐depth information of the values presented. KPIs do however provide a traceable origin of the information, allowing for faster reference. The use of BSC for policy has its unique challenges that arise from the complex nature of organizations it measures. Determining the reference source for KPIs is a tedious initial process. The BSC presented in this study extracts information from numerous information sources, with most documents being up to 30 pages long. The complexity of collecting data increases with the number of cases that have to be analysed. The current BSC does not measure the effect of the Directive because the Member State’s policies and initiatives were in place before. It does however give an estimation of how far the Member States are from meeting its requirements. The same BSC can then be used for continuous assessment; suggestions will be covered in further research section.

48
8 CONCLUSIONS
Harmonization of charging infrastructure according to EU Policy
The current state of charging infrastructure for Electric Vehicles was determined by the individual Member States’ National Policy and not by EU Policy. This has lead to some lack of harmonization in the charging infrastructure. The main disparities between the charging networks of the Member States are the common technical specification of Slow and Fast DC charge points. Household connectors for slow charging require less investment than the Type 2; they have served as a bridging option to support the circulating EVs. On the contrary, Fast DC is an expensive and comparably younger technology, with no available standard. There is a high level of standardization in Fast Charging, with a 98% predominance of Type 2 connectors. This is highly related to the influence Germany has as automotive market leader. This harmonization has not been coordinated by EU policy but rather by German national policy and initiatives. The use of the BSC was useful to identify how the charging network addresses range limitation of EVs, where availability, distribution but also accessibility must be taken into account and not only technical specifications. On average, there are enough connectors available for 86% of the EVs currently circulating in the selected cases. London currently has more charge points installed than EVs on the road. The spatial distribution of the charging network is different in all cases. Germany and the UK have comparably the same number of charge points; the first has high coverage but medium density, while the UK has medium coverage but with significantly high density in London. Sweden has medium coverage and high density in Stockholm. This is attributed to the urban distribution of the three countries and not specifically their policy. Accessibility was identified as a major limiting factor; the current charge point maps also consider as public those whose use is restricted to private customers (e.g. customers of a dealership). The payment method also impairs accessibility. Of the cases studied only Germany offers direct payment, while the others require registration before making use of the charge points. There are identifiable differences between the policy approaches for private and public push for development. The UK’s use of public push in the form of one-‐time grants have led to high number of installed charge points. Germany’s policy focuses on private push using the power of its automotive industry to set a standard for charging infrastructure. All three Member States can easily adopt the new Directive on alternative fuel infrastructure. The UK and German national policies are more mature and

49
already meet most of the requirements; special attention is required on standardizing slow charge points and payment method. Perhaps the biggest advantage is for Sweden, lacking a policy means they can adopt one that meets the requirements and avoids market fragmentation from the beginning. Regulation of the technical disparities improves the industry’s capacity to respond to the urgency and facilitates the adoption of a harmonized Pan-‐European charging infrastructure. Having a charging network that is standardized, accessible and of high coverage is vital for the breakthrough of electromobility in Europe and in general the world.
Utility of the Balanced Scorecard
The BSC was a useful methodology to meet the aim of the study, proving utility for policy analysis on a multidimensional level. A BSC is of complex nature but of simplified results, it can provide decision makers focus on policy outcomes but not on causes. Focusing on outcomes is especially beneficial for EU policies, since they require Member States to meet EU level objectives without necessarily specifying in what way. The biggest asset is creating strategic alignment and giving an overview of the current achievement of objectives. It should be used as a complimentary tool, taking into considerations its limitations regarding the selected indicators. The 69% average achievement of the Directive should not be read as an absolute measurement nor should it be seen as the main result of this thesis, as the individual KPI achievements are more informative. Assigning a weight to the KPIs introduces a bias from the researchers side, even when this was minimized as much as possible. Ideally, the same stakeholders developing the policy should develop the KPIs for the BSC, thus they can assign a weight according to their considerations. The current BSC should be seen as an indication of the current charging infrastructure in the selected cases and not as an absolute measurement. Statistical data on charging infrastructure is currently very limited and under constant improvement.. The use of the BSC can be expanded to other areas of studies that require systematic comparability, for example between electromobility achievements between EU, Europe and China.

50
9 RECOMMENDATIONS AND FURTHER RESEARCH
The main aim of the thesis was achieved with help of the Balanced Scorecard. However, the scope of the thesis was limited to time and availability of resources. The current BSC framework does not measure the effects of the specific directive, rather the current state of the charging network system it is suppose to regulate. Therefore, the consecutive use of the BSC in the future can track the progress made after its implementation. The future BSC can have a 2013 baseline with the actual values given in this study. It would be interesting, for example, to track how a target stimulates the rate of deployment of charge points or how regulation will facilitate the adoption of a single technology. Another research possibility is the use of the same BSC to measure and different Member States with different capacities; comparing leaders and laggards. The current and future studies can also benefit from better statistical data on charging infrastructure, since it is currently not centralized by Eurostat and only available through online charge maps.

51
10 BIBLIOGRAPHY
ACEA. 2011. ACEA position paper on electrically chargeable vehicles [Online].
Brussels. Available: http://www.acea.be/images/uploads/files/ACEA_on_ECVs.pdf.
ACEA 2012a. ACEA position paper and recommendations for the standarization of the carging of electrically chargeable vehicles. Brussels.
ACEA 2012b. The Automobile Industry Pocket Guide. Brussels. ACEA. 2013a. Auto industry welcomes proposals to expand clean fuel
infrastructure [Online]. Available: http://www.acea.be/news/news_detail/press_release_auto_industry_welcomes_proposals_clean_fuel_infrastructure.
ACEA. 2013b. Press Release: Automobile Manufacturers call for improved conditions for electrically-‐chargeable vehicles [Online]. Available: http://www.acea.be//news/news_detail/automobile_manufacturers_call_for_improved_conditions_for_ecvs/.
Automotive Industry Data. 2012. Ultra-‐Green Europe Slow to Buy Electric Vehicles. Forbes [Online]. Available: http://www.forbes.com/sites/eco-‐nomics/2012/05/04/ultra-‐green-‐europe-‐slow-‐to-‐buy-‐electric-‐vehicles/.
Balanced Scorecard Institute. 2009. What is the Balanced Scorecard? [Online]. Available: http://www.balancedscorecard.org/BSCResources/AbouttheBalancedScorecard/tabid/55/Default.aspx [Accessed 04/04/2013.
Beltramello, A. 2012. Marketing Development for Green Cars. In: OECD (ed.) OECD Green Growth Papers. Paris: OECD.
Chan, Y.-‐C. L. 2004. Performance measurement and adoption of balanced scorecards: A survey of municipal governments in the USA and Canada. International Journal of Public Sector Management, 17, 204-‐221.
Crabbé, A. & Leroy, P. 2008. The handbook of environmental policy evaluation, Earthscan.
Creswell, J. W. & Clark, V. L. P. 2007. Designing and conducting mixed methods research, Wiley Online Library.
Electric Drive Transportation Association. 2013. Technology [Online]. Available: http://www.electricdrive.org/index.php?ht=d/sp/i/2446/TPL/LandingPageTechIss/pid/2446 [Accessed 18/02/2012.
eMO-‐Berlin 2012. Berlin-‐Brandenburg International Showcase for Electromobility Application. Berlin.
EURELECTRIC. 2012. Facilitating e-‐mobility: EUROLECTRIC views on charging infrastructure. Position Paper [Online]. Available: http://www.eurelectric.org/media/27060/0322_facilitating_emobility_eurelectric_views_-‐_final-‐2012-‐030-‐0291-‐01-‐e.pdf.
European Comission 2010a. Communication from the commission to the european parliament, the council, the european economic and social committee and the committee of the regions. An Integrated Industrial Policy for the Globalisation Era Putting Competitiveness and Sustainability at Centre Stage. COM/2010/0614. Brussels.
European Comission 2010b. Communication from the commission to the european parliament, the council, the european economic and social
52
committee and the committee of the regions Europe 2020 Flagship Initiative Innovation Union. COM/2010/0546. Brussels.
European Comission 2010c. EUROPE 2020 A strategy for smart, sustainable and inclusive growth. COM/2010/2020. Brussels.
European Comission 2010d. White paper on transport: Roadmap to a single European transport area : towards a competitive and resource efficient transport system. In: TRANSPORT, D.-‐G. F. M. A. (ed.). Brussels, Belgium.
European Comission 2011a. Communication from the commission to the european parliament, the council, the european economic and social committee and the committee of the regions a resource-‐efficient Europe – Flagship initiative under the Europe 2020 Strategy. COM/2011/0021. Brussels.
European Comission 2011b. Communication from the commission to the european parliament, the council, the european economic and social committee and the committee of the regions Energy Efficiency Plan 2011. COM/2011/0109. Brussels.
European Comission 2011c. Infrastructure for Alternative Fuels: Report of the European Expert Group on Future Transport Fuels.
European Environment Agency 2011. Laying the foundations for greener transport-‐ TERM 2011: transport indicators tracking progress towards environmental targets in Europe.
Figge, F., Hahn, T., Schaltegger, S. & Wagner, M. 2002. The sustainability balanced scorecard -‐ Linking sustainability management to business strategy. Business Strategy and the Environment, 11, 269-‐284.
Greater London Authority 2011. London Plan, Spatial development strategy for Greater London. London.
Hedegaard, C. 2013. Connie Hedegaard on the clean fuel strategy announced today [Online]. Available: http://ec.europa.eu/commission_2010-‐2014/hedegaard/headlines/news/2013-‐01-‐24_01_en.htm.
IA-‐HEV. 2013. Information by Country [Online]. Available: http://www.ieahev.org/by-‐country/ [Accessed 20/02/2013.
International Electrotechnical Commission. 2011. A Step forward for global EV roll-‐out-‐ IEC International Standard for EV charging [Online]. Geneva. Available: http://www.iec.ch/newslog/2011/nr0411.htm [Accessed 2013/02/20.
Kaplan, R. S. & Norton, D. P. 1996. The Balanced Scorecard: Translating Strategy into action. Boston: Harvard Business Press.
Kaplan, R. S. & Norton, D. P. 2001. Transforming the balanced scorecard from performance measurement to strategic management: Part I. Accounting horizons, 15, 87-‐104.
Kemp, R. 1993. An economic analysis of cleaner technology: theory and evidence. Environmental strategies for industry, 79, 113.
Kirsch, D. A. 2000. The electric vehicle and the burden of history, New Brunswick, N.J., Rutgers University Press.
Koerth-‐Baker, M. 2012. Why Your Car Isn't Electric. New York Times Magazine. New York, United States, New York: New York Times Company.
Larminie, J. & Lowry, J. 2012. Electric Vehicle Technology Explained (2nd Edition), John Wiley & Sons.

53
Matheys, J. & autenboer, W. V. 2004. SUBAT: EU Project on Sustainable Batteries. Brussels: Vrije Universiteit Brussels (ETEC).
MENNEKES. 2013. Mennekes Products [Online]. Available: http://www.mennekes.de/en/produkte.html?no_cache=1 [Accessed 20/04/2013.
Murphy, J. & Gouldson, A. 2000. Environmental policy and industrial innovation: integrating environment and economy through ecological modernisation. Geoforum, 31, 33-‐44.
Nationale Plattform Elektromobilität 2009. German Federal Government's National Electromobility Development Plan. Berlin.
Nationale Plattform Elektromobilität. 2010. Second Report of the National Platform for Electromobility. Berlin.
Nationale Plattform Elektromobilität 2012a. The German Standardization Roadmap for Electromobility-‐ Version 2. Berlin.
Nationale Plattform Elektromobilität 2012b. Progress Report of the German National Platform for Electric Mobility (Third Report). Berlin.
Office for Low Emission Vehicles 2011. Making the connection, The Plug-‐In vehicle infrastructure Strategy. London: Department for Transport, UK Government.
Office for Low Emission Vehicles. 2013. Plugged-‐in Places [Online]. Available: https://http://www.gov.uk/government/publications/plugged-‐in-‐places [Accessed 20/03/2010.
Österreichische Energieagentur 2011. European Smart Metering Landscape Report-‐ SmartRegions Deliverable 2.1. Vienna.
Roadmap Sweden. 2013. Large Scale Electrification of the Swedish Vehicle fleet, Roadmap Sweden [Online]. Available: http://roadmapsweden.se/english [Accessed 05/10/2013.
Senatsverwaltung für Stadtentwicklung und Umwelt Berlin 2011. Stadtentwicklungsplan Verkehr. Berlin.
Sharma, B. & Gadenne, D. 2011. Balanced Scorecard Implementation in a Local Government Authority: Issues and Challenges. Australian Journal of Public Administration, 70, 167-‐184.
Source London. 2013. Source London [Online]. Available: https://http://www.sourcelondon.net.
SSE. 2013. PowerFuel [Online]. Available: http://www.sse.co.uk/BeingGreen/Powerfuel/.
Stevenson, W. D. 1982. Elements of power system analysis, McGraw-‐Hill. Stockholms Stad & Vattenfall AB. 2013. Elbilsupphandling [Online]. Available:
http://www.elbilsupphandling.se [Accessed 03/05/2013. Trip, J. J., lima, J. & Bakker, S. 2012. Electric mobility policies in the North Sea
Region countries. Delft: TU Delft. Yilmaz, M. & Krein, P. T. 2013. Review of battery charger topologies, charging
power levels, and infrastructure for plug-‐in electric and hybrid vehicles. IEEE Transactions on Power Electronics, 28, 2151-‐2169.

54
11 ANNEX
Annex 1. Relevant Annexes of Directive COM (2013) 18
EN 19 EN
ANNEX I National policy frameworks
The National Policy Framework shall contain at least the following elements: 1. A regulatory framework A regulatory framework shall consist of measures to support the build up of alternative fuels infrastructure, such as building permits, parking lots permits, environmental performance of businesses certification, fuel stations concessions. 2. Policy measures supporting the implementation of the national policy framework These measures shall include at least the following elements : - Direct incentives for purchase of alternative fuels means of transport or building of the infrastructure; - Possibility of tax incentives to promote alternative fuels means of transport and infrastructure; - Use of public procurement in support of alternative fuels, including joint procurement; - Demand side non-financial incentives: e.g. preferential access to restricted areas, parking policy, dedicated lanes; 3. Deployment and manufacturing support Yearly public budget allocated for alternative fuels infrastructure deployment, differentiated by fuel and transport mode (road, rail, water and air). Yearly public budget allocated to support manufacturing plants for alternative fuels technologies, differentiated by fuel and transport mode. 4. Research, technological development and demonstration: Yearly public budget allocated to support alternative fuels RTD&D, differentiated by fuel and transport mode. 5. Targets - 2020 national targets for the deployment of alternative fuels in the different transport modes (road, rail, water and air) and for the relevant infrastructure - national targets, established year by year, for the deployment of alternative fuels in the different transport modes and for the relevant infrastructure in order to achieve 2020 national targets.
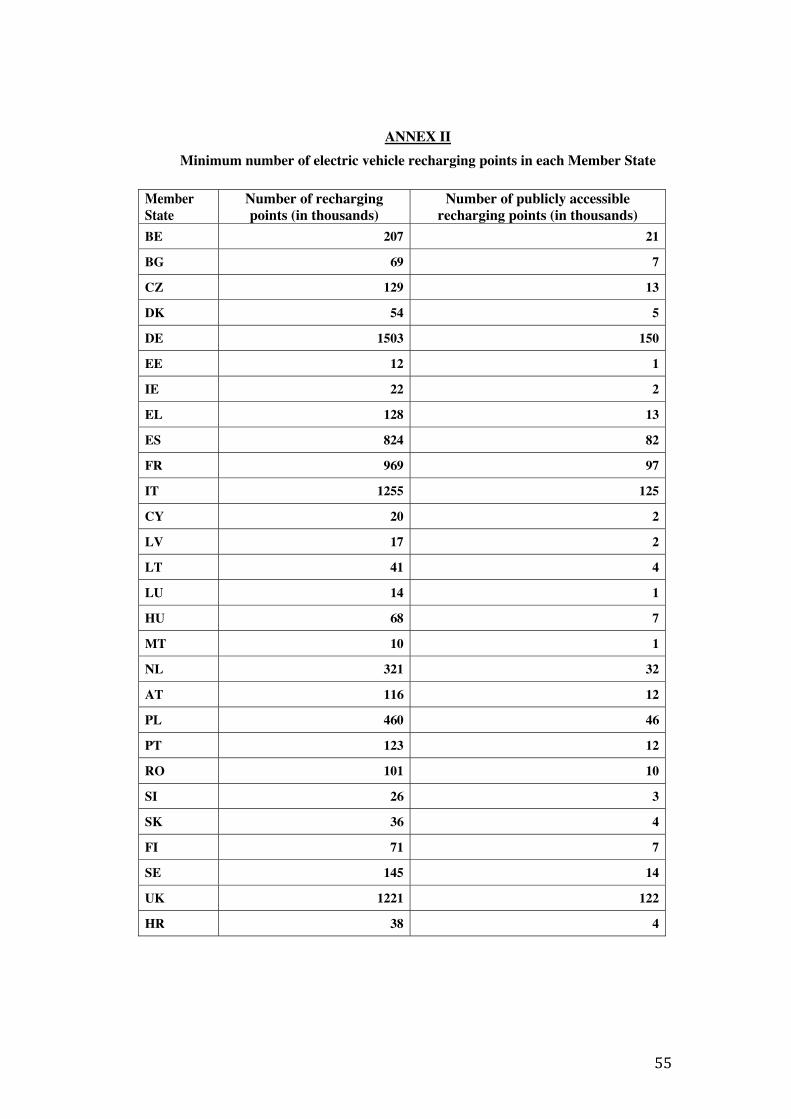
55
EN 20 EN
ANNEX II Minimum number of electric vehicle recharging points in each Member State
Member State
Number of recharging points (in thousands)
Number of publicly accessible recharging points (in thousands)
BE 207 21
BG 69 7
CZ 129 13
DK 54 5
DE 1503 150
EE 12 1
IE 22 2
EL 128 13
ES 824 82
FR 969 97
IT 1255 125
CY 20 2
LV 17 2
LT 41 4
LU 14 1
HU 68 7
MT 10 1
NL 321 32
AT 116 12
PL 460 46
PT 123 12
RO 101 10
SI 26 3
SK 36 4
FI 71 7
SE 145 14
UK 1221 122
HR 38 4

56
EN 21 EN
ANNEX III Technical specifications
1. Technical specifications for electric recharging points 1.1. Slow electric recharging points for motor vehicles Alternate Current (AC) slow recharging points for electric vehicles shall be equipped, for interoperability purposes, with connectors of Type 2 as described in standard EN62196-2:2012. 1.2. Fast electric recharging points for motor vehicles Alternate Current (AC) fast recharging points for electric vehicles shall be equipped, for interoperability purposes, with connectors of Type 2 as described in standard EN62196-2:2012. Direct Current (DC) fast recharging points for electric vehicles shall be equipped, for interoperability purposes, with connectors of Type "Combo 2" as described in the relevant EN standard, to be adopted by 2014. 1.3. Shore-side electricity for waterborne vessels Shore-side electricity supply for waterborne vessels, including the design, installation and testing of the systems shall comply with the relevant EN standard, to be adopted by 2014, and, pending the publication of this standard, with the technical specifications of the IEC/ISO/IEEE 80005-1 standard. 2. Technical specifications for hydrogen refuelling points for motor vehicles 2.1. Outdoor hydrogen refuelling points dispensing gaseous hydrogen used as fuel on board land vehicles shall comply with the relevant EN standard, to be adopted by 2014, and, pending the publication of this standard, with the technical specifications of the ISO/TS 20100:2008 Gaseous Hydrogen Fuelling specification. 2.2. The hydrogen purity dispensed by hydrogen refuelling points shall comply with the relevant EN standard, to be adopted by 2014, and, pending the publication of this standard, with the technical specfications included in the ISO 14687-2 standard. 2.3. Hydrogen refuelling points shall employ fuelling algorithms and equipment complying with the relevant EN standard, to be adopted by 2014, and, pending the publication of this standard, with the ISO 20100 Fuelling Protocols for Light Duty Gaseous Hydrogen Surface Vehicles. 2.4. Connectors for vehicles for the refuelling of gaseous hydrogen shall comply with the relevant EN standard, to be adopted by 2014, and, pending the publication of this standard, with the ISO 17268 gaseous hydrogen land vehicle refuelling connection devices standard. 3. Technical specifications for natural gas refuelling points
3.1. Technical specifications for Liquefied Natural Gas (LNG) refuelling points for waterborne vessels LNG refuelling points for waterborne vessels shall comply with the relevant EN standards, to be adopted by 2014.
3.2. Technical specifications for Liquefied Natural Gas (LNG) refuelling points for motor vehicles

57
Annex 2. Key Point Indicators (KPIs) for BSC-‐ Directive COM (2013) 18
Perspe
ctive
Objectives Target KPI #
KPI Base-‐line
Goal 2020
Real Value
Weight Formula Type of Indicator
Description Information
Source
Nationa
l Policy Fram
ework (30%
)
Establish a Regulatory
Framework for CP Installation
Existing specific policy on EV charging infrastructure
1.1 Existing Policy for charging infrastructure
0 2 X 5.00%
0= No 1= Under develop-‐ment 2= Yes
Qualitative
Determine whether there is specific EV charging infrastructure policy. The Goal should be 2, meaning it is developed and in practice
Governmental sites
Existence in policy: building permits, parking lots, etc.
1.2 Regulated CP installation for developers
0 1 X 5.00% 0= No 1= Yes
Qualitative
Determine whether there regulatory policy for the installation of CP. The Goal should be 1, meaning that it is regulated in planning policy
Governmental sites
Supporting Policy Measures
Existence in policy: taxes, purchase incentives, public procurement
1.3 Available supporting policy measures
0 2 X 5.00%
0= No 1= Yes, <1 measure 2= Yes, >1 measures
Qualitative
Identify supportive policy (financial and non financial incentives). The Goal should be 2, meaning that there is more than one supportive measure
Governmental sites
Designate resources for deployment of Charge Infrastructure
R&D expenditure available for infrastructure development
1.4 Available R&D economic support
0 1 X 5.00% 0= No 1= Yes
Qualitative
Identify whether the policy includes a budgeted economic support for R&D. Goal 1, means there is public funding without assessing the quality of the support.
Governmental sites
Deployment and manufacturing support
Allocation of public budget for CP Manufacturing
1.5
Available economic support for OEMs
0 1 X 5.00% 0= No 1= Yes
Qualitative
Identify whether the policy includes a budgeted economic support for the manufacturing and installation of CP. Goal 1,
Governmental sites

58
Perspe
ctive
Objectives Target KPI #
KPI Base-‐line
Goal 2020
Real Value
Weight Formula Type of Indicator
Description Information
Source
means there is public funding without assessing the quality of the support.
Establish minimum target for number of CP
Binding CP targets in policy (minimum required by EU directive)
1.6 National CP target
0
According to COM (2018) 13-‐
ANNEX II
National CP
target in Policy
5.00% National CP target/Directive CP target
Quantitative
Determines if National CP target (if it exists) supported by the policy is meets the minimum required CP target established in the EU directive.
Governmental sites
Charging
Network (35%
) Provide necessary infrastructure to support EV
Install minimum CP required by EU directive
2.1
Current number of installed CP according to EU directive
0
According to COM (2018) 13-‐
ANNEX II
Current Number of CP
10.00% Current CP/Directive CP target
Quantitative Calculates how many of the required CP have currently been installed
Charge Point database appointed by authorities
2 EVs per CP 2.2 CP with more than 2 connectors
0 1 X 5.00% 0= No 1= Yes
Qualitative
Gives an approximation whether the CP on average can support more than 2 EVs by having more than 2 connectors. Determined by the ratio of connectors to CP
Charge Point database appointed by authorities
EV Support Capacity
Available number of connectors is higher than circulating EVs
2.3
Total Number of Connectors available for current EVs
0 Regis-‐tered EVs
Total available connec-‐tors
5.00% # Total Connectors/# total EVs
Quantitative
Calculates the percentage of EVs supported based on equal or higher available number of connectors
Charge Point database appointed by authorities

59
Perspe
ctive
Objectives Target KPI #
KPI Base-‐line
Goal 2020
Real Value
Weight Formula Type of Indicator
Description Information
Source
Network will addresses range limitations
Average EV drive range of 100km
2.4 Density of charge points within 100km
0 2 X 5.00%
0=low coverage 1=medium coverage 2= high coverage
Qualitative
Determine the density and coverage of charging network. 2 means there is high coverage throughout the whole territory (roads)
Charge Point database appointed by authorities
Public Accessibility
10% Public CP Required by directive
2.5 Publicly Accessible CPs
0
According to COM (2018) 13-‐
ANNEX II
X 5.00%
#Total Public charge points/minimum required by EU Directive
Quantitative Determine the number of CP that offer 'non discriminatory access to users'
Charge Point database appointed by authorities
Transborder connectivity
Coverage on transnational roads
2.6 CP on Highways 0 1 0 5.00% 0= No 1= Yes
Qualitative Determine whether there are CP available on highways connecting to other countries
Charge Point database appointed by authorities
Common
Techn
ical Spe
cifications (3
5%)
Interoperability and Connectivity
Single AC charger Plug Type 2 for Slow CP (3-‐3.7KW/
3.1 Percentage of Type 2 Slow Charge Points
0
Total Slow Charge Points
Total Type 2 Mode 3 Slow Charge Points
10.00% #Total Type 2 Mode 3 Slow CP/ # Slow CP
Quantitative
Calculate the percentage of Slow Charge Points that have standard EU connector Type 2 EN621960-‐2:2012
Charge Point database appointed by authorities
Single AC charger Plug Type 2 for Fast CP (7KW/32A)
3.2 Percentage of Type 2 Fast Charge Points
0
Total Fast
Charge Points
Total Type 2 Mode 3 Fast
Charge Points
10.00% #Total Type 2 Mode 3 Fast CP/ # Fast CP
Quantitative
Calculate the percentage of Fast Charge Points that have standard EU connector Type 2 EN621960-‐2:2012
Charge Point database appointed by authorities

60
Perspe
ctive
Objectives Target KPI #
KPI Base-‐line
Goal 2020
Real Value
Weight Formula Type of Indicator
Description Information
Source
Single DC Charger Plug Combo 2 for Fast Charging
3.3 Type 2 Combo DC Fast Charge Points
0
Total DC Fast Charge Points
Total Type 2 Combo DC Fast Charge Points
5.00% #total Combo 2/ # Fast DC CP
Quantitative
Calculate the percentage of Charge Points that have standard EU connector Type 2 COMBO (standard pending)
Charge Point database appointed by authorities
Common pricing scheme
Smart metering 3.4 CP have smart metering
0 1 X 5.00% 0= No 1= Yes
Qualitative Identify whether there is synergy between rollout of CP and smart metering.
Governmental sites
Common Payment scheme
3.5 Payment method
0 2 X 5.00%
0= No 1= Yes, within the Member State 2= Yes, with other Member States
Qualitative Identify if the payment method gives open access to all users.
Governmental sites

61
Annex 3 BSC Formulary
Blank BSC template:
Strategic Perspective
(A)
Objective (B)
KPI (C)
Weight (D)
Baseline (E)
Expected value (F)
Real Value (G)
Achievement (H)
% Weighted
(I)
National Policy
Framework (1)
Regulatory provision of
CP by developers
Regulated CP
installation for
developers
5% 0 1 0 0
Achievement:
Ec. 2 =+IF(F1="NM","NM",((G1-‐D1)/(F1-‐D1x))) Logical test: F1="NM” Value if true: “NM” Value if false: ((G1-‐D1)/(F1-‐D1)) Meaning that if the value for cell F1 is Not Measurable (NM), then %Achievement is also NM, if not then, it is the value given by the Value if false equation. Formula for % Weighted: Ec. 3 =+IF(H1="NM","NM",IF(H1>1,$D1,IF(H1<0,0,IF(OR(H1>0,H1<1),H1*$D1,"NM")))) Logical test: H1="NM” Value if true: “NM” Value if false: IF(H1>1,$D1,IF(H1<0,0,IF(OR(H1>0,H1<1),H1*$D1,"NM"))))

62
Annex 4. Comparison between battery technologies
Nominal Parameter
Battery Type
Lead-‐acid (Pb-‐acid)
Nickel Cadmium (NiCad)
Nickel Metal Hydride (NiMH)
Lithium-‐ion (LIB)
Chemical composition
Lead metal (-‐) Lead dioxide (+) Sulphuric acid (-‐/+)
Nickel Oxide (+) Metallic Cadmium (-‐) Lye solution: potassium hydroxide and lithium hydroxide (-‐/+)
Hydrogen (-‐) Metal alloy (+)
Carbon (-‐) Lithium metal oxide (+) Organic solution (-‐/+)
Specific energy (Wh/kg)
40 60 70 125
Specific Power (W/kg)
250 200 350 400
Nominal cell voltage (V)
2 1.2 1.2 3.5
Efficiency 80-‐85% 70-‐75% 70% 90%
Commercial availability
Readily available Good for small sizes
Good range of small cells but low for traction batteries
Standard battery for electric road vehicles
Number of Life-‐cycles
500 1350 1350 1000
Recharge time Full: 8h 90%: 1h
Full: 1h, 60%: 20 min rapid charge
Full: 1h 60%: 20 min rapid charge
Full: 2-‐3h 80%: >1h
Adapted from: Larminie and Lowry (2012) and Matheys and Autenboer (2004) (+): cation, positive charge ion (-‐): anion, negative charge ion

63
Annex 5 BSC summary
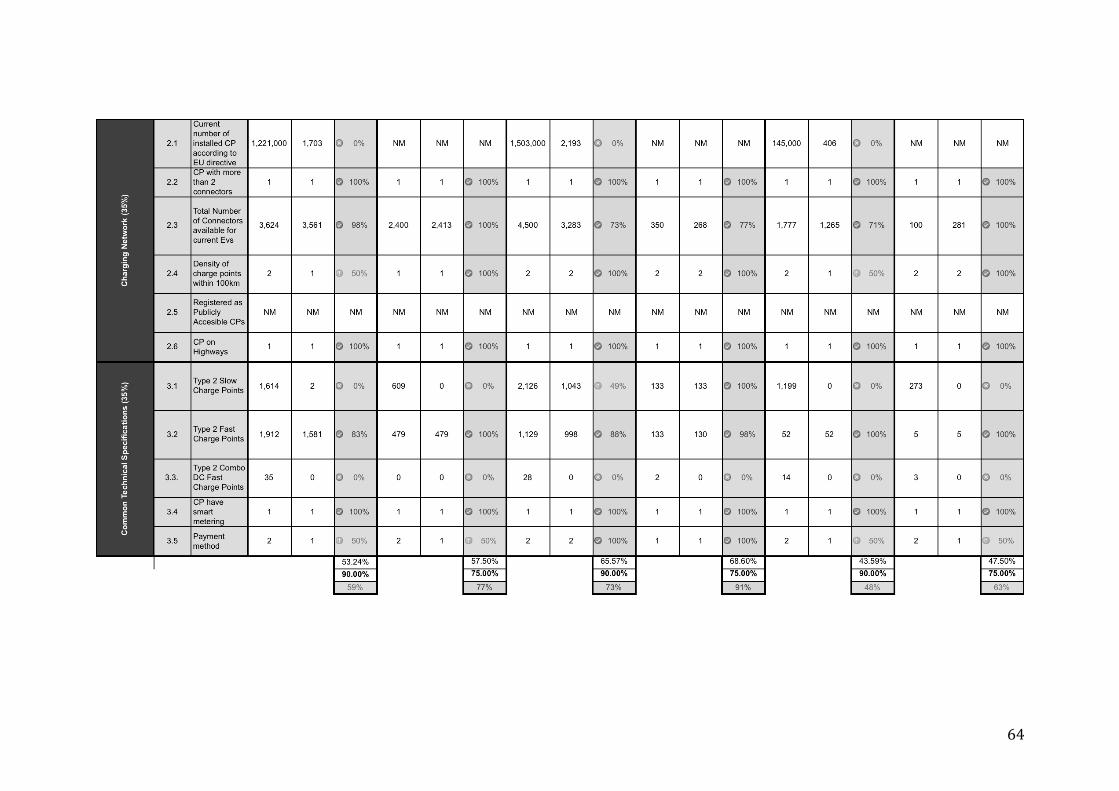
64

65
Annex 6. Charging Points database and calculations
United Kingdom
UK Total Standard UK London
Standard London
Total Charge Points 1703 726 1088* 479 Total Connectors 3561 1583 2176** 957 Slow (3.7KW/16Amp)
1614 2 1219 0
Fast (7KW/32Amp) 1581 1581 957 957 DC Fast 35 0 2 0 UK Total source: National Charge Point Registry, Official database of the UK Government, last updated 04/05/2013. Available at: (http://www.nationalchargepointregistry.com) London sources: *Total charge points: Source London webpage (sourcelondon.net), last update 04/05/2013 **Number of connectors estimations according the Source London (2013) report:
Approximately 2 connectors per charge point: 1088 x 2 = 2176
Power rating and plug type • Fast (7kW/32A), Mennekes (Plug Type 2 IEC 62916): 44%
1088 x 44% = 957 • Slow (3.7kW/16A), BS(1363): 56%
1088 x 56% = 957 Germany and Berlin
Germany Standard Germany
Berlin Standard Berlin
Total Charge Points
2200 1052 133 130
***Total Connectors
3283 2041 268 263
Slow (3.7kW/16A)
2126 1043 133 133

66
Fast(7kW/32) 1129 998 133 130 DC Fast 28 0 2 0
Source: the online charge point map website LamNet was selected because it is appointed as a successful case study by National Platform Electromobilität. The website also contains the highest registry of charge points in Germany. The total number of charge points in LamNet coincides with the total officially number of charge points registered by the Work Group 3 (2012)
***Total connectors: obtained by adding the amount of connectors from each category Sweden and Stockholm
Sweden Standard Sweden
Stockholm Standard Stockholm
Total Charge Points
406 31 31 1
***Total Connectors
1265 52 281 5
Slow (3.7KW/16A)
1199 0 273 0
Fast(7KW/32A) 52 52 5 5 DC Fast 14 0 3 0
Source: Uppladdning (www.uppladdning.nu), online charge point map, appointed by the El Bils Upphandling and Stockholm parking authorities.
***Total connectors: obtained by adding the amount of connectors from each category