Embed Size (px)
Citation preview

UNLV Theses, Dissertations, Professional Papers, and Capstones
8-2011
The development and validation of a tool to measure self-The development and validation of a tool to measure self-
confidence and anxiety in nursing students while making clinical confidence and anxiety in nursing students while making clinical
decisions decisions
Krista Alaine White University of Nevada, Las Vegas
Follow this and additional works at: https://digitalscholarship.unlv.edu/thesesdissertations
Part of the Curriculum and Instruction Commons, Educational Assessment, Evaluation, and Research
Commons, and the Nursing Commons
Repository Citation Repository Citation White, Krista Alaine, "The development and validation of a tool to measure self-confidence and anxiety in nursing students while making clinical decisions" (2011). UNLV Theses, Dissertations, Professional Papers, and Capstones. 1384. http://dx.doi.org/10.34917/3276068
This Dissertation is protected by copyright and/or related rights. It has been brought to you by Digital Scholarship@UNLV with permission from the rights-holder(s). You are free to use this Dissertation in any way that is permitted by the copyright and related rights legislation that applies to your use. For other uses you need to obtain permission from the rights-holder(s) directly, unless additional rights are indicated by a Creative Commons license in the record and/or on the work itself. This Dissertation has been accepted for inclusion in UNLV Theses, Dissertations, Professional Papers, and Capstones by an authorized administrator of Digital Scholarship@UNLV. For more information, please contact [email protected].

THE DEVELOPMENT AND VALIDATION OF A TOOL TO MEASURE
SELF-CONFIDENCE AND ANXIETY IN NURSING STUDENTS
WHILE MAKING CLINICAL DECISIONS
By
Krista Alaine White
A dissertation submitted in partial fulfillment
of the requirements for the
Doctor of Philosophy in Nursing
School of Nursing
Division of Health Sciences
The Graduate College
University of Nevada, Las Vegas
August 2011

Copyright by Krista Alaine White, 2011
All Rights Reserved

ii
THE GRADUATE COLLEGE
We recommend the dissertation prepared under our supervision by
Krista Alaine White
entitled
The Development and Validation of a Tool to Measure Self-Confidence
and Anxiety in Nursing Students While Making Clinical Decisions
be accepted in partial fulfillment of the requirements for the degree of
Doctor of Philosophy in Nursing School of Nursing
Cheryl Bowles, Ed. D., R.N., CNE, Committee Chair
Lori Candela, Ed. D., R.N., CNE, Committee Member
Michele Clark, Ph. D., R.N., Committee Member
Joanne Thompson, Ph. D., MSW, Graduate College Representative
Ronald Smith, Ph. D., Vice President for Research and Graduate Studies
and Dean of the Graduate College
August 2011

iii
ABSTRACT
The Development and Validation of a Tool to Measure Self-Confidence and Anxiety
in Nursing Students While Making Clinical Decisions
By
Krista Alaine White
Dr. Cheryl Bowles, Examination Committee Chair
Professor of Nursing
University of Nevada, Las Vegas
Clinical decision making (CDM) is a cornerstone skill for nurses. Self-confidence
and anxiety are two affective influences that impact the learning and adeptness of CDM.
Currently, no instruments exist that measure perceived self-confidence and anxiety level
of undergraduate nursing students related to CDM. The purpose of this research was to
develop, test, and establish psychometric properties for a quantitative instrument that
measures the levels of self-confidence and anxiety experienced by undergraduate nursing
students while making clinical decisions. The new tool is entitled the Nursing Anxiety
and Self-Confidence with Clinical Decision Making (NASC-CDM) scale. The tool is a
self-report, Likert-type instrument with two subscales measuring levels of self-confidence
and anxiety. Bandura‟s social cognitive theory, regarding self-efficacy and anxiety
arousal framed the study along with two embedded nursing models which explain the
relationship between self-confidence, anxiety, and CDM.
Content validity and face validity were established through critique by a panel of
internationally known experts in the area of CDM and by a panel of undergraduate
student nurses and registered nurses. Two samples of pre-licensure associate and
baccalaureate nursing students participated in either the pilot- (fall 2010, n = 303) or

iv
main-testing (spring 2011, n = 242) phase of the study to test the scale. Exploratory
factor analysis was used to examine the scale‟s construct validity. Items were reduced
from the scale based on EFA results from each sample. Similar factor structures were
found between the two samples, indicating a stable three dimensional scale. The self-
confidence and anxiety subscales of the NASC-CDM scale were correlated with two
psychometrically sound instruments to examine convergent validity. Pearson r
correlation coefficients examined the relationship between the self-confidence subscale
and the General Self-Efficacy (GSE) scale. Results were positive, moderate and
significant at .54 and .62 for the fall and spring samples respectively. Pearson r
correlation coefficients examined the relationship between the anxiety subscale and the
Generalized Anxiety Disorder-7 (GAD-7) scale. Results were positive, low to moderate
and significant at .52 and .38 for the fall and spring samples respectively. Internal
consistency reliability was assessed using Cronbach‟s alpha reliability coefficient. Alpha
coefficients for the final version were: self-confidence subscale, α = .97 and anxiety
subscale, α = .96.
Results of the study provided initial evidentiary support for the NASC-CDM scale as
a content valid, construct valid, convergent valid and reliable measurement tool.
Findings of the study have important implications for nursing education. Nurse educators
may be able to utilize the NASC-CDM scale in numerous situations, around real-life or
simulated clinical experiences. If nurse educators are aware of how affective states, such
as levels of self-confidence and anxiety, influence nursing students while moving through
the process of making clinical decisions, they can intervene more effectively and
facilitate students learning the vital skill of CDM.
v
ACKNOWLEDGEMENTS AND DEDICATION
Dedication
This dissertation work is dedicated to two people, my husband and my mother-in-law
(posthumous). Without the love, support, and commitment of my best friend, this
dissertation research, I am certain, would not have come to fruition. Therefore most
importantly, this paper is dedicated to the love-of-my-life and very best friend, my
husband Kerry White. Despite that she did not physically see this project to its
completion, I know my mother-in-law, Hulda White, is watching and cheering from
Heaven. Her famous words to me during this journey were, “I love you, now don‟t work
so hard that you crack-up.” We did it Mom White – sanity intact!
Acknowledgements
As is the case with all doctoral dissertations, the number of people who assist with the
research inquiry and document preparation are countless. Two groups of people must be
acknowledged; family and friends and committee members. To my family and friends
who often had no comprehension of the trials I faced, the timelines I kept, or even the
terminology I used but who listened anyway, I thank you. Often all I really needed was a
supportive ear. Mr. Jim Scofield read chapters and provided editorial suggestions. His
time and efforts are appreciated. A special appreciation goes to my parents, Don and
Diane Weir, who graciously gave up many days from September through April to travel
with me across three states in the name of classroom visits and student recruitment.
The representatives who comprise the dissertation committee are imperative for a
successful study. Recognition must be given to Dr. Chad Cross for his statistical
expertise. As I struggled with normality, outliers, homoscedasticity, and interpreting

vi
outputs, emails were generated. Dr. Cross replied promptly, kindly, and calmly – even
when my messages were drafted in panicked frenzy. His demeanor reassured and
motivated me to keep going. Conceptual frameworks are fundamentally essential for any
scientific inquiry. Dr. Michele Clark was instrumental in helping me see clearly the
tenets of Bandura‟s social cognitive theory. She is certainly an expert. Dr. Lori
Candela‟s experience with the quantitative research process, and novice practitioner
populations were vital to my success. When questions arose she provided insightful
timely feedback. Thank you. The time and effort put forth by my graduate college
representative, Dr. Joanne Thompson, is also appreciated.
There are adjectives which describe the perfect dissertation committee chairperson:
cheerful, devoted, meticulous, motivated, patient, tireless, and zealous. Dr. Cheryl
Bowles, the chair my PhD dissertation examination committee, epitomizes each of these.
She worked thoroughly to help me articulate the best study design. She appropriately
questioned components of the design I thought were perfectly apparent… but she knew
better and made me clarify. She guided and encouraged me through the IRB approval
process at 54 institutions of higher education. She waded through an inordinate number
of emails over the course of two and a half years, held video meetings on weekends, and
proofread diligently. Had it not been for the perfect dissertation committee chairperson
qualities possessed by Dr. Bowles, I would not have earned a new professional credential.
My gratitude is immeasurable.

vii
TABLE OF CONTENTS
ABSTRACT ....................................................................................................................... iii
ACKNOWLEDGEMENTS AND DEDICATION............................................................. v
LIST OF TABLES .............................................................................................................. x
CHAPTER 1 INTRODUCTION .................................................................................... 1
Background and Statement of the Problem ................................................................... 2
Early Instrument Development ...................................................................................... 4
Statement of the Study Purpose ..................................................................................... 5
Chapter Summary .......................................................................................................... 6
CHAPTER 2 REVIEW OF RELATED LITERATURE ................................................ 7
Historical Viewpoints of Clinical Decision Making ...................................................... 7
Clinical Decision Making Content Domains ............................................................... 12
Constructs Related to Clinical Decision Making ......................................................... 23
Emotional Barriers of Self-Confidence and Anxiety ................................................... 25
Conceptual Frameworks .............................................................................................. 28
Definitions of Constructs ............................................................................................. 37
Chapter Summary ........................................................................................................ 40
CHAPTER 3 METHODOLOGY ................................................................................. 41
Research Questions ...................................................................................................... 41
Psychometric Theory ................................................................................................... 42
Instrument Development .............................................................................................. 44
Sampling Framework ................................................................................................... 55
Data Collection Methods ............................................................................................. 59
Data Analysis ............................................................................................................... 76
Chapter Summary ........................................................................................................ 91
CHAPTER 4 FINDINGS OF THE STUDY ................................................................ 92
Results from the Pilot-Testing Phase ........................................................................... 92
Results from the Main-Testing Phase ........................................................................ 121
Chapter Summary ...................................................................................................... 145
CHAPTER 5 SUMMARY, CONCLUSIONS, AND RECOMMENDATIONS ....... 146
Discussion of Study Results....................................................................................... 147
Relationship with Conceptual Frameworks ............................................................... 164
Strengths of the Study ................................................................................................ 168
Limitations of the Study............................................................................................. 171
Implications for Nursing Education and Practice ...................................................... 173
Recommendations for Further Research .................................................................... 176
Chapter Summary and Conclusions ........................................................................... 179

viii
APPENDIX A Nursing Models and Permission ........................................................ 180
APPENDIX B Initial NASC-CDM Scale Blueprint ................................................... 183
APPENDIX C Initial Item-Pool of the NASC-CDM Scale by Content Domain ....... 184
APPENDIX D Sample Invitation Sent to Expert Reviewers...................................... 188
APPENDIX E Expert Reviewer Rating Packet .......................................................... 189
APPENDIX F Content Validity Indices from Expert Reviewers ............................... 204
APPENDIX G Pilot Version Item-Pool of the Scale by Content Domain ................. 207
APPENDIX H Demographic Questions ..................................................................... 215
APPENDIX I General Perceived Self-Efficacy Scale and Permission ..................... 217
APPENDIX J Generalized Anxiety Disorder-7 Scale and Permissions ..................... 220
APPENDIX K IRB Approval from UNLV and Informed Consent ........................... 224
APPENDIX L Contact Letter for Faculty-Contact ..................................................... 228
APPENDIX M Student Recruitment Flyer ................................................................. 229
APPENDIX N Initial Email Sent to Student by Faculty-Contact............................... 230
APPENDIX O Faculty-Contact and Student Follow-up Emails ................................ 231
APPENDIX P Characteristics and Comparisons of Sample, Pilot ............................. 233
APPENDIX Q Factor Analysis Results for Self-Confidence Subscale, Pilot ............ 238
APPENDIX R Factor Analysis Results for Anxiety Subscale, Pilot .......................... 241
APPENDIX S Overlapping Items among NASC-CDM Subscales, Pilot .................. 244
APPENDIX T Reliability Results of Subscales, Pilot ................................................ 245
APPENDIX U Results of Independent Samples t-tests, Pilot .................................... 246
APPENDIX V Five Questions Related to the NASC-CDM Scale, Pilot ................... 247
APPENDIX W Content Analysis for Open-Ended Questions Related to the

ix
NASC-CDM Scale, Pilot .................................................................. 250
APPENDIX X Characteristics and Comparisons of Sample, Main ............................ 251
APPENDIX Y Factor Analysis Results for Self-Confidence Subscale, Main ........... 256
APPENDIX Z Factor Analysis Results for Anxiety Subscale, Main ......................... 259
APPENDIX AA Overlapping Items among NASC-CDM Subscales, Main ................ 262
APPENDIX BB Reliability Results of Subscales, Main ............................................. 263
APPENDIX CC Results of Independent Samples t-tests, Main .................................. 264
APPENDIX DD Characteristics and Comparison of Pilot and Main Samples ........... 266
APPENDIX EE Overlap of Factor Structures and Content Domains ......................... 268
BIBLIOGRAPHY ........................................................................................................... 270
VITA ............................................................................................................................... 290

x
LIST OF TABLES
Table 1 Eligible Associate and Baccalaureate Nursing Programs ............................... 58
Table 2 Position of Three Scales within the Survey Package ...................................... 68
Table 3 Nursing Programs Agreeing to Participate, Pilot............................................ 94
Table 4 Assessment of Normality for Age, Pilot ......................................................... 98
Table 5 Results of Composite Scores for Four Scales, Pilot ..................................... 100
Table 6 Assessment of Normality for Total Scores on Scales, Pilot ......................... 101
Table 7 KMO and Bartlett‟s Test Results, Pilot ........................................................ 104
Table 8 Results of Coefficients Table for Standard Multiple Regression
Analysis, Pilot ............................................................................................. 118
Table 9 Nursing Programs Agreeing to Participate, Main ......................................... 123
Table 10 Assessment of Normality for Age, Main ...................................................... 126
Table 11 Results of Composite Scores for Four Scales, Main .................................... 127
Table 12 Assessment of Normality for Total Scores on Scales, Main ........................ 129
Table 13 KMO and Bartlett‟s Test Results, Main ....................................................... 132
Table 14 Results of Coefficients Table for Standard Multiple Regression
Analysis, Main ............................................................................................. 144

1
CHAPTER 1
INTRODUCTION
Few people would argue that professional nurses, as well as student nurses, do not
make numerous important decisions on a daily basis. In fact, some author‟s argue that
effective clinical decision making (CDM) “is the principal skill that separates
professional nursing personnel from ancillary or technical personnel and differentiates a
novice from an expert” (K. K. Hughes & Young, 1990, p. 189). In this era of high acuity
patients, CDM skills are important for professional nurses to possess (Baldwin, 2007;
Donohue & Martin, 1996): It is a “cornerstone skill for nurses” (Baxter & Boblin, 2008,
p. 345). Because nurses remain at the bedside far more than any other member of the
multi-disciplinary team, they are generally the first to observe cues in patients which may
warrant making a clinical decision. Once contextual cues are assessed by the nurse,
appropriate interpretation and action must occur (Bakalis & Watson, 2005; Hammond,
1964). Bakalis and Watson (2005) proclaim nurses who make effective clinical decisions
provide safer, more competent nursing care. Thompson (2002) further declares the
quality of health care is dependent upon the “clinical decisions of the professionals
delivering it” (p. 22). Patient outcomes are significantly influenced by the effectiveness
of the clinical decision making process (A. H. White, 2003).
This chapter contains three sections. The first section introduces the background and
statement of the research problem and includes the rationale for the pursuance of
instrument development for the study. The second section explains briefly the early
development of the quantitative self-report instrument that was refined and tested in this
study. The third and final section of this chapter describes the purpose of the study.

2
Background and Statement of the Problem
Since CDM is such an important acquired skill for nurses, the process of learning it
must not begin as a graduate nurse; it must be introduced and practiced during pre-
licensure nursing education programs. Several influences do exist however, that impact
the learning and adeptness of CDM. A lack of self-confidence and a high level of
anxiety are affective influences to consider when teaching and learning the process of
CDM (Baxter & Rideout, 2006; Haffer & Raingruber, 1998). These influences will be
termed emotional barriers to CDM (O'Neill, Dluhy, Fortier, & Michel, 2004a). Because
patient outcomes are at stake, it is imperative that nursing students begin to develop and
feel confident with CDM steps during the safety of supervised educational experiences
(O'Neill, Dluhy, & Chin, 2005). If nurse educators are more fully aware of the CDM
processes in students and what affective states influence the processes, they can foster
CDM attributes more adeptly, ultimately making students more confident and less
anxious with this burgeoning skill (Itano, 1989; Tschikota, 1993).
The primary focus of this research was the emotional barriers, self-confidence and
anxiety level (O'Neill et al., 2005) which influence the process of CDM in pre-licensure
student nurses during the provision of patient care in the clinical practicum environment.
Although a surfeit of research related to CDM has been conducted using qualitative
(Baxter & Boblin, 2008; Itano, 1989) and quantitative (Bakalis & Watson, 2005;
Grossman, Campbell, & Riley, 1996) methods, the instruments utilized for quantitative
inquiry most often have had limited psychometric property testing. Therefore, an
extensive search within nursing and allied health literature was conducted to locate a
psychometrically sound instrument that measures nursing students‟ levels of self-

3
confidence and anxiety during the process of CDM. The results of the inquiry yielded
16 quantitative instruments related to CDM. However, no quantitative instrument was
found which measures the construct of CDM within the area of the perceived self-
confidence and anxiety level in undergraduate pre-licensure nursing students as they
progress through the CDM process.
Numerous instruments located within the literature were designed for the studies in
which they were used and demonstrate limited established psychometric properties.
Furthermore, existing instruments were often developed to measure CDM in a precise
setting and in a certain context, not to measure the CDM process in a more holistic
fashion including emotional barriers which influence it. For instance, Fry and Burr
(2001) examined emergency room nurses making clinical decisions within triage
situations and Papathanassoglou, Tseroni, Karydaki, Vazaious, Kassikou, and Lavdaniti
(2005) studied experienced nurses‟ CDM and autonomy within Hellenic intensive care
settings. Finally, sampling methods used to establish psychometric properties for
existing measures used primarily experienced clinicians, not undergraduate nursing
students. Of the 16 instruments found in the literature related to CDM in nursing, only
two (Grundy, 1993; Jenkins, 1983) used undergraduate nursing student samples to
establish psychometric properties. Additionally, one instrument was located in the
respiratory care literature that relates to the problem solving abilities of respiratory care
students.

4
Early Instrument Development
Because the development of the process of CDM is imperative for novice nurses
(Bakalis & Watson, 2005; Baxter & Boblin, 2008; O'Neill et al., 2005), because the
emotional barriers of low self-confidence and high anxiety affect decision making
processes (Haffer & Raingruber, 1998; Wood & Bandura, 1989), and because no
quantitative instrument exists that measures these two important emotional barriers,
instrument development was the intent of this research study. A methodological study
was planned to develop and test a quantitative research instrument.
A comprehensive concept analysis of self-confidence was conducted as part of the
preliminary work for the design of this new quantitative scale (K. A. White, 2009).
Theoretical literature and empirical studies were extensively reviewed for construct
analysis and for the formulation of content domains within CDM. An initial pool of 82-
items within four content domains resulted from the deductive inquiry. These items were
used to construct a self-report Likert-type tool entitled the Nursing Anxiety and Self-
Confidence with Clinical Decision Making (NASC-CDM) scale.
The early drafts of the NASC-CDM scale contained two subscales within four
content-domains. These subscales related to the two emotional barriers being measured
in undergraduate nursing students: self-confidence and anxiety. The content domains of
the NASC-CDM scale embraced the process or cognitive steps of CDM: investigating
information and cues; interpreting information and meaning; integrating findings and
illuminating options; and intervening and reflecting on the decision process. Therefore,
users of the tool may have the ability to obtain subscores for respondents that relate to
two emotional barriers and four domains of CDM.
5
A preliminary appraisal of content validity was performed to assess the NASC-CDM
scale for relevancy, clarity, and comprehensiveness (DeVellis, 2003). Five
internationally known experts in the content area of CDM were invited to evaluate the
82-item first draft of the NASC-CDM scale in spring 2009. Both item-content validity
and scale-content validity were calculated (Polit, Beck, & Owen, 2007). Items were
reduced or revised based on expert panelist feedback. Subsequently, the second draft of
the NASC-CDM scale was critiqued by registered nurses and undergraduate student
nurses, including some with English as a second language, to ensure item clarity and
readability and ensure face validity (DeVellis, 2003). After significant revision and
reduction of items, the NASC-CDM scale was finalized into the draft used in the pilot-
testing and validation phase of the research study.
Statement of the Study Purpose
The purpose of this dissertation research was to test, validate, and establish
psychometric properties for the NASC-CDM scale which is a Likert-type, norm-
referenced, self-report instrument (Polit & Beck, 2008; Waltz, Strickland, & Lenz, 2005).
The NASC-CDM scale is designed to measure the level of self-confidence and level of
anxiety experienced by undergraduate nursing students as they progress through the
CDM process.
The NASC-CDM scale is intended for a number of uses: it was deliberately written in
a generic manner to allow for increased generalizability among different program types,
different levels of students within a program, and varied clinical situations; it may
evaluate changes in self-confidence and anxiety with CDM when used longitudinally
6
across the curriculum; it may be useful in a formative or summative fashion; and it may
be used in a pre- and post-test design surrounding clinical simulation or clinical
practicum experiences. The NASC-CDM scale is also intended for use with graduate
nurses who again find themselves in affectively charged novice circumstances.
Chapter Summary
This chapter described the importance of CDM to professional nursing. Quality
patient care and positive patient outcomes depend on nurses‟ abilities to accurately
recognize a patient problem, assess cues within the situation, consider plausible decision
options, and act in the best interest of the patient. The concepts of self-confidence and
anxiety as emotional barriers which influence CDM were introduced. Currently no
quantitative instrument exists which measures the level of self-confidence and level of
anxiety in undergraduate students as they move through the cognitive steps of making a
clinical decision. Therefore, instrument development was the purpose of this dissertation
research. A brief introduction regarding preliminary work on and structure of the NASC-
CDM scale was provided. The following chapter reviews literature related to the
constructs of CDM, self-confidence, and anxiety.

7
CHAPTER 2
REVIEW OF RELATED LITERATURE
The purpose of this chapter is to review seminal works, as well as current literature
related to CDM, within medicine and nursing. A domain-referenced approach (Gable &
Wolf, 1993) was used to examine the breadth and depth of CDM and to create an
inclusive pool of items for the NASC-CDM scale (DeVellis, 2003; Switzer, Wisniewski,
Belle, Dew, & Schultz, 1999). Additionally, literature is reviewed which examines the
relationship of two emotional barriers, self-confidence and anxiety, to the CDM process.
The terms student nurse and novice clinician are used interchangeably.
Six sections comprise this chapter. Three historically relevant viewpoints of CDM
are initially presented followed by an explication of four content domains of CDM.
Within the third section, several similar constructs related to CDM are defined. Rationale
for why these constructs are not CDM, and therefore are not included within the context
of the NASC-CDM tool, is provided. In the fourth section, two emotional barriers related
to CDM are described. The fifth section contains an explanation of the two theoretical
frameworks which undergird the study. In the sixth and final section of this chapter,
conceptual and operational definitions of constructs used within the research study are
presented.
Historical Viewpoints of Clinical Decision Making
Empirical research related to CDM commonly adheres to three viewpoints: analytic
decision theory, information-processing theory, and the intuitive-humanistic model.
Early studies were grounded in analytic decision theory, which emphasizes the use of

8
algorithms and decision trees (Elstein, Shulman, & Sprafka, 1978; Hammond, 1964).
Information-processing theory embraces the process of cue recognition, hypothesis
generation, and the formulation of decision options (Elstein, Kagan, Shulman, Hilliard, &
Loupe, 1972; Harbison, 1991; Westfall, Tanner, Putzier, & Padrick, 1986). The intuitive-
humanistic stance asserts that experiential knowledge and intuitive thought are integral to
CDM (Banning, 2008; Benner, 2001; Rew, 2000). Items on the NASC-CDM scale were
designed to incorporate tenets from information-processing and intuitive-humanist
viewpoints.
Analytic Decision Theory
Research methodologies based on probability, logic, and linear sequences are the
basis for analytic decision theory (Aspinall, 1979; Thompson, 1999). Bayes‟ theorem is
one example of the prescriptive analytic decision viewpoint. Elstein et al., (1978) cite the
premise of Bayesian theory as “a precise mathematical formula for calculating the degree
of change that should take place in a belief to reflect accurately the impact of new
information” (p. 30). Seminal works within the realm of CDM in nursing used Bayesian
methods to determine the extent nurses revised their judgments about patient cues and the
probable state-of-the-patient in a manner that could be predicted by a logical
mathematical model (Hammond, Kelly, Schneider, & Vancini, 1966). Aspinall (1979)
utilized a decision analytic framework, in the form of algorithmic decision trees, to
investigate the accuracy of 30 triads of experienced nurses in deciding the correct
problem for a post-operative patient. Decision analytic theory has been referred to as a
rationalistic (Harbison, 1991) and linear-reductionist (Vance, Groves, Paik, & Kindler,
2007) viewpoint.

9
Despite the use of decision analytic techniques in early research related to CDM, it is
generally not used in current research within clinical professions for one primary reason.
Situations with patients are perpetually fluid with innumerable variability; human
problem solving cannot be matched to a template or set against textbook descriptions
(Elstein et al., 1978). Clinical professions such as medicine, nursing, and clinical
psychology boast ambiguity (Pica, 1998) and complexity (Botti & Reeve, 2003; K. K.
Hughes & Young, 1990). The tenets of decision analytic theory boast logic and linearity.
Because of this principal incongruence between variable clinical professions and logical
analytic thinking, often a different methodological approach is taken to examine CDM
related to human problems within clinical professions.
Information-Processing Theory
Information-processing theory adheres to a descriptive hypothetico-deductive
philosophy (Harbison, 2001; Muir, 2004). Its primary premise is that CDM is an iterative
cognitive process whereby clinicians move through steps such as data collection,
hypothesis generation, cue interpretation, and hypothesis evaluation. Information is
subsequently synthesized, a decision is made, and action ensues.
Early research in the area of CDM using the information-processing viewpoint was
conducted with novice and experienced physicians (Elstein et al., 1972; Elstein et al.,
1978). Authors of theoretical literature argue paramount to the information-processing
viewpoint is the practitioners‟ recognition and use of patterns of information in order to
make quality decisions (Banning, 2008; Harbison, 1991). Information-processing has
been referred to as a phenomenological (Harbison, 1991) and non-linear (Vance et al.,
2007) viewpoint.

10
A variety of empirical studies in nursing embrace the tenets of information-
processing theory. Jenkins‟ (1983) doctoral dissertation research adhered to an
information-processing framework and examined different levels of undergraduate
nursing students and measured perceptions of their own CDM ability. Lauri and
Salantera (1995, 1998) used the information-processing viewpoint to guide several
studies that identified nursing decision making models used by novice and experienced
registered nurses in different clinical arenas. Thiele and her colleagues (1991) carried out
a study with undergraduate baccalaureate students to assess perceptions of approaches to
CDM and to examine actual patterns of CDM used by novice students during their first
clinical nursing course. Their work embraced the information-processing perspective.
Because the information-processing viewpoint concedes situations within nursing are
complex, fluid, and human-oriented, and because its principles relate to the descriptive
process of how CDM occurs, its use is appropriate when studying the process of decision
making in clinical settings.
Intuitive-Humanistic Model
The intuitive-humanistic model of CDM acknowledges the concepts of intuition and
experiential knowledge as influential in making quality decisions. Thompson (1999)
posits this model examines CDM from the perspective of prior experience, expertise, and
the use of the nurses‟ feelings and instincts to assist with making effective decisions.
Essential to this viewpoint is the relationship between domain expertise, knowledge
enrichment, and how these influence decisions made by clinicians. Unlike the more task-
oriented information-processing viewpoint, the intuitive-humanistic viewpoint highlights
the clinician who makes the decision (Banning, 2008; Benner, 2001). One author (Rew,

11
2000) notes intuition is the application of knowledge. Within the context of CDM,
intuition was once viewed with skepticism but is now recognized as vital to the process.
Authors differ in their opinions about whether the intuitive-humanistic viewpoint
within nursing can be mastered only by experts or whether this ability might also be
possessed by novices (Benner, 2001; Lyneham, Parkinson, & Denholm, 2008; Smith,
Thurkettle, & dela Cruz, 2004). To confirm the importance of intuition related to CDM,
Rew designed a unidimensional quantitative instrument that measures nurses‟
acknowledgement of using intuition in CDM (Rew, 2000). Because the intuitive-
humanistic viewpoint recognizes situations within nursing are human-oriented and
domain-dependent, and because its principles relate to the clinician making the decisions,
its use is appropriate when studying the process of decision making in nursing (Banning,
2008; Thompson & Dowding, 2002).
Furthermore, there is a philosophy that CDM is not based exclusively on the
information-processing theory or the intuitive-humanistic model, but is an amalgamation
of the two. Numerous authors agree both these viewpoints are used by nurses when
making clinical decisions. Cognitive continuum theory is a multifaceted combined
philosophy of CDM. Hammond‟s cognitive continuum theory arose from cognitive
psychology as it applied to medicine and was subsequently applied to nursing by Hamm
(Cader, Campbell, & Watson, 2005; Harbison, 2001; Thompson, 1999).
Primary principles of cognitive continuum theory posit decisions are made using
information about judgment tasks as well as cognition components. Judgment tasks are
related to the structure of a clinical situation; tasks fall on a continuum ranging from ill-
structured to well-structured. Cognition components are related to the cerebral portion of
12
CDM; cognition components fall on a continuum ranging from intuitive thinking to
analytical thinking (Cader et al., 2005). This combined information-processing and
intuitive-humanistic viewpoint is also a useful framework when addressing CDM in
nursing (Lauri et al., 2001; Standing, 2008).
Clinical Decision Making Content Domains
Ensuring content validity is one of the most important steps in instrument
development (Beck & Gable, 2001). Items on the instrument should be derived from the
possible universe of content within the domain of interest (Gable & Wolf, 1993; Waltz et
al., 2005) and is generally a qualitative endeavor. A comprehensive literature review and
deductive approach resulted in the formulation of four content domains of CDM upon
which items on the NASC-CDM scale are based. It is acknowledged that CDM is
contextual and that the cognitive steps of CDM are fluid; hence, students move iteratively
through the steps prior to making their final clinical decision.
Investigating Information and Cues
The first content domain of CDM is investigating information and cues. As early as
1964, Kelly acknowledged both the importance and complexity of collecting data related
to CDM within nursing; “In the performance of her professional duties the nurse
routinely makes important and significant decisions based on uncertain data – data that
are complex, non-discriminating, and inconclusive” (p. 314). Early qualitative studies
identified attending to available patient cues and recognizing problematic elements from
these cues as essential to the decision making process (Elstein et al., 1972; Kelly, 1964).
Later studies revealed other important components like pre-encounter data, such as

13
patient chart information and obligatory knowledge to help identify patient problems, as
foundational to the CDM process. Some bit of requisite knowledge is imperative to make
quality clinical decisions (Cioffi, 2001; O'Neill, Dluhy, Andrea, & Ryan, 2006; Standing,
2007).
Numerous qualitative and quantitative studies identified data collection, assessment,
discovery, or cue recognition as a paramount early step in CDM (Jenkins, 1983; Tanner,
Padrick, Westfall, & Putzier, 1987; A. H. White, 2003). Tschikota (1993) calls this
process “cue-based data acquisition” (p. 390). Itano (1989) posits cues from patients are
the “building blocks or raw data from which decisions are made” (p. 121). Elstein et al.
(1978) cite, errors or omissions in data collection often attribute to mistakes made. A
theoretical article discussed a classroom teaching strategy to promote CDM in
baccalaureate nursing students related to the triage process of a pediatric patient in the
emergency department. The author of the article reflects upon the teaching strategy
usage, noting the importance of accurate assessment, data collection, and recognition of
cues by the students in order to make the best clinical decisions (Baldwin, 2007).
The intent of one exploratory inquiry examined the importance of data collection.
The study was conducted to examine cognitive strategies used by students and nurses to
derive a diagnosis for a patient problem. The study concentrated on three areas of
clinical reasoning: hypothesis activation, data acquisition, and diagnostic accuracy.
Results indicated that data acquisition occurred most often through hypothesis-driven and
cue-based assessments. Students asked more questions to generate plausible hypotheses
for the patient problem than their experienced nurse counterparts (Tanner et al., 1987).

14
Empirical works revealed additional skills necessary within this content domain.
Several studies noted that patients themselves influence the CDM process. Standing
(2007) studied novice undergraduate students longitudinally as they moved through their
nursing curriculum and into clinical practice. She identified active listening with the
patient as an essential conception of nursing and key to the CDM process. A. H. White‟s
(2003) qualitative inquiry of graduating baccalaureate students revealed knowing
patients, connecting with them, and observing nonverbal cues as integral to CDM.
Another study also confirmed the patient‟s impact on CDM. Knowing the patient is
imperative because “patients influenced every aspect of the student‟s decision making…
The patient provided the students with a multitude of both verbal and nonverbal cues”
(Baxter & Boblin, 2008, p. 123).
In Elstein and his colleagues‟ (1978) seminal work with internal and family medicine
physicians, the importance of utilizing nonverbal cues was cited. Most physicians
generated a number of plausible diagnoses for the clinical situation and most obtained
information using verbal cues from the patient. However, physicians also relied heavily
on nonverbal patient cues to judge the accuracy of a specific diagnosis they were
considering.
The final skill validated as important in this first content domain of the CDM process
is intuition (Rew, 2000; Tanner, 2006). In one study, during the final of four qualitative
interviews, participants who began the study as undergraduate students but were now
novice nurses in clinical practice discussed intuitive thinking as significant to their CDM
process. Interestingly, during the participants‟ earlier interviews, these same participants
did not stress an intuitive process to aid them with making clinical decisions (Standing,

15
2007). The pilot version of the NASC-CDM scale contained nine items related to
elements within this content domain.
Interpreting Information and Meanings
The second content domain of CDM is interpreting information and meanings. Once
preliminary cues are assessed they must be interpreted. Attending to the relevancy or
irrelevancy of collected data can be a difficult skill for novice clinicians (C. Hughes &
Hughes, 1990; O'Neill et al., 2006). Elstein et al., (1978) noted two problems often
encountered by medical students during the CDM (termed diagnostic inquiry) process
were excessive data collection and un-interpreted cues. They further explained that three
types of errors occur in relationship to cue interpretation; the novice tends to engage in
over-, under- and mis-interpretation. Kelly (1964) found inexperienced nurses may
ignore highly relevant cues while Hammond and his colleagues‟ (1966) seminal work
revealed that overall nurses did not consciously decipher useful and not-useful cues.
Girot (2000) examined critical thinking abilities and perceptions of CDM in
undergraduate first year and fourth year baccalaureate nursing students, new graduates
with baccalaureate degrees, and experienced diploma graduates returning for a bachelor‟s
degree in nursing. Results indicated that the graduate nurses with baccalaureate degrees
were more effective in their search for information about patient problems and in their
ability to decipher relevancy than were their first year undergraduate and diploma
graduate counterparts.
Another study further confirmed that students struggle to interpret the relevancy of
data collected. Students often gather large amounts of data then perceive a causal
relationship between all the cues and the current state-of-the-patient; they often suffer

16
from information overload (Itano, 1989). In a study that examined the relationship
between locus of control and CDM behaviors, results indicated that both groups of
undergraduate students (those whose locus of control was identified as internal and those
whose locus of control was identified as external) considered all pieces of information
they gathered to be relevant to the patient problem (Tschikota, 1993). Furthermore,
Thiele et al. (1991) found that novices consider all cues to be relevant to the patient
problem while Hughes and Young (1990) found that novices gather too much
information and put too much importance on irrelevant cues. O‟Neill et al. (2006)
posited novice clinicians have more difficulty eliminating irrelevant cues and honing in
on the real patient problem.
The use of knowledge and past experience to interpret best the information gathered
is critical to CDM. Numerous authors argue knowledge and experience are two leading
influences on CDM (Bakalis, 2006; Banning, 2008; Benner, 2001; Cioffi, 2001; Itano,
1989; Tanner, 2006); however, novice clinicians lack extensive nursing knowledge and
widespread clinical experiences. As students progress through their nursing curriculum,
and are exposed to more patient situations, they gain a broader spectrum of knowledge
and experiences upon which to draw.
Within an elective undergraduate course on clinical reasoning, all students expressed
anxiety and a sense of being overwhelmed by their lack of experience (Haffer &
Raingruber, 1998). One researcher studied student perceptions about CDM across
different levels of a baccalaureate curriculum and found that “… decision makers faced
with familiar problems may rely on simplifying strategies used in the past” (Jenkins,
1983, p. 19). Cioffi (2001) studied 32 experienced nurses to assess the use of past

17
experiences in CDM in emergent situations. Results revealed that 63 % of nurses among
six areas of clinical practice, used knowledge of past experiences to appropriately initiate
calls to the medical emergency team (rapid response team) for patients in crisis. Elstein
et al., (1978) argue the vastness of experiences makes the difference between experts and
weaker problem solvers. Novice clinicians must build their repertory of experiences in
order to become stronger decision makers.
Lasater (2007) assessed the effect of high-fidelity simulation experiences on students‟
development of clinical judgment and decision making abilities. The simulations held
throughout the semester gave students controlled experiences which they could later
apply to the clinical practicum setting. Focus-groups resulted in the emergence of themes
that acknowledged anxiousness, yet an increased awareness, with different clinical
situations and connectedness with other students. Often students gained experiences
vicariously from one another.
Another inquiry analyzed the CDM processes of expert experienced registered nurses
compared to novice senior baccalaureate nursing students during live patient encounters.
The researcher concluded that experienced nurses collected more cues than did students,
517 versus 368 respectively. She confirmed the importance of data collection to the
accurate CDM and noted that experience does affect the CDM process (Itano, 1989).
Brooks and Shepherd (1990) examined the relationship between CDM and critical
thinking in four types of nursing programs; two-year associate, three-year diploma, four-
year baccalaureate, and upper-division completion. Findings indicated significantly
higher CDM scores in the upper-division students than the other three program types.
Such findings suggest that nursing knowledge and expertise gained through clinical

18
experiences promote the process of CDM. One student‟s comment exemplifies the
importance of requisite knowledge when making sound clinical decisions; “You‟ve got to
know normal ranges of blood to deal with the results” (Standing, 2007, p. 264). The pilot
version of the NASC-CDM scale contained ten items related to elements within this
content domain.
Integrating Findings and Illuminating Options
Integrating findings and illuminating options is the third content domain within CDM
upon which items on the NASC-CDM scale are based. This domain includes the
components of analyzing the full clinical picture, considering decision options, analyzing
the risk-benefit ratio of the options being considered, and utilizing resources to aid in the
CDM process. Novice clinicians tend to be analytical and rule-based; they often have
difficulty comprehending the whole clinical picture and seeing patterns among cues
(Bakalis & Watson, 2005; Benner, 2001; O'Neill et al., 2006). Lauri and Salantera‟s
(1995) investigation of 200 in-patient and public-health Finnish nurses revealed novice
nurses rely heavily on protocols, procedures, and other resources during the CDM
process. Despite adherence by the novice clinician to a rule-laden philosophy, the
development of the ability to see the complete clinical picture is vital to CDM. Until
students gain confidence with the process of CDM and begin to see themselves as a
professional nurse, integrating the whole picture is limited (A. H. White, 2003).
Two studies, one within nursing and one within medicine, confirmed that accurate
decision making improves when cues are not observed in a vacuum; cues must be
clustered to see best the complete clinical picture (Elstein et al., 1978; O'Neill et al.,
2006). Westfall et al., (1986) cited the importance of comprehending the full clinical

19
picture related to CDM, referring to this skill as “complexity or pulling it all together” (p.
273). Vance et al., (2007) also posited the importance of the understanding the full
clinical picture related to CDM, referring to this ability as the “insightful component” of
decision making, the “explicated enlightened solution” - it is seeing clearly the full
picture of the clinical situation (p. 170).
Empirical studies reveal the formulation of decision options and the assessment of the
risk versus benefit of possible interventions are key elements of CDM. Baldwin‟s (2007)
summary of a classroom teaching strategy to promote CDM noted students struggle with
deliberating decision options and then acting on the decisions they choose. Byrnes and
West‟s (2000) quantitative exploratory inquiry of 520 registered nurses enrolled in a
baccalaureate completion program discovered that participants almost always
acknowledged searching for the best alternatives when deliberating about a clinical
patient problem. Tschikota (1993) found that senior diploma students formulated
hypotheses and considered interventions, but toiled over wanting more information to
make their decision. Various authors articulate that paramount to the CDM process is the
generation and deliberation of multiple plausible hypotheses as they relate to affects on
patient outcome. Moreover, these authors confirm experts can generate more decision
options than novices (Elstein et al., 1978; O'Neill et al., 2005).
Assessing the risk versus benefit of decision options is important in CDM and should
be considered in order that the ultimate decisions made affect patients in the most
positive way possible. Banning (2008) argues anticipating and controlling risks of each
potential decision option is imperative to the CDM process. Studies by O‟Neill and her
colleagues (2005), as well as Baxter and Boblin (2008), indicated that nurses rank the

20
degree of risk of each potential problem and then implement interventions to decrease the
likelihood of the most threatening risk occurring.
Numerous research findings support the importance of novice nurses‟ utilization of
resources to aid the CDM process (O'Neill et al., 2006; Standing, 2008). Resources used
by novice clinicians to assist with CDM are described as staff nurses (Baxter & Boblin,
2008), clinical faculty members (Seldomridge, 1997), and evidenced-based literature
(Lauri & Salantera, 1995; Lauri et al., 2001). Baxter and Rideout (2006) examined
influences on the CDM process using a qualitative methodology. Twelve undergraduate
nursing students in their first clinical course used journaling as a springboard for semi-
structured interviews. A theme which emerged among students was that one of the
hardest decisions is whether to make the clinical decision themselves or consult the nurse
or the faculty member. Hughes and Young (1990) conducted an exploratory study that
examined 101 medical surgical and intensive care nurses with varied levels of
experience. Participants completed a three-part 95-item instrument to measure their
consistency of CDM in situations with varied levels of complexity. A key finding
indicated the more complex the CDM situation, the more support the nurses required.
One empirical inquiry used interviewing and journaling to assess the kinds of
decisions undergraduate students made and factors which influence the CDM process.
The findings from the study summarize the various components of this third content
domain of CDM. Several themes such as determining interventions, considering the use
of outside resources (nurse preceptor or instructor), and acting on their decision options
emerged. Students noted that often their decision to act or not to act was based on the
risk-benefit assessment to themselves and the patient (Baxter & Boblin, 2008). One

21
student nurse‟s comments confirms the importance of the utilization of resources in the
CDM process; “I learned nurses often work as a team to make decisions: That has helped
me to ask for help” (Haffer & Raingruber, 1998, p. 66). The pilot version of the NASC-
CDM scale contained twelve items related to elements within this content domain.
Intervening and Reflecting on the Decision Process
The final content domain is intervening and reflecting on the decision process. This
content domain encompasses three primary elements: taking action on the interventions
being considered, evaluating outcomes, and being accountable for the action taken. The
term that makes the CDM process different from similar constructs such as clinical
judgment is action. The act of implementing an intervention is unique to CDM. Both
qualitative and quantitative studies confirm the importance of acting upon decision
options (Bakalis & Watson, 2005; Baxter & Boblin, 2008; Tschikota, 1993). Jenkins
(1985a) referred to the culmination of the CDM process or the action part of CDM as
choosing the right alternatives to make the most effective decisions.
Once the decision option is chosen and the action is implemented, critical reflection
of the outcomes must occur. In Standing‟s (2007) longitudinal study, she followed
undergraduate nursing students through the curriculum and into the first year of
professional practice. Students‟ comments reverberated about the need for reflection
about the decisions made. New graduates‟ comments addressed the stress of making
decisions independently and then being accountable for those decisions. Reflective
practice is essential for gaining knowledge, for improving clinical reasoning skills
(Tanner, 2006) and for improving confidence with decision making skills (Hoffman &
Elwin, 2004). During debriefing sessions following numerous high-fidelity simulation

22
experiences, two undergraduate nursing students summarized the reflective evaluation
process related to their CDM. One student commented, “The experiences where I
messed up, I learned the most.” A second student voiced, “You could really mess up...
you knew sim-man wasn‟t going to die” (Lasater, 2007, p. 273).
General professional accountability within nursing is important. Professional
accountability for decisions made within one‟s own clinical practice is also important
(Donohue & Martin, 1996; Muir, 2004). Bakalis (2006) argues that realizing the gravity
and taking responsibility for decisions made is a stressful venture. One perception of
CDM defined by participants in a study that lasted four years was that nurses must be
accountable for both right and wrong decisions made (Standing, 2007). Results of the
qualitative content analysis from the journals and interviews of undergraduate nursing
students about CDM revealed participants often sought support and utilized resources to
help make effective clinical decisions. However despite this fact, the researchers noted
that students need to be prepared to support the decisions they make and be accountable
for them (Baxter & Boblin, 2008).
Harbison (2001) argues that most nursing activities are not themselves good or bad
but nursing activities are assessed within the context of whether they are good or bad for
those entrusted to nursing‟s care. As such, nurses must make decisions that advocate best
for patients and then must be accountable for the decisions implemented. The pilot
version of the NASC-CDM scale contained ten items related to elements within this
content domain.

23
Constructs Related to Clinical Decision Making
It must be acknowledged that throughout the literature several terms resound
similarly to CDM but are not wholly CDM. Similar terms include clinical judgment,
clinical inference, and critical thinking. Often these terms are used interchangeably;
however, there are differences. This study pilot-tested and validated a research tool to
assess students‟ perceived levels of self-confidence and anxiety during the CDM process.
Therefore, it is important to differentiate between the construct of CDM and related
constructs.
CDM is an iterative process whereby clinicians assess cues, gather information
(Tschikota, 1993), interpret the meaning of information, determine the relevancy of
information (O'Neill et al., 2006), consider plausible decision options (Tanner et al.,
1987), choose a decision option in the best interest of the patient (Baxter & Boblin,
2008), and act. Unique to CDM is the element of action; the implementation of an
intervention (Bakalis & Watson, 2005; Jenkins, 1985b). Constructs related to CDM
embrace processes antecedent to the element of action. This research study was
interested in the comprehensive process of CDM, from cue acquisition through action
and thus did not include the related terms. Related constructs appear in italics.
Some authors propose that clinical judgment ensues when the clinician assembles
signs and symptoms about the state of a patient and draws a conclusion; the decision
making piece of CDM occurs henceforth (Kelly, 1964; Thompson & Dowding, 2002).
For example, signs and symptoms indicate the patient is constipated (the judgment). The
clinician then intervenes by offering prune juice and administering a laxative (the
decision). Therefore, clinical judgment processes precede CDM.

24
Clinical inference is a thinking process by the nurse that results in the determination
of whether or not action is necessary (Harbison, 2001). Once data are gathered within a
clinical situation, an inference is the conclusion drawn from that data (Kelly, 1964). In a
study of home health nurses, O‟Neill (1996) noted that each incidence of CDM “was
preceded by an inference about the state of the patient” (p. 365). The researcher
conducting this study concedes the constructs clinical judgment and clinical inference are
resoundingly similar. Clinical inference processes precede CDM.
Problem solving and critical thinking have been used synonymously with CDM.
Some pronounce that CDM is actually the end-product of problem solving and critical
thinking. Beyond merely problem solving or critical thinking, an elemental component
of CDM is action. The culminating piece which represents CDM is that the nurse takes
action (Bakalis, 2006; Donohue & Martin, 1996). Consequently CDM is its own entity,
separate from both problem solving and critical thinking (Brooks & Shepherd, 1990;
Girot, 2000; Oermann, 1997; Shin, 1998).
Another term, clinical reasoning, is most similar to CDM. Early studies related to
medical inquiry cite the final stage of clinical reasoning is when the clinician makes a
choice to implement a decision option from among the diagnostic alternatives (Elstein et
al., 1978). Tanner (2006) defines clinical reasoning as the process of making a judgment,
deliberating options, weighing them against the evidence, and choosing an appropriate
course of action. O‟Neill et al. (2005) argue the relationship among clinical reasoning
and CDM in their embedded nursing models. They cite novice clinicians develop clinical
reasoning skills, use resources, gain working knowledge, and act upon decision options in
order to gain experience and become expert decision makers. Other researchers explicate

25
clinical reasoning is the process of indentifying patients‟ needs and determining the most
appropriate action to achieve positive outcomes (Byrnes & West, 2000).
Emotional Barriers of Self-Confidence and Anxiety
Expert professionals and novice students differ with regard to CDM competence in a
number of ways. They differ in the frequency of missed cues (Itano, 1989), the ability to
eliminate irrelevant cues (O'Neill et al., 2006), and the number of plausible decision
options generated (Elstein et al., 1978). In addition to differences in cognitive processes
of CDM between experts and novices, there are affective influences on CDM. Two
affective emotional barriers are cited in the literature as paramount for novices to
conquer, a lack of self-confidence and emotional arousal or high anxiety.
The relationship between self-confidence, anxiety, and CDM is prevalent in a number
of studies. Key to quality CDM is that students must perceive they are capable of making
appropriate clinical decisions to achieve positive patient outcomes; hence, be self-
confident (Byrnes & West, 2000; Jenkins, 1985a; A. H. White, 2003). O‟Neill (1996)
examined CDM abilities and influences on CDM among homecare nurses. Results
revealed the more confident the nurse, the better the ability to consider plausible decision
options.
Congruent themes of fear, stress, anxiety, and a lack of self-confidence related to
CDM are apparent in several studies. A qualitative inquiry of 12 undergraduate students
in their first nursing clinical rotation revealed themes of knowledge level, confidence
level, and fear as most influential to CDM (Baxter & Rideout, 2006). In Standing‟s
(2007) study of nursing students and nursing graduates, confidence was cited as an

26
important perception of CDM. Furthermore, new graduates in this study posited that
being accountable for their decisions was stressful. A. H. White‟s (2003)
phenomenological inquiry of 17 graduating baccalaureate nursing students revealed when
the sense of self-confidence with technical and communication skills was stronger,
students were better able to focus on the patient. On the other hand, when the sense of
self-confidence was diminished, students focused on their own anxiety and not on the
patient‟s clinical situation.
Haffer and Raingruber (1998) examined the experiences of clinical reasoning to gain
an understanding of CDM in junior and senior baccalaureate nursing students. Student
participants were enrolled in an elective course on clinical reasoning. Their qualitative
content analysis revealed the presence of six themes for both diminished confidence and
increased confidence with CDM. Examples of themes that diminished confidence were:
perceiving others as more capable, being anxious about potential patient harm, and being
disorganized or scattered. Examples of themes that enhanced confidence were: drawing
strength from others‟ experiences, learning one‟s capabilities are comparable to peers,
and finding ways to focus on quality CDM under stress. One student wrote in her
journal, “… it seems to be that fear and anxiety of the situation leaves me in a paralyzed
state and I cannot sort out the steps involved to solve the problem” (Haffer & Raingruber,
1998, p. 66). In another study, one student‟s comments epitomize the influence of
emotional barriers on CDM; “However, the minute I opened the wound and saw what I
had to do, all the confidence and excitement I had were gone, I became nervous and
unsure of myself” (Baxter & Rideout, 2006, p. 124).

27
Most nurse educators would agree undergraduate nursing students often suffer from
anxiety and fall short on a firm sense of confidence. Rigorous lines of research cannot
conclude undeniably whether lesser amounts of anxiety promote self-confidence or
whether higher amounts of self-confidence curb anxiety. Various authors argue each is
the case. For instance, a concept analysis explicates self-awareness as one of three
defining attributes of self-confidence. One facet of self-awareness is the ability to stave
emotional arousal. “Anxiety level plays a pivotal role in the amount of confidence one
possesses” (K. A. White, 2009, p. 107). Mellalieu et al. (2006) studied self-confidence
and anxiety arousal in athletes prior to competition. Findings revealed that athletes who
used positive self-talk or self-pep-talks lessened their level of anxiety and thus, promoted
their level of self-confidence. Others also argue less emotional arousal equates to more
self-confidence (Sanna, 1999; Savitsky, Medvec, Charlton, & Gilovich, 1998).
Conversely, there is considerable empirical evidence to support that individuals who
possess higher levels of self-confidence more effectively control emotional arousal that
influences performance (Bandura, 1997; Schunk & Pajares, 2005; Zulkosky, 2009).
Schunk and Pajares (2005) cite students who are confident embrace more challenging
goals and engage in more effective self-regulatory strategies. Such self-regulatory
strategies control anxiety arousal. One renowned researcher further articulates that
individuals often perform satisfactorily despite high levels of anxiety if their level of self-
confidence is strong enough (Bandura, 1983).
The reality is that emotional barriers strongly affect novice clinicians. Literature
documents that repeated exposure and experience to situations helps diminish emotional
barriers (Bandura, 1977a; Bandura & Jourden, 1991; O'Neill, Dluhy, Fortier, & Michel,

28
2004b; K. A. White, 2009). Therefore, the more CDM situations the novice experiences
and the more clinical successes they encounter, the more emotional barriers can be
overcome. Seldomridge (1997) argues although stressful, students must be allowed to
“struggle through the judgment process without being told what to do: By reasoning in
clinical situations, students gain confidence in their abilities to make decisions” (p. 8).
Once students have attempted the CDM process the student-faculty dyad should review
and revise the process as necessary. If clinical environments as well as nursing faculty
members provide safety and support, students are less fearful and more confident to
practice the skill of CDM (Baxter & Rideout, 2006).
Conceptual Frameworks
Research that advances the science of nursing is underpinned by theory (Gall, Gall, &
Borg, 2007). The tenets of one learning theory and two embedded theoretical nursing
models were foundational to the development, testing, and validation of the NASC-CDM
scale. Social cognitive theory (Bandura, 1977b, 1997) along with the clinical decision
making and novice clinical reasoning models (O'Neill et al., 2004a; O'Neill et al., 2005)
provided the theoretical basis for this research study.
Social Cognitive Theory
Social cognitive theory (SCT) is a multi-faceted complex learning theory. Because
this learning theory is highly complex and embodies numerous constructs, the discussion
that follows relates to those components of the theory most relevant to the research study.
Originally coined social learning theory in 1977, the theory cites key concepts of

29
modeling of human behaviors, socialization, modes of reinforcement, motivation, self-
regulation, and self-efficacy (Bandura, 1977b, 1986; Crain, 2000).
Early work related to social learning theory and human behavior revolved around the
construct reciprocal determinism (Bandura, 1978b). Unlike theorists who pronounced
influences on human behavior were unidirectional, Bandura argued an interrelated
reciprocity among three determinants. The unidirectional premise of social learning
theory considered individuals and situations were independent entities that intermingled
to produce behavior. Conversely, the reciprocal determinant premise of social learning
theory posited that human behavior was dependent upon interactions between a triad of
factors; behavioral, cognitive, and environmental. In 1978, Bandura wrote, “The relative
influence exerted by these three sets of interlocking factors will vary in different
individuals and under different circumstances” (p. 346). Two phenomena instrumental to
this triadic viewpoint are the cognitive processes human agency and self-regulation.
The following figure depicts the theoretical relationship among concepts within SCT
and the research study. This researcher concedes the process denoted graphically as
linear and progressive is iterative in real-life situations. Concepts written in red italics
represent those elements of SCT most vital to the development, testing, and validation of
the NASC-CDM scale.

30
Figure 1. Regulating Behavior Model
The name change to SCT in 1986 resulted from a realization that cognitive processes
played an essential role in one‟s ability to self-regulate, evaluate context, consider task
difficulty, and perform in a wide array of situations. A principle philosophy of SCT is
that humans are cognitive beings with self-knowledge structures; they are agents of their
own behavior (Bandura, 1986, 2001, 2007). Agents make things intentionally happen by
their own actions (Bandura, 2001). One means of making things happen is to possess the
ability to regulate behaviors. When regulating behavior, a person examines key
components of the situation, task difficulty and situational context (Bandura, 1986).
According to SCT, three means of regulating behavior include external-, vicarious-,
and self-reinforcement. Although the means of regulating behavior named self-
reinforcement is most congruent with the purpose of this study, external- and vicarious-
reinforcement are described briefly for comparison. External-reinforcement is the

31
process by which behavior is influenced by direct and immediate consequences of one‟s
action. Such consequences may come in the form of the observance of outcomes or in
the form of direct feedback from others (Bandura, 1977b; Crain, 2000). For instance, a
nurse educator demonstrates external-reinforcement when providing written anecdotal
comments about a student‟s performance in the clinical practicum environment.
Vicarious-reinforcement is the process by which behavior is influenced by witnessing
the rewards or punishments of others. SCT promotes that seeing behaviors succeed in
others increases the propensity to act in a similar way oneself (Bandura, 1977b; Crain,
2000). For example, observing peers implement appropriate interventions during a high-
fidelity simulation exercise, and getting faculty praise for those efforts, enhances the
likelihood a nursing student who was observing will implement similar interventions in a
comparable situation.
Perhaps the most important means of regulating behavior is through self-
reinforcement. Self-reinforcement refers to the self-monitored process by which
behavior is influenced. Bandura (1977b) argues that if actions were determined “solely
by external reward and punishments, people would behave like weathervanes, constantly
shifting in different directions to conform to momentary influences…” (p. 128). SCT
asserts that individuals impose internal standards for behavior or performance. Once the
behavior occurs, the individual reflects upon the behavior and self-corrects as necessary
(Bandura, 1977b; Crain, 2000). For instance, a student forgets to confirm patency of a
gastric tube prior to administering medications. During the administration process, the
student realizes the tube is occluded when the syringe comes dislodged and the
medications spew into the patient‟s bed. Consequently, during the next medication
32
administration process via a gastric tube, the student remembers to first confirm tube
patency.
Performance in a situation is based on considerations of effort expenditure and
expectancy. Expectancy is comprised of two factors, outcome expectancy and efficacy
expectancy. Outcome expectancy presumes that actions are determined by a person‟s
conviction that the action will result in positive outcomes. Efficacy-expectancy (i.e. self-
efficacy) refers to the belief that people can produce the effects they desire by their own
actions (Bandura, 2007).
Self-efficacy is foundational to SCT (Bandura, 1977a, 1978a). Self-efficacy is also
fundamental to the intent of the newly designed NASC-CDM scale; it is one of the two
emotional barriers to CDM (O'Neill et al., 2005). The NASC-CDM scale contains a self-
confidence subscale related to undergraduate nursing students‟ perceptions of their level
of self-confidence as they progress through the process of CDM. To be effective
decision makers, nursing students must believe they can be successful with the skill. If
nurse educators can identify where students fall short on self-efficacy related to CDM,
they can intervene best and foster this burgeoning skill.
An influential work by Bandura (1977a) describes four sources of self-efficacy:
performance accomplishments, vicarious experience, verbal persuasion, and emotional
arousal. This research related most congruently to the fourth source of self-efficacy,
emotional or anxiety arousal; however, each is defined briefly. The performance
accomplishments source of self-efficacy relates to the amount of positive experiences and
successes one gains from behaviors and their outcomes. This source is the most

33
influential to one‟s perception of self-efficacy because successes authenticate whether
someone has what it takes to be successful (Bandura, 1997).
The second source of self-efficacy is vicarious experience. This source involves
enacting behavior based on the results of others‟ actions. Hence, modeling behavior is
often an effective means to gain personal self-efficacy (Bandura, 1997).
Verbal persuasion is the third source of self-efficacy. This source comes in the form
of feedback from others, positive self-talk, and desensitization techniques. When persons
are persuaded verbally they have the capabilities to succeed, they are more likely to do so
(Bandura, 1977a; Bandura, Adams, & Beyer, 1977).
The fourth source of self-efficacy is emotional arousal. Emotional arousal equates to
the level of anxiety, vulnerability, physiological arousal, or visceral agitation one
experiences when confronted with threatening situations (Bandura, 1982, 1997). Control
over emotional and physiological agitation to improve performance is a vital precept of
SCT.
Another concept fundamental to the intent of the newly designed NASC-CDM scale
and congruent with SCT is anxiety or emotional arousal; it is one of the two emotional
barriers to CDM (O'Neill et al., 2005). The NASC-CDM scale contains an anxiety
subscale related to undergraduate nursing students‟ perceptions of their level of anxiety
as they progress through the process of CDM. Nursing students must be able to realize
and curtail their level of emotional arousal before they can engage fully in the CDM
process. If nurse educators can identify where students experience high levels of anxiety
related to CDM, they can intervene best and foster this developing skill.

34
A strong inverse relationship has been evidenced between the level of anxiety arousal
and the level of self-efficacy. One study demonstrated that 48 college students with
higher levels of perceived self-efficacy and stronger abilities to cope with emotional
arousal during mathematical computational situations displayed diminished intrinsic
opioid activation (Bandura, Cioffi, Taylor, & Brouillard, 1988). Also, Ozer and Bandura
(1990) found that women who participated in a self-defense class showed less anxiety
arousal, less avoidance behaviors, and higher self-efficacy about defending themselves
against a potential assailant. Finally, one self-efficacy expert notes because high levels of
emotional arousal frequently debilitate performance, individuals usually consider
themselves more capable when they are less anxious (Bandura et al., 1977).
A result of the inability to control anxiety arousal is the avoidance of the activity
which causes the physiological and emotional arousal response. For example, “being
bitten severely by a dog can instill belief in one‟s inefficacy to control their
dangerousness and can produce… avoidance of dogs” (Bandura, 1986, p. 188). The
research study adhered to the belief if nursing students have low self-efficacy and high
anxiety arousal with the CDM process they will not engage fully in the experience.
Avoidance behaviors will occur and this lack of engagement will squelch exposure to and
practice of CDM. If one cannot practice, one cannot master (Bandura, 1977a; Clark,
Owen, & Tholcken, 2004; K. A. White, 2009). Therefore, it is important for nurse
educators to know the levels of self-confidence and anxiety undergraduate nursing
students experience while making clinical decisions in order to intervene appropriately.

35
Clinical Decision Making and Novice Clinical Reasoning Models
Not only did SCT ground this research, but a nursing framework also served to
undergird the study. Two embedded models reveal the relationship between the
emotional barriers, a lack of self-confidence and high anxiety, and the development of
CDM in novice clinicians (O'Neill et al., 2005). As such, the primary intention of the
NASC-CDM scale is based on concepts rooted within the models of O‟Neill and her
colleagues.
The impetus for the creation of the clinical decision making model (CDMM) and the
novice clinical reasoning model (NCRM) was to ground a computerized decision support
system called the Nurse Computer Decision Support (N-CODES) project. N-CODES is
“a point-of-care system that will make relevant client information available to acute care
nurses as they make decisions” (O'Neill et al., 2004b, p. 345). Knowledge within the N-
CODES system is based on IF… THEN… rules: IF the patient has pneumonia and is
restless… THEN consider hypoxia (O'Neill et al., 2006).
The N-CODES project is designed primarily to assist novice practitioners. The
project‟s aim is to create informatics as a means to manage risk and support novice
nurses while they develop clinical experiences with CDM (O'Neill et al., 2005).
However, because no theoretical framework was found at the project‟s inception that
illuminated the process of how novices learn CDM, the NCRM was conceived (E.
O‟Neill, personal communication, February 13, 2009).
Clinical Decision Making Model
Although the CDMM and the NCRM are separate graphic depictions, their concepts
are intertwined. See Appendix A for an illustration of the CDMM and the NCRM. The

36
intent of the CDMM is to illustrate the multi-dimensional CDM process of experienced
nurses. The CDMM, based on the precepts of information-processing theory, includes
pre-encounter data, risk-benefit assessment, hypothesis generation, hypothesis selection,
and nursing action (O'Neill et al., 2005). Paramount to the CDMM is the working
knowledge of the nurse. Working knowledge is the body of information, gained from
textbooks and experiences that are used in one‟s day-to-day work. An example of
working knowledge is the nurse‟s awareness if post-operative patients remain in bed they
are at risk for the development of venous thrombosis. Working knowledge “contains
memories of previous patients as well as composite pictures of commonly confronted
problems” (O'Neill et al., 2005, p. 71): It is elemental to CDM. Novice clinicians have
limited working knowledge.
Novice Clinical Reasoning Model
The NCRM, on the other hand, illustrates variables that influence the development of
working knowledge in novice clinicians. The NCRM highlights such variables as:
limited perceptions of clinical situations, cognitive and emotional barriers, resource
utilization within the clinical setting, and the importance of positive clinical experiences
(O'Neill et al., 2005). Emotional barriers that affect CDM in novice clinicians are cited
as high anxiety and a lack of self-confidence (O'Neill et al., 2004a; O'Neill et al., 2005).
The model indicates practice experiences influence levels of self-confidence and anxiety.
Although the NCRM identifies a number of influences on CDM experienced by
novice clinicians, the emotional barriers related to CDM are the component of the model
most relevant to the research study. Numerous authors support that more experiences
promote more confidence (Lindsey & Kleiner, 2005), successful outcomes enhance

37
confidence (Bandura & Jourden, 1991; Savitsky et al., 1998), and higher confidence
promotes increased performance (Schunk & Pajares, 2005; Wood & Bandura, 1989); all
of which diminish anxiety arousal. Hence, the design of not only the NASC-CDM
scale‟s items but also the scale‟s prime purpose, to measure self-confidence and anxiety
levels in undergraduate nursing students as they progress through the CDM process, are
fundamentally similar with the underlying principles of both SCT and the embedded
CDM and NCR models.
Definitions of Constructs
When designing a quantitative research instrument it is important to explicate
theoretical or conceptual definitions for the constructs under study. Additionally,
operational definitions are presented where applicable (Waltz et al., 2005). Several
constructs were used repeatedly within this research study and thus are defined to avoid
confusion about their meanings. The defined constructs appear in italics.
For the purpose of this study a definition was presented which this researcher believes
best exemplifies the conceptualization of clinical decision making in student nurses.
Standing (2007) posits CDM is “a complex process involving information processing,
critical thinking, evaluating evidence, applying knowledge, problem-solving skills,
reflection, and clinical judgment to implement the best course of action” (p. 266). This
research study maintained congruence with this definition throughout both design and
revision phases of the NASC-CDM scale.
CDM was operationally defined as the pool of items that make up the NASC-CDM
scale. Four content domains of CDM were represented in the newly developed tool: (a)

38
investigating information and cues; (b) interpreting information and meanings; (c)
integrating findings and illuminating options; and (d) intervening and reflecting on the
decision process.
For the purpose of this research study emotional barrier was defined as an affective
influence on the process of CDM in the novice clinician. The two emotional barriers
addressed in the study were self-confidence and anxiety (O'Neill et al., 2004b; O'Neill et
al., 2005).
Self-confidence was conceptually defined as “beliefs in one‟s capabilities to organize
and execute the courses of action required that produce given attainments” (Bandura,
1997, p. 3). Self-confidence was noted as one of two emotional barriers that influence
CDM processes in novice clinicians. This methodological inquiry to pilot-test and
validate the NASC-CDM scale embraced the ideals presented in a comprehensive
concept analysis of self-confidence (K. A. White, 2009). For the purpose of this research
study the terms self-confidence and self-efficacy were used synonymously. Self-
confidence was operationally defined as the scores obtained on the self-confidence
subscale of the NASC-CDM measurement tool.
Anxiety was conceptually defined for this research study using two sources. The
American Heritage Dictionary defines anxiety as “a state of uneasiness and distress about
future uncertainties… apprehension…intense fear or dread …” (Boyer et al., 1985, p.
117). Bandura (1988) cites anxiety as “a state of anticipatory apprehension over possible
deleterious happenings… an emotion of fright indexed by physiological arousal or
subjective feelings of agitation” (p. 77-78): He further argues that anxiety or emotional
arousal is a physiological as well as emotional state. Anxiety was noted as one of two

39
emotional barriers that influence CDM processes in novice clinicians. Within this
research study the terms anxiety arousal and emotional arousal were used synonymously
with the term anxiety. Anxiety was operationally defined as the scores obtained on the
anxiety subscale of the NASC-CDM measurement tool.
The term nursing program was conceptually defined for this empirical research as a
course of study in higher education that leads to either an associate‟s or bachelor‟s degree
in nursing. Graduates from such programs are eligible to take the national licensure
exam to become a registered nurse. Nursing programs invited to participate in this study
met the national standards for accreditation by either the National League for Nursing -
Accrediting Commission (NLNAC), the American Association of Colleges of Nursing –
Commission on Collegiate Nursing Education (CCNE) or both accrediting bodies.
Further, each nursing program invited to participate met all other inclusion criteria for the
study.
For the purpose of this research study the term undergraduate nursing student was
defined conceptually as an individual who was enrolled in a nationally accredited,
associate or baccalaureate nursing program and who met all other inclusion criteria for
the study. Throughout the study the term novice clinician, nursing student, or
undergraduate pre-licensure nursing student were used synonymously with undergraduate
nursing student.
Clinical nursing course was defined conceptually for this research study as one of the
final two courses within the nursing program with a clinical practicum component in real-
life patient care settings. For study purposes the clinical nursing course could be non-
integrated, whereby students provide care to patients in real-life clinical settings but the

40
course contains no didactic component. However, the clinical nursing course could also
be integrated, whereby students provide care to patients in real-life clinical settings and
the course does contain a didactic component.
Chapter Summary
Chapter two examined both early influential as well as current relevant literature
related to CDM, self-confidence, and anxiety arousal. Several historical viewpoints
related to CDM were introduced and verification was provided to demonstrate that items
on the NASC-CDM scale embrace the precepts of the information-processing and
intuitive-humanistic viewpoints. Four content domains which address steps in the
iterative process of CDM were explicated and evidence was provided to substantiate
rationale for the inclusion of items on the newly designed NASC-CDM scale. Constructs
related to but not entirely like CDM were described.
Levels of self-confidence and anxiety were the two emotional barriers measured in
the research study. Hence, literature relevant to these important constructs was cited to
authenticate their impact on the CDM process in novice clinicians. Two theoretical
frameworks used to undergird the research study were discussed. The final section of
chapter two identified terms important to the research study; terms were introduced and
defined conceptually and operationally when appropriate. The following chapter reviews
the methodological approach undertaken for this research.

41
CHAPTER 3
METHODOLOGY
The methodology chapter discusses the scientific approach undertaken for this
research. The purpose of this study was to develop, test, and establish psychometric
properties for a norm-referenced, self-report quantitative research instrument entitled the
Nursing Anxiety and Self-Confidence with Clinical Decision Making (NASC-CDM)
scale.
Six sections comprise the methodology chapter. Section one addresses research
questions. The second section examines psychometric theory and discusses key terms
such as validity and reliability. Section three summarizes the process of instrument
development. Section four describes the sampling framework for the study. The fifth
section explains data collection methods for the study, including recruitment of
participants and procedural steps. Finally, section six illustrates techniques for data
analysis.
Research Questions
The goal of instrument development is to create a collection of items which can be
combined into a composite score; its intent is to reveal various levels of an attribute or
construct which are not directly observable (DeVellis, 2003). Subsequent to item
construction, psychometric properties such as validity and reliability are established. As
a means to this end, several research questions were posed.

42
1. Do the self-confidence and anxiety subscales of the NASC-CDM scale
provide a valid measure of undergraduate nursing students‟ perceptions of self-
confidence and anxiety levels during the process of CDM?
2. Do the self-confidence and anxiety subscales of the NASC-CDM scale relate
satisfactorily with two established reliable and valid quantitative instruments
measuring generalized self-efficacy and generalized anxiety?
3. Do the self-confidence and anxiety subscales of the NASC-CDM scale
provide a reliable measure of undergraduate nursing students‟ perceptions of self-
confidence and anxiety levels during the process of CDM?
Psychometric Theory
Psychometrics refers to the qualities of an instrument that measures variations of a
construct within the context in which the instrument was designed (Switzer et al., 1999).
Psychometric theory is the foundation which undergirds instrument development (Rust &
Golombok, 2009; Waltz et al., 2005). Two concepts essential to psychometric theory are
reliability and validity. Reliability refers to the consistency of the instrument. It is the
amount of variance in scores on a tool which can be accounted for by the true score of the
attribute being measured and not by error (DeVellis, 2003). Validity refers to the extent
to which a research instrument measures the attribute it is intended to measure and not
some other attribute (Waltz et al., 2005).
In order to establish psychometric properties for the NASC-CDM scale, the tool was
subjected to testing using two samples of pre-licensure undergraduate nursing students.

43
Both reliability and validity aspects of psychometric theory were assessed (DeVellis,
2003; Waltz et al., 2005).
The first research question addressed the newly developed scale‟s validity. Several
forms of validity were assessed, namely content validity (Davis, 1992; Polit et al., 2007)
and construct validity (DeVon et al., 2007; Polit & Beck, 2008). To ensure the NASC-
CDM scale was content valid it was subjected to critical review by a panel of expert
judges in the area of CDM. Content validity was also established through comprehensive
literature review of both theoretical and research works in the area of CDM. An inclusive
review of literature which authenticated the relationships of self-confidence and anxiety
with CDM further demonstrated the content validity of the NASC-CDM scale. Item
analysis and exploratory factor analytic techniques were employed to begin the
accruement of construct validity (DeVon et al., 2007; Waltz et al., 2005) of the NASC-
CDM scale.
Research question number two considered the convergent validity of the NASC-CDM
scale. A means of examining convergent validity was to correlate scores on the newly
developed NASC-CDM scale with scores on existing, psychometrically sound
instruments (Waltz et al., 2005). The newly designed scale includes a self-confidence
subscale and an anxiety subscale. Respondents‟ scores from each of these subscales were
compared with respondents‟ scores on a generalized self-efficacy scale and generalized
anxiety scale respectively.
The third research question related to the reliability of the NASC-CDM scale. A
reliable instrument is one that is repeatable and consistent (DeVellis, 2003; Waltz et al.,
2005). Reliability was assessed using Cronbach‟s alpha for internal consistency

44
(Cronbach, 1951). The examination of psychometric properties for the NASC-CDM
scale is discussed more fully within the data analysis section of this chapter.
Instrument Development
The NASC-CDM scale is considered a hybrid or mixed scale. Cognitive scales
examine subjects‟ achievement of knowledge or process while affective measures
examine subjects‟ interests, values, and attitudes (Waltz et al., 2005). The NASC-CDM
scale examines the cognitive process of making a clinical decision, but its ultimate
purpose is to appraise the affective domain (Gable & Wolf, 1993; Polit & Beck, 2008) of
the self-confidence and anxiety levels experienced by undergraduate nursing students as
they proceed through the CDM process.
DeVellis (2003) argues scale development specificity must be congruent with the
broadness or narrowness of the tool‟s focus, its content, setting, and population. The
NASC-CDM is intended for use primarily with undergraduate nursing students; is
designed to measure two affective emotional barriers, self-confidence and anxiety; and is
intended for use within the clinical practicum environment. Because of the specific
population, focus, and setting of the proposed instrument, the scale is considered
narrowly defined.
Confirmation of a level of measurement is important for research instruments. The
NASC-CDM scale is by design an ordinal-level scale. Ordinal-level scales rank-order
the relative amount of the attributes being measured (Waltz et al., 2005), in this case the
perceived amounts of self-confidence and anxiety experienced by nursing students while
performing CDM. Summated composite scores are calculated for both subscales of the

45
tool. Scores obtained in summed fashion yield raw scores, a form of continuous data.
Interval-level data are continuous in nature (Gall et al., 2007; Polit & Beck, 2008).
Hence, the NASC-CDM was considered interval-level for the purposes of data analysis.
Initial Item Pool and Response Format
The initial pool of 82 items was generated using a domain-referenced approach
(Gable & Wolf, 1993). This pool was sufficient to allow for an approximate 50%
reduction of items (DeVellis, 2003; DeVon et al., 2007) resulting from expert feedback
and pilot-testing. A priori consideration of content areas, scale objectives, and numbers
of items within each is paramount during early instrument development (Gable & Wolf,
1993; Waltz et al., 2005). See Appendix B for the initial NASC-CDM scale blueprint.
See Appendix C for initial draft of items by content domain.
In the initial draft of the scale the statement, I am ____ self-confident and ____
anxious in my ability to…. was written at the start of the survey with the declarative
portion of each statement concluding this sentence. For instance, an item read I am
_____ self-confident and I am _____ anxious in my ability to….correlate physical
assessment findings with what the client tells me. A neutral 5-point, Likert-type (Likert,
1932) scale with 1 = not at all, 2 = somewhat, 3 = equally and not equally, 4 = mostly,
and 5 = totally was chosen for the first draft of the NASC-CDM scale. DeVellis (2003)
discusses numerous discrete responses (using a scale from 1 to 100) and simple binary
selections (Yes or No) as being potentially problematic. He further writes the number of
response options must be congruent with the overarching objective of the scale. The
utilization of five anchors would allow respondents to meaningfully discriminate among
the offered choices but not confuse respondents with too many options.

46
During the initial phase of instrument development the purposeful decision to adopt
an odd response option format was made (Francis & Busch, 1975; Mercer & Durham,
2001). Because the undergraduate nursing student, as a novice clinical decision maker,
may actually feel equally confident and not confident or equally anxious and not anxious
with a step of the CDM process, a neutral response option was used. This neutral
response option was worded in a positive as opposed to negative manner (DeVellis, 2003;
Gable & Wolf, 1993). For instance, the third anchor could have read, neither fully
confident nor unconfident as opposed to equally confident and not confident.
Numerous components such as item length, reading level, redundancy, positive or
negative wording, and grammar (Comrey, 1988; DeVellis, 2003; DeVon et al., 2007;
Gable & Wolf, 1993) were considered when writing items for inclusion in the first draft
of the NASC-CDM scale. To enhance reliability and validity, instrument developers
must ensure all items that make up the tool are congruent with the construct under study
(DeVellis, 2003); in this case CDM. All drafts of the NASC-CDM scale used
declarative, closed-ended statements that align with the steps in the cognitive process of
CDM. The language used is familiar to undergraduate nursing students.
Internationally Known Expert Panel
After the phenomenon under study is operationally defined, an item blueprint is
developed and items are constructed, the judgment quantification phase (Grant & Davis,
1997) of scale development must begin. The judgment quantification component of scale
development occurs when expert panelists evaluate items on the scale and the scale in its
entirety (Grant & Davis, 1997). Several criteria are necessary to assess when choosing an
expert reviewer. Davis (1992) posits experts should have expertise with the target

47
population, presented professionally on the topic of interested, published papers within
peer-reviewed journals, or conducted research on the topic area. The intent of the newly
developed scale is to measure perceptions of the levels of two affective barriers
experienced during the process of CDM in undergraduate nursing students as it relates to
patient care in the clinical practicum environment. For this reason, content experts in the
field of clinical decision making with undergraduate student nurses were invited to
critique the NASC-CDM scale.
Rationale for Expert Reviewers
Five internationally known content experts were invited and agreed to evaluate the
82-item first draft of the NASC-CDM scale in spring 2009 for relevancy, clarity, and
comprehensiveness (Davis, 1992; DeVellis, 2003; Grant & Davis, 1997). The number of
content experts is consistent with recommendations by Gable and Wolf (1993). Content
experts were chosen because of their expertise in the area of CDM, scale development, or
both. See Appendix D for a sample of the invitation sent to the expert reviewers via
electronic mail (email). Expert # 1 did not return the packet, Expert # 5 completed
feedback on only one half of the 82 items. Further, Expert # 5 seemingly misinterpreted
the primary intent of the instrument as generic, citing comments that the scale developer
should assign a specific clinical situation upon which the students would base their
responses. After serious consideration, feedback from Expert # 5 was not included in
further tallies. Item-content validity and scale-content validity was calculated (Beck &
Gable, 2001; Waltz et al., 2005) based on feedback from three of five expert judges.
Brief biographical summaries for the three expert panelists who completed
comprehensive feedback provide justification for their selection.

48
Expert # 2 is a doctorally prepared registered nurse from the southwest portion of the
United States. This expert was sought as a valuable source of feedback not only because
she has completed research in the area of CDM, but also because she has expertise with
instrument development related to CDM. Of primary interest to this expert is the use of
intuition within CDM and self-reflection as part of the process of learning CDM. The
quantitative instrument developed by this expert is a unidimensional questionnaire which
measures the acknowledgement of the use of intuition in CDM by nurses. This expert
has more than 25 years in undergraduate and graduate nursing education. She also
maintains a quality funded research program, conducting qualitative and quantitative
studies in the domains of decision making, intuition, decision making in underserved
populations, and health behaviors of underserved youth.
Expert # 3 is a doctorally prepared registered nurse from southwest Finland. Like
expert number two, expert number three was sought as a valuable panelist not only
because she has completed research in the area of CDM, but also because of her expertise
with instrument development related to CDM. She co-designed a quantitative self-report
instrument which assesses the CDM model used by nurses. This research instrument
determines the model of CDM (information-processing or intuitive-humanistic) used by
nurses in various clinical settings, in various countries, and at various levels of
experience. She has completed numerous qualitative and quantitative studies. Her
doctoral work was completed in the domain of CDM. In addition to her many years
teaching undergraduate and graduate nursing students, this expert has authored or co-
authored more than 60 peer-reviewed articles and textbook chapters, many in the area of
CDM, and has presented internationally in the content-area of CDM.

49
Expert # 4 is a doctorally prepared registered nurse from the northwest portion of the
United States. Over the past 25 years, this expert has worked as an undergraduate nurse
educator and established a credible career as a nurse researcher and author in the area of
clinical judgment and clinical reasoning. This expert currently teaches masters, post-
master and doctoral students. Additionally, she has advised many students pursuing
research interests related to clinical judgment, clinical education, and simulation. She has
completed numerous funded studies using qualitative and quantitative modes of inquiry
related to intuition, knowing the patient, and reflection and its relationship to the process
of clinical judgment. Finally, this expert serves as editor for a national peer-reviewed
journal. Expert # 4 was invited to serve as a panelist because of her expertise not only in
the area of CDM, but also because of her internationally renowned work in the area of
intuition, clinical judgment with level of experience, and skill acquisition of novice as
well as experienced nurses.
Packet for Expert Reviewers
Numerous authors describe elements which should be provided to and asked of an
expert reviewer (Davis, 1992; DeVellis, 2003; Grant & Davis, 1997). Components
contained within the packet given to the experts who reviewed the NACS-CDM scale
were consistent with these recommendations. A reviewer packet was sent to each expert
panelist electronically (their preferred means) after receipt of their willingness to serve
was affirmed. The packet included: a cover letter that introduced the researcher of the
study, explained the purpose of the NASC-CDM scale, and thanked the individual for
agreeing to serve as an expert instrument reviewer; a definition of the construct under
study; a summary and definitions of scale content domains around which the tool was

50
designed; and the expert reviewer rating form with rating instructions. See Appendix E
for the expert reviewer rating packet.
Feedback from Expert Reviewers
Each expert completed the rating form independently. They were given one month to
complete the instrument review form and return it to the researcher electronically.
Content experts unanimously agreed that 38 of the 82 items were moderately relevant or
highly relevant to the CDM construct. Beck and Gable (2001) cite that content validity
indices should be assessed on those items achieving a moderately relevant or highly
relevant rating. Additionally, the researcher retained 12 items because of their strong
theoretical relevance to the scale.
Content experts placed items within the correct content domain with 63% accuracy.
Expert # 2 mentioned placing items within a content domain was difficult. She further
commented that some items did not seem mutually exclusive to a domain. She suggested
as instrument development progresses, a small sample similar to the intended population
should evaluate the tool for content, readability, and item clarity.
Comments provided by the content experts were beneficial to the process of item
revision and reduction. With regard to comprehensiveness of the NASC-CDM scale, one
expert noted the NASC-CDM scale to be very comprehensive, one cited the scale to be
moderately comprehensive, and one cited the scale to be slightly comprehensive. Expert
# 3, from Finland, commented that her evaluation of items was influenced by the
language barrier and cited that each item required several reads before relevancy rating or
placement into content domain could commence. In retrospect, the use of an expert
panelist with English as a second language may have been prohibitory to this phase of the

51
scale review process. Two experts suggested that the final scale be comprised of fewer
items because an 82-item scale may be tedious for students to complete.
Each of the three experts provided feedback which might facilitate clarity of items.
Two experts noted the scale to be moderately clear, and one noted the scale to be slightly
clear. Both experts who rated the scale as moderately clear scale commented that items
were written at a high level; this may be detrimental to easy student completion. Expert #
3 commented that items were difficult to read because they were not written as full-
sentences. The beginning of the sentence, I am ___ confident and ___ anxious with my
ability to…was noted only at the start of the tool with each item being written as the
completion of that sentence. This researcher acknowledged the initial sentence structure
as an intrinsic design flaw. Revisions to item sentence structure were made in subsequent
drafts of the scale. All content experts cited feedback about the revision or elimination of
specific items to enhance the scale‟s clarity. Item revision and reduction was made
accordingly.
The panelists were asked to respond to one final statement. Experts were asked their
opinion about the use of a 4-point forced-choice, Likert-type scale versus a 5-point
neutral-option, Likert-type scale. Two of the three experts suggested using a forced-
choice response format. Rationale for the selection of a 4-point format included the
decrease in ambivalent responses, hence gathering more accurate data. Expert # 2
suggested the option of using a 6-point forced-choice format in lieu of the more limited
4-point scale to gain a fuller picture of students‟ self-confidence and anxiety level while
they engage in the process of CDM. Expert # 3 recommended using a neutral-option

52
format, arguing that the use of a 5-point scale allows respondents to have no opinion.
This expert panelist cited a 4-point scale may result in a higher amount of missing data.
Content validity is a valuable and necessary preliminary step in evaluating any newly
developed research instrument. It is most often achieved through the use of content
experts who quantify the content of multi-item scales (Polit et al., 2007). The scale-
content validity index (S-CVI) is determined by assessing the proportion of expert
reviewers who score items as a three or four on the relevancy scale, where 1 = not at all
relevant and 4 = highly relevant, to the total number of items on the scale (Grant &
Davis, 1997). The item-content validity index (I-CVI) is determined by assessing the
proportion of relevance of each item to the number of expert reviewers (Waltz et al.,
2005). Davis (1992) advocates new instruments should attempt to achieve .80 for I-CVI.
Others argue for a scale to have exceptional content validity it should have an I-CVI of
.78 or higher and an S-CVI of .90 or higher (Polit et al., 2007). Items on the NASC-
CDM scale were retained that achieved unanimous agreement among the three expert
reviewers. See Appendix F for content validity indices from expert reviewers from the
initial draft of items. The second draft of the scale consisted of 50 items.
Registered Nurse and Undergraduate Student Panel
In addition to a panel of internationally known content experts within the area of
CDM, another panel of experts was sought. One content expert cited the importance of
critique of the scale by a population similar to that which will complete the scale. For
this reason, and also to reduce the risk of differential item functioning (Kaplan &
Saccuzzo, 2005; Rust & Golombok, 2009) items from the second draft were reviewed by
seven registered nurses with Filipino as their primary language. Eight undergraduate

53
nursing students, three with English as their second language, also evaluated items for
readability and clarity. Although the NACS-CDM scale is not specifically designed for
international use, the researcher considered it important that nurse clinicians, nursing
students, and those whose first language is not English could easily understand items.
Review by this group of panelists ensured the scale‟s face validity. Items were again
revised or reduced based on their feedback (Rust & Golombok, 2009). The researcher
subsequently scrutinized all items a final time for redundancy, readability, and clarity.
Pilot Item Pool and Response Format
The draft of the NASC-CDM scale that was pilot tested contained 41 items. See
Appendix G for the pilot version of the scale by content domain. Each item within the
survey begins with the stem of the sentence. The stem of the item reads; I am ____ self-
confident and ____ anxious in my ability to… The declarative portion of each item
concludes the sentence. This sentence structure was a dramatic modification from the
initial draft and enhanced clarity and readability. A 6-point, forced choice, Likert-type
response format is used (Likert, 1932). The anchors read: 1 = not at all, 2 = just a little, 3
= somewhat, 4 = mostly, 5 = almost totally, and 6 = totally.
There are practical and empirical considerations when determining response format.
Gable and Wolf (1993) argue practical reasons for limiting response options because the
higher the number of anchors from which to chose, the higher the level of thinking
required when completing the scale. The 6-point likelihood format was chosen for the
NASC-CDM scale because it allows respondents to discriminate adequately their
perception of self-confidence and anxiety without confusing them with too fine a
discrimination level (DeVellis, 2003; Gable & Wolf, 1993). A 6-point Likert-type scale

54
gathers a fuller view of student perception and gathers fuller data than a 4-point response
option because of the broader array of anchor points. Two empirical reasons exist for the
use of a 6-point scale. Gable and Wolf (1993) cite 5- and 6-point scales are more reliable
and Comrey (1988) posits 6- and 7-point scales provide more stable factor solutions.
The forced-choice format was chosen to avoid ambiguity and neutrality in an attempt
to gather more discriminate data (Coombs & Coombs, 1976; Cronbach, 1946). Gathering
fuller data and reducing ambiguous items is beneficial during scale development;
stronger items improve the tool‟s reliability and interpretability (Coombs & Coombs,
1976). Forced-choice is a useful response format if respondents are apathetic toward the
topic under study because it promotes higher-level thinking and eliminates the ability for
a noncommittal response (Coombs & Coombs, 1976). Forced-choice is also useful if
respondents are female, as females tend to demonstrate more neutrality during survey
completion than males (Francis & Busch, 1975). Some authors cite the use of a forced-
choice response option may result in more missing data as respondents may skip an item
if they can not commit to one of the anchors (Rust & Golombok, 2009). Conversely,
results of one empirical inquiry noted no increase in missing data when comparing two
versions of a tool, one with neutral-option and one with forced-choice (Mercer &
Durham, 2001).
Although there is a reciprocal relationship between self-confidence and anxiety with
regard to CDM, both subscales use the same six anchor points and flow in the same
direction. Utilizing the same anchors and the same direction for both subscales allows
respondents to rate the amount of the attribute they possess with more ease and less

55
deliberation. For instance, if a respondent possesses higher self-confidence and higher
anxiety on an item, a higher anchor point is chosen for each.
The NASC-CDM scale responses are considered subjective, supply-type items. Waltz
et al. (2005) explicate that such items are warranted for norm-referenced scales in which
respondents supply a number, symbol, or statement best representing the amount of a
specified attribute they possess. Items are short and concisely written. For this reason,
the researcher believes respondent fatigue, because of difficulty level and scale length
(DeVellis, 2003; Waltz et al., 2005), will not significantly impact survey completion.
Early versions of the NASC-CDM scale had two subscales within four content-domains.
Therefore, administrators of the tool had the ability to obtain a composite score for each
subscale, self-confidence and anxiety, per respondent that relates to a domain of CDM.
Sampling Framework
Two phases of testing were completed to establish psychometric properties of the
NASC-CDM scale. Pilot-testing with a sample of undergraduate pre-licensure nursing
students was completed to preliminarily assess the reliability and validity of the tool
(DeVon et al., 2007; Waltz et al., 2005). The scale was revised and items reduced based
on data analysis from this sample. Main-testing of the revised tool was completed by a
second sample, drawn from the same population, for assessment of reliability and validity
of the revised tool.
A convenience sampling framework (Gall et al., 2007; Polit & Beck, 2008) was used
for both pilot- and main-testing phases of the study. Convenience sampling is a
nonprobability or nonrandom technique. Although nonprobability sampling is commonly

56
used for methodological research, it is recognized that caution must be taken “in
generalizing results from the sample to the target population” (Huck, 2004, p. 109).
The target population includes associate and baccalaureate nursing students in the
United States. The accessible population includes the nursing programs and nursing
students that meet inclusion criteria within four states in the northeast portion of the
United States. Generalizability and thus external validity of the study may be enhanced
because sampling occurred in rural, suburban, and urban areas and included associate and
baccalaureate nursing programs (Gall et al., 2007). Demographic data were gathered
from all study participants to assess the representativeness of the sample in relation to the
target population (Polit & Beck, 2008), determine an exclusion criterion, and examine
information related to the intent of the NASC-CDM scale.
Inclusion criteria encompassed requirements for not only the nursing programs but
also the pre-licensure undergraduate nursing students selected to receive an invitation to
participate in the research study. Inclusion criteria required that: (a) nursing programs
were a nationally accredited associate degree or baccalaureate degree program, (b)
nursing programs were located within the confined area of a 150 mile radius of a city
located in the northeast area of the United States, (c) nursing programs maintained an
annual graduation rate of greater than or equal to 30 students, (d) nursing students were in
one of their final two clinical nursing semesters of the program, (e) nursing students were
at least 18 years of age, and (f) nursing students agreed to participate. It was anticipated
that an undergraduate nursing student who is also a licensed practical nurse (LPN) has
experience with CDM and therefore may have fundamentally different levels of self-
confidence and anxiety than a student who is not an LPN (Faulk, Parker, Lazenby, &

57
Morris, 2008; Qadri, Wang, Ruiz, & Roos, 2009). For this reason, LPNs were excluded
from the study.
Rationale for nursing program and nursing student inclusion criteria are provided.
First, the inclusion of nationally accredited nursing programs ensured participants
attended a school of nursing which adheres to common standards for nursing education
programs. Programs were selected from lists generated by the National League for
Nursing - Accrediting Commission (NLNAC) and the American Association of Colleges
of Nursing (AACN) websites of nationally accredited associate and baccalaureate degree
nursing programs within the specified area.
Second, the inclusion criterion that nursing programs be located within 150 mile
radius of a city within the northeast United States allowed the researcher to visit
numerous programs and potentially improve response rate. Eligible programs were
located within the states of Delaware, Maryland, New Jersey, and Pennsylvania.
The final nursing program inclusion criterion related to program size. To maximize
the potential number of participants, only programs within the confined area with annual
graduation rates of greater than or equal to 30 students were invited to participate.
Rationale for the use of three inclusion criteria related to nursing students included:
First, sampling students in one of their final two clinical nursing semesters ensured lesser
variability in scores and enhanced the stability of factor solutions during data analysis
(Tabachnick & Fidell, 2007). Second, confirming student participants were at least 18
years of age eliminated the need for parental consent. Third, voluntary participation in
the study facilitated protection of the rights of student participants. Eligible students
from each of the eligible programs were invited to participate in either the pilot- or main-

58
testing phases after permission was secured from the nursing program and the
Institutional Review Board (IRB).
A total of 27 associate and 27 baccalaureate degree nursing programs met inclusion
criteria. The Table 1 depicts eligible nursing programs included in either pilot- or main-
testing phases of the study.
Table 1. Eligible Associate and Baccalaureate Nursing Programs
State
Type of Degree
Number of
Eligible Programs
Approximate Number of
Eligible Students
Delaware Associate 3 584
Delaware Baccalaureate 2 406
Maryland Associate 9 1,444
Maryland Baccalaureate 5 1,564
New Jersey Associate 3 550
New Jersey Baccalaureate 2 242
Pennsylvania Associate 12 3,144
Pennsylvania Baccalaureate 18 4,396
Total 54 12,330
Eligible student numbers were calculated using annual graduation rate per program,
times ten percent for estimated program growth, times recruitment of two classes within
each program. Thus, the accessible population of participants for the study was
approximately 12,300 students. In accordance with scale development and factor
analytic experts, attempts were made to obtain six to ten participants per item for both
pilot- and main-testing phases (DeVellis, 2003; Gable & Wolf, 1993). A sample size of
at least 300 nursing students was anticipated for both testing phases.

59
Data Collection Methods
Electronic Survey Format
The Survey Monkey (https://www.surveymonkey.com) survey platform was used to
provide an online version of the NASC-CDM scale and the full survey package for both
pilot- and main-testing phases. Data collection in an online format has several
advantages, namely confirmed anonymity which may lead to less social response bias,
convenience for the participant, and the ability to sample a broader geographical area.
There are limitations however, such as the inability to follow-up with respondents with
missing data, collaboration among respondents who complete the survey at the same
place and time, the possibility of computer malfunction (Cantrell & Lupinacci, 2007).
Another limitation to an online survey format is lower response rates for online surveys
versus mailed surveys. Online survey response rates differ widely. One study in a
nonprofit organization invited 1,696 subjects and yielded a response rate of 16.5%
(Wright & Schwager, 2008) while another study within a university setting invited 5,430
undergraduate students and achieved a response rate of 34.5% (Crawford, Couper, &
Lamias, 2001).
The full survey package in the pilot phase contained 78 items and seven parts. Part
one contained informed consent. Part two explained background information about the
study, the parts of the survey package, directions, completion timeframe, and completion
deadline. Part three contained demographic questions. See Appendix H for demographic
questions. Part four included the NASC-CDM scale. Part five contained a general self-
efficacy scale. Part six included a general anxiety scale. The survey package used during
pilot-testing included six additional items related to the NASC-CDM scale. These items

60
requested respondents‟ feedback about the clarity of directions, clarity of item meaning,
readability of items, overall survey length, ease of completion, and invited respondents to
provide general comments about the NASC-CDM scale.
Instrumentation
Nursing Anxiety and Self-Confidence with Clinical Decision Making Scale
A comprehensive discussion of the NASC-CDM scale‟s development ensued in a
previous section of this chapter. The first item on the NASC-CDM scale was chosen
deliberately. Rust and Golombok (2009) advise the first item of the tool should be “an
interesting and unthreatening item” (p. 221). Thereafter, placement of the remaining 40
items on the NASC-CDM scale were randomly selected (by pulling from a hat) to avoid
the risk of inflated reliability coefficients and decrease proximity effect (Gable & Wolf,
1993).
In addition to the completion of the newly designed NASC-CDM scale, respondents
completed two existing psychometrically sound scales. The General Perceived Self-
Efficacy (GSE) scale and the Generalized Anxiety Disorder-7 (GAD-7) scale were
completed by all student participants. This strategy began the assessment of convergent
validity (DeVon et al., 2007; Gall et al., 2007).
General Perceived Self-Efficacy Scale
Although self-efficacy is generally considered to be domain-specific, some
researchers have conceptualized that generalized self-efficacy does exist (Imam, 2007;
Luszczynska, Gutiérrez-Doña, & Schwarzer, 2005; Schwarzer, Mueller, & Greenglass,
1999). General self-efficacy is deemed an overall usual sense of confidence in coping
ability across an array of life situations (Scholz, Gutiérrez-Doña, Sud, & Schwarzer,

61
2002). The GSE scale was developed in Germany over a period of 20 years and has
strong psychometric properties established from an original sample of 3,816 students and
teachers. The GSE scale has been translated into 28 languages and has been used in
nearly 1,000 empirical studies (Luszczynska, Scholz, & Schwarzer, 2005).
An advantage of the GSE scale lies with its brevity; it is a unidimensional 10-item, 4-
point Likert-type scale. Principal component analysis using Kaiser‟s eigenvalue criterion
and scree plot evaluation, computed separately on 25 subsamples confirmed the single-
factor solution of the GSE scale (Scholz et al., 2002). See Appendix I for the GSE scale
and permission. Scores are obtained in summative fashion and range from 10 to 40
points where lower scores indicate less self-efficacy and higher scores indicate more self-
efficacy. The arithmetic mean can be calculated. There is no cut-off score. Norms for
the GSE scale are available and were derived from a sample of 1,595 adults in the United
States (Schwarzer, 2009). The GSE scale is public domain and no cost was incurred for
its use.
Psychometric testing of the GSE scale with different samples has produced
consistently acceptable reliability and validity assessments. A multicultural validation of
the instrument revealed alpha coefficients ranging from .86 to .94 in a sample from
Germany, Poland, and South Korea (Luszczynska, Scholz, et al., 2005). Psychometric
properties of an online version of the GSE scale were compared with previously achieved
psychometrics from a traditional paper-pencil version of the GSE scale using a sample of
internet users ages 15 to 50 years (n = 1,314), German teachers (n = 274), German high
school students (n = 3,077), and Canadian university students (n = 290). Internal
consistency ranged from α = .78 in the high school sample to α = .89 in the university

62
student sample (Schwarzer et al., 1999). A sample of 19,120 subjects examined the
global nature of self-efficacy across 25 countries; a Cronbach‟s alpha of .87 was obtained
from the sample of the 1,594 United States subjects. Test-retest reliability after one year
yielded significant coefficients (r = .75) and after two years in German females (r = .63)
(Scholz et al., 2002).
Convergent and divergent validity have been demonstrated through comparisons with
similar (optimism) and dissimilar (anxiety) constructs. In a Costa Rican sample of 393
people, GSE correlated with anxiety for women (r = -.43) and anxiety for men (r = -.42).
Further, correlations between GSE and other personality traits were highly significant in
a sample of 180 university students: extraversion (r = .64), decision or action orientation
(r =.49), hope for success (r = .46), neuroticism (r = -.42), and fear of failure (r = -.45)
(Schwarzer, 2009). Another study assessed the relationship among scores on the GSE
scale with scores on items from numerous quantitative measures related to personality,
affect, and life appraisal. The relationships between GSE scores and self-esteem,
optimism, self-regulation, and quality of life were significant and positive. The
relationships between GSE scores and anxiety and depression were significant and
negative (Luszczynska, Gutiérrez-Doña, et al., 2005).
Rationale exists for comparing undergraduate nursing students‟ scores on the NASC-
CDM scale with scores on the GSE scale to begin the establishment of convergent
validity. The NASC-CDM scale is domain-specific in that its intent is to affirm the levels
of two emotional barriers within a certain context; while making clinical decisions. A
study which examined the relationship between general self-efficacy and domain-specific
self-efficacy (i.e. physical activity self-efficacy), revealed that across all three culturally

63
diverse samples general self-efficacy beliefs were significantly positively related to
domain-specific self-efficacy beliefs (Luszczynska, Scholz, et al., 2005).
Numerous empirical studies using the GSE scale within a wide variety of contexts
continue to amass psychometric value of this brief self-report tool. For example, the
measurement of GSE and its connection with coping was examined in two healthcare
studies: one related to coping and social support after cancer surgery (Luszczynska,
Mohamed, & Schwarzer, 2005) while the other related to GSE as a predictor of four
sources of coping after tumor removal surgery (Schwarzer, Boehmer, Luszczynska,
Mohamed, & Knoll, 2005). Other studies used the GSE scale to examine students and
teachers. Student populations were studied within the context of the perceived levels of
stress, levels of GSE, and psychological well-being among male high school students
(Moeini et al., 2008) and within the context of interpersonal attribution and GSE among
female nursing students (Zhang, Yuan, Zhang, & Lu, 2009). Teachers were studied
within the context of measuring perceived GSE as a predictor of job stress and burnout
(Schwarzer & Hallum, 2008). One final example of the use of the GSE scale is cited. A
recent study measured the relationship between GSE and the prevalence and severity of
posttraumatic stress disorder in persons impacted by hurricane Katrina (Hirschel &
Schulenberg, 2009).
Generalized Anxiety Disorder-7 Scale
Generalized anxiety disorders (GAD) rival only depression as the most common
mental health disorder influencing the lives of its victims. GAD effects can be seen in
the loss of individual functioning, decreased work productivity, and enormous health care
costs (Kroenke, Spitzer, Williams, Monahan, & Löwe, 2007; Titov et al., 2009). The

64
GAD-7 scale was developed as part of a family of self-report surveys entitled the Patient
Health Questionnaire (PHQ). Scales within the PHQ include two depression indices (one
shorter and one longer), the GAD-7 scale, a 2-item version of the GAD-7 scale, and a
scale to measure somatic symptom severity. Each of the scales that make up the PHQ
may be used separately or in combination (Kroenke et al., 2007).
Development of the PHQ and the scales contained within it began in 1999 with an
American and German team of instrument developers. The GAD-7 scale has solid
psychometric properties established from an original sample of 2,740 patients from
primary care clinics in the United States and was designed to reflect the symptom criteria
for GAD within the Diagnostic and Statistical Manual of Mental Disorders, Fourth
Edition (Spitzer, Kroenke, Williams, & Lowe, 2006). A recent report confirmed the
GAD-7 scale has been translated successfully into Spanish and has been tested successful
within a Spanish speaking population (García-Campayo et al., 2009).
An advantage of the GAD-7 scale lies with its brevity; it is a unidimensional 7-item,
4-point Likert-type scale intended to screen patients for symptoms of GAD (Löwe et al.,
2008; Spitzer, Kroenke, Williams, & Swinson, 2006). See Appendix J for the GAD-7
scale and permissions. Scores are obtained in summative fashion and range from 0 to 21
points. The GAD-7 scale is a tool for assessing symptoms related to four major anxiety
disorders; GAD, panic, social anxiety, and posttraumatic stress disorder. Operating
characteristics of the GAD-7 scale determined cut-points scores; “scores of 5, 10, and 15
represent mild, moderate, and severe anxiety symptoms”, respectively (Kroenke et al.,
2007, p. 318). The GAD-7 scale is public domain and no cost was incurred for its use.

65
Although a relatively new instrument, psychometric testing of the GAD-7 scale has
provided consistently acceptable reliability and validity assessments. Data from 5,036
Germans from the general population yielded an alpha coefficient of .89 (Löwe et al.,
2008). While Cronbach‟s alpha for internal consistency reliability was cited in one study,
results that presented different types of validity assessments and confirmed operating
characteristics related to the GAD-7 were cited more frequently.
Convergent and divergent validity was demonstrated through comparisons with eight
well-established anxiety and depression measures in a study conducted in the United
States (Spitzer, Kroenke, Williams, & Lowe, 2006) and through comparisons with four
well-established anxiety and depression measures in a study conducted in Germany
(Löwe et al., 2008). Results from both inquiries provided continued confirmation of the
validity of the GAD-7 scale. A study to establish psychometric properties and assess
construct validity of the GAD-7 scale examined 5,036 subjects in the general population
in Germany. Multi-group confirmatory factor analysis was used to test the
unidemensionality of the GAD-7 scale. Results indicated factor solutions for the 7-item
scale as unifactorial; goodness-of-fit index, Χ2 = 314.1, df = 14, p < .001; factor loadings
ranged from .76 to .90 (Löwe et al., 2008, p. 268). Blinded interviews with mental health
practitioners to ascertain a GAD diagnosis were correlated with scores on the GAD-7
scale, thus substantiating evidence of criterion-referenced validity (Kroenke et al., 2007).
Operating characteristics of the GAD-7 scale provide evidence the instrument is
highly effective in screening for GAD. Sensitivity, specificity, and likelihood ratios are
commonly used to describe operating characteristics of quantitative measures used for
screening purposes (Polit & Beck, 2008). Sensitivity of a screening tool describes its

66
ability to diagnose the condition correctly, whereas specificity describes its ability to
screen-out correctly those without the condition. Likelihood ratios summarize the
relationship between sensitivity and specificity; they reveal how much more likely it is
that scores on the scale will be positive in those with the condition than in those without
the condition (Polit & Beck, 2008).
One study that examined psychometrics of the GAD-7 scale revealed a sensitivity and
specificity of .92 and .76 (95% confidence interval [CI]) respectively and a likelihood
ratio of +3.8 (95% CI) was reached at a cut-point of > 8 for GAD. The same study
revealed a sensitivity and specificity of .89 and .82 (95% CI) respectively and a
likelihood ratio of +5.1 (95% CI) was reached at a cut-point of > 10 for GAD (Kroenke et
al., 2007). An interpretation of these findings indicates those people with a score of > 10
were diagnosed with GAD correctly 89% of the time. Further, the odds that a person has
GAD is 5.1 times more likely if his or her score is > 10. Haligren and Morton (2007)
compared the operating characteristics of three brief anxiety measures commonly used
within healthcare settings and found the GAD-7 had the best operating characteristics and
most usefulness for GAD in primary care settings.
An empirical study to validate and standardize the GAD-7 scale was conducted with a
non-American sample. However, generalizability to United States populations is argued.
Developers of the GAD-7 scale cited demographic characteristics of the German study
sample mirrored the characteristics of both the German and United States general
population (Löwe et al., 2008). Therefore, it is appropriate to use the GAD-7 scale with
United States samples.

67
Rationale exists for comparing undergraduate nursing students‟ score on the NASC-
CDM scale with scores on the GAD-7 scale to assess convergent validity. Empirical
inquiry is widespread in the arena of anxiety because disorders in this area are extremely
common (Kroenke et al., 2007). Further, Skapinakis (2007) argues anxiety disorders are
not only widespread but are also generally chronic in nature. In light of this information,
it was anticipated that for this research, student nurses who exhibit higher anxiety arousal
during the process of CDM will also exhibit higher scores on the GAD-7 scale.
Studies using the GAD-7 scale within different contexts provide supplementary
psychometric support of this brief self-report tool. For instance, one study used the
GAD-7 scale along with other measures to assess the interaction effects of age and
gender differences on life-satisfaction. This study also examined to what degree
depressive and anxiety symptoms are associated with life-satisfaction (Daig, Herschbach,
Lehmann, Knoll, & Decker, 2009). In another study, the GAD-7 scale and a worry
survey were used in a pre- and post-test format to examine the effectiveness of an online
cognitive behavioral treatment program for people with diagnosed GAD (Titov et al.,
2009). The prevalence and relationship between depression, anxiety, and gastrointestinal
symptoms was studied in Germany using the GAD-7 scale as the measure to indicate
anxiety severity (Mussell et al., 2008). One final example of the use of the GAD-7 scale
is cited. A recent Italian study examined the prevalence and clinical implications of
white-coat syndrome. The GAD-7 scale was used in the study to compare the incidence
of anxiety with the incidence of white-coat syndrome (Mario et al., 2009).

68
Summary of Instrumentation
Student respondents in both phases of the study completed the newly designed
NASC-CDM scale, the GSE scale, and the GAD-7 scale. Three versions of the survey
package were constructed, each with the three scales in a different order. Rationale for
the creation of three versions allowed for randomization of a version upon deployment to
a nursing program; thus, diminishing the risk of intrinsic test bias (Rust & Golombok,
2009). All students within a single nursing program received the same version of the
survey package. The three scales were assigned letters on separate pieces of paper (A =
NASC-CDM; B = GSE; C = GAD-7) and then randomly selected to indicate which scale
would be placed first in each of three versions. Results revealed version one placed the
NASC-CDM scale first, version two positioned the GSE scale first, and version three
situated the GAD-7 scale first. To avoid similar positioning of scales within the survey
package, scales were ordered as follows. Table 2 indicates the position of the three scales
within the survey package.
Table 2. Position of Three Scales within the Survey Package
Version of
Survey
Package
Position 1 of Scales
within the Package
Position 2 of Scales
within the Package
Position 3 of Scales
within the Package
1 A B C
2 B C A
3 C A B
Each of the three versions of the survey package contained the same background
color, font, and design format to maintain constant conditions for all participants. The
use of radio buttons as opposed to a drop box format for items was maintained

69
throughout the survey package. Experts in online survey design posit that participants
prefer a radio button format and are able to complete them more quickly than a drop box
format (Couper, Tourangeau, Conrad, & Crawford, 2004). The format and design of the
survey package remained the same for both testing phases.
It was anticipated that student respondents who experience lower levels of self-
confidence with CDM in the clinical practicum environment would report lower self-
confidence scores on the GSE scale. It was also anticipated that student respondents who
experience higher levels of anxiety with CDM in the clinical practicum environment
would report higher anxiety scores on the GAD-7 scale.
Procedure
Approval from Nursing Programs
Data collection for both pilot- and main-testing phases followed the same procedures.
Nursing programs that met inclusion criteria were invited to participate in either the pilot-
or main-testing phase of the study. Approval for the study was obtained from the IRB of
the University of Nevada, Las Vegas (UNLV). See Appendix K for the IRB approval
letter from UNLV and informed consent. Approval from the IRB of each nursing
program in the accessible population was secured prior to subject recruitment. Each
institutional IRB was contacted to identify their requirements to grant permission for
participation in the research study. Requirements were submitted to each eligible nursing
program as requested.
Figure 2 depicts the methodological process for the study. Important persons or
entities are presented on the left side of the diagram and key components implemented by
the researcher are listed on the right side of the diagram.

70
Figure 2. Methodological Flow Chart
Selection of Nursing Programs
One half of the 54 eligible nursing programs were randomly assigned and invited to
participate in the pilot-testing phase. The remaining nursing programs were invited to
participate in the main-testing phase. Completion of instrument testing in this fashion
eliminated the risk of the same students completing the survey during the pilot- and again
during the main-testing phase. The pilot-testing phase of the study commenced during
the fall 2010 semester and the main-testing phase of the study occurred during the spring
2011 semester.
Recruitment of Student Participants
Deans/Directors of the selected nursing programs were contacted by phone or email.
The intent of the study and time commitment for participants was described and the

71
program was invited to participate (Gable & Wolf, 1993). If consent to participate was
confirmed by the Dean/Director, the researcher requested contact names of those faculty
who lead/coordinate the final two clinical nursing courses within the curriculum. Student
recruitment procedures were discussed with the Deans/Directors.
Key to student recruitment was the development of a relationship with faculty-
contacts after initial contact was made by phone or email. The faculty-contacts could be
the lead/coordinators of the final two clinical courses or a designate; they assisted with
data collection. A contact letter was sent via email to the faculty-contacts. See Appendix
L for contact letter for faculty-contact. After contact between the researcher and the
faculty-contacts was established, a recruitment flyer was sent via email to the faculty-
contacts to be distributed to and discussed with students. After faculty-contacts received
the recruitment flyer the researcher initiated a phone call or email to the faculty-contacts
to answer any questions or provide clarification about the study. This dialogue ensured
that information to students was relayed properly and that questions asked by students
were answered appropriately. The conversation took place prior to the distribution of
flyers to students. Suggestions were made that the faculty-contacts distribute the
recruitment flyer to students by sending it through course email and by printing the flyer
and posting it in the classroom. Faculty-contacts were asked to discuss the flyer and
answer questions posed by students. See Appendix M for the student recruitment flyer.
Additionally, if permission by the nursing program was obtained and schedules
permitted, the researcher attempted to visit as many nursing programs as possible. Face-
to-face contact and rapport building was completed in an attempt to improve response
rates (Gable & Wolf, 1993). During the site visit the researcher informed participants of

72
the intent of the study, time commitment, encouraged students to voluntarily complete the
online survey, and answered questions. Visits to campus were completed for student
recruitment purposes only. No data collection occurred at the time of the site visits.
Survey Deployment and Completion
The researcher sent an email to faculty-contacts which contained a link to the online
Survey Monkey (https://www.surveymonkey.com) survey package. Page one of the
survey package contained the informed consent. This email was sent after recruitment
flyer information had been discussed and all student questions were answered by the
faculty-contacts or researcher. Faculty-contacts were asked to send the email with the
survey package link to all students through their course email routing list or similar
means to ensure all students in the course received the email. See Appendix N for the
initial email to be sent to students that contains survey package electronic link.
One of three versions of the survey package was randomly selected for a single
nursing program at the time of survey deployment to the faculty-contacts. The researcher
did not meet with student participants either to distribute or collect hard-copy surveys.
Student respondents completed the survey package fully online. The email containing
the survey package link was deployed during the second half of the semester for both
pilot-testing and main-testing phases. This deployment strategy ensured consistency of
conditions and reduced maturity effects (Polit & Beck, 2008).
At one week and at three weeks after the initial deployment of the survey package
link, faculty-contacts were sent two follow-up emails (Crawford et al., 2001). The first
follow-up email at weeks one and three asked the faculty-contacts to remind their
students verbally about the study. The second follow-up email at weeks one and three

73
contained the secure survey package link, reminded students about the intent of the study,
and encouraged them to voluntarily participate. Faculty-contacts were asked to forward
the second email onto their students via the course routing list or similar means to ensure
all students received the reminder. See Appendix O for the two follow-up emails.
Therefore, eligible students received a verbal reminder from the faculty-contact at one
and three weeks after the initial survey invitation, as well as received an email reminder
from the researcher (forwarded by the faculty-contact) at one and three weeks following
the initial survey invitation. Gall et al. (2007), Huck (2004), and Polit and Beck (2008)
all argue the importance of follow-up with research subjects to improve response rates.
The cutoff date for pilot-phase survey completion was Friday, December 10, 2010. The
cutoff date for main-phase survey completion was Friday, May 6, 2011.
The accessible population, inclusive of both pilot- and main-testing samples was
approximately 12,300 pre-licensure undergraduate nursing students. Response rates for
online surveys tend to be low (Cantrell & Lupinacci, 2007; Polit & Beck, 2008). A 20%
response rate was estimated which is consistent with literature related to online survey
response rates (Crawford et al., 2001; Wright & Schwager, 2008). Consequently, the
number of completed surveys submitted, inclusive of both samples, was anticipated to
approach 2,460 nursing students. This estimated response rate would exceed the
proposed sample size of 300 respondents for pilot-testing and 300 respondents for main-
testing to ensure adequate sample size for multivariate statistical analysis.
Data Handling and Privacy of Participants
Survey data were stored in encrypted data bases within Survey Monkey
(https://www.surveymonkey.com). In addition, the researcher purchased a second layer

74
of encrypted security through Survey Monkey. Only the principal investigator and the
student investigator had password access to the survey platform account. The names of
the nursing programs that participated in the study were not revealed and data could not
be matched to any program. Hence, program confidentiality was maintained. Student
participant data could not be matched to any nursing program and their responses were
anonymous.
After the submission deadline for the pilot- and the main-testing phases of the study,
data from Survey Monkey (https://www.surveymonkey.com) were downloaded into a
spreadsheet software program and the Survey Monkey online files were permanently
deleted at that time. Subsequently, the spreadsheet data were cleaned and uploaded into
Statistical Package for the Social Sciences® (SPSS
®) for Windows, version 17.0.0 with
graduate package (SPSS, 2008). This statistical package was used for all statistical
analysis. All research data were stored on a password-protected four gigabyte (4GB)
Sandisk Cruzer USB flash drive during data analysis and interpretation. All research data
and files related to this study will be stored on a password-protected computer in the
principal investigator‟s locked office for a period of three years after study completion at
which time all research data, files, and storage media will be permanently destroyed.
Informed Consent and Ethical Considerations
The informed consent document was provided to participants when they clicked on
the electronic link provided in the email from the researcher, sent by the faculty-contacts.
The informed consent was page one of the survey package. Participants began
completion of the survey package by clicking on the word NEXT at the bottom of the
informed consent. Student participants were informed that by clicking the word NEXT at

75
the end of the informed consent document and entering the survey package their
informed consent was indicated.
The researcher obtained IRB approval from UNLV as well as IRB approval from
each institution from which student participants were recruited. Faculty-contacts from
the participating nursing programs were instructed to inform students their participation
was voluntary and anonymous. In addition, participants were told their decision to
participate or not participate in the study would have no effect on their progress or
success in any of the nursing courses in which they were currently enrolled. This
information was also included in the informed consent presented to participants when
they clicked on the survey package link provided in the email sent to the faculty-contacts
by the researcher.
The researcher did not have access to individual student email accounts or lists of
students at any participating institution. Survey access information was deployed to
students by the faculty-contacts for each participating program. Student respondents
were told the purpose, procedure, and time commitment of the study and faculty-contacts
or the researcher responded to questions.
Student respondents completed the online survey at a time and place convenient to
their schedules. During the completion of the online survey, student respondents had the
option to skip any item which might cause physical or emotional distress, pass over that
item, and then proceed with survey completion. Participants also had the option to exit
the survey at any time. The content of the NASC-CDM, GSE, and GAD-7 measurement
tools were anticipated to result in little or no psychological distress to participants. The

76
researcher‟s contact information as well as contact information of the UNLV IRB was
provided if participants had questions prior to, during, or after the study.
Data Analysis
Data analysis for pilot- and main-testing phases utilized univariate descriptive and
multivariate techniques. Descriptive statistical analysis examined demographic data and
composite scale scores from both pilot-testing and main-testing samples (Huck, 2004;
Polit & Beck, 2008). Multiple linear regression analysis examined predictions between
demographic data and scores on the NASC-CDM subscales (Munro, 2005; Pallant,
2007). The majority of data analysis was conducted in order to begin the assessment of
psychometric properties of the newly designed NASC-CDM scale. Reliability
coefficients were calculated for both pilot and main sample data. Content validity had
been assessed previously. Item analysis, convergent assessment, and exploratory factor
analysis comprised a large portion of data analysis for the research study and assisted in
the assessment of construct validity of the NASC-CDM scale (Comrey & Lee, 1992; Rust
& Golombok, 2009).
Descriptive Analysis
Descriptive statistical analysis of data included the use of frequency distribution
tables to present categorical nominal and ordinal level demographic data; for instance,
gender, ethnicity, and current work status as a nursing assistant. Histograms are
appropriate for use with interval and ratio level data (Polit & Beck, 2008) and therefore
were used to demonstrate such variables as age, composite scores on the self-confidence
and anxiety subscales of the NASC-CDM scale, and composite scores on the GSE and

77
GAD-7 scales. The examination of the shape of the distributions for study variables
using histograms provides information about skewness, modality, and kurtosis of data
and therefore assists in ascertaining normality. Shapiro-Wilk tests to assess normality
were conducted on data from both pilot- and main-testing phases. Because numerous
statistical tests are sensitive to outliers, histograms and boxplots were also used to assess
the presence of univariate outliers (Huck, 2004; Pallant, 2007). Univaritate outlier values
were replaced with the largest value which was not an outlier (Munro, 2005; Tabachnick
& Fidell, 2007).
Measures of central tendency and variability were calculated for the demographic
variable age, as well as for composite scores on the NASC-CDM subscales, the GSE
scale, and the GAD-7 scale. The use of standard deviation is beneficial not only because
it indicates the average amount of deviation of scores around the mean but also because it
indicates homogeneity or heterogeneity of the study population (Huck, 2004; Polit &
Beck, 2008).
Missing data occur if items within the survey package are intentionally or
unintentionally unanswered. Three issues are considered related to missing data:
determine how much and the randomness of missing data, consider why data are missing,
and decide how to handle missing data (Duffy, 2006). Different techniques are available
to handle missing data. Techniques are often based on the randomness of the data that
are missing.
The study used SPSS® Missing Values Analysis (SPSS, 2008) software to screen for
patterns of missing data. The use of regression imputation with random error term and
multiple imputation was considered to estimate missing data. Regression imputation with

78
random error term uses known data values and missing data to create regression equation
that predict missing values (Musil, Warner, Yobas, & Jones, 2002). Multiple imputation
uses both logistic regression and statistically generated data sets to create equations that
estimate missing values. Data found to be missing not at random (MNAR) negates the
use of regression with random error term and multiple imputations (Tabachnick & Fidell,
2007).
One easily implemented technique that has been used commonly in quantitative
studies is group value replacement with the arithmetic mean or mode (Munro, 2005).
Some experts argue value replacement should be used cautiously because it reduces
variance of items and there are advanced statistical algorithmic options readily available
to estimate missing data values. Statisticians advise the use of mean or modal value
replacement for missing data only if limited amounts of missing data are found (Musil et
al., 2002; Tabachnick & Fidell, 2007). Very small amounts of missing values during
both phases of the study were replaced.
Multiple Linear Regression Analysis
Multiple linear regression (MLR) is a complex analysis based on correlation. MLR
statistically establishes a prediction equation where the predictor variables are assigned a
weight based on their relationship to the outcome variable (Huck, 2004; Munro, 2005).
This statistical technique was used to examine relationships among theoretically
important demographic variables and outcome variables, namely composite scores on the
self-confidence and anxiety subscales of the NASC-CDM scale. For instance, variances
in scores on the self-confidence subscale (outcome or dependent variable) may be

79
explained best by the contributions of age, current work status within healthcare, and
prior college experience (predictor or independent variables) respectively.
MLR is a powerful multivariate technique and can be used with either categorical or
continuous data; however, it is not especially robust to violations of assumptions.
Adherence to MLR assumptions is important in order to generalize findings beyond the
study sample. Assumptions of MLR are checked from the residuals generated when
computing the test and include: linearity, representativeness of the sample, normality, and
homoscedasticity (Munro, 2005; Pallant, 2007). Statistical experts argue adequate
sample size is imperative when using MLR. They cite adequate sample size as: N > 50 +
8m (where m is the number of predictor variables). MLR computations are sensitive to
multivariate outliers and multicollinearity (Tabachnick & Fidell, 2007). The researcher
tested each assumption, examined sample size, and assessed for outliers (univariate and
multivariate) as well as multicollinearity prior to implementing MLR procedures.
Violations of assumptions were handled by transforming variables or excluding cases as
appropriate.
When computing MLR, predictor variables are entered into the regression equation
using one of three different methods: standard, hierarchical, and stepwise. Standard
MLR, the most common method, is used when the researcher considers all variables as
equally important and thus enters all predictor variables into the equation simultaneously
(Pallant, 2007). Hierarchical MLR methods are used when the researcher chooses in
which order to enter predictor variables into the equation. Variables must not be chosen
randomly for entrance into the equation. There must be sound theoretical rationale for
their order of selection. The third method of selecting variables for regression is

80
stepwise. In stepwise MLR the researcher enters first the predictor variable with the
highest correlation to the outcome variable and then enters additional variables in
stepwise fashion based on a set of statistical criteria (Munro, 2005; Tabachnick & Fidell,
2007). Because the researcher concluded several demographic questions were most
theoretically relevant to the outcome variable, the study utilized the standard MLR
method for selecting variables.
Development, refinement, and testing of a newly designed quantitative self-report
scale were purposes of this methodological study. Accordingly, the following section of
the chapter addresses statistical techniques that provided support for the psychometric
properties of the NASC-CDM scale. The section is divided into two primary areas
paramount to psychometric theory – reliability and validity.
Reliability
Reliability theory cites that no quantitative measure is flawless, error influences
observed scores. This premise is expressed using the equation: Observed score = true
score + error score (DeVon et al., 2007). The less error in scores the more reliable the
instrument. In other words, reliability is the consistency or dependability with which the
instrument measures the intended affective construct for a specified sample. A
commonly referenced formula for reliability is:
VE__
Reliability = 1 – V Total
Because perfect reliability is represented as 1, the reliability equals 1 minus the
proportion of error variance to total variance of scores (Kerlinger, 1973).

81
The reliability of an instrument can be assessed using several methods: internal
consistency, temporal stability, and parallel forms. Reliability of the self-confidence and
anxiety subscales of the NASC-CDM scale was assessed using internal consistency
reliability; the Cronbach‟s alpha (Cronbach, 1951). Cronbach‟s alpha is based on inter-
item correlations and is the most commonly reported evaluation of internal consistency
for quantitative measurement instruments. The internal consistency implies items within
a scale are homogeneous in nature; that is they have a strong relationship to the latent
variable under study (DeVellis, 2003).
Several factors influence internal consistency reliability, namely sample
characteristics and sample size, homogeneity of the item content, and number and
response format of items (Gable & Wolf, 1993). As recommended by psychometric
experts, both pilot- and main-testing samples used to test the NASC-CDM scale were
drawn from the same population; undergraduate nursing students in one of their final two
clinical nursing courses. Attempts were made to obtain six to ten student participants per
item on the scale during both pilot- and main-testing phases. Items on the NASC-CDM
scale share similar content meaning and are a subset of the possible universe of items
within the domain of CDM as deduced through comprehensive literature review. There
were 41 items on the pilot version of the NASC-CDM scale. The response format is a 6-
point Likert-type format. Scale development experts posit scales with higher numbers of
items generally have higher reliability coefficients (Gable & Wolf, 1993; Waltz et al.,
2005). Comrey (1988) cites a scale with at least 20 items should obtain adequate
reliability coefficients.

82
Scale development experts note .70 is a good coefficient alpha for a newly developed
affective scale (DeVellis, 2003; Gable & Wolf, 1993; Rust & Golombok, 2009). It is
generally accepted “the higher the coefficient, the more stable the measure” (Polit &
Beck, 2008, p. 454). Because the two subscales within the NASC-CDM tool measure
two different but related affective constructs, it is appropriate to assess Cronbach‟s alpha
for each subscale individually rather than computing one alpha coefficient for the entire
NASC-CDM scale.
During analysis of internal consistency reliability, correlations of items with one
another were examined to observe the effect on alpha coefficient. Items which reduced
alpha when retained were reviewed or reduced; items which improved alpha when
retained remained in the scale (DeVellis, 2003; Polit & Beck, 2008). The use of this
strategy assisted in reduction of items during analysis of data from the pilot-testing
sample. This process was repeated during analysis of data from the main-testing sample.
Also, an assessment of patterns of correlation among items between pilot-testing data and
main-testing data were completed.
The assessment of temporal stability is another means of estimating reliability, but is
recommended only when the construct under study is stable over time (DeVon et al.,
2007). Because the emotional barriers of self-confidence and anxiety that influence
CDM are affective concepts with a potential for large variability and because natural
progression through the nursing program, student maturation, and exposure to clinical
situations where CDM occurs will affect students‟ perceptions of their self-confidence
and anxiety, test-retest reliability assessment was not appropriate. The use of parallel

83
forms to establish reliability was not appropriate for purposes of this study (Rust &
Golombok, 2009).
Validity
Validity of the NASC-CDM scale was examined in a number of ways. Previously
discussed activities undertaken during the early phases of instrument development were
focused on content validity and face validity. Procedures such as inter-item and item-
total correlation, convergent assessment, and exploratory factor analysis (Munro, 2005;
Tabachnick & Fidell, 2007; Waltz et al., 2005) were used to build evidence of construct
validity for the pilot tool and the revised tool. These assessments assisted in determining
needed revisions to the tool from pilot-testing data results and for validating the revised
tool from main-testing data results.
Content Validity and Face Validity
The focus of content validity is primarily qualitative and determines whether the pool
of items for inclusion in the scale is representative of and relevant to the content domain
(DeVellis, 2003; Waltz et al., 2005). Content validity was assessed in several ways,
including a widespread review of the literature and evaluation of items by a panel of
content experts. A review of items for readability and clarity by registered nurses and
student nurses, some with English as a second language, was also done during the early
stages of instrument development. A comprehensive discussion of the process utilized to
enhance content validity of the NASC-CDM scale is presented earlier in this chapter.
Item Analysis
Item analysis can be conducted to reveal the relationship of one item with another
item (inter-item correlation) and also to examine the relationship of one item with the

84
total scale (item-total correlation). Opinions differ about item analytic findings. Some
psychometricians posit that correlations between .30 and .70 are reasonable to expect but
correlations of greater than .70 may indicate redundancy of items (Munro, 2005; Waltz et
al., 2005) while others argue correlations between .30 and .50 are acceptable. Items with
correlations of less than .20 should be considered seriously for reduction (Gable & Wolf,
1993). This research study used the criterion of item correlations between .30 and .70 to
review and reduce items accordingly.
Convergent Assessment
Another means of accumulating support for the construct validity of a new scale is
through the use of convergent techniques. Like numerous other techniques related to
instrument validity, convergent validity is based on correlation and is an assessment of
the relationship between tools that measure theoretically similar constructs (DeVellis,
2003). During the process of instrument development and testing, the new scale should
be subjected to comparisons with like (convergent validity) and unlike (discriminant
validity) constructs (Huck, 2004).
A correlation of scores on the psychometrically sound GSE scale and GAD-7 scale
with scores on the newly developed NASC-CDM scale provided assessments of
convergent validity (DeVon et al., 2007; Polit & Beck, 2008) for the two subscales of the
NASC-CDM instrument. For instance, a student with higher scores on the anxiety
subscale of the NASC-CDM tool should theoretically obtain higher scores on the GAD-7
which screens for generalized anxiety disorders. Findings similar to those in the previous
example would lend support for the convergent validity of the new tool tested in the
study. The research study did not examine discriminant validity.

85
Though psychometric experts differ in their opinion about an adequate correlation
coefficient to indicate convergence, some agree that r greater than or equal to .50 is
acceptable for newly designed instruments. Sample size does influence r (Huck, 2004).
In addition to the criterion r greater than or equal to .50, this study examined data results
for positive correlation coefficients as well as statistical significance (Gall et al., 2007);
thus providing evidence of convergent validity between the two established scales and the
two newly designed subscales on the NASC-CDM tool. This strategy to assess
convergent validity was used during both pilot- and main-testing phases of the study.
Exploratory Factor Analysis
Exploratory factor analysis (EFA) comprised a large portion of data analysis for the
pilot and main samples and was used to enhance construct validity. EFA is commonly
used during instrument development and is best applied when there are groups of
variables that relate strongly to several relatively independent constructs (Comrey, 1988).
The family of factor analytic techniques is based primarily on correlation, variance,
matrix algebra, and coordinate geometry. Although EFA is a complex multivariate
family of statistical techniques some components are practical and subjective, not
statistical in nature. Subjective pieces of EFA include decisions about the number of
factors identified, rotational schemes chosen, and factor labels placed (Comrey & Lee,
1992).
There are several main purposes of EFA. One purpose is to determine underlying
factors or components for a set of variables. Another purpose is to provide a means of
explaining the amount of variance among variables and their associated factors. The final

86
purpose of EFA is to identify variables that covary with similar items and likely define
some meaningful construct.
Data assumptions of EFA are similar to other techniques related to correlation. EFA
assumptions include: adequate sample size, data are interval level or treated as interval
level, items correlate reasonably to at least one other variable, normality, and linearity.
EFA is sensitive to univariate and multivariate outliers (Munro, 2005; Tabachnick &
Fidell, 2007). Violations of assumptions were handled by excluding cases as appropriate.
Opinions about adequate sample size to obtain stable factor solutions during factor
analytic procedures differ widely. Some psychometricians argue samples of greater than
500 are preferable for stable factor solutions (Comrey & Lee, 1992); others note it is
unnecessary to secure samples of more than 100 subjects when using factor analytic
techniques for instrument development (Sapnas & Zeller, 2002). One scale development
expert notes samples of 200 subjects are adequate for a scale of approximately 40 items;
however, a sample of 400 subjects improves factor structure (Comrey, 1988). Another
team of investigators argue there is no set rule for sample size in relation to stable factor
solutions. Their empirical inquiry using different sample sizes revealed that variables
within the study, study design, and level of communality all played roles in adequate
sample sizes. Overall, samples of less than 100 resulted in nonconvergent solutions but
samples of 200 to 400 were adequate under all conditions tested (MacCallum, Widaman,
Zhang, & Hong, 1999).
Two tests assess the suitability of data for EFA, Bartlett‟s test of sphericity and the
Kaiser-Meyer-Olkin (KMO) measure of sampling adequacy. Bartlett‟s test of sphericity
should reach a significance of p < .05 and the KMO index should be > .6 for data to be

87
considered appropriate for EFA computations (Pallant, 2007; Tabachnick & Fidell,
2007). Composite scores on the NASC-CDM, GSE, and GAD-7 scales were considered
continuous outcome variables (Gall et al., 2007). Assumptions of EFA were tested prior
to the initial EFA run. Bartlett‟s test and the KMO index were examined and tests were
run to identify outliers. Sample sizes of at least 300 student participants were planned for
both pilot- and main-testing phases of the study.
There are five primary steps of EFA. Each of these steps was implemented during
both pilot- and main-testing phases of the study. The first step of EFA is the
consideration of which EFA method to use. Principal components analysis (PCA) and
Common factor analysis (CFA) are two common methods of EFA. PCA is commonly
used and easily interpreted when used for the initial run of data (Comrey & Lee, 1992;
Tabachnick & Fidell, 2007). Additionally, the use of PCA for the initial data run is
justified because all items on the scale are assumed to be reliable. A key premise of PCA
is that error and unique variance is used in the computation of factors. Whereas a key
premise of CFA is that only shared variance among items is used in the computation of
factors (Ford, MacCallum, & Tait, 1986). The initial run of data in the research study
utilized PCA (Rust & Golombok, 2009).
During the second phase of EFA the researcher decides the number of factors to
extract. Pallant (2007) and Tabachnik and Fidell (2007) discuss the use of Kaiser‟s
criterion and the scree plot when determining the number of factors to extract. Kaiser‟s
criterion (Kaiser, 1960) for the extraction of factors cites factors are retained when
eigenvalues of greater than 1 are obtained after the factor analysis run. Generally, the use
of Kaiser‟s criterion works well with PCA where unities are placed in the main diagonal

88
cells (Ford et al., 1986). Because the eigenvalue is a notation of the amount of total
variance accounted for by that factor, the larger the eigenvalue the more important the
factor. Eigenvalues of less than one are often attributed to error. Consequently, factors
related to values less than one should not be extracted (Rust & Golombok, 2009).
Cattell‟s scree plot (Cattell, 1966) which plots eigenvalues against successive factor
numbers, is also used to determine the number of factors to extract. Factors with higher
eigenvalues are depicted vertically and factors with lower eigenvalues are seen as scree
or rubble, depicted horizontally after a notable elbow on the graph. Factors are retained
that lie above the metaphorical elbow on the grid (DeVellis, 2003; Munro, 2005). This
research used Kaiser‟s criterion and Cattell‟s scree plot for the determination of the
number of factors to extract.
The third step of EFA relates to the selection of a method of rotation. Based upon the
graphic depiction of factors-in-rotated-space with the initial PCA run, a rotational scheme
was chosen. Munro (2005) cites by using rotation, distinct patterns emerge in the factor
matrix, certain items go with certain factors and others do not. Unrotated data are
uninterpretable. Rotation allows the researcher to view the relationship among variables
from different vantage points, making connection appear more readily (DeVellis, 2003).
When the factor matrix cluster show unrelated patterns an orthogonal (varimax)
rotation is utilized in a subsequent run (Kaiser, 1958). When the factor matrix patterns
appear not to be independent then oblique rotation is implemented. Oblimin rotation is
the most commonly used method of oblique rotation (Tabachnick & Fidell, 2007).
Comrey and Lee (1992) recommend data should be run using orthogonal rotation toward
a simple solution prior to running oblique rotation. Gable and Wolf (1993) recommend

89
instrument developers run both varimax and oblique rotations to examine which produces
more stable meaningful solutions. Some factor analytic experts advocate the use of
oblique rotation because it most accurately represents complex real-world variables (Ford
et al., 1986). For the study, the initial PCA run used a varimax rotational scheme.
However, because of the complex iterative interdependent nature of the process of CDM,
it was likely items on the NASC-CDM scale would not be independent of one another.
The interdependent nature of items necessitated the use of an oblique rotational scheme
during subsquent runs.
The fourth step assesses factor loadings. Factor loadings are examined upon
completion of orthogonal and oblique data runs. The loading or correlation coefficient
represents the degree of intercorrelation between items on the scale. Though cut off
values for factor loadings differ among studies, .40 generally consitutes a substantial
loading on a factor (Ellenbecker & Byleckie, 2005; Gable & Wolf, 1993; Gall et al.,
2007). Several tables related to factor loadings are contained in the SPSS®
output (SPSS,
2008). To most accurately interpret how substantially items load on a particular factor,
information within the pattern matrix as opposed to the structure matrix is used (Pallant,
2007). The study used the cut off value for factor loadings of less then .40 to warrant
review, reduction, or revision of items on the NASC-CDM scale.
The final phase of EFA comprises the determination of label names for factors
(Munro, 2005; Pallant, 2007). The labels assigned to factor solutions are determined by
the researcher and are based on the content of the items which comprise the factor.
Researchers must use caution and be open to indentifying labels for factor solutions they
did not expect to find (Ford et al., 1986). Factor labeling is a qualitative, somewhat

90
subjective process. One means of reducing subjectivity when labeling factors is for an
independent panel to examine factor solutions and provide suggestions of labels (Ford et
al., 1986). Once factor loadings were examined and stable factor solutions reached,
factors were labeled. To maintian the highest level of objectivity when labeling, the
researcher and a panel of five doctorally prepared nurses, independently reviewed factor
structures and assigned labels. The final labels that thematically summarized each factor
were ultimately assigned by the researcher.
Factor analytic procedures have statistical as well as pragmatic goals. Two statistical
goals of EFA are to uncover the simplest factor solution with as few a number of factors
as possible and to explain as much variance as possible from the data (Munro, 2005;
Tabachnick & Fidell, 2007). EFA is intended to reduce a set of variables to a few factors
by combining variables (i.e. items within a scale) that are correlated with each other (Gall
et al., 2007; Tabachnick & Fidell, 2007).
Pragmatic goals are important when EFA is used during instrument development.
The practical goals of factor analysis include: identifying stable factors, determining
which items relate to which factors, screening items for poor fit, revising and reducing
items as appropriate, and re-testing the tool (Comrey & Lee, 1992; Tabachnick & Fidell,
2007). In the study, EFA was utilized to analyze data from the sample that tested the
pilot version of the NASC-CDM scale. Factor analytic techniques used with data from
the pilot-testing phase determined factor solutions for the tool and identified which items
related to those factors. It was anticipated that factors achieved during pilot-testing EFA
would relate to the content domains of CDM determined by the researcher. Items with
poor loadings were revised or reduced.
91
Participants in the main-testing phase completed the revised tool. EFA procedures
were again completed. Main-testing sample data were compared with pilot-testing data
to confirm or dispute initial factor solutions and item loadings. It was anticipated that
factor solutions attained during main-testing would be similar to those achieved during
pilot-testing. Items were again revised or reduced after data analysis from the main-
testing phase of the study.
Chapter Summary
Chapter three examined the methodological process undertaken for the study. Three
research questions were noted as a means of testing the NASC-CDM scale. An
introduction to psychometric theory was presented which included an overview of key
terms such as reliability and validity. The comprehensive process of instrument
development was discussed. Methods of sampling and data collection were explicated.
The full procedure for collecting data was cited and a flow chart was presented to
summarize this procedure. Data analysis for the study included descriptive as well as
multivariate techniques. Statistical techniques were used to build evidence for the
reliability and validity of the NASC-CDM scale. The subsequent chapter discusses
research findings from both pilot- and main-testing phases of the study.

92
CHAPTER 4
FINDINGS OF THE STUDY
The purpose of this chapter is to present results for both the pilot- and main-testing
phases of the study. Pilot-testing to preliminarily assess the reliability and validity of the
Nursing Anxiety and Self-Confidence with Clinical Decision Making (NASC-CDM)
scale took place during the fall 2010 semester. Main-testing of the revised scale took
place during the spring 2011 semester. Two independent samples of pre-licensure
undergraduate nursing students were used to test and validate the scale.
This chapter includes six sections for the pilot-testing phase and five sections for the
main-testing phase of the study. Nursing program participation and factors which
influenced it is explored in the first section. Nursing student participation, response rate,
and missing data are discussed in section two. Characteristics of the undergraduate
nursing student samples are examined using descriptive and univariate statistics in the
third section of the chapter. Information related to the three research questions designed
for the study is examined in the fourth section of the chapter. Predictive relationships
between demographic variables and outcome variables using standard multiple linear
regression (SMLR) are described in part five. An analysis of six questions asked to help
refine the NASC-CDM scale is contained in the sixth and final section of the chapter (for
the pilot-testing phase only).
Results from the Pilot-Testing Phase
Fifty-four nursing programs within the states of Delaware, Maryland, New Jersey,
and Pennsylvania met criteria for inclusion in the study. Twenty-seven nursing programs

93
were randomly assigned for participation in the pilot-testing phase of the study. The IRB
from each eligible institution was contacted and inquires were made about requirements
for approval to recruit undergraduate nursing students to voluntarily complete an
anonymous online survey package. Information was submitted accordingly.
Nursing Program Participation
Randomly assigned institutions for the pilot-testing phase included 15 baccalaureate
degree and 12 associate degree nursing programs. However, the final number of nursing
programs was comprised of six baccalaureate degree and six associate degree programs.
Three primary factors influenced the final number of nursing programs that participated
in the pilot phase: IRB approval, Dean/Director approval, and faculty-contact willingness
to participate.
After submission and repeated follow-up by the researcher over a period of three
months, the IRB offices from four institutions did not respond to the researcher regarding
the submitted IRB application and packet of supporting documents. The remaining 23
institutions either granted IRB approval for the recruitment of nursing students or noted
they had no formal IRB process. Those institutions with no formal IRB approval process
instructed the researcher to secure a willingness-to-participate statement from the
Dean/Director of nursing and subsequently work in collaboration with the department of
nursing to recruit students.
The second factor that influenced the final number of nursing programs in the pilot-
testing phase was a lack of response from several Dean/Directors of eligible nursing
programs. Numerous attempts were made to contact these administrators by email and
telephone. After four attempts to contact each Dean/Director over a period of three

94
months, nonresponders from five programs were eliminated from the study. The
remaining 18 nursing administrators provided names and contact information for faculty
who coordinated the final two clinical courses in the curriculum. These faculty members
were contacted by the researcher about their willingness to assist with data collection.
Faculty unwillingness to assist with data collection was the third issue that influenced
the final number of nursing programs participating in the pilot phase. After several
attempts to contact faculty whose names were provided by their Deans/Directors,
nonresponders from six programs were eliminated from the study. The remaining 12
nursing programs were included in the study. Table 3 outlines the total number of
nursing programs that agreed to participate in the pilot phase of the study.
Table 3. Nursing Programs Agreeing to Participate, Pilot
State Baccalaureate
Degree
Associate
Degree
Potential Student
Numbers
Delaware (None)
Maryland 1 99
New Jersey (None)
Pennsylvania 6 5 1,149
Totals 6 6 1,248
Faculty-contacts who responded affirmatively about their willingness to participate
were sent an IRB approved letter via email which outlined the intent of the study and
informed faculty members of their role with data collection. Throughout the fall 2010
semester the researcher worked closely with faculty-contacts about the feasibility of
campus visits, the deployment of the survey link, forwarding email reminders, and
reminding students to participate in the study.

95
Nursing Student Participation and Survey Response Rate
Researchers argue response rate for online surveys is often appreciably lower than for
paper-pencil surveys completed onsite (Cantrell & Lupinacci, 2007; Polit & Beck, 2008).
A 20% response rate was estimated for the study. Attempts were made to visit as many
eligible nursing classes as possible during the fall 2010 semester. Rationale for campus
visits was to discuss the intent of the study, invite students to participate, answer
questions, and improve response rate (Gable & Wolf, 1993).
Once permission from nursing departments was obtained, the researcher made 14
visits to eligible nursing classes from nine programs. Email invitations with the survey
package link were deployed to students during the second half of the fall 2010 semester.
The invitation with link was sent by the researcher to the faculty-contacts who forwarded
it onto students via the class routing list or other means to ensure all students received the
invitation. No data were collected during visits to campuses. A personal schedule was
made by the researcher to ensure important information was sent in timely fashion to
each participating faculty member. For instance, the recruitment flyer was sent to
faculty-contacts about one and a half weeks prior to the email invitation and survey
package deployment. Reminder emails were sent to faculty-contacts at approximately
one-week and three-weeks after the initial invitation. For those schools where the
researcher made a face-to-face visit, the survey deployment date corresponded with the
classroom visit date. Rationale for this strategy was that proximity of time between
introduction to the study and survey deployment would improve response rate.
A total of 1,248 students from 12 nursing programs were invited to participate in the
pilot-testing phase. The survey closed on December 10, 2010 at 5:00 p.m. At the time of

96
the download of data from Survey Monkey (https://www.surveymonkey.com) into the
spreadsheet software package, 382 respondents completed the survey package. Response
rate for the pilot phase was 30.6%. This exceeded the estimated 20% response rate.
Study design warranted the exclusion of LPNs. It was hypothesized that nursing
students licensed as LPNs have experience with CDM and may have inherently different
levels of self-confidence and anxiety in the clinical practicum setting than their pre-
licensed student counterparts (Faulk et al., 2008; Unruh, 2003). Thus, LPNs were
excluded from the study. Thirty-three LPNs were deleted from the dataset immediately
upon the download from the survey platform. This resulted in 349 remaining surveys.
The Missing Values Analysis (MVA) software (SPSS, 2008) was used to determine
patterns of missing data within the dataset. The amount of missing data was calculated as
10.8%. Results indicated data were missing not at random (MNAR); therefore,
imputations and estimated value replacements were not utilized (Tabachnick & Fidell,
2007). Data were MNAR because 46 student respondents completed only the
demographic questions within the survey package. Although these respondents were not
deleted from the dataset, they were excluded from data analysis. Additionally, minimal
sporadic amounts of data values were missing across variables which were replaced with
the arithmetic group mean for that item. Total scores on the scales were normally
distributed and thus, the mean, median, and mode were similar values. Statistical experts
note value replacement should occur only when very small amounts of data are missing
(Tabachnick & Fidell, 2007). A number of respondents, either inadvertently or
intentionally, did not complete one or several items within the survey package. The use

97
of mean replacement for missing values replaced less than 1% of survey package data.
The number of suitable surveys utilized for data analysis was 303.
Sample Characteristics
A convenience sampling framework was used for this study. A sample of
undergraduate nursing students in one of their final two clinical nursing courses
completed the pilot-version of the scale during the fall 2010 semester. The sample (N =
349) completing the NASC-CDM scale consisted of pre-licensure undergraduate
baccalaureate (BSN) and associate (ADN) degree nursing students from two states in the
northeastern portion of the United States. Forty-six students did not complete the entire
survey package while 303 students completed the full survey package.
Descriptive statistics were used to examine the characteristics of those students who
completed the full survey package and those who completed demographic questions only.
A total of 111 (36.6%) BSN students and 192 (63.4%) ADN students completed the
survey package. The mean age of participants who completed the survey was 29.16 + 7.5
with a range in years from 20 to 45. Furthermore, 23 survey completers were greater
than 45 years of age. In addition to sociodemographic questions, students were asked
several questions related to their nursing program, work experience, and previous college
experience. See Appendix P for characteristics and comparisons of the pilot-sample
completers and noncompleters.
Parametric and nonparametric statistics were used to compare students who
completed the survey package with those who did not to see if the groups were inherently
different. Although the Shapiro-Wilk test for normality of age was statistically
significant, indicating a violation of normality, both skewness and kurtosis did not exceed

98
+ 1 (Munro, 2005). For this reason, preliminary analysis assumed normality for age for
the two independent groups. Table 4 indicates assessment of the normality assumption
for age.
Table 4. Assessment of Normality for Age, Pilot
Group Shapiro-Wilk Skewness Kurtosis
Complete Surveys
(n = 303)
.89(271), p < .001 .63 -.93
Incomplete Surveys
(n = 46)
.86(42), p < .001 .86 -.46
An independent samples t-test was used to compare the groups of survey completers
and noncompleters with regard to age. The chi-square for independence (Pallant, 2007)
was used to compare survey completers and noncompleters with regard to a number of
categorical sociodemographic variables when no expected frequency per cell requirement
was violated. Likelihood ratio was used when expected cell frequencies fell below five.
Fisher‟s exact test was computed instead of chi-square for independence or likelihood
ratio for two-by-two tables that violated the expected frequency per cell requirement
(Munro, 2005).
Results of the comparison indicated that completers and noncompleters were
statistically different in several ways. One difference between the groups related to the
type of program in which they were enrolled. Students who completed the full survey
package were more often enrolled in ADN programs (63.4%) whereas students who did
not complete the full survey package were more often enrolled in BSN programs (63%).
Another significant difference was related to the format of the nursing program students

99
attended. More survey completers (25.1%) than noncompleters (13%) were enrolled in
year round nursing programs. More survey noncompleters (17.4%) than completers
(5.9%) were enrolled in an accelerated program format.
A third difference was related to the current semester of nursing in which students
were enrolled; however, the practical significance of this finding is questionable. The
researcher speculated respondents misunderstood this question. It was believed
responses varied widely because students interpreted the question to mean the TOTAL
semesters of college in which they had been enrolled, instead of the current NURSING
semester in which they were enrolled. The word nursing was capitalized to enhance
question clarity for the main-testing phase of the study.
The final two sociodemographic questions asked students about the difficulty level
and course letter grade of the current clinical nursing course(s) in which they were
enrolled. The nonparametric Spearman rho correlation was used to examine the
correlation of course difficulty with course grade (see Appendix P). The Spearman rho
was appropriate because the relationship between two rank-order variables was examined
(Munro, 2005). Numerous statistically significant findings were revealed. However, the
practical significance of these findings is questionable because it was posited students
misunderstood the questions. Upon inspection of the data, the researcher believed that
instead of indicating the level of difficulty and letter grade for the current CLINICAL
NURSING COURSE in which the students were enrolled, students indicated the
difficulty and grade of each CLINICAL ROTATION within one course. For this reason,
results from the analysis of these data were not used for further analysis. The phrase

100
clinical nursing course was capitalized to enhance question clarity for the main-testing
phase of the study.
Measures of central tendency and variability were calculated for composite scores on
the subscales of the NASC-CDM, the General Perceived Self-Efficacy (GSE), and the
Generalized Anxiety Disorder-7 (GAD-7) scales for the pilot sample. Table 5
summarizes these results. Interpretations of these findings are discussed in chapter five.
Table 5. Results of Composite Scores for Four Scales, Pilot
Scale Name
Number
of Items
Response
Option
Scoring
Range
Mean Score,
(SD) a
NASC-CDM, Self-
Confidence
(n = 291)
41 6-point Likert 41 - 246 161.42 (+ 36.73)
NASC-CDM, Anxiety
(n = 293)
41 6-point Likert 41 - 246 106.24 (+ 32.72)
GSE
(n = 300)
10 4-point Likert 10 – 40 31.84 (+ 3.67)
GAD-7
(n = 299)
7 4-point Likert 0 - 21 9.09 (+ 5.55)
a, SD = standard deviation
Results Related to the Research Questions
The purpose of the pilot-testing phase of the study was to test and begin the
establishment of psychometric properties for the newly designed self-report, 6-point
Likert-type scale entitled the Nursing Anxiety and Self-Confidence with Clinical
Decision Making (NASC-CDM) scale. The majority of data analysis was completed to
answer the three research questions which framed the methodology of the study (see page
42). Two research questions were related to the establishment of the NASC-CDM scale‟s

101
validity. One research question was related to the establishment of the scale‟s reliability.
Data from 303 undergraduate nursing students who completed the full survey package
were included in analyses.
Normality and Linearity Assumptions
Because the assumptions of normality and linearity are vital for a number of
statistical analyses, the process of their assessment is discussed here. Preliminary
analyses of composite scores on the NASC-CDM, Self-Confidence (NASC-CDM, SC)
subscale scores, the NASC-CDM, Anxiety (NASC-CDM, A) subscale scores, the GSE
scale total scores, and the GAD-7 scale total scores were completed to test the
assumptions of normality and linearity. Univariate outliers were identified by examining
histogram and boxplot graphs: Outlier values were replaced with the largest data value
which was not an outlier (Munro, 2005; Tabachnick & Fidell, 2007). Although several
results of the Shapiro-Wilk test for normality were statistically significant, indicating a
violation of normality, both skewness and kurtosis did not exceed + 1. Based on these
results, data were assumed to be normally distributed. Table 6 summarizes assessment of
normality after values for univariate outliers were replaced.
Table 6. Assessment of Normality for Total Scores on Scales, Pilot
Scale Name Shapiro-Wilk Skewness Kurtosis Initial Outliers
NASC-CDM, SC
(n = 291)
.99(291), p = .13 -.11 -.17 1
NASC-CDM, A
(n = 293)
.98(293), p = .001 .39 .09 4
GSE (n = 300) .98(300), p < .001 .14 -.42 7
GAD-7 (n = 299) .96(299), p < .001 .32 -.86 0

102
The assumption of linearity was assessed using scatterplots (Munro, 2005; Pallant,
2007). A scatterplot was created for scores on the NASC-CDM, SC with scores on the
GSE scale. Another scatterplot was created for scores on the NASC-CDM, A with scores
on the GAD-7 scale. Examination of the swarm indicated linear relationships between
the variables. The following three sections address each of the research questions.
NASC-CDM Scale as a Valid Measurement Tool
The first research question addressed in the study was: Do the self-confidence and
anxiety subscales of the NASC-CDM scale provide a valid measure of undergraduate
nursing students‟ perceptions of self-confidence and anxiety levels during the process of
CDM?
Exploratory factor analysis (EFA) and item analysis were conducted to begin the
initial assessment of construct validity for the subscales of the pilot version of the NASC-
CDM scale. Results of EFA techniques allowed the researcher to revise and reduce items
based on complex statistical techniques that incorporate the concepts of matrix algebra,
variance, correlation, and coordinate geometry (Comrey & Lee, 1992). EFA procedures
were run separately for each NASC-CDM subscale, self-confidence and anxiety.
A number of statistical assumptions were considered prior to the initial EFA
procedure: level of data, normality, linearity, inter-items correlation, outliers, and sample
size. The continuous composite scores on the NASC-CDM, SC and NASC-CDM, A
subscales were deemed interval level data for the purpose of data analysis (Gall et al.,
2007; Polit & Beck, 2008). Preliminary analyses of the dataset were conducted to test the
assumptions of normality and linearity. Based on assessments of normality from the
section above, data were assumed to be normally distributed. Linearity was assessed

103
through visual inspection of the normal probability plots (P-P plots) and scatterplots
within the residual statistics of the linear regression model. Several random spot-checks
of the scatterplots of two items on the subscales were also assessed for linearity.
Residual normal P-P plots revealed a reasonably straight line while scatterplots
resembled rectangular shapes (Tabachnick & Fidell, 2007).
There were 41 items on the pilot version of the NASC-CDM scale; therefore the
inter-item correlation analyses created a 41 by 41 correlation matrix for scores on each
subscale. Inter-item correlations were reviewed to visualize substantial relationships, .30
and above (Munro, 2005; Rust & Golombok, 2009), and to ensure the suitability of data
for factor analytic procedures. Based on results of item analysis, no items were reduced
prior to factor analysis initiation.
EFA is sensitive to multivariate outliers, thus these must be identified and removed
prior to implementation. Multivariate outliers were identified using linear regression
analysis and locating the maximum value for Mahalanobis distance from the residual
statistics (Pallant, 2007; Tabachnick & Fidell, 2007). The maximum value for
Mahalanobis distance (p = .001) for the NASC-CDM, SC subscale was 130.66 (critical
value = 73.40(41), n = 291). Twenty-three cases exceeded the critical value for
Mahalanobis distance and were excluded from EFA runs for the self-confidence subscale.
The maximum value for Mahalanobis distance for the NASC-CDM, A subscale was
135.88 (critical value = 73.40(41), n = 293). Thirty-five cases exceeded the critical value
for Mahalanobis distance and were excluded from EFA runs for the anxiety subscale.
The final number of cases used in factor analysis runs for the self-confidence and anxiety
subscales was 268 and 258 respectively.

104
Sufficient sample size was assumed at between six and ten subjects per 41 items on
the NASC-CDM scale, which is consistent with scale development and factor analytic
experts (Comrey, 1978; Gable & Wolf, 1993; Sapnas & Zeller, 2002). The subject
number to item number ratio equaled 7.39 if the complete dataset of 303 participants had
been used for EFA procedures. After exclusion of multivariate outlier cases the subject
number to item number ratio for the self-confidence and anxiety subscales was 6.54 and
6.29 respectively.
The Kaiser-Meyer-Olkin (KMO) measure of sampling adequacy and Bartlett‟s test of
sphericity examine the suitability of data for factor analysis (Comrey & Lee, 1992).
Table 7 reveals results of the KMO and Bartlett‟s tests for the self-confidence and anxiety
subscales. Results indicated data were appropriate for factor analytic procedures.
Table 7. KMO and Bartlett’s Test Results, Pilot
Scale Name KMO Measure of
Sampling Adequacy a
Bartlett’s Test of
Sphericity b
NASC-CDM, SC .98 df 820, p < .001
NASC-CDM, A
.98
df 820, p < .001
a, Should exceed .60
b, Should reach significance, p < .05
Numerous steps are involved with EFA, namely determining a factor analysis
method, deciding the number of factors to extract, choosing a rotational scheme,
assessing factor loadings, and labeling the factors. Principal component analysis (PCA)
with varimax rotation was used for the initial factor analysis run for both subscales
(Comrey & Lee, 1992; Tabachnick & Fidell, 2007). Using Kaiser‟s criterion (Kaiser,

105
1958), four factors for the NASC-CDM, SC subscale and three factors for the NASC-
CDM, A subscale achieved eigenvalues exceeding 1.
Visual inspection of the scree plots (Cattell, 1966) indicated a metaphoric elbow
between factors four and five for the self-confidence subscale and between three and four
for the anxiety subscale. These findings further confirmed a four factor solution
explaining 71.83% of the total variance for the NASC-CDM, SC and a three factor
solution explaining 66.57% of the total variance for the NASC-CDM, A. See Appendix
Q and Appendix R for results of Kaiser‟s criterion and variance explained for the
subscales. For clarity, factor analysis results in the appendices are reported separately for
the self-confidence and anxiety subscales.
Factor loadings were examined using the rotated component matrices on the PCA
with varimax rotation output. Factor plots were examined. Numerous secondary
loadings and multiple loadings were seen among the 41 items. It is recognized
theoretically that the process of clinical decision making is an iterative one; that is
students move back and forth through the process until a decision is made and action
occurs. Because of the considerable overlap among factor loadings, because of
intermingled points on the factor plots, and because items concerning the iterative
process of decision making are associated, items within the factor solutions were
determined to be related. Therefore, to enhance interpretability, subsequent factor
analytic runs implemented oblique rotational schemes (Comrey, 1978; Tabachnick &
Fidell, 2007).
The most commonly used oblique rotational scheme is direct oblimin. When PCA
with oblimin rotation was used with items for both self-confidence and anxiety subscales

106
no stable factor solutions were derived at 25 iterations. Analyses were also run using
PCA with promax rotation. Results indicated substantial factor loadings of some items
using this technique. Factor analytic experts and scale development experts note it is
appropriate to initiate multiple runs of factor analysis techniques to achieve the most
stable factors, with substantial factor loadings, with reasonable iterations (Comrey, 1978;
Gable & Wolf, 1993).
Alpha factoring maximizes the alpha reliability of factors and is appropriate during
the process of scale development (Munro, 2005; Tabachnick & Fidell, 2007). The final
run for both subscales used alpha factoring with promax rotation. Similar to the initial
run using PCA with varimax rotation, four factors were retained for the self-confidence
subscale and three factors were retained for the anxiety subscale. Factor loadings from
the pattern matrices were used to interpret the meaning of factors because they represent
unique variance of items. Structure matrices contain considerable overlap among items
and were not considered as interpretable (Comrey & Lee, 1992; Munro, 2005). See
Appendix Q and Appendix R for alpha factoring with promax rotation results for the
subscales. Cumulative total variance explained after rotation cannot be determined when
oblique rotational schemes are implemented because of the inter-related nature of items
and factors (Munro, 2005; Pallant, 2007); therefore, they are absent from both
appendices.
The intent of the NASC-CDM scale is to measure students‟ levels of self-confidence
and anxiety during the process of clinical decision making. Consequently, although the
number of factors and structure of loadings on factors varied between the self-confidence
and anxiety subscales, the researcher decided items should remain identical on both

107
subscales. Nine items were reduced from the NASC-CDM scale based on item analysis
and factor analysis results. Another four items were modified slightly for grammatical
and clarification purposes only. The content of these four items was not altered.
Considerations for item reduction included items correlating weakly or strongly with
a number of other items, items not loading on either of the two subscales, and items with
smaller or secondary loadings. Items were reviewed with inter-item correlations of < .30
and > .70 (Gable & Wolf, 1993; Waltz et al., 2005). Factor loadings were noted as
substantial if they reached at least .40 (DeVellis, 2003; Ellenbecker & Byleckie, 2005).
Not all items with secondary loadings were reduced. Some redundancy among items is
beneficial during the process of instrument development. Patterns of factor loadings
should be reexamined for similarities with another sample (Comrey, Reise, & Waller,
2000; DeVellis, 2003; Tabachnick & Fidell, 2007).
The nine items reduced from the NASC-CDM scale and the rationale for their
reduction follow. I am ___ self-confident and ___ anxious in by ability to…
Q8: Recognize a possible client problem by reading the patients chart (No problems with
item analysis, no loading on anxiety subscale, and substantial loading on self-confidence
subscale).
Q12: Evaluate how successful my clinical decision was in improving the client‟s physical
assessment findings (Correlations of > .70 with several items, small loading on anxiety
subscale, and no loading on self-confidence subscale).
Q21: Evaluate whether the clinical decision I made actually made the client better, worse,
or didn‟t make a difference (Correlations of > .70 with several items, substantial loading
on anxiety subscale, and small loading on self-confidence subscale).
108
Q25: Know when enough information about the current problem has been gathered from
the client (Correlations of > .70 with several items, substantial loading on anxiety
subscale, and small loading on self-confidence subscale).
Q26: Identify which pieces of clinical information I gathered are NOT related to the
client‟s current problem (Correlations of > .70 with several items, small loading on
anxiety subscale, and no loading on self-confidence subscale).
Q28: Change my assessment based on the client‟s signs and symptoms of the current
problem (Correlation of > .70 with one item, substantial loading on anxiety subscale, and
no loading on self-confidence subscale).
Q33: Correlate the client‟s diagnostic study results with his or her physical assessment
findings (Correlations of > .70 with several items, small loading on anxiety subscale, and
secondary loading on self-confidence subscale).
Q37: Follow a „feeling‟ that something is wrong with the client and then begin to gather
information (Correlations of > .70 with several items, secondary loading on anxiety
subscale, and strong loading on self-confidence subscale).
Q41: Take the full responsibility for the clinical decision I made (Correlations of < .30
with one item, strong loading on anxiety subscale, and no loading on self-confidence
subscale).
Secondary loadings of several items occurred on the self-confidence subscale. Q2
loaded on factor II at .474 and on factor III at .417 while Q9 loaded on factor II at .461
and on factor III at .426. Based on the content of these items, each was placed with
similar items into factor III. Q30 loaded at .411 on factor II and at .375 on factor III;
however after review of its content, this item was determined to fit best in factor III.

109
Finally, although Q14 loaded stronger on factor I (.624) than on factor IV (.412) its
content about listening was determined to fit best with the items in factor IV. Secondary
loading of one item was found on the anxiety subscale. Q2 loaded at .450 on factor II
and at .469 on factor III. Based on its content, Q2 was placed with similar items into
factor II.
Four factors were extracted for the self-confidence subscale explaining 21.37%,
20.65%, 21.09% and 11.94% of variance respectively. Three factors were extracted for
the anxiety subscale explaining 22.13%, 18.73% and 18.15% of variance respectively.
Factor correlation matrices results revealed correlation coefficients of > .40 on both
subscales indicating interrelatedness among factors (Pallant, 2007). See Appendix Q and
Appendix R for factor correlation matrices. There was considerable overlap of item
loadings onto factors of the self-confidence and anxiety subscales. See Appendix S for
overlapping items among subscales.
The final step of factor analytic procedures is labeling factors. Because the factor
structures of the two subscales were similar, they were given similar labels. The
researcher reviewed and labeled factors based on the content of items which comprised
each factor (Munro, 2005). Additionally, a panel of five doctorally prepared nurse
educators independently reviewed factor analysis results and were asked to provide labels
for factors. Rationale for using a panel of experts was to reduce the subjectivity
inherently associated with factor labeling (Ford et al., 1986). Input from the expert
panelists was advantageous; nevertheless, factor labels were assigned ultimately by the
researcher. The four factors of the self-confidence subscale were labeled: (I) using
resources to gather information, (II) using information to see the big picture, (III)

110
knowing and acting, and (IV) listening fully. The three factors of the anxiety subscale
were labeled: (I) using resources to gather information and listening fully, (II) knowing
and acting, and (III) using information to see the big picture.
Results of item analysis and factor analytic procedures answered research question
one affirmatively during the pilot phase. Stable factor solutions were confirmed for the
self-confidence and anxiety subscales of the NASC-CDM scale. Items contained within
these factors for the subscales revealed considerable overlap, indicating their
interrelatedness. These outcomes contributed positively to the establishment of construct
validation of the newly designed scale.
Convergent Validity of the NASC-CDM Scale
The second research question was designed to initially assess convergent validity of
the NASC-CDM scale. This research question asked: Do the self-confidence and
anxiety subscales of the NASC-CDM scale relate satisfactorily with two established
reliable and valid quantitative instruments measuring generalized self-efficacy and
generalized anxiety?
The relationship between students‟ perceived self-confidence during clinical decision
making (as measured by the NASC-CDM, SC) and general self-efficacy (as measured by
the GSE), and the relationship between students‟ perceived anxiety during clinical
decision making (as measured by the NASC-CDM, A) and generalized anxiety (as
measured by the GAD-7) were examined using the Pearson product moment correlation
coefficient (r). The continuous composite scores for all scales were deemed interval level
for data analysis. Preliminary analyses of these data were completed to ensure no
violation of the assumptions of normality, linearity, and homoscedasticity (DeVon et al.,

111
2007; Munro, 2005). The analysis of normality and linearity are addressed in an earlier
section of this chapter. Normality and linearity were assumed. The assumption of
homoscedasticity was assessed by examining the shape of the scatterplots, as well as by
using a linear regression model and examining the residual plot for rectangular shape and
a lack of obvious funneling. No violations were found.
Pearson r correlation computations were completed for the first sample data from the
pilot phase using pairwise exclusion. There was a statistically significant, moderate
positive correlation between the variables NASC-CDM, SC and GSE (r = .54, p < .001, n
= 290). There was also a statistically significant, moderate positive correlation between
the variables NASC-CDM, A and GAD-7 (r = .52, p < .001, n = 290). Internal
consistency reliability coefficients for the GSE and GAD-7 scales were examined for the
pilot sample; GSE (α = .85, n = 300), GAD-7 (α = .90, n = 299).
Results of this analysis answered research question two affirmatively. Results
revealed there was a statistically significant, moderate positive relationship between the
self-confidence and anxiety subscales of the NASC-CDM scale and the psychometrically
sound instruments with which they were compared. A positive correlation in the range of
.50 is respectable for a newly designed scale (Gable & Wolf, 1993; Waltz et al., 2005).
These findings indicate undergraduate nursing students with higher levels of self-
confidence during the process of CDM had higher levels of general self-confidence.
Similarly, students with higher levels of anxiety during the process of CDM had higher
levels of generalized anxiety.
Additionally, Pearson product moment correlation coefficient (r) with pairwise
exclusion was computed to examine the relationship between scores on the NASC-CDM,
112
SC and NASC-CDM, A subscales. Preliminary analyses of these data were completed to
ensure no violation of the assumptions of normality, linearity, and homoscedasticity
(DeVon et al., 2007; Munro, 2005). As noted above, normality and linearity were
assumed. The assumption of homoscedasticity was assessed by examining the shape of
the scatterplots as well as by using a linear regression model and examining the residual
plot for rectangular shape and a lack of funneling. No violations were found.
There was a statistically significant, moderate negative correlation between the
variables NASC-CDM, SC and NASC-CDM, A (r = -.67, p < .001, n = 287). Results
indicated those undergraduate nursing students with higher levels of self-confidence
during the process of CDM had lower levels of anxiety during the process and vice versa.
NASC-CDM Scale as a Reliable Measurement Tool
The third research question evaluated in this study was: Do the self-confidence and
anxiety subscales of the NASC-CDM scale provide a reliable measure of undergraduate
nursing students‟ perceptions of self-confidence and anxiety levels during the process of
CDM?
Cronbach‟s alpha internal consistency reliability coefficient (Cronbach, 1951) was
used to compute the reliability for the self-confidence and anxiety subscales of the
NASC-CDM scale. Items included on each of the subscales of the NASC-CDM scale are
identical. Student respondents were asked to identify their level of self-confidence and
level of anxiety for each item; thus the number of items and scoring range for both
subscales are the same. Examination of the item-total statistics for both subscales
revealed no substantial influence on alpha if any item was deleted. Scale development
experts note an alpha of .70 is acceptable for a newly designed affective scale (DeVellis,

113
2003; Rust & Golombok, 2009). See Appendix T for reliability results of the subscales
for the pilot version and the rerun of reliability after the reduction of nine items.
Review of inter-item correlations is beneficial to identify weak or redundant items on
a scale. Items with inter-item correlations of < .20 should be considered for reduction
because of their lack of relationship with other items on the scale. Those with inter-item
correlations of > .70 should be reviewed for content redundancy (Gable & Wolf, 1993;
Munro, 2005; Waltz et al., 2005). The mean inter-item correlation for the subscales of
the pilot version and revised version of the NASC-CDM scale did not exceed .70 but
several inter-item dyads did top .70 – these were reviewed. Furthermore, no inter-item
dyad correlation fell below .20. Although inter-item correlation review was valuable for
the assessment of internal consistency reliability of a scale, this information was also
used for the purposes of the establishment of construct validity. The majority of
discussion about inter-item correlation and its use occurred during the section of this
chapter that relates to the first research question.
Results of this analysis answered research question three affirmatively. Reliability
coefficients for both subscales of the NASC-CDM scale were satisfactory (Cronbach,
1951; DeVellis, 2003). Inter-item and item-total findings were reviewed with regard to
the appraisal of reliability and construct validity. Items were rephrased or reduced based
on these results.
Predictions using Multiple Linear Regression
Standard multiple linear regression analysis (SMLR) was used to examine the
predictive relationship of several demographic variables (independent or predictor
variables) with composite scores on the NASC-CDM, SC and NASC-CDM, A subscales

114
(dependent or outcome variables). It is acknowledged that including numerous
independent variables in MLR reduces degrees of freedom and ultimately lessens the
power of the analysis (Tabachnick & Fidell, 2007). For this reason, independent
variables were chosen thoughtfully based on their theoretical importance to the concepts
of self-confidence and anxiety with the process of CDM.
Demographic questions considered for SMLR included age, gender, program type,
program format, employment as a nursing assistant, prior college experience, and
participation in an externship program. The researcher‟s original intent was to include the
demographic questions related to current course difficulty and current course grade in the
regression analysis. However, as previously discussed, it was surmised these questions
were misconstrued and responses were ambiguous. Therefore, data from these two
questions were not incorporated into regression analytic procedures.
Preliminary analyses, using independent samples t-tests, were conducted on
dichotomous independent variables to reveal significant differences of mean scores
(Munro, 2005) on the self-confidence and anxiety subscales. Variables with
nonsignificant t-test results, indicating no differences between the groups, were excluded
from regression analysis.
Independent samples t-tests were conducted separately to compare mean scores for
each of the NASC-CDM subscales for several variables: gender (male or female),
program type (associate or baccalaureate), participation in an externship program (yes or
no), and current employment as a nursing assistant (yes or no). The question related to
participation in an externship program included a third response option, I am not familiar
with this type of program; however, only 15 of 303 respondents who fully completed the

115
survey chose this option. These 15 cases were excluded from the t-test analysis for this
variable. Nonsignificant Levene tests for each variable assumed equal variance. See
Appendix U for t-test results.
There was a nearly significant difference in mean self-confidence scores between
males and females. There was a statistically significant difference in mean anxiety scores
between males and females. Because of these results, gender was included in SMLR
runs. There was no significant difference in mean self-confidence scores for students
enrolled in either associate or baccalaureate degree programs. There was no significant
difference in mean anxiety scores for students enrolled in either type of program. In light
of these results, program type was not included in SMLR runs.
There was no significant difference in mean self-confidence scores for students who
participated in an externship program and students who did not. There was no significant
difference in mean anxiety scores for students who participated in an externship program
and students who did not. Because of these results, externship participation was not
included in SMLR runs. There was no significant difference in mean self-confidence
scores for students who were employed as a nursing assistant and students who were not.
There was no significant difference in mean anxiety scores for students who were
employed as a nursing assistant and students who were. Based on these results, nursing
assistant employment status was not included in SMLR runs.
Four independent variables were included in regression analysis using pairwise
exclusion. Variables included were gender, age (measured in years), format of program
(measured as accelerated, evening/weekend, traditional, and year-round), and amount of
prior college experience (measured as none, 1 to 2 semesters, 3 to 4 semesters, greater

116
than 4 semesters, and completion of a college degree). Nominal and ordinal level
independent variables were recoded into DUMMY variables for interpretability in
regression analyses. Evaluation of assumptions (Munro, 2005; Pallant, 2007; Tabachnick
& Fidell, 2007) was completed related to each subscale independently prior to the final
SMLR analysis.
Adequate sample size was assumed with approximately 230 student respondents for
each subscale. Data did not violate the multicollinearity assumption, as no correlations
exceeded .70, no tolerance was less than .10, and no variance inflation factor (VIF)
exceeded 2. Normality of total scores was previously examined and did not violate this
assumption. Additionally, normality and linearity of data were assumed by reviewing the
regression standardized residual plots. Normal P-P plots for both subscales indicated a
reasonably straight line. Scatterplot swarms revealed randomness, with no discernible
patterns of concern. Examination of residual scatterplots revealed no obvious funneling;
thus, homogeneity of variance or homoscedasticity was assumed.
Mahalanobis distance (p < .001) was used from the residual statistics to determine
multivariate outliers. For the self-confidence subscale, 10 cases exceeded the critical
value of 18.47 with a maximum value of 24.36. For the anxiety subscale, 16 cases
exceeded the critical value or 18.47 with a maximum value of 42.05 for the anxiety
subscale. These 10 and 16 cases respectively were excluded from subsequent regression
runs. Nonsignificant results of the Durbin-Watson statistic (1.98 for the self-confidence
subscale and 1.86 for the anxiety subscale) indicated no violation of the assumption
independence of errors.

117
Results of early runs of standard regression analysis using four independent variables
indicated, for the question about amount of college experience, only the recoded variable
for the completion of a college degree (New for prior college4) appeared to contribute
significantly to the regression model. Consequently, New for prior college4 was the only
response related to amount of college experience included in subsequent SMLR runs.
Results of SMLR revealed no statistical significance in the overall regression model
for either subscale. Analysis of Variance (ANOVA) tables for the NASC-CDM, SC
subscale indicated, F(4, 231) = 1.20, p = .31 and for the NASC-CDM, A subscale
revealed, F(3, 225) = 1.11, p = .35. Correlations for scores on the anxiety subscale and
gender were missing from the NASC-CDM, A regression output; therefore, this variable
was deleted from the analysis.
R2 for both subscales confirmed the regression model (including gender [for SC
only], age, format of program, and New for prior college4) explained only 2% and 1.5%
of the variance in total scores on the self-confidence and anxiety subscales respectively.
Evaluation of the Beta standardized coefficients revealed the amount each independent
variable contributed to the model. Beta coefficients indicated having a college degree
was the largest contributor to the overall regression model. Nonetheless, these findings
were not statistically significant. See Table 8 for the regression coefficients table results.

118
Table 8. Results of Coefficients Table for Standard Multiple Regression Analysis,
Pilot
Scale Name Independent Variable Beta t Significance, p a
NASC-CDM, SC
(n = 243)
Gender
Age
Format of Program
New for prior college4
.05
.04
.04
.12
.74
.58
.62
1.7
.46
.56
.53
.09
NASC-CDM, A
(n = 229)
Gender
Age
Format of Program
New for prior college4
---
-.03
.02
-.10
---
-.37
.22
-1.4
---
.74
.82
.16
a, No independent variable contributed significantly to the regression model.
Because New for prior college4 (completion of a college degree) contributed most to
the regression model, SMLR was rerun for each subscale including only this independent
variable. Results indicated no statistical significance of the overall model for the self-
confidence or the anxiety subscales. Self-confidence: F(1, 237) = 3.41, p = .07; R2 =
1.4% total variance explained; Beta coefficient = .12, t = 1.85, p = .07. Anxiety: F(1,
227) = 3.17, p = .08; R2 = 1.4% total variance explained; Beta coefficient = -.12, t = -
1.78, p = .08.
Results Related to Questions to Refine the NASC-CDM Scale
Undergraduate nursing students in the pilot-testing phase of the study were asked five
4-point Likert-type questions which helped the researcher refine the newly developed
NASC-CDM scale. Respondents were also asked one open-ended question. The open-
ended item invited students to provide additional comments they thought might be
beneficial for the researcher to improve the scale.

119
The Likert-type questions addressed the topics of clarity of directions, meaning of
items, appropriateness of reading level, appropriateness of survey length, and ease of
survey completion. Response anchors were written such that 1 indicated the most
negative response (i.e. directions were not at all clear) and 4 indicated the most positive
response (i.e. directions were totally clear). Frequency distributions revealed > 75% of
respondents answered either a 3 or 4 for each of these items. See Appendix V for the
results of descriptive analysis for the five questions related to the NASC-CDM scale.
Based on these results, the directions, item meaning, reading level, and design format of
the NASC-CDM scale remained the same for the second sample in the main-testing
phase. The length of the scale was reduced from 41 to 32 items.
In addition to the five closed-ended questions, respondents were asked one open-
ended question related to the NASC-CDM scale. The question read: Any comments
about specific items or comments in general about the NASC-CDM tool are appreciated.
I am interested in the feedback you provide which might allow me to improve the tool.
Thank you again for your time and cooperation. Seventy-two students responded to this
question. See Appendix W for results of the content analysis for the open-ended
question. A number of comments were simply words of encouragement to the
researcher. For instance, several comments read “Good luck with your research.”, “Good
luck with your journey.”, “Thanks for including us in your survey.”, and “Thanks for
doing this survey…students like me need it!”.
Content analysis was completed to distinguish similarities among comments.
Students‟ responses were arranged within four comment types: positive, negative, format

120
of scale, and unrelated to scale. Several comments written by students were especially
profound and thus, are included here.
Several positive comments included: “It was interesting how there were similar
questions phrased differently each time. The wording made me really think it through…
well structured survey.” Another student wrote, “I enjoyed the statements because most
of them are what I think about at times during clinical. The questions were very
applicable to nursing students‟ situations.” A second degree respondent commented,
“Many times when I take this type of survey the questions seem repetitive. I appreciate
that each question focused on a particular and different aspect so that I felt I was giving
new information with each answer. This was a very thoughtful set of questions.”
Several negative comments related to the length of the scale, “This survey was long,
tedious and therefore frustrating…I didn‟t finish it” and “The questions were a bit
„wordy‟. It was a little difficult at the end after reading so many questions.” Other
student comments related to redundancy of items, “I got bored in the middle of the 41
questions because many of them seemed very similar” and “I felt like one question
repeated a lot… something about determining whether or not an intervention was
effective with your patient.”
Six student respondents indicated they believed the format of the scale should
separate the self-confidence and anxiety subscales. For instance, one student wrote: “It
was a little confusing rating confidence and anxiety in the same question. It would have
made more sense to me if they were separated.” Another student commented on design
format, “The format was a little distracting to me. I would have liked each question to
start with the content of the question, since they all started the same.”

121
Interestingly, 12 student comments did not relate at all to the NASC-CDM scale.
Instead, these comments recounted other factors which influence their level of self-
confidence or anxiety in the clinical practicum setting. These comments are discussed in
chapter five.
Results from the Main-Testing Phase
Similar to the pilot-testing phase of the study, 27 nursing programs were randomly
assigned and invited to participate in the main-testing phase of the study. The main-
testing phase was conducted to test and accrue validation for the revised version of the
NASC-CDM scale. The IRB from each eligible institution was contacted and inquires
were made about requirements for approval to recruit undergraduate nursing students to
voluntarily complete an anonymous online survey package. Information was submitted
accordingly.
Nursing Program Participation
Randomly assigned institutions for the main-testing phase included 13 baccalaureate
degree and 14 associate degree nursing programs. However, the final number of nursing
programs was comprised of eight baccalaureate degree and six associate degree
programs. One nursing program was excluded from the main-testing phase of the study,
prior to seeking IRB approval, because it was determined to be an LPN to RN transition
program only. The same three factors influenced the final number of nursing programs
that participated in the main-testing phase as the pilot-testing phase: IRB approval,
Dean/Director approval, and faculty-contact willingness to participate. One additional

122
factor influenced the final number of nursing programs: student contact by external
researcher policy.
After submission and repeated follow-up by the researcher over a period of six
months, the IRB offices from two institutions did not respond to the researcher regarding
the submitted IRB application and packet of supporting documents. The remaining 24
institutions either granted IRB approval for the recruitment of nursing students or noted
they had no formal IRB process. If no formal IRB process was in place, the researcher
worked directly with nursing to secure permission and willingness to participate.
The second factor that influenced the final number of nursing programs in the main-
testing phase was a lack of response from several Dean/Directors of eligible nursing
programs. After four attempts to contact each Dean/Director over a period of six months,
nonresponders from five programs were eliminated from the study. The remaining 19
nursing administrators provided names and contact information of faculty who
coordinated the final two clinical courses in the curriculum. These faculty members were
contacted by the researcher about their willingness to assist with data collection.
Faculty unwillingness to assist with data collection was the third issue that influenced
the final number of nursing programs participating in the main-testing phase. After
several attempts to contact faculty whose names were provided by their Deans/Directors,
nonresponders from three programs were eliminated from the study. Of the remaining 16
nursing programs, two noted they would not allow external researchers to contact
students. The remaining 14 nursing programs were included in the study. Table 9
outlines the total number of nursing programs that agreed to participate in the main-
testing phase of the study.

123
Table 9. Nursing Programs Agreeing to Participate, Main
State Baccalaureate
Degree
Associate
Degree
Potential Student
Numbers
Delaware 1 1 154
Maryland 1 3 298
New Jersey (None)
Pennsylvania 6 2 823
Totals 8 6 1,275
Faculty-contacts who responded affirmatively about their willingness to participate
were sent an IRB approved letter via email which outlined the intent of the study and
informed faculty members of their role with data collection. Throughout the spring 2011
semester the researcher worked closely with faculty-contacts about the feasibility of
campus visits, the deployment of the survey link, forwarding email reminders, and
reminding students to participate in the study.
Nursing Student Participation and Survey Response Rate
During the spring 2011 semester, attempts were made to visit as many eligible
nursing classes as possible. Campus visits were completed to discuss the intent of the
study, invite student participation, answer questions, and improve response rate (Gable &
Wolf, 1993). Once permission from nursing departments was secured, the researcher
made 20 visits to eligible nursing classes from 12 programs. A procedure similar to the
one utilized during the fall 2010 semester was used to invite student participation and
deploy the survey package. Students were never contacted individually via email. All
email correspondence was completed through the use of faculty-contacts at each nursing
program. No data were collected during visits to campuses. Reminder emails were sent
in a fashion similar to those sent during the pilot-testing phase.

124
A total of 1,275 students from 14 nursing programs were invited to participate in the
main-testing phase. The survey closed on May 6, 2011 at 5:00 p.m. Survey data were
then downloaded from Survey Monkey (https://www.surveymonkey.com) into a
spreadsheet software package. A total of 313 students completed the survey package.
Response rate for the main phase was 24.5% which exceeded the estimated 20% response
rate. Because of the criterion to exclude LPNs from the study, 38 surveys completed by
nursing students licensed as LPNs were removed from the dataset immediately upon
download from the survey platform. This resulted in 275 remaining surveys.
The Missing Values Analysis (MVA) software (SPSS, 2008) was again used to
determine patterns of missing data within the dataset. The amount of missing data was
calculated as 9.3%. Results indicated data were missing not at random (MNAR);
therefore, imputations and estimated value replacements were not utilized (Tabachnick &
Fidell, 2007). Data were MNAR for several reasons. Sixteen respondents completed
only the demographic questions within the survey package. Another seven respondents
completed demographic questions and the GAD-7 scale but completed no additional
items within the survey package. Yet another 10 respondents completed demographic
questions as well as items on the GAD-7 and GSE scales but did not complete any item
on the NASC-CDM scale. Data from these 33 respondents were excluded from data
analysis.
Additionally, minimal sporadic amounts of data values were missing across variables
which were replaced with the modal value for that item. Total scores on the scales were
normally distributed and thus, the mean, median, and mode were similar values.
Statistical experts note value replacement strategies should occur only when very small

125
amounts of data are missing (Tabachnick & Fidell, 2007). A number of respondents,
either inadvertently or intentionally, did not complete one or several items within the
survey package. The use of modal replacement for missing values replaced less than 1%
of survey package data. The number of suitable surveys used for data analysis was 242.
Sample Characteristics
A sample of 275 undergraduate nursing students in one of their final two clinical
nursing courses completed the 32-item revised version of the NASC-CDM scale during
the spring 2011 semester. The sample was comprised of pre-licensure undergraduate
baccalaureate (BSN) and associate (ADN) degree nursing students from three states in
the northeastern portion of the United States. Thirty-three students did not complete the
entire survey package while 242 students completed the full survey package.
Descriptive statistics were used to examine the characteristics of those students who
completed the full survey package and those who did not. A total of 168 (69.4%) BSN
students and 74 (30.6%) ADN students completed the survey package. The mean age of
participants who completed the survey was 25.19 + 5.67 with a range from 19 to 45
years. More than one half of participants (60.7%) fell between 21 and 23 years of age.
Eight (3.3%) survey completers were greater than 45 years of age. See Appendix X for
characteristics and comparisons of the main-sample completers and noncompleters.
Parametric and nonparametric statistics were used to compare students who
completed the survey package with those who did not to see if the groups were inherently
different. The Shapiro-Wilk test for normality of age for those who completed the full
survey package was statistically significant, and both skewness and kurtosis exceeded + 1
(Munro, 2005); thus indicating a violation of normality. Age was assumed to be

126
normally distributed for the noncompleters as skewness and kurtosis did not exceed + 1.
Table 10 indicates assessment of the normality assumption for age.
Table 10. Assessment of Normality for Age, Main
Groupa Shapiro-Wilk Skewness Kurtosis
Complete Surveys
(n = 221)
.76(221), p < .001 1.62 1.68
Incomplete Surveys
(n = 29)
.77(29), p < .001 .98 -.62
a, System-missing = 13. This analysis does not include those > 45 years.
Use of the nonparametric Mann-Whitney U test was appropriate for the comparison
of age between groups because of a violation of normality. The use of Fisher‟s exact test,
likelihood ratio, and chi-square for independence were utilized appropriately (Huck,
2004; Munro, 2005). Results of the comparison indicated that completers and
noncompleters were not statistically different from one another.
Despite capitalization modifications from fall to spring semester, the researcher again
speculated respondents misunderstood several demographic questions. Responses varied
widely for the question relating to the current nursing semester in which students were
enrolled. Similar to responses from the fall 2010 sample, it was believed a number of
student respondents interpreted the question to mean the TOTAL semesters of college in
which they were enrolled, instead of the current NURSING semester in which they were
enrolled. Therefore, the practicality of these results is questionable.
The final two sociodemographic questions asked students about the difficulty level
and course letter grade of the current clinical nursing course(s) in which they were

127
enrolled. The nonparametric Spearman rho correlation was used to examine the
correlation of course difficulty with course grade (see Appendix X). The Spearman rho
was appropriate because the relationship between two rank-order variables was examined
(Munro, 2005). Several statistically significant findings were revealed. Despite
capitalization modifications from fall to spring semester, the researcher again believed
that instead of indicating the level of difficulty and letter grade for the current CLINICAL
NURSING COURSE in which the students were enrolled, students indicated the
difficulty and grade of each CLINICAL ROTATION within one course. Thus, the
practical significance of these findings is questionable. Results from the analysis of these
data were not used for further analysis.
Measures of central tendency and variability were calculated for composite scores on
the subscales of the NASC-CDM, the General Perceived Self-Efficacy (GSE), and the
Generalized Anxiety Disorder-7 (GAD-7) scales for the main sample. Table 11
summarizes these results. Interpretations of these findings are discussed in chapter five.
Table 11. Results of Composite Scores for Four Scales, Main
Scale Name
Number
of Items
Response
Option
Scoring
Range
Mean Score,
(SD) a
NASC-CDM, Self-
Confidence
(n = 242)
32 6-point Likert 32 - 192 126.88 (+ 27.40)
NASC-CDM, Anxiety
(n = 242)
32 6-point Likert 32 - 192 78.48 (+ 23.01)
GSE
(n = 242)
10 4-point Likert 10 – 40 31.70 (+ 3.48)
GAD-7
(n = 241)
7 4-point Likert 0 - 21 8.13 (+ 5.31)
a, SD = standard deviation

128
Results Related to the Research Questions
The purpose of the main-testing phase of the study was to test the revised version of
the NASC-CDM scale and continue the establishment of psychometric properties by
using a second sample of pre-licensure undergraduate nursing students. This section
examines data analysis results used to answer the three research questions which framed
the methodology of the study (see page 42). Data from 242 student respondents who
completed the full revised survey package during the spring 2011 semester were included
in analyses.
Normality and Linearity Assumptions
Preliminary analyses of composite scores on the revised NASC-CDM, Self-
Confidence (NASC-CDM, SC) subscale scores, the NASC-CDM, Anxiety (NASC-CDM,
A) subscale scores, the GSE scale total scores, and the GAD-7 scale total scores were
completed to test the assumptions of normality and linearity. Univariate outliers were
identified by examining histogram and boxplot graphs: Outlier values were replaced with
the largest data value which was not an outlier (Munro, 2005; Tabachnick & Fidell,
2007). Although several results of the Shapiro-Wilk test for normality were statistically
significant, indicating a violation of normality, both skewness and kurtosis did not exceed
+ 1. Based on these results, data were assumed to be normally distributed. Table 12
summarizes assessment of normality after values for univariate outliers were replaced.

129
Table 12. Assessment of Normality for Total Scores on Scales, Main
Scale Name Shapiro-Wilk Skewness Kurtosis Initial Outliers
NASC-CDM, SC
(n = 242)
.93(242), p = .22 .06 -.42 0
NASC-CDM, A
(n = 242)
.99(242), p = .04 .24 -.35 3
GSE (n = 242) .98(242), p < .001 -.01 -.08 7
GAD-7 (n = 241) .94(241), p < .001 .70 -.27 0
The assumption of linearity was assessed using scatterplots (Munro, 2005; Pallant,
2007). A scatterplot was created for scores on the NASC-CDM, SC with scores on the
GSE scale. Examination of the swarm indicated a strong linear relationship between
variables. Another scatterplot was created for scores on the NASC-CDM, A with scores
on the GAD-7 scale. Although results did not reveal a tight swarm pattern, no evidence
of a curvilinear relationship was seen between variables. Hence, linearity of data was
assumed. The following three sections address each of the research questions.
NASC-CDM Scale as a Valid Measurement Tool
The first research question addressed in the study was: Do the self-confidence and
anxiety subscales of the NASC-CDM scale provide a valid measure of undergraduate
nursing students‟ perceptions of self-confidence and anxiety levels during the process of
CDM?
Exploratory factor analysis (EFA) and item analysis were conducted to continue the
assessment of construct validity for the subscales of the 32-item revised NASC-CDM
scale. EFA procedures were again run separately for each NASC-CDM subscale, self-

130
confidence and anxiety. Results of EFA techniques, using data from the second sample,
allowed the researcher to reduce items as necessary.
A number of statistical assumptions were considered prior to the initial EFA
procedure. The continuous composite scores on the NASC-CDM, SC and NASC-CDM,
A subscales were deemed interval level data for the purpose of data analysis (Gall et al.,
2007; Polit & Beck, 2008). Preliminary analyses of the dataset were conducted to test the
assumptions of normality and linearity. Based on assessments of normality from the
section above, data were assumed to be normally distributed. Linearity was assessed
through visual inspection of the normal probability plots (P-P plots) and scatterplots
within the residual statistics of the linear regression model output. Several random spot-
checks of the scatterplots of two items on the subscales were also assessed for linearity.
Residual normal P-P plots revealed a reasonably straight line while scatterplots
resembled rectangular shapes (Tabachnick & Fidell, 2007). No curvilinear relationships
were found.
There were 32 items on the revised version of the NASC-CDM scale; therefore the
inter-item correlation analyses created a 32 by 32 correlation matrix for scores on each
subscale. Inter-item correlations were reviewed to visualize substantial relationships, .30
and above (Munro, 2005; Rust & Golombok, 2009), and to ensure the suitability of data
for factor analytic procedures. Based on results of item analysis, no items were reduced
prior to factor analysis initiation.
Multivariate outliers were identified using linear regression analysis and locating the
maximum value for Mahalanobis distance from the residual statistics (Pallant, 2007;
Tabachnick & Fidell, 2007). The maximum value for Mahalanobis distance (p = .001)

131
for the NASC-CDM, SC subscale was 86.28 (critical value = 59.70(32), n = 242).
Nineteen cases exceeded the critical value for Mahalanobis distance and were excluded
from EFA runs for the self-confidence subscale. The maximum value for Mahalanobis
distance for the NASC-CDM, A subscale was 86.75 (critical value = 59.70(32), n = 242).
Twenty-seven cases exceeded the critical value for Mahalanobis distance and were
excluded from EFA runs for the anxiety subscale. The final number of cases used in
factor analysis runs for the self-confidence and anxiety subscales was 223 and 215
respectively.
Sufficient sample size was assumed at between six and ten subjects per 32 items on
the revised NASC-CDM scale, which is consistent with scale development and factor
analytic experts (Comrey, 1978; Gable & Wolf, 1993; Sapnas & Zeller, 2002). The
subject number to item number ratio equaled 7.56 if the complete dataset of 242
participants had been used for EFA procedures. After exclusion of multivariate outlier
cases the subject number to item number ratio for the self-confidence and anxiety
subscales was 6.96 and 6.72 respectively.
The Kaiser-Meyer-Olkin (KMO) measure of sampling adequacy and Bartlett‟s test of
sphericity examine the suitability of data for factor analysis (Comrey & Lee, 1992).
Table 13 reveals results of the KMO and Bartlett‟s tests for the self-confidence and
anxiety subscales of the revised NASC-CDM scale. Results indicated data were
appropriate for factor analytic procedures.

132
Table 13. KMO and Bartlett’s Test Results, Main
Scale Name KMO Measure of
Sampling Adequacy a
Bartlett’s Test of
Sphericity b
NASC-CDM, SC .97 df 496, p < .001
NASC-CDM, A
.97
df 496, p < .001
a, Should exceed .60
b, Should reach significance, p < .05
For constancy and ease of comparison, EFA procedures were run for the second
sample (spring 2011) similar to those used with the first sample (fall 2010). To further
maintain ease of comparison of results between the first and second samples, items on the
revised NASC-CDM scale were not renumbered after the reduction of nine items from
the pilot version of the scale. For instance, Q13 from the pilot version remained Q13 on
the revised version despite the removal of Q8 and Q12 from the pilot version. Principal
component analysis (PCA) with varimax rotation was used for the initial factor analysis
run for both subscales (Comrey & Lee, 1992; Tabachnick & Fidell, 2007). Using
Kaiser‟s criterion (Kaiser, 1958), three factors for the NASC-CDM, SC and the NASC-
CDM, A subscale achieved eigenvalues exceeding 1.
Visual inspection of the scree plots (Cattell, 1966) indicated a metaphoric elbow
between factors three and four for both subscales. These findings further confirmed a
three factor solution explaining 69.51% of the total variance for the NASC-CDM, SC and
a three factor solution explaining 63.39% of the total variance for the NASC-CDM, A.
See Appendix Y and Appendix Z for results of Kaiser‟s criterion and variance explained
for the subscales.

133
Factor loadings were examined using the rotated component matrices on the PCA
with varimax rotation output. Factor plots were examined. Numerous secondary
loadings and multiple loadings were seen among the 32 items. These results were similar
to those found with the first sample of students from the fall 2010 semester. Because of
the considerable overlap among factor loadings, because of intermingled points on the
factor plots, and because items concerning the iterative process of decision making are
associated, items within the factor solutions were determined to be related.
Alpha factoring with promax rotation was used for the subsequent factor analysis run
in order to maintain consistency between data analysis from the first and second samples
(Comrey, 1978; Tabachnick & Fidell, 2007). Analysis from the second run using alpha
factoring with promax rotation revealed findings similar to the initial run using PCA with
varimax rotation. Three factors were extracted for the self-confidence subscale as well as
the anxiety subscale. Factor loadings from the pattern matrices were used to interpret the
meaning of factors because they represent unique variance of items (Comrey & Lee,
1992). See Appendix Y and Appendix Z for alpha factoring with promax rotation results
for the subscales.
Items remained identical on both subscales of the revised NASC-CDM scale because
the intent is to measure students‟ levels of self-confidence and anxiety during the process
of clinical decision making. The decision to have items remain the same on both
subscales was similar to that used during analysis of data from the first sample. Criteria
for item review in the main-testing phase remained consistent with the criteria for item
review in the pilot-testing phase. These criteria included: inter-item correlations of < .30

134
and > .70, secondary factor loadings, and factor loadings of < .40 (DeVellis, 2003; Gable
& Wolf, 1993; Waltz et al., 2005).
Five items were reduced from the revised version of the NASC-CDM scale based on
item analysis and factor analysis results. No items were modified or rephrased. The five
items reduced from the revised NASC-CDM scale and the rationale for their reduction
follow. I am ___ self-confident and ___ anxious in by ability to…
Q1: Listen carefully to what the client tells me about his or her health problem (No
problems with item analysis, no loading on anxiety subscale, and minimal loading on
self-confidence subscale).
Q2: Make the FINAL decision after information is gathered, analyzed, and possible
interventions are evaluated (No problems with item analysis, secondary loading on
anxiety subscale, and substantial loading on self-confidence subscale). Analysis of this
item from the fall 2010 sample revealed weak secondary loadings on both subscales.
Q6: Detect when verbal and nonverbal cues from the patient don‟t match (Correlation of
> .70 with one item, substantial loading on anxiety subscale, and no loading on self-
confidence subscale).
Q27: Draw on my own past clinical experiences to help interpret information about the
client‟s current problem (No problems with item analysis, secondary loading on anxiety
subscale, and no loading on self-confidence subscale). This item did not overlap between
factor structures among subscales during data analysis from the fall 2010 sample.
Q40: Perform additional system-assessments to gather more information about the
client‟s current problem (No problems with item analysis, no loading on anxiety subscale,
and no loading on self-confidence subscale).

135
Secondary loadings of two items occurred on the self-confidence subscale. Q36
loaded on factor III at .512 and on factor I at .403 while Q38 loaded on factor III at .565
and on factor I at .405. Based on the content of these items, each was placed with similar
items into factor I. Q36 loaded substantially on factor I during data analysis from the fall
2010 sample. Secondary loading of one item was found on the anxiety subscale. Q31
loaded at .489 on factor III and at .404 on factor II. Based on its content, Q31 was placed
with similar items into factor II. Q31 loaded substantially on factor III on the self-
confidence subscale. For this reason, Q31 was placed with related items in factor II on
the anxiety subscale.
Three factors were extracted for the self-confidence subscale explaining 16.40%,
16.55%, and 15.97% of variance respectively. Three factors were extracted for the
anxiety subscale explaining 14.77%, 14.28% and 13.07% of variance respectively.
Factor correlation matrices results revealed correlation coefficients of > .40 on both
subscales indicating interrelatedness among factors (Pallant, 2007). See Appendix Y and
Appendix Z for factor correlation matrices. There was considerable overlap of item
loadings onto factors of the self-confidence and anxiety subscales. This was not
surprising given the complex and iterative process of clinical decision making. See
Appendix AA for overlapping items among subscales.
The final step of factor analytic procedures is labeling factors. The researcher
reviewed and labeled factors based on the content of items which comprised each factor
(Munro, 2005). Because the factor structures of the two subscales were similar, they
were given similar labels. The factor structure for the anxiety subscale from the first and
second samples remained the same; thus, factor labels remained the same. The factor

136
structure for the self-confidence subscale from the first sample revealed a four factor
solution and the factor structure for the second sample revealed a three factor solution.
Results of EFA for the NASC-CDM, SC subscale revealed factors I and IV with the first
sample combined to be factor I with the second sample. A panel of five doctorally
prepared nurse educators to review factor analysis results was not necessary during the
main-testing phase given the similarity of factor structures from fall 2010 to spring 2011.
The three factors of the self-confidence and anxiety subscales were labeled: (I) using
resources to gather information and listening fully, (II) knowing and acting, and (III)
using information to see the big picture.
Results of item analysis and factor analytic procedures answered research question
one affirmatively during the main phase. Stable factor solutions were confirmed for the
self-confidence and anxiety subscales of the revised NASC-CDM scale. Items contained
within these factors for the subscales revealed considerable overlap, indicating their
interrelatedness. EFA results were similar based on data from the fall 2010 and spring
2011 samples. These outcomes demonstrated positive continued establishment of
construct validation of the newly designed scale.
Convergent Validity of the NASC-CDM Scale
The second research question was designed to reassess convergent validity of the
NASC-CDM scale. This research question asked: Do the self-confidence and anxiety
subscales of the NASC-CDM scale relate satisfactorily with two established reliable and
valid quantitative instruments measuring generalized self-efficacy and generalized
anxiety?

137
The Pearson product moment correlation coefficient (r) was used to examine the
relationship between students‟ perceived self-confidence during clinical decision making
and general self-efficacy. These constructs were operationalized by the revised NASC-
CDM, SC subscale and the GSE scale respectively. Additionally, Pearson r was utilized
to appraise the relationship between students‟ perceived anxiety during clinical decision
making and generalized anxiety. These constructs were operationalized by the revised
NASC-CDM, A subscale and the GAD-7 scale respectively. The continuous composite
scores for all scales were deemed interval level for the purpose of data analysis.
Preliminary analyses of these data were completed to ensure no violation of the
assumptions of normality, linearity, and homoscedasticity (DeVon et al., 2007; Munro,
2005). The analysis of normality and linearity are addressed in an earlier section of this
chapter. Normality and linearity were assumed. The assumption of homoscedasticity
was assessed by examining the swarm of the scatterplots, as well as by using a linear
regression model and examining the residual plot for rectangular shape and a lack of
obvious funneling. No violations were found.
Pearson r correlation computations were completed for the second sample data from
the main-testing phase using pairwise exclusion. There was a statistically significant,
moderate positive correlation between the variables NASC-CDM, SC and GSE (r = .62,
p < .001, n = 242), indicating a stronger relationship than was found with the first sample
in fall 2010 (r = .54). There was a statistically significant, low positive correlation
between the variables NASC-CDM, A and GAD-7 (r = .38, p < .001, n = 241), indicating
a weaker relationship than was found with the first sample in fall 2010 (r = .52). Internal
consistency reliability coefficients for the GSE and GAD-7 scales were examined for the

138
second sample (GSE, α = .84, n = 242 and GAD-7, α = .91, n = 241) and were found to
be similar to those computed with the first sample.
Results revealed the convergent validity was similar to the findings for the fall 2010
sample with the self-confidence subscale. Findings for the correlation between the
anxiety subscale and the GAD-7 scale were lower than those found with the fall 2010
sample, although still statistically significant and positive. Instrument development
experts note a positive correlation in the range of .50, when considering convergent
validity, as acceptable for a newly designed scale (Gable & Wolf, 1993; Waltz et al.,
2005).
Additionally, Pearson product moment correlation coefficient (r) with pairwise
exclusion was computed to examine the relationship between scores on the revised
NASC-CDM, SC and NASC-CDM, A subscales from the second sample. Preliminary
analyses of these data were completed to ensure no violation of the assumptions of
normality, linearity, and homoscedasticity (DeVon et al., 2007; Munro, 2005). No
violations were found.
There was a statistically significant, high negative correlation between the variables
NASC-CDM, SC and NASC-CDM, A (r = -.75, p < .001, n = 242), indicating a stronger
negative relationship than was found during the pilot phase of the study (r = -.67).
Results indicated those undergraduate nursing students with higher levels of self-
confidence during the process of CDM had lower levels of anxiety during the process and
vice versa.

139
NASC-CDM Scale as a Reliable Measurement Tool
The third research question evaluated in this study was: Do the self-confidence and
anxiety subscales of the NASC-CDM scale provide a reliable measure of undergraduate
nursing students‟ perceptions of self-confidence and anxiety levels during the process of
CDM?
Similar to the pilot phase of the study, Cronbach‟s alpha internal consistency
reliability coefficient (Cronbach, 1951) was used to compute the reliability for the self-
confidence and anxiety subscales of the revised NASC-CDM scale. Examination of the
item-total statistics for both subscales revealed no substantial influence on alpha if any
item was deleted. Scale development experts note an alpha of .70 is acceptable for a
newly designed affective scale (DeVellis, 2003; Rust & Golombok, 2009). See
Appendix BB for reliability results for the revised version of the scale and for the rerun of
reliability after the reduction of five items from the main sample.
In a procedure similar to the one used during the pilot phase of the study, items with
inter-item correlations of < .20 or > .70 were reviewed. Inter-item correlations of < .20
may signify a lack of relationship with other items on the scale while inter-item
correlations of > .70 may suggest content redundancy (Gable & Wolf, 1993; Munro,
2005; Waltz et al., 2005). The mean inter-item correlation for the subscales of the
revised version and final version of the NASC-CDM scale did not exceed .70 but several
inter-item dyads did top .70 and thus, were reviewed for content redundancy. No inter-
item dyad correlation fell below .20.
Results of this analysis answered research question three affirmatively. Reliability
coefficients for both subscales of the revised NASC-CDM scale were satisfactory

140
(DeVellis, 2003). Cronbach‟s alpha and item-analysis results were similar between the
first and second samples. These findings provide evidentiary support for the internal
consistency or stability of the NASC-CDM scale.
Predictions using Multiple Linear Regression
Standard multiple linear regression analysis (SMLR) was used to examine the
predictive relationship of several demographic variables (independent or predictor
variables) with composite scores on the revised NASC-CDM, SC and NASC-CDM, A
subscales (dependent or outcome variables). Demographic questions used for SMLR in
the main-testing phase were similar to those used in the pilot-testing phase in order to
facilitate ease of comparison. These included age, gender, program type, program
format, employment as a nursing assistant, prior college experience, and participation in
an externship program.
Preliminary analyses, using independent samples t-tests, were conducted on
dichotomous independent variables to reveal significant differences of mean scores
(Munro, 2005) on the self-confidence and anxiety subscales. Variables with
nonsignificant t-test results, indicating no differences between the groups, were excluded
from regression analysis.
The independent variable, age, was statistically transformed using logarithm
transformation in light of its highly positive skew and leptokurtic appearance (Munro,
2005; Tabachnick & Fidell, 2007). Despite improvement after statistical transformation
these data remained nonnormal (Shapiro-Wilk = .79(221), p < .001; skewness = 1.34; and
kurtosis = .69). Nine outliers were replaced with the highest value which was not an
outlier with no improvement in normality (Shapiro-Wilk = .79(221), p < .001; skewness

141
= 1.24; and kurtosis = .30). Original age data were subsequently recoded in a
dichotomous variable for use in SMLR analysis (Tabachnick & Fidell, 2007).
Independent samples t-tests were conducted separately to compare mean scores for
each of the revised NASC-CDM subscales for several variables: age (18 to 31 years or 32
to > 45 years), gender (male or female), program type (associate or baccalaureate),
participation in an externship program (yes or no), and current employment as a nursing
assistant (yes or no). The question related to participation in an externship program
included a third response option, I am not familiar with this type of program; however,
only three of 242 respondents who fully completed the survey package chose this option.
These three cases were excluded from the t-test analysis for this variable. Nonsignificant
Levene tests for each variable, except one, assumed equal variance. Equal variance was
not assumed for the demographic question for both subscales related to participation in an
extern program; thus, the appropriate t-test statistic was reported. See Appendix CC for
t-test results.
Independent samples t-test results from the second sample were similar to those from
the first sample with two exceptions. First, t-test results for males and females indicated
no significant difference in mean scores for both subscales of the revised NASC-CDM
scale. Hence, gender was not included as an independent variable in SMLR analysis.
Second, there was a significant difference in mean self-confidence and anxiety scores for
students who participated in externship programs and students who did not. Because of
these results, externship participation was included in SMLR runs.
Three independent variables were included in regression analysis using pairwise
exclusion. Variables included were format of program (measured as accelerated,

142
evening/weekend, traditional, and year-round), amount of prior college experience
(measured as none, 1 to 2 semesters, 3 to 4 semesters, greater than 4 semesters, and
completion of a college degree) and participation in an extern program (measured as yes
or no). Nominal and ordinal level independent variables were recoded into DUMMY
variables for interpretability in regression analyses. Evaluation of assumptions (Munro,
2005; Pallant, 2007; Tabachnick & Fidell, 2007) was completed related to each subscale
independently prior to the final SMLR analysis.
Adequate sample size was assumed with approximately 230 student respondents for
each subscale. Data did not violate the multicollinearity assumption, as no correlations
exceeded .70, no tolerance was less than .10, and no variance inflation factor (VIF)
exceeded 2. Normality of total scores was previously examined and did not violate this
assumption. Additionally, normality and linearity of data were assumed by reviewing the
regression standardized residual plots. Normal P-P plots for both subscales indicated a
reasonably straight line. Scatterplot swarms revealed randomness, with no discernible
patterns of concern. Examination of residual scatterplots revealed no obvious funneling;
thus, homogeneity of variance or homoscedasticity was assumed.
Mahalanobis distance (p < .001) was used from the residual statistics to determine
multivariate outliers. For the self-confidence subscale, 12 cases exceeded the critical
value of 26.12 with a maximum value of 53.56. For the anxiety subscale, 11 cases
exceeded the critical value or 26.12 with a maximum value of 53.16 for the anxiety
subscale. These 12 and 11 cases respectively were excluded from subsequent regression
runs. Nonsignificant results of the Durbin-Watson statistic (2.06 for the self-confidence

143
subscale and 1.98 for the anxiety subscale) indicated no violation of the assumption
independence of errors.
Results of early SMLR runs indicated, for the question about amount of college
experience, that the recoded variable for 3 to 4 semesters of college prior to beginning a
nursing program (New for prior college2) appeared to contribute significantly to the
regression model. New for prior college2 was therefore included in subsequent SMLR
runs. The recoded variable for the completion of a college degree (New for prior
college4) was also included in subsequent SMLR runs because of its contribution to the
regression model during the pilot phase of the study and in order to make adequate
comparisons between the first and second samples. Participation in an extern program
appeared to contribute to the regression model and thus was included in subsequent runs.
During early runs, format of program did not contribute to the regression model; this
variable was not included in subsequent runs.
Results of SMLR revealed no statistical significance in the overall regression model
for the self-confidence subscale and minimal statistical significance in the overall
regression model for the anxiety subscale. ANOVA tables for the NASC-CDM, SC
subscale indicated, F(3, 223) = 1.65, p = .18 and for the NASC-CDM, A subscale
revealed, F(3, 225) = 2.64, p = .05.
R2 for both subscales confirmed the regression model (including participation in
extern program, New for prior college2, and New for prior college4) explained only 2.2%
and 3.4% of the variance in total scores on the self-confidence and anxiety subscales
respectively. Evaluation of the Beta standardized coefficients revealed the amount each
independent variable contributed to the model. Beta coefficients indicated participation

144
in an extern program was the largest contributor to the overall regression model.
Nonetheless, these findings were not statistically significant for the NASC-CDM, SC
subscale and were barely statistically significant for the NASC-CDM, A subscale. See
Table 14 for the coefficients table results.
Table 14. Results of Coefficients Table for Standard Multiple Regression Analysis,
Main
Scale Name Independent Variable Beta t Significance, p
NASC-CDM, SC
(n = 229)
Participate in extern
program
New for prior college2
New for prior college4
.12
-.08
.01
1.82
-1.21
.06
.07
.23
.95
NASC-CDM, A
(n = 231)
Participate in extern
program
New for prior college2
New for prior college4
-.13
.94
-.08
-2.04
1.38
-1.15
.04a
.17
.25
a, Statistically significant contribution to the regression model.
Because participation in an extern program contributed most to the regression model,
SMLR was rerun for each subscale including only this independent variable. Results
indicated no statistical significance of the overall model for the self-confidence or the
anxiety subscales. Self-confidence: F(1, 226) = 3.34, p = .07; R2 = 1.4% total variance
explained; Beta coefficient = .12, t = 1.83, p = .07. Anxiety: F(1, 228) = 3.51, p = .06; R2
= 1.5% total variance explained; Beta coefficient = -.12, t = -1.87, p = .06.

145
Chapter Summary
This chapter discussed the results of data analysis conducted during the pilot- and
main-testing phases of the study. Participation by nursing programs was examined.
Characteristics of the first sample (fall 2010 semester) and second sample (spring 2011
semester) of pre-licensure undergraduate nursing students who completed the survey
package were described. Students in the first sample completed the 41-item pilot version
of the NASC-CDM scale while students in the second sample completed the 32-item
revised version of the NASC-CDM scale. Data analysis results were explained in a
manner that answered the three research questions which framed the methodology of the
study. Statistical analyses revealed consistent findings between the first and second
samples for the newly designed 6-point Likert, self-report NASC-CDM scale. The final
chapter discusses the findings of the study as well as strengths and limitations and
explains conclusions and recommendations.

146
CHAPTER 5
SUMMARY, CONCLUSIONS, AND RECOMMENDATIONS
The purpose of this investigation was to develop, test, and validate a quantitative self-
report, Likert-type scale that measures nursing students‟ perception of their levels of self-
confidence and anxiety during the process of clinical decision making (CDM). Items on
the scale entitled the Nursing Anxiety and Self-Confidence with Clinical Decision
Making (NASC-CDM) scale were generated using deductive inquiry. After extensive
literature review, the pilot version of the NASC-CDM scale contained 41 items and two
subscales within four content domains. These subscales relate to two emotional barriers
which influence the process of CDM in novice nurses: self-confidence and anxiety
(Haffer & Raingruber, 1998; O'Neill et al., 2005). In order to test the scale and begin the
establishment of psychometric properties, data were gathered from two samples of pre-
licensure undergraduate nursing students. The purpose of this chapter is to interpret the
results of the study, discuss strengths and limitations, provide conclusions, and propose
recommendations.
There are six sections within the chapter. Section one discusses results of the
findings of the study. Similarities and differences between the two samples with regard
to sociodemographic questions are explained. Conclusions related to validity testing,
reliability assessment, and ancillary findings are explicated. Section two addresses the
relationship between results of the study and the two conceptual frameworks which
undergirded the inquiry. The third and fourth sections discuss strengths and limitations
of the study. Section five reviews implications for nursing education and nursing
practice. The final section examines recommendations for further research.

147
Discussion of Study Results
Characteristics of Samples
A convenience sampling framework was used for this study. The first sample (fall
2010) was drawn from a population of pre-licensure nursing students from six
baccalaureate and six associate degree programs from the northeastern portion of the
United States. The second sample (spring 2011) was recruited from the same population
and included students from eight baccalaureate and six associate degree programs.
Students in the second sample were recruited from the same geographic area as the first
but were from different nursing programs.
A number of student respondents, during both phases, did not complete the full
survey package and were excluded from data analytic procedures. However,
comparisons were made between survey completers and noncompleters to examine
intrinsic differences on sociodemographic variables. Results of these comparisons for
each sample are presented in chapter four.
Comparisons were also completed to evaluate the homogeneity of students who
comprised the first and second samples. Despite having been drawn from the same
population, the first and second samples were not statistically equivalent on nearly every
sociodemographic variable. See Appendix DD for characteristics and comparisons of the
pilot and main samples. A total of 545 student respondents among two groups were
compared on eight sociodemographic variables. Only two variables, gender and
ethnicity, did not reveal statistically significant findings.
Differences between groups were as follows. Nursing students in the second sample
were younger than students in the first sample. Approximately 60% of students from the

148
second sample were between the ages of 21 and 23 years. Interestingly, the percentage of
students enrolled in ADN versus BSN programs was reversed between the first and
second samples. The first sample consisted of 63.4% ADN students and 36.6% BSN
students while the second sample consisted of 30.6% ADN students and 69.4% BSN
students. Program format also revealed significant results. Ninety percent of students in
the second sample attended traditional, two semesters per academic year programs while
only 46% of those in the first sample attended traditional programs.
Overall, results of comparisons between the first and second samples revealed
heterogeneous groups. The majority of students in the first sample were older, attended
ADN programs in traditional, accelerated or evening/weekend format, completed more
than four semesters of college or completed a college degree before beginning their
nursing program, did not work as a nursing assistant, and did not participate in an extern
program. Conversely, the majority of students in the second sample was younger,
attended BSN programs in traditional format, and completed little to no semesters of
college before beginning their nursing program. The majority did not participate in an
extern program. One half of student respondents in the second sample worked as a
nursing assistant; one half did not.
In order to assess the representativeness of the study samples with the overall nursing
student population, national statistics on sociodemographic variables were reviewed.
Among pre-licensure nursing programs (ADN and BSN) approximately 87% of students
are female and 13% of students are male (National League for Nursing, 2011).
Descriptive statistics for both study samples for gender revealed approximately 93% were
female and 7% were male. Approximate frequencies of ethnicity among pre-licensure

149
nursing students are described as: 74% Caucasian, 12% African American, 8% Hispanic,
6% Asian, and 1% American Indian (Kaufman, 2011; National League for Nursing,
2011). Both study samples were similar to the national statistics for ethnicity with
Caucasian frequencies being somewhat higher and Hispanic and African American
frequencies being somewhat lower.
Sixty percent of pre-licensure students in the United States graduate from ADN
programs while 37% graduate from BSN programs (National League for Nursing, 2011).
Percentages from the fall 2010 sample were consistent with these national statistics.
Seventy percent of students enrolled in BSN programs are < 25 years of age while only
26% of students enrolled in ADN programs are < 25 years of age. Only 14% of students
enrolled in BSN programs are > 31 years of age while 49% of students enrolled in ADN
programs are > 31 years of age (National League for Nursing, 2011). Descriptive
statistics from both study samples were consistent with these frequencies.
Speculations were made about the heterogeneity of groups. Data collection
procedures were identical during both phases of the study to maintain consistency.
Classrooms visits for the purpose of student recruitment were completed equally between
ADN and BSN programs during the fall 2010 and spring 2011 semesters. Perhaps
faculty-contacts within the baccalaureate programs during the spring 2011 semester were
more invested in participation; hence, encouraging more student involvement. Given that
BSN but not ADN students are required to study the research process (American
Association of Colleges of Nursing, 2008; National League for Nursing, 2008), both BSN
students and faculty may have embraced more fully participation in a dissertation
research study. The potential higher amount of commitment to the research study amid

150
traditional baccalaureate nursing faculty during the spring semester may have accounted
for the higher numbers of younger students with less prior college experience.
The lack of homogeneous groups did not discernibly influence results between the
pilot-testing and main-testing phases. Data analysis results regarding scale validity, scale
reliability, and linear regression were comparable from fall 2010 to spring 2011. The
lack of homogeneity may have in fact strengthened findings of the study and enhanced
generalizability.
Conclusions of Validity Testing
Two research questions addressed the examination of the validity of the two NASC-
CDM subscales. Construct validity was examined through the use of EFA and
convergent validity. To maintain consistency and promote ease of comparison, similar
data analysis procedures were used during the pilot- and main-testing phases.
Exploratory Factor Analysis Results
The original set of items on the NASC-CDM scale was derived from the possible
universe of content within the domain of CDM (Gable & Wolf, 1993). Items were
subjected to critical review by an internationally known panel of CDM experts to ensure
the scale was content valid. Forty-one items, within four content domains, comprised the
pilot version of the scale. Although it was recognized the process of CDM is an iterative
one, the content domains were named in sequential fashion from the acquisition of cues,
through consideration of decision options, through intervention, and finally to reflection.
Investigating information and cues was the first content domain. This domain
contained items related to acquisition of cues, collecting data, listening, knowing the
patient, observing nonverbal cues, and using intuition (Baxter & Boblin, 2008; Elstein et

151
al., 1972; Rew, 2000; Tschikota, 1993). The pilot version contained nine items within
this domain: Q1, Q8, Q14, Q15, Q22, Q28, Q35, Q37, and Q40.
Interpreting information and meanings was the second content domain. This domain
contained items related to interpreting the meaning of cues, attending to the relevancy of
information, and using knowledge from past experiences (Banning, 2008; Benner, 2001;
Elstein et al., 1978; Girot, 2000). The pilot version contained ten items within this
domain: Q4, Q6, Q7, Q10, Q17, Q18, Q24, Q25, Q26, and Q27.
Integrating findings and illuminating options was the third content domain of CDM.
Items which comprised this domain related to analyzing the full clinical picture,
considering decision options, examining the risk-benefit ratios of decision options, and
utilizing resources (Baxter & Rideout, 2006; O'Neill et al., 2006; A. H. White, 2003).
The pilot version contained twelve items within this domain: Q3, Q5, Q13, Q16, Q20,
Q29, Q31, Q32, Q33, Q34, Q38, and Q39.
Intervening and reflecting on the decision process was the final content domain.
Items included in this domain related to taking action upon decision options being
considered, evaluating outcomes, and being accountable for the actions taken (Bakalis,
2006; Jenkins, 1985a; Standing, 2007). The pilot version contained ten items within this
domain: Q2, Q9, Q11, Q12, Q19, Q21, Q23, Q30, Q36, and Q41.
The EFA results from the first sample data revealed a stable factor solution for both
NASC-CDM subscales. The four factors of the self-confidence subscale were labeled: (I)
using resources to gather information, (II) using information to see the big picture, (III)
knowing and acting, and (IV) listening fully. The three factors of the anxiety subscale
were labeled: (I) using resources to gather information and listening fully, (II) knowing

152
and acting, and (III) using information to see the big picture. Because EFA resulted in
more than one factor, the scale is referred to as multidimensional (Comrey et al., 2000).
Nine items were reduced from the scale based on EFA results from the first sample.
The reduced items ranged across each of the four content domains: Q8, Q28, and Q 37
were deleted from the first content domain; Q25 and Q26 were removed from the second
content domain; Q33 was removed from the third content domain; and Q12, Q21, and
Q41 were reduced from the fourth content domain. Rationale for the reduction of these
items is presented in chapter four.
The EFA results from the second sample data revealed a stable three factor solution
for both NASC-CDM subscales. Factor structures remained consistent between the first
and second samples with the exception of factors I and IV for the NASC-CDM, SC
subscale. These two factors merged with the second sample. Factor labels remained
consistent between the pilot-testing and main-testing phases. Final factor labels were: (I)
using resources to gather information and listening fully, (II) knowing and acting, and
(III) using information to see the big picture.
Five items were reduced from the scale based on EFA results from the second
sample. Items reduced ranged across three of four content domains: Q1 and Q 40 were
deleted from the first content domain; Q6 and Q27 were removed from the second
content domain; and Q2 was reduced from the fourth content domain. No items were
removed from the third content domain on the revised version of the NASC-CDM scale.
Rationale for the reduction of these items is presented in chapter four.
A primary tenet of factor analytic procedures notes factor structures are revealed
when like items group together. Items should correlate strongly with similar ones and

153
weakly with those that are dissimilar. Because of this principle, the resultant factors
emerged as thematic rather than sequential (Comrey, 1988; Munro, 2005). Three stable
factors (themes or dimensions) were established from the EFA results, indicating the
NASC-CDM scale was multidimensional.
Items on the NASC-CDM subscales did not remain in their content domains once the
multidimensional factor structures were achieved. Content domains were created based
upon the sequence of the CDM process, not by theme (Banning, 2008; Elstein et al.,
1972; Thiele et al., 1991). Factor analytic experts note stable factor structures are not
linear but dimensional (Comrey et al., 2000; DeVellis, 2003). Hence, the incongruence
between content domain structure and factor structure was not entirely unexpected. See
Appendix EE for the overlap of factor structures and content domains for the pilot and
main sample.
During the design of the study it was determined items should remain identical on
both subscales of the NASC-CDM scale. This strategy maintains the intent of measuring
levels of self-confidence and anxiety during the process of CDM. For easier
interpretation and consistency, items should be placed within only one dimension. After
thorough review of the final 27 items on the NASC-CDM scale, 22 items revealed
substantial loadings onto the three dimensions between the first and second sample. Five
items; however, warranted further review. These items are discussed.
Each statement on the NASC-CDM scale begins with, I am ___ self-confident and
___ anxious in my ability to… The declarative portions of the statements are noted
below. Information about factor loadings with samples and rationale about item
placement in a factor is provided.

154
Q9: Implement the „best‟ priority decision option for the client‟s problem. This item
revealed secondary loadings on the „knowing and acting‟ and „using information to see
the big picture‟ factors of the self-confidence subscale and loaded substantially on the
„knowing and acting‟ factor of the anxiety subscale with the first sample. It loaded
substantially on the „using information to see the big picture‟ factor of the self-confidence
subscale but loaded on the „knowing and acting‟ factor of the anxiety subscale with the
second sample. The decision was made to retain the item because of its strong theoretical
importance to prioritization of decision options (Jenkins, 1985a; Tschikota, 1993). Based
on its content, the item was placed most appropriately in the „knowing and acting‟ factor
(II).
Q23: INDEPENDENTLY make a clinical decision to solve a client‟s problem. This item
loaded very strongly on the „knowing and acting‟ factor for both subscales with the first
sample. With the second sample, it loaded on the „knowing and acting‟ factor of the
anxiety subscale but loaded on the „using information to see the big picture‟ factor of the
self-confidence subscale. Question 23 was ultimately placed in the „knowing and acting‟
factor (II) because of its inherent affinity to the action component of the CDM process
(Baxter & Boblin, 2008).
Q29: Correlate physical assessment findings with the client‟s nonverbal cues to see if
they match or don‟t match. This item achieved the smallest loadings on the „knowing
and acting‟ factor of the self-confidence subscale with both samples. It loaded
substantially on the „using resources to gather information and listening fully‟ factor of
the anxiety subscale with both samples. Because the item loaded substantially on the

155
„using resources to gather information and listening fully‟ factor, and based on its content
(Tanner, 2006; A. H. White, 2003), it was placed within this factor structure (I).
Q31: Use my knowledge of diagnostic tests, like lab results or x-ray findings, to help
create a possible list of decisions I could implement. This item loaded substantially on
the „using information to see the big picture‟ factor of both subscales with the first
sample. With the second sample, it loaded substantially on the „knowing and acting‟
factor of the self-confidence subscale but revealed secondary loadings between the „using
information to see the big picture‟ factor and the „knowing and acting‟ factor of the
anxiety subscale. Based on the content of the item (Brooks & Shepherd, 1990; Standing,
2007), it was placed with similar items within the „knowing and acting‟ factor (II).
Q38: Incorporate personal things I know about the client in order to make decisions in
his or her best interest. This item loaded substantially on the „knowing and acting‟ factor
of the self-confidence subscale with the first sample. On the anxiety subscale with the
first sample and on both subscales with the second sample, the item loaded strongly on
the „using resources to gather information and listening fully‟ factor. Because the item
infers using the client as a resource as well as listening to what the client says (Rew,
2000; A. H. White, 2003), this item was placed in the „using resources to gather
information and listening fully‟ factor (I).
Despite heterogeneity among the two samples used to test the NASC-CDM scale,
these differences did not demonstrably impact EFA results. Statistical results were in fact
strikingly similar. Comparable EFA results between two heterogeneous samples and
stable factor solutions during both fall 2010 and spring 2011 semesters provided
evidentiary support the NASC-CDM subscales are construct valid (Comrey et al., 2000).

156
Convergent Validity Results
The examination of relationships between the two subscales of the NASC-CDM scale
and two established psychometrically sound scales addressed convergent validity. Scores
on the NASC-CDM, SC were correlated with scores on the GSE scale. Scores on the
NASC-CDM, A were correlated with scores on the GAD-7 scale. Pearson r correlation
coefficients were computed.
The researcher anticipated a positive correlation of > .50 between the NASC-CDM
subscales and their respective established scale. When considering convergent validity, a
positive correlation in the range of .50 is respectable for a newly designed scale (Gable &
Wolf, 1993; Waltz et al., 2005). It is recognized the level of statistical significance is
influenced by sample size (Huck, 2004; Polit & Beck, 2008).
Results of these computations revealed a stronger, more positive correlation between
the NASC-CDM, SC subscale and GSE scale from the first to the second sample, with
the Pearson r exceeding the goal of > .50. Students with higher amounts of self-
confidence on the NASC-CDM, SC subscale showed higher levels of general self-
confidence on the GSE scale. This was an anticipated finding and provided evidence to
support the convergent validity of the self-confidence subscale.
Pearson r computations to assess the relationship between the NASC-CDM, A and
GAD-7 scale revealed a weaker, less positive correlation from the first to the second
sample, with the Pearson r falling short of the > .50 goal. While the decline in correlation
was not substantial (from approximately .50 to approximately .40) it was not anticipated.
The Pearson r was; nonetheless, statistically significant and correlations did flow in a
positive direction. It is acknowledged that statistical significance is influenced by sample

157
size. Further, statistical significance does not necessarily infer meaningfulness (Munro,
2005; Polit & Beck, 2008). This lower correlation was an unexpected finding and
provided incomplete support for the convergent validity of the anxiety subscale.
Reasons for the decline in the correlation between the NASC-CDM, A subscale and
GAD-7 scale were considered. Examination of mean scores on the NASC-CDM, A
subscale and GAD-7 scale indicated several facts. Mean scores on the GAD-7 scale
remained consistent between the fall and spring samples (approximately 9 + 5.5 to 8 +
5.3 respectively). Mean scores on the NASC-CDM, A subscale declined between the fall
and spring samples (approximately 83 + 25.4 to 78 + 23.1 respectively). Mean scores
were recalculated during the pilot phase after the nine items were reduced. This
recalculation allowed for easier comparisons between the first and second sample. There
was no appreciable change in the high alpha coefficient for reliability on either subscale
after the removal of nine items from the pilot version of the scale. Such findings
suggested lower mean scores on the NASC-CDM, A subscale were the explanation for
the lower Pearson r value.
Attempts were made to maintain constant study conditions and diminish variability
between the two samples. For instance, students were recruited from the final two
clinical courses during both pilot and main phases of the study. Student respondents in
both phases were enrolled in ADN and BSN programs. Clinical content to which
students were exposed remained reasonably consistent between the fall and spring
samples. Despite attempts at constancy, variability did occur. Several explanations were
considered for findings related to lower anxiety subscale scores for the spring sample.
158
First, age frequently influences anxiety (Titov et al., 2009). Often, existing
instruments are normed or standardized for age; as was the case with the GAD-7 scale
during validation and standardization studies. Statistically significant differences were
found among categorical age groups with participants in the general population. Ages
ranged from 14 to > 75 years. The investigators acknowledged this result as an expected
association (Löwe et al., 2008). Examination of results from the independent samples t-
test in this dissertation research indicated no difference in mean scores on the NASC-
CDM, A subscale between younger (age 18 – 31) and older (age 32 - > 45) students.
Therefore, age may not have influenced lower anxiety scores for the spring sample.
Second, higher numbers of BSN students in the second sample may have influenced
NASC-CDM, A subscale scores. If BSN students were less anxious than ADN students,
mean scores during the spring 2011 semester would have been lower. Examination of
independent samples t-test results indicated BSN students actually scored higher on the
NASC-CDM, A subscale than did their ADN counterparts. Therefore, higher numbers of
BSN students were not likely an influence on lower anxiety scores during the spring 2011
semester.
Third, the nine items reduced from the pilot version may have been items causing
students appreciably more anxiety. Thus when these items were reduced, mean scores
would have decreased. These nine items were reviewed. Their content was not believed
to have substantially impacted the change in mean scores from fall to spring.
Fourth, response set bias may have influenced results with the first or second sample.
Student respondents during the fall 2010 semester may have inflated their responses
regarding anxiety or during the spring 2011 semester minimized their perception of

159
anxiety. Respondents may have provided what they believed were socially acceptable
answers (Rust & Golombok, 2009). Response bias is believed to be a plausible influence
on mean anxiety scores and thus, an influence on the lower Pearson r correlation
coefficient from fall 2010 to spring 2011.
One final reason was considered for differences in anxiety subscale scores from the
first to the second sample. True differences in levels of anxiety related to the process of
CDM may have influenced scores. Student respondents in both samples were enrolled in
one of their final two clinical courses and clinical content within those courses was
similar. In spite of this consistency, students during the fall semester perceived higher
levels of anxiety with CDM than did students during the spring semester.
Conclusions of Reliability Testing
One research question addressed the assessment of reliability of the two NASC-CDM
subscales. To maintain consistency and promote ease of comparison, similar data
analysis procedures were used during the pilot- and main-testing phases of the study.
The alpha coefficient was used to assess the reliability of the NASC-CDM subscales.
Scale development experts note an alpha of .70 is acceptable for a newly designed
affective scale (DeVellis, 2003; Rust & Golombok, 2009).
The alpha coefficients met psychometric criteria for newly designed instruments.
High alpha coefficients for both subscales indicated variance in scores was attributed to
the measurement of true score and not the measurement of error (DeVellis, 2003; Rust &
Golombok, 2009). Such findings lend support to a high degree of internal consistency
and suggest the NASC-CDM subscales do in fact measure the constructs of self-
confidence and anxiety during the process of CDM.
160
It is acknowledged that higher numbers of items on a scale, alpha factoring usage, and
large sample size generally result in higher reliability coefficients (Gable & Wolf, 1993;
Tabachnick & Fidell, 2007). Therefore, because the revised version and final version of
the NASC-CDM scale contained 32 and 27 items, because alpha factoring was the factor
extraction method utilized, and because sample numbers were 303 (fall) and 242 (spring),
the alpha reliability coefficient was likely inflated. No appreciable change in alpha was
noted if any item was deleted. This finding may be a function of the fairly large numbers
of items on the NASC-CDM scale and large sample size.
Ancillary Findings
Independent Samples t-test Results
Prior to standard multiple linear regression (SMLR) analysis, independent samples t-
tests were conducted using dichotomous sociodemographic variables and mean scores on
the NASC-CDM subscales to evaluate group differences. Several interesting findings are
discussed. Student data from the second sample revealed those employed as nursing
assistants had higher levels of self-confidence during the process of CDM than those not
employed as nursing assistants. Though not statistically significant, data from the first
and second samples revealed students employed as nursing assistants consistently
indicated lower levels of anxiety during the process of CDM than those not employed as
nursing assistants.
Data from the first and second samples indicated student respondents who
participated in extern programs perceived higher levels of self-confidence and lower
levels of anxiety during the process of CDM than those who did not participate in extern
programs. These results were not statistically significant for the fall 2010 sample but

161
were statistically significant for the spring 2011 sample. Moreover, mean scores on the
self-confidence subscale (fall 2010 and spring 2011) were higher for those who
participated in extern programs than for those employed as nursing assistants. Mean
scores on the anxiety subscale (spring 2011) were lower for those participating in extern
programs than for those employed as nursing assistants.
Presumptions were made about these findings. Results of the study provide evidence
to support the advantage of nursing students working as nursing assistants and
participating in extern programs. Based on comparisons between groups, findings
revealed employment as a nursing assistant was beneficial to students‟ perception of their
levels of self-confidence and anxiety while making clinical decisions. Further,
involvement in an extern program was even more beneficial to the enhancement of self-
confidence and reduction of anxiety among nursing student respondents. These findings
are consistent with current literature related to student extern program outcomes
(Redding & Flatley, 2003; Ruth-Sahd, Beck, & McCall, 2010).
A primary tenet of student nurse extern programs is externs work to emulate the
registered nurse (RN) role instead of functioning in a nursing assistant capacity. Student
nurse externs have opportunities to collaborate with RN preceptors, discuss decision
making, and practice this burgeoning skill (Cantrell & Browne, 2005; Ruth-Sahd et al.,
2010). Nursing assistants, on the other hand, may not have opportunities to engage in
clinical decision making. Nursing programs and clinical practice arenas would be well-
served to collaborate and institute quality nursing assistant and extern programs for
student nurses. It appears the NASC-CDM scale would be useful as a tool to measure

162
levels of self-confidence and anxiety during the process of CDM in nursing students
employed as nursing assistants and those involved in student extern programs.
Multiple Linear Regression Results
During data analysis from the first and second samples, SMLR was used to determine
if several sociodemographic variables demonstrated predictive value in explaining scores
on the NASC-CDM subscales (Tabachnick & Fidell, 2007). Four independent variables
with strong theoretical relationships to self-confidence, anxiety, and CDM were included
in the analysis from the first sample: gender, age, program format, and amount of college
experience prior to beginning a nursing program. Although results revealed the
completion of a college degree prior to entering a nursing program contributed most
substantially to the regression model, no significant predictive ability was found among
the variables included and self-confidence and anxiety scores.
Three independent variables with theoretical relationships to the constructs of the
study were included in the analysis from the second sample: program format, amount of
college experience prior to beginning a nursing program, and participation in an extern
program. Results indicated participation in an extern program contributed most
considerably to the regression model but was not statistically significant as a predictor of
self-confidence scores. This predictor variable was barely significant to predict anxiety
scores. SMLR analysis was rerun to include only participation in an extern program as
the predictor variable; it had no predictive value toward scores on either NASC-CDM
subscale.
Sociodemographic questions were considered thoughtfully during the design of the
study. An unanticipated finding was that no sociodemographic variable was meaningful

163
in predicting scores on the subscales of the NASC-CDM scale. Consequently,
sociodemography did not carry the predictive weight that was presumed with regard to
students‟ perceptions of their levels of self-confidence and anxiety while making clinical
decisions.
Because no quantitative instrument exists which measures constructs similar to those
of the NASC-CDM scale, comparison of the SMLR findings with current literature was
difficult. Hoffman et al. (2004) concluded age was not a predictor of the number of
clinical decisions make by nurses. Ruth-Sahd et al. (2010) concluded self-confidence
was enhanced in student nurses who participated in an extern program.
Open-Ended Question about NASC-CDM Scale
During the pilot-testing phase, student respondents were asked one open-ended
question along with five closed-ended questions to assist the researcher with refinement
of the scale. Interestingly, 12 student comments did not relate at all to the NASC-CDM
scale but rather recounted other factors which influence their level of self-confidence or
anxiety in the clinical practicum setting. Such factors as number of clinical hours,
clinical experiences, overall nursing student stress, fatigue, and faculty member behavior
resounded strongly in the comments.
Several notable quotes are included here. One student commented, “[My] clinical
instructor is easy to approach but there are clinical instructors that make the student freak
out and not want to ask questions for fear of being chastised.” Another wrote, “In my
experience, and in some of my classmates, the biggest factor that contributed to anxiety
in the clinical setting was contingent on who the instructor was.” “I would have liked to
have seen questions on how fatigued, stressed SNs [student nurses] are going into the

164
clinical site…this really has affected my ability for recall, applying new knowledge, and
overall performance. This decreases my self-confidence and increases my anxiety
tenfold!”
The importance of these comments must be acknowledged. The NASC-CDM scale is
intended to measure students‟ perceptions of their levels of self-confidence and anxiety
during the process of CDM. Despite this fact, student respondents felt compelled to
include comments about factors which affect their overall level of self-confidence or
anxiety in the clinical setting. Such remarks speak loudly about influences on students‟
emotional state during clinical practicum experiences. Comments presented by student
respondents in this study resonate similarly to factors which influence overall self-
confidence and anxiety among nursing students in the clinical practicum environment
(Baxter & Rideout, 2006; Haffer & Raingruber, 1998; Kushnir, 1986; Moscaritolo,
2009).
Relationship with Conceptual Frameworks
Two conceptual frameworks undergirded the development, testing, and validation of
the NASC-CDM scale. One social learning theory (Bandura, 1977b, 1997) and two
embedded theoretical nursing models (O'Neill et al., 2004a; O'Neill et al., 2005) provided
the theoretical foundation for this methodological inquiry. Both frameworks related
strongly to the constructs inherent to the study.
Congruent themes of fear, stress, anxiety, and a lack of self-confidence related to
CDM are prevalent in the literature (Baxter & Rideout, 2006; O'Neill et al., 2004a;
Standing, 2007). Rigorous lines of research cannot conclude undeniably whether lesser

165
amounts of anxiety promote self-confidence or whether higher amounts of self-
confidence curb anxiety. Various authors argue each is the case. Despite this debate, the
reality is that emotional barriers (self-confidence and anxiety) strongly affect novice
clinicians (Haffer & Raingruber, 1998; O'Neill et al., 2006; K. A. White, 2009). In this
section, results of the study and their relationship to the two conceptual frameworks are
presents. Conclusions are inferred.
Social Cognitive Theory
The first theory which framed the study was social cognitive theory (SCT). There are
numerous complex components of SCT. Those most similar with the intent of this study
are self-reinforcement, self-efficacy, and emotional arousal (Bandura, 1986; Bandura et
al., 1977). See Figure 1 on page 30 for a graphic depiction of these principles. Bandura
(1977a) explains four sources of self-efficacy: performance accomplishments, vicarious
experience, verbal persuasion, and emotional arousal (anxiety). Control over emotional
and visceral arousal is a vital precept of SCT. Research studies validate there is
reciprocity between the constructs self-confidence and emotional arousal (Bandura et al.,
1988; Mellalieu et al., 2006; Ozer & Bandura, 1990).
Results of the study revealed an inverse relationship between students‟ perceived
levels of self-confidence and anxiety during the process of CDM. Scores on both
subscales during the pilot phase had a possible range from 41 to 246. The pilot version of
the scale contained 41 items. Student respondents scored an average 161.42 + 36.73 on
the self-confidence subscale and an average 106.24 + 32.72 on the anxiety subscale.
Similar results were found during the main phase of the study. The revised version
contained 32 items with a possible scoring range of 32 to 192. Student respondents

166
scored an average 126.88 + 27.40 on the self-confidence subscale and an average 78.48 +
23.01 on the anxiety subscale.
The result that students perceived higher levels of self-confidence and lower levels of
anxiety during the process of CDM was an unanticipated finding. CDM literature related
to novice practitioners supports the opposite is true (Bakalis & Watson, 2005; O'Neill et
al., 2005; Standing, 2007). An expected finding; however, was scores on the NASC-
CDM, SC and NASC-CDM, A subscales revealed an inverse relationship. There was a
statistically significant, moderate to strong negative correlation for both samples between
the scores on the NASC-CDM, SC and NASC-CDM, A subscales. The correlation
finding is consistent with research literature.
It is difficult to determine whether student respondents‟ levels of confidence
diminished their anxiety or whether their ability to control anxiety elevated their
confidence. Because the intent of this study was to test, validate, and establish
psychometric properties of the newly designed NASC-CDM scale, the researcher did not
nominate a specific patient problem on which students based their responses. It is
recognized if student responses were determined around a particular real-life or simulated
patient situation, perceptions of the levels of self-confidence and anxiety may differ.
Conclusions about these findings are discussed more fully in the section related to the
embedded nursing models.
Clinical Decision Making and Novice Clinical Reasoning Models
The second framework foundational to the study was two embedded nursing models
related to CDM. The purpose of the clinical decision making model (CDMM) is to
illustrate the multidimensional CDM process of experienced nurses. Steps of the CDMM
167
include: data gathering, risk-benefit assessment, hypothesis generation, hypothesis
selection, and nursing action. Important to this model is the concept of working
knowledge; the body of knowledge gained from textbooks and experiences. Novice
clinicians have limited working knowledge. An embedded model, partnered with the
CDMM, is the novice clinical reasoning model (NCRM). This model identifies variables
that influence the development of working knowledge in novice nurses. A lack of self-
confidence and high anxiety are cited as two emotional barriers that influence the process
of CDM in inexperienced clinicians (O'Neill et al., 2006; O'Neill et al., 2005).
Despite literature that supports diminished levels of self-confidence and increased
levels of anxiety in nursing students during the CDM process (Lauri et al., 2001; Tanner,
2006; A. H. White, 2003) results of the study did not confirm this claim. Explanations
for the unanticipated results were considered. First, students who find themselves in
clinical practicum settings which are safe and nurturing may be more willing to practice
the skill of CDM. More practice subsequently improves self-confidence and lessens
anxiety (Baxter & Rideout, 2006; Jenkins, 1983; K. A. White, 2009). Student
respondents in the study may have perceived their clinical settings as safe and nurturing.
For this reason, they would rate their levels of self-confidence higher and their levels of
anxiety lower.
Second, numerous authors cite the utilization of resources to assist with CDM as
paramount for the novice nurse. Student respondents may have utilized a variety of
resources in the clinical setting and therefore, perceived higher levels of self-confidence
and lower levels of anxiety while making clinical decisions. Utilization of resources

168
include: nursing staff (Baxter & Boblin, 2008), nursing faculty members (Seldomridge,
1997), or evidence-based literature (Lauri & Salantera, 2002).
Third, more clinical experiences with real-life patient encounters enhance students‟
opportunities to work through the process of CDM. Overwhelmingly, experts in the area
of CDM posit experience is vital to foster self-confidence and reduce anxiety arousal
(Bakalis, 2006; Banning, 2008; Benner, 2001; O'Neill et al., 2004b). Students in this
study were recruited from the final two clinical semesters of the curriculum and thus,
may have experienced enough real-life patient encounters to have bolstered their self-
confidence levels and diminished their anxiety levels. It is recognized students in
beginning nursing courses may have responded differently to items on the NASC-CDM
scale. Because the purpose of the study was instrument development, a specific patient
experience for which students base their responses was not enlisted. Student respondents
were asked to think about their experiences with CDM over the current semester.
Students in the pilot phase of the study were asked for feedback to help refine the
NASC-CDM scale. One particular comment epitomized that novice practitioners often
lack working knowledge. The student wrote: “As a novice nurse and having little
experience, I thought about each question asked and re-framed it in my mind as; „With
my current knowledge, I am ___ confident…‟ The truth is that without real nursing
experience the knowledge I have is most certainly lacking.”
Strengths of the Study
Experts in the area of instrument development posit quantitative assessment tools
should be “reliable, valid, standardized, and free from bias” (Rust & Golombok, 2009, p.

169
5). In order to accomplish these goals, it is imperative methodological studies conducted
to test newly designed instruments have strong rational scientific designs. Careful
consideration was given to study design to strengthen its procedures and enhance its
findings.
The inclusion of strategies to improve response rate is noted as a strength of the
study. Response rates for online surveys tend to be lower than when administered face-
to-face (Cantrell & Lupinacci, 2007; Wright & Schwager, 2008). For this reason, the
researcher intentionally built-in several ways to enhance numbers of respondents.
Adequate numbers of respondents were vital for multivariate data analysis procedures
and to maximize the potential for stable factor solutions during EFA (Comrey, 1978;
Polit & Beck, 2008). A response rate of 20% was estimated for both the first and second
samples. Actual response rates for the first sample (fall 2010) and the second sample
(spring 2011) were 30.6% and 24.5% respectively.
Strategies used to improve response rate are discussed. First, the researcher visited
34 eligible nursing classes over the course of two semesters to recruit student
participation. Second, all students received the initial survey invitation as well as two
follow-up reminders, each were verbal and written. Third, the online survey platform
used in the study is completely anonymous which may have positively influenced
students‟ willingness to participate. Fourth, a strong rapport was built with faculty-
contacts during both semesters of data collection. A strong rapport may have enhanced
faculty members‟ willingness to participate fully. These faculty members may have
encouraged greater student involvement. Many faculty-contacts discussed with their

170
students that engagement in nursing research is not only essential to their professional
growth but also builds the body of nursing knowledge.
Another strength was the use of randomization when feasible. Gall et al. (2007)
argue the use of random assignment is a quality technique to ensure equivalence and thus,
strengthens study design. Methods used for randomization are discussed. First, all
nursing program names were drawn randomly from slips of paper placed in a hat to
determine their inclusion into either the pilot-testing or main-testing phase. Second, the
three scales (NASC-CDM, GSE, and GAD-7) were selected randomly to determine their
placement within one of three versions of the survey package. Versions of the survey
package were identical except the three scales were placed in different orders. Third, at
the time of survey deployment to a nursing program one of three versions of the survey
package was drawn randomly. The chosen version of the survey package was deployed
to all students in that nursing program.
Maintaining constancy of conditions was also a strength of the study. Polit and Beck
(2008) note a lack of constancy increases extraneous variations and diminishes the
strength of a study. Because data collection occurred with two samples over the course
of two academic semesters, the researcher utilized identical methodological procedures.
For instance, contact with course faculty, student recruitment, survey deployment, and
survey reminding was completed in similar fashion for both pilot-testing and main-testing
phases.
One final strength is related to differences among samples. Although the original
presumption of study design was the fall 2010 and spring 2011 samples would be
homogeneous across sociodemographic variables, this was not the case. The groups were

171
found to be statistically different in a number of ways. Differences among samples are
acknowledged as a strength in light of the similarities of data analysis results despite
dissimilarities of samples. These findings provide evidentiary support for the stability of
the NASC-CDM scale across heterogeneous groups and thus, augment generalizability
and improve external validity (DeVon et al., 2007; Gall et al., 2007).
Limitations of the Study
Though study design, sampling, procedure, measurement instruments, and statistical
analysis were all considered carefully, limitations are inherent in any research study. Due
to study design and inclusion criteria, nonprobability convenience sampling was
necessary. Convenience sampling was used to enhance the likelihood of visiting as many
programs as possible; however, not all eligible nursing classes were visited. That all
eligible classes were not visited is, in itself, a limitation. The convenience sampling
framework created selection bias (Polit & Beck, 2008; Rust & Golombok, 2009) and
must be noted as a limitation of the study.
Additionally, the use of a convenience sampling framework limits the generalizability
of findings (Gall et al., 2007; Polit & Beck, 2008). Nursing programs from four states
within the northeast portion of the United States were invited to participate in the study.
Therefore, findings may not be generalizable to undergraduate nursing students across the
country and abroad. The two samples of pre-licensure nursing students used to test and
validate the NASC-CDM scale were representative of the population of pre-licensure
nursing students from which they were drawn. This similarity may contribute to
enhanced generalizability (Huck, 2004).
172
Another limitation intrinsic to study design is that student respondents voluntarily
completed the survey fully online. Because no contact occurred at the time of survey
completion and because survey completion was completely voluntary, response rates
were appreciably lower than if surveys were completed during face-to-face meeting time
(Wright & Schwager, 2008). Furthermore, participants from the first sample (fall 2010)
who chose to complete the survey package were inherently different in several ways from
those who chose not to participate. Students voluntarily agreed or self-selected their
participation in the study which also must be recognized as a limitation. Therefore,
response and selection biases are cited as limitations of the study.
Other limitations of the study are described. Response set bias occurred if student
respondents provided socially acceptable or extreme response answers to items. Gable
and Wolf (1993) argue if the purpose and intent of the research, as well as practical uses
of study results are explained to respondents and if the study situation is non-threatening,
subjects should answer honestly: The incidence of faking should be low. If student
respondents communicated during the completion of the online survey, contamination
may have been a factor. Measurement error occurs in varying degrees during scientific
inquiry. The NASC-CDM, brief GSE, and brief GAD-7 scales, that contained 41 (pilot
version), 32 (revised version), 10, and 7 items respectively, should have diminished
testing fatigue and thus, diminished measurement error (Gable & Wolf, 1993; Polit &
Beck, 2008).
173
Implications for Nursing Education and Practice
Professional nurses as well as student nurses make numerous clinical decisions on a
daily basis. Most authors concur that CDM is a skill paramount for the professional
nurse to master. Most would also agree it is difficult to learn (Baldwin, 2007; K. K.
Hughes & Young, 1990). Because the skill is cornerstone to professional nursing,
learning the process of CDM must not begin after graduation but must be introduced,
taught, and practiced in the safe confines of pre-licensure nursing programs.
The purpose of the study was the development and validation of a newly designed
self-report Likert-type instrument. As a means to that end, three research questions were
asked and answered. The development of the NASC-CDM scale represents a
quantitative measure from which considerable knowledge can be gained about nursing
students‟ perceptions of their levels of self-confidence and anxiety during the process of
CDM. This section presents implications of study results for nursing education as well as
nursing practice.
The NASC-CDM scale was designed for a number of intended uses. It was
deliberately written in a generic manner to allow for utilization among different program
types, different levels of students within a program, and varied clinical situations. The
scale may be useful to evaluate changes in self-confidence and anxiety with CDM when
used longitudinally across the curriculum. It could be used in a formative or summative
fashion around real-life or simulated patient encounters. The NASC-CDM scale may
also have a potential use in a pre- and post-test design surrounding clinical simulation or
clinical practicum experiences. Although the purpose of the scale relates to these uses,
confirmation of its merit in these situations will come only from its actual usage in these

174
situations. Results of studies which utilize the NASC-CDM scale will indicate its
performance in a variety of situations across a variety of populations.
Most nurse educators would concede at times faculty and student perceptions of
similar events differ. A primary implication for nursing education is nurse educators can
utilize the scale to assess their students‟ perceptions of their levels of self-confidence and
anxiety during the process of CDM. Items which comprise the scale were placed into
three themes or dimensions based on EFA results from two samples. Therefore, nurse
educators have the ability to not only measure self-confidence and anxiety levels broadly
but also examine specifically in what areas students need assistance.
When nurse educators evaluate successfully where students‟ levels of self-confidence
and anxiety lie, they can intervene with appropriate teaching-learning strategies (Itano,
1989). For instance, nurse educators might assess high levels of anxiety across
dimensions as a barrier to students learning the process of CDM. Armed with this
knowledge, teaching-learning strategies could be implemented to ensure a safe, calm
environment (Baxter & Rideout, 2006; Moscaritolo, 2009; O'Neill et al., 2005) where
students can practice the skill. Conversely, nurse educators may conclude low levels of
self-confidence across all three dimensions are the obstacle to learning the process of
CDM. In this case, strategies to foster self-confidence such as positive external
reinforcement (Bandura & Locke, 2003) or the encouragement of positive self-talk
(Mellalieu et al., 2006; Schunk & Pajares, 2005) might be employed.
Items on the NASC-CDM scale were placed within three dimensions based on EFA
results. Nurse educators will have the ability to not only measure students‟ levels of self-
confidence and anxiety with CDM in a broader context but also measure levels specific to

175
one of three dimensions. For example, students may indicate high levels of anxiety
related to several items within the dimension „using information to gather information
and listening fully‟. The items producing high anxiety levels may be: Q14 - use active
listening skills when gathering information about the client‟s current problem, Q35 – ask
the client‟s significant other/family questions to gather information about the current
problem, and Q38 – incorporate personal things I know about the client in order to make
decisions in his or her best interest. Each of these items relates to gathering information
through the use of therapeutic communication and engagement with clients and families.
In this case, the nurse educator might use teaching-learning strategies with the student to
improve communication and listening skills.
One implication is explicated for the use of the NASC-CDM scale within nursing
practice. Nursing students nearing the completion of their programs may perceive higher
levels of self-confidence and lower levels of anxiety during the process of CDM; as
indicated by the results of this inquiry. However, upon commencement of their first
professional nursing position, graduate nurses may again find themselves in affectively
charged novice situations. Levels of self-confidence may fall and levels of anxiety may
rise as graduate nurses realize the substantial accountability which accompanies the CDM
process (Bakalis, 2006; Muir, 2004; Standing, 2007). The NASC-CDM scale could be
utilized by nurse managers or RN preceptors to examine levels of two emotional barriers
across three dimensions related to CDM.

176
Recommendations for Further Research
Empirical inquiry answers posed questions; it also generates new questions. This
methodological study was no exception. Results of the study support the reliability and
validity of the newly designed NASC-CDM scale and have begun the establishment of
sound psychometric properties. Scientific inquiry; however, cannot end here. Two areas
for further research are presented that would continue to build strong psychometrics for
the scale. One area relates to inquiry which would continue validation of the NASC-
CDM scale for advanced assessments of reliability and accruements of validity. The
second area relates to research which would utilize the NASC-CDM scale within nursing
education and practice.
Further Validation of the NASC-CDM Scale
This dissertation research developed and validated a quantitative self-report 6-point
Likert scale that measures students‟ perceptions of their levels of self-confidence and
anxiety during the process of clinical decision making. Two samples of associate and
baccalaureate pre-licensure nursing students from four states within the northeastern
portion of the United States were invited to participate in the study. Scale development
experts agree the use of different samples to test measurement tools adds to the
establishment of psychometric properties (DeVellis, 2003; Switzer et al., 1999).
In order to offer continued support for the reliability and validity of the scale, a third
sample should be used to test the 27-item final version of the NASC-CDM scale. The
researcher recommends the third sample be recruited from a different geographic region
of the United States. Data from the third sample would be analyzed and compared with
results from the first and second samples to assess similarities or differences. Congruent

177
findings would provide further evidence for the psychometric soundness of the NASC-
CDM scale.
A second recommendation is to conduct a research study to ensure the NASC-CDM
scale is discriminant valid. Discriminant validity, a component of construct validity,
purports scales that measure theoretically unrelated constructs should correlate minimally
(DeVellis, 2003; DeVon et al., 2007). Further investigation should explore the
relationship between the constructs measured by the NASC-CDM scale and theoretically
unrelated constructs. For instance, to ensure discriminant validity, composite scores on
the NASC-CDM self-confidence subscale should be correlated with scores on a scale that
measures an similar yet unrelated construct; self-esteem (Davidhizar, 1993; Kröner &
Biermann, 2007). Low nonsignificant correlations would support the self-confidence
subscale does not measure the construct of self-esteem. Correlation between the anxiety
subscale and a similar yet unrelated construct should also be examined.
Research to determine norm-references or standardization of the NASC-CDM scale is
a third recommendation for further inquiry. It is not necessary for all research
instruments to be standardized or norm-referenced; however, such referencing increases
interpretability and meaningfulness of the scale. It must be acknowledged that
standardization is a complicated process and norming sample sizes must be very large in
order to obtain stable results (Gall et al., 2007; Rust & Golombok, 2009). A study should
be completed to establish standard scores for different groups of pre-licensure nursing
students. Norming the NASC-CDM scale would allow nurse educators to compare their
own students‟ scores with like students‟ scores. For example, standardization of scores
could be norm-referenced for different program formats (accelerated, evening/weekend,

178
and traditional), gender, and curricular level (first semester nursing, second semester
nursing, etc.).
Utilization of the NASC-CDM Scale in Nursing Education and Practice
It is recommended a second version of the NASC-CDM scale be developed for
completion by nursing faculty members. Results of the current study revealed students
surprisingly had higher levels of self-confidence and lower levels of anxiety during the
process of CDM. Most experienced nurse educators‟ perception of students‟ levels of
affective influences (self-confidence and anxiety) while making clinical decisions might
not coincide with these findings. Few would argue that at times faculty perception and
student perception of affective influences on clinical experiences differ. A faculty
version of the NASC-CDM scale could be used to compare faculty perception with
student perception related to the same clinical experience. If nursing faculty members are
cognizant of students‟ levels of self-confidence and anxiety during the process of CDM,
they can tailor strategies to facilitate learning most effectively this important skill.
The intent of the NASC-CDM scale‟s design was that nurse educators might use it
with different levels of students, in various settings, and in different clinical situations.
Until the NASC-CDM scale is tested in diverse settings and situations it is unknown how
it will perform. Therefore, another area of further research is that the scale be used in
scientific inquiry across the curriculum, with varied levels of students, in different real-
life and simulated clinical situations. Results of these studies will accrue additional
information about the performance of the scale as well as continue the establishment of
psychometric properties.

179
One final recommendation is made for further research. Based on results from the
regression analysis from the second sample data, participation in an extern program
contributed to scores on the NASC-CDM subscales. Therefore, a suggested research
inquiry is for the nursing practice arena to utilize the scale with student nurse externs.
The NASC-CDM scale could be completed in a pre- and post-program fashion to
measure changes in levels of self-confidence and anxiety during CDM as a result of
participation in the program.
Chapter Summary and Conclusions
This chapter provided a summary of findings related to characteristics of the two
samples, the assessment of reliability, and the accruement of validity. Miscellaneous
results from t-tests and regression analysis were examined. Conclusions were made
between results of the study and the two conceptual frameworks which formed its
foundation. Strengths and limitations were explored. Implications of findings for
nursing education and nursing practice as well as areas for further research were
presented.
The NASC-CDM scale has important potential uses in nursing education as well as
nursing practice. The establishment of sound psychometric properties for any newly
designed quantitative measure is vital to its success. Results of this dissertation research
have initially indicated that the scale is a reliable and valid measure of two emotional
barriers, self-confidence and anxiety, which influence the process of CDM in novice
nurse clinicians.
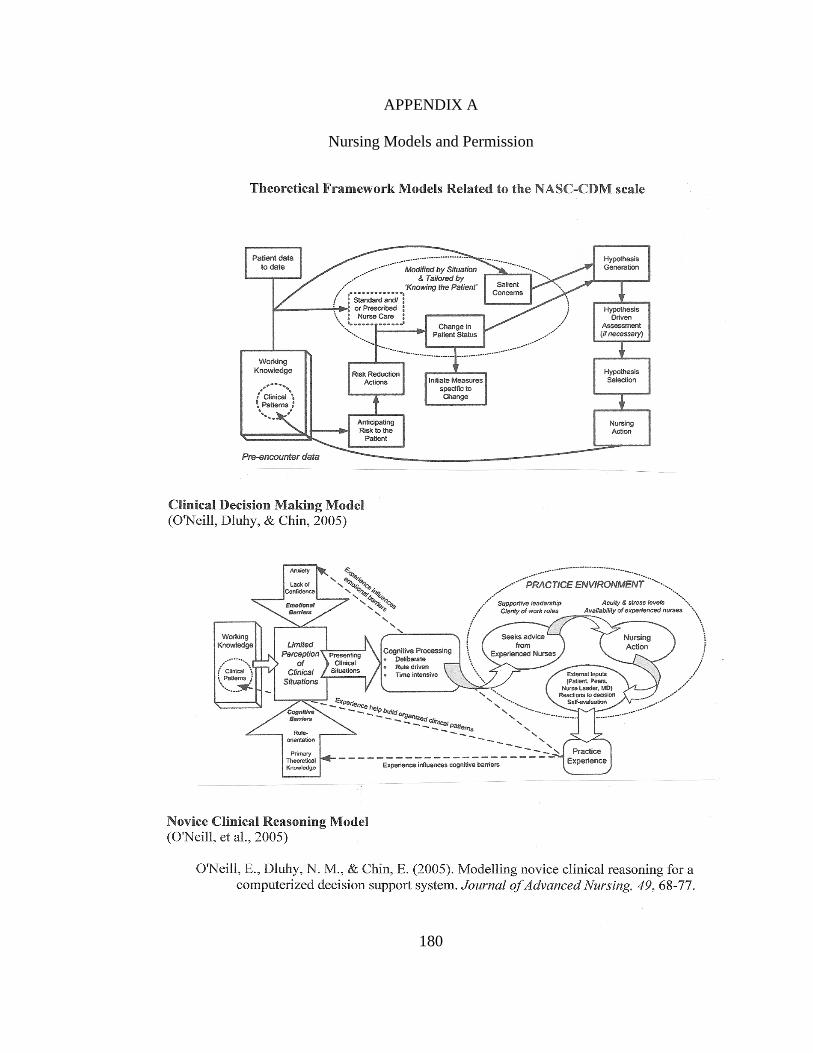
180
APPENDIX A
Nursing Models and Permission

181
Nursing Models Permission
This is a License Agreement between Krista A. White ("You") and John Wiley and Sons
("John Wiley and Sons") provided by Copyright Clearance Center ("CCC"). The license
consists of your order details, the terms and conditions provided by John Wiley and Sons,
and the payment terms and conditions.
All payments must be made in full to CCC. For payment instructions, please see information listed at the bottom of this
form.
License Number 2357760424754
License date Jan 28, 2010
Licensed content publisher John Wiley and Sons
Licensed content publication Journal of Advanced Nursing
Licensed content title Modelling novice clinical reasoning for a computerized decision support system
Licensed content author O'Neill Eileen S., Dluhy Nancy M., Chin Elizabeth
Licensed content date Dec 20, 2004
Start page 68
End page 77
Type of use Dissertation/Thesis
Requestor type Author of this Wiley article
Format Print and electronic
Portion Figure/table
Number of figures/tables 2
Original Wiley figure/table number(s) I would like permission to reprint Figure 1 CDMM on p. 69 and Figure 2 NCRM on p. 70 of this
article.
Will you be translating? No
Order reference number Total 0.00 USD
Terms and Conditions
TERMS AND CONDITIONS
This copyrighted material is owned by or exclusively licensed to John Wiley & Sons, Inc. or one if its group companies (each a “Wiley
Company”) or a society for whom a Wiley Company has exclusive publishing rights in relation to a particular journal (collectively
“WILEY”). By clicking “accept” in connection with completing this licensing transaction, you agree that the following terms and conditions apply to this transaction (along with the billing and payment terms and conditions established by the Copyright Clearance
Center Inc., (“CCC’s Billing and Payment terms and conditions”), at the time that you opened your Rightslink account (these are
available at any time at http://myaccount.copyright.com).
Terms and Conditions
1. The materials you have requested permission to reproduce (the "Materials") are protected by copyright.
2. You are hereby granted a personal, non-exclusive, non-sublicensable, non-transferable, worldwide, limited license to reproduce the
Materials for the purpose specified in the licensing process. This license is for a one-time use only with a maximum distribution equal to
the number that you identified in the licensing process. Any form of republication granted by this licence must be completed within two
years of the date of the grant of this licence (although copies prepared before may be distributed thereafter). Any electronic posting of the Materials is limited to one year from the date permission is granted and is on the condition that a link is placed to the journal
homepage on Wiley’s online journals publication platform at www.interscience.wiley.com. The Materials shall not be used in any other
manner or for any other purpose. Permission is granted subject to an appropriate acknowledgement given to the author, title of the
material/book/journal and the publisher and on the understanding that nowhere in the text is a previously published source
acknowledged for all or part of this Material. Any third party material is expressly excluded from this permission.
3. With respect to the Materials, all rights are reserved. No part of the Materials may be copied, modified, adapted, translated,
reproduced, transferred or distributed, in any form or by any means, and no derivative works may be made based on the Materials
without the prior permission of the respective copyright owner. You may not alter, remove or suppress in any manner any copyright,
trademark or other notices displayed by the Materials. You may not license, rent, sell, loan, lease, pledge, offer as security, transfer or
assign the Materials, or any of the rights granted to you hereunder to any other person.
4. The Materials and all of the intellectual property rights therein shall at all times remain the exclusive property of John Wiley & Sons
Inc or one of its related companies (WILEY) or their respective licensors, and your interest therein is only that of having possession of

182
and the right to reproduce the Materials pursuant to Section 2 herein during the continuance of this Agreement. You agree that you own no right, title or interest in or to the Materials or any of the intellectual property rights therein. You shall have no rights hereunder
other than the license as provided for above in Section 2. No right, license or interest to any trademark, trade name, service mark or
other branding ("Marks") of WILEY or its licensors is granted hereunder, and you agree that you shall not assert any such right, license
or interest with respect thereto.
5. WILEY DOES NOT MAKE ANY WARRANTY OR REPRESENTATION OF ANY KIND TO YOU OR ANY THIRD PARTY, EXPRESS, IMPLIED OR
STATUTORY, WITH RESPECT TO THE MATERIALS OR THE ACCURACY OF ANY INFORMATION CONTAINED IN THE MATERIALS,
INCLUDING, WITHOUT LIMITATION, ANY IMPLIED WARRANTY OF MERCHANTABILITY, ACCURACY, SATISFACTORY QUALITY, FITNESS
FOR A PARTICULAR PURPOSE, USABILITY, INTEGRATION OR NON-INFRINGEMENT AND ALL SUCH WARRANTIES ARE HEREBY
EXCLUDED BY WILEY AND WAIVED BY YOU.
6. WILEY shall have the right to terminate this Agreement immediately upon breach of this Agreement by you.
7. You shall indemnify, defend and hold harmless WILEY, its directors, officers, agents and employees, from and against any actual or
threatened claims, demands, causes of action or proceedings arising from any breach of this Agreement by you.
8. IN NO EVENT SHALL WILEY BE LIABLE TO YOU OR ANY OTHER PARTY OR ANY OTHER PERSON OR ENTITY FOR ANY SPECIAL, CONSEQUENTIAL, INCIDENTAL, INDIRECT, EXEMPLARY OR PUNITIVE DAMAGES, HOWEVER CAUSED, ARISING OUT OF OR IN
CONNECTION WITH THE DOWNLOADING, PROVISIONING, VIEWING OR USE OF THE MATERIALS REGARDLESS OF THE FORM OF
ACTION, WHETHER FOR BREACH OF CONTRACT, BREACH OF WARRANTY, TORT, NEGLIGENCE, INFRINGEMENT OR OTHERWISE
(INCLUDING, WITHOUT LIMITATION, DAMAGES BASED ON LOSS OF PROFITS, DATA, FILES, USE, BUSINESS OPPORTUNITY OR
CLAIMS OF THIRD PARTIES), AND WHETHER OR NOT THE PARTY HAS BEEN ADVISED OF THE POSSIBILITY OF SUCH DAMAGES. THIS
LIMITATION SHALL APPLY NOTWITHSTANDING ANY FAILURE OF ESSENTIAL PURPOSE OF ANY LIMITED REMEDY PROVIDED HEREIN.
9. Should any provision of this Agreement be held by a court of competent jurisdiction to be illegal, invalid, or unenforceable, that
provision shall be deemed amended to achieve as nearly as possible the same economic effect as the original provision, and the
legality, validity and enforceability of the remaining provisions of this Agreement shall not be affected or impaired thereby.
10. The failure of either party to enforce any term or condition of this Agreement shall not constitute a waiver of either party's right to enforce each and every term and condition of this Agreement. No breach under this agreement shall be deemed waived or excused by
either party unless such waiver or consent is in writing signed by the party granting such waiver or consent. The waiver by or consent
of a party to a breach of any provision of this Agreement shall not operate or be construed as a waiver of or consent to any other or
subsequent breach by such other party.
11. This Agreement may not be assigned (including by operation of law or otherwise) by you without WILEY's prior written consent.
12. These terms and conditions together with CCC’s Billing and Payment terms and conditions (which are incorporated herein) form the
entire agreement between you and WILEY concerning this licensing transaction and (in the absence of fraud) supersedes all prior
agreements and representations of the parties, oral or written. This Agreement may not be amended except in a writing signed by both
parties. This Agreement shall be binding upon and inure to the benefit of the parties' successors, legal representatives, and authorized
assigns.
13. In the event of any conflict between your obligations established by these terms and conditions and those established by CCC’s
Billing and Payment terms and conditions, these terms and conditions shall prevail.
14. WILEY expressly reserves all rights not specifically granted in the combination of (i) the license details provided by you and
accepted in the course of this licensing transaction, (ii) these terms and conditions and (iii) CCC’s Billing and Payment terms and conditions.
15. This Agreement shall be governed by and construed in accordance with the laws of England and you agree to submit to the
exclusive jurisdiction of the English courts.
BY CLICKING ON THE "I ACCEPT" BUTTON, YOU ACKNOWLEDGE THAT YOU HAVE READ AND FULLY UNDERSTAND EACH OF THE SECTIONS OF AND PROVISIONS SET FORTH IN THIS AGREEMENT AND THAT YOU ARE IN AGREEMENT WITH AND ARE WILLING TO
ACCEPT ALL OF YOUR OBLIGATIONS AS SET FORTH IN THIS AGREEMENT.
V1.2
Gratis licenses (referencing $0 in the Total field) are free. Please retain this printable license for your reference. No payment is required.
If you would like to pay for this license now, please remit this license along with your payment made payable to
"COPYRIGHT CLEARANCE CENTER" otherwise you will be invoiced within 48 hours of the license date. Payment should be in the form of a check or money order referencing your account number and this invoice number RLNK10726629.
Once you receive your invoice for this order, you may pay your invoice by credit card. Please follow instructions provided
at that time.
Make Payment To:
Copyright Clearance Center
Dept 001 P.O. Box 843006
Boston, MA 02284-3006
If you find copyrighted material related to this license will not be used and wish to cancel, please contact us referencing
this license number 2357760424754 and noting the reason for cancellation.
Questions? [email protected] or +1-877-622-5543 (toll free in the US) or +1-978-646-2777.

183
APPENDIX B
Initial NASC-CDM Scale Blueprint
Objectives Content-Domains
The student nurse will
select the self-
confidence level and
anxiety level reflective
of his or her ability to:
Investigating
information
and cues
Interpreting
information
and meanings
Integrating
findings
and
Illuminating
options
Intervening
and
Reflecting on
the decision
process
Totals
Gather information
appropriate to a client
problem.
14 14
Decipher meanings of
cues present within a
client problem.
8 8
Employ an intuitive-
humanist stance when
faced with a client
problem.
4 3 1 8
Utilize pre-encounter
data when faced with a
client problem.
2 2 1 5
Analyze the information
gathered within a client
problem.
5 5
Utilize pre-requisite
knowledge within a
client problem.
3 3 6
Integrate data related to
a client problem to
formulate plausible
decision options.
7 7
Deliberate plausible
decision options and/or
seek additional resource
assistance for
information validation
or to assess decision
options.
14 14
Implement the clinical
decision.
8 8
Evaluate the
effectiveness of the
implemented clinical
decision relevant to a
client problem.
7 7
Total = 20 18 27 17 82

184
APPENDIX C
Initial Item-Pool of the NASC-CDM Scale by Content Domain
Think about this statement as you read each item:
“I am _________ self-confident and I am ___ anxious in my ability to:”
1 = not at all; 2 = somewhat; 3 = equal and not equally; 4 = mostly; 5 = totally
Content-Domain Item
Investigating
information and cues (20)
3. Implement two ways of gathering information related to the
client‟s problem.
5. Describe to my clinical nursing instructor the subjective data
gathered from the client.
8. Quickly develop a therapeutic relationship with the client.
9. Gather at least two pieces of objective data about the client‟s
problem.
11. Listen carefully to what the client tells me about his or
her health problem.
15. Perform the steps of a basic head-to-toe physical
assessment.
19. State a reason why assessing the client‟s nonverbal cues is
important.
24. Ask directed questions to really get to know my client.
28. Summarize to my clinical nursing instructor the objective
data gathered from the client.
33. Describe normal findings from the physical exam performed
on the client.
34. Utilize family members when collecting data.
41. Identify a potential client problem by reading the client‟s
chart.
49. Explain to my nursing instructor abnormal client findings.
51. Implement active listening techniques.
57. Gather at least two pieces of subjective data from the client
about the health problem.
58. Restate to my clinical nursing instructor the client‟s signs
and symptoms in my own words.
60. Identify important data about a client problem from
information given in the shift-change report.
67. Tailor my assessment based on the client‟s signs and
symptoms of the current problem.
74. Ask the client‟s significant others questions to collect data
about the current problem.
82. Follow a feeling that something is wrong with the client and
then begin to gather information.

185
Interpreting information
and meanings (18)
1. Determine clinical information that is not relevant to the
current client problem.
12. Communicate client assessment findings to healthcare
team members.
16. Recognize subtle changes in the client‟s baseline
assessment findings.
20. Analyze the meaning of a certain clinical finding related to
the client‟s problem.
25. Determine if enough pertinent information about the
current problem has been gathered from the client.
26. Detect when verbal and nonverbal client cues don‟t match.
29. Draw on my own clinical experiences to help interpret the
client‟s cues.
35. Interpret the relevance of information provided by family
members.
40. Ask additional questions when needed to get more specific
data about the current client problem.
43. Use my knowledge of anatomy and physiology to interpret
cues related to the current client problem.
45. Determine clinical information that is relevant to the
current client problem.
53. Fully assess the client even if early cues seem to lead to
one certain problem.
61. Discuss three possible problems that could occur within the
client‟s clinical situation once data is gathered.
65. Perform additional system assessments to gather more data
about the client‟s health problem.
66. Interpret subtle nonverbal cues in the client related to the
present problem.
73. Recall information I learned in the past that relates to the
client‟s current problem.
77. Draw on the clinical experiences of my student-peers to
help interpret the client‟s cues.
78. Apply information about disease processes learned in the
classroom to my client‟s clinical problem.
Integrating findings
and Illuminating options
(27)
2. Analyze the risks of one decision option.
4. Determine the need to search professional literature to help
clarify the client‟s clinical findings.
7. Correlate physical assessment findings with what the client
tells me.
10. Formulate at least one possible intervention I could
implement for the client‟s current problem.
17. Consider an intervention for the current client problem
based on my gut-feeling.
18. Identify the need to talk with my clinical nursing instructor
about decision options.

186
21. Recognize the need to use the staff nurse as a resource to
discuss decision options.
27. Use my knowledge of diagnostic tests to make an effective
decision option for the client.
30. Disregard cues that do not apply to the full clinical picture
of the client‟s current problem.
36. Identify the need to talk with my nursing instructor to help
confirm client findings about the current problem.
37. Correlate the client‟s diagnostic study results with the
physical exam findings.
39. Generate two possible interventions I could implement for
the client‟s current problem.
46. Apply my knowledge of medications to make a positive
decision and improve the client‟s outcomes.
47. Collaborate with the doctor about the client‟s problem.
48. Pull together a full clinical picture of the client‟s situation.
50. Analyze the benefits of one decision option.
54. Create three or more possible interventions I could
implement for the client‟s current problem.
55. Determine the need to consult a protocol/procedure to
validate information about the client‟s problem.
59. Integrate physical assessment findings with the client‟s
nonverbal cues.
63. Remain open to a number of reasons for the client‟s
problem despite cues that point to one problem.
64. Generate at least one possible intervention for the client‟s
problem within the first minute or two of my assessment. 68.
Integrate personal knowledge about the client in order to
make decisions in his or her best interest.
70. Decide to discuss an intervention I am considering with a
student-peer.
71. Consider a possible intervention for the client problem
because it seems right, despite a lack of supporting
evidence.
75. Determine the need to search professional literature to help
find an appropriate decision option.
79. Easily see relevant patterns in client cues so I can determine
the best decision option.
81. Use my knowledge of lab values to make a positive clinical
decision that benefits the client.
Intervening and
Reflecting
on the decision process
(17)
6. Evaluate how effective the decision option was in improving
the client‟s physical assessment findings.
13. Accurately choose one plausible intervention if the client is
in a life threatening situation.
14. Evaluate if the clinical decision made influenced client
satisfaction.
22. Act upon at least one decision option I consider to be
important in solving the client‟s problem.
23. Take full responsibility for the decision I made.

187
TOTAL ITEMS = 82
31. Implement the “best” decision option for the client‟s
problem.
32. Judge how successful the clinical decision was in having
the client‟s laboratory findings improve.
38. Reflect upon whether my chosen decision affected overall
client outcomes.
42. Evaluate specific consequences of my decision option.
44. Make the final clinical decision after cues are analyzed and
decision options are deliberated.
52. Implement a decision option for a client problem during my
first week in a new clinical environment.
56. Act upon at least two decision options that I consider to
be important in solving the client‟s problem.
62. Evaluate if the clinical decision made affected the client‟s
overall length of stay.
69. Independently make a clinical decision to solve the
client‟s problem.
72. Draw on my own past clinical experiences to help make a
current decision.
76. Act upon at least one specific intervention based on my gut-
feeling.
80. Implement a decision option for a client problem in a clinical
environment where I have been for several weeks.

188
APPENDIX D
Sample Invitation Sent to Expert Reviewers
Dear Dr. ---, I am a PhD in Nursing student at the University of Nevada, Las Vegas and
am beginning work on the development of a quantitative research instrument in the area
of self-confidence and clinical decision making in student nurses.
Currently, I am completing an extensive literature review in the content-domain of
clinical decision making and constructing items for an instrument which will measure the
self-confidence and anxiety levels of student nurses as they progress through the process
of making clinical decisions. Items will be included on the instrument embracing both the
information-processing and intuitive sides of decision-making. I am writing to ask if you
would be willing to serve as an expert reviewer for these items. Your expertise in the
genre of intuitive-humanistic clinical decision making would make your feedback most
welcome. My hope is that this preliminary work to assess validity will support the need
and appropriateness of my tool. Hence, instrument development is what I am anxious to
pursue for dissertation.
If you agree to serve as an expert panelist I would send you a Reviewer Packet either
by mail or electronic means, according to your preference, approximately the
second week of March, 2009. You would have one month to complete your feedback
and return the packet to me. Please let me know if you are willing to assist me with this
early work in instrument development. I look forward to your expertise and feedback to
guide this process.
If you would like any additional information prior to making a decision to serve as a
reviewer, please feel free to let me know. I will attempt to clarify anything for you that I
can! Thank you for your time and consideration.
Most Sincerely,
Krista A. White RN, MSN, CCRN
PhD in Nursing, student, UNLV

189
APPENDIX E
Expert Reviewer Rating Packet
March 13, 2009
Dear Dr. -----,
Thank you so much for agreeing to serve as an expert reviewer for the quantitative tool I have
developed to measure the self-confidence and anxiety level of student nurses as they progress
through the process of clinical decision making (CDM). I am a doctoral student in nursing at
the University of Nevada, Las Vegas and am working in the area of examining the self-
confidence and anxiety level felt by student nurses as they make clinical decisions. To measure
this construct, I have developed a norm-referenced, Likert-type, self-report tool. The design of the
tool is for use in the clinical practicum environment. This instrument is designed to reflect both
the information-processing and intuitive-humanist sides of CDM. Your impressive expertise in
the domain of clinical judgment and prolific authorship in this area will be very beneficial to the
development of this tool! Further, your participation in the instrument review will serve as a vital
preliminary step in the establishment of a credible research tool.
In this era of high acuity patients, clinical decision making skills are important for professional
nurses not only to possess but also to feel confident. Because nurses remain at the bedside far
more than any other member of the multi-disciplinary team, they are generally the first to observe
cues in patients which may warrant making critical clinical decisions. Once contextual cues are
assessed by the nurse, appropriate interpretation and action must occur. Since clinical decision
making is such an important acquired skill for nurses, the process of learning to make decisions,
and gaining confidence with this process, must not begin as a graduate nurse - it must be
introduced and practiced during nursing education programs. Because patient outcomes are at
stake, it is imperative that nursing students begin to develop confidence with clinical decision
making steps during the safety of supervised educational experiences. After extensive literature
review, a dearth of existing instruments has been found which assess the level of self-confidence
and anxiety perceived by student nurses as they move through the process of CDM.
As an instrument reviewer I will ask you to: (1) review the overall objective for the tool,
conceptual definition, and content-domains for CDM; (2) complete the expert rating form which
will require you to rate each item on its relevancy to the domain of CDM; (3) complete the expert
rating form which will require you to designate, by checkmark, in which content-domain of CDM
you believe each item would be placed; (4) judge the overall clarity and comprehensiveness of
the tool; (5) offer suggestions about using a 4-point forced-choice response format or a 5-point
response format; and (6) offer suggestions about revision, addition, or deletion of items that might
facilitate refinement of the tool.
Again, thank you again for agreeing to serve in the capacity of expert reviewer. Your feedback is
appreciated by Monday April 13, 2009. I am grateful for your commitment to this important
matter. If you have any questions, please feel free to contact me.
Sincerely,
Krista A. White, MSN, RN, CCRN
PhD in Nursing Student, UNLV

190
Definitions of Clinical Decision Making and Content Domains for the
Nursing Anxiety and Self-Confidence with Clinical Decision Making Scale
Instrument Intent: The primary interest of the tool developer is in the perceived self-
confidence and anxiety level throughout the process of clinical decision making (CDM)
in an undergraduate student nurse population as it relates to client care in the clinical
practicum environment. More specifically, I am interested in the confidence level and
anxiety level students experience while engaging in the various components of making
clinical decisions. The Nursing Anxiety and Self-Confidence with Clinical Decision
Making scale (NASC-CDM) is considered a hybrid scale because it examines the
cognitive and intuitive process of making a clinical decision but its ultimate purpose is to
appraise the affective domain of the self-confidence and anxiety level experienced by the
student nurse while carrying out the CDM process
Clinical Decision Making Definitions: Standing (2007) defines CDM as “a complex
process involving information processing, critical thinking, evaluating evidence, applying
knowledge, problem-solving skills, reflection, and clinical judgment to select the best
course of action” (p. 266). In the mixed methodological study by Tschikota (1993), she
defines CDM as “the formulation of hypotheses and/or the selection of nursing
interventions” (p. 389). The content domains are identified below which reflect the
definition and the overarching intent of the tool.
Content-Domains of CDM
Investigating Information and Cues: Includes data gathering, cue acquisition, and assessment
skills related to a client problem. This may include the utilization of both information-processing
and intuitive means.
Interpreting Information and Meanings: Includes summarizing the meaning of cues present in
a client situation, distinguishing if enough information has been obtained, interpreting which
information is relevant and irrelevant to the client problem, implementing more pointed physical
assessment, and asking specific questions to validate the cues presented. Pre-requisite knowledge
is required for this domain.
Integrating Findings and Illuminating Options: Includes incorporating, cognitively and
intuitively, the full clinical picture in order that one or more plausible decision option may be
deliberated. Includes analyzing a number of decision options and determining the need to seek
assistance with the CDM process. This domain includes the risk/benefit analysis for plausible
decision options. Pre-requisite knowledge is required for this domain.
Intervening and Reflecting on the Decision Process: Includes making the final decision to act
based on cues presented, data gathered, clinical picture synthesis, and plausible decision options
considered. This domain also includes appraising the outcome or the effectiveness of the clinical
decision chosen, reflecting on the CDM process, and taking responsibility for one‟s actions.

191
Nursing Anxiety and Self-Confidence with Clinical Decision Making Scale
I have included a sample of the instrument simply for your perusal. The expert reviewer
rating form follows this scale example. This instrument is designed for undergraduate
nursing students as they near the completion of their program.
Student Directions: Think about a few client problems you have experienced in the
clinical setting in the past two weeks where you needed to make a decision. Read each
item below. Circle the number for each item on the left side of the survey that best
identifies the level of self-confidence you usually feel in a given situation. Also, circle
the number for each item on the right side of the survey that best identifies the level of
anxiety you usually feel in a given situation.
Please provide a response for each item presented. Self-Confidence Scale: 1 = not at all confident; 2 = somewhat confident; 3 = equally
confident and not confident; 4 = mostly confident; 5 = totally confident.
Anxiety Scale: 1 = not at all anxious; 2 = somewhat anxious; 3 = equally anxious and
not anxious; 4 = mostly anxious; 5 = totally anxious.
Think about this statement as you read each item: “I am _______ in my ability to:”
Circle the Number Best
Identifying your Self-
Confidence Level
Read Each Item Carefully
Circle the Number
Best Identifying your
Anxiety Level
1 2 3 4 5
1 2 3 4 5
1 2 3 4 5
1 2 3 4 5
1 2 3 4 5
1 2 3 4 5
1. Determine clinical information
that is not relevant to the current
client problem.
2. Analyze the risks of one
decision option.
3. Implement two ways of
gathering information related to the
client‟s problem.
4. Determine the need to search
professional literature to help
clarify the client‟s clinical findings.
5. Describe to my clinical nursing
instructor the subjective data
gathered from the client.
6. Evaluate how effective the
decision option was in improving
1 2 3 4 5
1 2 3 4 5
1 2 3 4 5
1 2 3 4 5
1 2 3 4 5
1 2 3 4 5

192
1 2 3 4 5
1 2 3 4 5
1 2 3 4 5
1 2 3 4 5
the client‟s physical assessment
findings.
7. Correlate physical assessment
findings with what the client tells
me.
8. Gather at least two pieces of
objective data about the client‟s
problem.
9. Formulate at least one possible
intervention I could implement for
the client‟s current problem.
10. Listen carefully to what the
client tells me about his or her
current health problem.
1 2 3 4 5
1 2 3 4 5
1 2 3 4 5
1 2 3 4 5

193
Expert Reviewer Rating Form for the
Nursing Anxiety and Self-Confidence with Clinical Decision Making Scale
Rating Instructions: For each item please indicate:
1. How relevant the item is to the process of making a clinical decision. Your notation may be made by placing a
checkmark in the appropriate box.
1 = not at all relevant 2 = slightly relevant 3 = moderately relevant 4 = highly relevant
2. In which content domain (i.e. investigating information and cues) you believe the item belongs. Your notation may be
made by placing a checkmark in the appropriate box. If you feel an item is ambiguous and thus cannot be placed in a
content domain, please leave the spaces blank.
Relevance
Item
Content-Domains
1
2
3
4
Listed below are the 82 items proposed
for the NASC-CDM scale.
Investigating
Information and
Cues
Interpreting
Information
and Meanings
Integrating
Findings and
Illuminating
Options
Intervening and
Reflecting on
the Decision
Process
1. Determine clinical information that is
not relevant to the current client problem.
2. Analyze the risks of one decision
option.
3. Implement two ways of gathering
information related to the client‟s
problem.
4. Determine the need to search
professional literature to help clarify the

194
Relevance
Item
Content-Domains
1
2
3
4
Listed below are the 82 items proposed
for the NASC-CDM scale.
Investigating
Information and
Cues
Interpreting
Information
and Meanings
Integrating
Findings and
Illuminating
Options
Intervening and
Reflecting on
the Decision
Process
client‟s clinical findings.
5. Describe to my clinical nursing
instructor the subjective data gathered
from the client.
6. Evaluate how effective the decision
option was in improving the client‟s
physical assessment findings.
7. Correlate physical assessment findings
with what the client tells me.
8. Quickly develop a therapeutic
relationship with the client.
9. Gather at least two pieces of objective
data about the client‟s problem.
10. Formulate at least one possible
intervention I could implement for the
client‟s current problem.
11. Listen carefully to what the client
tells me about his or her health problem.
12. Communicate client assessment
findings to healthcare team members.
13. Accurately choose one plausible
intervention if the client is in a life
threatening situation.
14. Evaluate if the clinical decision made
influenced client satisfaction.

195
Relevance
Item
Content-Domains
1
2
3
4
Listed below are the 82 items proposed
for the NASC-CDM scale.
Investigating
Information and
Cues
Interpreting
Information
and Meanings
Integrating
Findings and
Illuminating
Options
Intervening and
Reflecting on
the Decision
Process
15. Perform the steps of a basic head-to-
toe physical assessment.
16. Recognize subtle changes in the
client‟s baseline assessment findings.
17. Consider an intervention for the
current client problem based on my gut-
feeling.
18. Identify the need to talk with my
clinical nursing instructor about decision
options.
19. State a reason why assessing the
client‟s nonverbal cues is important.
20. Analyze the meaning of a certain
clinical finding related to the client‟s
problem.
21. Recognize the need to use the staff
nurse as a resource to discuss decision
options.
22. Act upon at least one decision option
I consider to be important in solving the
client‟s problem.
23. Take full responsibility for the
decision I made.
24. Ask directed questions to really get to

196
Relevance
Item
Content-Domains
1
2
3
4
Listed below are the 82 items proposed
for the NASC-CDM scale.
Investigating
Information and
Cues
Interpreting
Information
and Meanings
Integrating
Findings and
Illuminating
Options
Intervening and
Reflecting on
the Decision
Process
know my client.
25. Determine if enough pertinent
information about the current problem has
been gathered from the client.
26. Detect when verbal and nonverbal
client cues don‟t match.
27. Use my knowledge of diagnostic tests
to make an effective decision option for
the client.
28. Summarize to my clinical nursing
instructor the objective data gathered from
the client.
29. Draw on my own clinical
experiences to help interpret the client‟s
cues.
30. Disregard cues that do not apply to
the full clinical picture of the client‟s
current problem.
31. Implement the “best” decision option
for the client‟s problem.
32. Judge how successful the clinical
decision was in having the client‟s
laboratory findings improve.
33. Describe normal findings from the
physical exam performed on the client.

197
Relevance
Item
Content-Domains
1
2
3
4
Listed below are the 82 items proposed
for the NASC-CDM scale.
Investigating
Information and
Cues
Interpreting
Information
and Meanings
Integrating
Findings and
Illuminating
Options
Intervening and
Reflecting on
the Decision
Process
34. Utilize family members when
collecting data.
35. Interpret the relevance of information
provided by family members.
36. Identify the need to talk with my
nursing instructor to help confirm client
findings about the current problem.
37. Correlate the client‟s diagnostic study
results with the physical exam findings.
38. Reflect upon whether my chosen
decision affected overall client outcomes.
39. Generate two possible interventions I
could implement for the client‟s current
problem.
40. Ask additional questions when
needed to get more specific data about the
current client problem.
41. Identify a potential client problem by
reading the client‟s chart.
42. Evaluate specific consequences of my
decision option.
43. Use my knowledge of anatomy and
physiology to interpret cues related to the
current client problem.
44. Make the final clinical decision after

198
Relevance
Item
Content-Domains
1
2
3
4
Listed below are the 82 items proposed
for the NASC-CDM scale.
Investigating
Information and
Cues
Interpreting
Information
and Meanings
Integrating
Findings and
Illuminating
Options
Intervening and
Reflecting on
the Decision
Process
cues are analyzed and decision options are
deliberated.
45. Determine clinical information that is
relevant to the current client problem.
46. Apply my knowledge of medications
to make a positive decision and improve
the client‟s outcomes.
47. Collaborate with the doctor about the
client‟s problem.
48. Pull together a full clinical picture of
the client‟s situation.
49. Explain to my nursing instructor
abnormal client findings.
50. Analyze the benefits of one decision
option.
51. Implement active listening techniques.
52. Implement a decision option for a
client problem during my first week in a
new clinical environment.
53. Fully assess the client even if early
cues seem to lead to one certain problem.
54. Create three or more possible
interventions I could implement for the

199
Relevance
Item
Content-Domains
1
2
3
4
Listed below are the 82 items proposed
for the NASC-CDM scale.
Investigating
Information and
Cues
Interpreting
Information
and Meanings
Integrating
Findings and
Illuminating
Options
Intervening and
Reflecting on
the Decision
Process
client‟s current problem.
55. Determine the need to consult a
protocol/procedure to validate information
about the client‟s problem.
56. Act upon at least two decision options
that I consider to be important in solving
the client‟s problem.
57. Gather at least two pieces of
subjective data from the client about the
health problem.
58. Restate to my clinical nursing
instructor the client‟s signs and symptoms
in my own words.
59. Integrate physical assessment
findings with the client‟s nonverbal cues.
60. Identify important data about a client
problem from information given in the
shift-change report.
61. Discuss three possible problems that
could occur within the client‟s clinical
situation once data is gathered.
62. Evaluate if the clinical decision made
affected the client‟s overall length of stay.
63. Remain open to a number of reasons
for the client‟s problem despite cues that

200
Relevance
Item
Content-Domains
1
2
3
4
Listed below are the 82 items proposed
for the NASC-CDM scale.
Investigating
Information and
Cues
Interpreting
Information
and Meanings
Integrating
Findings and
Illuminating
Options
Intervening and
Reflecting on
the Decision
Process
point to one problem.
64. Generate at least one possible
intervention for the client‟s problem
within the first minute or two of my
assessment.
65. Perform additional system
assessments to gather more data about the
client‟s health problem.
66. Interpret subtle nonverbal cues in the
client related to the present problem.
67. Tailor my assessment based on the
client‟s signs and symptoms of the current
problem.
68. Integrate personal knowledge about
the client in order to make decisions in his
or her best interest.
69. Independently make a clinical
decision to solve the client‟s problem.
70. Decide to discuss an intervention I
am considering with a student-peer.
71. Consider a possible intervention for
the client problem because it seems right,
despite a lack of supporting evidence.
72. Draw on my own past clinical

201
Relevance
Item
Content-Domains
1
2
3
4
Listed below are the 82 items proposed
for the NASC-CDM scale.
Investigating
Information and
Cues
Interpreting
Information
and Meanings
Integrating
Findings and
Illuminating
Options
Intervening and
Reflecting on
the Decision
Process
experiences to help make a current
decision.
73. Recall information I learned in the
past that relates to the client‟s current
problem.
74. Ask the client‟s significant others
questions to collect data about the current
problem.
75. Determine the need to search
professional literature to help find an
appropriate decision option.
76. Act upon at least one specific
intervention based on my gut-feeling.
77. Draw on the clinical experiences of
my student-peers to help interpret the
client‟s cues.
78. Apply information about disease
processes learned in the classroom to my
client‟s clinical problem.
79. Easily see relevant patterns in client
cues so I can determine the best decision
option.
80. Implement a decision option for a
client problem in a clinical environment
where I have been for several weeks.

202
Relevance
Item
Content-Domains
1
2
3
4
Listed below are the 82 items proposed
for the NASC-CDM scale.
Investigating
Information and
Cues
Interpreting
Information
and Meanings
Integrating
Findings and
Illuminating
Options
Intervening and
Reflecting on
the Decision
Process
81. Use my knowledge of lab values to
make a positive clinical decision that
benefits the client.
82. Follow a feeling that something is
wrong with the client and then begin to
gather information.
Thank you for completing this instrument review form. I would appreciate a few more minutes of your time.
Rate the following:
1. Overall clarity of the instrument (mark one please by changing font color or highlighting):
1 = not at all clear 2 = slightly clear 3 = moderately clear 4 = very clear
Any suggestions to improve the clarity:
2. Overall comprehensiveness of the instrument (mark one please by changing font color or highlighting):
1 = not at all comprehensive 2 = slightly comprehensive 3 = moderately comprehensive 4 = very
comprehensive
Any suggestions to improve the comprehensiveness:

203
3. Opinion about using a 4-point, forced-choice, Likert-scale versus a 5-point, neutral-option, Likert scale (mark one
please by
changing font color or highlighting):
4-point scale 5-point scale
Rationale for selection:
4. Comments or suggestions about the wording of existing items, items that you believe should be deleted, and/or items
which you
believe should be added. I encourage you to note any comments you believe might facilitate the most effective
revisions to the SCCDM scale.
One Final Request: I have reviewed your information on the ----- website, examined the list of your publications, and
reviewed the bio-sheet. Would you be willing to forward to me your CV – if you feel this would be more inclusive?
Pertinent professional information about each content expert will be beneficial as I progress through dissertation.
Thank you
Standing, M. (2007). Clinical decision-making skills on the developmental journal from student to registered nurse: A
longitudinal inquiry. Journal of Advanced Nursing, 60, 257-269.
Tschikota, S. (1993). The clinical decision-making processes of student nurses. Journal of Nursing Education, 32, 389-398

204
APPENDIX F
Content Validity Indices from Expert Reviewers
Items rated as 3 = moderately relevant or 4 = highly relevant are considered in this table.
Item Expert #1 Expert #2 Expert #3 Expert #4 Experts in Agreement I-CVI
1 --- No Yes Yes 2 .67
2 --- Yes Yes Yes 3 1.00
3 --- Yes No Yes 2 .67
4 --- Yes Yes Yes 3 1.00
5 --- No Yes No 1 .33
6 --- No Yes Yes 2 .67
7 --- Yes --- Yes 2 .67
8 --- No --- No 0 ---
9 --- Yes No Yes 2 .67
10 --- Yes No Yes 2 .67
11 --- Yes Yes Yes 3 1.00
12 --- No Yes No 1 .33
13 --- Yes Yes Yes 3 1.00
14 --- Yes Yes Yes 3 1.00*
15 --- Yes Yes No 2 .67
16 --- Yes --- Yes 2 .67
17 --- Yes No Yes 2 .67
18 --- Yes Yes Yes 3 1.00
19 --- No Yes No 1 .33
20 --- Yes Yes Yes 3 1.00
21 --- Yes --- Yes 2 .67
22 --- Yes Yes Yes 3 1.00*
23 --- Yes Yes Yes 3 1.00
24 --- Yes Yes No 2 .67
25 --- Yes Yes Yes 3 1.00
26 --- Yes Yes Yes 3 1.00*
27 --- Yes Yes Yes 3 1.00

205
Item Expert #1 Expert #2 Expert #3 Expert #4 Experts in Agreement I-CVI 28 --- Yes No No 1 .33
29 --- Yes Yes Yes 3 1.00
30 --- Yes No Yes 2 .67
31 --- Yes Yes Yes 3 1.00
32 --- Yes Yes Yes 3 1.00
33 --- Yes Yes No 2 .67
34 --- Yes Yes Yes 3 1.00
35 --- Yes Yes Yes 3 1.00
36 --- No Yes Yes 2 .67
37 --- Yes Yes Yes 3 1.00*
38 --- Yes Yes Yes 3 1.00
39 --- Yes No --- 1 .33
40 --- Yes Yes Yes 3 1.00
41 --- Yes Yes Yes 3 1.00*
42 --- Yes Yes Yes 3 1.00
43 --- Yes Yes Yes 3 1.00*
44 --- Yes Yes Yes 3 1.00*
45 --- Yes Yes Yes 3 1.00*
46 --- Yes --- Yes 2 . 67
47 --- Yes Yes No 2 .67
48 --- Yes Yes Yes 3 1.00
49 --- No Yes No 1 .33
50 --- Yes --- Yes 2 .67
51 --- No Yes Yes 2 .67
52 --- No No No 0 ---
53 --- No No No 0 ---
54 --- No No --- 0 ---
55 --- Yes Yes Yes 3 1.00
56 --- Yes No --- 1 .33
57 --- Yes No --- 1 .33
58 --- No No No 0 ---
59 --- Yes Yes Yes 3 1.00
60 --- Yes Yes Yes 3 1.00
61 --- Yes No Yes 2 .67

206
Item Expert #1 Expert #2 Expert #3 Expert #4 Experts in Agreement I-CVI 62 --- Yes No Yes 2 .67
63 --- Yes No Yes 2 .67
64 --- Yes No Yes 2 .67
65 --- Yes No Yes 2 .67
66 --- Yes No Yes 2 .67
67 --- Yes No Yes 2 .67
68 --- Yes Yes Yes 3 1.00
69 --- Yes No Yes 2 .67
70 --- No No No 0 ---
71 --- Yes Yes Yes 3 1.00
72 --- Yes Yes Yes 3 1.00
73 --- Yes Yes Yes 3 1.00
74 --- Yes Yes Yes 3 1.00
75 --- Yes Yes Yes 3 1.00
76 --- Yes No Yes 2 .67
77 --- No Yes --- 1 .33
78 --- Yes Yes --- 2 .67
79 --- Yes Yes Yes 3 1.00
80 --- Yes Yes No 2 .67
81 --- Yes Yes Yes 3 1.00
82 --- Yes Yes Yes 3 1.00
Proportion
Relevant
Per Expert
.82
.65
.74
Scale CVI = .46
Expert # 3 has a low proportion of relevancy. Perhaps she left blank of answered “NO” because of the admitted language
barrier.
* Became 100% relevant after removal of Expert # 5.

207
APPENDIX G
Pilot Version Item-Pool of the NASC-CDM Scale by Content Domain
Item
Response Format
Not at all Just a little Somewhat Mostly Almost totally Totally
Domain: Investigating information and cues
(9)
1. I am _____ self-confident and _____ anxious
in my ability to listen carefully to what the
client tells me about his or her health problem.
2. I am _____ self-confident and _____ anxious
in my ability to assess the client‟s nonverbal
cues.
3. I am _____ self-confident and _____ anxious
in my ability to recognize a possible client
problem by reading the client‟s chart.
4. I am _____ self-confident and _____ anxious
in my ability to use active listening skills to
gather information about the client‟s current
problem.
Self-confident 1 2 3 4 5 6
Anxious 1 2 3 4 5 6
Self-confident 1 2 3 4 5 6
Anxious 1 2 3 4 5 6
Self-confident 1 2 3 4 5 6
Anxious 1 2 3 4 5 6
Self-confident 1 2 3 4 5 6
Anxious 1 2 3 4 5 6

208
Item
Response Format
Not at all Just a little Somewhat Mostly Almost totally Totally
5. I am _____ self-confident and _____ anxious
in my ability to recognize important information
about a client problem from information given
in the shift-change report.
6. I am _____ self-confident and _____ anxious
in my ability to change my assessment based on
the client‟s signs and symptoms of the current
problem.
7. I am _____ self-confident and _____ anxious
in my ability to ask the client‟s significant
others/family questions to gather information
about the current problem.
8. I am _____ self-confident and _____ anxious
in my ability to follow a „feeling‟ that
something is wrong with the client and then
begin to gather information.
9. I am _____ self-confident and _____ anxious
in my ability to perform additional system-
assessments to gather more information about
the client‟s current problem.
Self-confident 1 2 3 4 5 6
Anxious 1 2 3 4 5 6
Self-confident 1 2 3 4 5 6
Anxious 1 2 3 4 5 6
Self-confident 1 2 3 4 5 6
Anxious 1 2 3 4 5 6
Self-confident 1 2 3 4 5 6
Anxious 1 2 3 4 5 6
Self-confident 1 2 3 4 5 6
Anxious 1 2 3 4 5 6
Domain: Interpreting information and
meanings (10)

209
Item
Response Format
Not at all Just a little Somewhat Mostly Almost totally Totally
10. I am _____ self-confident and _____
anxious in my ability to identify which pieces of
clinical information I gathered are not related to
the client‟s current problem.
11. I am _____ self-confident and _____
anxious in my ability to interpret the meaning of
a specific assessment finding related to the
client‟s current problem.
12. I am _____ self-confident and _____
anxious in my ability to know when enough
information about the current problem has been
gathered from the client.
13. I am _____ self-confident and _____
anxious in my ability to detect when verbal and
nonverbal cues from the client don‟t match.
14. I am _____ self-confident and _____
anxious in my ability to draw on my own past
clinical experiences to help interpret
information about the client‟s current problem.
15. I am _____ self-confident and _____
anxious in my ability to decide if information
Self-confident 1 2 3 4 5 6
Anxious 1 2 3 4 5 6
Self-confident 1 2 3 4 5 6
Anxious 1 2 3 4 5 6
Self-confident 1 2 3 4 5 6
Anxious 1 2 3 4 5 6
Self-confident 1 2 3 4 5 6
Anxious 1 2 3 4 5 6
Self-confident 1 2 3 4 5 6
Anxious 1 2 3 4 5 6
Self-confident 1 2 3 4 5 6

210
Item
Response Format
Not at all Just a little Somewhat Mostly Almost totally Totally
given by significant others/families is important
to the client‟s current problem.
16. I am _____ self-confident and _____
anxious in my ability to ask the client additional
questions to get more specific information about
the current problem.
17. I am _____ self-confident and _____
anxious in my ability to use my knowledge of
anatomy and physiology to interpret
information I gathered about the client‟s current
problem.
18. I am _____ self-confident and _____
anxious in my ability to identify which pieces of
clinical information I gathered are related to the
client‟s current problem.
19. I am _____ self-confident and _____
anxious in my ability to recall knowledge I
learned in the past that relates to the client‟s
current problem.
Anxious 1 2 3 4 5 6
Self-confident 1 2 3 4 5 6
Anxious 1 2 3 4 5 6
Self-confident 1 2 3 4 5 6
Anxious 1 2 3 4 5 6
Self-confident 1 2 3 4 5 6
Anxious 1 2 3 4 5 6
Self-confident 1 2 3 4 5 6
Anxious 1 2 3 4 5 6
Domain: Integrating findings and
Illuminating options (12)

211
Item
Response Format
Not at all Just a little Somewhat Mostly Almost totally Totally
20. I am _____ self-confident and _____
anxious in my ability to analyze the risks of the
interventions I am considering for the client‟s
current problem.
21. I am _____ self-confident and _____
anxious in my ability to realize the need to talk
with my clinical nursing instructor or the staff
nurse about interventions I am considering.
22. I am _____ self-confident and _____
anxious in my ability to use my knowledge of
diagnostic tests, like lab results or x-ray
findings, to help create a possible list of
decisions I could implement.
23. I am _____ self-confident and _____
anxious in my ability to recognize the need to
talk with my clinical nursing instructor to help
sort-out client assessment findings.
24. I am _____ self-confident and _____
anxious in my ability to correlate the client‟s
diagnostic study results with his or her physical
assessment findings.
25. I am _____ self-confident and _____
anxious in my ability to see the full clinical
Self-confident 1 2 3 4 5 6
Anxious 1 2 3 4 5 6
Self-confident 1 2 3 4 5 6
Anxious 1 2 3 4 5 6
Self-confident 1 2 3 4 5 6
Anxious 1 2 3 4 5 6
Self-confident 1 2 3 4 5 6
Anxious 1 2 3 4 5 6
Self-confident 1 2 3 4 5 6
Anxious 1 2 3 4 5 6
Self-confident 1 2 3 4 5 6
Anxious 1 2 3 4 5 6

212
Item
Response Format
Not at all Just a little Somewhat Mostly Almost totally Totally
picture of the client‟s problem rather than
focusing in on one part of it.
26. I am _____ self-confident and _____
anxious in my ability to recognize the need to
review a protocol, procedure, or nursing
literature to help me make a clinical decision.
27. I am _____ self-confident and _____
anxious in my ability to correlate physical
assessment findings with the client‟s nonverbal
cues to see if they match or don‟t match.
28. I am _____ self-confident and _____
anxious in my ability to remain open to
different reasons for the client‟s problem even
though the information I gathered may point to
only one reason.
29. I am _____ self-confident and _____
anxious in my ability to incorporate personal
things I know about the client in order to make
decisions in his or her best interest.
30. I am _____ self-confident and _____
anxious in my ability to consider a possible
intervention for the client‟s problem because it
„seems‟ right, even though there is a lack of
Self-confident 1 2 3 4 5 6
Anxious 1 2 3 4 5 6
Self-confident 1 2 3 4 5 6
Anxious 1 2 3 4 5 6
Self-confident 1 2 3 4 5 6
Anxious 1 2 3 4 5 6
Self-confident 1 2 3 4 5 6
Anxious 1 2 3 4 5 6
Self-confident 1 2 3 4 5 6
Anxious 1 2 3 4 5 6

213
Item
Response Format
Not at all Just a little Somewhat Mostly Almost totally Totally
supporting evidence.
31. I am _____ self-confident and _____
anxious in my ability to easily see important
patterns in the information I gathered from the
client.
Self-confident 1 2 3 4 5 6
Anxious 1 2 3 4 5 6
Domain: Intervening and Reflecting on the
decision process (10)
32. I am _____ self-confident and _____
anxious in my ability to evaluate how successful
my clinical decision was in improving the
client‟s physical assessment findings.
33. I am _____ self-confident and _____
anxious in my ability to implement one accurate
intervention if the client is in an emergency
situation.
34. I am _____ self-confident and _____
anxious in my ability to take full responsibility
for the clinical decision I made.
35. I am _____ self-confident and _____
anxious in my ability to implement the „best‟
priority decision option for the client‟s problem.
36. I am _____ self-confident and _____
Self-confident 1 2 3 4 5 6
Anxious 1 2 3 4 5 6
Self-confident 1 2 3 4 5 6
Anxious 1 2 3 4 5 6
Self-confident 1 2 3 4 5 6
Anxious 1 2 3 4 5 6
Self-confident 1 2 3 4 5 6
Anxious 1 2 3 4 5 6

214
Item
Response Format
Not at all Just a little Somewhat Mostly Almost totally Totally
anxious in my ability to evaluate if the clinical
decision I made influenced client satisfaction.
37. I am _____ self-confident and _____
anxious in my ability to evaluate if my clinical
decision improved the client‟s laboratory
findings.
38. I am _____ self-confident and _____
anxious in my ability to evaluate whether the
clinical decision I made actually made the client
better, worse, or didn‟t make a difference.
39. I am _____ self-confident and _____
anxious in my ability to make the final clinical
decision after information is gathered, analyzed,
and possible interventions are evaluated.
40. I am _____ self-confident and _____
anxious in my ability to make a clinical decision
all by myself to solve the client‟s problem.
41. I am _____ self-confident and _____
anxious in my ability to act on at least one
intervention I considered based on my gut-
feeling or intuition.
Self-confident 1 2 3 4 5 6
Anxious 1 2 3 4 5 6
Self-confident 1 2 3 4 5 6
Anxious 1 2 3 4 5 6
Self-confident 1 2 3 4 5 6
Anxious 1 2 3 4 5 6
Self-confident 1 2 3 4 5 6
Anxious 1 2 3 4 5 6
Self-confident 1 2 3 4 5 6
Anxious 1 2 3 4 5 6
Self-confident 1 2 3 4 5 6
Anxious 1 2 3 4 5 6

215
APPENDIX H
Demographic Questions
1. Gender
___ Female
___ Male
2. Age
From the dropdown box, please choose your current age. (< 18, 18… 45, > 45)
3. Ethnicity
___ African American
___ American Indian
___ Asian
___ Caucasian
___ East Indian
___ Hispanic
Other (please specify)
4. In what type of program are you enrolled?
___ Associate degree
___ Baccalaureate degree
5. What is the format of your nursing program?
___ Accelerated
___ Evening/weekend
___ Traditional, 2 semesters per academic year
___ Year round, 3 semesters per academic year
Other (please specify)
6. In what semester of NURSING courses are you currently enrolled?
___ 3rd
___ 4th
___ 5th
___ 6th
___ My school does not follow a semester system
Other (please specify)
7. In what quarter of NURSING courses are you currently enrolled?
___ 4th
___ 5th
___ 6th
___ My school does not follow a quarter system
Other (please specify)
8. Are you currently licensed as an LPN?
___ No
___ Yes

216
9. Do you currently work as a nursing assistant/nurses aid?
___ No
___ Yes
10. How much college experience did you have before beginning your nursing program?
___ 0, I starting my nursing program right out of high school
___ 1 – 2 semesters
___ 3 – 4 semesters
___ > 4 semesters
___ I completed a college degree before starting my nursing program
11. Did you participate in any type of nursing intern/extern program?
___ I am not familiar with this type of program
___ No
___ Yes
12. The content in your clinical nursing course(s) this semester is:
(Check all that apply)
___ Community
___ Critical Care
___ Leadership/Mentorship
___ Medical/Surgical
___ Obstetrics
___ Pediatrics
___ Psych/Mental health
Other (please specify)
13. Please rate the difficulty level of your current CLINICAL NURSING COURSE(s).
Clinical Course
1,
Very
easy
2,
Easy
3,
About what I expected
4,
Hard
5,
Very
hard
Clinical Course #1:
Clinical Course #2:
Clinical Course #3:
14. What is your current grade in the CLINICAL NURSING COURSE(s) you are taking?
Clinical Course A B C D F
Clinical Course #1:
Clinical Course #2:
Clinical Course #3:

217
APPENDIX I
General Perceived Self-Efficacy Scale (GSE)
Item Not at all
true
Hardly
true
Moderately
true
Exactly
true
1. I can always manage to solve difficult
problems if I try hard enough.
1 2 3 4
2. If someone opposes me, I can find
means and ways to get what I want.
1 2 3 4
3. I am certain that I can accomplish my
goals.
1 2 3 4
4. I am confident that I could deal
efficiently with unexpected events.
1 2 3 4
5. Thanks to my resourcefulness, I can
handle unforeseen situations.
1 2 3 4
6. I can solve most problems if I invest
the necessary effort.
1 2 3 4
7. I can remain calm when facing
difficulties because I can rely on my
coping abilities.
1 2 3 4
8. When I am confronted with a problem,
I can find several solutions.
1 2 3 4
9. If I am in trouble, I can think of
something to do.
1 2 3 4
10. I can handle whatever comes my
way.
1 2 3 4
Reproduced with permission from European Journal of Psychological Assessment, Vol,
18, (3), 2002
© 2002 by Hogrefe & Huber Publisher. Cambridge, MA . Toronto . Goettingen . Bern.

218
GSE Permission
Dear Ms. White,
Thank you very much for your permission request to use from our European Journal of
Psychological Assessment, Vol. 18 (3) 2002 the item - The General Perceived Self-
Efficacy Scale on p. 251 from the Appendix of the article - Is General Self-Efficacy a
Universal Construct? Psychometric Findings from 25 Countries by Urte Scholz, Benicio
Gutierrez Dona, Shonali Sud, and Ralf Schwarzer, pp. 242-251.
We are happy to grant you permission to use The General Perceived Self-Efficacy Scale
as outlined in your request.
Please make sure that the following copyright line will appear:
Reproduced with permission from European Journal of Psychological Assessment,
Vol.18, (3), 2002
© 2002 by Hogrefe & Huber Publishers. Cambridge, MA. Toronto. Goettingen.
Bern
Kind regards,
Gitta Bloier
Permissions
Hogrefe & Huber Publishers GmbH
Rohnsweg 25, 37085 Goettingen, Germany
Tel. +49 (551) 99950-421
Fax. +49 (551) 99950-425
www.hogrefe.com
CEO: Dr. G.-Juergen Hogrefe
Registered: Amtsgericht Goettingen, HRB 2224
VAT# DE115303194
-----Original Message----- From: [email protected] [mailto:[email protected]]
Sent: Sunday, January 17, 2010 1:04 PM
Subject: Permission for use of GSE scale
Dear Ms. Bloier -- I am a doctoral student in the School of Nursing at the University of
Nevada, Las Vegas (UNLV) and am working on my dissertation. My research focus is
quantitative instrument development and my work is entitled Self-Confidence and
Anxiety of Nursing Students While Making Clinical Decisions: A Study to Develop and
Test a Research Instrument. In order to establish psychometric properties for my newly
designed instrument, I will have undergraduate nursing students complete not only my
own instrument but also two existing instruments with sound psychometrics.

219
Hence, I am seeking permission to use the General Perceived Self-Efficacy scale as found
in Scholz, U., Gutierrez-Dona, B., Sud, S. & Schwarzer R. (2002). Is general self-
efficacy a universal construct? Psychometric findings in 25 countries. European Journal
of Psychological Assessment, 18(3), 242-251.
If you need any additional information, please let me know. Thank you so much for
attending to this request.
Sincerely,
Krista A. White RN, MSN, CCRN, PhD student UNLV
Email: [email protected]
Phone: XXXXX

220
APPENDIX J
Generalized Anxiety Disorder – 7 Scale (GAD-7)
Over the last 2 weeks, how often have
you been bothered by the following
problems?
Not at all Several
days
More
than half
the days
Nearly
every day
1. Feeling nervous, anxious, or on edge.
0
1
2
3
2. Not being able to stop or control
worrying.
0 1 2 3
3. Worrying too much about different
things.
0 1 2 3
4. Having trouble relaxing.
0 1 2 3
5. Being so restless that it is hard to sit
still.
0 1 2 3
6. Becoming easily annoyed or irritable.
0 1 2 3
7. Feeling afraid as if something awful
might happen.
0 1 2 3
(Kroenke et al., 2007, p. 326)
GAD-7 Copyright Pfizer Inc. all rights reserved; used with permission.

221
GAD-7 Permission
ROA1016499
February 20, 2010
UNLV
York, PA 17406
Dear Ms. White:
Thank you for your request for print format of the following from Annals of Internal
Medicine:
Appendix figure: Kroenke, K., et al, (2007). Anxiety disorders in primary care: Prevalence, impairment, comorbidity, and detection, Annals of Internal Medicine, 146
Permission is granted for the preceding material with the understanding that you will give
appropriate credit to Annals of Internal Medicine as the original source of the material.
Any translated version must carry a disclaimer stating that the American College of
Physicians is not responsible for the accuracy of the translation. This permission
grants non-exclusive, worldwide rights for this edition in print format only. ACP does not
grant permission to reproduce entire articles or chapters on the Internet. This letter
represents the agreement between ACP and Krista A. White RN, MSN, CCRN, PhD
for request ROA1016499 and supersedes all prior terms from the requestor.
Thank you for your interest in Annals of Internal Medicine. If you have any further
questions or would like to discuss the matter further, please contact me at 856-489-8555
or fax 856-489-4999.
Sincerely,
Gina Brown
Permissions Coordinator

222
GAD-7 Permission
Dear Krista,
Thank you for your email. Pfizer is pleased to give permission for the requested use. Please use the following notice: GAD-7 Copyright Pfizer Inc. all rights reserved; used with permission. Best regards, Rosalba Oliveri Trademark Specialist Pfizer Inc. --Trademark Department Mail Stop: 150/2/112 150 East 42nd Street, New York, NY 10017 direct 212.733.1120 | fax 212.573.2273 [email protected] -----Original Message----- From: [email protected] [mailto:[email protected]] Sent: Tuesday, February 02, 2010 8:13 PM To: Customer Response; Request For Permissions Subject: request to use GAD-7 scale To whom it may concern -- I am a doctoral student in the School of Nursing at the University of Nevada, Las Vegas (UNLV) and am working on my dissertation. My research focus is quantitative instrument development and my work is entitled Self-Confidence and Anxiety of Nursing Students While Making Clinical Decisions: A Study to Develop and Test a Research Instrument. In order to establish psychometric properties for my newly designed instrument, I will have undergraduate nursing students complete not only my own instrument but also two existing instruments with sound psychometrics. Hence, I am seeking permission to use the Generalized Anxiety Disorder-7 scale. The 7-item GAD-7 scale was developed by K. Kroenke, R. Spitzer, et al. approximately 2006 and I believe it was developed with grant money from Pfizer Inc. I have located a copy of the GAD-7 in the Annals of Internal Medicine, 146(5), p, 326 or W-77 and have received permission from this journal to use the scale in my dissertation work. If you need any additional information, please let me know. Thank you so much for attending to this request. I am in need of permission by February 20, 2010. Sincerely, Krista A. White RN, MSN, CCRN, PhD student UNLV Email: [email protected] Phone: XXXXX

223
GAD-7 Permission
Yes, you have permission. Attached is a document with information on the PHQ family of scales
including the GAD-7
Kurt Kroenke, MD
Professor of Medicine, Indiana University
Regenstrief Institute, 5th Floor
1050 Wishard Blvd
Indianapolis, IN 46202
Phone: 317-630-7447 (Donna Burgett)
Fax: 317-630-6611
E-mail: [email protected]
-----Original Message-----
From: [email protected] [mailto:[email protected]]
Sent: Wednesday, February 03, 2010 4:08 PM
Subject: GAD-7 permission
Dear Dr. Kroenke -- I am a doctoral student in the School of Nursing at the
University of Nevada, Las Vegas (UNLV) and am working on my dissertation. My
research focus is quantitative instrument development and my work is entitled
Self-Confidence and Anxiety of Nursing Students While Making Clinical Decisions:
A Study to Develop and Test a Research Instrument. In order to establish
psychometric properties for my newly designed instrument, I will
have undergraduate nursing students complete not only my own instrument but also
two existing instruments with sound psychometrics.
Hence, I am seeking permission to use the Generalized Anxiety Disorder-7 scale
as found in the article by Kroenke, K., Spitzer, R., Williams, J., Monahan, P.,
and Lowe, B. (2007). Anxiety disorders in primary care: Prevalence, impairment,
comorbidity, and detection, Annals of Internal Medicine, 146(5), 317-325. The
scale appears as an Appendix figure on page W-77 at the end of the article.
At the present time I have secured permissions from both Pfizer and the Annals
of Internal Medicine to reproduce the scale.
If you need any additional information, please let me know. Thank you so much
for attending to this request. I am excited to use your instrument to support my
own research.
Sincerely,
Krista A. White RN, MSN, CCRN, PhD student UNLV
Email: [email protected]
Phone: XXXXX

224
APPENDIX K
IRB Approval from UNLV and Informed Consent

225

226

227

228
APPENDIX L
Contact Letter for Faculty-Contact
Dear ____ (Name will be placed here) -- I am a PhD candidate in the School of Nursing
at the University of Nevada, Las Vegas (UNLV) and am working on my dissertation
research. My research focus is quantitative instrument development and my work is
entitled: The Development and Validation of a Tool to Measure Self-Confidence and
Anxiety in Nursing Students While Making Clinical Decisions.
I am writing to ask for your assistance with the student recruitment and data collection
phase of my study. Your name was given to me by your Dean/Direction as a possible
contact person and I am excited to work with you. If you agree with help with the study,
here is all that you would be asked to do: (1) announce the intent of the study to your
class; (2) email a student recruitment flyer to your students and post it in your classroom;
(3) describe to the students that they are being invited to voluntarily complete an online
survey by May 6, 2011; and (4) answer questions students may have about the study.
Additionally, you would be asked to verbally remind your students to complete the
survey and send them an email reminder with the survey link one week and three weeks
after initial deployment of the survey. I will ensure that you have all the necessary
information about the study prior to the discussion with your class! I will also send you
the two follow-up reminder emails.
If permission is granted and schedules allow, I would like to visit your campus and talk to
your class in person. During my visit I would present the intent of the study, let students
know their role, and answer questions. Data collection will not occur during my campus
visit. You would still be asked to deploy the survey link and invite students to
voluntarily complete the survey.
If you have any questions at all or would like additional information, please let me know.
Thank you in advance for your assistance with my PhD dissertation research. I look
forward to working with you and your students.
Sincerely,
Krista A. White MSN, RN, CCRN, PhD(c)
Email: [email protected]
Phone: XXXXX

229
APPENDIX M
Student Recruitment Flyer
Are you at least 18 years old and enrolled in one of your last two clinical semesters of nursing school?
If so, you may be eligible to participate in a research study. Purpose of the study: To gather information about a new survey that measures how anxious and confident students feel while making decisions in clinical. What will I do?: Complete an on-line survey and click “Submit”. The survey-link will be emailed to you by one of your professors. What kinds of questions will I be asked?: You will be asked questions about background information and how you feel while making decisions in clinical. You will also be asked to complete two short surveys that include questions about your usual levels of confidence and anxiety outside of school. How long will it take to complete the survey?: It takes about 15-20 minutes to complete and your responses are important to the study results. When will I complete the survey?: Anytime before Friday, May 6, 2011. Will my information be kept confidential?: YES. Confidentiality will always be maintained. Your responses to the survey are anonymous. The researchers will NOT have access to your name or individual email address. The only people who will have access to your survey responses are the Principal Investigator and Student Investigator of the study. Participation is voluntary. Why should I participate?: Your information will help teachers see how students feel while making clinical decisions. If nurse educators know this information, they can help students learn the process better. Who do I contact if I have questions?: Principal Investigator: Dr. Cheryl Bowles, University of Nevada, Las Vegas, Nursing Department; (702) 892-3082; [email protected] Student Investigator: Krista White, MSN, RN, CCRN, PhD Candidate, University of Nevada, Las Vegas, Nursing Department; Phone: XXXXX; [email protected]
Have you ever felt anxious in clinical or lacked confidence in
clinical??

230
APPENDIX N
Initial Email Sent to Student by Faculty-Contact
If you’ve ever felt anxious or lacked confidence in clinical, here
is a chance for you to make a difference!!
Dear Student – Recently one of your professors talked to you about volunteering to
participate in a research study. As a nursing student, I know your time is precious so I do
appreciate your participation. This is an opportunity for you to help other nursing
students and faculty members learn more about how students feel about their
confidence level and anxiety level while making decisions in the clinical setting. For
my PhD research study, I am designing a new survey about this topic and you can
help test it!
Contained at the end of this email is a link to an online survey. All you have to do is
click on the link, complete the survey and click submit. It will take you about 20
minutes but the information you provide is very important to my study results. So,
please consider completing the survey!! Participation is voluntary.
The deadline for completion of the online survey is Friday, May 6, 2011. Your
responses to the survey are completely anonymous and all your information will be kept
confidential. Only I and one of my professors will have access to your information.
If you have any questions or would like additional information prior to entering the
survey, please let me know. Thank you in advance for completing the survey and helping
with my PhD dissertation research. Your time is very much appreciated.
Sincerely,
Krista A. White MSN, RN, CCRN, PhD(c)
Email: [email protected]
Phone: XXXXX
<<< LINK TO SURVEY PACKAGE GOES HERE >>>

231
APPENDIX O
Faculty-Contact and Student Follow-up Emails
Faculty-Contact Follow-up Email
Dear ___ (Name will be placed here) – About one week ago (or this will read three weeks
ago for the second follow-up) you forwarded an email, sent from me, to your students
inviting them to voluntarily participate in a research study. This message is being sent
to ask that you verbally remind your students about the study and invite them to
complete the online survey. If you have any questions or would like additional
information please let me know. Thank you so much.
I am asking that you remind your students using this scripted message:
“A week ago you received an email inviting you to complete an online survey about your
confidence and anxiety levels while making decisions in clinical. This is an opportunity
for you to participate in a research study and make a difference for nursing students. The
researcher is designing a new survey and you can help test it! Thank you if you who
have already completed the survey.
If you think you may be interested in completing the survey, see the flyer on the bulletin
board in our classroom for more information. If you have not already completed the
survey and are interested in participating, be sure to check your email because I will be
forwarding a reminder (sent to me by the researcher) with the link to enter the survey.
The deadline for completion is Friday, May 6, 2011.
Just a reminder, please complete the survey only ONCE. If you’ve already filled it
out, don’t complete it again. The researcher would like to thank you all for your time
and help with her research study.”
Sincerely,
Krista A. White MSN, RN, CCRN, PhD(c)
Email: [email protected]
Phone: XXXXX

232
Student Follow-up Email
If you’ve ever felt anxious or lacked confidence in clinical, here
is a chance for you to make a difference!!
Dear Student – About one week ago (or this will read three weeks ago for the second
follow-up) one of your professors sent you an email inviting you to voluntarily
participate in a research study. If you have completed the survey, thank you so much for
your time!! If you have not completed the online survey, this message is being sent to
remind you of the study and invite you to complete the online survey attached to this
email. Please complete the survey only ONCE.
For my PhD research study, I am designing a new survey and you can help test it!! This
is an exciting opportunity for you to help other nursing students and faculty members
learn more about how students feel about their confidence level and anxiety level while
making decisions in the clinical setting!
Contained at the end of this email is a link to an online survey. All you have to do is
click on the link, complete the survey and click submit. It will take you about 20
minutes but the information you provide is very important to my study results. So,
please consider completing the survey!! Participation is voluntary.
The deadline for completion of the online survey is Friday, May 6, 2011. Your
responses to the survey are completely anonymous and all your information will be kept
confidential. Only I and one of my professors will have access to your information.
If you have any questions or would like additional information prior to entering the
survey, please let me know. Thank you in advance for completing the survey and helping
with my PhD dissertation research. Your time is very much appreciated.
Sincerely,
Krista A. White MSN, RN, CCRN, PhD(c)
Email: [email protected]
Phone: XXXXX
<<< LINK TO SURVEY PACKAGE GOES HERE >>>

233
APPENDIX P
Characteristics and Comparisons of the Sample, Pilot
N = 349
Demographic Questions
Complete
Surveys
(n = 303)
Incomplete
Surveys
(n = 46)
Statistic
Gender
Female
Male
283 (93.4%)
20 (6.6%)
44 (95.7%)
2 (4.3%)
Fisher’s Exact,
p = .75
Age (M, + SD)
29.16 + 7.50*
27.67 + 7.04*
t = -1.30, p = .20
Ethnicity
African American
American Indian
Asian
Caucasian
East Indian
Hispanic
Other
African
Arab
Caucasian & Hispanic
Hawaiian
*
13 (4.4%)
1 (0.3%)
13 (4.4%)
257 (86.5%)
0
13 (4.4%)
---
1 (0.3%)
1 (0.3%)
2 (1.7%)
1 (0.3%)
*
6 (13.6%)
0
2 (4.5%)
34 (77.4%)
0
2 (4.5%)
---
1 (2.2%)
0
0
1 (2.2%)
LR = 5.14,
p = .27
Program type
Associate degree
Baccalaureate degree
192 (63.4%)
111 (36.6%)
17 (37%)
29 (63%)
Χ2 = 11.59 **
Program format
Accelerated
Evening/weekend
Traditional, 2 semesters per
academic year
Year round, 3 semesters per
academic year
Other
*
18 (6%)
66 (21.9%)
141 (46.7%)
77 (25.5%)
0
*
8 (17.8%)
8 (17.8%)
22 (53.3%)
5 (11.1%)
0
Χ2 = 11.40 **

234
Demographic Questions
Complete
Surveys
(n = 303)
Incomplete
Surveys
(n = 46)
Statistic
Current nursing semester
3rd
4th
5th
6th
My school does not follow a
semester system
Other
7th
8th and final semester
*
106 (42.9%)
63 (25.5%)
40 (16.2%)
38 (15.4%)
0
---
14 (4.6%)
37 (2.2%)
*
9 (25.7%)
8 (22.9%)
14 (40%)
4 (11.4%)
0
---
5 (10.9%)
6 (13%)
Χ2 = 11.70 **
Current nursing quarter
4th
5th
6th
My school does not follow a
quarter system
Other
*
0
0
0
292 (96.4%)
0
0
0
0
46 (100%)
0
Currently working as nursing
assistant
No
Yes
*
207 (68.3%)
95 (31.4%)
30 (65.2%)
16 (34.8%)
Χ2 = .20,
p = .65
College experience before
nursing school
I started my nursing program right
out of high school
1 to 2 semesters
3 to 4 semesters
> 4 semesters
I completed a college degree
before starting my nursing
program
*
45 (15.1%)
30 (10%)
53 (17.7%)
79 (26.4%)
92 (30.8%)
10 (21.7%)
5 (10.9%)
9 (19.6%)
4 (7.8%)
18 (39.1%)
LR = 8.60,
p = .07
Participation in nursing
intern/extern program
No
Yes
I am not familiar with this type
of program
236 (77.9%)
52 (17.2%)
15 (5%)
34 (73.9%)
10 (21.7%)
2 (4.3%)
LR = .56,
p = .76

235
Demographic Questions
Complete
Surveys
(n = 303)
Incomplete
Surveys
(n = 46)
Statistic
Content of current clinical
nursing course(s)
(Choose all that apply)
Community
Critical Care
Medical/Surgical
Obstetrics
Pediatrics
Psych/mental health
Other
Cardiac telemetry
Day surgery
Emergency department
Geriatrics
Leadership/mentorship
Long-term care
Oncology
Operating room
Orthopedics
Rehabilitation
107 (35.3%)
120 (39.6%)
200 (66%)
60 (19.8%)
97 (32%)
136 (44.9%)
---
6 (2%)
1 (0.3%)
10 (3.3%)
1 (0.3%)
7 (2.3%)
1 (0.3%)
7 (2.3%)
2 (0.6%)
4 (1.3%)
1 (0.3%0
10 (21.7%)
14 (30.4%)
23 (50%)
9 (19.6%)
15 (32.6%)
13 (28.3%)
---
0
0
0
1 (2.2%)
2 (4.3%)
0
0
0
0
0
Note. t = independent samples t-test; LR = likelihood ratio; Χ2 = chi square for
independence
* Indicates some missing values
** p < .01 (2-tailed)

236
Course Difficulty with Course Grade for Complete Survey Group (n = 303)
Difficulty Level of Clinical
Nursing Course # 1
Grade A Grade B Grade C Grade D Grade F
Very easy 2 1
Easy 17 4
About what I expected 66 74 10 2
Hard 18 47 20 9 1
Very hard 5 6 14 3
Spearman rho correlation rho = .44(297), p <.001¥
Difficulty Level of Clinical
Nursing Course # 2
Grade A Grade B Grade C Grade D Grade F
Very easy 1
Easy 2 2
About what I expected 35 40 12 2
Hard 13 37 16 2 1
Very hard 4 7 8 2
Spearman rho correlation rho = .29(182), p < .001¥
Difficulty Level of Clinical
Nursing Course # 3
Grade A Grade B Grade C Grade D Grade F
Very easy 1
Easy 1 2
About what I expected 18 22 9 2
Hard 7 26 11 1 1
Very hard 2 8 4
Spearman rho correlation rho = .21(113), p = .02¥
Difficulty Level of Clinical
Nursing Course # 4
Grade A Grade B Grade C Grade D Grade F
Very easy
Easy 2 1
About what I expected 12 14 5 1
Hard 7 13 5 1
Very hard 3 6 4
Spearman rho correlation rho = -.18(72), p = .12
¥ Indicates statistical significance

237
Course Difficulty with Course Grade for Incomplete Survey Group (n = 46)
Difficulty Level of Clinical
Nursing Course # 1
Grade A Grade B Grade C Grade D Grade F
Very easy 1
Easy 1 1
About what I expected 11 11 1
Hard 8 8
Very hard 2 1
Spearman rho correlation rho = .50(43), p < .001¥
Difficulty Level of Clinical
Nursing Course # 2
Grade A Grade B Grade C Grade D Grade F
Very easy
Easy 1 1
About what I expected 5 4 1
Hard 2 1
Very hard 1 1
Spearman rho correlation rho = .51(15), p = .04¥
Difficulty Level of Clinical
Nursing Course # 3
Grade A Grade B Grade C Grade D Grade F
Very easy
Easy 1
About what I expected 2 1
Hard 1 2
Very hard
Spearman rho correlation rho = .57(5), p = .17
Difficulty Level of Clinical
Nursing Course # 4
Grade A Grade B Grade C Grade D Grade F
Very easy
Easy
About what I expected 1
Hard 1 3 2
Very hard
Spearman rho correlation rho = -.44(5), p = .32
¥ Indicates statistical significance

238
APPENDIX Q
Factor Analysis Results for Self-Confidence Subscale, Pilot
n = 268
Factor
Initial eigenvalue
Rotation sums of squared loadings
Total % of variance Cumulative % Total % of variance Cumulative %
I 25.52 a 62.25 62.25 9.51 22.20 23.20
II 1.75 4. 26 66.51 9.21 22.47 45.67
III 1.17 2.86 69.37 6.84 16.68 62.35
IV 1.01 2.46 71.83 3.88 9.47 71.83
V .77
Initial run: Principal component analysis with varimax rotation
a, Bold numbering indicates the four factors retained
Question # for
Self-confidence Sub-scale
Descriptor
Factors a, b
h2 c
I II III IV
Q13 Use of resources – faculty/staff .911 d .071 -.316 .136 .667
Q32 Use of resources –faculty/staff .905 .023 -.158 -.008 .640
Q35 Gathering information from family .626 .005 .242 -.039 .655
Q34 Remain open to reasons for problem .614 .072 .190 -.034 .651
Q16 Use of resources – protocol or literature .607 .072 -.044 .191 .565
Q22 Recognize information from report .601 .244 .066 -.032 .691
Q24 Gather more specific information from patient .596 -.034 .251 .116 .731
Q17 Importance of information from others .547 .034 .183 .210 .752
Q36 Evaluation of decision on patient satisfaction .544 -.058 .383 .050 .742
Q40 Gather more information through more assessment .486 .263 .173 .022 .742
Q15 Assess nonverbals .449 -.138 .275 .377 .738

239
Question # for
Self-confidence Sub-scale
Descriptor
Factors a, b
h2 c
I II III IV
Q21 e Evaluation of decision on patient condition .443 .089 .384 .035 .763
Q5 See the full clinical picture -.074 .811 -.031 .172 .701
Q10 Interpret meaning of findings .127 .725 .012 .009 .698
Q4 Identify relevant information .033 .707 -.088 .308 .753
Q3 See patterns in the information -.088 .697 -.010 .318 .700
Q7 Recall past learned knowledge .014 .648 .101 .085 .621
Q33 Correlate test findings with assessment findings .447 .641 -.068 -.159 .750
Q11 Evaluation of decision on lab findings .239 .627 .015 -.059 .632
Q31 Use knowledge to create list of decision options .148 .605 .254 -.173 .711
Q18 Use knowledge to interpret information .246 .570 .100 -.082 .646
Q8 Recognize problem by reading the chart .089 .479 .014 .195 .628
Q2 Make the final decision to act -.303 .474 .417 .291 .656
Q9 Implement the „best‟ decision option -.068 .461 .426 .067 .671
Q30 Implement decision in emergent situation .100 .411 .375 -.082 .598
Q39 Consider an intervention because it „seems‟ right -.257 .235 .791 .056 .602
Q37 Gather information because something ‘feels’ wrong .324 -.105 .671 .019 .768
Q19 Implement decision based on intuition .131 -.027 .670 .158 .735
Q23 Independently make the decision .148 .440 .623 -.042 .742
Q38 Make the decision based on patient knowledge .335 .029 .517 -.015 .671
Q20 Analyze risk of interventions .163 .263 .478 .051 .751
Q27 Use past knowledge to help interpret information .334 .169 .419 -.042 .680
Q25 Know when enough information is gathered .211 .296 .408 .040 .748
Q29 Correlate assessment with nonverbals .307 .126 .407 .154 .774
Q1 Listen carefully to the patient .164 .118 -.058 .588 .537
Q6 Detect when verbal and nonverbal don‟t match .204 .040 .151 .532 .655

240
Question # for
Self-confidence Sub-scale
Descriptor
Factors a, b
h2 c
I II III IV
Q14 Use active listening to gather information .624 .017 -.137 .412 .692
Q12 Evaluation of decision on patient assessment No loading > .40 on any factor .718
Q26 Identify irrelevant information No loading > .40 on any factor .732
Q28 Change my assessment of the patient problem No loading > .40 on any factor .741
Q41 Take full responsibility for decision made No loading > .40 on any factor .517
Initial eigenvalue f 25.52 1.75 1.17 1.01
Rotation sums of
squared loadings g
21.37 20.65 21.09 11.94
Alpha factoring with promax rotation. Rotation converged in 14 iterations.
a, Factor labels: (I) using resources to gather information; (II) using information to see the big picture; (III) knowing and
acting; (IV) listening fully
b, Substantial loading is > .40
c, Communality is the variance per item across factors = row sums of squared loadings
d, Bold font indicates substantial loading on corresponding factor
e, Italicized questions were reduced from the pilot version of the scale
f, Eigenvalue is the variance per factor across items = column sums of squared loadings
g, When factors are correlated, sums of squared loadings cannot be added to obtain a total variance
Factor Correlation Matrix a
Factor I II III IV
I 1.00
II .717 1.00
III .777 .758 1.00
IV .568 .534 .568 1.00
a, Correlations of > .40 indicate inter-related factors

241
APPENDIX R
Factor Analysis Results for Anxiety Subscale, Pilot
n = 258
Factor
Initial eigenvalue
Rotation sums of squared loadings
Total % of variance Cumulative % Total % of variance Cumulative %
I 24.24 a 59.12 59.12 12.83 31.29 31.29
II 1.85 4. 52 63.64 7.67 18.71 50.00
III 1.20 2.93 66.57 6.79 16.57 66.57
IV .94
Initial run: Principal component analysis with varimax rotation
a, Bold numbering indicates the three factors retained
Question # for
Anxiety Sub-scale
Descriptor
Factors a, b
h2 c
I II III
Q15 Assess nonverbals .915 d -.085 -.021 .701
Q14 Use active listening to gather information .883 -.150 .058 .670
Q17 Importance of information from others .855 -.095 .053 .682
Q24 Gather more specific information from patient .800 .034 .001 .680
Q36 Evaluation of decision on patient satisfaction .790 .111 -.048 .707
Q16 Use of resources – protocol or literature .764 -.127 .158 .630
Q32 Use of resources –faculty/staff .730 .059 .007 .610
Q38 Make the decision based on patient knowledge .708 .241 -.079 .712
Q29 Correlate assessment with nonverbals .699 .183 .007 .723
Q34 Remain open to reasons for problem .651 .037 .125 .606
Q13 Use of resources – faculty/staff .647 -.129 .143 .442
Q6 Detect when verbal and nonverbal don‟t match .643 -.153 .246 .532

242
Question # for
Anxiety Sub-scale
Descriptor
Factors a, b
h2 c
I II III
Q27 Use past knowledge to help interpret information .635 .140 .078 .653
Q35 Gathering information from family .629 .049 .115 574
Q26 e Identify irrelevant information .626 .159 .099 .593
Q1 Listen carefully to the patient .626 -.204 .252 .467
Q37 Gather information because something ‘feels’ wrong .582 .434 -.219 .684
Q40 Gather more information through more assessment .569 .146 .169 .677
Q21 Evaluation of decision on patient condition .558 .391 -.062 .712
Q25 Know when enough information is gathered .539 .289 .093 .728
Q28 Change my assessment of the patient problem .504 .400 .118 .729
Q22 Recognize information from report .459 .230 .112 .550
Q33 Correlate test findings with assessment findings .432 .149 .303 .659
Q12 Evaluation of decision on patient assessment .418 .143 .399 .697
Q30 Implement decision in emergent situation -.274 .849 .193 .635
Q41 Take full responsibility for decision made -.169 .800 .123 .588
Q23 Independently make the decision -.050 .798 .089 .680
Q39 Consider an intervention because it „seems‟ right .143 .786 -.171 .610
Q20 Analyze risk of interventions .189 .624 .104 .712
Q19 Implement decision based on intuition .307 .599 -.063 .652
Q9 Implement the „best‟ decision option .007 .521 .299 .590
Q2 Make the final decision to act -.190 .450 .469 .494
Q5 See the full clinical picture .081 .025 .736 .667
Q4 Identify relevant information .321 -.010 .677 .751
Q7 Recall past learned knowledge .005 .150 .602 .519
Q3 See patterns in the information .241 .063 .543 .624
Q10 Interpret meaning of findings .233 .166 .524 .720
Q31 Use knowledge to create list of decision options .125 .341 .431 .671

243
Question # for
Anxiety Sub-scale
Descriptor
Factors a, b
h2 c
I II III
Q18 Use knowledge to interpret information .178 .261 .431 .630
Q11 Evaluation of decision on lab findings .244 .170 .426 .591
Q8
Recognize problem by reading the chart No loading > .40 on any factor .530
Initial eigenvalue f 24.24 1.85 1.20
Rotation sums of
squared loadings g
22.13 18.73 18.15
Alpha factoring with promax rotation. Rotation converged in 9 iterations.
a, Factor labels: (I) using resources to gathering information and listening fully; (II) knowing and acting; (III) using
information to see the big picture
b, Substantial loading is > .40
c, Communality is the variance per item across factors = row sums of squared loadings
d, Bold font indicates substantial loading on corresponding factor
e, Italicized questions were reduced from the pilot version of the scale
f, Eigenvalue is the variance per factor across items = column sums of squared loadings
g, When factors are correlated, sums of squared loadings cannot be added to obtain a total variance
Factor Correlation Matrix a
Factor I II III
I 1.00
II .755 1.00
III .749 .709 1.00
a, Correlations of > .40 indicate inter-related factors

244
APPENDIX S
Overlapping Items among NASC-CDM Subscales, Pilot
Factor Number Self-Confidence * Factor Number Anxiety *
I Q13 I Q13
Q32 Q32
Q35 Q35
Q34 Q34
Q16 Q16
Q22 Q22
Q24 Q24
Q17 Q17
Q36 Q36
Q40 Q40
Q15 Q15
IV Q1 Q1
Q6 Q6
Q14 Q14
------ Q27
------ Q29
------ Q38
II Q5 III Q5
Q10 Q10
Q4 Q4
Q3 Q3
Q7 Q7
Q11 Q11
Q31 Q31
Q18 Q18
III Q2 II Q2
Q9 Q9
Q30 Q30
Q39 Q39
Q19 Q19
Q23 Q23
Q20 Q20
Q27 ------
Q29 ------
Q38 ------
* Includes the 32 items remaining on the scale after the reduction of 9 items.

245
APPENDIX T
Reliability Results of Subscales, Pilot
Reliability Results for the NASC-CDM, SC & NASC-CDM, A;
Pilot Version
Subscale
Name
Number
of Items
Scoring
Range
(1 – 6 Likert)
Cronbach’s
Alpha
Mean Inter-Item
Correlation
(Minimum/Maximum)
Mean
Score and (SD)
NASC-
CDM, SC
(n = 291)
41
41- 246
.98a
.56 (.26/.79)
161.42
(+ 36.73)
NASC-
CDM, A
(n = 293)
41
41- 246
.98a
.52 (.26/.76)
106.24
(+ 32.72)
a, No change in Cronbach‟s alpha was noted with the deletion of any item.
Reliability Results for the NASC-CDM, SC & NASC-CDM, A;
After Nine Item Reduction, Pilot
Subscale
Name
Number
of Items
Scoring
Range
(1 – 6 Likert)
Cronbach’s
Alpha
Mean Inter-Item
Correlation
(Minimum/Maximum)
Mean
Score and (SD)
NASC-
CDM, SC
(n = 291)
32
32 - 192
.97a
.54 (.26/.74)
125.99
(+ 28.25)
NASC-
CDM, A
(n = 293)
32
32 - 192
.97a
.51 (.26/.76)
82.95
(+ 25.36)
a, No change in Cronbach‟s alpha was noted with the deletion of any item.

246
APPENDIX U
Results of Independent Samples t-tests, Pilot
NASC-CDM
Subscale
IV Levels of
IV
Mean
+ SD
n t(df) pa
Self-Confidence
Gender
Male
Female
176.79 + 33.05
160.36 + 36.75
19
272
-1.09(289)
.06
Anxiety
Gender
Male
Female
80.93 + 19.92
106.68 + 31.71
14
240
4.50(252)
< .001¥
Self-Confidence
Program type
Associate
Baccalaureate
158.97 + 37.92
165.75 + 34.20
185
106
1.52(289)
.13
Anxiety
Program type
Associate
Baccalaureate
105.18 + 32.72
105.43 + 29.35
179
75
-.06(252)
.96
Self-Confidence
Externship participation
Yes
No
163.33 + 31.57
160.86 + 38.44
51
225
-.43(274)
.67
Anxiety
Externship participation
Yes
No
104.65 + 30.17
105.62 + 32.54
32
207
.16(237)
.88
Self-Confidence
Nursing assistant
employment
Yes
No
158.90 + 34.06
161.71 + 38.83
31
205
.38(236)
.70
Anxiety
Nursing assistant
employment
Yes
No
100.92 + 30.35
107.16 + 32.25
76
177
1.44(251)
.15
Note. IV = independent variable; SD = standard deviation
a, (2-tailed); ¥, statistically significant

247
APPENDIX V
Five Questions Related to the NASC-CDM Scale, Pilot
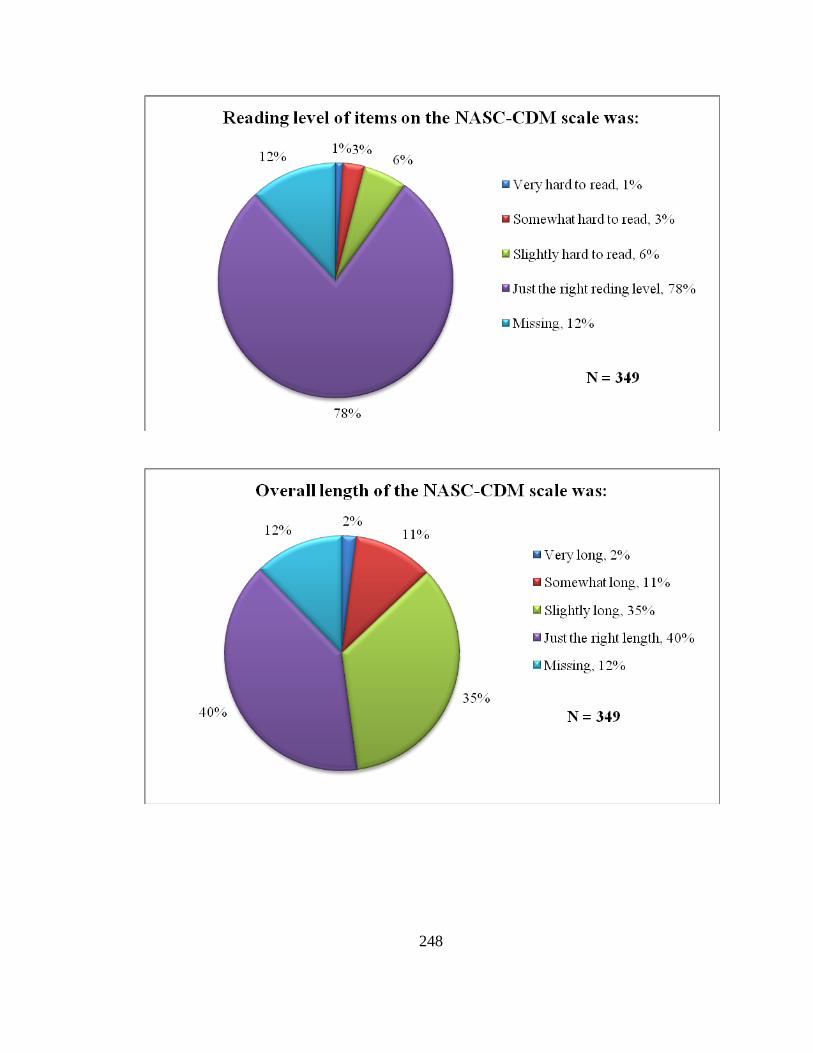
248

249

250
APPENDIX W
Content Analysis for Open-Ended Question Related to the NASC-CDM Scale, Pilot
n = 72
Comment
Type
Topic or Comment Number of
Responses
Positive
Good length; easy to follow.
I really had to concentrate.
“It was interesting how there were similar questions
phrased differently each time – the wording made me
really think it through – well structured survey.”
Very straight forward survey.
Brought my attention to my strengths and
weaknesses.
Made me realize how I‟ve grown in my
education.
Survey is excellent.
“I enjoyed the statements because most of them are what I
think about during clinical. The questions were very
applicable to nursing students‟ situations.”
2
2
1
1
1
1
1
1
Negative
Redundant items.
Too long.
Some situations I have not encountered.
Boring.
A bit too wordy.
4
4
3
2
1
Format of scale
Separate the two subscales.
Start each question with the content not the part about the
self-confidence and anxiety sentence completion.
Format was cumbersome.
Answer choices made it seem like self-confidence and
anxiety had to be opposites.
Put self-confidence and anxiety on opposite ends of a
scale.
Need more than six answer choices.
Background color was distracting.
6
5
4
2
1
1
1
Unrelated to
scale
The nursing instructor has a large influence on students‟
levels of self-confidence and anxiety during clinical.
Students all have some anxiety about the decisions they
make.
Self-confidence and anxiety are influenced by the number
of clinical hours and experiences.
“I would have liked to see questions on how fatigued,
stressed SNs [student nurses] are going into the clinical
site… this really has affected my ability for recall,
applying new knowledge, and overall performance. This
decreases my self-confidence and anxiety tenfold!”
9
2
1
1

251
APPENDIX X
Characteristics and Comparisons of Sample, Main
N = 275
Demographic Questions
Complete
Surveys
(n = 242)
Incomplete
Surveys
(n = 33)
Statistic
Gender
Female
Male
226 (93.4%)
16 (6.6%)
32 (97%)
1 (3%)
Fisher’s Exact,
p = .70
Age (M, + SD)
25.19 + 5.67*
27. 52 + 8.10*
Mann-Whitney U =
2,825, p = .29
Ethnicity
African American
American Indian
Asian
Caucasian
East Indian
Hispanic
Other
African
Jamaican
18 (7.4%)
1 (0.4%)
7 (2.9%)
207 (85.5%)
1 (0.4%)
5 (2.1%)
---
2 (0.8%)
1 (0.4%)
3 (9.1%)
0
4 (12.1%)
25 (75.8%)
0
1 (3%)
---
0
0
LR = 6.16,
p = .41
Program type
Associate degree
Baccalaureate degree
74 (30.6%)
168 (69.4%)
14 (42.2%)
19 (57.6%)
Χ2 = 1.87,
p = .17
Program format
Accelerated
Evening/weekend
Traditional, 2 semesters per
academic year
Year round, 3 semesters per
academic year
Other
13 (5.4%)
5 (2.1%)
219 (90.5%)
5 (2.1%)
0
3 (9.1%)
0
29 (87.9%)
1 (3%)
0
LR = 2.01,
p = .57
Current nursing semester
3rd
4th
5th
6th
My school does not follow a
semester system
Other
10 (4.1%)
129 (53.3%)
15 (6.2%)
52 (21.5%)
19 (7.9%)
---
0
20 (60.6%)
1 (3%)
4 (12.1%)
6 (18.2%)
---
LR = 7.65,
p = .18

252
Demographic Questions
Complete
Surveys
(n = 242)
Incomplete
Surveys
(n = 33)
Statistic
Don‟t know what you are
asking
1 (0.4%) 0
Last semester
8th of 8 total
6 (2.5%)
10 (4.1%)
1 (3%)
1 (3%)
Current nursing quarter
4th
5th
6th
My school does not follow a
quarter system
Other
3rd
of 4
8th of 8
7 (2.9%)
0
2 (0.8%)
230 (95%)
---
2 (0.8%)
1 (0.4%)
*
2 (6.3%)
0
0
29 (90.6%)
---
1 (3%)
0
LR = 1.90,
p = .60
Currently working as nursing
assistant
No
Yes
*
120 (49.6%)
121 (50%)
20 (60.6%)
13 (39.4%)
Χ2 = 1.36,
p = .24
College experience before
nursing school
I started my nursing program
right out of high school
1 to 2 semesters
3 to 4 semesters
> 4 semesters
I completed a college degree
before starting my nursing
program
*
74 (30.6%)
36 (14.9%)
51 (21.1%)
31 (12.8%)
49 (20.2%)
11 (33.3%)
4 (12.1%)
6 (18.2%)
5 (15.2%)
7 (21.2%)
LR = .48,
p = .97
Participation in nursing
intern/extern program
No
Yes
I am not familiar with this type
of program
*
159 (65.7%)
79 (32.6%)
3 (1.2%)
25 (75.8%)
7 (21.2%)
1 (3%)
LR = 2.28,
p = .32
Content of current clinical
nursing course(s)
(Choose all that apply)
Community
Critical Care
Leadership/mentorship
Medical/Surgical
Obstetrics
96 (39.7%)
98 (40.5%)
145 (59.9%)
133 (55%)
24 (9.9%)
15 (45.5%)
13 (39.4%)
18 (54.5%)
19 (57.6%)
6 (18.2%)

253
Demographic Questions
Complete
Surveys
(n = 242)
Incomplete
Surveys
(n = 33)
Statistic
Pediatrics
Psych/mental health
Other
Cardiac telemetry
Geriatrics
Long-term care
Neonatal intensive care
Oncology
Senior seminar
30 (12.4%)
76 (31.4%)
---
1 (0.4%)
9 (3.7%)
3 (1.2%)
1 (0.4%)
8 (3.3%)
4 (1.7%)
7 (21.2%)
13 (39.4)
---
0
3 (9.1%
0
0
2 (6.1%)
1 (3%)
Note. LR = likelihood ratio; Χ2 = chi square for independence
* Indicates some missing values
** Statistically significant at p < .01 (2-tailed)

254
Course Difficulty with Course Grade for Complete Survey Group (n = 242)
Difficulty Level of Clinical
Nursing Course # 1
Grade A Grade B Grade C Grade D Grade F
Very easy 5 1
Easy 14 4 1
About what I expected 61 67 10
Hard 21 32 9
Very hard 4 8 5
Spearman rho correlation, rho = .25, p < .001**
Difficulty Level of Clinical
Nursing Course # 2
Grade A Grade B Grade C Grade D Grade F
Very easy 3 1 1 1
Easy 9 5 2
About what I expected 54 54 11 1
Hard 18 27 6
Very hard 9 4
Spearman rho correlation, rho = .18, p = .01**
Difficulty Level of Clinical
Nursing Course # 3
Grade A Grade B Grade C Grade D Grade F
Very easy
Easy 2 4
About what I expected 20 21 6 1
Hard 7 14 1
Very hard 4 4
Spearman rho correlation, rho = -.03, p = .75
** Indicates statistical significance

255
Course Difficulty with Course Grade for Incomplete Survey Group (n = 33)
Difficulty Level of Clinical
Nursing Course # 1
Grade A Grade B Grade C Grade D Grade F
Very easy 2 1
Easy 2 1
About what I expected 7 6 1
Hard 4 4 1
Very hard 1 1
Spearman rho correlation, rho = .19, p = .29
Difficulty Level of Clinical
Nursing Course # 2
Grade A Grade B Grade C Grade D Grade F
Very easy 1 1
Easy 3 1
About what I expected 5 6 1
Hard 4 2 3
Very hard 1
Spearman rho correlation, rho = .32, p = .10
Difficulty Level of Clinical
Nursing Course # 3
Grade A Grade B Grade C Grade D Grade F
Very easy
Easy
About what I expected 5 3 2
Hard 1 1
Very hard 1
Spearman rho correlation, rho = .26, p = .39
** Indicates statistical significance

256
APPENDIX Y
Factor Analysis Results for Self-Confidence Subscale, Main
n = 223
Factor
Initial eigenvalue
Rotation sums of squared loadings
Total % of variance Cumulative % Total % of variance Cumulative %
I 19.70 a 61.55 61.55 8.27 25.86 25.86
II 1.51 4. 71 66.26 8.20 25.63 51.49
III 1.04 3.25 69.51 5.76 18.02 69.51
IV .78
Initial run: Principal component analysis with varimax rotation
a, Bold numbering indicates the three factors retained
Question # for
Self-confidence Sub-scale
Descriptor
Factors a, b
h2 c
I II III
Q13 Use of resources – faculty/staff .884 d .246 -.352 .680
Q32 Use of resources –faculty/staff .857 .022 -.042 .708
Q35 Gathering information from family .802 -.323 .326 .715
Q24 Gather more specific information from patient .754 .018 .094 .630
Q14 Use active listening to gather information .732 .158 .002 .736
Q22 Recognize information from report .551 .213 .111 .665
Q17 Importance of information from others .519 .234 .127 .685
Q16 Use of resources – protocol or literature .499 .144 .166 .568
Q34 Remain open to reasons for problem .484 -.027 .351 .593
Q15 Assess nonverbals .440 .202 .251 .675
Q36 Evaluation of decision on patient satisfaction .403 -.133 .512 .732
Q38 Make the decision based on patient knowledge .405 -.082 .565 .723

257
Question # for
Self-confidence Sub-scale
Descriptor
Factors a, b
h2 c
I II III
Q1 e Listen carefully to the patient .401 .389 .010 .563
Q27 Use past knowledge to help interpret information No loading > .40 on any factor .743
Q40 Gather more information through more assessment No loading > .40 on any factor .685
Q7 Recall past learned knowledge .063 .835 -.128 .622
Q5 See the full clinical picture -.028 .786 .098 .707
Q4 Identify relevant information .057 .736 .026 .638
Q18 Use knowledge to interpret information .144 .729 -.044 .650
Q10 Interpret meaning of findings .078 .717 .052 .668
Q9 Implement the „best‟ decision option -.082 .697 .233 .675
Q3 See patterns in the information .052 .628 .172 .649
Q2 Make the final decision to act -.076 .576 .336 .605
Q23 Independently make the decision -.083 .562 .353 .630
Q11 Evaluation of decision on lab findings .221 .532 .109 .641
Q6 Detect when verbal and nonverbal don’t match No loading > .40 on any factor .618
Q39 Consider an intervention because it „seems‟ right -.161 .137 .735 .521
Q19 Implement decision based on intuition -.062 .275 .672 .645
Q20 Analyze risk of interventions .134 .194 .625 .795
Q30 Implement decision in urgent situation .188 .124 .542 .635
Q31 Use knowledge to create list of decision options .073 .282 .515 .656
Q29 Correlate assessment with nonverbals .302 .120 .469 .675
Initial eigenvalue f 19.70 1.51 1.04
Rotation sums of
squared loadings g
16.40 16.55 15.97
Alpha factoring with promax rotation. Rotation converged in 10 iterations.

258
a, Factor labels: (I) using resources to gather information and listening fully; (II) using information to see the big picture; (III)
knowing and acting
b, Substantial loading is > .40
c, Communality is the variance per item across factors = row sums of squared loadings
d, Bold font indicates substantial loading on corresponding factor
e, Italicized questions were reduced from the revised version of the scale
f, Eigenvalue is the variance per factor across items = column sums of squared loadings
g, When factors are correlated, sums of squared loadings cannot be added to obtain a total variance
Factor Correlation Matrix a
Factor I II III
I 1.00
II .740 1.00
III .747 .769 1.00
a, Correlations of > .40 indicate inter-related factors

259
APPENDIX Z
Factor Analysis Results for Anxiety Subscale, Main
n = 215
Factor
Initial eigenvalue
Rotation sums of squared loadings
Total % of variance Cumulative % Total % of variance Cumulative %
I 17.38 a 54.30 54.30 8.46 26.43 26.43
II 1.83 5.72 60.02 6.41 20.03 46.46
III 1.08 3.37 63.39 5.42 16.93 63.39
IV .94
Initial run: Principal component analysis with varimax rotation
a, Bold numbering indicates the three factors retained
Question # for
Anxiety Sub-scale
Descriptor
Factors a, b
h2 c
I II III
Q14 Use active listening to gather information .884 d -.145 .033 .661
Q32 Use of resources –faculty/staff .866 .010 -.133 .606
Q24 Gather more specific information from patient .793 -.008 .031 .657
Q35 Gathering information from family .721 .259 -.198 .598
Q17 Importance of information from others .709 -.100 .222 .665
Q15 Assess nonverbals .692 -.103 .255 .677
Q36 Evaluation of decision on patient satisfaction .686 .212 -.056 .647
Q13 Use of resources – faculty/staff .654 -.065 .078 .447
Q38 Make the decision based on patient knowledge .651 .336 -.143 .651
Q34 Remain open to reasons for problem .649 .102 .077 .615
Q29 Correlate assessment with nonverbals .527 .154 .124 .554
Q6 e Detect when verbal and nonverbal don’t match .509 -.008 .329 .601

260
Question # for
Anxiety Sub-scale
Descriptor
Factors a, b
h2 c
I II III
Q27 Use past knowledge to help interpret information .462 -.052 .444 .649
Q16 Use of resources – protocol or literature .449 .040 .252 .477
Q22 Recognize information from report .440 .130 .213 .514
Q1 Listen carefully to the patient No loading > .40 on any factor .407
Q40 Gather more information through more assessment No loading > .40 on any factor .548
Q39 Consider an intervention because it „seems‟ right .026 .711 .040 .578
Q30 Implement decision in urgent situation .020 .691 .080 .588
Q19 Implement decision based on intuition .132 .679 -.063 .530
Q23 Independently make the decision -.081 .648 .253 .633
Q20 Analyze risk of interventions .212 .618 .019 .633
Q9 Implement the „best‟ decision option -.047 .523 .361 .634
Q31 Use knowledge to create list of decision options -.041 .404 .489 .649
Q2 Make the final decision to act .120 .494 .427 .499
Q7 Recall past learned knowledge .031 -.008 .724 .549
Q10 Interpret meaning of findings .035 .110 .714 .684
Q4 Identify relevant information .068 .060 .712 .657
Q3 See patterns in the information -.118 .218 .682 .595
Q11 Evaluation of decision on lab findings .172 .016 .644 .629
Q5 See the full clinical picture .102 .125 .616 .632
Q18 Use knowledge to interpret information .205 -.002 .572 .539
Initial eigenvalue f 17.38 1.83 1.08
Rotation sums of
squared loadings g
14.77 14.28 13.07
Alpha factoring with promax rotation. Rotation converged in 9 iterations.

261
a, Factor labels: (I) using resources to gathering information and listening fully; (II) knowing and acting; (III) using
information to see the big picture
b, Substantial loading is > .40
c, Communality is the variance per item across factors = row sums of squared loadings
d, Bold font indicates substantial loading on corresponding factor
e, Italicized questions were reduced from the revised version of the scale
f, Eigenvalue is the variance per factor across items = column sums of squared loadings
g, When factors are correlated, sums of squared loadings cannot be added to obtain a total variance
Factor Correlation Matrix a
Factor I II III
I 1.00
II .739 1.00
III .695 .752 1.00
a, Correlations of > .40 indicate inter-related factors

262
APPENDIX AA
Overlapping Items among NASC-CDM Subscales, Main
Factor Number Self-Confidence * Factor Number Anxiety *
I Q13 I Q13
Q32 Q32
Q35 Q35
Q34 Q34
Q16 Q16
Q22 Q22
Q24 Q24
Q17 Q17
Q36 Q36
Q15 Q15
Q14 Q14
Q38 Q38
------ Q29
II Q5 III Q5
Q10 Q10
Q4 Q4
Q3 Q3
Q7 Q7
Q11 Q11
Q18 Q18
Q9 -----
Q23 -----
III Q20 II Q20
Q30 Q30
Q39 Q39
Q19 Q19
Q31 Q31
----- Q9
----- Q23
Q29 -----
* Includes the 27 items remaining on the scale after the reduction of 5 items.

263
APPENDIX BB
Reliability Result of Subscales, Main
Reliability Results for the NASC-CDM, SC & NASC-CDM, A;
Revised Version
Subscale
Name
Number
of Items
Scoring
Range
(1 – 6 Likert)
Cronbach’s
Alpha
Mean Inter-Item
Correlation
(Minimum/Maximum)
Mean
Score and (SD)
NASC-
CDM, SC
(n = 242)
32
32 - 192
.98a
.56 (.29/.78)
126.88
(+ 27.40)
NASC-
CDM, A
(n = 242)
32
32 - 192
.97a
.50 (.31/.71)
78.48
(+ 23.01)
a, No change in Cronbach‟s alpha was noted with the deletion of any item.
Reliability Results for the NASC-CDM, SC & NASC-CDM, A;
After Five Item Reduction, Main
Subscale
Name
Number
of Items
Scoring
Range
(1 – 6 Likert)
Cronbach’s
Alpha
Mean Inter-Item
Correlation
(Minimum/Maximum)
Mean
Score and (SD)
NASC-
CDM, SC
(n = 242)
27
27 - 162
.97a
.55 (.29/.72)
106.85
(+ 23.13)
NASC-
CDM, A
(n = 242)
27
27 - 162
.96a
.49 (.31/.71)
66.47
(+ 19.68)
a, No change in Cronbach‟s alpha was noted with the deletion of any item.
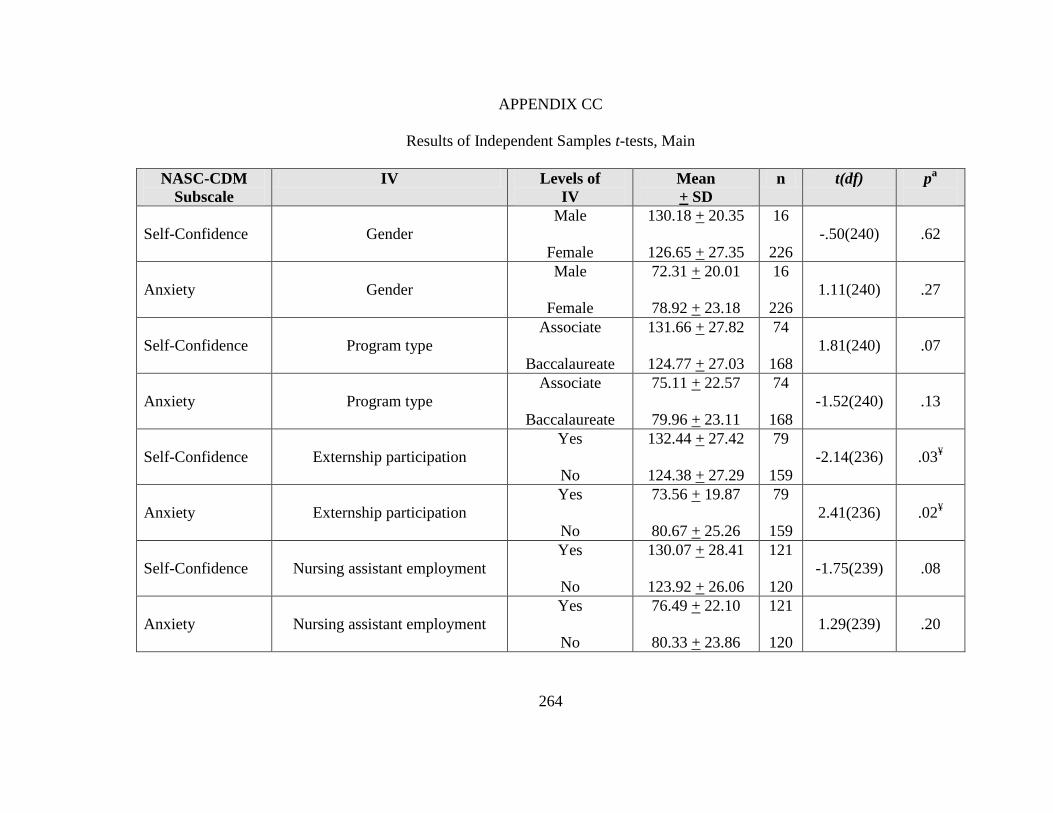
264
APPENDIX CC
Results of Independent Samples t-tests, Main
NASC-CDM
Subscale
IV Levels of
IV
Mean
+ SD
n t(df) pa
Self-Confidence
Gender
Male
Female
130.18 + 20.35
126.65 + 27.35
16
226
-.50(240)
.62
Anxiety
Gender
Male
Female
72.31 + 20.01
78.92 + 23.18
16
226
1.11(240)
.27
Self-Confidence
Program type
Associate
Baccalaureate
131.66 + 27.82
124.77 + 27.03
74
168
1.81(240)
.07
Anxiety
Program type
Associate
Baccalaureate
75.11 + 22.57
79.96 + 23.11
74
168
-1.52(240)
.13
Self-Confidence
Externship participation
Yes
No
132.44 + 27.42
124.38 + 27.29
79
159
-2.14(236)
.03¥
Anxiety
Externship participation
Yes
No
73.56 + 19.87
80.67 + 25.26
79
159
2.41(236)
.02¥
Self-Confidence
Nursing assistant employment
Yes
No
130.07 + 28.41
123.92 + 26.06
121
120
-1.75(239)
.08
Anxiety
Nursing assistant employment
Yes
No
76.49 + 22.10
80.33 + 23.86
121
120
1.29(239)
.20

265
Self-Confidence
Age
18 to 31 years
32 to > 45 years
126.86 + 26.85
126.49 + 29.73
190
39
.08(227)
.94
Anxiety
Age
18 to 31 years
32 to > 45 year
79.08 + 23.04
79.41 + 22.78
190
39
1.16(227)
.26
Note. IV = independent variable; SD = standard deviation
a, (2-tailed); ¥, statistically significant

266
APPENDIX DD
Characteristics and Comparisons of Pilot and Main Samples
N = 545
Demographic Questions
Fall 2010
Sample
(n = 303)
Spring 2011
Sample
(n = 242)
Statistic
Gender
Female
Male
283 (93.4%)
20 (6.6%)
226 (93.4%)
16 (6.6%)
Χ2 = 0
p = 1
Age (M, + SD)
29.16 + 7.5*
25.19 + 5.67*
t = 6.71**
Ethnicity
African American
American Indian
Asian
Caucasian
East Indian
Hispanic
Other
African
Arab
Caucasian & Hispanic
Hawaiian
Jamaican
*
13 (4.4%)
1 (0.3%)
13 (4.4%)
257 (86.5%)
0
13 (4.4%)
---
1 (0.3%)
1 (0.3%)
2 (1.7)
1 (0.3%)
0
18 (7.4%)
1 (0.4%)
7 (2.9%)
207 (85.5%)
1 (0.4%)
5 (2.1%)
---
2 (0.8%)
0
0
0
1 (0.4%)
LR = 11.64,
p = .07
Program type
Associate degree
Baccalaureate degree
192 (63.4%)
111 (36.6%)
74 (30.6%)
168 (69.4%)
Χ2 = 57.89**
Program format
Accelerated
Evening/weekend
Traditional, 2 semesters per
academic year
Year round, 3 semesters per
academic year
Other
18 (6%)
66 (21.9%)
141 (46.7%)
77 (25.5%)
0
13 (5.4%)
5 (2.1%)
219 (90.5%)
5 (2.1%)
0
Χ2 = 128.28**
Currently working as nursing
assistant
No
Yes
*
207 (68.3%)
95 (31.4%)
*
120 (49.6%)
121 (50%)
Χ2 = 19.67**

267
Demographic Questions
Fall 2010
Sample
(n = 303)
Spring 2011
Sample
(n = 242)
Statistic
College experience before
nursing school
I started my nursing program
right out of high school
1 to 2 semesters
3 to 4 semesters
> 4 semesters
I completed a college degree
before starting my nursing
program
*
45 (15.1%)
30 (10%)
53 (17.7%)
79 (26.4%)
92 (30.8%)
*
74 (30.6%)
36 (14.9%)
51 (21.1%)
31 (12.8%)
49 (20.2%)
Χ2 = 35.89**
Participation in nursing
intern/extern program
No
Yes
I am not familiar with this type
of program
236 (77.9%)
52 (17.2%)
15 (5%)
*
159 (65.7%)
79 (32.6%)
3 (1.2%)
Χ2 = 21.79**
Note. Χ2 = chi square for independence; t = independent samples t-test; LR = likelihood
ratio
* Indicates some missing values
** Statistically significant at p < .01 (2-tailed)

268
APPENDIX EE
Overlap of Factor Structures and Content Domains
Pilot Sample
Factor
Content
Domain*
Self-
Confidence
**
Factor
Content
Domain*
Anxiety
**
Using resources
to gather
information (I)
3 Q13 Using resources to
gather information
and listening fully (I)
3 Q13
3 Q32 3 Q32
1 Q35 1 Q35
3 Q34 3 Q34
3 Q16 3 Q16
1 Q22 1 Q22
2 Q24 2 Q24
2 Q17 2 Q17
4 Q36 4 Q36
1 Q40 1 Q40
1 Q15 1 Q15
Listening fully
(IV)
1 Q1 1 Q1
2 Q6 2 Q6
1 Q14 1 Q14
------ 2 Q27
------ 3 Q29
------ 3 Q38
Using
information to see
the big picture
(II)
3 Q5 Using information to
see the big picture
(III)
3 Q5
2 Q10 2 Q10
2 Q4 2 Q4
3 Q3 3 Q3
2 Q7 2 Q7
4 Q11 4 Q11
3 Q31 3 Q31
2 Q18 2 Q18
Knowing and
acting (III)
4 Q2 Knowing and acting
(II)
4 Q2
4 Q9 4 Q9
4 Q30 4 Q30
3 Q39 3 Q39
4 Q19 4 Q19
4 Q23 4 Q23
3 Q20 3 Q20
2 Q27 ------
3 Q29 ------
3 Q38 ------
* Content domains: 1 – investigating information and cues; 2 – interpreting information
and meanings; 3 – integrating findings and illuminating options; 4 – intervening and
reflecting.
** Includes the 32 items remaining on the scale after the reduction of 9 items.

269
Main Sample
Factor
Content
Domain*
Self-
Confidence
**
Factor
Content
Domain*
Anxiety
**
Using resources to
gather information
and listening fully
(I)
3 Q13 Using resources to
gather information
and listening fully
(I)
3 Q13
3 Q32 3 Q32
1 Q35 1 Q35
3 Q34 3 Q34
3 Q16 3 Q16
1 Q22 1 Q22
2 Q24 2 Q24
2 Q17 2 Q17
4 Q36 4 Q36
1 Q15 1 Q15
1 Q14 1 Q14
3 Q38 3 Q38
------ 3 Q29
Using information
to see the big
picture (II)
3 Q5 Using information
to see the big
picture (III)
3 Q5
2 Q10 2 Q10
2 Q4 2 Q4
3 Q3 3 Q3
2 Q7 2 Q7
4 Q11 4 Q11
2 Q18 2 Q18
4 Q9 -----
4 Q23 -----
Knowing and acting
(III)
3 Q20 Knowing and acting
(II)
3 Q20
4 Q30 4 Q30
3 Q39 3 Q39
4 Q19 4 Q19
3 Q31 3 Q31
----- 4 Q9
----- 4 Q23
3 Q29 -----
* Content domains: 1 – investigating information and cues; 2 – interpreting information
and meanings; 3 – integrating findings and illuminating options; 4 – intervening and
reflecting.
** Includes the 27 items remaining on the scale after the reduction of 5 items.

270
BIBLIOGRAPHY
American Association of Colleges of Nursing. (2008). The essentials of baccalaureate
education for professional nursing practice. Retrieved from
http://www.aacn.nche.edu/Education/pdf/BaccEssentials08.pdf
Aspinall, M. J. (1979). Use of a decision tree to improve accuracy fo diagnosis. Nursing
Research, 28, 182-185.
Bakalis, N. (2006). Clinical decision-making in cardiac nursing: A review of the
literature. Nursing Standard, 21(12), 39-46.
Bakalis, N., & Watson, R. (2005). Nurses' decision-making in clinical practice. Nursing
Standard, 19(23), 33-39.
Baldwin, K. B. (2007). Friday night in the pediatric emergency department: A simulated
exercise to promote clinical reasoning in the classroom. Nurse Educator, 32(1),
24-29.
Bandura, A. (1977a). Self-efficacy: Toward a unifying theory of behavioral change.
Psychological Review, 84, 191-215. doi: 10.1037/0033-295x.84.2.191
Bandura, A. (1977b). Social learning theory. Englewood Cliffs, NJ: Prentice Hall.
Bandura, A. (1978a). Reflections on self-efficacy. Advances in Behavioral Research
Theory, 1, 237-269.
Bandura, A. (1978b). The self system in reciprocal determinism. American Psychologist,
33, 344-358. doi: 10.1037/0003-066x.33.4.344
Bandura, A. (1982). Self-efficacy mechanism in human agency. American Psychologist,
37, 122-147. doi: 10.1037/0003-066x.37.2.122

271
Bandura, A. (1983). Self-efficacy determinants of anticipated fears and calamities.
Journal of Personality and Social Psychology, 45, 464-469. doi: 10.1037/0022-
3514.45.2.464
Bandura, A. (1986). Social foundations of thought and action: A social cognitive theory.
Upper Saddle River, NJ: Prentice Hall.
Bandura, A. (1988). Self-efficacy conception of anxiety. Anxiety Research, 1(2), 77-98.
Bandura, A. (1997). Self-efficacy: The exercise of control. New York, NY: W H
Freeman/Times Books/ Henry Holt & Co.
Bandura, A. (2001). SOCIAL COGNITIVE THEORY: An Agentic Perspective. Annual
Review of Psychology, 52, 1-26.
Bandura, A. (2007). Reflections on an agentic theory of human behavior. Tidsskrift for
Norsk Psykologforening, 44, 995-1004.
Bandura, A., Adams, N. E., & Beyer, J. (1977). Cognitive processes mediating behavioral
change. Journal of Personality and Social Psychology, 35(3), 125-139. doi:
10.1037/0022-3514.35.3.125
Bandura, A., Cioffi, D., Taylor, C. B., & Brouillard, M. E. (1988). Perceived self-efficacy
in coping with cognitive stressors and opioid activation. Journal of Personality
and Social Psychology, 55, 479-488. doi: 10.1037/0022-3514.55.3.479
Bandura, A., & Jourden, F. J. (1991). Self-regulatory mechanisms governing the impact
of social comparison on complex decision making. Journal of Personality and
Social Psychology, 60, 941-951. doi: 10.1037/0022-3514.60.6.941
Bandura, A., & Locke, E. A. (2003). Negative self-efficacy and goal effects revisited.
Journal of Applied Psychology, 88, 87-99. doi: 10.1037/0021-9010.88.1.87

272
Banning, M. (2008). A review of clinical decision making: Models and current research.
Journal of Clinical Nursing, 17, 187-195.
Baxter, P., & Boblin, S. (2008). Decision making by baccalaureate nursing students in the
clinical setting. Journal of Nursing Education, 47, 345-350.
Baxter, P., & Rideout, E. (2006). Second-year baccalaureate nursing students' decision
making in the clinical setting. Journal of Nursing Education, 45, 121-127.
Beck, C. T., & Gable, R. K. (2001). Ensuring content validity: An illustration of the
process. Journal of Nursing Measurement, 9, 201-215.
Benner, P. (2001). From novice to expert: Excellence and power in clinical nursing
practice (Commemorative ed.). Upper Saddle River, NJ: Prentice Hall.
Botti, M., & Reeve, R. (2003). Role of knowledge and ability in student nurses' clinical
decision-making. Nursing & Health Sciences, 5(1), 39-49.
Boyer, M., DeVinne, P., Harris, D., Soukhavov, A., Bohle, B., Borup, L., et al. (Eds.).
(1985). The American heritage dictionary (2nd ed.). Boston, MA: Houghton
Mifflin.
Brooks, K., & Shepherd, J. (1990). The relationship between clinical decision-making
skills in nursing and general critical thinking abilities of senior nursing students in
four types of nursing programs. Journal of Nursing Education, 29, 391-399.
Byrnes, M., & West, S. (2000). Registered nurses' clinical reasoning abilities: A study of
self perception. Australian Journal of Advanced Nursing, 17(3), 18-23.
Cader, R., Campbell, S., & Watson, D. (2005). Cognitive continuum theory in nursing
decision-making. Journal of Advanced Nursing, 49, 397-405.

273
Cantrell, M. A., & Browne, A. M. (2005). The impact of a nurse externship program on
the transition process from graduate to registered nurse: Part II. Qualitative
findings. Journal for Nurses in Staff Development, 21(6), 249-258.
Cantrell, M. A., & Lupinacci, P. (2007). Methodological issues in online data collection.
Journal of Advanced Nursing, 60, 544-549.
Cattell, R. B. (1966). The scree test for the number of factors. Multivariate Behavioral
Research, 1, 245-276. doi: 10.1207/s15327906mbr0102_10
Cioffi, J. (2001). A study of the use of past experiences in clinical decision making in
emergency situations. International Journal of Nursing Studies, 38, 591-599.
Clark, M. C., Owen, S. V., & Tholcken, M. A. (2004). Measuring student perceptions of
clinical competence. Journal of Nursing Education, 43, 548-554.
Comrey, A. L. (1978). Common methodological problems in factor analytic studies.
Journal of Consulting and Clinical Psychology, 46, 648-659. doi: 10.1037/0022-
006x.46.4.648
Comrey, A. L. (1988). Factor-analytic methods of scale development in personality and
clinical psychology. Journal of Consulting and Clinical Psychology, 56, 754-761.
doi: 10.1037/0022-006x.56.5.754
Comrey, A. L., & Lee, H. B. (1992). A first course in factor analysis (2nd ed.). Hillsdale,
NJ: Lawrence Erlbaum Associates.
Comrey, A. L., Reise, S. P., & Waller, N. G. (2000). Factor analysis and scale revision.
Psychological Assessment, 12, 287-297.
Coombs, C. H., & Coombs, L. C. (1976). "Don't know": Item ambiguity or respondent
uncertainty? Public Opinion Quarterly, 40, 497-514.

274
Couper, M. P., Tourangeau, R., Conrad, F. G., & Crawford, S. D. (2004). What they see
is what we get: Response options for web surveys. Social Science Computer
Review, 22(1), 111-127. doi: 10.1177/0894439303256555
Crain, W. (2000). Theories of development: Concepts and applications (4th ed.). Upper
Saddle River, NJ: Prentice Hall.
Crawford, S. D., Couper, M. P., & Lamias, M. J. (2001). Web surveys: Perceptions of
burden. Social Science Computer Review, 19, 146-162. doi:
10.1177/089443930101900202
Cronbach, L. J. (1946). Response sets and test validity. Educational & Psychological
Measurement, 6, 475-494.
Cronbach, L. J. (1951). Coefficient alpha and the internal structure of tests.
Psychometrika, 16, 297-334. doi: 10.1007/bf02310555
Daig, I., Herschbach, P., Lehmann, A., Knoll, N., & Decker, O. (2009). Gender and age
differences in domain-specific life satisfaction and the impact of depressive and
anxiety symptoms: A general population survey from Germany. Quality of Life
Research, 18, 669-678. doi: 10.1007/s11136-009-9481-3
Davidhizar, R. E. (1993). Self-confidence: A requirement for collaborative practice.
Dimensions of Critical Care Nursing, 12(4), 218-222.
Davis, L. L. (1992). Instrument review: Getting the most from a panel of experts. Applied
Nursing Research, 5, 194-197.
DeVellis, R. F. (2003). Scale development: Theory and applications (2nd ed.). Thousand
Oaks, CA: Sage.

275
DeVon, H. A., Block, M. E., Moyle-Wright, P., Ernst, D. M., Hayden, S. J., Lazzara, D.
J., et al. (2007). A psychometric toolbox for testing validity and reliability.
Journal of Nursing Scholarship, 39, 155-164.
Donohue, J., & Martin, S. G. (1996). Individual decision making. In R. A. Patronis-Jones
& S. E. Beck (Eds.), Decision making in nursing (pp. 59-75). Albany, NY:
Delmar.
Duffy, M. E. (2006). Using research to advance nursing practice. Handling missing data:
A commonly encountered problem in quantitative research. Clinical Nurse
Specialist: The Journal for Advanced Nursing Practice, 20, 273-276.
Ellenbecker, C. H., & Byleckie, J. J. (2005). Home healthcare nurses' job satisfaction
scale: Refinement and psychometric testing. Journal of Advanced Nursing, 52,
70-78.
Elstein, A., Kagan, N., Shulman, L., Hilliard, J., & Loupe, M. (1972). Methods and
theory in the study of medical inquiry. Journal of Medical Education, 47, 85-92.
Elstein, A., Shulman, L., & Sprafka, S. (1978). Medical problem solving: An analysis of
clinical reasoning. Cambridge, MA: Harvard University Press.
Faulk, D., Parker, F., Lazenby, R., & Morris, A. (2008). Broadening the knowledge of the
LPN long-term care provider: A pilot study. Educational Gerontology, 34(1), 89-
100.
Ford, J. K., MacCallum, R. C., & Tait, M. (1986). The application of exploratory factor
analysis in applied psychology: A critical review and analysis. Personnel
Psychology, 39, 291-314. doi: 10.1111/j.1744-6570.1986.tb00583.x

276
Francis, J. D., & Busch, L. (1975). What we know about "I DON'T KNOWS". Public
Opinion Quarterly, 39, 207-218.
Fry, M., & Burr, G. (2001). Current triage practice and influences affecting clinical
decision-making in emergency departments in NSW, Australia. Accident &
Emergency Nursing, 9, 227-234.
Gable, R. K., & Wolf, M. B. (1993). Instrument development in the affective domain:
Measuring attitudes and values in corporate and school settings (2nd ed.).
Boston, MA: Kluwer Academic.
Gall, M. D., Gall, J. P., & Borg, W. R. (2007). Educational research: An introduction
(8th ed.). Boston, MA: Pearson Education.
García-Campayo, J., Zamorano, E., Ruíz, M. A., Pardo, A., Freire, O., Pérez-Páramo, M.,
et al. (2009). P01-150 Cultural adaptation into Spanish of the generalized anxiety
disorder scale - 7 (GAD-7) scale. European Psychiatry, 24, S538-S538. doi:
10.1016/s0924-9338(09)70771-0
Girot, E. A. (2000). Graduate nurses: Critical thinkers or better decision makers? Journal
of Advanced Nursing, 31, 288-297.
Grant, J. S., & Davis, L. L. (1997). Focus on quantitative methods. Selection and use of
content experts for instrument development. Research in Nursing & Health, 20,
269-274.
Grossman, S., Campbell, C., & Riley, B. (1996). Assessment of clinical decision-making
ability of critical care nurses. Dimensions of Critical Care Nursing, 15, 272-279.
Grundy, S. E. (1993). The confidence scale: Development and psychometric
characteristics. Nurse Educator, 18(1), 6-9.

277
Haffer, A., & Raingruber, B. (1998). Discovering confidence in clinical reasoning and
critical thinking development in baccalaureate nursing students. Journal of
Nursing Education, 37, 61-70.
Haligren, J. D., & Morton, J. R. (2007). What's the best way to screen for anxiety and
panic disorders? Journal of Family Practice, 56, 579-580.
Hammond, K. R. (1964). Clinical inference in nursing: A methodological approach.
Nursing Research, 13, 315-319.
Hammond, K. R., Kelly, K., Schneider, R. J., & Vancini, M. (1966). Clinical inference in
nursing: Information units used. Nursing Research, 15, 236-243.
Harbison, J. (1991). Clinical decision making in nursing. Journal of Advanced Nursing,
16, 404-407.
Harbison, J. (2001). Clinical decision making in nursing: Theoretical perspectives and
their relevance to practice. Journal of Advanced Nursing, 35, 126-133.
Hirschel, M. J., & Schulenberg, S. E. (2009). Hurricane Katrina‟s impact on the
Mississippi gulf coast: General self-efficacy‟s relationship to PTSD prevalence
and severity. Psychological Services, 6, 293-303. doi: 10.1037/a0017467
Hoffman, K., Donoghue, J., & Duffield, C. (2004). Decision-making in clinical nursing:
Investigating contributing factors. Journal of Advanced Nursing, 45, 53-62.
Hoffman, K., & Elwin, C. (2004). The relationship between critical thinking and
confidence in decision-making. Australian Journal of Advanced Nursing, 22(1),
8-12.
Huck, S. W. (2004). Reading statistics and research (4th ed.). Boston, MA: Pearson
Education.

278
Hughes, C., & Hughes, K. K. (1990). N-way sensitivity analysis: A verification and
stability-assessment technique for completely subjective decision analysis trees.
Medical Decision Making, 10, 68-74.
Hughes, K. K., & Young, W. B. (1990). The relationship between task complexity and
decision-making consistency. Research in Nursing & Health, 13, 189-197.
Imam, S. S. (2007). Sherer et al. general self-efficacy scale: Dimensionality, internal
consistency, and temporal stability. Paper presented at the Redesigning Pedagogy:
Culture, Knowledge, and Understanding, Singapore.
Itano, J. (1989). A comparison of the clinical judgment process in experience registered
nurses and student nurses. Journal of Nursing Education, 28, 120-126.
Jenkins, H. M. (1983). Perceptions of decision making among baccalaureate nursing
students as measured by the clinical decision making in nursing scale. (PhD
dissertation), University of Maryland, Baltimore, MD. Retrieved from ProQuest
Dissertations (ID number 749408381) database.
Jenkins, H. M. (1985a). Improving clinical decision making in nursing. Journal of
Nursing Education, 24, 242-243.
Jenkins, H. M. (1985b). A research tool for measuring perceptions of clinical decision
making. Journal of Professional Nursing, 1, 221-229.
Kaiser, H. F. (1958). The varimax criterion for analytic rotation in factor analysis.
Psychometrika, 23, 187-200.
Kaiser, H. F. (1960). The application of electronic computers to factor analysis.
Educational and Psychological Measurement, 20, 141-151. doi:
10.1177/001316446002000116

279
Kaplan, R. M., & Saccuzzo, D. P. (2005). Psychological testing: Principles, applications,
and issues (6th ed.). Belmont, CA: Thomson Wadsworth.
Kaufman, K. A. (2011). Executive summary: Findings from the annual survey of schools
of nursing, academic year 2009 - 2010. National League for Nursing. Retrieved
from http://www.nln.org/research/slides/exec_summary_0910.pdf
Kelly, K. (1964). An approach to the study of clinical inference in nursing: Part I.
Introduction to the study of clinical inference in nursing. Nursing Research, 13,
314-315.
Kerlinger, F. N. (1973). Foundations of behavioral research (2nd ed.). New York, New
York: Holt, Rinehart and Winston.
Kroenke, K., Spitzer, R. L., Williams, J. B. W., Monahan, P. O., & Löwe, B. (2007).
Anxiety disorders in primary care: Prevalence, impairment, comorbidity, and
detection. Annals of Internal Medicine, 146, 317-W377.
Kröner, S., & Biermann, A. (2007). The relationship between confidence and self-
concept--Towards a model of response confidence. Intelligence, 35, 580-590. doi:
10.1016/j.intell.2006.09.009
Kushnir, T. (1986). Stress and social facilitation: The effects of the presence of an
instructor on student nurses' behaviour. Journal of Advanced Nursing, 11, 13-19.
doi: 10.1111/1365-2648.ep13112476
Lasater, K. (2007). High-fidelity simulation and the development of clinical judgment:
Students' experiences. Journal of Nursing Education, 46, 269-276.
Lauri, S., & Salantera, S. (1995). Decision-making models in Finnish nurses and public
health nurses. Journal of Advanced Nursing, 21, 520-527.

280
Lauri, S., & Salantera, S. (1998). Decision-making models in different fields of nursing.
Research in Nursing & Health, 21, 443-452.
Lauri, S., & Salantera, S. (2002). Developing an instrument to measure and describe
clinical decision making in different nursing fields. Journal of Professional
Nursing, 18, 93-100.
Lauri, S., Salantera, S., Chalmers, K., Ekman, S.-L., Kim, S., Kappeli, S., et al. (2001).
An exploratory study of clinical decision-making in five countries. Journal of
Nursing Scholarship, 33, 83-90.
Likert, R. (1932). A technique for the measurement of attitudes. Archives of Psychology,
22(140), 55-78.
Lindsey, G., & Kleiner, B. (2005). Nurse residency program: An effective tool for
recruitment and retention. Journal of Health Care Finance, 31(3), 25-32.
Löwe, B., Decker, O., Müller, S., Brähler, E., Schellberg, D., Herzog, W., et al. (2008).
Validation and standardization of the Generalized Anxiety Disorder Screener
(GAD-7) in the general population. Medical Care, 46, 266-274. doi:
10.1097/MLR.0b013e318160d093
Luszczynska, A., Gutiérrez-Doña, B., & Schwarzer, R. (2005). General self-efficacy in
various domains of human functioning: Evidence from five countries.
International Journal of Psychology, 40(2), 80-89. doi:
10.1080/00207590444000041
Luszczynska, A., Mohamed, N. E., & Schwarzer, R. (2005). Self-efficacy and social
support predict benefit finding 12 months after cancer surgery: The mediating role
of coping strategies. Psychology, Health & Medicine, 10, 365-375.

281
Luszczynska, A., Scholz, U., & Schwarzer, R. (2005). The general self-efficacy scale:
Multicultural validation studies. Journal of Psychology, 139, 439-457.
Lyneham, J., Parkinson, C., & Denholm, C. (2008). Explicating Benner's concept of
expert practice: Intutition in emergency nursing. Journal of Advanced Nursing,
64, 380-387.
MacCallum, R. C., Widaman, K. F., Zhang, S., & Hong, S. (1999). Sample size in factor
analysis. Psychological Methods, 4(1), 84-99. doi: 10.1037/1082-989x.4.1.84
Mario, B., Massimiliano, M., Chiara, M., Alessandro, S., Antonella, C., & Gianfranco, F.
(2009). White-coat effect among older patients with suspected cognitive
impairment: Prevalence and clinical implications. International Journal of
Geriatric Psychiatry, 24, 509-517. doi: 10.1002/gps.2145
Mellalieu, S. D., Neil, R., & Hanton, S. (2006). Self-confidence as a mediator of the
relationship between competitive anxiety intensity and interpretation. Research
Quarterly for Exercise and Sport, 77, 263-270.
Mercer, C., & Durham, T. W. (2001). The Hood Mysticism Scale: Does the presence of a
neutral response-item affect response style. Psychological Reports, 88, 335-338.
doi: 10.2466/pr0.88.2.335-338
Moeini, B., Shafii, F., Hidarnia, A., Babaii, G. R., Birashk, B., & Allahverdipour, H.
(2008). Perceived stress, self-efficacy and its relations to psychological well-
being status in Iranian male high school students. Social Behavior and
Personality, 36, 257-266. doi: 10.2224/sbp.2008.36.2.257
Moscaritolo, L. M. (2009). Interventional strategies to decrease nursing student anxiety in
the clinical learning environment. Journal of Nursing Education, 48, 17-23.

282
Muir, N. (2004). Clinical decision-making: Theory and practice. Nursing Standard,
18(36), 47-52.
Munro, B. H. (2005). Statistical methods for health care research (5th ed.). Philadelphia,
PA: Lipincott Williams & Wilkins.
Musil, C. M., Warner, C. B., Yobas, P. K., & Jones, S. L. (2002). A comparison of
imputation techniques for handling missing data. Western Journal of Nursing
Research, 24, 815-829.
Mussell, M., Kroenke, K., Spitzer, R. L., Williams, J. B. W., Herzog, W., & Löwe, B.
(2008). Gastrointestinal symptoms in primary care: Prevalence and association
with depression and anxiety. Journal of Psychosomatic Research, 64, 605-612.
doi: 10.1016/j.jpsychores.2008.02.019
National League for Nursing. (2008). NLNAC accreditation manual: Assuring quality for
the future of nursing education. Retrieved from
http://www.nlnac.org/manuals/NLNACManual2008.pdf
National League for Nursing. (2011). Annual survey of schools of nursing: Academic
year 2009 - 2010. NLN Data View. Retrieved from
http://www.nln.org/research/slides/pdf/AS0910_14.pdf
O'Neill, E. (1996). An exploratory study of clinical decision making in home healthcare
nursing. Home Healthcare Nurse, 14, 362-368.
O'Neill, E., Dluhy, N., Andrea, H., & Ryan, J. (2006). Coupling the N-CODES system
with actual nursing decision-making. Computers, Informatics, Nursing 24, 28-34.

283
O'Neill, E., Dluhy, N., Fortier, P., & Michel, H. (2004a). Knowledge acquisition,
synthesis, and validation: A model for decision support systems. Journal of
Advanced Nursing, 47, 134-142.
O'Neill, E., Dluhy, N., Fortier, P., & Michel, H. (2004b). The N-CODES project: The
first year. Computers Informatics, Nursing, 22, 345-350.
O'Neill, E., Dluhy, N. M., & Chin, E. (2005). Modelling novice clinical reasoning for a
computerized decision support system. Journal of Advanced Nursing, 49, 68-77.
Oermann, M. (1997). Evaluating critical thinking in clinical practice. Nurse Educator,
22(5), 25-28.
Ozer, E. M., & Bandura, A. (1990). Mechanisms governing empowerment effects: A
self-efficacy analysis. Journal of Personality and Social Psychology, 58, 472-486.
doi: 10.1037/0022-3514.58.3.472
Pallant, J. (2007). SPSS survival manual: A step by step guide to data analysis using
SPSS for windows (3rd ed.). Berkshire, England: Open University Press,
McGraw-Hill Education.
Papathanassoglou, E. D. E., Tseroni, M., Karydaki, A., Vazaiou, G., Kassikou, J., &
Lavdaniti, M. (2005). Practice and clinical decision-making autonomy among
Hellenic critical care nurses. Journal of Nursing Management, 13, 154-164.
Pica, M. (1998). The ambiguous nature of clinical training and its impact on the
development of student clinicians. Psychotherapy: Theory, Research, Practice,
Training, 35, 361-365.
Polit, D. F., & Beck, C. T. (2008). Nursing research: Generating and assessing evidence
for nursing practice (8th ed.). Philadelphia, PA: Lippincott Williams & Wilkins.

284
Polit, D. F., Beck, C. T., & Owen, S. V. (2007). Is the CVI an acceptable indicator of
content validity? Appraisal and recommendations. Research in Nursing & Health,
30, 459-467.
Qadri, S. S., Wang, J., Ruiz, J. G., & Roos, B. A. (2009). Personal Digital Assistants as
Point-of-Care Tools in Long-Term Care Facilities: A Pilot Study. Educational
Gerontology, 35, 294-305. doi: 10.1080/03601270802467049
Redding, D. A., & Flatley, D. (2003). Successful implementation of a student nurse
externship program. Clinical Research & Regulatory Affairs, 20, 479-485. doi:
10.1081/crp-120026129
Rew, L. (2000). Acknowledging intuition in clinical decision making. Journal of Holistic
Nursing, 18, 94-113.
Rust, J., & Golombok, S. (2009). Modern psychometrics: The science of psychological
assessment (3rd ed.). London, England: Routledge.
Ruth-Sahd, L. A., Beck, J., & McCall, C. (2010). During a nursing externship program:
The reflections of senior nursing students. Nursing Education Perspectives, 31(2),
78-83.
Sanna, L. J. (1999). Mental simulations, affect, and subjective confidence: Timing is
everything. Psychological Science, 10, 339-345. doi: 10.1111/1467-9280.00165
Sapnas, K. G., & Zeller, R. A. (2002). Minimizing sample size when using exploratory
factor analysis for measurement. Journal of Nursing Measurement, 10, 135-154.
doi: 10.1891/jnum.10.2.135.52552
Savitsky, K., Medvec, V. H., Charlton, A. E., & Gilovich, T. (1998). 'What, me worry?'
Arousal, misattribution and the effect of temporal distance on confidence.

285
Personality and Social Psychology Bulletin, 24, 529-536. doi:
10.1177/0146167298245008
Scholz, U., Gutiérrez-Doña, B., Sud, S., & Schwarzer, R. (2002). Is general self-efficacy
a universal construct? Psychometric findings from 25 countries. European
Journal of Psychological Assessment, 18, 242-251. doi: 10.1027//1015-
5759.18.3.242
Schunk, D. H., & Pajares, F. (2005). Competence preceptions and academic functioning.
In A. J. Elliot & C. S. Dweck (Eds.), Handbook of competence and motivation
(pp. 85-104). New York, NY: Guilford Press.
Schwarzer, R. (2009). Everything you wanted to know about the General Self-Efficacy
Scale but were afraid to ask, from http://userpage.fu-berlin.de/~health/faq_gse.pdf
Schwarzer, R., Boehmer, S., Luszczynska, A., Mohamed, N. E., & Knoll, N. (2005).
Dispositional self-efficacy as a personal resource factor in coping after surgery.
Personality & Individual Differences, 39, 807-818. doi:
10.1016/j.paid.2004.12.016
Schwarzer, R., & Hallum, S. (2008). Perceived teacher self-efficacy as a predictor of job
stress and burnout. Applied Psychology: An International Review, 57(Suppl 1),
152-171. doi: 10.1111/j.1464-0597.2008.00359.x
Schwarzer, R., Mueller, J., & Greenglass, E. (1999). Assessment of perceived general
self-efficacy on the internet: Data collection in cyberspace. Anxiety, Stress &
Coping, 12, 145-161.
Seldomridge, E. A. (1997). Faculty and student confidence in their clinical judgment.
Nurse Educator, 22(5), 6-8.

286
Shin, K. R. (1998). Critical thinking abilities and clinical decision-making skills among
senior nursing students in associated and baccalaureate programmes in Korea.
Journal of Advanced Nursing, 27, 414-418.
Skapinakis, P. (2007). The 2-item generalized anxiety disorder scale had high sensitivity
and specificity for detecting GAD in primary care. Evidence-Based Medicine, 12,
149.
Smith, A. J., Thurkettle, M. A., & dela Cruz, F. A. (2004). Use of intuition by nursing
students: Instrument development and testing. Journal of Advanced Nursing, 47,
614-622.
Spitzer, R. L., Kroenke, K., Williams, J. B., & Swinson, R. P. (2006). The GAD-7 scale
was accurate for diagnosing generalised anxiety disorder. Evidence-Based
Medicine, 11(6), 184-184.
Spitzer, R. L., Kroenke, K., Williams, J. B. W., & Lowe, B. (2006). A brief measure for
assessing generalized anxiety disorder. Archives of Internal Medicine, 166, 1092-
1097.
SPSS. (2008). for Windows, Release 8/23/2008 (Version Gradpack 17.0.0). Chicago, IL:
SPSS Inc.
Standing, M. (2007). Clinical decision-making skills on the developmental journey from
student to Registered Nurse: A longitudinal inquiry. Journal of Advanced
Nursing, 60, 257-269.
Standing, M. (2008). Clinical judgement and decision-making in nursing: Nine modes of
practice in a revised cognitive continuum. Journal of Advanced Nursing, 62, 124-
134.

287
Switzer, G. E., Wisniewski, S. R., Belle, S. H., Dew, M. A., & Schultz, R. (1999).
Selecting, developing, and evaluating research instruments. Social Psychiatry &
Psychiatric Epidemiology, 34, 399-409.
Tabachnick, B. G., & Fidell, L. S. (2007). Using multivariate statistics (5th ed.). Boston,
MA: Pearson Education.
Tanner, C. A. (2006). Thinking like a nurse: A research-based model of clinical judgment
in nursing. Journal of Nursing Education, 45, 204-211.
Tanner, C. A., Padrick, K. P., Westfall, U. E., & Putzier, D. (1987). Diagostic reasoning
strategies of nurses and nursing students. Nursing Research, 36, 358-363.
Thiele, J. E., Holloway, J., Murphy, D., Pendarvis, J., & Stucky, M. (1991). Perceived
and actual decision making by novice baccalaureate students. Western Journal of
Nursing Research, 13, 616-626.
Thompson, C. (1999). A conceptual treadmill: The need for 'middle ground' in clinical
decision making theory in nursing. Journal of Advanced Nursing, 30, 1222-1229.
Thompson, C. (2002). Human error, bias, decision making, and judgement in nursing -
the need for a systematic approach. In C. Thompson & D. Dowding (Eds.),
Clinical Decision Making and Judgement in Nursing (pp. 21-45). London, UK:
Churchill Livingstone, Elsevier.
Thompson, C., & Dowding, D. (2002). Decision making and judgement in nursing: An
introduction. In C. Thompson & D. Dowding (Eds.), Clinical Decision Making
and Judgement in Nursing (pp. 1-20). London, UK: Churchill Livingstone,
Elsevier.

288
Titov, N., Andrews, G., Robinson, E., Schwencke, G., Johnston, L., Solley, K., et al.
(2009). Clinician-assisted internet-based treatment is effective for generalized
anxiety disorder: Randomized controlled trial. Australian & New Zealand Journal
of Psychiatry, 43, 905-912. doi: 10.1080/00048670903179269
Tschikota, S. (1993). The clinical decision-making processes of student nurses. Journal
of Nursing Education, 32, 389-398.
Unruh, L. (2003). The Effect of LPN Reductions on RN Patient Load. Journal of Nursing
Administration, 33, 201-208.
Vance, C., Groves, E., Paik, Y., & Kindler, H. (2007). Understanding and measuring
linear-nonlinear thinking style for enhanced mamagement education and
professional practice. Academy of Management Learning & Education, 6, 167-
185.
Waltz, C. F., Strickland, O. L., & Lenz, E. R. (2005). Measurement in nursing and health
research (3rd ed.). New York, NY: Springer.
Westfall, U. E., Tanner, C. A., Putzier, D., & Padrick, K. P. (1986). Activating clinical
inferences: A component of diagnostic reasoning in nursing. Research in Nursing
& Health, 9, 269-277.
White, A. H. (2003). Clinical decision making among fourth-year nursing students: An
interpretive study. Journal of Nursing Education, 42, 113-120.
White, K. A. (2009). Self-confidence: A concept analysis. Nursing Forum, 44, 103-114.
Wood, R., & Bandura, A. (1989). Impact of conceptions of ability on self-regulatory
mechanisms and complex decision making. Journal of Personality and Social
Psychology, 56, 407-415. doi: 10.1037/0022-3514.56.3.407
289
Wright, B., & Schwager, P. H. (2008). Online survey research: Can response factors be
improved? Journal of Internet Commerce, 7, 253-269. doi:
10.1080/15332860802067730
Zhang, C.-h., Yuan, A.-h., Zhang, H.-y., & Lu, Z.-x. (2009). Interpersonal attribution
style and self-efficacy of female students of nursing school. Chinese Journal of
Clinical Psychology, 17, 232-233.
Zulkosky, K. (2009). Self-efficacy: A concept analysis. Nursing Forum, 44, 93-102.

290
VITA
Graduate College
University of Nevada, Las Vegas
Krista Alaine White
Degrees
Diploma, Nursing, 1986
Lancaster General Hospital School of Nursing
Associate of Science, 1986
Franklin and Marshall College
Bachelor of Science, Nursing, 1990
Millersville University
Master of Science, Nursing, 1994
Villanova University
Special Honors and Awards
Robert & Thelma Flory Doctoral Endowment Fund, 2009
Lancaster General College of Nursing & Health Sciences
Student Scholarship Award, Zeta Kappa Chapter Nursing Honor Society, 2009
University of Nevada, Las Vegas
Research Scholarship Award, Xi Chi Chapter Nursing Honor Society, 2010
Millersville University
Robert & Thelma Flory Doctoral Endowment Fund, 2011
Lancaster General College of Nursing & Health Sciences
Publications
White, K. A. & Ruth-Sahd, L. A. (2007). Bronchiolitis obliterans organizing
pneumonia. Critical Care Nurse (27)3, 53-66.
White, K. A. (2007). Ogilvie‟s syndrome: No ordinary constipation. American Nurse
Today 2(8), 12-14.

291
White, K. A. (2008). The growing threat of cephalosporin resistance. American
Nurse Today 3(4), 9-12.
White, K. A. (2009). Self-confidence: A concept analysis. Nursing Forum, 44,
103-114.
Ruth-Sahd, L. A. & White, K. A. (2009). Bronchiolitis obliterans organizing
pneumonia. Dimensions in Critical Care Nursing, 28(5), 204-208.
Dissertation Title
The Development and Validation of a Tool to Measure Self-
Confidence and Anxiety in Nursing Students While Making Clinical Decisions
Dissertation Examination Committee
Chairperson, Cheryl Bowles, Ed.D, R.N., CNE
Committee Member, Lori Candela, Ed.D., R.N., CNE
Committee Member, Michele Clark, Ph.D., R.N.
Graduate Faculty Representative, Joanne Thompson, Ph.D., MSW