Embed Size (px)
Citation preview

The Determination and Interpretation of Soil PH Values
Item Type text; Book
Authors McGeorge, W. T.
Publisher College of Agriculture, University of Arizona (Tucson, AZ)
Rights Copyright © Arizona Board of Regents. The University of Arizona.
Download date 30/12/2021 08:37:25
Link to Item http://hdl.handle.net/10150/190647


OF CONTENTS
PAGE
INTRODUCTION 369
SALINITY-PH RELATIONSHIPS 371
USE OF CENTRIFUGE FOR DEMONSTRATING THE SALINITY-PH RELATIONSHIPS 380
THE HEHNER METHOD 386
BASE EXCHANGE-PH RELATIONSHIPS 389
SESQUIHYDRATES „ 396
PH OF SOIL SEPARATES 398
ISOHYDRIC PH VALUES 405
PH OF EXCHANGE NEUTRALITY 410
CALCULATION OF PH VALUES 411
VARIATION IN ABSOLUTE WEIGHT OF SOIL 413
PH STUDIES AT LOW MOISTURE CONTENT 414
SUMMARY 419
CONCLUSIONS 423
LITERATURE CITED 425
ILLUSTRATIONSPAGE
FIGURE 1.—CORRELATION BETWEEN PH AND P.P.M. CO3 IN SOILS: A,DIFFERENCE BETWEEN PH AT 1:10 AND SOIL PASTE; B, PHAT 1:10 SOIL: WATER RATIO; C, PH OF SOIL PASTE '. 375
FIGURE 2.—CORRELATION BETWEEN PH AND P.P.M. HCOa IN SOILS: A,DIFFERENCE BETWEEN PH AT 1:10 AND SOIL PASTE; B, PHAT 1:10 SOIL: WATER RATIO; C, PH OF SOIL PASTE 375
FIGURE 3.—CORRELATION BETWEEN PH AND P.P.M. CL NOT SIGNIFICANT 376
FIGURE 4.—CORRELATION BETWEEN PH AND P.P.M. SO* IN SOILS: A,DIFFERENCE BETWEEN PH AT 1:10 AND SOIL PASTE; B, PHAT 1:10 SOIL: WATER RATIO; C, PH OF SOIL PASTE 376
FIGURE 5.—CORRELATION BETWEEN P.P.M. SOLUBLE CA AND PH IN SOILS:A, DIFFERENCE BETWEEN PH AT 1:10 AND SOIL PASTE; B, PHAT 1:10 SOIL: WATER RATIO; C, PH OF SOIL PASTE 378
FIGURE 6.—CORRELATION BETWEEN PH AND FJP.M.' NA IN SOILS NOTSIGNIFICANT 378
FIGURE 7.—CORRELATION BETWEEN PH AND P.P.M. TOTAL SOLUBLE SALTSIN SOILS NOT SIGNIFICANT 379
FIGURE 8.—CORRELATION BETWEEN PH AND CONDUCTIVITY OF TENTHWATER EXTRACT, TABLE 3 385
FIGURE 9.—RELATION BETWEEN CONDUCTIVITY AND PH OF SOIL WHICHHAS BEEN EXTRACTED TEN TIMES WITH DISTILLED WATER.... 387
FIGURE 10.—CORRELATION BETWEEN HEHNER VALUES AND PH OF SOIL:A} 1:10 SOIL: WATER RATIO; B, SOIL PASTE 388
FIGURE 11.—CORRELATION BETWEEN PER CENT SILT PLUS CLAY IN SOILAND DIFFERENCE BETWEEN PH AT 1:10 AND SOIL PASTE,DILUTION EFFECT 391

FIGURE 12.—CORRELATION BETWEEN RATIO OF REPLACEABLE SODIUM TOTOTAL REPLACEMENT CAPACITY AND PH AT (A) 1:10 SOIL;WATER RATIO AND (B) SOIL PASTE 392
FIGURE 13.—CORRELATION BETWEEN ME REPLACEABLE NA PER 100 GRAMSSOIL AND PH AT (B) 1:10 SOIL:WATER RATIO, (C) SOILPASTE, AND (A) DIFFERENCE BETWEEN 1:10 AND PASTE 393
FIGXJRE 14. PH OF SOIL SEPARATES; SOLID LINES REPRESENT PH OF SOILPASTE AND BROKEN LINES PH OF 1:10 SOIL: WATER RATIO.. 402
FIGURE 15.—PH OF SOIL SEPARATES; SOLID LINES REPRESENT PH OF SOILPASTE AND BROKEN LINES PH OF 1:10 SOIL: WATER RATIO.. 403
FIGURE 16.—REPLACEMENT CAPACITY OF SOIL SEPARATES AND EFFECT OFGRINDING ON THE REPLACEMENT CAPACITY OF COARSE SOILPARTICLES 404
FIGURE 17.—ISOHYDRIC POINT OBTAINED BY PLOTTING TITRATION DATA.POINT AT WHICH LINES CROSS IS ISOHYDRIC POINT. MEDESIGNATES PH OF SOIL PASTE AND IH THE ISOHYDRIC PH.. 408
FIGURE 18.—ISOHYDRIC POINT OBTAINED BY PLOTTING TITRATION DATA.POINT AT WHICH LINES CROSS IS ISOHYDRIC POINT. MEDESIGNATES PH OF SOIL PASTE AND IH THE ISOHYDRIC PH.. 409
FIGURE 19.—ISOHYDRIC POINT OBTAINED BY PLOTTING TITRATION DATA.POINT AT WHICH LINES CROSS IS ISOHYDRIC POINT. MEDESIGNATES PH OF SOIL PASTE AND IH THE ISOHYDRIC PH.. 410
FIGURE 20.—PH OF EXCHANGE NEUTRALITY. ME DESIGNATES PH OF SOILPASTE AND EN PH OF EXCHANGE NEUTRALITY OR POINT ATWHICH CURVES CROSS 412
FIGURE 21.—RELATION BETWEEN ABSOLUTE WEIGHT OF SOIL AND PH ATCONSTANT SOIL: WATER RATIO 414

THE DETERMINATION AND INTERPRETATION OFSOIL PR VALUES
BY W. T. MCGEORGE
INTRODUCTION
Hydrogen-ion concentration is a contributing factor in mostbiological systems, particularly as regards plant growth and themicropopulation of the soil. It is also a controlling factor in thesoil mineral system as regards both the chemical and the physicalproperties of the soil. With the development of accurate methodsof measuring acidity and alkalinity in soils and of interpretingpH values, a greater interest in soil reaction in relation to soilproperties and the economic production of crops has arisen. Whileit is known that soils of extreme acidity or alkalinity are non-productive for most crops, a lack of precise methods, as well asthe selection of an analytical technic, has prevented any precisionin the establishment of safe or preference ranges. In the South-west, practically all the problem soils are on the alkaline side ofneutrality primarily because they contain CaCO3, but oftenbecause they contain an excess of replaceable sodium which issometimes accompanied by Na COa. That is, they possess bothactive and potential alkalinity in greater or lesser amounts. Inview of this, soil-reaction studies have been major projects in theAgricultural Chemistry and Soils Department. These investiga-tions have included such subjects as base exchange, effect of H-ionand OB-ion concentration on ion absorption by plants, effect ofalkalinity on the availabilitj^ of plant food elements in the soil,methods of aiding plant nutrition in an alkaline environment,methods of determining pH values of soils, and factors affectingthe pH determination and its interpretation. In spite of the largeamount of work that has been done on the technic of pH deter-mination and its interpretation, the manner in which inherent soilproperties contribute to minimize or maximize the pH values ofalkaline-calcareous soils is still more or less obscure.
This bulletin presents a continuation of studies on the natureof soil alkalinity and the factors affecting the OH-ion concentra-tion and the pH determination in semiarid soils. The complexityof the alkali problem has frequently been manifest during soilinvestigations in this laboratory. As one example, it was notedthat the soil solution of alkaline soils contains sodium silicate andsodium aluminate and that with alternate wetting and drying,hydrates and silicates are formed, thus increasing the exchangecapacity and therefore the potential alkalinity (8). In anotherexperiment, "breakdown" and "build-up" in the exchange com-
369

370 TECHNICAL BULLETIN NO. 104
plex were noted, the former by treating the soils with acid andthe latter by treating them with alkali (7). Also it has beenobserved that black alkali soils contain more adsorbed sodiumthan the capacity represented by the NH4 adsorbed by the soilduring replacement of the bases (23), a condition which has beennoted by Kelley and Brown (16) on both alkaline and salinesoils.
The mineral fraction of the soil is composed of the products ofrock weathering and the organic fraction of the soil by the prod-ucts of the weathering of plant and animal debris. These residualmaterials, which in general are the soil mass, are largely humus,alkaline earth carbonates, the hydrated silicates and oxides ofiron and aluminum in which the alkaline and alkaline earthbases may be combined; and in semiarid soils the soluble saltsdeposited in the soil by excessive evaporation must be included.In these soils calcium carbonate, sodium carbonate, and the groupof minerals which comprise the exchange complex represent themajor alkaline compounds. The carbonates are simple compoundswith quite definitely defined properties. On the other hand theadsorption and exchange complex may be composed of one orseveral minerals, not necessarily silicates, the structure, compo-sition, and properties of which are extremely variable. Thealumino-silicate compounds and the sesquihydrates that displaythe sharply manifested capacity for cation exchange and adsorp-tion, when coming in contact with electrolytes, exert an influ-ence on soil pH depending in large part upon the nature of thecations attached. When the soil comes in contact with water thesoil colloids, with the attached cations, hydrolyze and ionize andthe bases appear in solution as hydroxides. The early investiga-tions indicated that the exchange capacity of the soil is a constantvalue, but later work has proved that these early conclusions arein error.
Briefly, then, the exchange complex, the calcium carbonate,and the soluble salts are the major factors contributing to thealkalinity of semiarid calcareous soils which we express as pH. Inthese soils the part which the exchange complex plays in soil reac-tion is complicated by the presence of salts, for salines represshydrolysis. Since the pH of the soil is a complex of many factors,it is obvious that the ideal method for determining the pH value,in which the farmer is most interested, is one which permits thesame magnitude of ionization and hydrolysis as occurs under fieldconditions. In previous publications from this laboratory thebelief has been expressed that the pH of a soil paste, approxi-mately the moisture equivalent, approaches this ideal most close-ly; but there are still contributing factors which need clarificationin order the better to interpret this pH value. Important amongthese are: the influence of total salinity; the influence of individ-ual cations and anions; the influence of sodium carbonate and bi-carbonate; the influence of the hydrolytic properties of the

SOIL PH VALUES 371
exchange complex; the influence of the proportion of different-sized particles in the soil; and the relation of pH of the soil pasteto the so-called isohydric pH, the pH of exchange neutrality, andthe equi-ionic pH.
SALINITY-PH RELATIONSHIPS
In order to illustrate the variety of conditions and the difficultiesinvolved in the determination and interpretation of the pHvalues of alkaline-calcareous soils, some pertinent soil analyses aresubmitted in Tables 1 and 2. The soils presented in Table 1 arefrom widely scattered sections of the state and represent a widevariety of types and a set of conditions in which no relationbetween pH and general methods of soil analysis seems apparent.The soils in Table 2 represent a single type—that is, a group ofsixteen separate samples from sixteen separate but adjoiningborders in a single field.
Briefly, the methods used in the analyses of these soils were asfollows. Replaceable bases were determined by leaching 20 gramsof soil with 50 per cent methanol until free of neutral salts, thenwith 250 ml. of neutral normal ammonium acetate solution. So-dium, potassium, and magnesium were determined in aliquots ofthis leachate. Total exchange capacity was determined by wash-ing the soil on the filter until it was free from ammonium acetate,and by distilling the ammonia into standard acid, using MgO toalkalinize the soil suspension in a Kjeldahl flask. Replaceable cal-cium was determined by subtracting the sum of the sodium, po-tassium, and magnesium from the total.
Calcium carbonate was determined by the A.O.A.C. method ofabsorbing the total CO2 liberated on treating the soil with HC1, inNaOH solution, precipitating the CO^ with BaCl2, and titrating theexcess hydroxide.
Mechanical analyses were made by the hydrometer method.Soluble salts were determined by conductivity, using the L. and
N. soil conductivity bridge and a suspension of one part soil infive parts distilled water which had been shaken for one halfhour or by totaling the anions and cations. The separate ions weredetermined in this water extract after the soil suspension had beenfiltered.
The soils given in Table 1 vary in replacement capacity from3.7 milliequivalents per 100 grams to 23.6, from noncalcareoussoils to 10.18 per cent CaCO*, from 310 to 8,020 parts per millionsoluble salts, and mechanically from sand to clay. These soilsmay be identified from the following classification and numbers.1
1. Superstition sand from the Yuma Mesa.2. Clay loam soil from the Casa Grande Valley.
xWherever these numbers appear in this bulletin, they refer to the soilslisted here.

372 TECHNICAL BULLETIN NO. 104
3. Laveen sandy loam, University Farm, Mesa.4. Gila clay loam.5. Pima clay loam, Safiford Valley.6. Palos Verdes sandy loam, noncalcareous surface layer.7. Gila clay loam, black alkali soil.8. Casa Grande clay, brown silted phase.
9B. Sandy black alkali soil.10B. Sandy black alkali soil.
TABLE 1.—-CHEMICAL AND MECHANICAL ANALYSES OF SOILSIN GROUP 1
Soil no.
6453281
10B9B7
pH values
Original soilPaste
7.207,207.707.757.958.008.408.508.559.55
1:10
8.158.458.358.859,109.409.359.60
10.0010.40
Na sat. soilPaste
9.809.408.859.059.009.209.709.759.809.70
1:10
10.2010.3010.1510.2510.1510.2010.0010.2510.3010.40
Replaceable bases, m.e. per
Na
1.01.12.41..22.2
10.90.31.01.97.4
K
0.61.43.81.82.42.00.42.01.30.2
Mg
1.82.35.64.75.43.81.0
L4
Ca
1.32.6
11.81.54.03.62.0
..6*2
100 gm.
Total
4.77.4
23.69.2
14.020.3
3.74.15.89.2
6453281
10B9B7
CO3
00000
tr.0
2535
935
HCO3
230245875730230575180220375180
Soluble
Cl
4011063021016019020
21075
940
salts—p.p.m. soil
SO*
tr.225400160375125
tr.1,200
1002,400
Ca
tr.1,200
2002251709575
10035
150
Mg
20tr.tr.tr.1010tr.tr.tr.tr.
Na
8069569523016023535
700220
3,415
Totalsalts
3703,5822,8001,5551,1051,230
3102,455
8408,020
6453281
10B9B7
CaCO3
0.005.452.20
10.184.881.331.93
i"eo
Sand72443450424091848338
Per centMech. anal.
Silt1727373429186
108
37
Clay112929162942
369
25
SOIL PH VALUES 373
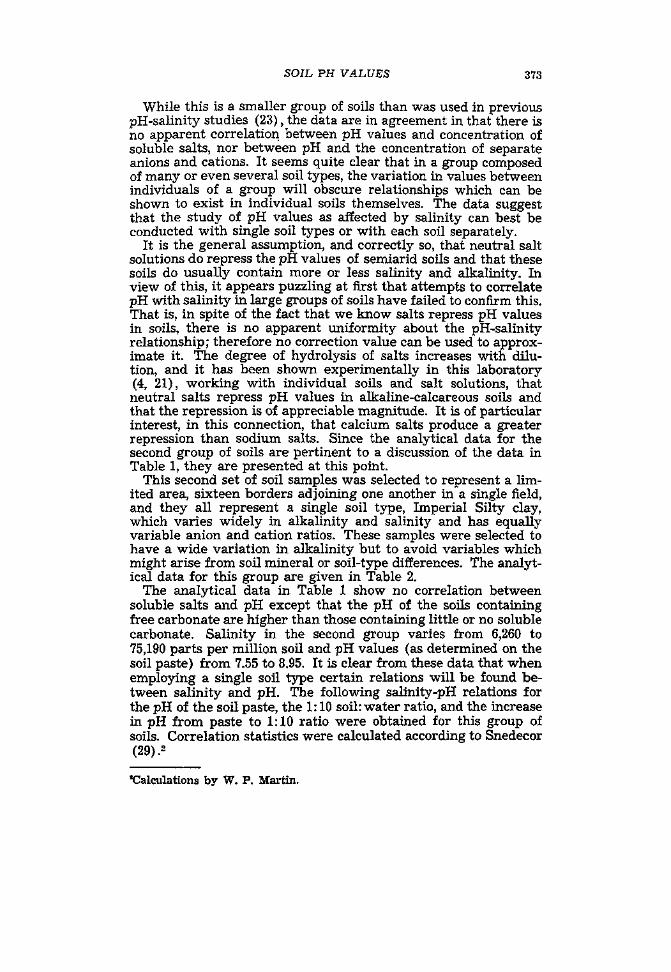
While this is a smaller group of soils than was used in previouspH-salinity studies (23), the data are in agreement in that there isno apparent correlation between pH values and concentration ofsoluble salts, nor between pH and the concentration of separateanions and cations. It seems quite clear that in a group composedof many or even several soil types, the variation in values betweenindividuals of a group will obscure relationships which can beshown to exist in individual soils themselves. The data suggestthat the study of pH values as affected by salinity can best beconducted with single soil types or with each soil separately.
It is the general assumption, and correctly so, that neutral saltsolutions do repress the pH values of semiarid soils and that thesesoils do usually contain more or less salinity and alkalinity. Inview of this, it appears puzzling at first that attempts to correlatepH with salinity in large groups of soils have failed to confirm this.That is, in spite of the fact that we know salts repress pH valuesin soils, there is no apparent uniformity about the pH-salinityrelationship; therefore no correction value can be used to approx-imate it. The degree of hydrolysis of salts increases with dilu-tion, and it has been shown experimentally in this laboratory(4, 21), working with individual soils and salt solutions, thatneutral salts repress pH values in alkaline-calcareous soils andthat the repression is of appreciable magnitude. It is of particularinterest, in this connection, that calcium salts produce a greaterrepression than sodium salts. Since the analytical data for thesecond group of soils are pertinent to a discussion of the data inTable 1, they are presented at this point.
This second set of soil samples was selected to represent a lim-ited area, sixteen borders adjoining one another in a single field,and they all represent a single soil type, Imperial Silty clay,which varies widely in alkalinity and salinity and has equallyvariable anion and cation ratios. These samples were selected tohave a wide variation in alkalinity but to avoid variables whichmight arise from soil mineral or soil-type differences. The analyt-ical data for this group are given in Table 2.
The analytical data in Table 1 show no correlation betweensoluble salts and pH except that the pH of the soils containingfree carbonate are higher than those containing little or no solublecarbonate. Salinity in the second group varies from 6,260 to75,190 parts per million soil and pH values (as determined on thesoil paste) from 7.55 to 8.95. It is clear from these data that whenemploying a single soil type certain relations will be found be-tween salinity and pH. The following salinity-pH relations forthe pH of the soil paste, the 1:10 soil: water ratio, and the increasein pH from paste to 1:10 ratio were obtained for this group ofsoils. Correlation statistics were calculated according to Snedecor(29) ?
Calculations by W. P. Martin.

374 TECHNICAL BULLETIN NO. 104
TABLE 2.—CHEMICAL ANALYSES AND MECHANICAL ANALYSESOF SOILS IN GROUP 2
Soil no.
11121314151617181920212223242526
M e. per
Ads. cap.
33.933.933.335.030.429.025.024.024.028.026.029.029.031.027.028.0
100 gms.
Ads. Na
12.58.77.74.811.712.39.36.011.323.416.413.022.126.514.55.9
p H values •
Paste
7.877.858.027.957.557.958.058.208.358.358.158.458.458.958.558.32
1:10
8.578.409.158.558.158.458.658.609.409.409 009.759.659.859.559.32
Mechanical analyses(%)
Sand
38282932363731272320222122222022
Silt
27282533363333373032342528262829
Clay
35444635283036364748445450525249
Chemical analyses, ions as p.p.m. m 1:10 water extract, total salts asp.p.m. in soil
11121314151617181920212223242526
CO3
005000553434104848383810
HCOa
1901021491178090687310210778204156136156107
Cl
6765287284
2,0561,556500160
1,8482,7881,22815253624832036
SO,
1,2401,060450840
1,6802,7202,0001,1001,0001,2001,400180700
1,160360200
Ca
901062213575062036739026262063722523011
Mg
114527825675tr.tr.2
tr.tr.242
Na
715520368291
2,5882,2961,104498
2,9123,3642,137423
1,1411,599675260
Totalsalts
29,22023,61010,68014,74072,36073,38040,51022,31059,22075,19050,61010,44026,03032,35015,8306,260
Carbonate, PH increases with increase in concentrations of CO3(Fig. 1). The correlation between CO3 and pH is significant bothfor the soil paste and at 1:10 soil: water ratio, and the increase inpH on dilution from paste to 1:10 ratio.
Bicarbonate. PH increases with increase in concentration ofHCO3 (Fig. 2). Correlation between HCOg and pH is significantat 1:10 soil: water ratio and for the increase in pH on dilution frompaste to 1:10, but it loses its significance for the pH of the soilpaste.
Chloride. While it is known that chlorides repress pH values,the statistical analysis of the data does not show any significantcorrelation between pH and Cl (Fig. 3).

SOIL PH VALUES 375
pH*O0U3A + 064r « 0 7 9 2 * *
pH«0.026A + 8.58r* 0.882**
pH- 0.014A +7.96r - 0 7 9 8 * *
10 20 30 40ppm CO3
50 6 0
Figure 1.—Correlation between pH and p.p.m. CO8 in soils: A, differencebetween pH at 1:10 and soil paste; B, pH at 1:10 soil: water ratio; C, pH ofsoil paste.
10-
1 9 -
pH* 0 0072 A +8.17r*0535*
pH-0 0072 A+8.17r - 0 535*
0299
80 100 120ppm HCO3
140 180 200
Figure 2.—Correlation between pH and p.p.m. HCO in soils: A} differencebetween pH at 1:10 and soil paste; B, pH at 1:10 soil: water ratio; C, pH ofsoil paste.


SOIL PH VALUES 377
Sulphates. PH decreases with increase in concentration ofsulphate (Fig. 4). At 1:10 soil: water ratio the correlation is sig-nificant and is highly significant for the increase in pH on dilutionfrom paste to 1:10; but like the HCO3, it loses its significance forthe soil paste.
Calcium. PH decreases with increase in concentration of Ca(Fig. 5). The correlation between pH and Ca is significant forthe soil paste, and highly significant for the 1:10 soil: water ratioand for the increase in pH with dilution.
Sodium. There is no significant correlation between pH and Na(Fig. 6).
Total salts. There is no significant correlation between pH andp.p.m. total soluble salts (Fig. 7).
Alkaline earth bases. There is definitely less Mg and Ca inthe soil extracts of the soils containing soluble carbonates.
An examination of the data in Tables 1 and 2 shows severaldefinitely defined characteristics of the salines and the hydrolyticclay complex which throw some light on the pH problem, partic-ularly with regard to the effect of dilution on pH and the pH-salinity relationship which is not in evidence when a comparisonis made between pH and total salinity of a group of soils. The onlysignificant data in Table 1 are the pH values which show thedilution effect; namely, the difference between the pH at 1:10 andpH of the soil paste, both in the original soils and after saturatingthe exchange complex with sodium. The soils in their originalstate of course contain the original salinity, while the sodium-saturated soils are free from neutral salts. The salt-free sodium-saturated soils show an increase in pH with increase in soil: waterratio, just as they did when the original salines were present. Inother words, the increase in pH with increase in soil: water ratiois a property of the potentially alkaline clay complex and willfunction independently of the presence or absence of salts. It isof interest that the dilution effect noted for these salt-free soilsis not in accord with results obtained by Puri and Asghar (26),who found that in the absence of salts the pH of the soil is notaffected by variation in the soil: water ratio. Since ionization isconfined to the surface, they believe that mere dilution in theabsence of salts may have no marked effect on the pH value ofthe soil suspension as a whole. Buehrer and Williams (5) in astudy of the effect of soil: water ratio on the pH of eight differentalumino-silicate minerals commonly present in soils, found thatonly bentonite increased in pH with increase in dilution. Allothers showed a decrease in pH. However, Buehrer and Williams(4) have shown an increase in pH for CaCO3 with increase inratio of CaCOa to water. Since CaCOa is a constituent of most ofthe soils of the irrigated areas of Arizona, it is clear that the twomost important potentially alkaline compounds in these soilsexhibit a dilution-pH relation even when there are no salts presentto repress hydrolysis. Since the pH of the soil is a function of sur-


SOIL PH VALUES 379
ence
ffer
"5Xa
0
x 9
8
9
£8
7
- X
-
-
-
4
* X
X *
o
°
o
4
• •
*
X
o
44
1
x
0
•»
1 1—
(A)X
(B) .a
(C) ,4
( f
X
O
(
X
-
•
*
4
+.
1 t 1
10,000 20,000 30,000 40p00 50,000 60,000 70P00 80,000ppm total salts
Figure 7 —Correlation between pH and p.p.m. total soluble salts in soilsnot significant.
face ionization, the hydrolysis of soil minerals and carbonates,and the several colligative properties of the soluble salts, it isevident that the dominance of one of these factors might affect theinfluence of the others in a comparison of analytical data from alarge group of miscellaneous soil samples.
That this is true for the salines is brought out very clearly bythe data in Table 2 and already briefly summarized. These an-alytical data show definite cation and anion concentration corre-lations with pH values, and they are-in agreement with some ofthe properties exhibited in laboratory experiments with singlesoils and single salt solutions. In most part the salts present inthese soils are sodium salts; namely, the chloride, sulphate, bi-carbonate, and carbonate. The pH of the soil increases with in-crease in concentration of carbonate and bicarbonate ions (Figs.1 and 2) and decreases with increase in concentration of sulphateand chloride3 ions (Figs. 3 and 4). This is a further explanationfor the absence of any correlation between sodium, total solublesalts, and pH values/ The data show that in a confusion of ionssuch as exists in a group of different soil types, no correlationshould be expected between pH values and the concentration of
I n this set of soils the pH-Cl relationship is not significant However it canbe shown experimentally that chlorides do repress pH values in salinesoils.

380 TECHNICAL BULLETIN NO. 104
sodium or total salts. In other words, the opposite effects of thedifferent anions on pH tend to oppose or balance one another andthus may or may not obscure the pH-salinity relations that canbe demonstrated under controlled conditions.
Since most of the irrigated soils of Arizona are calcareous, thepH-CaCOs relationship is important. The data in Table 1 showa relation between the presence of CaCO* and pH, but it is notquantitatively related to the percentage of CaCO3 in the soil. Thatis, the noncalcareous soil shows the lowest pH value at both 1:10soil: water ratio and on the soil paste. This is true for the sodium-saturated soils as well as for the soils in their original state. WhileCaCO3 is not usually classified as one of the soluble salts, insalinity studies on semiarid soils its solubility is of sufficient mag-nitude to warrant some recognition in pH and base exchangestudies. Apparently, because of its low solubility, the mere pres-ence is sufficient to impart the CaCO^ effect on pH, and this maybe a reaction between CaCOs and sodium salts. Buehrer andWilliams (4) have previously shown the absence of any correla-tion between percentage of CaCO. in soils and their pH values.
USE OF CENTRIFUGE FOR DEMONSTRATING THESALINITY-PH RELATIONSHIP
The preceding experiments show definite cation and anionrelationships between concentration and pH value of the soil,but they fail to show any relation between pH and total salinity,probably because of the confusion and opposite effects of the dif-ferent ions. In order to conduct a further study of the pH-salinityproblem, an experiment of a slightly different approach wasdesigned, using an Ivan Sorvell centrifuge. Fifty grams of soiland 50 ml. of boiled distilled water, making a 1:1 ratio, wereplaced in an 80 ml. cellulose nitrate tube, stoppered, thoroughlyshaken by hand, and centrifuged for ten minutes at 5,000 r/p.m.This operation was repeated ten times, decanting the supernatantsolution and adding a new portion of distilled water. PH deter-minations were made each time on the soil-water mixture beforecentrifuging and separately on the supernatant water and thesoil paste compacted in the bottom of the tube, after centrifuging.Conductivity of each water extract was determined with an L.and N. soil conductivity bridge, and chemical analyses weremade of some of the water extracts. These data are given in partin Table 3, and the following is a discussion of the results.
Soils number 2, 3, 4, 5, and 8 represent irrigated soils whichare saline but contain no black alkali. That is, they contain CaCO$and some replaceable sodium, but the latter is not present in suf-ficient amounts to impart the characteristic black alkali properties.The data for these soils show that when the centrifuge is used toseparate the soil and water extract, a definite pH-salinity relation-

SOIL PH VALUES 381
ship can be demonstrated for all saline soils. The pH values forthe soil paste, the soil-water suspension, and the water centrif-ugal separate all increase with successive extractions, and theconductivity determinations show successive reductions in sa-linity. It is significant that the greatest increase in pH from suc-cessive extraction of salines was obtained for soils 4 and 5, andthese soils were highest in soluble calcium. This is in agreementwith our experiments (21) which showed that calcium salts re-press pH values of soils more than do sodium salts. These centri-fuge studies prove that the best way to determine a pH-salinityrelation in soils is by analyzing the soils before and after removalof the salines rather than to attempt to establish a correlationbetween pH and the total salinity determinations.
For the black alkali soils, 7 and K, both the conductivity and thepH behave differently with successive extractions of the solublesalts; that is, there is a decrease in the pH of the soil paste as com-pared with the increase found for the soils which do not have anyblack alkali present. For the soil-water suspension and the waterextracts the pH increases as in the case of the saline soils, but thisincrease is much smaller and almost within experimental error.It should be mentioned that both soils, 7 and K, contained someNajCO,*, and the exchange complex was nearly saturated withsodium. As already mentioned, we have found that black alkalisoils usually contain more adsorbed sodium than the equivalentof the total exchange capacity of the soil as determined withneutral normal ammonium acetate solution. We have postulatedthat this indicates a surface adsorption of NaOH, or Na2CO3 inexcess of the sodium chemically combined with the exchangeminerals, or that in black alkali soils some of the replaceablesodium is more loosely held. The decrease in pH of the soil pasteas the successive water extracts increase in pH indicates that bythe removal of this loosely held alkalinity the clay complex, atthe moisture content represented by the soil paste, undergoes areduction in hydrolytic capacity. Kelley and Cummins (17), in astudy of the effect of salts on soils, found notable differences inthe reaction between soils and solutions of neutral and alkalinesodium salts. On treating the soils with the neutral and alkalinesolutions, sodium was removed from the solution in increasingamounts in passing from the less to the more alkaline solutions.There may also be some relation between the difference in be-havior noted for the black alkali soils and the observations ofKelley and Brown (16) that neutral soils absorb substantialamounts of Ca(OH)2 without exchange of cations and that thisabsorbed Ca (OH) 2 appears to be loosely held. On leaching suchsoils they report that the leachate continued alkaline after pro-longed leaching. Jarusov (15) has noted what he refers to as"dissimilar mobility" for replaceable H ions; namely, H ionswhich are characterized by a high degree of mobility, and hydro-lytic H ions as of a lower degree of mobility.


384 TECHNICAL BULLETIN NO. 104
Referring to the pH values of the first and tenth soil-watersuspensions, the change in pH from the first to the tenth is leastfor the black alkali soils. Since these soils are saline as well asalkaline, the data indicate less pH repression from salinity inblack alkali soils than in the saline soils where sodium car-bonate is absent and replaceable sodium is not present in sufficientamount to impart the black alkali properties. The black alkalisoils are highest in CO8 and HCO3 ions which tend to increase thepH of the soil suspension and oppose the decrease in pH producedby Cl and SO4 ions. When such soils are subjected to successiveextractions with water, the ratio of HCO3 + CO» / Cl + SO4increases, and this alkalinity tends to maintain a higher pH at thetenth water extraction, desalinization. The degree of hydrolysisof the exchange complex of the saline soils is not nearly so greatas in the soils where the exchange complex is nearly saturatedwith sodium and free Na2COa is present.
It is of interest to study the data in Table 3 from another angle.The effect of dilution on the pH, obtained by subtracting the pHof the soil paste from the pH at 1:1 soil: water ratio, is greatestin every case at the tenth extraction. Since the soluble salts arelargely washed out of the soils at this point, this is additionalevidence of pH repression by salinity and that the increase in pHof the soil with increase in soil: water ratio is definitely a prop-erty of the soil colloids and their ion atmosphere, independentlyof the salinity effect on pH and the fact that salts do influencetheir hydrolysis.
The relation between the pH and the conductivity of the tenthwater extract is also of interest (Fig. 8). Excepting the noncal-careous soil and the Superstition sand, both distinctly differentfrom average semiarid soils, the values obtained by subtractingthe pH of the soil paste from the pH of the 1:1 soil-water suspen-sion, the dilution effect, varies only between the minimum of 0.6and the maximum of 0.9 while the resistance (L. and N. soil con-ductivity bridge) varies from 511 to 3,580 ohms. This again indi-cates a source of error arising from attempts to correlate the pHof soils with total salts if they are calculated from conductivity,for it is clearly evident that the soil colloids in a soil suspension,as well as the soluble salts, contribute to the total conductivity ofthe soil suspension. Figure 8 shows that there is a wide variationin the conductivity of these soil suspensions which have beenwashed ten times and are therefore essentially free of solublesalts. The conductivity is highest for the two black alkali soils andleast for the Palos Verdes and Superstition soils, which are lowestin clay content. Figure 9 shows how the pH of the soil suspensiondecreases with the increase in conductivity.
Soil number 1, Superstition sand, is an unusual type of soilcontaining more than 90 per cent sand and only 3 per cent clay;but in spite of this it has a relatively high pH value. The salinityis very low. In this soil the changes in pH with successive extrac-

SOIL PH VALUES 385
tions were only minor, as was also the difference in pH betweenthe water extract and the soil. This is evidence that the silt andclay fractions exhibit the major influence on pH changes of thisnature.
2000 -
1000 •
Figure 8.—Correlation between pH and conductivity of tenth water extract.Table 3.

386 TECHNICAL BULLETIN NO. 104
The Palos Verdes soil, number 6, is a noncalcareous soil low insalinity. It is an upland soil from which the CaCO3 has beenleached out of the surface soil into the lower soil horizons. Itshows only a very small increase in pH with successive extractions.
For the purpose of comparison, an acid soil from Rhode Island(R.I.) was included in the experiment. In this soil both salinityand CaCO.3 effects are entirely absent, and replaceable H is thedominant cation. It is of interest that the pH increases withsuccessive extractions in both the soil-water suspension and in thesoil and water separates, but at each extraction all three deter-minations are in rather close agreement.
The centrifugal method shows that several significant factorsare involved in the pH changes in soils with change in soil: waterratio. Arid saline soils, calcareous and noncalcareous, increasein pH value with successive extractions with distilled water andreduction in conductivity, but there is no relation between themagnitude of the initial or final pH and the initial or final con-ductivity. The black alkali soils continue to decrease in pH (soilpaste) with successive extractions up to the end of the ten ex-tractions made in this experiment. In practically all cases the pHof the soil-water suspension is greater than either the water sep-arate or the soil paste. It is of further interest that for every soilthere was an increase in pH of the soil-water suspension with in-crease in number of extractions. This applies to the calcareousand noncalcareous soils, to those containing NaoCOs and where itwas not present, and to those both high and low in salinity, andit shows the prolonged hydrolytic property of the exchangecomplex.
The analytical data presented in Tables 1 and 2 were obtainedby analytical methods commonly employed in the examination ofsemiarid soils and illustrate how several factors may affect thepH values and the changes in pH values with variation in soil:water ratios. Both the calcareous and noncalcareous soils willexhibit hydrolysis as an inherent property of the mineral soilfraction, but in the presence of neutral or alkaline salts this willbe in proportion to the concentration and ratio of ions. Among theways in which salinity functions to repress pH values there arereduction in activity of water, coagulation of colloids, reducedsurface, repression of hydrolysis, and chemical reaction with theexchange complex and thus a change in hydrolytic equilibria.
THE HEHNER METHOD
Many years ago the Hehner method (28) was quite widely usedin water analysis to determine the Na2CO3 and the method wasapplied to a limited extent in the analysis of alkali soils. The fol-lowing is the method as applied to soils. Twenty-five grams of soilare weighed into a 500 ml. volumetric flask, 400 ml. of boileddistilled water added, and the whole digested on the steam bath

SOIL PH VALUES 387
1000) «.^ 2 0 ?P -. 30%- ,4£2£U 5000, 600Bridge Readmg,0hms(60#E) of soil-water
6 0 0 0
t suspension
Figure 9.—Relation between conductivity and pH of soil which has beenextracted ten times with distilled water.
TABLE 4.—COMPARISON OF HEHNER AND PH VALUES
Soil no.P.p.m. total
sol. saltsPer centNa,CO*
Hehner valuePH soil paste PH 1:10 PH 1:10-
paste
Alkaline soils12578XB13192022232425KC9294
3101,1052,8008,02012,30224,0006,48010,68059,22075,19010,44026,03032,35015,8305,320
8401,775
.0424
.0636
.0212
.2544
.1164
.3284
.1060
.1692
.1484
.1692
.2548
.2648
.2120
.1164
.2964
.1904
.0952
.0212
8.407.957.709.558.008.959.308.028.358.458.458.459.858.559.658.858.558.50
9.359.108.3510.409.409.859.989.159.409.409.759.659.859.5510.3510.0010.009.60
0.951.150.65
- 0.851.400.900.681.131.050.951.301.200.901.000.701.151.451.10
Saline soils41112141516171821
3,58229,22023,61010,47072,36073,38040,51022,31050,610
7.207.877.857.957.557.958.058.208.15
8.458.578.408.558.158.458.658.649.00
1.250.700.550.600.600.500.600.440.85
for ten hours. It is then cooled, made to volume, shaken, and fil-tered. Fifty ml. of the filtrate is evaporated to dryness on the steam

388 TECHNICAL BULLETIN NO. 104
bath in a platinum dish, with 25 ml. of N/25 Na2CO3. This residueis rubbed up in the dish with an agate pestle by using boileddistilled water for complete transfer to a 100 ml. vol. flask, made tovolume, shaken, and let stand over night. Fifty ml. of this is drawnoff with a pipette, transferred to a glass bottle, 5 ml. of CHC13,and 5 ml. of a 0.1 gram per liter solution of erythrosin are added.This is titrated with N/20 H2SO4 until it becomes colorless.
If less acid is required than is necessary to balance the Na2CO3which was added, then some of the carbonate has reacted withcalcium and magnesium salts, and no Na2CO3 is present in thesoil extract. If more acid is required for the titration than thatequivalent to the Na2COa added, then black alkali is present inthe soil extract. Obviously the method measures both NaHCO3and Na2CO8.
The Hehner method was selected for a further study of therelation between NaHCO3 and Na CO* and the pH values of thesoil as determined at the 1:10 soil: water ratio and on the soilpaste. Twenty-seven soils were selected for this study, of whicheighteen showed alkalinity by the Hehner method and nine didnot. These data are given in Table 4, while the soils showingalkalinity are shown in relation to pH in Figure 10.
In interpreting these data an undetermined salinity effect onpH must be recognized. With due consideration to this salinityeffect—namely, the wide variation in the saline concentration ofthe soil solution of this group of soils—it is believed that the cor-relation between the Hehner values and pH is quite definite forthe values at 1:10 soil: water ratio and for the soil paste. On sub-tracting the pH of the soil paste from the pH at 1:10, in order toget the dilution effect on pH, a mean value of 1.04 is obtained forthe black alkali soils and of 0.63 for the nine saline soils, showinggreater hydrolysis in the former.
05 •0 15 20 25 .30Hehticr Values-Per cent Nag COj
Figure 10.—Correlation between Hehner values and pH of soil: A, 1:10soil: water ratio; B, soil paste.

SOIL PH VALUES 389
The Hehner method, in agreement with the salinity studies,shows a definite correlation between the Na2COs, plus NaHCO,*in the soil and the pH value.
BASE EXCHANGE—PH RELATIONSHIPS
While base fixation and exchange had been recognized (begin-ning with the experiments of Way) as an important soil property,full appreciation of its value began with the researches of Gedroiz,Kelley, Hissink, and others sixty years or more thereafter. Thisnew emphasis on the adsorptive property of the soil arose from thediscovery that the clay fraction of the soil possesses definitechemical properties, that the exchange of bases between the soilminerals and the electrolytes of the soil solution takes place inchemically equivalent proportions, and that the nature of thecations attached to the exchange complex greatly influences soilproperties. A new field of investigation was opened by these dis-coveries because soils in which the exchange complex is saturatedor near saturated with sodium possess high pH values and exhibitmany other properties which up to this time had been attributedonly to Na2CO;t in black alkali soils. That certain soil propertiesmight in turn have an influence on the adsorptive capacity of thesoil for cations was not at first recognized. It has now been quiteconclusively shown that the constancy of the exchange capacityvalue depends upon the pH of the salt solution used to determinethe exchange capacity of the soil. That is, for complete saturationof the soil with bases, salt solutions of high pH values must beused instead of neutral salt solutions.
Kelley and Brown (16) obtained an increase in exchange capac-ity on treating soils with Ca (OH) o- Using mixtures of KC1 andKOH, Bradfield (2) found an adsorption of K by the soil whichincreased with increase in pH, and the soil did not reach satura-tion until pH 10.0. Tiulin (30) and Bystrova have shown that re-placeable H ions are not completely replaced by neutral saltsolutions. Treatment of the soil with Ca(OH)2 gave a higherexchange capacity than neutral salt solutions, and this was morecharacteristic of podsols than chernozems. They offered the ex-planation that neutral salt solutions do not completely replaceH ions and that the sesquioxides and hydrates in acid soils, whichhave exchange properties as electronegative colloids, functiononly after treatment with an alkaline solution. Mattson (19) andhis associates have had similar experiences with Fe(OH)8 andAl (OH) s ampholytes. After determining the isoelectric points ofthese hydrogels, they leached them with salt solutions of pH valuesequal to the isoelectric point and found that they exhibited no ex-change properties. When they were leached with salt solutionswith pH values higher than the isoelectric point they exhibited

390 TECHNICAL BULLETIN NO. 104
cation exchange properties. Mattson says that total exchange ca-pacity is a meaningless term and that the exchange capacity at pH7.0 bears no simple relationship to total combining power. In ex-pressing the exchange capacity of a soil he believes it is necessaryto state the pH at which the determination was made. Puri (25)also concluded that the base exchange capacity of the soil is ameaningless term unless it is taken to pH 10.0 or the point at whichthe soil takes up a maximum of bases. He recommends exposingthe soil to a normal solution of NH4OH in a desiccator for completesaturation with NH4. He says the logical way of expressing baseexchange capacity is by means of a titration curve from which thesaturation capacity for any pH can be calculated.
Most of the work of the above nature has been done on acidsoils. Alkaline-calcareous soils have pH values which are abovethe isoelectric points of the sesquioxides and hydrates, so it ishardly conceivable that there could be an increase in the exchangecapacity from this source by treating these soils with salt solu-tions of high pH values. There is, however, some evidence thatthe exchange capacity of semiarid soils is increased by contactwith salt solutions of high pH values. Reference is made to ourown experiences, as well as to those of Kelley and Brown (16) andKelley and Cummins (17), that on determining the replaceablebases and exchange capacity of black alkali soils, soils of high pH,the exchange capacity of the soil as measured by the adsorption ofNH4 from a neutral solution of ammonium acetate or ammoniumchloride is less than the total replaceable bases set free in theleachate and often is less than replaceable sodium alone. Thisinvestigation is concerned with exchange capacity of the soil onlyin so far as it is related to the pH value of the soil. If the pH valueof the salt solution in contact with the soil influences the exchangecapacity, might one find a similar effect on the pH of the soil? Theexperiments immediately following were designed to study thisphase of the pH problem.
Hydrolytic pH is, in most soils, a function of the silt and clayfractions because of the part these soil fractions play in cationadsorption. It is of interest to compare the data in Table 1 on thisbasis. In Figure 11 the sum of the percentage of clay and silt inthe soil is plotted against the effect of dilution on the pH of thesoil. It is shown that the increase in pH with dilution of the soilcorrelates with an increase in silt and clay.
Among the data in Tables 1 and 2 there are several soil sampleswhich are high in replaceable sodium. The ratio of sodium tototal replaceable bases was calculated, and the relation of thisratio to pH is shown in Figure 12. These ratios are plotted againsttwo pH values; namely, the pH at 1:10 soil: water ratio and thepH of the soil paste. The data show a significant increase in pHwith increase in Na/total rep. cap. Since eleven of these soilscontain some sodium carbonate, it is possible that this may havesome influence on the location of the points on the chart. Williams

SOIL PH VALUES 391
(31) studied the relation between the Ca:Na ratio and pH inbentonite and found a linear relation between this ratio and pH,the line beginning at pH 10.2 for bentonite containing 44.27 m.e.Na and 22.7 m.e. Ca and ending at pH 9.6 for bentonite with 90.0m.e. Ca and 2.42 m.e. Na. He made these pH measurements in1:10 water suspensions.
For the group of soils given in Table 1 an experiment was con-ducted in which each soil was saturated with sodium in order tostudy the pH values of sodium-saturated soils. The experimentwas also designed to determine whether the pH values of thesodium-saturated soils increase with the capacity for adsorptionand the absolute amount of replaceable sodium. The data obtainedare extremely illuminating. Sodium saturation was accomplishedby leaching the soils with a normal solution of NaCl in which thepH was adjusted to pH 9.5 and washing the soils once with waterand then with 60 per cent methanol to remove the excess of NaCl.The pH values obtained with these sodium-saturated soils arepresented in Figure 13. They show that regardless of the adsorp-tion capacity of the soil the pH values for all these soils at 1:10soil: water ratio are approximately the same. This means that allsoils, when saturated with sodium, will exhibit closely the samepH at 1:10, when neutral salts are absent, regardless of the abso-lute amount (as milliequivalents per 100 grams) of replaceablesodium present. The pH of Superstition sand with 3 per cent clayand 3.7 m.e. replacement capacity per 100 grams is just as high asthe Casa Grande loam with 45 per cent clay and 23.7 m.e. replace-ment capacity. The "constant" pH value for these sodium-saturated soils appears to be approximately 10.2 at 1:10 soil: waterratio.
When the pH values of the sodium-saturated soils are deter-mined on the soil paste, there is a highly significant decrease withincrease in exchange capacity or m.e. replaceable sodium per 100
10 20 30 40 50 60 70Per Cent Silt + Clay
Figure 11.—Correlation between per cent silt plus clay in soil and differencebetween pH at 1:10 and soil paste, dilution effect.


394 TECHNICAL BULLETIN NO. 104
obviously quite variable. The dissimilar structure of the at-mosphere of cations, according to Jarusov (15), greatly influencescation mobility; and he associates high mobility under conditionsof a loose structure and low mobility where the ions exist in acompact cation atmosphere. It seems reasonable to assume that thedifferences noted for the pH values of sandy and clay soils maybe associated with the nature of the cation atmosphere in soils ofdifferent mechanical texture.
The pH of most alkaline-calcareous soils is 8.0 or higher whenthe pH determination is made on a 1:10 soil: water ratio. Sincethis is above the isoelectric point of the sesquioxides and hydrates,this fraction of the exchange complex should be in possession ofits full exchange properties when a salt solution is used to deter-mine the exchange capacity of such soils. This is confirmed in thefollowing experiment.
Six soils varying in exchange capacity from 3.7 to 23.6 m.e. per100 grams, as determined with a solution of neutral normal am-monium acetate, were alternately leached several times withnormal sodium acetate solution and normal ammonium acetatesolution, both of which had been adjusted to pH 8.5. After eachleaching to the saturation point, the excess reagent was washedout with 60 per cent methanol; thus it was possible to determinethe displaced sodium in the ammonium acetate leachate and thedisplaced ammonium in the sodium acetate leachate. The datathus obtained are given in Table 5 and show a very close agree-ment between the replacement capacity as determined with aneutral salt solution and one which has been adjusted to pH 8.5.It is clearly evident from these data that the sesquihydrates inthese soils are in full possession of their exchange property.
Following this experiment, soil number 8 was selected for astudy of the effect of raising the pH of the leaching solution to10.2. Each of 10-gram portions of soil was leached with 250 ml. ofnormal sodium acetate solution in which the pH had been adjustedto pH 10.2, the soil then thoroughly washed with 60 per centmethanol, then with normal ammonium acetate solution, and thesodium determined in the leachate. Eight replications were usedin this experiment, and the eight separate determinations of
TABLE 5.—EXCHANGE CAPACITIES OF SOILS LEACHED WITH SO-LUTIONS OF SODIUM ACETATE AND AMMONIUM ACETATE
SOLUTIONS OF PH 8.5 AS COMPARED TO AMMONIUMACETATE SOLUTION PH 7.0
Soilno.
145678
Am, ac.7.0
3.77.4
23.64.79.2
20.3
Sod. ac.8.5
3.26.7
24.13.99.3
19.8
Am. ac.8.5
3.59.1
25.64.8
10.420.6
Sod. ac.8.5
3.97.7
23.73.89.1
19.9
Am. ac.8.5 I3.0
5.2
20.9
Sod. ac.i 8.5
3.0
19.4

SOIL PH VALUES 395
adsorption capacity checked within 1.4 m.e. per 100 grams of soil.That is a variation of 21.6 to 23.0 m.e. per 100 grams of soil. Acomparison of these data with the exchange capacity given for thissoil in Table 5 shows an increase of approximately 2 m.e. per 100grams soil at pH 10.2, as compared to the value obtained at pH 7.0.
In the next experiment, six soils were leached with normalNaCl solution adjusted to pH 11.1. Five-gram portions of soilwere leached with 250 ml. of this solution, then with 60 per centmethanol, and again with 250 ml. of normal ammonium acetatesolution. Sodium was determined in the leachate, and the NH4fixed by the soil was determined by distillation into standard acidafter the excess of ammonium acetate was washed out with 60per cent methanol. The data obtained are given in Table 6,together with the replacement capacity of the soils as determinedat pH 7.0.
This experiment and that preceding it show that the cationadsorbing capacity of alkaline-calcareous soils is increased byleaching with salt solutions adjusted to high pH values. Since thisinvestigation is concerned primarily with pH studies, what effectdoes this higher replacement capacity have on the pH value of thesoil? The next experiment was designed to study this phase of thepH-exchange complex problem.
Six soils were selected for a study of the pH values of soilswhich have been saturated with sodium at different pH valuesTABLE 6.—COMPARING REPLACEMENT CAPACITY WITH NEUTRAL
AMMONIUM ACETATE AND SODIUM CHLORIDESOLUTION OF PH 11.1
Soil no.
483762
Am. ac. 7.0
7.420.39.29.24.7
14.0
Sod. chl. 11.1
13.623.414.514.86.7
19.2
Am. ac. 8.5
10.625.512.014.05.0
20.1
TABLE 7.—PH VALUES OF SOILSCOMPLEX WITH Na, USING SODIUM
PH of solutions
Soil no. 2, pasteSoil no. 2, 1:10
Soil no. 4, pasteSoil no. 4, 1:10
Soil no. 6, pasteSoil no. 6, 1:10
Soil no. 7, pasteSoil no. 7, 1:10
Soil no. 3, pasteSoil no. 3, 1:10
Soil no. 5, pasteSoil no. 5, 1:10
NaCl
7.0
9.3510.05
8.959.90
8.809.25
9.209.95
9.4510.05
9.3510.25
9.0
9.4510.00
9.159.85
8.759.35
9.259.95
9.409.95
9.4010.20
10.0
9.4510.45
9.159.90
9.009.75
9.209.90
9.459.90
9.4510.20
AFTER SATURATINGSALT SOLUTIONS OF
NaaSO*
7.0
9.3010.10
9.109.90
8.859.45
9.259.90
9 559.95
9,4010.15
9.0
9.3510.00
9 309.95
8,909.35
9.259.90
9.559.95
9.401015
10.0
9.3510.10
9.4010.10
9.40
9.4010.00
10.2010.20
9.8510.35
THE EXCHANGEPH 7.0, 9.0, AND 10.0
NaCiHsOj
7.0
9.359.90
9.259.90
8.809.40
9,209.85
9.309.80
9.3510.10
9.0
9.2510.05
9.209.90
8.959.55
9.359.90
9.459.90
9.5510.15
10,0
9.3010.05
9.309.90
8.909.50
9.259.85
9.559.90
9.4010.10

396 TECHNICAL BULLETIN NO. 104
by leaching the soils with salt solutions which had been adjustedto different pH values. The solutions used were normal solutions ofsodium chloride, sodium sulphate, and sodium acetate adjusted topH values of 7.0, 8.0, 9.0, and 10.0. The saturation with sodium wasaccomplished by weighing 20 grams of soil into 150-ml. beakers,adding the respective salt solutions, and transferring the whole toa filter where it was leached with 250 ml. of the respective saltsolution. The soils were then washed on the filters with successiveportions of 60 per cent methanol until they were free from excesssalt. PH values were determined on these soils at the moistureequivalent and at 1:10 soil: water ratio. These data are given inTable 7. In spite of the fact that there is an increased adsorption ofsodium when the soils are leached with sodium-salt solutionswhich have been adjusted to high pH values, the data given inTable 7 show that this increase in adsorption has little or no effectupon the pH value of the soil. All the values are in close agree-ment, considering the difficulties involved in washing an excessof alkali salts out of a soil. It is of interest that the Palos Verdessoil, number 6, which is noncalcareous, does not reach the maxi-mum values exhibited by the calcareous soils.
SESQUIHYDRATES
Among the colloids commonly occurring in soils, the oxides andhydrates of iron and aluminum—the so-called sesquioxides orhydrates—are important. These colloids are electrical ampholytesand are electropositive in an acid medium and electronegative inalkaline media. Little is known about the extent to which thesematerials, at pH values above their isoelectric points, contributeto the pH of soils (18). Obviously in alkaline soils such colloids areelectronegative, and Mattson (19) has shown that at pH valuesabove their isoelectric points they possess cation exchange prop-erties. The following isoelectric points are given by Mattson,depending upon whether the chloride or the sulphate is used toprepare the hydrate.
A1C13 and NaOH pH 8.1FeCl3 and NaOH pH 7.1Al2 (SO4) z and NaOH pH 7.6Al2 (SO4) 3 and NaOH pH 7.8
Most of the alkaline-calcareous soils of Arizona have pH valueshigher than the isoelectric points given by Mattson for thesehydrates. In view of this, we should expect these sesquihydratesand oxides to function as exchange compounds and therefore tocontribute to the pH of these soils.
In order to study this phase of the pH problem, hydrates ofaluminum and iron were prepared in the laboratory. To a solution

SOIL PH VALUES 397
of NaOH a solution of Aid* was added at room temperature, withcontinuous stirring, and with frequent testing with a pH meter,until the pH value of the whole was reduced to pH 9.0. For thepreparation of the ferric hydrate the same procedure was followedwith solutions of FeCla and NaOH. After having stood for twenty-four hours, both gels were shaken in a flask with distilled waterand filtered three times in order to remove the excess of NaCLAfter the gels were thus washed, the pH of the Al (OH) 8 was 9.0and that of the Fe (OH) 3 was 8.9.
PH studies on small portions of these hydrates were made asfollows. One portion of each was dried in the oven at 105 degreesC, another was dried in the air, and a third portion was reservedwithout drying to be studied as a gel. PH determinations weremade on the gel at the gel stage, on the dry hydrates at low mois-ture content approximating the moisture equivalent, and on allthree at 1:10 dilutions with boiled distilled water. These data aregiven in Table 8. The hydrates were then washed free of NaClwith distilled water and the pH values were again determined at1:10 after just enough water was added to form a gel. These dataare also given in Table 8.
TABLE 8.—PH VALUES EXHIBITED BY THE SESQUIHYDRATES
Fe(OH), gelAl(QH)* gelFe(OH)a air-dryAl(OH), air-dryFe(OH)'} oven-dryAl(OH)-) oven-dry
PH before leaching
Paste
9.909.057.857.859.008.00
1:10
10.108.708.808.709.858.85
PH after leaching
Paste
9.609.50
10.6010.00
1:10
10.259.15
10.859.95
It is evident that these sesquihydrates may function as contrib-uting factors in the high pH of alkali soils.
Gel. In the original gel form the pH of the Fe (OH) 8 is higherthan the A1(OH)». The former is increased by dilution to 1:10while the latter is reduced.
Air-dried hydrates. The air-dried hydrates, which should closelyresemble the sesquihydrates in the soil, show that air-drying hasreduced the pH value as compared with the original gel. Bothhydrates show an increase in pH with dilution from the paste tothe 1:10 ratio. After the air-dry hydrates were leached to ridthem of NaCl, there was a notable increase in pH for both; but itis greater for the Fe(OH)8 than for the A1(OH)«, and as theoriginal gel, the pH of the Al (OH) 8 decreases with dilution whilethe pH of the Fe (OH) g increases with dilution.
Oven-dried hydrates. The oven-dried hydrates have a higherpH than the air-dried, and before the NaCl is leached out the pHat 1:10 is appreciably higher than that for the paste. After theNaCl is leached out, this dilution effect is greatly reduced forFe(OH)3 and completely absent for A1(OH)8.

398 TECHNICAL BULLETIN NO. 104
There is evidence that the sesquihydrates at pH values abovetheir isoelectric points possess permanent and high pH values and,as do the carbonates and the exchange silicates, will contributeto the high pH values of alkali soils—depending of course uponhow extensively they are present. Both the iron and aluminumhydrates exhibit the dilution behavior, as has been noted foralkaline-calcareous soils; namely, an increase with dilution. How-ever, in the absence of salts the dilution effect for Al(OH),* isnegative while the Fe (OH) * is positive both in the presence andabsence of salts.
Exchange capacity. As a matter of interest, the adsorbing ca-pacity of the dried hydrates was determined by placing a quanti-tatively weighed portion of each on a filter where they wereleached with normal ammonium acetate, pH 8.5, then with dis-tilled water until free from ammonium acetate. The adsorbedNH4 was then determined in the hydrates by distillation withMgO into standard acid. The following NH4 adsorption was found.
Fe (OH) i air-dried 22.2 m.e. per 100 gm.A1(OH)3 air-dried 9.6 m.e. per 100 gm.Fe(OHh oven-dried 20.2 m.e. per 100 gm.A1(OH)3 oven-dried 8.1 m.e. per 100 gm.
The Fe (OH) A apparently has a higher cation exchange capacitythan has Al(OH),*, and this may explain the difference in pHvalues exhibited on dilution.
PH OF SOIL SEPARATES
The soil mass is composed of mineral particles varying fromthose of colloidal dimensions to particles of gravel or even larger,and the cations adsorbed by these particles are among the mostreactive of those present in the soil. While some base exchangestudies have been conducted with the different-sized soil particles,pH studies on them seem to be lacking. It seemed of interest,therefore, to study the contribution which the different-sized soilparticles make to the pH of the soil mass as a whole. For a studyof this phase of the problem, particle separates were prepared fromten different soils. A 500-gram portion of soil was worked in amortar (a rubber pestle was used) with 60 per cent methanoland washed through a set of sieves of 20-mesh (0.84 m.m.) to 100-mesh (0.149 m.m.), The process of rubbing and washing was re-peated as long as any clay appeared in the washings. Furtherseparation of the portion passing the 100-mesh sieve was accom-plished by sedimentation to obtain fractions of clay (.002 m.m.),silt (.002-.02 m.m.), and sand (.02-149 m.m.). All these separateswere dried in air and their weights calculated to percentage ofthe different-sized particles in air-dry soils. These percentagesare given in Table 9. Some of the fractions were too small for pHdetermination and it was therefore necessary to combine some ofthe separates to increase the size of the sample.

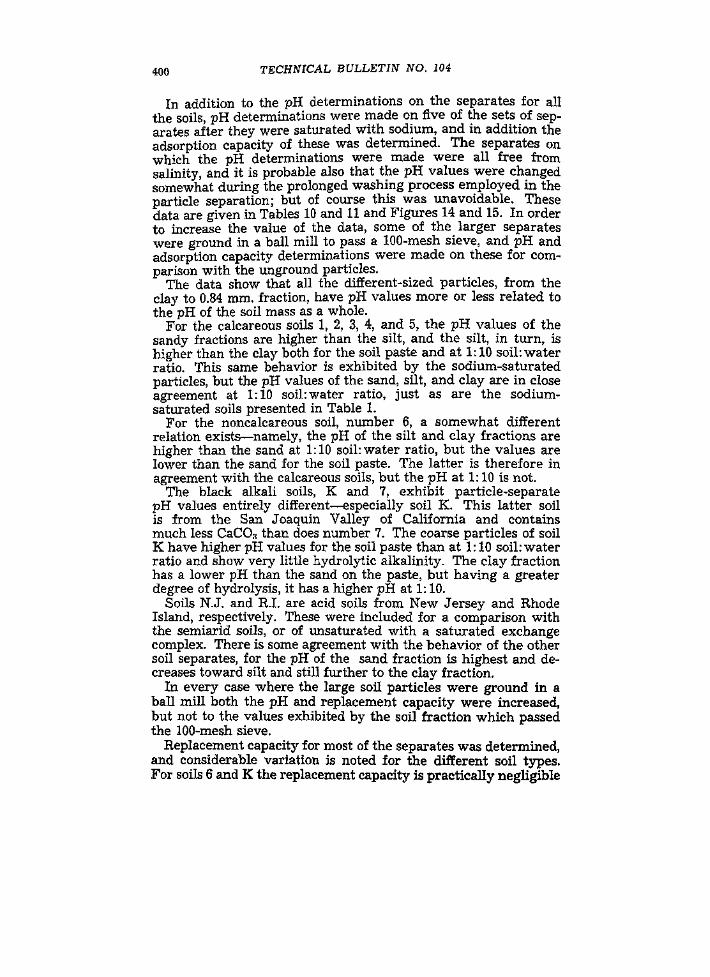
400 TECHNICAL BULLETIN NO. 104
In addition to the pH determinations on the separates for allthe soils, pH determinations were made on five of the sets of sep-arates after they were saturated with sodium, and in addition theadsorption capacity of these was determined. The separates onwhich the pH determinations were made were all free fromsalinity, and it is probable also that the pH values were changedsomewhat during the prolonged washing process employed in theparticle separation; but of course this was unavoidable. Thesedata are given in Tables 10 and 11 and Figures 14 and 15. In orderto increase the value of the data, some of the larger separateswere ground in a ball mill to pass a 100-mesh sieve, and pH andadsorption capacity determinations were made on these for com-parison with the unground particles.
The data show that all the different-sized particles, from theclay to 0.84 mm. fraction, have pH values more or less related tothe pH of the soil mass as a whole.
For the calcareous soils 1, 2, 3, 4, and 5, the pH values of thesandy fractions are higher than the silt, and the silt, in turn, ishigher than the clay both for the soil paste and at 1:10 soil: waterratio. This same behavior is exhibited by the sodium-saturatedparticles, but the pH values of the sand, silt, and clay are in closeagreement at 1:10 soil: water ratio, just as are the sodium-saturated soils presented in Table 1.
For the noncalcareous soil, number 6, a somewhat differentrelation exists—namely, the pH of the silt and clay fractions arehigher than the sand at 1:10 soil: water ratio, but the values arelower than the sand for the soil paste. The latter is therefore inagreement with the calcareous soils, but the pH at 1:10 is not.
The black alkali soils, K and 7, exhibit particle-separatepH values entirely different—especially soil K. This latter soilis from the San Joaquin Valley of California and containsmuch less CaCOs than does number 7. The coarse particles of soilK have higher pH values for the soil paste than at 1:10 soil: waterratio and show very little hydrolytic alkalinity. The clay fractionhas a lower pH than the sand on the paste, but having a greaterdegree of hydrolysis, it has a higher pH at 1:10.
Soils N.J. and R.I. are acid soils from New Jersey and RhodeIsland, respectively. These were included for a comparison withthe semiarid soils, or of unsaturated with a saturated exchangecomplex. There is some agreement with the behavior of the othersoil separates, for the pH of the sand fraction is highest and de-creases toward silt and still further to the clay fraction.
In every case where the large soil particles were ground in aball mill both the pH and replacement capacity were increased,but not to the values exhibited by the soil fraction which passedthe 100-mesh sieve.
Replacement capacity for most of the separates was determined,and considerable variation is noted for the different soil types.For soils 6 and K the replacement capacity is practically negligible

SOIL PH VALUES
TABLE 10.—PH VALUES FOR SOIL PARTICLE SEPARATES
401
Size ofparticle
149—.84*.84 plus.42—.84.25—.42.02—.149.02.002
149—.84*.84 plus.42—.84.25—.42.02—.149.02.002
Soi I 1
PH valuesPaste
8.808.958.758.658.058.15
1:10
9.009.159.459.408.908.95
Soil 6
8.007.708.107.858.107.557.40
8.657.708.208.258.208.558.35
Soil 2
PH valuesPaste
8.258.608.758.758.207.95
1:10
8.909.209.309.158.858.80
Soil 7
9.259.709.609.059.108.80
9.709.909.959.609.95
10.10
Soil 3
PH valuesPaste
8.108.658.708.608.207.95
Soil
5.254.955.355.755.355.25
1:10
8.659.109.209.158.858.85
R.I.
5.905.505.856.205.605.45
Soil 4
P H values
Paste
8.558.158.558.508.758.308.05
Soil
6.256.256.357.156.906.50
1:10
9208.859.259.159.259.058.85
N.J.
6.956.757.207.457,307.15
SoilL 5
PTL values
Paste
7.75
8.458.107.10
Soil
10.0010.0510.309.259.059.20
1:10
8.80
9.058.908.20
K
9.359,90
10.159.259.55
10.15
•Ground in a ball mill to pass a 100-mesh sieve to determine effect of grinding onpH and replacement capacity.
TABLE 11.—PH OF SOILNa, AND REPLACEMENT
Particlesize
<m.m.)
.149-.84*.84 plus j.42-.84 \.2S-.42 I.149-.02.02.002
.149-.84*
.84 plus
.42-.84
.2S-.42
.149-.02
.02.002
PARTICLE SEPARATES AFTER SATURATION WITHCAPACITY OF
Soil 2
Paste9.50
9.70
10.059.208.80
PH values
1:10
10.35
10.25
10.2010.2510,10
rep.cap.8.0
6.3
4.615.444.0
Soil 6
9.008.908.609.209.658.908.30
9,459.158.959.709.909.809.70
4.00.3 10.8 \1.9 J1.9
13.927.9
SEPARATES IN m.e. PER 100
Soil 3
PH values
Paste9.60
9.60
9.909.208.75
1:10
10.20
10.10
10.2510.2510.10
rep.cap.
3.20
2.20
3.407.50
45.00
GRAMS
Soil 4
PH values
Paste9.50
9.60
9.909.109.00
1:10
10.20
10.15
10.1010.1010.10
rep.cap.
3.7
3.6
3.711.139.0
Soil K
10.10
9.90
9.909.809.50
10.10
9.90
10.3010.3010.40
1.7
1.4
1.34.5
21.0
•Ground in a ball mill to pass a 100-mesh sieve to determine effect of grinding onpH and replacement capacity,
for the particles of sand or those of greater diameter. For soils 3and 4, it is somewhat higher and is highest for soil number 2. Thereplacement capacities for the different separates are showngraphically in Figure 16.
On close examination of the data in Tables 10 and 11 and Figures14 and 15, it will be noted that the relative pH values of the dif-ferent separates are similar—that is, the curves representing thepH values at the moisture equivalent follow the same generaltrend. Starting with low pH values at 40-mesh or coarser, the pHincreases to a maximum value, usually the sand (0.02 to .129 m.m.),and then decreases again to a low pH value for the clay fraction.The low pH of the coarse particles is simply a low hydrolyticalkalinity, low exchange capacity, while the low pH for the otherparticle extreme, the clay fraction, is due to repressed hydrolysis

402 TECHNICAL BULLETIN NO. 104
8 -
9 -
8f-
8 -
.42~.84 .25-29 .149-177 .02-.I49 .002-.02 .002-Sand Silt Clay
Figure 14.—PH of soil separates; solid lines represent pH of soil paste andbroken lines pH of 1*10 soil: water ratio.
at the low moisture content represented by the soil paste. Thedata indicate that under field conditions higher pH values shouldexist in sandy soils, or be more easily attained in nature under

SOIL PH VALUES 403
.42-84 .25-.29 J47-.I77 .02-.I49 .O0&-O2 .002-Figure 15.—PH of soil separates; solid lines represent pH of soil paste andbroken lines pH of 1:10 soil; water ratio.
semiarid and salinity conditions, than in clay soils under similarconditions. But since the total hydrolytic alkalinity is much lowerin sandy soils and the absorption capacity less, they should beless toxic toward crop growth and more easily reclaimed whenblack alkali is present. On examining the data for the pH values

TECHNICAL BULLETIN NO. 104
#/49~.84 .02-.I49 .002-.02Particle Size
.002- 3 2Soil No.
Figure 16.—Replacement capacity of soil separates and effect of grinding onthe replacement capacity of coarse soil particles.
of the separates as determined at a 1:10 soil: water ratio, the dif-ference in hydrolytic alkalinity is clearly shown. The pH valuesfor the particle sizes of sand to 80-mesh, as determined at bothmoisture contents, approach one another more closely because of

SOIL PH VALUES 405
the low hydrolytic alkalinity of these particle sizes. In the clayfraction where the hydrolytic alkalinity is highest, the two curvesare farthest apart because of the greater hydrolysis on dilution.
ISOHYDRIC PH VALUES
When two solutions or a solution and a miscible material havethe same hydrion concentration they are said to be isohydric. Inalkali soils the OH ions are largely confined to the moisture filmimmediately in contact with the surface of the soil particles andin soil suspensions may be concentrated at the surface with moreor less freedom of circulation. Obviously, then, the pH of the soilwill, vary with the variation in conditions under which the actualmeasurements are made, largely the soil: water ratio. To meetthis situation we have suggested that the determination be madeon a soil paste, approximately the moisture equivalent. Thismoisture content was chosen because it represents very closelythe moisture consent of the soil under field conditions soon afterthe soil has been irrigated and also because we found that pHvalues exhibited little or no change between the moisture equiv-alent and the water-holding capacity.
It has been suggested that buffer solutions should be useful forthe determination of the pH value of a soil and that such valuesshould approach the true pH value of the soil more closely thanany other. On the basis that the ideal method for determining pHof the soil is one in which as little hydrolysis as possible is allowedto take place, Puri and Sarup (27) have suggested the isohydricpH. This isohydric pH is similar to the pH value suggested byMattson (20) to express the exchange neutrality of the soil. Inbrief, the isohydric pH value of the soil is represented by the pHvalue of a buffer solution which is not changed when thoroughlyshaken with a sample of soil. It may be determined by shakingweighed samples of soil with a series of buffer solutions of dif-ferent pH values and ascertaining which buffer remains un-changed in pH during this process, Puri and Sarup (27) go so faras to refer to this isohydric pH value as an absolute pH valuewhich does not fluctuate with alterations in experimentalconditions.
During this investigation the question arose as to the relationbetween the pH of the soil paste and the isohydric pH, becauseboth methods are specifically designed to reduce to a minimum theinfluence of ionization and hydrolysis on pH. The next experimentwas designed to compare the isohydric pH of the soil and the pHof the soil paste which approximates the moisture equivalent. Thebuffer solution used in this experiment was the one suggested byPuri and Sarup (27) ; namely, 25 ml. of 0.2 normal KC1 solution,25 ml. of 0.2 normal boric acid, plus varying amounts of 0.2 normalKOH solution to be added before diluting the whole to 100 ml. to

406 TECHNICAL BULLETIN NO. 104
TABLE 12.—VALUES OBTAINED IN TITRATION FOR ISOHYDRIC PH VALUES
P Hbuffer
P Hbuffer & soil
Soil no. 8 (7.55)*
6,557 527.908.208.288.358.55
7.507.557.607.757.807.908.05
Soil no. 7 (9.55)
8.308.558.758.858.929.009.109.459.82
8.508.758.909.009.059.109.159.459.75
Soil no. 2 (7.85)
7.587.717.837.928.00
7.757.788.787.827.85
Soil no. 3 (7.75)
7.357.467.657.807.907.98
7.557.607.607.657.687.70
Soil no. 1 (8.20)
7.908.078.158.608.718.858.95
7.958.108.128.508.608.708.80
Soil no. C (9.25)
8.658.909.059.229.429.65
8.829.009.109.289.409.60
Soil no . 25 (8.50)
7.908.158.60
8.158.258.55
P Hbuffer
PHbuffer & soil
Soil no. 4 (7.60)
6.707,187.457.627.807.968.108.20
7.487.597.607.657.707.757.847.92
Soil no. 6 (7.20)
6.707.207.507.707.80
7.107,207.327.407.46
Soil no. 5 (7.60)
6.707.207.427.627 807.978.10
Soil nc
8.158.438.608.718.859.06
Soil nc8.568.989.169.309.509.80
Soil no.
7.507.828.008.108.22
7.527.527.567.597.657.687.70
. 14 (8.95)
8.508.658.728.808.858.92
). B (9.30)
8.658.929.109.209.359.55
1A (7.90)
7.857.857.907.927.95
Soil no. 92 (8.40)
7.908.158.608.85
7.958.108.458.67
P Hbuffer
P Hbuffer & soil
Soil no. 3A (7.90)
7.587.808.108.208.40
Soil no
7.407.607.727.807.988.12
Soil nc
8.038.128.308.458.558.66
Soil no
7.357.657.878.028.128.358.428.60Soil no.
8.128.308.45
Soil no.
7.908.148.158.43
Soil no.
9.409.90
10.2011.0011.50
7.787.787.857.907.98
. 6A (7.75)
7.687.707.727.727.767.80
. 9A (8.30)
8.178.208.308.388.428.52
11A (8.15)
7.908.008.028.058.108.158.228.35
12A (8.15)
8.108.188.27
13A (8.40)
8.208.258.258.35
K (10.15)
9.5810.0210.1510.7011.20
Soil no. 15A (8.15)
8.128.308.458.55
8.138.208.308.35
•Values in parentheses represent pH of soil paste.

SOIL PH VALUES 407
form the completed buffer solution. The method recommendedby Puri and Sarup (27) was also followed for the determinationof the isohydric pH value; namely, 20 grams of soil shaken fortwo hours with 100 ml. of buffer solution, filtered, and the pH ofthe filtrate determined and compared with the pH value of thesame series of buffer solutions before they were shaken with thesoil. These data are given in Table 12 and Figures 17, 18, and 19for twenty-two soils, together with the pH of the same soils asdetermined on the soil paste.
The data presented in Figures 17, 18, and 19 are in the form oftitration curves in which the pH values of the buffer series areplotted against the pH values of the same series of buffer solutionsafter having been shaken with the soil. One curve is obtained byusing the X axis for the pH of the buffer solutions and the Y axisfor the pH of the buffer solutions plus soil. The other curve isobtained by reversing this and using the X axis for the buffersolutions plus soil and the Y axis for the buffer solutions alone.The point at which the two curves meet and cross is taken as theisohydric pH, as it shows this point more accurately than the pHvalues of each member of the series because in some cases theactual isohydric point falls between two buffer solutions of theseries.
There is very close agreement between the pH as determined onthe soil paste and the isohydric pH in all but a few samples. Soilnumber 1, the Superstition sand, is closely isohydric with all thebuffer solutions in the series, because with its low silt and claycontent its buffer capacity is very low. This soil is essentially ablow sand and is located in the Yuma Mesa area.
There are twenty-two soils in the group examined. All thesoils which did not contain Na OOs show a close agreement be-tween the pH of the soil-paste method and the isohydric pH. Outof a total of twenty-two soils twelve of them were black alkaliand showed appreciable amounts of Na2COa in the analysis ofthe water extracts. Out of these twelve black alkali soils thereare four, designated as 92, C, B, and K, for which the pH of thepaste and -the isohydric point do not agree closely; but this issimply because they are already in more or less equilibrium withan NaiiCOa-NaHCOs buffer. The nature of the curves obtainedfor the black alkali soils are characteristically different from thetitration curves representing the saline soils, in which Na2CO3 isabsent. For the latter soils the curves tend to meet at an angleapproaching a right angle and the isohydric point is sharply de-fined, while for the black alkali soils the curves tend to paralleleach other and, as already mentioned, in four of the black alkalisoils the point at which the two curves cross is not in very closeagreement with the pH of the soil paste. However, the curvesparallel each other so closely, both below and above the isohydricpoint, that the two curves are not widely separated at the pHvalue represented by the soil paste. That is, even though the iso-

408 TECHNICAL BULLETIN NO. 104
9 -
8 -
8 -
8 -
7 -
6 -
8 -
-
ME. 8.95
ME7.90
ME7.60
-
-
ME7.85
-
—i r 1
14IH
8.85 f
V/3A
IH7.80 /
5IH
7.60
f2 IH
7.80
i i i
1
ME8.30
ME7.75
ME7.55
ME7.90
— , ,
9A IH8.30
Js6A *
IH7.70
f
0
8IH
7.55 /
Is\
1A
_
IH7 9 0
PH
- 10
- 9
- 8
- 8
- 7 5
- 8
- 7
- 6
- 8
PH
Figure 17.—Isohydric point obtained by plotting titration data. Point atwhich lines cross is isohydric point. ME designates pH of soil paste andIH the isohydric pH.
hydric pH does not agree with the pH of the soil paste in someblack alkali soils, the isohydric curves are very close to each otherat the pH of the soil paste.
It is believed that the pH of the soil paste yields a value whichis the same pH as the isohydric value, and that in black alkali

SOIL PH VALUES 409
X7a
3ME IH
775 7.60
6ME IH720 7.20
I2AME IH
8.15 8.10
I3AME IH8.40 830
I5AME IH
8.15 8J0
HAME IH8.15 8.10
PH PH
Figure 18.—Isohydric point obtained by plotting titration data. Point atwhich lines cross is isohydric point. ME designates pH of soil paste andIH the isohydric pH.
soils where there is antagonism between the Nbuffer in the soil and the boric acid-KCl-KOH the pH value of thesoil paste is the more acceptable value. This experiment addsconsiderable support to the selection of the soil paste as being themost desirable moisture content for the determination of soil pEL

410 TECHNICAL BULLETIN NO. 104
10
ME IH8.20 8.15
7ME IH
955 9.45
" 92ME IH
8.40 8.05
25ME IH
8.50 8.30
ME IH9.25 9.28
ME10.15
PH10
PH10
Figure 19.—Isohydric point obtained by plotting titration data. Point atwhich lines cross is isohydric point. ME designates pH of soil paste andIH the isohydric pH*
PH OF EXCHANGE NEUTRALITY
In one of a series of papers, "The Laws of Soil Colloidal Be-havior," published in Soil Science, Mattson and his coworkershave emphasized two pH values; namely, the pH of exchangeneutrality and the equi-ionic pH value (20). The latter represents

SOIL PH VALUES 411
the pH at which the capacities of the soil to combine with theanions and cations of the solution are equal. The former is thepoint at which the addition of a neutral salt to a soil suspensiondoes not affect the pH of the latter. In many soils these points donot vary greatly among one another.
In order to compare the pH of the soil as made on the soil paste,at approximately the moisture equivalent with the pH of exchangeneutrality, an experiment was conducted with three noncalcar-eous soils. Noncalcareous soils were selected in order to avoid theinfluence of CaCO3 on soil titration and the "breakdown" in ex-change complex that might accompany the removal of CaCO3from the soil with dilute acid.
The experimental procedure was essentially that used by Matt-son in which a suspension of 10 grams of soil in 20 ml. of distilledwater and another of 10 grams of soil in 20 ml. of normal Na2SO4solution were titrated with .02 normal solutions of H2SO4 andNaOH. The points at which the two curves for each soil crosswhen the titrations are plotted on cross-section paper were takenas the pH of exchange neutrality. The data and curves are givenin Figure 20.
In all three soils these points agree closely with the pH of thesoil paste, and they therefore add further support to the selectionof the soil-paste method as being best suited for the determinationof the pH value of soils.
CALCULATION OF PH VALUES
Puri and Sarup (27), in their study of isohydric pH values insoils, did not recommend the method for the determination of pHin highly alkaline soils because such soils invariably containmore or less Na CO* and NaHCOs. Since such soils are already inequilibrium with a Na_>CO rNaHCO'* buffer, they have proposed aformula for calculating the pH value of highly alkaline soils. Inorder to obtain the values for the formula, they recommend thedetermination of the pH value, COa, and HCOa in a 0.1 normalKC1 extract of the soil, one part soil in five parts KC1 solution.The values thus obtained are substituted in the followingequation:
PH value = 8.67 + 0.018A - .0032Bin which B represents ml. of 0.1 normal alkali (CO3 + HCO3) in100 ml., and A equals per cent Na2COs in B. Having first deter-mined the pH values of various mixtures of Na2COs in distilledwater and in 0.1 normal KC1 and having found the difference tobe 0.2 pH, they add this value to the calculated pH. On applyingthis formula to a number of black alkali soils, they found a closeagreement between the calculated pH and the pH determinedwith the antimony electrode.
In view of the fact that several of the highly alkaline soils ex-amined in our experiments gave pH values at the isohydric point


SOIL PH VALUES 413
TABLE 13.—COMPARISON OF PH VALUES, OBTAINED ON THE SOILPASTE AND AT 1-10, WITH CALCULATED PH VALUES
Soil no.
ABCDEFGHIJ
PH paste
9.608.958.558.358.358.409.658.858.558.50
PH 1:10
10 409 859.659 409.409 65
10 3510.0010.009.60
PH cal.
9.739.689.549.229.409.099.979.358.989.32
VARIATION IN ABSOLUTE WEIGHT OF SOIL
In addition to the established fact that pH values for soils varywith the soil: water ratio at which the determination is made,Buehrer and Williams (4) have shown that the pH value of a soilwill increase with an increase in the absolute weight of soil andvolume of water, even though the ratio of soil to water is main-tained at a constant. For example, they showed that the pH valueof a soil suspension of one part soil in ten parts of water increasedfrom 8.2 for 3 grams of soil in 30 ml. of water to 9.11 for 20 gramsof soil in 200 ml. of water. Huberty and Haas (14) studied theinfluence of absolute weight of soil at constant soil: water ratio,using 4 to 50 grams of soil. They used soils with pH values of 6.42,6.81, 7.28, and 10,28 and both 1:5 and 1:10 soil: water ratios andobtained the same pH values with all absolute weights of soil.In view of the fact that Buehrer and Williams used only one soil,it seemed advisable to examine a little further the subject ofabsolute weight of soil and its influence on the pH by using alarger number of soils. The data thus obtained are given inFigure 21.
The pH values of eight different soils were determined at 1:10soil: water ratio, using 1, 2, 4, 6, 8,10,15, 207 25, 30, 40, and 50 gramsof soil with 10, 20, 40, 60, 80,100,150, 200, 250, 300, 400, and 500 ml.of boiled distilled water. The data confirm our previous observa-tions (Buehrer and Williams), that when pH determinations aremade on a soil suspension of 1:10, the absolute weight of soil usedis an important consideration. When 10 grams of soil or less areused, the pH values obtained are not reliable. Consistently re-producible results are obtained only when the absolute weight ofsoil is 20 to 40 grams.
This variation in pH with variation in absolute weight of soilis shown to exist for the black alkali soils, for both the calcareousand noncalcareous soils, and for the soils with both high and lowsalinity, and is not related to the CaCOs in the soil. The soil which

414 TECHNICAL BULLETIN NO. 104
Absolute weight soil — I 10 ratioi i i 1
Figure 21.—Relation between absolute weight of soil and pH at constantsoil: water ratio.
shows the greatest variation with change in absolute weight of soilfrom 1 to 20 grams is the Superstition sand. This suggests that aminimum weight of 20 grams of soil is required for uniform sat-uration of the soil suspension with the hydrolytic products of thepotentially alkaline compounds in the soil.
PH STUDIES AT LOW MOISTURE CONTENT
In our original research on the pH determination in soils at lowmoisture contents in this laboratory, it was shown that apparentpH readings could be made with the glass electrode at moisturecontents well below the moisture equivalent. It should be men-tioned in this connection that most of the semiarid soils of Arizonacontain very little organic matter and are therefore very low inactual moisture content under atmospheric conditions. A closeagreement in pH values for soils can be obtained for moisturecontents within the range extending from the moisture equivalentto the water-holding capacity. Above the water-holding capacitythere is a considerable increase in pH with dilution up to a soil:water ratio of 1; 10 at which point it becomes practically constant.At moisture contents below the moisture equivalent the glasselectrode gives values which decrease at a rather rapid rate withdecrease in moisture content, but it is sometimes difficult to ob-

SOIL PH VALUES 415
tain consistent and reproducible readings. This may be due topoor electrode contacts, to insufficient continuity of the moisturefilms on the soil particles, or, as Davis (9) has pointed out, to theeffect of increased resistance on the product of the grid currentand resistance. For this reason Davis has referred to these low pHvalues as apparent pH values.
We have continued to make all routine pH determinations onthe soil paste or approximately the moisture equivalent in thislaboratory. However, there is still some interest in pH values ofthe soil below the moisture equivalent, both in field soils in situand in the analysis of laboratory samples. This is in large partdue to the low pH values reported for field tests by Haas andHuberty (14). These authors report extensive studies on orchardsoils in the field, in which appreciably acid pH values were foundunder field conditions for soils which by the regular procedureyielded pH values on the alkaline side of neutrality, and thesevalues appeared to be related to tree performance in the orchards.Davis (9) obtained equilibrium values with the glass electrode atthese low moisture contents, but there was a slow yet appreciabledrift before equilibrium was reached. This is more or less inagreement with our own experiences, except that we have foundthat these apparent pH values are more consistent and reproduc-ible if the low soil moisture samples are enclosed for twenty-fourhours in a glass weighing bottle with a ground glass cover in orderto establish complete moisture equilibrium in the soil beforeinserting the electrodes. Since Davis has shown that commercialvacuum tubes may give erroneous results under these conditions,there is as yet no acceptable evidence that air-dry soils are char-acteristically more acid or alkaline than moist soils. Heintze (13)obtained pH values of 5.6 to 6.2 for dry soils, and he concluded thatthese values represent "the pH value of a thin moist film inequilibrium with the carbon dioxide content of the air and withthe glass but not in equilibrium with the soil moisture."
In our original work the moisture equivalent was selected asa desirable moisture content for the pH determination of soils,because it is a frequently used value for characterizing the mois-ture relations in soils. It represents closely the moisture presentin the small pores and that imbibed by the soil colloids. All soilsare equally wet at the moisture equivalent. It is slightly below thefield moisture capacity, well above the wilting point, and is aboutthe optimum moisture content for seed germination.
In the work on pH determination at low moisture contents,especially below the moisture equivalent, no recognition seems tohave been given to the fact that the soil is worked into a paste(before inserting the electrodes) when the determination ismade at the moisture equivalent. In so doing, a large part of thewater becomes bound and therefore the amount of free waterpresent is reduced well below that represented by the moistureequivalent. Bouyoucos has defined bound water as that portion

416 TECHNICAL BULLETIN NO. 104
(1) of the total water which fails to freeze when the soil is placedin a freezing chamber and reduced to —1 degree C. Ewing andSpur way (11) found a reduction in the dielectric constant ofwater from 81 to 22 in the binding of water by silica gel. Therewas likewise a reduction in solvent power for salts, and the waterbecame less polar and less active. It has been shown that Ari-zona soils are most severely puddled when worked at the moistureequivalent and that this moisture content is a critical point forphysical changes in the soil (24). Buehrer and Rose (6) haveshown that maximum binding of water takes place when soilsare puddled at the moisture equivalent. An examination of sevensoils showed that 37 to 98 per cent of the moisture was bound whenthey were puddled at the moisture equivalent. There is evidence,then, that when a pH determination is made on a prepared soilpaste the free or active water is far less than the content actuallyrepresented by the moisture equivalent percentage.
An experiment was conducted to determine, by puddling, theeffect of reduction in free water on the pH of the soil. Fifty gramsof soil, in two series, were weighed into 100-ml. beakers and suf-ficient distilled water added to bring the moisture content to themoisture equivalent. One series was thoroughly puddled into apaste, allowed to stand in a saturated atmosphere for twenty-fourhours, and the pH determined on this paste (Table 14, col. 1). Theother series was left unpuddled but also left in the water-saturatedatmosphere for twenty-four hours in order for the soil and mois-ture to come to equilibrium before inserting the electrodes for thepH determination (Table 14, col. 2) after which this portion wasworked into a paste and the pH again determined (Table 14,col. 3).
TABLE 14.—COMPARISON OF PH VALUES AT THE MOISTUREEQUIVALENT FOR PUDDLED AND UNPUDDLED SOILS
Soilno.
C234578
PH
Puddled
8.857.907.757.507.709.057.85
Not puddled
8.807.757.707.657.559.057.70
Puddled
8.807.857.807.607.609.057.80
Per cent clayin soils
291629292542
P.p.m. totalsalts in soils
1,1051,555
10,2002,8008,0201,230
Practically all soils, especially when they contain appreciableamounts of clay, have a certain percentage of moisture bound,and this is merely increased by puddling. The data in Table 14indicate that there are only small differences in pH values ofpuddled and unpuddled soils at the moisture equivalent. For fivesoils the pH is slightly higher for the puddled soils, in one it isslightly lower, and in another there is no difference in pH. Allthese pH determinations may be considered within the range of

SOIL I>H VALUES 417
experimental error, especially in view of the fact that there wassome drift in the readings made on the unpuddled soil. This ex-periment shows that if reduction in free water by puddling is inany way related to reduction of moisture by evaporation, thereshould be little or no change in the pH of the soil on reducing themoisture content below the moisture equivalent.
The subject of pH determinations on soils at moisture contentsbelow the moisture equivalent has been approached from anotherangle. That is, pH studies have been conducted on soil suspensionsor mixtures of soil in alcohol instead of water. This experimenthad two objectives. First, to study the possibility of using alcoholas a medium for the suspension of air-dry soils, thus obtainingpH values for soils at low moisture percentages; and second, tostudy the possibility of selecting an alcohol-water mixture thatwould yield the same pH values as those obtained on the soilpaste. In making a large number of routine soil analyses it takessome time to prepare soil pastes of the proper moisture content.This is especially true of clay soils, which are usually sticky, andon the other extreme, for sandy soils where it is difficult to avoidgoing beyond the moisture equivalent and having present anexcess of water. Routine pH determinations in soils could begreatly expedited if a 1:1 mixture of soil and alcohol could beused to obtain a pH value which agreed with that of the soilpaste. This is especially true since we now know that the pH ofthe soil paste is closely the isohydric pH and since Davis (9) hasshown that pH values obtained at very low moisture contents areerroneous, or at least of questionable value.
There are several things one might expect from the use of al-cohol as a medium for the soil suspension. Mixing alcohol with thesoil should change the concentration of the water present, depend-ing upon the amount of water in the soil, but it should not changethe absolute amount present. The amount of water present can bevaried by using different ratios of water and alcohol in thesuspension. Since water has a dielectric constant of 80, methanolof 33, and ethanol of 25, the use of alcohol suspensions should re-duce the dissociation and hydrolysis of the salts and soil minerals.In a qualitative examination of five saline soils and two blackalkali soils shaken with distilled water, 95 per cent ethanol, andabsolute methanol, 1:5 ratio, conductivity readings with an L.& N. soil conductivity bridge showed the lowest conductivity formethanol, next lowest for ethanol, and highest for water.
Alcohols act as dehydrating agents and as flocculants for soilcolloids. Since they are dehydrating agents they should increasethe apparent resistance of the glass electrode, and it would notbe advisable to use strong alcohol solutions. Also the activity ofwater decreases with increase in per cent alcohol. It has beenshown by Dole (10) that the presence of alcohol introduces anerror into the pH readings of the glass electrode; but within therange of 33 to 66 per cent alcohol he found the error, at least in

418 TECHNICAL BULLETIN NO. 104
acid solutions, was very small. In another experiment in whichNaOH solution was gradually added to an alcoholic solution ofNal the error was low between pH 7.73 and 8.09. Thus there isvery little encouragement in the literature for the use of alcoholin the pH determination of soils.
For the study of the pH values of soils in alcohol suspensions,nine soils were selected. Both ethanol and methanol were used,and both were redistilled from pyrex flasks in which an excessof CaO was present. For ethanol the pH determinations weremade with 10, 25, 50, 80, and 95 per cent solutions and soil alcoholratios of 1:1, 1:5, and 1:10. For methanol the solutions were 10,25, 50, and 80 per cent solutions, and ratios of 1:1 and 1:5 wereused. The technic employed for the determinations was the sameas that used in the pH determination of water suspensions. ThepH readings were made approximately fifteen minutes after thesuspensions were prepared. This arbitrary time was selected afterdeterminations made over a period of twenty-four hours showedno change in pH. The data are given in Table 15 together withvalues obtained with boiled distilled water at 1:1, 1:5, and 1:10soil: water ratios and on the soil paste.
These data show that the pH values obtained with 50 per centethanol and 50 per cent methanol at a 1:1 ratio are very closelythe values obtained on the soil paste at a moisture content approx-imating the moisture equivalent. The values obtained withethanol are in closer agreement than those obtained with meth-anol and are sufficiently close to warrant consideration of themethod in the routine determination of soil pH values which maybe considered equivalent to the values of the soil paste. It is ofinterest that 50 per cent alcohol is within the range of concentra-tion where Dole found the least alcohol error.
With the encouragement of the above, thirty samples of soilwere selected at random from the soil samples on file in the labo-ratory and pH determinations were made on the soil paste, at 1:10soil: water ratio, and at 1:1 soil alcohol ratios for 50 per centethanol and 50 per cent methanol. These data are given in Table16, where a close agreement was obtained with both alcohols andthe soil paste with only a few exceptions. These exceptions arefewer for the ethanol than for methanol.
Briefly summarizing the pH studies at low moisture content ofsoils, there is considerable evidence that in the soil-paste methodthe active or free moisture content of the soil paste is considerablyless than the per cent moisture represented by the moisture equiv-alent percentage. There is also strong evidence that an approachto the pH of soils at low moisture content can be attained by us-ing dilute alcohol as a suspension medium. It is noted that Davis(9) employed an acetone soil paste to a limited extent.

SOIL PH VALUES 419
TABLE 15.—PH VALUES OBTAINED BY USING ALCOHOLS ASSUSPENSION MEDIA
Soil: waterratios
Soil number
2 3 5 | 4 ! 6 7 R.I. 8 C
Distilled water
Paste1:11:51:10
7.958.158.709.10
7.757.908.308.85
7.707.858.308.35
7.607.707.958.45
7.207.457.808.15
9.559.95
10.1010.40
4.454.304.454.75
8.008.559.159.40
8.959.309.95
10.30
30 per cent ethanol
1:11:51:10
8.108.658.85
7.808.208.55
7.808.208.45
7.708.008.15
7.457.807.90
9.9010.1510.15
4.204.304.55
8.609.159.30
9.309.859.95
25 per cent ethanol
1:11:51:10
8.008.508.75
7.708.108.35
7.758.108.35
7.607.908.05
7.357.657.80
9.7510.2010.10
4.204.304.50
8.359.059.20
9.109.909.90
50 per cent ethanol
1:11:51:10
7.858.358.55
7.607.858.10
7.658.008.30
7.457.707.95
7.257.557.60
9.559.959.80
4.204.404.65
7.858.808.90
8.909.459.55
1:11:51:10
80 per cent ethanol7.658.008.20
7.357.607.70
7.407.758.05
7.107.307.55
7.007.307.40
9.259.559.35
4.154.404.60
7.608.358.55
8.659.159.15
95 per cent ethanol1:11:51:10
7.407.657.60
6.907.307.30
6.957.157.30
6.806.807.15
6.656.957.05
8 408.708.50
8.008.508.45
10 per cent methanol1:11:5
8.108.60
7.858.20
7.808.20
7.758.00
7.307.45
9.8510.10
4.304.40
8.609.05
9.409.65
25 per cent methanol1:11:5
8.058.45
7.708.00
7.708.10
7.707.90
7.257.45
9.809.75
4.304.45
8.258.90
9.359.50
50 per cent methanol1:11:5
7.958.40
7.657.90
7.608.00
7.607.80
7.307.10
9.609.70
4.354.50
8.258.95
9.159.50
80 per cent methanol1:11:5
7.858,15
7.407.70
7.407,80
7.457.55
7.057.10
9.359.40
4.054.30
8.258.90
8.909.50
SUMMARY
As our knowledge of the chemical and physical properties ofsoils progressively increases, we find more and more emphasison their dynamic character—that is, on the property of the soilto respond to changes in environment. Mention is often noted inthe literature that there is no such thing as a definite or true soilsolution, that there is no such thing as a definite or true base ex-change capacity, and finally that there is no such thing as a def-inite or true pH value. There is plenty of experimental evidence

420 TECHNICAL BULLETIN NO. 104
TABLE 16.™COMPARISON OF PH VALUES USING WATER AT 1:10AND SOIL PASTE, 50 PER CENT ETHANOL,
AND 50 PER CENT METHANOL
Soilno.
50515253NK545556
126345
PVC7
57R8
SIS358
GlG4F8F92324
Water
Paste
7.657.757.657.705.809.857.807.757.858.607.957.407.707.657.607.208.959.607.904.458.007.258.107.206.905.908.108.109.158.75
1:10
7.858.808.658.456.10
10.208.858.508.858.959.108.108.858.458.358.15
10.3010.408.804.759.358.009.457.657.806.559.259.05
10.059.90
Methanol1:1
7.657.857.657.755.809.957.807.807.858,658.057.407.657.657.607.259.159.607.904.258.257.258.507.706.905.958.358.209.408.75
Ethanol1:1
7.607.807.557.655.70
10.207.807.807.758.657.957.357.607.607.657.208.909.557.804.208.157.258.457.757.005.858.357.959.258.65
on which to base such statements, for the soil is a product of en-vironment. But the same may be said of crops, for the plant, too,is a product of environment. However the soil solution, the ex-change capacity, and the pH value are all contributing factors insoil behavior and crop production. The dynamic character of thesoil merely emphasizes the necessity for continued research toclarify as many of the variables as possible. Environment isessentially the summation of these variables.
When electrometric and colorimetric methods were first de-veloped for the determination of pH values of soils, they imme-diately assumed an important place in soil research and control.The technic of the early methods was such as to require a soil sus-pension in water totally unlike the soil-moisture relations existingin the field. Definitely, the values thus obtained were not truepH values. The development of the glass electrode greatly ex-panded research in soil pH, for it is applicable under conditions oflow moisture content within the range at which roots make con-

SOIL PH VALUES 421
tact with the soil particles in the field. Based upon research con-ducted in this laboratory, it was suggested that a moisture contentapproximating the moisture equivalent be adopted for pH deter-minations in soils to replace the older methods which employedsoil: water ratios varying from 1:1 to 1:10. The selection of themoisture equivalent point was more or less arbitrary but wasbased in large part upon the fact that we found little variationin pH at moisture contents slightly below and above this point,and because the moisture equivalent represents a moisture con-tent at which all soils are equally wet. The pH value at this pointis usually considerably lower than the pH values obtained at dilu-tions previously used, but it is higher than apparent values ob-tained with the glass electrode at moisture contents well belowthe moisture equivalent and approaching air-dry ness. In a studyof these low pH or equilibrium values obtained at low moisturecontents Davis (9) has found evidence that these equilibriumvalues do not represent true pH values, and he suggests a soilpaste approximating the moisture equivalent as a satisfactorymoisture content for the pH determination. At present thereseems to be general agreement that this moisture content is mostsatisfactory for semiarid soils; but while there has been much tocommend the method, there still remains much to be learnedabout the pH values of soils and their interpretation. The datapresented in this bulletin present much evidence that the pHvalue of the soil paste is a true soil pH value.
Because of the great variation in soil pH values obtained at dif-ferent soil: water ratios and the opinion that none of them repre-sented true pH values, Puri (27) has suggested the isohydric pHvalue and Mattson (20) the pH of exchange neutrality as beingmost useful and as approaching an absolute value. The isohydricpH value is the pH of a buffer solution which is not changed byshaking it with a soil. The pH of exchange neutrality is defined asthat point at which the addition of a neutral salt to a soil suspen-sion does not affect the pH of the latter. Since both these valuesagree very closely with the pH value of the soil paste, this inves-tigation has yielded considerable support to the recommendationthat pH values of soils be determined on a soil paste.
The equi-ionic pH is defined as that pH of a salt solution whichis not affected by the addition of a completely unsaturated soil(free acid-base ampholytoid). In other words, it is the pH atwhich the capacities of the soil to combine with the cations andthe anions of the solution are equal. Mattson has shown this pointto approximate closely the pH of exchange neutrality, and ob-viously, then, it will closely approximate the pH value of the soilpaste.
Among the variables affecting pH are salinity, both concentra-tion and character, and the anions and cations as individuals, thecharacter of the base exchange complex, and the mechanicalcomposition of the soil. The influence of all these factors on the

422 TECHNICAL BULLETIN NO. 104
pH is reduced to a minimum at the moisture equivalent. In fact,all the information obtained in this investigation further com-mends the use of the soil paste for the pH determination, especiallyin view of the fact that the value is in close agreement with Matt-son's pH of exchange neutrality and Pun's isohydric pH to whichhe refers as an absolute value.
The salinity-pH relationship is greatly clarified by this investi-gation. It has been known for many years that salts have a pro-found influence on the pH value of soils. This is largely becausethe activity of water is reduced and thus becomes less active asa nydrolyzing agent, and because salts tend to flocculate and thusreduce the soil surface exposed to the hydrolyzing solution. Thecommon ion effect is also often mentioned. We have been some-what puzzled by the failure to find any correlation between pHand total salts in the soil, actually determined or calculated fromconductivity. This failure is now explained by the observationthat HCO^ and CO* ions have opposite effects on pH to the Cl andSO4 ions and may thus confuse the effect of total salinity depend-ing entirely on the composition and ratio of the different ions pres-ent in solution. The hydrolysis of the exchange complex andCaCO^ taking place both in the absence of salts and at variabledegrees m the presence of salts also contributes to the multiplicityof factors affecting pH. It is evident from the experiments pre-sented that one should not necessarily expect any relation betweentotal salinity and pH, nor between sodium and pH. The salinityeffect on pH appears to be largely due to the anions. It is true thatthere was a highly significant correlation between Ca and pH(Fig. 5), but it must be recognized that calcium is precipitated ascarbonate in the presence of Na CO * and so this significant corre-lation, decrease in Ca with increase in pH, may be a simple factthat the calcium is removed from solution in the high pH soils bythe precipitation as carbonate. Actually the data do not necessar-ily prove that pH decreases with increase in concentration ofsoluble calcium, although we know from other experiments thatit does.
The base exchange complex contributes to soil pH by hydrolysis;therefore its influence depends, in large part, upon the nature ofthe attached cations and the activity of the water in contact withthe soil. The pH of the soil increases with increase in percentageof replaceable sodium and the ratio of sodium to the total ex-change capacity of the soil. However all sodium-saturated soilswere found to have closely the same pH at 1:10 soil: water ratio,regardless of the m.e. sodium per 100 grams. At the moisturecontent represented by the moisture equivalent the soils highestin replaceable sodium, m.e. per 100 grams, had the lowest pH,while the soils lowest in replaceable sodium, the sandy soils, hadthe highest pH. When the adsorbing fraction of the soil is satu-rated with sodium it apparently acts similarly to CaCCH in that,regardless of the total amount present, they both hydrolyze to a

SOIL PH VALUES 423
constant and maximum pH value when conditions are such as topermit complete hydrolysis.
In the study of the soil particle separates from ten soils, theseparates from clay to 0.84 m.m. exhibited pH values somewhatrelated to the pH of the soil mass as a whole. The hydrolyticalkalinity increases with decrease in particle size. However, theOH-ion concentration is greatest for the sand particles showing awide difference between the intensity and quantity factors inalkali soils.
The value of pH determinations in dry soils—that is, well belowthe moisture equivalent—is still an open question. It is generallyagreed that equilibrium values can be obtained with the glasselectrode at these low moisture contents. Even though they maynot be true pH values, Haas and Huberty (14) have found thatthese low values are related to certain tree conditions in orchards.Plant experiments conducted in this laboratory have shown thatroots can absorb ions from dry soils (3) but that they do so bymoisture movement from the deep roots to the roots in the layerof dry soil where the moisture is exuded to form a root-soil contactfilm in the dry soil layer. This moist film is probably close to themoisture equivalent and therefore it seems that the pH at thismoisture content should be low enough and have the widest ap-plication in soil research and plant nutrition, and there shouldbe no place for pH values of dry soils where one is concernedprimarily with nutrition. The use of alcohol-water solutions offersan approach to the problem of low pH values. Alcohol is a dehy-drating agent and a flocculant, but it may introduce certain char-acteristic errors into the pH determination when the glass elec-trode is used. In spite of this property of alcohol the pH valuesobtained with 50 per cent alcohol, at a 1:1 ratio, agree very closelywith the pH of the soil paste.
Above all, in a consideration of the pH values of soil at lowmoisture content, one should not ignore the fact that in preparinga soil paste for the pH determination, most of the water becomesbound and therefore the free water present amounts to only asmall percentage of that present before the soil was worked intoa paste. Yet there is very little or no difference between the pHof puddled and unpuddled soils at the moisture content repre-sented by the moisture equivalent.
CONCLUSIONS
1. Calcareous semiarid soils have higher pH values than non-calcareous soils, but there is no relation between the percentageof CaCO<* and pH in the calcareous soils.
2. Soil pH values are repressed by increasing salinity, but thereis no correlation between total salinity and pH values when theanalyses of a large number of soils are compared.

424 TECHNICAL BULLETIN NO. 104
3. Of the anions, pH increases with increase in concentrationof CO^ and HCO3 and decreases with increase in Cl and SO4. Forthe cations the pH decreases with increase in concentration of Ca,but there is no correlation between pH and the concentration ofNa when the salts are predominantly sodium salts and CO.*, HCOa,Cl, and SO4 are all present.
4. The total salinity-pH relationship can best be demonstratedby centrifugal separation of the soil and water extracts. The pHt>f the soil-water mixture, the water separate, and the soil pasteincrease in pH with successive extractions except in the blackalkali soils where the pH of the soil paste decreases.
5. By employing the Hehner method for determining the blackalkali content of soils, a correlation between the magnitude of theHehner value and the pH was shown.
6. The pH value of the soil increases with an increase in thepercentage of replaceable sodium in the exchange complex and theratio of sodium to the total exchange capacity of the soil.
7. The pH value of the soil increases with dilution, both in thepresence and the absence of neutral salts.
8. All sodium-saturated soils, in the absence of neutral salts,have pH values approximating pH 10.0 to 10.2 when the pH valueis determined at a 1:10 soil: water ratio. At the moisture equiv-alent the pH decreases with increase in replaceable sodium.
9. The adsorbing capacity of the soil is increased by leachingthe soil with salt solutions of high pH values but not by salt solu-tions of pH 8.5 or lower. This increased cation adsorption in-creases the potential alkalinity of the soil but does not increasethe pH of the soil.
10. Sesquihydrates exhibit base exchange properties and highpH values which are affected by salinity and dilution.
11. All the soil separates possess an adsorption capacity forcations and exhibit high pH values in semiarid soils. The sandparticles usually have a higher pH than the silt and clay.
12. The pH value of a soil when determined on the soil pasteagrees closely with the isohydric pH and the pH of exchangeneutrality.
13. For the determination of soil pH at low moisture contents,the use of dilute and strong alcohol solutions has been studied.The pH values obtained with 50 per cent ethanol or 50 per centmethanol at 1:1 soil: alcohol ratio agree very closely with the pHvalues obtained on the soil paste.
14. Variation in absolute weight of soil with constant soil: waterratios materially affects the pH value of a soil suspension in water.For pH determinations where dilute suspensions are used, anabsolute weight of 20 grams of soil should be used for a 1:10soil: water ratio.

SOIL PH VALUES 425
LITERATURE CITED
1. Bouyoucos, G. J.1917.—Classification and measurement of the different forms of water
in the soil by means of the dilatometer method. Mich. Agr.Exp. Sta. Tech. Bull. 36.
2. Bradfield, R.1924.—The importance of hydrogen ion concentration control in
physico-chemical studies of heavy soils. Soil Sci. 17:411.
3. Breazeale, J. F. and Crider, F. J.1934.—Plant association and survival and the build-up of moisture
in semiarid soils. Ariz. Agr. Exp. Sta. Tech. Bull. 53.
4. Buehrer, T. F. and Williams, J. A.1936.—The hydrolysis of calcium carbonate and its relation to the
alkalinity of calcareous soils. Ariz. Agr. Exp. Sta. Tech. Bull.64.
5. Buehrer, T. F. and Williams, J. A.1937.—Hydrolysis of certain soil minerals. Soil Sci. Soc. Amer. Proc.
1:165.
6. Buehrer, T. F. and Rose, M. S.1943.—Studies in soil structure. V. Bound water in normal and
puddled soils. Ariz. Agr. Exp. Sta. Tech. Bull. 100.
7. Burgess, P. S.1929.—The so-called build-up and breakdown of soil zeolites as in-
fluenced by reaction. Ariz. Agr. Exp. Sta. Tech. Bull. 28.
8. Burgess, P. S. and McGeorge, W. T.1927.—Zeolite formation and base exchange reactions in soils. Ariz.
Agr. Exp. Sta. Tech. Bull. 15.
9. Davis, L. E,1943.—Measurements of pH with the glass electrode as affected by
soil moisture. Soil ScL 56:405.
10. Dole, M.1932.—Theory of the glass electrode: the glass as a water electrode.
Jour. Amer. Chem. Soc. 54:3095.
11. Ewing, D. T. and Spurway, C. H.1930.—The density of water absorbed on silica gel. Jour. Amer.
Chem. Soc. 52:4635.
12. Haas, A. R. C.1941.—The pH of soils at low moisture content. Soil Sci. 51:17.
13. Heintze, S. G.1934.—The use of the glass electrode in soil reaction and oxidation-
reduction potential measurements. Jour. Agri. ScL 24:28.
14. Huberty, M, R. and Haas, A. R. C.1940.—The pH of soil as affected by soil moisture. Soil Sci. 49:455.
15. Jarusov, S. S.I937.—On the mobility of exchangeable cations in the soil. Soil Sci.
43:285.
16. Kelley, W. P. and Brown, S. M.1924.—Replaceable bases in soils. Univ. Calif. Tech. Paper 15.

426 TECHNICAL BULLETIN NO. 104
17. Kelley, W. P. and Cummins, A. B.1921.—Chemical effect of salts on soils. Soil Sci. 11:139.
18. Mattson, S1930. The laws of soil colloidal behavior. Ill: Iso-electric precip-
itates. Soil Sci. 30: 459.
19. Mattson, S.1931.—The laws of soil colloidal behavior. "VI: Amphotenc behavior.
Soil Sci. 32:343.20. Mattson, S. and Wiklander, L.
1940.—The laws of soil colloidal behavior. XXIA: The amphotericpoints, the pH, and the Donnan equilibrium. Soil Sci. 49:109.
21. McGeorge, W. T.1935,—The measurement and significance of hydroxyl ion concen-
tration in alkaline-calcareous soils. Ariz. Agr. Exp. Sta. Tech.Bull. 57.
22. McGeorge, W. T.1937.—The determination of soil reaction under field conditions by
means of the spear type glass electrode. Jour. Amer. Soc.Agron. 29:841.
23. McGeorge, W. T.1938.—Factors contributing to the reaction of soils and their pH
measurement. Ariz. Agr. Exp. Sta. Tech. Bull. 78.
24. McGeorge, W. T.1937.—Studies on soil structure, II: Some characteristics of puddled
soils. Ariz. Agr. Exp. Sta. Tech. Bull. 67.
25. Puri, A. N.1930.—Interaction between ammonia and soils as a new method of
characterizing soil colloids. Soil Sci. 31:93.
26. Puri, A. N. and Asghar, A. G.1937.—Influence of salts and soil: water ratio on pH value of soils.
Soil Sci. 46:249.
27. Puri, A. N. and Sarup, A.1938.—Iso-hydric pH of soils and its determination. Soil Sci. 46:49.
28. Skinner, W. W.1906.—A method for the determination of black alkali in irrigating
waters and soil extracts. Jour. Amer. Chem. Soc. 28:77.
29. Snedecor, G. W.1937.—Statistical methods. Collegiate Press, Inc.
30. Tiulin, A. T. and Bystrova, E. M.1930.—On the causes and mechanism of increased cation exchange
in various soils after Ca(OH)2 treatment. Proc. Sec. Int. Cong.Soil Sci. Comm. 11:85.
30. Williams, J. A.1936.—Hydrolytic equilibria which influence the hydrogen ion con-
centration in alkaline-calcareous soils. Thesis, Dept. Agr.Chem. and Soils, Univ. Ariz.