Embed Size (px)
Citation preview

Eastern Illinois University Eastern Illinois University
The Keep The Keep
Masters Theses Student Theses & Publications
Summer 2020
The Determinants of Sectoral Employment in Nepal The Determinants of Sectoral Employment in Nepal
Thaman P. Bastola Eastern Illinois University
Follow this and additional works at: https://thekeep.eiu.edu/theses
Part of the Labor Economics Commons, and the Regional Economics Commons
Recommended Citation Recommended Citation Bastola, Thaman P., "The Determinants of Sectoral Employment in Nepal" (2020). Masters Theses. 4837. https://thekeep.eiu.edu/theses/4837
This Dissertation/Thesis is brought to you for free and open access by the Student Theses & Publications at The Keep. It has been accepted for inclusion in Masters Theses by an authorized administrator of The Keep. For more information, please contact [email protected].

1
The Determinants of Sectoral Employment in Nepal
Thaman P. Bastola
Department of Economics
Eastern Illinois University
Charleston, Illinois, USA
August 2020
Thesis Committee
Dr. Linda S. Ghent (Chair)
Dr. Ali R. Moshtagh
Dr.JimR.Bruehler

2
This thesis is submitted for the partial fulfillment for Master’s Degree award
in Economics at Eastern Illinois University.
Copyright©ThamanBastola
Dedication
This research is dedicated to the Nepali people those,
who are unemployed and under-employed.

3
Acknowledgment
I want to acknowledge deeply Dr. Linda S. Ghent for overseeing this
research. Your input into this paper confirmed its successful accomplishment. I also
thank to Dr. Ali R. Moshtagh, and Dr. Jim R. Bruehler for having my thesis
committee and for the fruitful suggestions. I also wish to appreciate all faculty
members of the Department of Economics in Eastern Illinois University for their
support and guidance that has showed me a right path to be a better person in the
intellectual world. And, I am grateful to all my friends, classmates for backing and
inspiration in this academic journey and otherwise.

4
Table of Contents
Abstract 8
Chapter one: Background 9-16
Introduction 9
Economy and Employment 10
Development Status 12
Statement of problem 14
Research objectives 16
Chapter Two: Literature Review 17-25
Theoretical Literature 17
Empirical Literature 20
Chapter Three: Employment Status of Nepal 25-42
Unemployment 28
Sectoral Differences 30
I) The Agriculture sector 31
II) The Industrial Sector 33
III) The Service Sector 36
IV) The Foreign Employment 38
Chapter Four: Data and Method 42-46
Models 42
I) Dependent Variables 43
II) Independent Variables 43
Source of Data 44

5
Descriptive Statistics 44
Chapter Five: Results and Discussion 47-51
Unit Root Test 47
Regression Results 48
Multi-collinearity Test 50
Heteroskedasticity Test 51
Autocorrelation Test 51
Regression Results with Newey-West Satndard Errors 53
Chapter Six: Conclusion 54-57
Summary and findings 55
Recommendations 56
Limitations of the Study 57
References 58-60
Figures
Figure 1: Sectoral share on value added GDP (1991 to 2019) 11
Figure 2: Determinants of level of employment 19
Figure 3: Self-employed, % of total employment (1991 to 2019) 27
Figure 4: Labor force unemployment % based on education 2017 29
Figure 5: Sectoral employment in Nepal (1991 to 2019) 31
Figure 6: Agriculture sector shares in employment and GDP 32
Figure 7: % of total employment in agriculture (1991) 33
Figure 8: % of total employment in agriculture (2019) 33
Figure 9: Industrial-sector share in employment and GDP (1991 to 2019) 35

6
Figure 10: % of total employment in industry (2019) 36
Figure 11: % of total employment in industry (2020) 36
Figure 12: Service-sector share in employment and GDP (1991 to 2019) 37
Figure 13: Percentage of total employment in services (2019) 38
Figure 14: Percentage of total employment in services (2020) 38
Figure 15: Personal remittances received % of GDP in Nepal 38
Figure 11: Licensed migrant workers from FY 2006/07 to 2016/17 38
Tables
Table 1: Employment-to-population ratio by sex, age and
rural /urban areas (2019) 26
Table 2: Sectoral Employment % of Total Employment in Nepal 30
Table 3: Summary statistics 45
Table 4: Augmented Dicky-Fuller Test 48
Table 5: Determinants of Sectoral Employment in Nepal 49
Table 6: Multicollinearity Tests 50
Table 7: Breusch-Pagan/Cook-Weisberg Test for Heteroskedasticity 51
Table 8: DW Test Stats 52
Table 9: Regression Results with Newey-West Standard Errors 54
Appendix 1, Table 1: Sectoral Share as a percentage (%) of GDP 62
Appendix 2, Table 2: Share on GDP to Share on Employment Ratio in 2019 62
Appendix 3, Table 3: Correlation Matrix 63

7
ABBREVIATIONS
ADRL Autoregressive Distributive Lag
BoP Balance of Payments
CPI Corruption Perception Index
DW Durbin-Watson
EPS Employment Permit System
EITC Earned Income Tax Credit
FDI Foreign Direct Investment
GCC Gulf Corporation Council
GDP Gross Domestic Product
HDI Human Development Indicators
HDR Human Development Report
ILO International Labor Organization
IOM International Organization for Migration
LDCs Least Developing Countries
OLS Ordinary Least Squares
NLFS Nepal Labor Force Survey
Rs Nepali Rupees
UNDP United Nation Development Program
UNCTAD United Nations Conference on Trade and Development
USD United States Dollar
WDI World Development Indicators

8
Abstract
This paper uses the data from 1991 to 2019 to analyze the determinants of employment in
agriculture, industrial, and service sectors of Nepal. The data are gotten from the world
development indicators (WDI), human development indicators (HDI) and Nepal Rastra
Bank (NRB). The results show that significant determinants of employment in Nepal are
education, health, population growth, interest rate, inflation rate and political conflict.
The education, health, population growth, and inflation are inversely related to the
employment of agricultural sectors employment. Likewise, the industrial sector
employment is positively affected by the health and political conflict, and negatively
affected by the level of education and interest rate in the country. For the service sector
employment, the education, health, population growth, and inflation impacted positively,
whereas the political conflict impacted negatively.
Keywords: Nepal, Employment, GDP, Agriculture, Industry, and Service.

9
Chapter One: Background
Introduction
Nepal is a landlocked country between the two most populous countries: China to
the North and India to the South, East, and West. One of the 47 least developed countries
(LDCs), Nepal was recently upgraded to the status of “low-middle income
countries.” With a per capita income of $1,071 (US$), Nepal ranked 147th out of 193
countries in the Human Development Index (HDI) published by the United Nations
Development Program (UNDP) Nepal in 2019 (HDI, 2019). Because of its 0.579 HDI
value, the country fell under the category of “low human development countries;”
however, that value has increased by 52.37 percent from 0.380 in 1990. The life
expectancy (at birth) in Nepal was 70.5 years in 2018, which is 16 years greater than the
54.4 years of life expectancy in 1990. In 2018, the average years of schooling is 4.9
years (HDI, 2019).
According to a recently published map, the area of Nepal is 147,516 sq. km.,
which is 335 sq.km. more than before. Nepal can be divided into three distinct
geographical regions called Himal, Pahad, and Terai. These three regions include the
higher mountains and himalayas on the north side, mountains and hills in the middle, and
the plain land on the south side respectively. Politically, there are seven provinces, 77
districts, and 753 local bodies with six metropolitan areas, 11 sub-metropolitan areas,
276-municipalities, and 460-rural-municipalities (The Asia Foundation, 2017).
Thousands of streams and rivers flow north to south, bisecting the landscape into
hundreds of small hills and hillocks in Nepal. These three regions also display an
10
immense diversity of human settlement patterns, population, land distribution, productive
resources, and levels of economic development.
Home to nearly 30 million people, Nepal consists of over 61 ethnic groups who
have their distinct languages, cultures, and lifestyles. Officially, it is a secular state.
However, the country still has a rigid caste system that divides the people into a four-tier
hierarchy, culturally. This caste framework finds a close nexus historically with the
system of governance, in which the upper caste (the Bahun and Chhetri castes, in
particular) have always held most of the official positions of power and privileges. As a
result, other lower-level caste groups have been discriminated against and deprived of
accessing decisive state structures and institutions.
Economies and Employment
In 2019, the gross domestic product (GDP) of Nepal was US$30.64 billion at
current prices with an annual growth rate of 6.99 percent and the nominal GDP per capita
was US$1,071 with a per capita GDP growth rate of 5.04 percent (WDI, 2020). Likewise,
the gross national income (GNI) per capita was US$3,417 at constant PPP dollars on
2017 price. The service sector contributes approximately 51 percent of GDP with an
annual growth rate of 7.27 percent; the industrial sector comprises 13 percent of GDP
with a sectoral annual growth rate of 7.72 percent, and agriculture contributes the
remaining 24.55 percent of GDP with a sectoral growth rate of 5.06 percent.
Accordingly, the annual inflation was 5.57 percent in 2019, based on the consumer price
index. The population growth rate was 1.84 percent in 2019 (WDI, 2019).

11
Figure 1
Data Source: WDI, July 2020
Figure 1 shows the value added to GDP of these three sectors from 1991 to 2019.
In the period 1991to 2019, the agriculture sector’s share in GDP decreased from 24.66
percent to 24.55 percent, and the share of the industrial sector also decreased from 16.44
percent to 13.29 percent. At the same time, the share of the service sector increased from
33.55 percent to 50.61 percent.
Nepal experienced a balance of payments (BoP) account deficits continuously
from the long past. For instance, the BoP deficit was approximately 3 percent of its GDP
in 2019, which is 11 percent more than it was in 2010 (WDI, 2020). Likewise, the total
trade deficit of the country was $11.85 billion in the year 2018, which had increased from
$2.85 billion in 2008 (Statistica, 2019). Nepal imported more than US$14 billion goods

12
and services in 2019, which is 46.26 percent of its GDP. On the other hand, it exported
less than US$3 billion goods and services, which is only 8.67 percent of its GDP (WDI,
2020).
The unemployment rate of Nepal was 11.4 percent in 2017 (NLFS, 2017/18). The
Department of Foreign Employment of Nepal issued more than 3.5 million labor permits
to migrant workers from 2008 to 2017 (NLFS, 2017/18). The majority of the workers
traveled to Malaysia and the nations of the Gulf Cooperation Council (GCC) such as
Qatar, Saudi Arabia, United Arab Emirates, Kuwait, Bahrain, and Oman. During the
same period, nearly 45 thousand Nepalese workers gained employment opportunities in
the Republic of Korea via the Employment Permit System (EPS). An additional 2 million
Nepalese workers migrated to India for seasonal or long-term employment; that is almost
37 percent of the total migrated workforce from the country.
Development Status
In 2018, fifteen percent of the population in Nepal fall below the poverty line,
measured at less than $1.90 per person per day (at 2011 PPP dollars) and 34 percent of
the population are in multidimensional poverty. Besides, 35.4 percent of total employed
people are counted as working poor, whose earnings are less than $3.10 per person per
day (at 2011 PPP dollars) (HDI, 2019). Also, the inequality index of Nepal was 0.476,
with an income-inequality measured by Gini coefficient was 0.328. The bottom 40
percent of the population earn 20.4 percent of total income while the top 10 percent
earned almost 27 percent of income (HDI, 2019).
The life expectancy in Nepal was 70.5 years with the life expectancy index of
o.777, which is calculated as the ratio [(life expectancy – 20)/(85 – 20)] with a maximum

13
and minimum goalpost life expectancy of 85 and 20 years respectively for the next
generation. The life expectancy was increased by more than 16 years from 1990 (54.4
years). The infant and child mortality rates in Nepal were respectively 27.8 and 33.7 per
1,000 live births. Health expenditure in Nepal was 6.3 percent of its GDP in 2018. Access
to safe drinking water facilities was available to 70.4 percent of the population in 1995,
and its access had increased to 83 percent of the population by 2010 and 88.8 percent in
2017 (WDI, 2020). However, managed drinking water facilities were accessible to only
27.24 percent of the population (HDI, 2019). In 2011, 78 percent of urban households
and only 37 percent of the rural population had access to toilets (Nepal Status Paper,
2011). Likewise, 60.8 percent of the population had maintained sanitation service in rural
areas compared to 67.3 percent in urban areas (HDI, 2019).
Of the adult population ages 15 years and older, the literacy rate was 59.6 percent
in 2018. Only 35.9 percent of the adult population aged 25 or older had at least some
secondary education. In the same year, the primary school dropout population was 26.5
percent. In Nepal, the expected years of schooling is 12.2 years by 2030, which is
targeted to achieve by assuring equal access for all women and men to affordable and
quality technical, vocational and tertiary education, including university education.
Because of the high unemployment rate and very low wages in the country,
international migration has been increasing since the early 1990s. That has led to an
increased flow of remittances, which have been instrumental to poverty alleviation as
well as to improve the living standards of those who are poor and vulnerable in Nepal
(IOM, 2018). As a result, Nepal was the number one remittance recipient country in the
world in 2016 based on the share of remittance to GDP. The share of remittance to GDP

14
was 31.3 percent with $6.1 billion in 2016. That contribution has decreased to 26.5
percent in 2019, however, the dollar value still increased to $8.13 billion.
Statement of Problem
The Human Development Report (UNDP, 2014) states that employment contains
more public benefits than private benefits, by creating social stability as well as
strengthening the people’s ability. Higher employment provides greater psychological
strength and boosts human civilization, while joblessness tends to lead to higher
misconduct, psychic problems, and eventually societal troubles (HDR, 2014).
Unemployment leads to creating a negative self-image, and people who feel less valued
might develop a rebellion against a social system and begin to participate in deviant
behavior such as crime or escapism of other forms (Napier, et al., 1978). Unemployment
results in frustration, crime, homelessness, family tension, and loss of confidence
(Maqbool, et al., 2013). An excessive rate of unemployment results in underutilization of
resources and a less-than-potential production level that reduces the rate of economic
growth (Maqbool, et al., 2013).
Employment is a public issue as well as an individual necessity. Clark & Oswald
(1994) reveals that the mental distress of those unemployed is higher compared to those
who are employed. In their sample, the estimated mental distress score of those
unemployed (2.98) was almost twice the distress score of employed people (1.45).
Interestingly, the mental distress score for those self-employed (1.54) was slightly higher
than those employed by others but was still much lower than the score for those who
were unemployed. Of those who are employed, having a high level of education yields a
higher mental distress score (1.48) than having a low or medium level of education

15
(1.43). Similarly, mental distress from unemployed people with higher education is at its
peak at 3.44 compared to those with low education (2.70) or medium-level education
(3.15). The study concludes that the unemployed for a long time are less mentally
distressed than people who have lost their jobs recently in Britain in 1991 (Clark &
Oswald, 1994). Thus the reduction of unemployment is very important.
According to World Bank data, the population of Nepal was 28,608,710 in 2019,
which is 0.37% of the total world population. In that 28.6 million population, 63.7
percent of them are below the age of 30-years. The unemployment rate for youth aged
15-29 years is approximately 19.5 percent compared to 11.4 percent for the whole
population. Over 500,000 young people are estimated to enter the labor force each year,
and 80 percent of them have been leaving the country for foreign employment.
On the other hand, the informal and agricultural sectors employments are much
less productive in Nepal and the earnings from those employments are very low. Almost
65 percent of the population has worked in agriculture sector in 2019 but their
contribution to the national economy was only 24.26 percent. That means a large number
of those workers are being underemployed and their productivity is pretty low. Their
earnings are not even enough to meet their subsistence living. Thus an important part of
the employment challenge in Nepal is how to enhance the employment opportunities with
better productivity and increase the workers earnings. Thus a large number of labor force,
especially the youth have chosen overseas migration in search of higher income and
better dignity at the society.
Despite the productivity of labor in agricultural sector in Nepal is low, the
productivity of labor in industrial and service sectors are encouraging. The ratios of the

16
sectoral share of GDP to the sectoral employment are 0.89 and 2.55 respectively for the
industrial and service sectors in Nepal in 2019 (see Table 2, Appendix 2). That means,
15.44 percent of the Nepalese work force have been employed in industrial sector and
their contribution to the GDP was 13.29 percent, and 19.86 percent of the population
have been employed in service sector and their contribution to the GDP was 50.61
percent. So, the labor productivity in service sector is pretty high and that in the industrial
sector is also more than doubled than in agricultural sector. Thus, Nepal has to enhance
the labor productivity in agricultural sector and the employment opportunities in all three
sectors to reduce the alarming unemployment in the country and to control the
international migration of its quality work force. Because of these reasons, this research
attempts to answer the following research questions.
What are the determinants of employments in Nepal in general and what are those
determinants in agricultural, industrial and service sectors?
Research Objectives
The general objective of this study is to explore the major determinants of
employment in Nepal. This could be useful to devise appropriate policies to reduce the
existing unemployment rate from 11.4 percent to below the natural rate of
unemployment. The specific objectives are:
• to identify the determinants of employment in agricultural sector,
• to identify the determinants of employments in industrial sector, and
• to identify the determinants of employment in service sector in Nepal.
17
Chapter Two: Literature Review
Theoretical Literature
Classical economists believe that all economic systems are run by self-correcting
mechanisms. Under the assumption of price flexibility, the economy automatically
adjusts its supply and demand until full employment is reached. This means that, due to
the price flexibility, any short-run unemployment that occurs could be automatically
corrected in the long-run (Evans-Pritchard, 1985). According to Pigou (1943), any
frictional unemployment that exists should be a short-run phenomenon. For instance,
unemployment may occur due to the continuous changes in aggregate demand that
prevent suitable wage correction immediately. In addition, when an individual changes
jobs from one to another, there could be a small amount of frictional unemployment.
Neither of these cases should exist for a long period.
Keynes (1936) strongly criticized the classical theory of employment. In the book
General Theory of Employment, Interest and Money, the author declared that the level of
employment in the short run is determined by aggregate effective demand for goods in a
country. The greater the aggregate effective demand, the greater will be the volume of
employment and vice versa. That means unemployment is the result of a deficiency of
effective demand. The effective demand is the money spent on the consumption of goods
and services and on investment, which is equal to the total expenditure of the country.
The total expenditure is equal to national income or output. Therefore, the national
income or output is equal to the effective demand.
The Keynesian theory of employment was based on an assumption of sticky
prices. In the short run, he assumed that the factors of production, such as capital goods,

18
the labor supply, technology, and the efficiency of labor remain unchanged and
combined; they determine the national output or national income and therefore ultimately
determine the level of employment.
In Keynes’ model, the aggregate demand price and aggregate supply price help in
determining the equilibrium level of employment. When the aggregate demand price
(ADP) is equal to the aggregate supply price (ASP), the employment level corresponding
to that point is the equilibrium employment. In Figure 2, ADP = ASP is achieved at point
E. The employment level corresponding to E is N2, which is the equilibrium level of
employment. Before reaching at N2, the economy wants to hire more and more workers
to increase their profit. The process will continue up to at the point of maximum profit,
where the aggregate demand price is exactly equal to the aggregate supply price.
However, when the employment level crosses the N2 level, the ADP curve is
below the ASP curve, and the aggregate supply price exceeds the aggregate demand
price. At this point, the organization would start suffering losses. The economy would
reduce the employment rate until the profit-maximizing level of employment is reached.
Therefore, the interaction of aggregate demand price and aggregate supply price
determines the equilibrium level of employment in the country.
As the aggregate demand is equivalent to effective demand and the aggregate
supply is equivalent to the effective supply, the interaction of effective demand and
supply determines the equilibrium rate of employment. This means that the national
income or the national output level affects the equilibrium rate of employment.

19
Figure 2
Determinants of Level of Employment
.
Determinants of Level of Employment
N2 Employment Level
ASP ADP E
Agg
rega
te D
eman
d an
d A
ggre
gate
Sup
ply
Pri
ces
and
Pro
fits

20
Empirical Literature
Dunga & Sekatane (2014) examine the employment status of households in
Bophelong Township in South Africa. The data was collected randomly by the household
surveys of different areas of the township in 2013 and calculated the results using the
logistic regression model. The paper concludes that the age, marital status, household
labor force, education level, and total government grants are the significant determinants
of employment in the area. However, the age of the head of household is negatively
impacted to the employment status, all others are positively impacted.
Using the data collected by Pakistan Bureau of Statistics from 2000 to 2010,
Umair and Ullah (2013) examined the influence of inflation on GDP and unemployment.
Their study concludes that unemployment and GDP are not significantly affected by
inflation. However, Aurangzeb & Asif (2013) analyzes the determinants of
unemployment for India, China and Pakistan from a macroeconomic perspective. They
use the economic survey data of 1987 to 2009 and co-integration analysis, granger
causality test, and regression analysis. Their results show a significant positive relation
of inflation, the exchange rate, population growth, and GDP on the unemployment rate of
Pakistan. The co-integration results point out the distribution of income that needs to be
enhanced for Pakistan to get a positive impact of growth on employment. The authors
explain the vital role of the exchange rate on employment in the modern globalized
world; the devaluation of currency leads to more exports and reduces the imports and this
consequently lowers the unemployment rate. The article uses three models for three
different countries; the results show a significant impact of GDP, population, the
exchange rate, and inflation on unemployment for all three countries. However, the study

21
also finds a significant positive impact of growth on unemployment in Pakistan.
According to the article, some of mis-utilization of foreign investment, an uneven
distribution of income, political instability, poverty, and other factors could be the cause
of that oddity. The study has recommended that adding variables could broaden the
research.
Xuen, et al. (2017) examines the influence of inflation, population growth, GDP
growth and foreign direct investment (FDI) on the unemployment rate in China. The
study finds a significant relationship between the population and GDP growth with
unemployment, while the inflation rate and FDI do not have a significant impact.
Napier et al. (1978) studies the factors affecting unemployment in the
Appalachian region of southeastern Ohio. That region includes five counties: Athens,
Gallia, Jackson, Meigs, and Vinton. This paper explores the higher unemployment in the
region compared to the state and national average; there is also less employment in
manufacturing and lower incomes. The study observes the lower unemployment rate of
the professional, technical and skilled workers compared to unskilled workers. The paper
uses five independent variables: age, education, length of residence, group membership,
number of children living in home and found all variables have insignificant impacts on
unemployment at 5-percent significance level.
Maqbool et al. (2013) examines the determinants of unemployment in Pakistan
using data from 1976 to 2012. The study analyzes the impact of population, inflation, real
GDP growth, foreign direct investment, external debt, and private investment on
unemployment. An autoregressive distributed lag (ARDL) model is used to estimate long
run relationships. The study finds a significant impact of all variables on unemployment,

22
except for external debt, for which the estimated effect is not statistically significant.
GDP, foreign direct investment, and inflation have a negative relation to unemployment
in Pakistan, while population growth is positively related. There is a negative relation
between unemployment and inflation in the long run and short run; a one-percent
increase in inflation decreases the unemployment rate by 0.34 percent, reflecting the
existence of the Phillips curve.
Riaz and Zafar (2018) evaluate the determining factors of unemployment in
Pakistan in the period of 1990 to 2015. The study examines the impact of GDP,
population growth, college and university enrollments, and technical and vocational
education on the unemployment rate, using an ARDL (Auto Regressive Distributed Lag)
model. The study finds that, the unemployment has an inverse relationship with GDP, a
positive relationship with population, and an insignificant relationship with education and
vocational training in the long run. However, the unemployment is significantly and
positively impacted by both population and technical and vocational education in the
short run.
Dalmar et al. (2017) analyze the determinants of unemployment using data from
1995 to 2014 in Somalia. The authors suggest that the migration, terrorism and robbery
are a by-product of unemployment in Somalia, which experienced 6.7 to 6.9 percent
unemployment rates in those years. The econometric techniques of the unit root test,
Johansen cointegration techniques, and Granger causality tests are used to reveal the
relationships among the variables. The paper finds a positive relationship between
unemployment and GDP, population growth, and external debt. They also find that there
23
is an inverse relationship between unemployment and gross capital formation and the
exchange rate. Some of the features of Somalia are similar to Nepal.
Khanal (2015) states that while the unemployment rate looks very low in Nepal,
the disguised underemployment is high, and almost 30 percent of population is
underutilized in Nepal's labor market. By the decomposition analysis of 1991 to 2001, the
study finds that a key role of labor productivity and employment in the growth procedure,
while decreasing employment contributed to increased labor productivity during the year
of 2001-2011. Author explains that employment growth in Nepal is slower than the
population growth rate. The working aged population attracted to the foreign
employment, which created the inter-sectoral labor relocation causes the total output
increase (Khanal, 2015). Over 3 million Nepalese were outside of Nepal for employment
purposes the unofficial estimates of 2011-2012.
Card (1990) examines the impact of a large swell of immigration by examining
the labor market of Miami before and after the Mariel boatlift. The model reveals that
there is no effect of Mariel immigration on non-Cuban workers in the Miami labor
market, while a smaller effect on other Cuban workers. The paper concludes that there is
no effect on wage rates and unemployment rates for other groups by the Mariel
immigrants.
Nayark & Chattarjee (1986) tries to explain underemployment of the rural orrisa
of India using variables such as time, willingness to work, poverty, productivity, and
uneven distribution of land criterion. The paper concludes that a large percentage of
disguised unemployment or underemployment exists in developing countries, mostly
backward non-industrialized agricultural societies. The rate of disguised unemployment

24
and underemployment differs significantly from criterion to criterion. Lower landholding
leads to higher disguised unemployment and vice versa. According to the mal-
distribution of land criterion, the farmers who are holding ten or more acres of land are
less affected by underemployment.
McMillan, et al. (2014) find that the structural transformation from agriculture to
non-agriculture sectors increases economic growth; however, structural change in a
negative direction contributes to negative economic growth, which has happened in Latin
American and sub-Saharan African countries since 1990. The paper analyzes the data of
38 countries (30 developing countries and 8 high income countries) from 1990 to 2005 by
decomposing the data into two periods, 1990 to 1999 and 2000 to 2005. The results
shows that India, China, and other countries have benefited from structural change caused
by globalization, while the Latin America and Sub-Saharan Africa have not. There is
almost two to four times higher productivity in manufacturing relative to agriculture in
Africa, Latin America, and Asia and the huge sectoral-productivity gaps occur mostly in
the poorest countries. The flows of labor and other resources from the agricultural sector
to modern or more productive sectors are a strong indicator of the successful and
unsuccessful countries.
This paper concludes that increasing competition on importable goods has forced
manufacturing industries It explains that the structural change is not a self-managed
system; it demands the force to appropriate direction. From 1950 to 1975, Latin
American countries experienced 4 percent economic growth. This was achieved through
structural change, which shows that the key driver of development is a labor flow from
low-productivity to high productivity sectors. This reduces the productivity gap between
25
traditional and modern economic activities in developing societies. However from 1990
to 2005, the structural change contributed to the negative growth in Latin America and
Africa, but contributed to the positive growth in Asia (McMillan et al., 2014).
Based on the review of existing literature, the major determinants of employment
in any country are: gross domestic product and its growth rate, gross fixed capital
formation rate or the investment rate, the inflation rate, the population growth rate, the
exchange rate, the average wage rate, political instability, foreign direct investment,
technology, structural change, along with the age, gender, and education levels of the
population.
Chapter Three: Employment Status of Nepal
This chapter analyzes the past trends and the current status of employment of the
Nepali workforce in the agriculture, industrial, and service sectors. It discusses the trends
and the status of employment by gender and their residence of geographic locations,
compares Nepal's employment scenario to that of South Asian countries and China, and
finally, discusses the status and the trend of foreign migration of the Nepali workforce
and their foreign employment.
The Nepal Labor Force Survey (2017/18) states that Nepali workers work an
average of 44 hours per week. Storage and transport employees work an average 55
hours; in the industrial sector, construction sector, and other sectors, male workers
average 48 hours per week, while female workers average 39 hours per week.

26
Table 1 reports International Labor Organization (ILO) modeled estimates of
employment-to-population ratio for various groups of the Nepali population in 2019. The
employment-to-population ratio of the population ages 15 and over was approximately 83
percent. The female employment-to-population ratio is lower than that for males in both
the total population and the urban population, but it is slightly higher in the rural
population. Between the ages of 15 to 24, more than 81 percent of the rural population
was employed. The male and female percentage of employment in rural communities was
78.7 percent and 84 percent respectively. In the case of the urban population, only 51.58
percent of the total urban population are employed; of those employed, 52.4 percent are
male and 50.65 percent of females. For those 25 and older, 86.5 percent of the
population was employed in 2019. The employment ratio was 90.13 percent for males
and 83.92 percent for females. For this age group, almost 90 percent of the rural
population and 75 percent of urban population were employed. The employment-to-
population ratio of females is lower in rural and urban areas (see Table 1).
Table 1: Employment-to-population ratio by sex, age and rural /urban areas (2019)
National
Rural
Urban
Age Total Male Female Total Male Female Total Male Female
15+ 82.694 83.782 81.843 87.302 87.155 87.414 67.571 73.455 62.505
15-24 74.172 71.738 76.512 81.507 78.706 84.063 51.576 52.398 50.65
25+ 86.505 90.128 83.925 89.839 91.441 88.717 75.246 85.886 67.203
Source: ILO, 2020
27
The Labor Act of 1992 and Trade Union Act of 1993 also helped to strengthen the
labor market in Nepal (Khanal, 2015). A minimum wage established by the Labor Act of
1992 for the first time in Nepal (Zeldin, 2016), but that policy was implemented after 15
years in 2007, when the basic salary was set at Rs.3300 (approximately $50 current USD)
per month. Later, the Labor Act of 2017 set a policy to revise the minimum wages every
two years (Sah, 2018). In July 2018, the minimum wage was set at Rs13,450
(approximately $123 current USD) per month which was 38 percent higher than one set
a Rs9,700 which is approximately $90 current USD in 2016 (Sah, 2018).
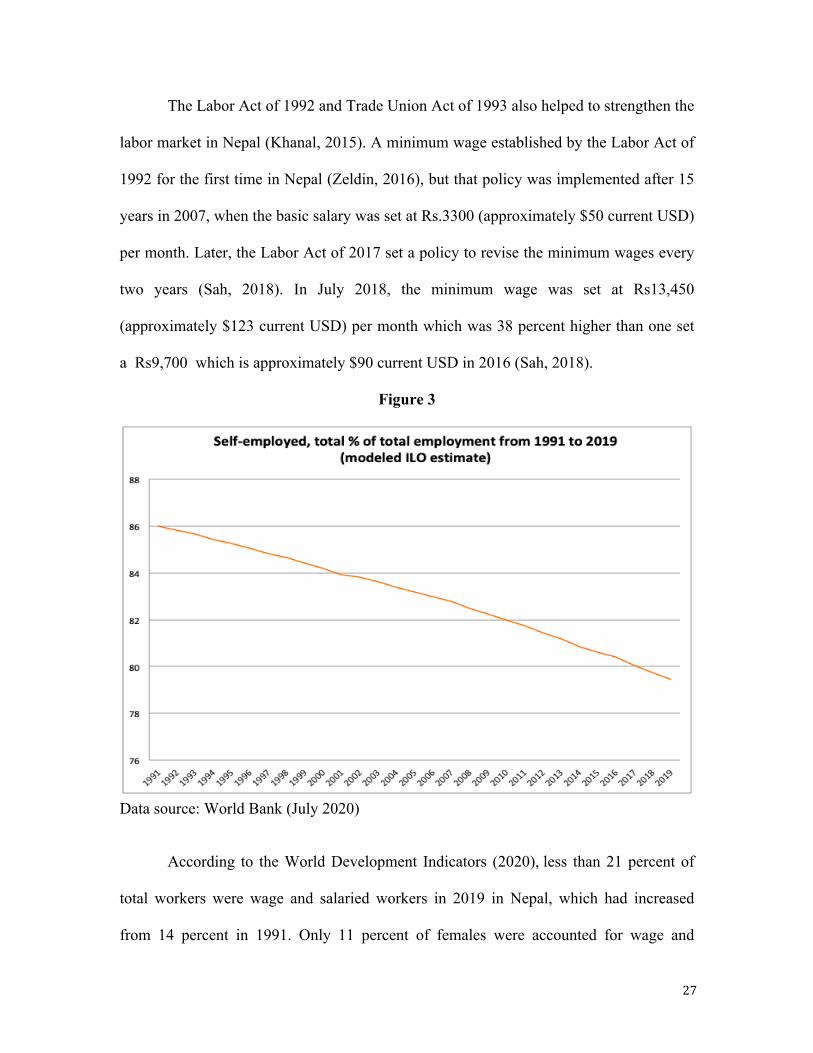
Figure 3
Data source: World Bank (July 2020)
According to the World Development Indicators (2020), less than 21 percent of
total workers were wage and salaried workers in 2019 in Nepal, which had increased
from 14 percent in 1991. Only 11 percent of females were accounted for wage and

28
salaried workers, which was approximately doubled in that 30 years period. Likewise, the
percentage of total employment of male population increased to nearly 33 percent in
2019 from less than 22 percent in 1991 (WDI, 2020).
The percent of total employment that comes from self-employment is shown in
Figure 3. Although the self-employed population has been decreasing continuously,
approximately 79 percent of people in Nepal are still self-employed; this value has fallen
from 86 percent in 1991. This most of the self employed population are in the agricultural
sectors. Which symbolizes that the how informal sector is survived in different sectors.
This implies that a large amount of work in the informal sector and self-employment has
existed in the country over this period.
Unemployment
According to the Labor Force Survey 2017/18, Nepal’s unemployment rate is
11.4 percent, with 10.3 percent of males and 13.1 percent of females unemployed.
Unemployment in the rural area was 10.7 percent (11.3 percent for males and 10.9
percent for females). Likewise, the unemployment rate was 10.1 percent in urban areas
(13.8 percent for males and 11.6 percent for females) (NLFS, 2017/18). However,
according to the ILO model estimates, the unemployment rate has reported less than 2
percent (WDI, 2020). Likewise, the Labor Force Survey of 2008 also reported a less than
2 percent unemployment rate in Nepal, but their estimate has changed significantly in
2018. That was due to the change in methodology to estimate the unemployment rate
(NLFS, 2017/18).

29
Figure 4
Data source: NLFS, 2017/18
There are seven provinces now in Nepal. In 2017, the highest unemployment rate
was in Province 2 at 20.1 percent, while Province 3 reported the lowest unemployment
rate at 7 percent (NLFS, 2018). Of those unemployed, 69.1 percent were 15 to 34 years
old young people and more than 30 percent of those were unemployed for more than 12
months. That is a signal of a long-term unemployment condition in Nepal. In the same
year, the unemployment rate of people with advanced education (bachelor’s, master’s and
doctoral degrees) was reported to be 8.46 percent. In that group, 7.79 percent of females
and 8.75 percent of male were unemployed. Similarly, the unemployment rate for those
with a basic education (primary or lower secondary education) was 10.44 percent. In that
group, 9.14 percent were male, and 13.74 percent were female. But there was a higher
unemployment rate for those with an intermediate education, which comprises those with
an upper-secondary or post-secondary non-tertiary education. In that group, more than 15
30
percent of the total, 13.8 percent of males and 17.59 percent of females were
unemployed. Figure 4 shows how unemployment rates vary across education levels.
Sectoral Differences
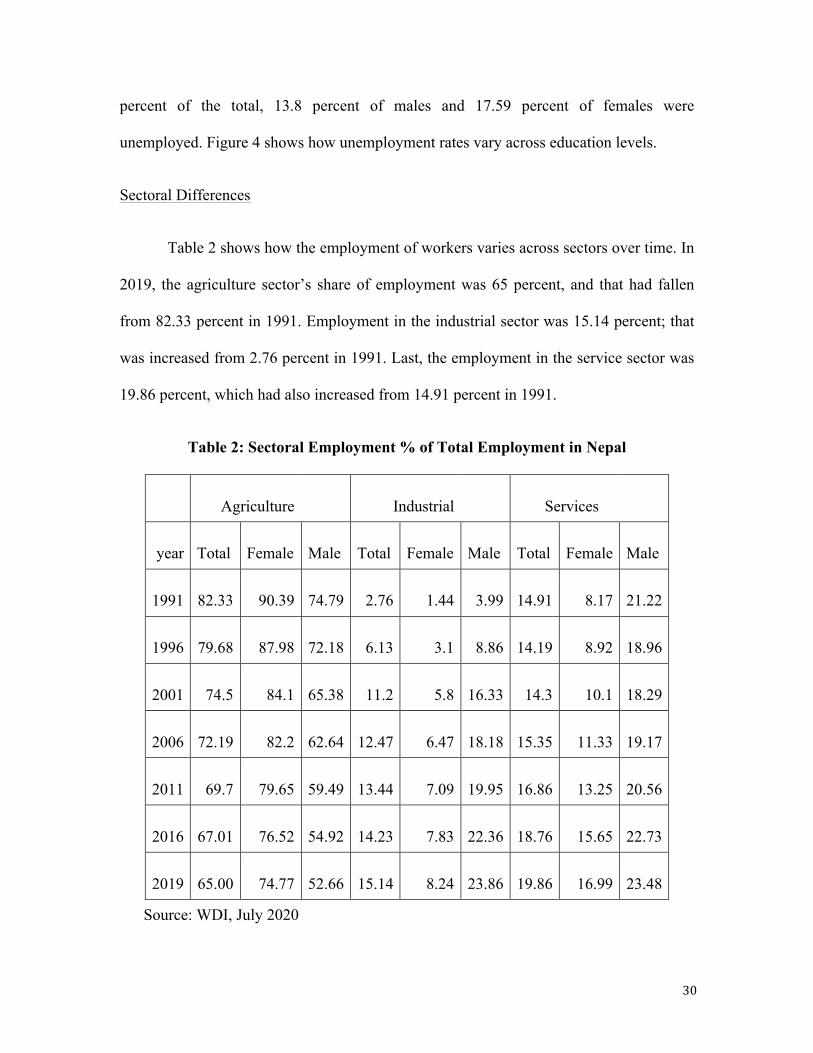
Table 2 shows how the employment of workers varies across sectors over time. In
2019, the agriculture sector’s share of employment was 65 percent, and that had fallen
from 82.33 percent in 1991. Employment in the industrial sector was 15.14 percent; that
was increased from 2.76 percent in 1991. Last, the employment in the service sector was
19.86 percent, which had also increased from 14.91 percent in 1991.
Table 2: Sectoral Employment % of Total Employment in Nepal
Agriculture
Industrial
Services
year Total Female Male Total Female Male Total Female Male
1991 82.33 90.39 74.79 2.76 1.44 3.99 14.91 8.17 21.22
1996 79.68 87.98 72.18 6.13 3.1 8.86 14.19 8.92 18.96
2001 74.5 84.1 65.38 11.2 5.8 16.33 14.3 10.1 18.29
2006 72.19 82.2 62.64 12.47 6.47 18.18 15.35 11.33 19.17
2011 69.7 79.65 59.49 13.44 7.09 19.95 16.86 13.25 20.56
2016 67.01 76.52 54.92 14.23 7.83 22.36 18.76 15.65 22.73
2019 65.00 74.77 52.66 15.14 8.24 23.86 19.86 16.99 23.48
Source: WDI, July 2020

31
The employment status of each of those sectors and foreign employment scenario
is analyzed below in the separate sections. Figure 5 shows how the sectoral employment
has changed over time in Nepal. Agriculture employment has continuously decreased
over the period of 1991 to 2019. But the industrial sector’s and the service sector’s
employment have both significantly increased over the same time.
Figure 5
Data source: WDI, July 20202
I) The Agriculture Sector
Employment in the agriculture sector has been decreasing over the years in Nepal.
In 1991, 82.33 percent of the population was employed in the agricultural sector. That
number fell to 74.5 percent in 2001, 69.7 percent in 2011, and 65 percent in 2019 (see
Figure 6). Employment of females in that sector decreased to 74.77 in 2019 from more
than 90 percent in 1991. Likewise, the share of male employment also decreased

32
significantly to 52.66 percent in 2019 from approximately 75 percent in 1991. Not
surprisingly, the share of the agricultural sector of GDP in 2019 had fallen to 24.25 from
42.66 percent in 1991 as we can see in Figure 6.
Figure 6
Data source: WDI, July 2020
Most of the people in Nepal live in rural areas. Therefore, their livelihoods come
from agriculture (Plecher, 2020). In Nepal, more than 65 percent of the population works
in the agricultural sector. Generally, the percentage of the population employed in the
agricultural sector is much higher in developing countries when we compare that number
with that in developed countries. But the agriculture sector value-added GDP is very low,
its US$413 in 1999 and increased to US$618 in 2018 (World Data Atlas, 2020). In
developed countries, less than five percent of the population is employed in that sector. In

33
developed countries such as North America, Europe, and New Zealand, the agriculture
sector value added per worker was $70,000 compared to $1,000 in Sub-Saharan Africa
and Asia, in 2017 (Roser, 2020)
Figure 7 Figure 8
Data source: WDI, July 2020
Figure 7 shows the percentage of employment in the agricultural sector across
several south Asian countries in 1991. Figure 8 provides the same information for 2019.
For both periods, Nepal employed the largest share of the population in the agriculture
sector when compared with other South Asian countries and China. The Maldives has the
lowest level of employment in the agriculture sector in the region, with 21.73 percent in
1991 and a decrease to 8.47 percent in 2019 followed by Sri Lanka in South Asia. The
story of China was amazingly interesting, however. The agriculture sector employment in
China was declined from 59.7 percent in 1991 to 25.36 percent in 2019.
II) The Industrial Sector
Employment in the industrial sector has been increasing continuously in the past
three decades. Industrial sector employment was only 2.76 percent in 1991. That
increased to 11.2 percent, 13.4 percent, and 15.14 percent respectively in 2001, 2011, and
2019. There is a gender gap in employment in the industrial sector in Nepal. The male-

34
female composition ratio was 3.99 percent versus 1.44 percent in 1991 whereas that
composition increased almost 6-fold in 2019 and reached 24 percent of males and 8
percent of females (see Table 1).
However, the contribution of the industrial sector to GDP did not increase at the
same rate. The share of the industrial sector to GDP increased from 16.44 percent in 1991
to 16.66 percent in 2001 but then decreased to 13.4 percent in 2019 (see Appendix 1,
Table 1). As Figure 9 shows, the trend of industrial sector contribution to GDP and the
share of employment are moving in the opposite direction in Nepal.
Figure 9
Data source: WDI, July 2020

35
Nepal entered into the era of economic liberalization and privatization in the early
1990s. The Privatization Act was first introduced in 1992. The government of Nepal
privatized 26 public enterprises by 2006 (UNCTAD, 2011). The conflict between the
democratically elected government and the Maoist rebellion started in 1996. This had
serious consequences on the development of hydropower and other sources of energy and
the country ran up to 18-hours/day load-shedding (interruption of electricity supply) until
2016.
On the other hand, many investors didn’t believe their investments would be
secure. This had serious consequences on the industrial sector. Because of that reason, the
industrial sector’s contribution to GDP has declined over the past three decades.
Figures 10 and 11 show how employment in the industrial sector compares to
that of other developing countries in South Asia in 1991 and 2019. In Nepal, the
contribution of the industrial sector in total employment was only 2.76 percent in 1991,
which was the smallest contribution relative to other countries in South Asia and China.
Whereas Sri Lanka had the greatest share of 26.58 percent in 1991 and that country
persistently maintains that status and provides the highest employment in the industrial
sector even in 2019 in South Asia.
Even though Nepal and Bhutan were the smallest industrial sector employment
providers in 1991 and 2019, those two countries made significant progress in terms of the
percentage increase in that sector employment in South Asia. The status of other
countries is presented in Figures 10 and 11 below.

36
Figure 10 Figure 11
Data source: WDI, July 2020
III) The Service Sector
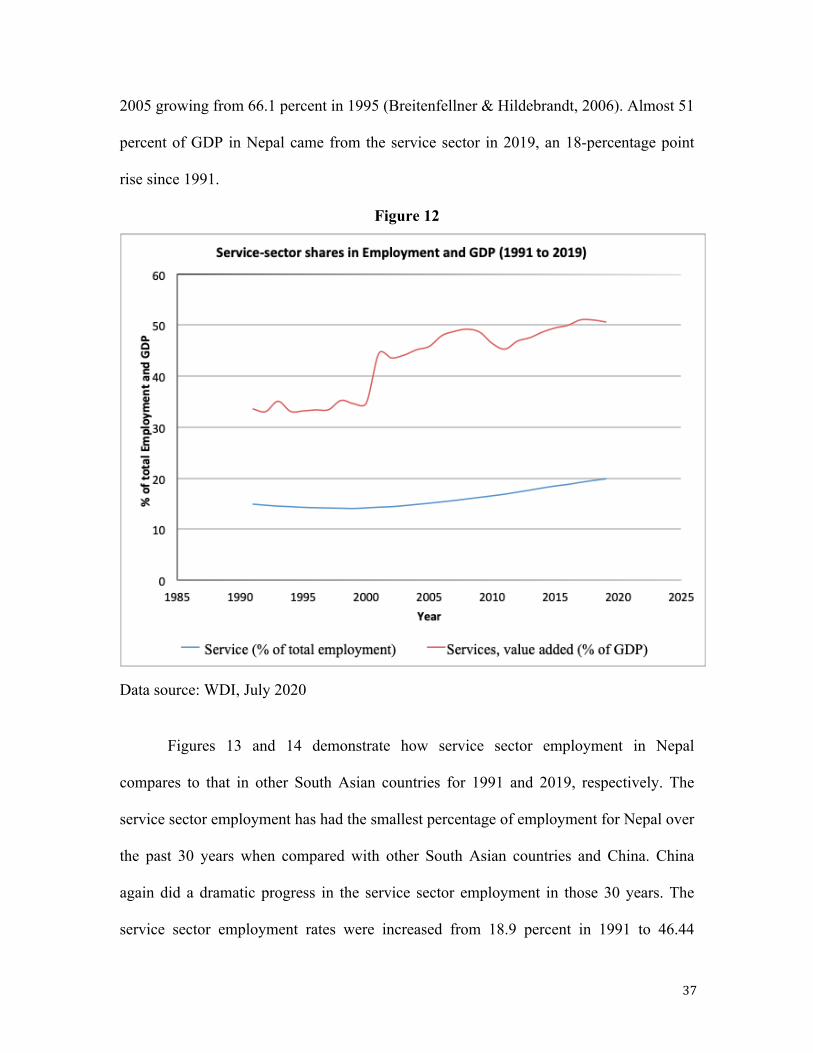
Employment in the service sector has been increasing in recent years in Nepal
(Figure 12). In 2019, the service sector accounted for 19.86 percent of total employment
in the country, which had increased from 14.91 percent in 1991. However, that sector fell
to 14.3 percent of employment from 1991 to 2001 and then increased by only 2.56
percentage points from 2001 to 2011. From 1991 to 2019, the share of females in service
sector employment has almost doubled, from 8.17 in 1991 to 16.99 percent in 2019. On
the other hand, male employment in the sector has only increased to 23.48 percent, which
was only a rise of 2.36 percentage points since 1991 (Table 2). Figure 12 shows how the
service sector has changed over time. Even though the share of employment in the
service sector has increased slightly, the sectoral share of GDP has continuously
increased over those 29 years.
The service sector is an important sector, which has been growing over the past
three decades in both developed and developing countries. Within the European Union
and other developed economies, the total share of the service sector was 71.4 percent in
37
2005 growing from 66.1 percent in 1995 (Breitenfellner & Hildebrandt, 2006). Almost 51
percent of GDP in Nepal came from the service sector in 2019, an 18-percentage point
rise since 1991.
Figure 12
Data source: WDI, July 2020
Figures 13 and 14 demonstrate how service sector employment in Nepal
compares to that in other South Asian countries for 1991 and 2019, respectively. The
service sector employment has had the smallest percentage of employment for Nepal over
the past 30 years when compared with other South Asian countries and China. China
again did a dramatic progress in the service sector employment in those 30 years. The
service sector employment rates were increased from 18.9 percent in 1991 to 46.44

38
percent in 2019. India, on the other hand, only made moderate progress from 21.72
percent to 32.04 percent in the creation of service sector employment in those 30 years.
The service sector employment was highest (34.19%) in Pakistan in 1991. But that
country was unable to maintain that status persistently. The service sector employment
was just increased by 3.82 percentage points in those 30 years and reached to 38.01
percent by the end of 2019.
Figure 13 Figure 14
Data source: WDI, July 2020.
IV) The Foreign Employment
Approximately 272 million people, which is 3.5 percent of the world’s
population, migrated internationally in 2019 (IOM, 2019). Every year, approximately 500
thousand people in the labor force leave Nepal for foreign employment. Of that, 75
percent are unskilled or low skilled and are now working in 100 different countries
around the globe (IOM, 2019).
The history of foreign employment began in the 18th century in Nepal. After the
integration of the country, people chose the form of corvée labor and migrated to recently
established tea estates in India (particularly those in Nagaland, Assam, and Sikkim) due

39
to the high tax burden in Nepal (Gurung, 2004). Formally, many Nepali young males
joined the military of Sikh Rajah, Ranjit Singh in Lahore, the northern region of Indian
state Punjab in the 19th century (Seddon, 2005).
After the war of 1814-1816, Nepalis joined the British army, and hundreds of
thousands of Nepalis fought for British allies. When India received independence, some
of the Gurkha regiments continued to enlist in the British army and others enlisted in the
Indian army (Seddon, 2005). By the World War II, 20-percent of the Nepali workforce
was employed in British-Indian army (Gurung, 2004). This is because Nepali workers
outside the country were employed mostly in India and Britain until the 1980s.
After the Labor Act of 1985, Nepal officially recognized labor migration beyond
the Indian subcontinent, and now, one of the major exports of Nepal is labor (Seddon,
2005). Due to huge informal sectors where it is difficult to increase productivity and
earnings, the choice of overseas migration for the youth labor force has grown so they
can earn higher income to improve their lifestyle (ILO, 2020). Employment in foreign
countries has become a major source of income for many Nepali households. In the fiscal
year 2016/2017, 642,860 labor permits were issued for foreign employment; of that
609,341 were males and 33,519 were females (Nepal Economic Survey, 2018/19).
Many migrant Nepalese are working in difficult, even dirty and dangerous jobs in
other countries, from Qatar to Malaysia and from South Korea to Israel (Kunwar,
2015). In recent years, Nepal formed an established government that has led to political
stability, and this improves the economic situation. However, remittances and foreign aid
remain the main sources of its economy (Plecher, 2020).

40
Figure 15
Data source: WDI, July 2020
Figure 15 shows how remittances (as a percentage of GDP) have changed over
time in Nepal. In 1993, remittances inflows in Nepal were 1.5 percent of its GDP; this
reached 11 percent in 2002 and went up to 21 percent in 2010. In 2016, remittances
peaked historically at 31.3 percent of its GDP. At that point, Nepal was the number one
remittance receiving country (as a share of its GDP) in the world. Nepal was damaged a
great deal by the tremendous disaster of an earthquake in April 2015. As a result, the
Nepalese diaspora sent a heavy amount of remittances. This shows that the Nepalese
people living are out of the country are vigorously supportive to relieve the national
difficulties at home.
In 2017, the share of remittance to GDP decreased to 27.84 percent, which is 3.5
percentage-point drop from 2016, but still, the total dollar amount was higher ($6.928
41
billion) than that in 2016. World Bank migration and remittance data released in April
2019 show that Nepal received $8.1 billion remittances from the globe, which was 28
percent of its GDP in 2019.
Figure 16
Data Source: Nepal Economic Survey, 2018/19
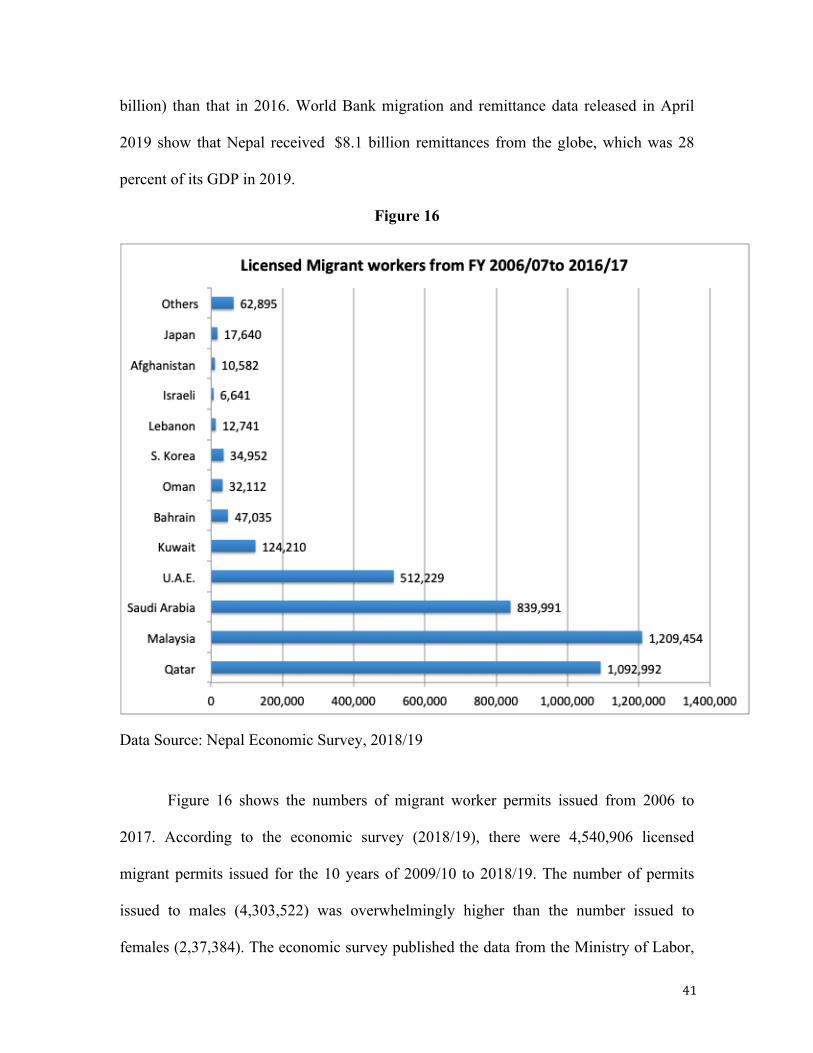
Figure 16 shows the numbers of migrant worker permits issued from 2006 to
2017. According to the economic survey (2018/19), there were 4,540,906 licensed
migrant permits issued for the 10 years of 2009/10 to 2018/19. The number of permits
issued to males (4,303,522) was overwhelmingly higher than the number issued to
females (2,37,384). The economic survey published the data from the Ministry of Labor,

42
Employment and Social Security, and Department of Foreign Employment (2019), and
indicated that more than four million (4,003,474) licensed migrant workers were reported
from the period of 2006/07 to 2016/17. In that period, approximately 3.8 million workers
went to work in Malaysia, Qatar, Saudi Arabia, UAE, and Kuwait. Nepali migrants are
also going to the United States, Australia, Canada, and Europe as well.
Chapter Four: Data and Method
This research identifies the determinants of employments in Nepal in general and
the determinants of employment in agriculture, industry and service sectors in particular.
The method and the data used in this research are discussed in the following sub-sections.
Models
To explore the determinants of employment in the agriculture, service, and
industrial sectors of the Nepali economy, I have estimated the following three equations,
each separately by sector.
AgEmpt = α0 + α1Educt+α2Healtht+ α3PopGrt +α4 GDPGrt + α5Inflt+
α6Intrt +α7Conft+ u1--(1)
InEmpt = β0 + β1Educt+β2Healtht+ β3PopGrt +β4 GDPGrt + β5Inflt+ β6Intrt
+β7Conft+ u2 ---(2)
SeEmpt = ϒ0 + ϒ1Educt+ϒ2Healtht+ ϒ3PopGrt +ϒ4 GDPGrt + ϒ5Inflt+
ϒ6Intrt +ϒ7Conft+ u3 ---(3)

43
In those equations, α s, βs, and ϒs are the parameters; u1, u2, and u3 are the random
error terms in the three different models; and the subscript t denotes the time. Brief
explanations about the dependent and independent variables are provided below.
I) Dependent Variables
To identify the determinants of employment in Nepal in different sectors
separately, there are three dependent variables in this study; however, the same
independent variables are used in all three-regression models. The dependent variables
are AgEmpt, which represents agriculture sector employment in time t, SeEmpt, which
represents service sector employment in time t, and InEmpt, which represents industrial
sector employment in time t.
II) Independent Variables
In all three models, independent variables are the same. Educt symbolizes
education, which uses the mean years of schooling. Likewise, Healtht represents public
health, using a life expectancy index, and PopGrt is the population growth rate of Nepal
as an annual percentage. GDPGrt is an annual growth rate of the gross domestic product
(GDP) of Nepal in real terms. Similarly, Inflt denotes inflation rate based on GDP
deflator; Intrt represents the interest rate, a weighted average of the 91-day Treasury bill
rate; and Conft is a binary variable that is equal to one if the year suffers due to Maoist
conflict and zeroes otherwise. (The conflict years were from 1996 to 2006.) This variable
serves as a measure of political stability in Nepal.

44
Sources of Data
This study uses secondary data collected from different sources for the period of
1991 to 2019. The percentage of the population employed in the agricultural, industrial
and service sectors, the GDP growth rate; the population growth rate; and the inflation
rate were collected from the World Development Indicators (WDI). The data for the life
expectancy index (a proxy measure for health) and average years of schooling were
collected from Human Development Indicators (HDI). Finally, the interest rate, a
weighted average of the 91-day Treasury bill was collected from Nepal Rastra Bank.
Nepal suffered from domestic political conflict and violence from 1996 to 2006. That
period is considered as the period of political conflict and the rest of the other years
during the study period are considered as no political conflict years. I have allocated a
one for conflict years and zero otherwise.
Descriptive Statistics
Table 3 presents the summary statistics for the variables used in this research.
There are 29 observations for each variable, belonging to the study period of 1991-2019.
The maximum and minimum percentage of employment in agriculture during that period
were respectively 82.33 percent and 65 percent of total employment, with a mean value
of 72.27 percent. Accordingly, the minimum and the maximum employment in the
industry sectors were 2.76 percent and 15.14 percent respectively, with a mean of 10.8
percent. Similarly, the minimum employment percentage in the service sector was 14.05
and the maximum was 19.86 with a mean value of 15.93 percent. The average population
growth rate of the period was 1.43 percent with a minimum and a maximum of -0.27
percent and 2.73 percent respectively.

45
Table 3: Summary statistics
Variable Explanation of variable Mean Std. Dev Min Max
AgEmp Employment percentage in agriculture 73.27 5.38 65.00 82.33
InEmp Employment percentage in Industry 10.79 3.88 2.76 15.14
SeEmp Employment percentage in Service 15.92 1.88 14.05 19.86
Educ Education: a mean year of Schooling 3.14 0.99 2.10 4.90
Health Life expectancy index value 0.68 0.07 .543 0.777
PopGr Population growth rate 1.43 0.89 -0.27 2.73
GDPGr Growth of growth domestic product 4.60 1.85 0.12 8.22
Infl Inflation 7.98 3.81 3.07 18.48
Intr Interest Rate 4.67 3.17 0.13 11.34
Conf Political Conflict 0.38 0.49 0.00 1.00
Total Number of Observations 29 29 29 29
Source: Calculated by Author, July 2020.
For education, the average year of schooling was 3.14 years with a maximum of
4.9 and a minimum of 2.1 years and a standard deviation of 0.99. The mean years of
Schooling in Nepal is pretty low compared to other countries, this could be the reason
why the majority of the Nepalese adult population is engaged in agriculture. Nepal made

46
significant progress in life expectancy in the past three decades. The value of the life
expectancy index was increased from 0.543 to 0.777 from 1991 to 2019 with a mean
value of 0.683 and a standard deviation of 0.072. This index is used as a proxy measure
of health in this study. The annual growth rate of the gross domestic product measured in
local currency was spread between 0.12 to 8.22 percent with a mean value of 4.60
percent, and a standard deviation of 1.85. Even though the annual average growth rate
was 4.6 percent, the fluctuation in GDP growth is apparent. However, if Nepal can
sustain its highest growth for a prolonged period, the country can upgrade to the upper-
middle-income countries status just in the next 10 to 15 years period.
Besides, the general price rise during the period fluctuated between 18.49 and
3.07 percent with a mean value of 7.98 percent and a standard deviation of 3.8. If we
compare the average price rise in the past 30 years to that of the GDP growth rate, the
inflation rate in Nepal was pretty high in that period. Accordingly, the average interest
rate of the period was 4.67 percent with a maximum of 11.34 and a minimum of 0.31
percent and a standard deviation of 3.17. That is not encouraging for productive investors
and employment creation in the country. Since the political conflict is a binary dummy
variable, its value is either 0 or 1. Its mean value was 0.38 and a standard deviation was
0.49. The conflict creates a significant impact on employment in all three sectors as well
as encouraged the international migration of Nepali adults basically after 1996. That
ultimately resulted in a migration of more than 4 million Nepali youths from the country
(NLFS, 2017/18).

47
Chapter Five: Results and Discussion
This study calculated the regression model for the period of 1991-2019 using the
data described in chapter four. To check for the reliability of the results, I performed
several econometric tests before and after the regression to determine the significant
influential factors determining employment in all three sectors (agriculture, industrial and
service) employment in Nepal.
Unit Root Tests
A Dickey-Fuller test is used to check to see if the data are stationary. The critical
values for the Dickey-Fuller test are -3.730, -2.992, and -2.626 respectively for one-,
five-, and ten- percent significance levels. If the test statistics are greater than the critical
values, the data are stationary. If the data are not stationary, we can take the first
difference, second difference, and so forth until they are stationary. I used the stationary
series for analysis. IndEmpt, SeEmpt, Healtht, and GDPGrt are stationary at the one-
percent level, and Inflt at the five-percent level. Educt, Intrt, and Conft are stationary at the
one-percent level once 1st-differenced. However, AgEmpt is stationary at 2nd difference
and PopGrt at 4th difference at the one-percent level. The results of the Dickey-Fuller test
are reported in Table 4. After the variables are stationary, I test the residuals for
stationarity to check if the model is co-integrated. The Augmented Dickey-Fuller (ADF)
t-statistics for residuals is -3.348, which is significant at the five-percent level. Since the
residuals are stationary, the variables are co-integrated.

48
Table 4: Augmented Dicky-Fuller Test
Variables Before 1st difference
first difference
second difference
Third difference
Fourth difference
Order of Integration
AgEmp -1.142 -2.576 -5.628*** - - I(2)
IndEmp -4.637*** - - - - I(1)
SeEmp 5.282*** - - - - I(0)
Educ 0.974 -4.922*** - - - I(1)
Health -15.682*** - - - - I(0)
GDPGr -5.328*** - - - - I(0)
Infl -3.548** - - - - I(0)
Intr -2.210 -5.271*** - - - I(1)
PopGr -1.263 -1.048 -1.490 -2.330 -3.987*** I(4)
Conf -1.451 -5.000*** - - - I(1)
Calculated by Author using Data Source: WDI, July 2020
Regression Results
The regression results are presented in Table 5. The values of R2 and the adjusted R2 are
very high for all three models. In all three cases, those values are more than 98 percent.
That means, more than 98 percent of the variation in the agriculture, industrial, and
service sector employment is explained by the list of independent variables included in

49
the model and the remaining is explained by other factors that are not captured by the
model.
Table 5: Determinants of Sectoral Employment in Nepal. OLS Estimates
Variables Agriculture Sector (1) Industry Sector (2) Service Sector (3)
Educ -0.6874*** [0.2169]
-1.0358*** [0.1288]
1.7232*** [0.1293]
Health -67.715*** [4.0723]
64.3151*** [2.0131]
3.4024* [2.5719]
PopGr -0.3604* [0.1691]
0.1269 [0.0968]
0.2337** [0.1023]
GDPGr -0.0412 [0.0538]
0.0089 [0.0431]
0.0322 [0.0223]
Infl -0.0553** [0.0208]
.0274 [.0198]
0.0279* [0.0125]
Intr 0.0860** [0 .0477]
-0.1182*** [0.0321]
0.0321 [0.0279]
Conf -0.3756 [0.2559]
0.8327*** [0.2140]
-0.4569*** [0.1276]
_cons 122.5965*** [2.4628]
-30.1068*** [1.2465]
7.5083*** [1.5099]
R-Squared (Adjusted R-Squared)
0.9954 (0.9938)
0.9939 (0.9918)
0.9880 (0.9840)
F-stat (7, 21) 646.98 487.08 247.71
P-value of F-stat 0.0000 0.0000 0.0000
Note: The numbers in brackets are robust standard errors.
Note: ***, ** and * respectively denote p < 0.01, p< 0.05, and p < 0.1 level of significance.
The values of F-stat are very high and the p-value of F-stats is 0.0000 in all three
models. That means, all of the independent variables are jointly significant at less than

50
the one-percent significance level in all three cases. This means that the models are fairly
strong. Even though the value of R2 is very high and the F-statistics are highly significant
in all three cases, the t-statistics for GDP growth and few other coefficients are
statistically insignificant. Columns 2, 3 and 4 present the regression outcomes for the
agriculture, industrial, and service sectors respectively.
Multicollinearity Test
The test results for the Variance Inflation Factor (VIF) are reported in Table 6. If
the VIF value is greater than 10, that variable suffers from multi-collinearity. In this
model, variables other than ‘Health’ are not suffer by multi-collinearity problem.
However, the value of the variable health is slightly higher, the average value of VIF is
4.76. That means the model does not suffer from severe multi-collinearity problem.
Table 6: Multicollinearity Tests
Variable VIF 1/VIF
Health 11.92 0.084
Educ 9.15 0.12
PopGr 4.18 0.23
Intr 2.82 0.35
Conf 2.41 0.41
Infl 1.61 0.62
GDPGr 1.20 0.83
Mean VIF 4.76 0.21
Calculated by author using the data from WDI, July 2020

51
Heteroskedasticity Test
The Bruesch-Pagan/Cook-Weisberg test results for heteroskedasticity for all three
models are reported in Table 7. The p-value for the χ2 of the agriculture sector model is
0.097. That means, we reject the null hypothesis of a constant variance at the ten-percent
level but not at the five- and one-percent levels. Thus, the model estimating agricultural
employment suffers from heteroskedasticity at the ten-percent level but not at the five-
and one-percent levels. So, the issue of heteroskedasticity is not that strong. In the other
two models, the χ2 values are small and the corresponding p-values are large. Thus, for
the industrial and service sector employment models, I am unable to reject the null
hypothesis. That means the industry and service sectors employment models do not suffer
from heteroskedasticity. However, robust standard errors are estimated for all three
models and reported with the regression coefficients in Table 5.
Table 7: Breusch-Pagan / Cook-Weisberg Test for Heteroskedasticity
Fitted var. Chi2(1) Prob > Chi2
AgEmp 2.72 0.0974
InEmp 0.45 0.5029
SeEmp 0.07 0.7944 Calculated by author using the data from WDI, July 2020
Autocorrelation Test
The Durbin-Watson (DW) test checks for autocorrelation or serial correlation in
the residuals from the regression analysis. Its value lies between zero and four. If the
value of the DW test statistic is two, the model is not suffering from a serial correlation
problem. However, if the DW test statistic is between zero and two, the model is
52
suffering from positive serial correlation. If the value is between two and four, the model
suffers from negative serial correlation.
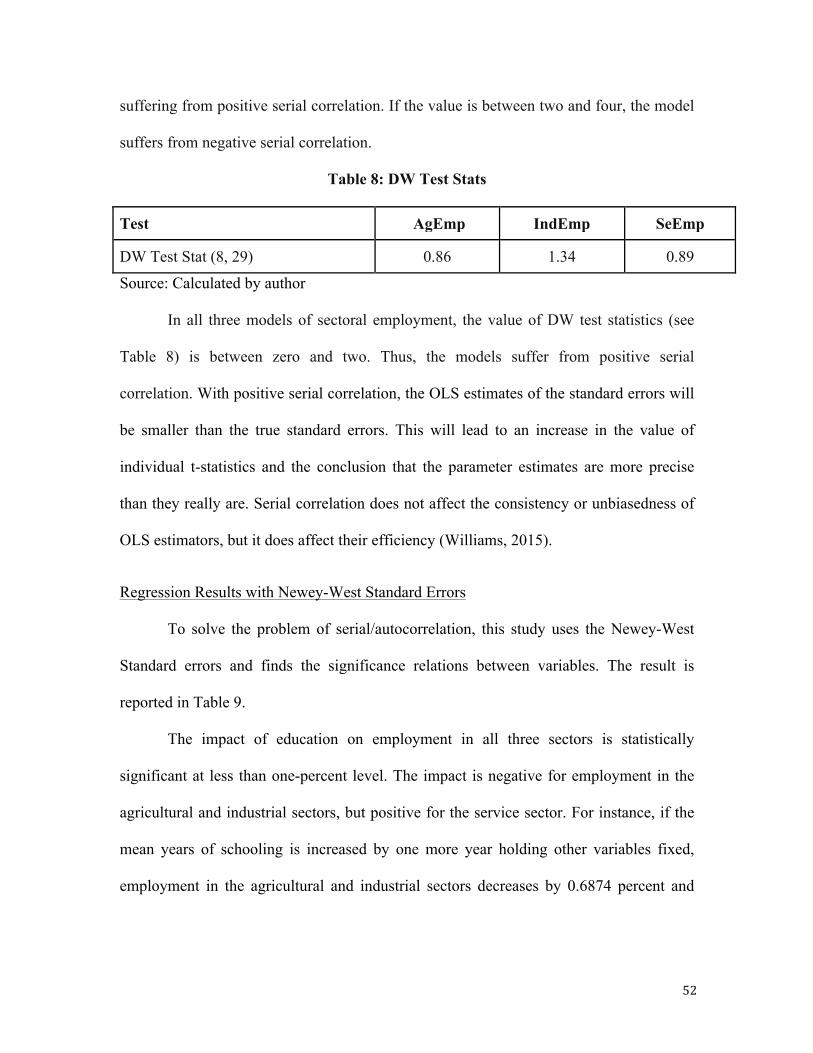
Table 8: DW Test Stats
Test AgEmp IndEmp SeEmp
DW Test Stat (8, 29) 0.86 1.34 0.89
Source: Calculated by author
In all three models of sectoral employment, the value of DW test statistics (see
Table 8) is between zero and two. Thus, the models suffer from positive serial
correlation. With positive serial correlation, the OLS estimates of the standard errors will
be smaller than the true standard errors. This will lead to an increase in the value of
individual t-statistics and the conclusion that the parameter estimates are more precise
than they really are. Serial correlation does not affect the consistency or unbiasedness of
OLS estimators, but it does affect their efficiency (Williams, 2015).
Regression Results with Newey-West Standard Errors
To solve the problem of serial/autocorrelation, this study uses the Newey-West
Standard errors and finds the significance relations between variables. The result is
reported in Table 9.
The impact of education on employment in all three sectors is statistically
significant at less than one-percent level. The impact is negative for employment in the
agricultural and industrial sectors, but positive for the service sector. For instance, if the
mean years of schooling is increased by one more year holding other variables fixed,
employment in the agricultural and industrial sectors decreases by 0.6874 percent and

53
1.0358 percent respectively, whereas service sector employment increases by 1.7232
percent.
The coefficient on the life expectancy index (a proxy measure for health) is
statistically significant at the one-percent level for the agriculture and industrial sectors,
whereas the insignificant at service sector. The impact of better health is negative on the
agriculture sector and positive in the industrial sectors whereas insignificant on the
service sector. The value of the life expectancy index lies between 0 and 1. Thus, if the
policy can increase the life expectancy index by 0.01 point, that will increase
employment in the industrial and service sectors by 0.643 and 0.034 respectively. That
same increase in the index will lead to a fall in agricultural sector employment by 0.677
percentages.
Table 9: Regression Result with Newey-West Standard Errors
Variables Agroculture sector Induatrial sector Service sector Educ -.6879***
[0.2282] -1.0368 *** [0.1306]
1.7213*** [0.1458]
Health -67.7181*** [4.1944]
64.3565*** [2.0231]
3.4163 [2.7448]
GDPGr -0.0414 [0.0489]
0.0085 [0.0409]
0.0328 [0.0221]
PopGr -0.3619** [.1717]
0.1311 [0.0974]
0.2337** [0.0998]
Infl -0.0554** [0.0233]
0.0277 [0.0180]
0.0279** [0.0136]
Intr -0.0554 [0.0233]
-0.1186*** [0.0352]
0.0321 [0.0297]
Conf -0.3749 [0.2659]
0.8309*** 0.2297
-0.4585*** [0.1471]
_Cons 122.6029*** [2.5454]
-30.1348*** [1.2490]
7.5019*** [1.5814]
Note: The numbers in brackets are Newey-West standard errors, and ***, ** and *
respectively denote p < 0.01, p< 0.05, and p < 0.1 level of significance.

54
The impact of the population growth rate is significant at the five-percent level in
the agriculture sector and at the five-percent level in the service sector; however, it is
insignificant for the industrial sector. However, the direction of the impact is negative in
the agriculture sector and positive in the industrial and service sectors. For example,
holding other factors constant, a 0.1 percent decrease in the population growth rate will
decrease employment in the agriculture sector by 0.036 percent and will increase
employment in the service sector by 0.023 percent. Unlike the impacts of education,
health, and population growth, the impact of growth in GDP on employment in all three
sectors is unexpectedly insignificant.
The impact of inflation is negative and significant at the five-percent level of
significance for the agriculture sector, but it is positive and significant at the five-percent
significance level for the service sector. It is positive and insignificant for the industrial
sector. Holding other factors fixed, a one-percentage point increase in inflation leads to a
decrease in employment in the agriculture sector by 0.055 percentage points; that same
change in inflation causes an increase in service sector employment by 0.028 percentage
points. Likewise, the impact of the interest rate on agriculture and service sector
employment is positive but insignificant while the impact on industrial sector is negative
and significant at the one-percent level. If the interest rate increases by one percentage
point, the industrial sector employment decrease by 0.1186 percentage points, holding
other independent variables constant. The impact of political conflict has negative in
service sectors employment and significant at one percent level. The impact of political
conflict is in agriculture sector employment is insignificant. However, the impact of
political conflict in industrial sector employment is surprisingly positive and significant

55
at one-percent level. Holding other dependent variables fixed, political conflict increases
the industrial sector employment by 0.832 percentage points, whereas the service sector
employment decrease 0.459 percentage points.
The regression results conclude the following three equations.
AgEmpt = 122.5965 - 0.6874 Educt - 67.715Healtht - 0.3604PopGrt -
0.0553 Inflt ---(1)
InEmpt = -30.1068 - 1.0358 Educt + 64.3151 Healtht - 0.1182Intrt +
0.8327 Conft ---(2)
SeEmpt = 7.5083 + 1.7232 Educt + 0.2337 PopGrt + 0.0279 Inflt -
0.4585 Conf ---(3)
Chapter Six: Conclusions
Summary of Findings
This study reveals the determinants of employment in Nepal for the period 1991-
2019. Over that period, education, health, population growth, interest rate, inflation and
political conflict have been significant determinants of sectoral employment when the
economy is divided into three major sectors of employment─agriculture, industry and
services. The education, health, population growth, and inflation are inversely related to
employment in agriculture whereas the impact of interest rate and political conflict is
insignificant. Likewise, for the industrial sector, the health and the political conflict
impact employment in a positive way, but the education, and the interest rate have a
negative effect. However, the inflation, and population growth are insignificant in the
industrial sector. For the service sector, the education, population growth, inflation and

56
political conflict affect positively, political conflict affect negatively and health and the
interest rate are statistically insignificant for that sector. Over the study period, the GDP
growth rate has no clear relationship with employment in any sector when other variables
are controlled for.
Recommendations
If the government of Nepal wants to transfer labor from agriculture and industry
to the service sector, expanding education (Mean years of schooling) in the country
seems a most promising way. This could be done by allocating greater resources to
education and schooling and through better implementation of ‘education for all’
programs. On the other hand, if an increase in employment in nonagricultural sectors is
given a greater priority, human capital investment in health seems highly desirable. By
increasing the access to health services for poorer and disadvantaged groups of people
through expansion of health network, the goal of higher life expectancy can be achieved.
Population growth and inflation positively increase service sector employment.
That means the government could use inflationary monetary policy to boost service
sector employment. However, the rupee exchange rate between Nepal and India is fixed
and the open-border policy the two countries have maintained makes manipulation of
inflation through policy in Nepal is not easy. India is too big a trading partner for Nepal
for an independent monetary policy. This should be a part of further research.
If the government wants to increase the industrial sector employment,
decreasing the interest ratemaybeagoodpolicy. It seems that investment in the
industrial sectors increases and employment in industrial sector also increases.
Withregardtoservices,asNepaltransitionstowardtheservicesector,thenegative

57
impactofpoliticalconflictontheservicesectorclearlyindicatesthatthestatemust
dobettertopreventaseveredomesticconflictfromre-emerging.
Limitation of the study
Major limitation of this study is an unavailability of data. Even though the wage
rate and the corruption index can have significant effect on employment, those variables
are excluded from the models due to the lack of sufficient data points. As more data
become available, replicating the model in future should be a more worthwhile exercise.
Likewise, FDI, and remittances are also removed from the model due to the
excessive multicollinearity problem in the model. However, I have included the GDP
growth in the model that can capture the effect of omitted variables and help to reduce the
potential bias. A slight reorientation of the model used here could examine more detailed
employment data across sub-sectors. This would enhance understanding of how the
pattern of inter-sectoral employment has been changing over time. Those are not
explored in this research and open it for the future research.
In particular, it could help to answer the question about whether sectors exhibiting
higher productivities, particularly manufacturing and parts of services, are gaining
employment shares and those having lower productivities (such as traditional agriculture)
are losing employment shares. Such a result would be in line with structural
transformation, which remains one of the goals of development in Nepal.

58
References
Asia Foundation (2017). Diagnostic Study of Local Governance in Federal Nepal 2017. The Asian Foundation Partnership in Nepal, Kathmandu.
Aurangzeb & Asif, K. (2013). Factors effecting unemployment: A cross country analysis. International Journal of Academic Research in Business and Social Sciences, 3(1), ISSN: 2222-6990.
Breitenfellner, A. & Hildebrandt, A. (2006). High employment with low productivity? The service sector as a determinant of economic development. Monetary Policy & the Economy, Q1/06.
Clark, A., & Oswald, A. (1994). Unhappiness and unemployment. The Economic Journal, 104(424), pp. 648-659. DOI:10.2307/2234639
Dalmar, M.S., Ali, A.Y.S., & Ali A.A. (2017). Factors affecting unemployment in Somalia. Journal of Economics and Sustainable Development, 8, pp. 200-210.
Dunga, S.H., & Sukhatane, M.B. (2014), Determinants of employment etatus and its relationship to poverty in Bophelong Township. Mediterranean Journal of Social Sciences, North West University South Africa. DOI: 10.5901/mjss.2014. v5 n21 p215
Ministry of Finance (2019). Nepal Economic Survey (2018/19). Government of Nepal, Ministry of Finance, Singh Durbar, Kathmandu.
Ezemenari, Kenechukwu M., and Joshi, N. K. (2019). Nepal Development Update: Envisioning a Future Data Ecosystem in Federal Nepal (English). Washington, D.C.: World Bank Group. Download Link: http://documents.worldbank.org/
Evans-Pritchard, J. (1985). Classical theory of employment. In Macroeconomics, Palgrave Macmillan, Londan. DOI : https:/doi.org/10.1007/978-1-349-17926-8_3
Gurung, G. (2004). An overview paper on overseas employment in Nepal, Series 4. International Labor Organization, Kathmandu, Nepal.
Human Development Report (2014), Sustaining Human Progress: Reducing Vulnerabilities and Building Resilience, United Nations Development Programme (UNDP).
International Labour Organization (2020). ILOSTAT database [database]. Available from https://ilostat.ilo.org/data/.
International Labor Organization (2020). Employment promotion in Nepal. Retrieved from: https://www.ilo.org/kathmandu/areasofwork/employment-promotion/lang--en/index.htm

59
IOM (2019). Nepal migration profile calls for upskilling of workers to compete in global job market. Retrived from: https://www.iom.int/news/nepal-migration-profile-calls-upskilling-workers-compete-global-job-market
Keynes, J. M. (1936). General theory of employment, interest and money. New York: Harcourt, Brace.
Khanal D.R. (2015). Employment challenges in Nepal: trends, characteristics and policy options for inclusive growth and development. South Asia Research Network (SARNET) Working Paper No.5, Institute for Human Development, Delhi.
Khare, S. & Slany, A. (2011). The dynamics of employment, the labour market. Employment. Working Paper No. 76. International Labor Organization, Geneva.
Kunwar, L. S. (2015). Emigration of Nepalese people and its impact. Economic Journal of Development Issues, 19(20), pp. 1-2.
McMillan, M., Rodrik, D., & Verduzco-Gallo, R. (2014). Globalization, structural change, and productivity growth with an update on Africa. World Development, 63, pp. 1–32.
Maqbool, S.M., Mahmood T., Sattar A., and Bhalli M.N. (2013) Determinants of unemployment: Empirical evidence of Pakistan. Pakistan Economic and Social Review, 51(2), pp. 191-208.
Mason, G. (2002). High skills utilisation under mass higher education: Graduate employment in service industries in Britain. Journal of Education and Work, 15(4), pp. 427-456. DOI: 10.1080/1363908022000023560
ADB. (2019). Macroeconomic update Nepal, 7(1), Kathmandu, Nepal.
Napier, T.L., Maurer, R.C. and Bryant, B.G. (1978). Factors affecting unemployment status among residents of a lesser developed region of Ohio. Research Bulletin # 1104, Ohio Agricultural Research and Development Center, Wooster, Ohio, USA.
Nepal Status Paper (2011). United Nations Conference on Sustainable Development 2012 (Rio+20) Synopsis. National Planning Commission, Government of Nepal, Singhadurbar, Kathmandu, Nepal.
NLFS (2018). Report on Nepal Labor Force Survey (2017/18). Central Bureau of Statistics, Nepal. Kathmandu, Nepal.
Nayark, P. & Chattarjee, B. (1986). Disguised unemployment in agriculture: a case study of rural Orissa. Indian Journal of Industrial Relations, 21(3), pp. 310-334.
Pigou, A. C. (1943). The classical stationary state. Economic Journal. 53 (212), pp. 343–351.

60
Plecher, H. (2020). Distribution of gross domestic product (GDP) across economic sectors Nepal 2018. Statistica, Retrived from: https://www.statista.com/statistics on June 8, 2020.
Riaz A. & Zafar, F. (2018) Determinants of Unemployment in Less Developed Countries. SHS Web of Conferences, 48 (01015). Retrived from: https://doi.org/10.1051/shsconf/20184801015
Roser, M. (2020). Employment in agriculture. OurWorldInData.org. Retrieved from: https://ourworldindata.org/employment-in-agriculture
Seddon, D. (2005). Nepal's dependence on exporting labor. Migration Policy Institute. Retrived from: https://www.migrationpolicy.org.
Shah, D.N. (2018). Minimum wages raised to Rs13450 per month. The Kathmandu Post, Published in July 2018. Retrieved from: https://kathmandupost.com/.
The Kathmandu Post (2018). Nepal’s employment rate highest in South Asia. The Kathmandu Post, Published in April 2018. Retrived from: https://kathmandupost.com
Umair, M. and Ullah, R. (2013). Impact of GDP and inflation on unemployment rate: A study of Pakistan economy in 2000-2010. International Review of Management and Business Research, 2(2).
UNCTAD (2011). Strategies for advancing development of the services sectors of Nepal. National Services Policy Review: Nepal, United Nations Conference on Trade and Development. United Nations, Geneva Switzerland.
Williams, R. (2015). Serial correlation, University of Notre Dame, https://www3.nd.edu/~rwilliam/
World Data Atlas (2020). Nepal agriculture value added per worker in constant price of 2010. Knoema. Retrived from: https://knoema.com/
Xuen, C.L., et al. (2017) Macroeconomic Factors Affecting Employment Rate in China [Unpublished bachelor’s thesis], Universiti Tunku Abdul Rahman.
Zeldin, W. (2016). Nepal: minimum wage increased. Global Labor Monitor, Library of Congress. Retrieved from: https://www.loc.gov/law/foreign-news.

61
Appendix 1
Table 1: Sectoral Share as a percentage (%) of GDP
Year Service Industry Agriculture
1991 33.55 16.44 42.66
2001 44.45 16.66 35.25
2011 45.29 14.11 34.98
2019 50.61 13.29 24.25
Source: World Bank, (July 1, 2020)
Appendix 2
Table 2: Share on GDP to Share on Employment Ratio in 2019
Sectors
Sectoral Contribution to
GDP (%) Sectoral share in Employment(%)
Share on GDP to Share on
Employment ratio
Agriculture 24.26 65.00 0.37
Industry 13.29 15.14 0.89
Service 50.61 19.86 2.55
Source: Ratio calculated by author (july 2020), Data from WDI.

62
Appendix 3
Table 3 : Correlation Matrix
AgEmp SeEmp IndEmp Educ GDPGr Infl Health Intr PopGr Conf
AgEmp 1.00
SeEmp -0.86 1.00
IndEmp -0.97 0.70 1.00
Educ -0.91 0.98 0.78 1.00
GDPGr -0.02 0.20 -0.07 0.12 1.00
Infl 0.18 -0.004 -0.25 -0.12 0.14 1.00
Health -0.99 0.83 0.97 0.88 -0.01 -0.19 1.00
Intr 0.73 -0.52 -0.76 -0.63 0.09 0.43 -0.72 1.00
PopGr 0.78 -0.56 -0.80 -0.64 0.19 0.05 -0.81 0.64 1.00
Conf 0.29 -0.61 -0.09 -0.51 -0.24 -0.37 -0.28 0.04 0.26 1.00
Source: Calculated by Author, July 2020
Correlation matrix shows the relation between the variables. Here the AgEmp and SeEmp
are negatively correlated of -0.86 and Industry and Agriculture sector employment also
negatively (-097) correlated. However, the industry sector employment and service sector
employment are positively related.