Embed Size (px)
Citation preview

Review of Quantitative Finance and Accounting, 12 (1999): 341±350
# 1999 Kluwer Academic Publishers, Boston. Manufactured in The Netherlands.
The Determinants of Debt Maturity:The Case of Bank Financing in Singapore
SHENG-SYAN CHEN
Department of Finance, College of Management, Yuan-Ze University, Taoyuan, TaiwanE-mail: [email protected]
KIM WAI HO
Division of Banking and Finance, Nanyang Business School, Nanyang Technological University,Singapore 639798
GILLIAN H.H. YEO
Division of Banking and Finance, Nanyang Business School, Nanyang Technological University,Singapore 639798
Abstract. This study presents important international evidence by examining the determinants of debt maturity
of listed ®rms in Singapore, a major ®nancial center in Asia. We focus on bank debt because it is the principal
source of ®nancing for most Singapore ®rms. We ®nd that consistent with the contracting-cost hypothesis, ®rms
with greater growth opportunities rely more heavily on short-term bank debt whereas larger ®rms are more likely
to use long-term bank debt. In contrast, we ®nd no strong support for either the tax or signaling hypotheses.
Key words: maturity, bank debt, contract-cost hypothesis, tax hypothesis, signaling hypothesis
JEL Classi®cation: G32, D82, E43
1. Introduction
The determinants of corporate debt maturity have recently been empirically examined in
Barclay and Smith (1995a), Guedes and Opler (1996), and Stohs and Mauer (1996).
Barclay and Smith ®nd that consistent with contracting cost hypothesis, ®rms with more
growth opportunities have less long-term debt while large ®rms and regulated ®rms have
more long-term debt. They ®nd little support for tax and signaling hypotheses. Guedes and
Opler report largely similar results when they examine the determinants of the maturity of
new issues of corporate debt. Stohs and Mauer examine the determinants of corporate debt
maturity using a maturity measure that incorporates detailed information about all of a
®rm's liabilities. They ®nd that proxies for signaling, tax, and maturity-matching
hypotheses are generally signi®cant determinants of debt maturity. However, their
empirical analysis is less supportive of agency cost hypothesis.
This study extends the above literature by using a unique data set collected from
®nancial statements of Singapore listed ®rms. Singapore is an important ®nancial center in
Asia, with many multinational banks operating there. Since results from existing studies
on corporate debt maturity may re¯ect the corporate environment in the U.S., our study
provides important international evidence. Further, since the number of listed ®rms in

Singapore is not large, manual collection of data is not prohibitively costly. Finally,
Singapore ®rms rely principally on bank borrowing, partly because of the relatively
underdeveloped bond market. This provides a unique setting to test the maturity of bank
debt.1 Since bank debt is a form of inside debt (see Fama (1985), James (1987) and others),
it would be interesting to know whether the determinants of its maturity are similar to
those of the maturity structure of all corporate liabilities.
Firms in Singapore are required to disclose separately in their ®nancial statements the
amount of bank debt that is repayable within twelve months from the balance sheet date
(as current liabilities) and the amount that is repayable after twelve months from the
balance sheet date (as long-term liabilities). We use the percentage of total bank borrowing
that is repayable within twelve months from the balance sheet date as our measure of
maturity.2 Our results are consistent with the contracting cost hypothesis: ®rms with higher
growth options tend to use more short-term bank borrowing while large ®rms tend to use
less short-term bank borrowing. We ®nd no strong support for the tax and signaling
hypotheses.
The remainder of the paper is organized as follows. Section 2 provides a brief discussion
of the determinants of the maturity of bank borrowing. Section 3 describes the data.
Empirical results are presented in Section 4. The ®nal section provides some concluding
remarks.
2. Determinants of the maturity of bank borrowing
The determinants of the maturity of bank borrowing may be examined in the context of
contracting cost, tax and signaling hypotheses. These theories and the independent
variables used in our study are brie¯y described in this section. These discussions are
dominated by demand-side considerations as information on supply-side behavior by
banks are not available due to the fact that banks in Singapore have to observe secrecy
codes.
2.1. Growth opportunities
Using shorter-term bank borrowing may mitigate the underinvestment problems (Myers
(1977)) and the Jensen and Meckling's (1976) asset substitution problem (Barnea, Haugen
and Senbet (1980)). The agency problems of underinvestment and asset substitution are
expected to be more severe for ®rms with more growth options in their investment
opportunity sets since they have more ¯exibility in their choice of future investments
(Titman and Wessels (1988) and Barclay and Smith (1995a, 1995b)). Hence, ®rms with
more growth options in their investment opportunity sets should use shorter-term bank
borrowing.
Stulz (1990) and Hart and Moore (1990) provide another explanation for the
relationship between growth opportunities and the maturity of bank borrowing. They
suggest that long-term borrowing is more effective in limiting managerial discretion in
342 CHEN, HO AND YEO
making bad investments. Hence, ®rms with few growth options should use more long-term
bank borrowing.
Following Barclay and Smith (1995a, 1995b) and others, we employ the ratio of the
market value of the ®rm's assets to their book value as a proxy for growth options in the
®rm's investment opportunity set. We expect that the higher the ®rm's market-to-book
ratio, the higher will be the proportion of short-term versus long-term bank borrowing. We
also use depreciation as a percentage of ®rm value and earnings-price ratio as alternative
proxies for growth opportunities. We expect ®rms with more depreciation expenses and
higher earnings-price ratio to have more tangible assets and fewer growth options in their
investment opportunity sets, and hence to use less short-term bank borrowing.3
2.2. Firm size
On average, small ®rms tend to have more growth options than large ®rms (Denis (1994)
and others). If ®rm size is positively correlated with the measurement error in the proxy
variable used to measure the ®rm's investment opportunity set, then the contracting-cost
hypothesis suggests that smaller ®rms will use more short-term bank borrowing (Barclay
and Smith (1993)).
Long-term bank borrowing has higher monitoring costs than short-term bank borrowing
because the bank's bargaining position is weakened with the longer maturity (Fama
(1985)). Larger ®rms are more able to take advantage of the scale economies by reducing
the per unit monitoring costs because they tend to borrow larger loans (Reed and Gill
(1989)). Hence, this contracting-cost argument suggests that larger ®rms will use more
long-term bank borrowing.
2.3. Firm quality
The signaling hypothesis suggests that high quality (undervalued) ®rms will want to use
more short-term borrowing while low quality (overvalued) ®rms will want to use more
long-term borrowing (Flannery (1986) and Kale and Noe (1990)). As in Barclay and Smith
(1995a, 1995b), we use the ®rm's abnormal future earnings to measure ®rm quality. High
quality ®rms are likely to have positive future abnormal earnings while low quality ®rms
are likely to have negative future abnormal earnings. We expect ®rms with higher
abnormal future earnings to use more short-term bank borrowing.
2.4. Term structure
Brick and Ravid (1985) suggest that if the term structure of interest rates is upward
sloping, the use of long-term debt reduces the ®rm's expected tax liability and hence
enhances the ®rm's value because long-term debt pays more interest in initial periods and
less interest in later periods than short-term debt.4 On the other hand, if the term structure
of interest rates is downward sloping, the use of short-term debt increases ®rm value. Brick
THE DETERMINANTS OF DEBT MATURITY 343

and Ravid's analysis suggests that ®rms use less short-term bank borrowing when the term
structure of interest rates is upward sloping and vice-versa.5
3. Data and summary statistics
Data on short- and long-term bank borrowing are collected from available ®nancial
statements of ®rms listed on the Stock Exchange of Singapore between 1983 and 1991.
Firms from the ®nance industry (i.e. banks, ®nancial service and insurance companies) are
excluded. To ensure no survivorship bias, ®rms which have merged or delisted during the
sample period as well as ®rms which were newly listed during the same period are also
included. The ®nal sample of ®rms is 128, representing approximately 70% of the number
of Singapore listed ®rms on the main trading section of the Stock Exchange of Singapore
at the end of 1991.6
The summary statistics are shown in Table 1. The amounts of short-term bank
borrowing for a ®rm are the average book values of short-term bank borrowing (i.e. bank
borrowing due within one year) as classi®ed under current liabilities in the balance sheet
Table 1. Summary statistics for short- and long-term bank borrowing for Singapore ®rms during the period 1983
to 1991
Variable
Number of
Observations Mean Median
Standard
Deviation
Interquartile
Range
Amount of short-term
bank borrowing
Singapore thousands 128 29,944 12,556 58,183 28,218
US thousands 14,781 6,198 28,720 13,929
Amount of long-term
bank borrowing
Singapore thousands 128 24,610 1,519 77,653 14,669
US thousands 12,148 750 38,330 7,241
Total amount of bank
borrowing
Singapore thousands 128 54,554 19,237 127,941 47,841
US thousands 26,928 9,496 3,153 23,615
Percentage of total bank
borrowing that is
short-term 128 80% 88% 22% 33%
Notes: The amounts of short- and long-term bank borrowing for a ®rm are respectively the average book
values of short-term bank borrowing under current liabilities and long-term bank borrowing under long-term
liabilities as disclosed in the ®nancial statements of the ®rm over the 1983 through 1991 time period. The
total amount of bank borrowing is the sum of average book values of short- and long-term bank borrowing.
The percentage of total bank borrowing that is short-term for a ®rm is measured by the mean ratio of the
amount of short-term bank borrowing to the total amount of bank borrowing over the same time period.
344 CHEN, HO AND YEO

over the years 1983 through 1991. The amounts of long-term bank borrowing are the
average book values of long-term bank borrowing (i.e. bank borrowing due in more than
one year) as classi®ed under long-term liabilities in the ®nancial statements over the same
period. The total amount of bank borrowing is the sum of the average book values of short-
and long-term bank borrowing. The percentage of total bank borrowing that is short-term
for a ®rm is the mean ratio of the amount of short-term bank borrowing to the total amount
of bank borrowing over the same time period. The mean (median) percentage of total bank
borrowing that is short-term is 80% (88%). The relatively high average percentage of bank
borrowing that is short-term is consistent with the observation in Fama (1985) that on
average bank borrowing is of shorter term maturity. However, there is also considerable
cross-sectional variation in the maturity of bank borrowing in our sample. The standard
deviation is 22% while the interquartile range is 33%.
Data on explanatory variables are collected from ®nancial statements of the sample
®rms and the Stock Exchange of Singapore. Market-to-book ratio is measured as the mean
ratio of the market value of the ®rm's assets to the book value of its assets, where the
market value of assets is estimated as the book value of assets minus the book value of
common equity plus the market value of common equity (as in Barclay and Smith
(1995a)). Firm size is measured as the mean natural logarithm of the estimated market
value of the ®rm.7 Abnormal future earnings is measured as the mean level of annual
abnormal earnings where abnormal earnings in year t� 1 is de®ned as earnings per share
in year t� 1 (excluding extraordinary items and adjusted for any change in shares
outstanding) minus earnings per share in year t, scaled by share price in year t. Term
structure is measured as the difference between the 5-year Singapore government bond
yield and the 3-month Singapore government bond yield at the ®rms' ®scal year-end. Data
on government bond yields are obtained from the Monthly Statistical Bulletin of the
Monetary Authority of Singapore and the Singapore Stock Exchange Journal.8
4. Empirical results
4.1. Cross-sectional regressions
Results of our base-case cross-sectional OLS regressions are reported in Table 2.9 Models
(1) to (4) are univariate regressions involving each of the four variables: market-to-book
ratio, log of ®rm value, abnormal earnings and term structure. Model (5) combines all four
variables in one regression.10 The t-values are computed with heteroskedasticity-consistent
standard errors if tests reject homoskedasticity at the 10% signi®cance level (White
(1980)). The number of observations varies across regressions because of data availability.
Consistent with the contracting-cost hypothesis, the coef®cient on the market-to-book
variable is positive and signi®cant at the 5% level using a one-tailed test. This evidence
suggests that ®rms with higher market-to-book ratio (i.e. ®rms with more growth options)
use more short-term bank borrowing.
The coef®cient on the log of ®rm value is negative and signi®cant at the 1% level using
a one-tailed test, suggesting that larger ®rms tend to use longer-term bank borrowing. This
evidence is consistent with the contracting-cost hypothesis.
THE DETERMINANTS OF DEBT MATURITY 345

The results on the abnormal earnings provide little support for the hypothesis that ®rms
use the maturity of bank borrowing to signal their ®rm quality. The term structure variable
is also not signi®cant, suggesting that taxes may have no material effect on the maturity of
bank borrowing in our sample.11
Model (6) in Table 2 includes industry dummies in the base-case regression. The
industry dummies (excluding the properties industry) are based on the industry
classi®cation by the Singapore Stock Exchange. The F-statistic for the joint signi®cance
of the industry dummies is insigni®cant at the 5% level. Results on other regression
Table 2. Cross-sectional regressions of the percentage of total bank borrowing that is short-term for Singapore
®rms from 1983 to 1991
Independent PredictedModel Speci®cation
Variable Sign (1) (2) (3) (4) (5) (6)
Intercept 0.725 1.463 0.798 0.777 1.358 1.189
(17.81)a (9.05)a (33.85)a (9.67)a (5.00)a (4.15)a
Market-to-book ratio � 0.054 0.057 0.049
(2.24)b (2.32)b (1.99)b
Log of ®rm value ÿ ÿ 0.055 ÿ 0.060 ÿ 0.052
(ÿ 4.02)a (ÿ 3.39)a (ÿ 2.86)a
Abnormal earnings � ÿ 0.257 0.192 0.033
(ÿ 0.39) (0.30) (0.05)
Term structure ÿ 1.106 3.640 3.124
(0.33) (0.64) (0.55)
F-Statistic for
industry dummies
[1.85]
Adjusted R2 0.04 0.08 ÿ 0.01 ÿ 0.01 0.12 0.13
F-Statistic 6.186 12.204 0.149 0.073 4.431 3.620
P-Value 0.014 0.001 0.700 0.787 0.002 0.003
Number of observations 123 124 106 128 105 105
a,b represent 1% and 5% signi®cance levels using a one-tailed test, respectively.
Notes: The dependent variable is the percentage of total bank borrowing that is short-term for a ®rm,
measured by the mean ratio of the amount of short-term bank borrowing to the total amount of bank
borrowing from 1983 to 1991. The market-to-book ratio is the mean ratio of the market value of the ®rm's
assets to their book value, where the market value of assets is estimated as the book value of assets minus
the book value of common equity plus the market value of common equity. Log of ®rm value is the mean
natural logarithm of the estimated market value of the ®rm (in Singapore thousands). Abnormal earnings is
the mean level of annual abnormal earnings, where abnormal earnings in year t� 1 is de®ned as earnings
per share in year t� 1 (excluding extraordinary items and adjusted for any changes in shares outstanding)
minus earnings per share in year t, divided by the share price in year t. The term structure of interest rates is
the mean difference between the ®ve-year Singapore government bond yield and the 3-month Singapore
government bond yield at the ®rms' ®scal year-end. The industry dummy variables (excluding the properties
industry) are based on the industry classi®cation by Singapore Stock Exchange. The t-values in parentheses
are computed with heteroskedasticity-consistent standard errors if tests reject homoskedasticity at the 10%
signi®cance level (White (1980)). The F-statistic for the industry dummies (in brackets) test whether the
industry dummies are jointly different from zero. The number of observations varies across regressions
because of data availability.
346 CHEN, HO AND YEO
coef®cients are qualitatively unchanged. Thus, ®rm-speci®c characteristics (such as size
and market-to-book ratio) are more important than industry-speci®c effects.
4.2. Additional tests
The cross-sectional regressions reported in Table 2 preserve the dispersion across ®rms,
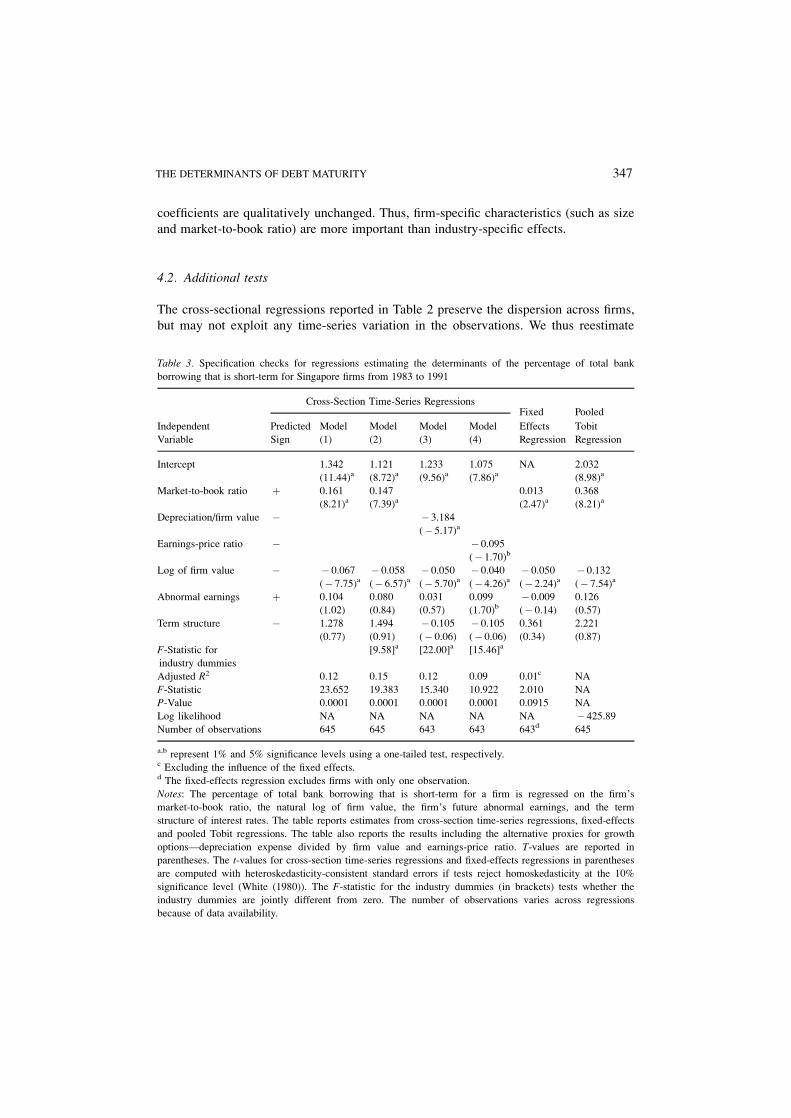
but may not exploit any time-series variation in the observations. We thus reestimate
Table 3. Speci®cation checks for regressions estimating the determinants of the percentage of total bank
borrowing that is short-term for Singapore ®rms from 1983 to 1991
Cross-Section Time-Series RegressionsFixed Pooled
Independent Predicted Model Model Model Model Effects Tobit
Variable Sign (1) (2) (3) (4) Regression Regression
Intercept 1.342 1.121 1.233 1.075 NA 2.032
(11.44)a (8.72)a (9.56)a (7.86)a (8.98)a
Market-to-book ratio � 0.161 0.147 0.013 0.368
(8.21)a (7.39)a (2.47)a (8.21)a
Depreciation/®rm value ÿ ÿ 3.184
(ÿ 5.17)a
Earnings-price ratio ÿ ÿ 0.095
(ÿ 1.70)b
Log of ®rm value ÿ ÿ 0.067 ÿ 0.058 ÿ 0.050 ÿ 0.040 ÿ 0.050 ÿ 0.132
(ÿ 7.75)a (ÿ 6.57)a (ÿ 5.70)a (ÿ 4.26)a (ÿ 2.24)a (ÿ 7.54)a
Abnormal earnings � 0.104 0.080 0.031 0.099 ÿ 0.009 0.126
(1.02) (0.84) (0.57) (1.70)b (ÿ 0.14) (0.57)
Term structure ÿ 1.278 1.494 ÿ 0.105 ÿ 0.105 0.361 2.221
(0.77) (0.91) (ÿ 0.06) (ÿ 0.06) (0.34) (0.87)
F-Statistic for
industry dummies
[9.58]a [22.00]a [15.46]a
Adjusted R2 0.12 0.15 0.12 0.09 0.01c NA
F-Statistic 23.652 19.383 15.340 10.922 2.010 NA
P-Value 0.0001 0.0001 0.0001 0.0001 0.0915 NA
Log likelihood NA NA NA NA NA ÿ 425.89
Number of observations 645 645 643 643 643d 645
a,b represent 1% and 5% signi®cance levels using a one-tailed test, respectively.c Excluding the in¯uence of the ®xed effects.d The ®xed-effects regression excludes ®rms with only one observation.
Notes: The percentage of total bank borrowing that is short-term for a ®rm is regressed on the ®rm's
market-to-book ratio, the natural log of ®rm value, the ®rm's future abnormal earnings, and the term
structure of interest rates. The table reports estimates from cross-section time-series regressions, ®xed-effects
and pooled Tobit regressions. The table also reports the results including the alternative proxies for growth
optionsÐdepreciation expense divided by ®rm value and earnings-price ratio. T-values are reported in
parentheses. The t-values for cross-section time-series regressions and ®xed-effects regressions in parentheses
are computed with heteroskedasticity-consistent standard errors if tests reject homoskedasticity at the 10%
signi®cance level (White (1980)). The F-statistic for the industry dummies (in brackets) tests whether the
industry dummies are jointly different from zero. The number of observations varies across regressions
because of data availability.
THE DETERMINANTS OF DEBT MATURITY 347

Models (5) and (6) in Table 2 using cross-section time-series regressions, in which ®rm-
year observations for each variable are used. The results are reported in Models (1) and (2)
in Table 3. Generally, the results are similar to those reported earlier.12 The evidence again
supports the contracting-cost hypothesis but does not support the tax and signaling
hypotheses.
Although the F-statistic for industry dummies in Model (2) in Table 3 indicates that they
are jointly different from zero, the adjusted R2 increases marginally. Hence, industry-
speci®c effects are not as important as ®rm-speci®c characteristics.
We also reestimate Model (1) using (1) ®xed-effects regressions where the ®rm-speci®c
time-series mean for each variable is subtracted from each observation, and ®rms with
only one observation are excluded; and (2) appropriate censored (Tobit) estimator. As
shown in Table 3, there is no basic change in the results when these techniques are used.
To check the robustness of our results to alternative proxies for growth options, we
reestimate Model (2) in Table 3 by using depreciation as a percentage of ®rm value and
earnings-price ratio, and the results are reported in Models (3) and (4) respectively in the
same table. The coef®cients on the depreciation as a percentage of ®rm value and
earnings-price ratio are signi®cant at the 1% and 5% level respectively using a one-tailed
test, and their signs are as predicted by the contracting-cost hypothesis. With the exception
in Model (4) that the abnormal earnings variable becomes signi®cantly positive when
earnings-price ratio is used, all other coef®cients are qualitatively similar. The exception
noted in Model (4) suggests potential multicollinearity between abnormal earnings and
earnings-price ratio.13,14
5. Conclusions
This paper provides important international evidence by examining the determinants of
debt maturity of listed ®rms in Singapore, a major ®nancial center in Asia. Since
Singapore ®rms use mainly bank ®nancing, this study focuses on the maturity structure of
bank debt. We ®nd that consistent with the contracting-cost hypothesis, ®rms with higher
growth options in their investment opportunity sets use more short-term bank borrowing
whereas large ®rms tend to use more long-term bank borrowing. We do not ®nd strong
support for tax and signaling hypotheses in our sample ®rms.
Acknowledgments
The authors wish to thank Cheng-few Lee (the Editor), Karlyn Mitchell, two anonymous
referees, and seminar participants at the 1996 FMA meetings for helpful comments and
suggestions. All remaining errors are ours.
Notes
1. COMPUSTAT does not provide details on the maturity structure of bank debt.
2. Barclay and Smith (1995a) use the percentage of the ®rm's total debt that has a maturity of more than three
years as a measure of the maturity structure of a ®rm's debt. Their results are similar using the percentage of
348 CHEN, HO AND YEO

debt maturing in more than one, two, four, or ®ve years. Stohs and Mauer (1996) measure the debt maturity of
the entire liability structure of the ®rm. Due to data limitation, we cannot explore alternative measures of debt
maturity.
3. In Singapore, accounting practices follow closely those recommended by the International Accounting
Standards Committee. For example, intangibles such as internally-generated goodwill and brands are
generally not capitalized as assets.
4. Interest expense is also deductible in Singapore as an expense for the computation of corporate tax liability.
5. Boyce and Kalotay's (1979) tax model also shows that an upward sloping term structure of interest rates
implies that long-term debt is optimal. However, Lewis (1990) argues that taxes have no effect on optimal
debt maturity if optimal leverage and debt maturity structure are determined simultaneously. Further, Brick
and Ravid (1991) demonstrate that in the presence of stochastic interest rates, even if the term structure of
interest rates is decreasing, long-term debt may still be optimal.
6. The number of Singapore listed ®rms at the end of 1991 is the highest in the sample period. Of the full
sample, 11 ®rms have issued public debt during the sample period. Our results are similar when the 11 ®rms
are excluded from our analysis.
7. Sales and number of employees are possible alternative measures of size. However, sales may be in¯uenced
by different accounting policies on revenue recognition by sample ®rms, especially between ®rms in different
industries. For example, sales (or revenue) of property ®rms depend very much on whether the percentage-of-
completion method or the completed contract method is used. Number of employees is not publicly available
for most listed ®rms as there is no compulsory disclosure of such information.
8. The longest term government bond yield published in the of®cial Monthly Statistical Bulletin of the Monetary
Authority of Singapore is the ®ve-year yield. Data from this source is only available from May 1987 when the
Singapore government securities market was restructured to model after the United States Treasury bond
market. Prior to May 1987, the month-end yields for government securities are published in the SingaporeStock Exchange Journal. As there is no exact ®ve-year yield in this data source, we adopt a simple linear
interpolation using the yields of the two bonds with maturity just before and after ®ve years.
9. To prevent extreme observations from having an undue in¯uence on the regression results, we eliminate
outliers that fall beyond 5 standard deviations from the mean of each variable used in the regressions. We also
reestimate these regressions using the appropriate censored (Tobit) estimator. The results are similar.
10. Log of ®rm value may interact with market-to-book ratio in this model. However, results are similar whether
these variables are tested jointly or separately.
11. The lack of support for the tax hypothesis may be due to the fact that the dependent variable measures the
®rm's average bank debt maturity for the entire sample period and thus may not capture any change in the
debt maturity structure of the ®rm if there is a sudden yield curve shift. Hence, in Section 4.2 we re-estimate
our models by cross-section time series regressions.
12. The differences in coef®cients and R2s between Tables 2 and 3 may suggest that some nonstationarities or
multilinearities are submerged in averaging.
13. Using a regulation dummy variable which equals to 1 for regulated ®rms and 0 otherwise, we have also tested
the hypothesis that ®rms in regulated industries use longer-term bank borrowing than unergulated ®rms
(Smith (1986)). Though not reported, our results are consistent with the hypothesis. However, we are careful
in drawing any conclusion as there are only 5 ®rms in industries considered as regulated (transportation,
publishing and printing).
14. Though results are not reported, Diamond's (1991, 1993) liquidity hypothesis is also tested using a quadratic
form for the credit risk proxy. As comprehensive credit rating information is not available in Singapore, we
use three alternative proxies: (i) (mean interest expenses minus mean earnings before interests and tax)
divided by standard deviation of earnings (Marsh (1982)); (ii) standard deviation of the percentage change in
operating income (Titman and Wessels (1988)); and (iii) the ®rm's stock return standard deviation times its
equity-to-value ratio (Barclay and Smith (1995a)). We ®nd little support for the hypothesis, possibly because
of the inadequacy of our proxy variables.
THE DETERMINANTS OF DEBT MATURITY 349

References
Barclay, M.J. and C.W. Smith, Jr., ``The Maturity Structure of Corporate Debt.'' Working paper, University of
Rochester, (1993).
Barclay, M.J. and C.W. Smith, Jr., ``The Maturity Structure of Corporate Debt.'' Journal of Finance 50, 609±631,
(1995a).
Barclay, M.J. and C.W. Smith, Jr., ``The Priority Structure of Corporate Debt.'' Journal of Finance 50, 899±917,
(1995b).
Barnea, A., R.A. Haugen, and L.W. Senbet, ``A Rationale for Debt Maturity Structure and Call Provisions in the
Agency Theoretic Framework.'' Journal of Finance 35, 1223±1234, (1980).
Boyce, W.M. and A.J. Kalotay, ``Tax Differentials and Callable Bonds.'' Journal of Finance 34, 825±838, (1979).
Brick, I.E. and S.A. Ravid, ``On the Relevance of Debt Maturity Structure.'' Journal of Finance 40, 1423±1437,
(1985).
Brick, I.E. and S.A. Ravid, ``Interest Rate Uncertainly and the Optimal Debt Maturity Structure.'' Journal ofFinancial and Quantitative Analysis 26, 63±81, (1991).
Denis, D.J., ``Investment Opportunities and the Market Reaction to Equity Offerings.'' Journal of Financial andQuantitative Analysis 29, 159±177, (1994).
Diamond, D.W., ``Debt Maturity Structure and Liquidity Risk.'' Quarterly Journal of Economics 106, 709±737,
(1991).
Diamond, D.W., ``Seniority and Maturity of Debt Contracts.'' Journal of Financial Economics 33, 341±368,
(1993).
Fama, E.F., ``What's Different about Banks?'' Journal of Monetary Economics 15, 29±36, (1985).
Flannery, M.J., ``Asymmetric Information and Risky Debt Maturity Choice.'' Journal of Finance 41, 19±37,
(1986).
Guedes, J. and T. Opler, ``The Determinants of the Maturity of New Corporate Debt Issues.'' Journal of Finance51, 1809±1834, (1996).
Hart, O. and J. Moore, ``Default and Renegotiation: A Dynamic Model of Debt.'' Working paper, MIT, (1990).
James, C., ``Some Evidence on the Uniqueness of Bank Loans.'' Journal of Financial Economics 19, 217±235,
(1987).
Jensen, M.C. and W. H. Meckling, ``Theory of the Firm: Managerial Behavior, Agency Costs and Ownership
Structure.'' Journal of Financial Economics 3, 305±360, (1976).
Kale, J.R. and T. H. Noe, ``Risky Debt Maturity Choice in a Sequential Equilibrium.'' Journal of FinancialResearch 13, 155±165, (1990).
Lewis, C.M., ``A Multiperiod Theory of Corporate Financial Policy under Taxation.'' Journal of Financial andQuantitative Analysis 25, 25±43, (1990).
Marsh, P., ``The Choice between Equity and Debt: An Empirical Study.'' Journal of Finance 37, 121±144,
(1982).
Myers, S.C., ``Determinants of Corporate Borrowing.'' Journal of Financial Economics 5, 147±175, (1977).
Reed, E.W. and E. K. Gill, Commercial Banking, Englewood Cliffs, New Jersey: Prentice Hall, 1989.
Smith, C.W., ``Investment Banking and the Capital Acquisition Process.'' Journal of Financial Economics 15, 3±
29, (1986).
Stohs, M. H. and D. C. Mauer, ``The Determinants of Corporate Debt Maturity Structure.'' Journal of Business69, 279±312, (1996).
Stulz, R.M., ``Managerial Discretion and Optimal Financing Policies.'' Journal of Financial Economics 26, 3±28,
(1990).
Titman, S. and R. Wessels, ``The Determinants of Capital Structure Choice.'' Journal of Finance 43, 1±20,
(1988).
White, H., ``A Heteroskedasticity-Consistent Covariance Matrix Estimator and a Direct Test for
Heteroskedasticity.'' Econometrica 48, 817±838, (1980).
350 CHEN, HO AND YEO


![Government Debt Maturity Structure, Fiscal Policy, and Default · Government Debt Maturity Structure, Fiscal Policy, and Default∗ SergiiKiiashko† November22,2017 [Linktolatestdraft]](https://img.dokumen.tips/doc/110x75/6050d317a7955115112203b2/government-debt-maturity-structure-fiscal-policy-and-default-government-debt-maturity.jpg)


