Embed Size (px)
Citation preview
THE DETERMINANTS OF COMMERCIAL BANKS PROFITABILITY IN
KENYA (1983-2012)
BY
OTIENO MAURICE OWITI
X50/61553/2010
A RESEARCH PAPER SUBMITTED TO THE SCHOOL OF ECONOMI CS,
UNIVERSITY OF NAIROBI, IN PARTIAL FULFILLMENT OF TH E
REQUIREMENTS FOR THE AWARD OF THE DEGREE OF MASTER OF
ARTS IN ECONOMICS
NOVEMBER, 2013

ii
DECLARATION
This research paper is my original work and has not been submitted for any award in any
other university.
Signed: ………………………….…Date………….………………………….…………..
Otieno Maurice Owiti
Reg. No. X50/61553/2010
This research project has been submitted with our approval us University Supervisors.
Signed:…………………………….. Date ………………………………………………..
Dr. Martine Oleche
Signed:…………………………………. Date …………………………………………….
Mr. Walter Ochoro

iii
DEDICATION
This research paper is dedicated to my loving mother, Ms Sylvia Mbuya. You gave me
the drive and discipline to handle any hustles in life with enthusiasm and determination.

iv
ACKNOWLEDGEMENT
My gratitude goes to the Almighty God for giving me life, strength and grace throughout
my undertakings and studies.
I am greatly indebted to my supervisors Dr. Oleche and Mr. Ochoro for their constant
encouragement and guidance throughout the period that I undertook on this project paper.
I extend my appreciation to the University of Nairobi, School of Economics for giving
me the opportunity, facilities and resources to pursue my Masters Degree in Economics.
I am sincerely grateful to my parents, Mr. Henry Owiti and Mrs. Sylvia Owiti for their
financial, moral and spiritual support with love and endurance during my studies; and to
my siblings Dorothy, Lencer, Lilian, Susan and Hosborn for their encouragement.
Special thanks to my wife Alice Abuyah and daughter Jada for their love, patience,
endurance and understanding throughout my busy study life.

v
TABLE OF CONTENTS
DECLARATION ................................................................................................................ ii
DEDICATION................................................................................................................... iii
ACKNOWLEDGEMENT ................................................................................................. iv
TABLE OF CONTENTS.................................................................................................... v
LIST OF ABBREVIATIONS............................................................................................. x
ABSTRACT....................................................................................................................... xi
CHAPTER ONE ............................................................................................................... 1
INTRODUCTION............................................................................................................. 1
1.1 Background of the study ............................................................................................... 1
1.1.1 Structure Performance of the Kenyan Banking Sector since 1980s to 2012 ....... 3
1.1.2. Bank Branches and Automated Teller Machines (ATMs) ................................. 5
1.1.3. Technology and Banking in Kenya Today ......................................................... 7
1.2 Problem Statement and Study Background .................................................................. 8
1.3 Research Objectives.................................................................................................... 10
1.4 Research Questions..................................................................................................... 11
1.5 Justification of the Study ............................................................................................ 11
CHAPTER TWO ............................................................................................................ 12
LITERATURE REVIEW .............................................................................................. 12
2.1 Introduction to Literature Review............................................................................... 12
2.2 Empirical Evidence..................................................................................................... 13
2.3 Bank Specific Determinants and Their Effects on Profitability ................................. 14
2.3.1 Capital Adequacy............................................................................................... 14
2.3.2 Assets Quality .................................................................................................... 16
2.3.3 Liquidity Management....................................................................................... 17
2.3.4 Cost Efficiency................................................................................................... 19
2.4 Macroeconomic Determinants and Their Effects on Profitability.............................. 20
2.4.1 Economic growth (GDP) ................................................................................... 20
vi
2.4.2 Inflation.............................................................................................................. 20
2.4.3 Interest Rates...................................................................................................... 21
2.5 Theories and Models of Bank Profitability................................................................. 21
2.6 Study Limitation ......................................................................................................... 24
CHAPTER THREE........................................................................................................ 25
RESEARCH METHODOLOGY ..................................................................................25
3.0 Introduction................................................................................................................. 25
3.1 Conceptual Framework............................................................................................... 25
3.2 Model Specification .................................................................................................... 26
3.3 Definition of Variables ............................................................................................... 27
3.4 Estimation Method...................................................................................................... 29
CHAPTER FOUR........................................................................................................... 31
EMPIRICAL RESULTS AND FINDINGS.................................................................. 31
4.0 Introduction................................................................................................................. 31
4.1 Descriptive Statisticsa and Normality Test................................................................. 31
4.2 Unit Root Test............................................................................................................. 32
4.3 Cointegration analysis................................................................................................. 35
4.4 Trends in the Variables ............................................................................................... 36
4.5 Regression Results for the Model ............................................................................... 39
4.6 Diagnostic Tests.......................................................................................................... 40
4.7 Discussion of Results and Findings ............................................................................ 41
CHAPTER FIVE ............................................................................................................ 44
CONCLUSION AND POLICY RECOMMENDATIONS .............. ........................... 44
5.1 Conclusion .................................................................................................................. 44
5.2 Policy Implications ..................................................................................................... 45
REFERENCES.................................................................................................................46

vii
LIST OF FIGURES
Figure 3.1: Diagrammatic Representation of the Relationship between Variables ...........25
Figure 4.1 CUSUM Test.…………………………………………………………………………41

viii
LIST OF GRAPHS
Graph 4.4.1: Trends in the Return on Assets .....................................................................36
Graph 4.4.2: Trends in the Bank Specific Factors .............................................................37
Graph 4.4.3: Trends in the Macroeconomic Factors..........................................................38

ix
LIST OF TABLES
Table 1.1: Ownership structure and Asset Base of the Financial Institutions .....................4
Table 1.2: Branch Network per Province ............................................................................5
Table 1.3: ATM Network ....................................................................................................6
Table 3.1: Operational Framework ....................................................................................30
Table 4.1: Normality Test Results .....................................................................................32
Table 4.2: Summary of ADF Unit Root Test Results after Differencing ..........................33
Table 4.3: Summary of ADF Unit Root Test Results after Differencing ..........................34
Table 4.4: ADF Test for Cointegration..............................................................................35
Table 4.5: Model’s Regression Estimates..........................................................................39
Table 4.6: Heteroscedasticity Tests ...................................................................................40

x
LIST OF ABBREVIATIONS
ASQ - Asset Quality
CAMEL – Capital adequacy; Asset quality; Management cost; Efficiency; and Liquidity
CAP - Capital Adequacy
CBK - Central Bank of Kenya
CEF - Cost Efficiency
ES - Efficiency Structure
GDP - Gross Domestic Product
KNBS - Kenya National Bureau of Statistics
LIM - Liquidity Management
MP - Market Power
NPL - Non-Performing Loans
OLS-Ordinary Least Squares
RMP - Relative Market Power
ROA - Return on Assets
ROE - Return on Equity
SCP - Structure Conduct Performance
SEE - South Eastern Europe
xi
ABSTRACT
This research paper examines some of the key determinants of commercial banks’
profitability in Kenya. The first objective of the study was to determine the effects of
bank-specific factors on the profitability of commercial banks in Kenya. The second
objective was to determine the effects of macroeconomic factors on profitability of
commercial banks in Kenya. The study employed a time series data analysis technique to
achieve the above objectives. The study used data from annual Bank Survey Reports
from CBK and Economic Survey Reports from KNBS for the period 1983 to 2012. A
multiple linear regression model was employed to obtain the desired results. The analysis
showed that both bank-specific factors and macroeconomic factors have statistically
significant impact on profitability. Based on the results and findings, the study
recommends policies that would encourage capitalization of banks, reduce costs of their
operations, and minimize on the credit risk and liquidity holding while harmonizing the
long term effects of the macroeconomic factors. The study therefore, provides additional
knowledge about Kenyan commercial banking sector profitability that is important for
policy making.
1
CHAPTER ONE
INTRODUCTION
1.1 Background of the study
Bank profitability plays an important role in both the developed and underdeveloped
economies in terms of giving financial means as well as advice. Therefore, impressive
profit figures not only persuade depositors to supply their funds but also help reassure
stakeholders. Hence, bank managers’ main objective is to maximize profits, as an
essential business rule.
In studying bank profitability, appraisal can be done at both micro and macro levels
within the economy (Aburime, 2009). At micro level, profit is the essential prerequisite
of a competitive banking institution and the cheapest source of funds. While at macro
level, a sound and profitable banking sector is better able to withstand negative shocks
and contribute to the stability of the financial system. Due to the importance of bank
profitability at the micro and macro levels, both researchers, academics, bank managers
and regulatory authorities have been pushed to develop considerable interest on the
factors that determine profitability in the banking sector.
The approach assumes that profitability is explained by both bank-specific factors like
capital adequacy, asset quality, liquidity management and cost efficiency; and by
macroeconomics factors like economic growth, real interest rates and inflation. These
will form the basis for analysis of profitability of commercial banks in the Kenyan
context.
Kenya’s banking sector has evolved over time. The inherent weaknesses in the banking
system became apparent in the late 1980’s and manifested themselves in the form of a
controlled and fragmented financial system, differences in regulations governing banking
and non-financial intermediaries, lack of autonomy, weak supervisory capacity of the
commercial banks and weak government policies which contributed to accumulation of
non-performing loans, loss of control over money supply by the Central Bank and non-
2
compliance by financial institutions to regulatory requirements of the banking act of 1989
among other factors (CBK, 2001).
In the early 1990’s, the government embarked on reforms designed to promote a more
efficient and market oriented financial system; improve mobilization, allocation and
utilization of financial resources; increase efficiency of the process of financial
intermediation; and develop more flexible instruments of monetary policy. These reform
programs focused on the policy, legal and institutional framework of the sector (Kamau,
2009).
Liberalization of the financial sector in Kenya has led to tremendous changes. It ushered
in stiff competition from SMFIs and SACCOs which opened front-office operations
providing services very much similar to those of the commercial banks and NBFIs while
some also converting to commercial banks.
Financial crisis of the 2000-2003 affected the banking profitability due to poor
performance and dwindling lending opportunities. Banks were forced to diversify to non-
balance sheet based income streams. Attracting these forms of incomes requires banks to
take deliberate strategic initiatives towards improvement of the product/service range and
delivery channels. These reforms may have been responsible for the improved
performance in the post 2002 period.
This project proposal was initiated by a series of questions: Why are some commercial
banks more profitable than others? To what extent are discrepancies in bank’s
profitability due to variation in internal factors within the control of bank’s management
and to what extent do macroeconomic factors impact the financial performance of these
banks? Answers to these questions would be helpful in identifying the factors
determining the success of commercial banks in Kenya and to help formulate policies
that will improve performance for the banking sector.
3
The approach assumes that profitability is explained by both bank-specific factors like
capital adequacy, asset quality, liquidity management, cost efficiency, income
diversification; and by macroeconomics factors like economic growth, and inflation.
These will form the basis of analysis of profitability of commercial banks within the
Kenyan context.
1.1.1 Structure Performance of the Kenyan Banking Sector since 1980s to 2012
The structure of the Kenyan banking system has significantly changed since the late
nineties. The transformation of the banking system came up as a respond to the rapidly
changing international economic environment and the rising needs for financing. The
necessity to adjust the banking legislation by the Central Bank of Kenya (CBK) has led in
general to the liberalization of the Kenya’s banking sys-tem, and in particular to the
abolition of several types of subsidies in the provisions of financial services. This
development led the entrance of new commercial banks both under local and foreign
ownership.
The banking sector in Kenya comprised the Central Bank of Kenya, as the regulatory
authority, Commercial Banks, Non-Bank Financial Institutions, Forex Bureaus and
Deposit Taking Microfinance Institutions as the regulated entities. Our main focus will
be on the commercial banks. The sector consists of 43 commercial banks; 3 of which are
locally owned; 27 are privately owned; and 13 are under foreign ownership CBK (2010).
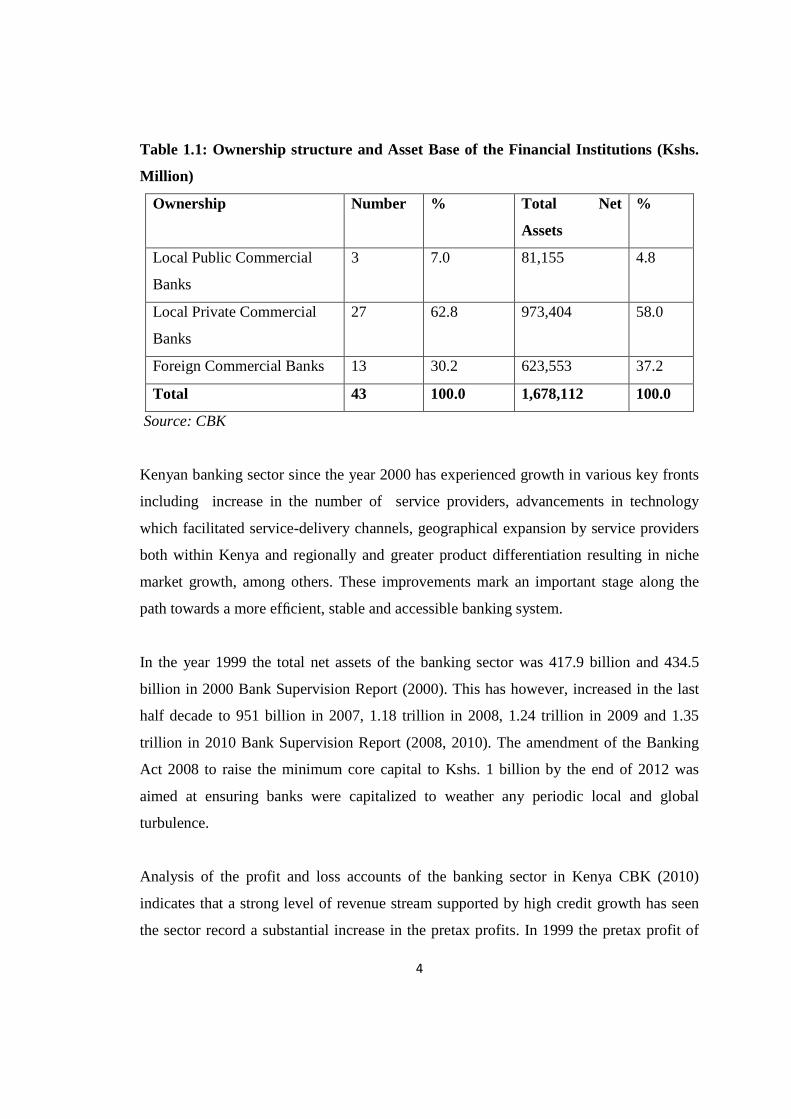
The locally owned commercial banks dominated the sector by accounting for 69.8
percent of the industry’s total assets; the 13 foreign owned banks accounted for 30.2
percent as at the end of year 2010 as shown in table 1.1
4
Table 1.1: Ownership structure and Asset Base of the Financial Institutions (Kshs.
Million)
Ownership Number % Total Net
Assets
%
Local Public Commercial
Banks
3 7.0 81,155 4.8
Local Private Commercial
Banks
27 62.8 973,404 58.0
Foreign Commercial Banks 13 30.2 623,553 37.2
Total 43 100.0 1,678,112 100.0
Source: CBK
Kenyan banking sector since the year 2000 has experienced growth in various key fronts
including increase in the number of service providers, advancements in technology
which facilitated service-delivery channels, geographical expansion by service providers
both within Kenya and regionally and greater product differentiation resulting in niche
market growth, among others. These improvements mark an important stage along the
path towards a more efficient, stable and accessible banking system.
In the year 1999 the total net assets of the banking sector was 417.9 billion and 434.5
billion in 2000 Bank Supervision Report (2000). This has however, increased in the last
half decade to 951 billion in 2007, 1.18 trillion in 2008, 1.24 trillion in 2009 and 1.35
trillion in 2010 Bank Supervision Report (2008, 2010). The amendment of the Banking
Act 2008 to raise the minimum core capital to Kshs. 1 billion by the end of 2012 was
aimed at ensuring banks were capitalized to weather any periodic local and global
turbulence.
Analysis of the profit and loss accounts of the banking sector in Kenya CBK (2010)
indicates that a strong level of revenue stream supported by high credit growth has seen
the sector record a substantial increase in the pretax profits. In 1999 the pretax profit of
5
the sector was 0.2 billion and 2.8 billion in 2000. The have however, more than tippled in
the last decade to levels of 35.6 billion in 2007, 43.3 billion in 2008, 48.9 billion in 2009
and 74.2 billion in 2010.
Generally, the banking sector in Kenya has remained stable and registered enhanced
performance both in structure and profitability. This has been supported by robust
domestic and global economy, regional expansion, adoption of modern technology and
implementation of various legal policies among others.
1.1.2. Bank Branches and Automated Teller Machines (ATMs)
Branch Network
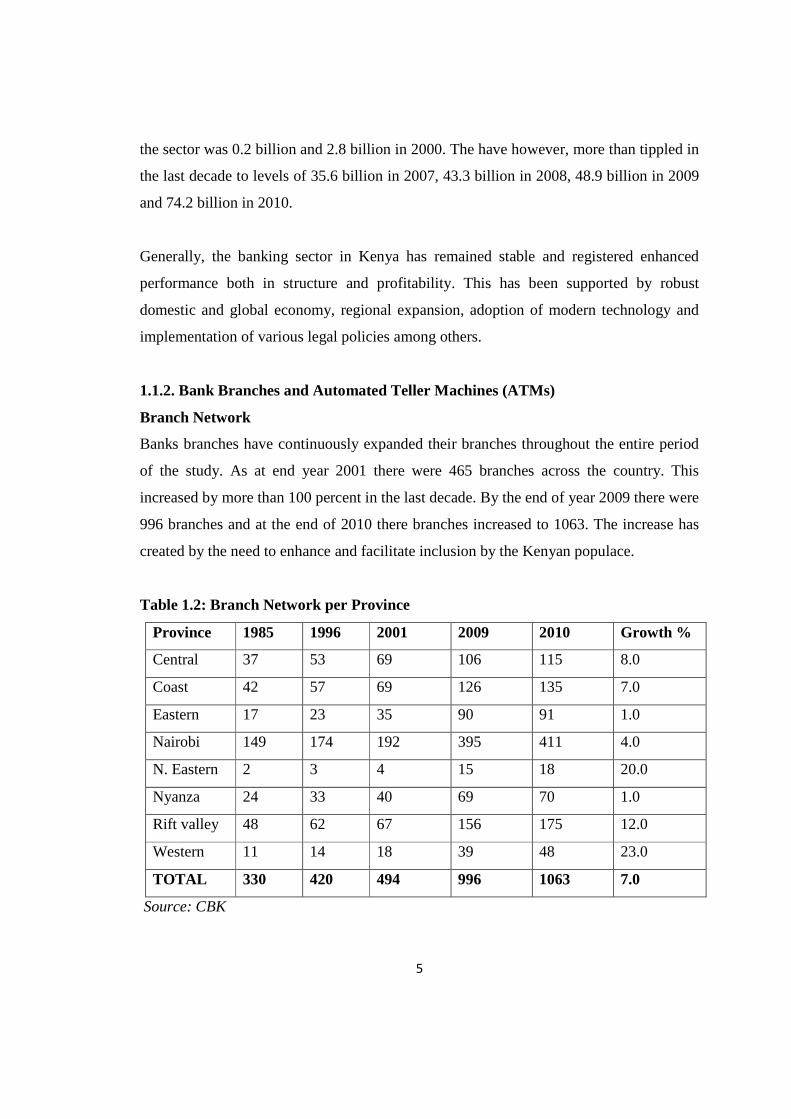
Banks branches have continuously expanded their branches throughout the entire period
of the study. As at end year 2001 there were 465 branches across the country. This
increased by more than 100 percent in the last decade. By the end of year 2009 there were
996 branches and at the end of 2010 there branches increased to 1063. The increase has
created by the need to enhance and facilitate inclusion by the Kenyan populace.
Table 1.2: Branch Network per Province
Province 1985 1996 2001 2009 2010 Growth %
Central 37 53 69 106 115 8.0
Coast 42 57 69 126 135 7.0
Eastern 17 23 35 90 91 1.0
Nairobi 149 174 192 395 411 4.0
N. Eastern 2 3 4 15 18 20.0
Nyanza 24 33 40 69 70 1.0
Rift valley 48 62 67 156 175 12.0
Western 11 14 18 39 48 23.0
TOTAL 330 420 494 996 1063 7.0
Source: CBK
6
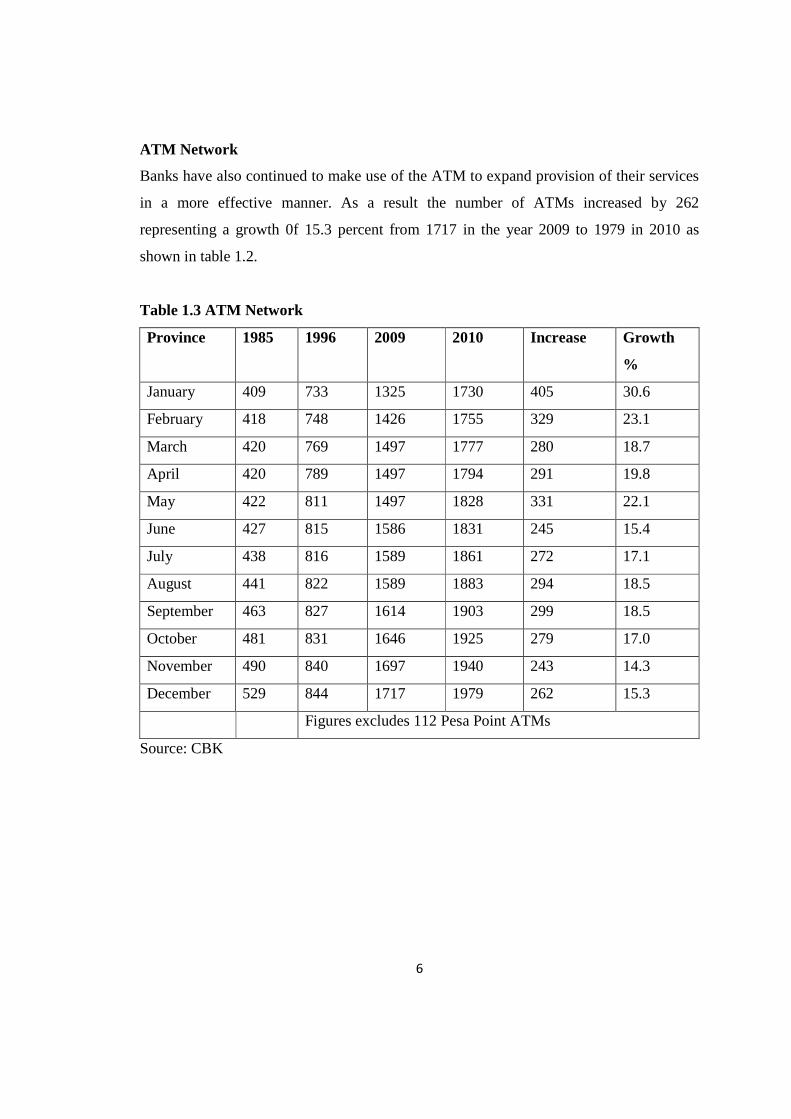
ATM Network
Banks have also continued to make use of the ATM to expand provision of their services
in a more effective manner. As a result the number of ATMs increased by 262
representing a growth 0f 15.3 percent from 1717 in the year 2009 to 1979 in 2010 as
shown in table 1.2.
Table 1.3 ATM Network
Province 1985 1996 2009 2010 Increase Growth
%
January 409 733 1325 1730 405 30.6
February 418 748 1426 1755 329 23.1
March 420 769 1497 1777 280 18.7
April 420 789 1497 1794 291 19.8
May 422 811 1497 1828 331 22.1
June 427 815 1586 1831 245 15.4
July 438 816 1589 1861 272 17.1
August 441 822 1589 1883 294 18.5
September 463 827 1614 1903 299 18.5
October 481 831 1646 1925 279 17.0
November 490 840 1697 1940 243 14.3
December 529 844 1717 1979 262 15.3
Figures excludes 112 Pesa Point ATMs
Source: CBK
7
1.1.3. Technology and Banking in Kenya Today
New Product:
In an effort to enhance customer service, the banking industry introduced new products in
the course of the year, mainly relating to Sharia compliant banking, mobile phone
banking and internet banking. The introduction of these new products was driven by
increased customer awareness and demand as well as the increasingly vibrant nature of
competition in the sector. With the advancement in technology, public awareness and
ease of use, e-banking has evolved to become the preferred mode of banking rather than
as an alternative channel. It is expected that the products launched will play a significant
role in expanding access to affordable financial services by the general public as well as
reduction in banking costs to the banks’ customers. (CBK 2010)
Mobile Banking
In 2010 mobile solution became the basis of payment solution for most of the banks. As a
result, a number of banks continued to sign up partnerships with money transfer service
providers as they improve their banking-on-the-move menus. In only four years of
existence of mobile phone money transfer services, four mobile operators have enrolled
over 15 million customers. Some of the commonly used mobile banking services
launched during the year include; M-Shwari, Mobicash, Orange money, Yu-cash, Elma,
Pesa-Pap, Pesa-Connect among others, with M-Pesa being the most widely used method
of mobile money transfer with about 305.7 million transactions effected and valued at
Ksh. 727.8 billion in the year.
Internet Banking
Banks continued to embrace the use of the Internet as a remote delivery channel for
banking services. The most common online services include; viewing of accounts,
inquiries and requests, salary payments, clearing cheques status query, instant alerts of
account status and transfer of funds CBK (2012)
8
Generally, the banking sector in Kenya has remained stable and registered enhanced
performance both in structure and profitability. This has been supported by robust
domestic and global economy, regional expansion, adoption of modern technology and
implementation of various legal policies among others.
1.2 Problem Statement and Study Background
During the great depression of the 1940s’ USA experienced a series of bank failures and
the poor performance of the financial markets in the Sub-Saharan Africa prompted
considerable attention to bank performance. In addition, recent global financial crisis of
2007/2009 also demonstrated the importance of bank performance both in locally and
internationally and, hence, the need to keep it under surveillance at all times. The
importance of banks is more pronounced in developing countries because financial
markets are usually underdeveloped, and banks are typically the only major source of
finance for the majority of firms and are usually the main depository of economic
savings.
African banks have not been widely studied and it is therefore, difficult to inform policy
on readily efficient banks in the continent without sufficient data. The few studies that
have been done in Kenya have come to a conclusion that more data was required on its
banking system to inform policy and that more understanding of sector’s performance
was important.
There are many aspects of the performance of commercial banks that can be analyzed.
This study focuses on the determinant of profitability of commercial banks in Kenya. It
has also been observed that the importance of bank profitability can be appraised at the
micro and macro levels of the economy. At the micro level, profit is the essential
prerequisite of a competitive banking institution and the cheapest source of funds. It is
not merely a result, but also a necessity for successful banking in a period of growing
competition on financial markets. Hence the basic aim of every bank management is to
maximize profit, as an essential requirement for conducting business.
9
At the macro level, a sound and profitable banking sector is better able to withstand
negative shocks and contribute to the stability of the financial system. Bank profits
provide an important source of equity especially if re-invested into the business. This
should lead to safe banks, and as such high profits could promote financial stability
(Flamini et al, 2009). However, too high profitability is not necessarily good. Other
studies have observed that too high profitability could be indicative of market power,
especially by large banks. This may hamper financial intermediation because banks
exercising strong market power may offer lower returns on deposit but charge high
interest rates on loans. Too low profitability, in turn, might discourage private agents
(depositors and shareholders) from conducting banking activities thus resulting in banks
failing to attract enough capital to operate. Furthermore, this could imply that only poorly
capitalized banks intermediate savings with the corresponding costs for sustainable
economic growth.
The banking environment in Kenya has, for the past decade, undergone many regulatory
and financial reforms. These reforms have brought about many structural changes in the
sector and have also encouraged foreign banks to enter and expand their operations in the
country (Kamau, 2009). Kenya’s financial sector is largely bank-based as the capital
market is still considered narrow and shallow (Ngugi et al, 2006). Banks dominate the
financial sector in Kenya and as such the process of financial intermediation in the
country depends heavily on commercial banks (Kamau, 2009). In fact Oloo (2009)
describes the banking sector in Kenya as the bond that holds the country’s economy
together. Sectors such as the agricultural and manufacturing virtually depend on the
banking sector for their very survival and growth. The performance of the banking
industry in the Kenya has improved tremendously over the last ten years, as only two
banks have been put under CBK statutory management during this period compared to 37
bank-failures between 1986 and 1998 (Mwega, 2009).
10
The overall profitability of the banking sector in Kenya has improved tremendously over
the last 10 years. However despite the overall good picture a critical analysis indicates
that, not all banks are profitable. For example the small and medium financial institutions
which constitute about 57 % of the banking sector posted a combined loss before tax, of
Ksh 0.09 billion in 2009 compared to a profit before tax of Ksh 49.01 billion posted by
the big financial institutions (CBK, 2009). The huge profitability enjoyed by the large
banks vis-a-avis the small and a medium bank indicates that there are some significant
factors that influence the profitability of commercial banks. Several studies have shown
that bank profitability is influenced by bank-specific factors and industry specific factors.
However, these studies were based on data from other countries and their findings may
not be applied to the local banking sector. Locally, to the researcher’s knowledge, no
studies have been done on the determinants of the commercial bank’s profitability. The
aim of this study then is to close this gap in knowledge by empirically evaluating the
determinants of profitability, within the banking sector for commercial banks in Kenya.
1.3 Research Objectives
The general objective of this study is to analyze the determinants of commercial banks
profitability in Kenya. Specific objectives derived from the general objective of the study
are:
i) To determine the effects of bank-specific factors on the profitability commercial
banks in Kenya.
ii) To determine the effects of macroeconomic factors on the profitability of
commercial banks in Kenya
11
1.4 Research Questions
This research paper was initiated by a series of questions; the answers to these questions
would be helpful in identifying the determinants of successful Kenyan commercial banks
in order to formulate policies for improved profitability of these institutions. The
questions are:
i) To what extent are discrepancies in bank’s profitability due to variation in bank-
specific factors under the control of bank management?
ii) To what extent, do macroeconomic factors impact the profitability performance of
these banks?
1.5 Justification of the Study
Empirical evidence clearly shows that studies focusing on Kenya’s bank profitability and
performance are still scanty and limited. Even those which have been carried out point to
a need for further investigation of the factors that have affect performance in the sub-
region, notwithstanding the reforms. Most of the evidence in regard to commercial banks’
performance largely focus on the developed economies environments and the conclusions
of may not be useful for Kenya’s financial sector planning. According to literature, the
studies on commercial banks’ profitability would provide more elaborate and current
information that is important for policy for the sector and also scholarly literature.
12
CHAPTER TWO
LITERATURE REVIEW
2.1 Introduction to Literature Review
According to previous studies, bank profitability, typically measured by the return on
assets (ROA) and/or the return on equity (ROE), is usually expressed as a function of
internal and external determinants. Internal determinants are factors that are mainly
influenced by a bank’s management decisions and policy objectives. Such profitability
determinants are the level of liquidity, asset quality, capital adequacy, cost efficiency and
bank size. On the other hand, the external determinants, mainly macroeconomic, are
variables that reflect the economic and legal environment where the credit institution
operates. These external determinants include economic growth, inflation and interest
rates.
The review of literature has revealed that bank profitability can be influenced by both
bank-specific factors and macroeconomic factors. Bank-specific factors are those
factors within the direct control of managers and can be best explained by the
CAMEL framework, while macroeconomic factors include inflation, economic
growth and interest rates.
The review of literature also revealed that the multiple linear regressions method is the
most used in modeling the relationship between bank profitability and its factors.
The relevant interrelationships among bank-specific factors and macroeconomic
factors and their impact on bank profitability, as revealed by the reviewed of literature,
and are depicted in the conceptual framework (Figure 3.1).
Finally, it is clear from the review of literature that few local studies have been dedicated
on this particular area of bank profitability and that studies that have attempted to do so
have tended to study each factor of performance to the exclusion of other factors.
13
2.2 Empirical Evidence
In trying to understand commercial banks’ performance in Kenya like Sub-Saharan
Africa, Europe and USA, studies on profitability have largely focused on returns on bank
assets or equity (ROA). Traditionally, the impact on banks’ performance has been
measured by bank-specific factors such as capital adequacy, credit risk, liquidity risk,
market power and regulatory costs. However, more recently, research seems to have
focused on the impact of macroeconomic factors on banks’ performance. In all these
studies, the literature reveals that Kenya has been less studied and therefore would
require more information on banking sector for better planning. This study is, therefore,
an attempt to address the gap of knowledge on Kenyan banking sector.
In investigating bank profitability, Demirguc-Kunt and Huizinga, (2000) applied linear
models to explain bank performance. Linear models have however been criticized for
employing inconsistent variables and generating inefficient results.
A study done in SSA show that bank profitability can also be looked at a function of both
internal and external factors (Panayiotis et al. 2006). Internal factors include bank-
specific factors; while external factors include macroeconomic factors. In this literature,
four standard key bank-specific indicators are used to determine bank profitability
namely - capital adequacy; asset quality; operational cost efficiency; and bank size.
Industry–specific factors include macroeconomic factors such as inflation, interest rate,
per-capita income and growth in GDP. This study also discovered that bank profitability
persist to a moderate extent which suggests that departures from perfectly competitive
market structures may not be large. The study further shows that all bank-specific
determinants, with the exception of size, influence bank performance in the anticipated
way. Extending a similar study to Kenya, therefore, generates comparative results.
A study of Bahrain’s commercial banks performance during 1994-2001 by (Samad,
2004) showed that commercial banks’ liquidity performance is not at par with the
banking industry. The student t-statistics also showed that commercial banks are
14
relatively less profitable, less liquid and more exposed. The study employed ten financial
ratios for measuring credit, liquidity and profitability performances.
A study to investigate the determinants of bank profitability in Nigeria revealed that real
interest rates, inflation, monetary policy, and exchange rate regime are significant
macroeconomic determinants of bank profitability (Toni, 2008). The study employed a
panel data set comprising 1255 observations of 154 banks over the 1980-2006 period and
macroeconomic indices over the same period. According to the findings banking sector
development, stock market development, and financial structure are insignificant; and the
relationship between corporate tax policy and bank profitability in Nigeria is
inconclusive.
Evidence from Tunisia reveals that high net interest margin and profitability tend to be
associated with banks that hold a relatively high amount of capital and with large
overheads (Naceur and Goaied, 2010). This study investigated the impact of banks’
characteristics, financial structure and macroeconomic indicators on banks’ net interest
margins and profitability in the Tunisian banking industry for the 1980-2000 periods.
Individual bank characteristics explain a substantial part of the within-country variation
in bank interest margins and net profitability.
2.3 Bank Specific Determinants and Their Effects on Profitability
2.3.1 Capital Adequacy
According to (Kosmidou, 2009), Capital adequacy refers to the sufficiency of the amount
of equity to absorb any shocks that the bank may experience. The capital structure of
banks is highly regulated because capital plays a crucial role in reducing the number of
bank failures and losses to depositors when a bank fails, as highly leveraged firms are
likely to take excessive risk in order to maximize shareholder value at the expense of
finance providers (Kamau, 2009). In Kenya, capital adequacy is measured by the ratio of
total capital to total risk weighted assets at the minimum regulatory requirement of 12.0
15
percent. This ratio improved from 21.0 percent in 2009 to 22.0 percent in December
2010. This was as a result of a higher increase in total capital brought about by fresh
capital injection and retention of profits that more than offset the increase in risk
weighted assets. This trend has been sustained since 2007 (CBK, 2010)
There are several reasons to believe that a better capitalized bank should be more
profitable. This can be attributed to the fact that capital acts as a safety net when it comes
to banks’ developments (Athanasoglou et al, 2008). The positive relationships is key
when it comes to financing of a bank’s assets due to the more favorable interest rates,
hence increase in profitability and managing the cost of equity. According to (Berger,
1995) in his expected bankruptcy-costs hypothesis, a bank with capital ratio below its
equilibrium ratio, expected bankruptcy costs are relatively high and an increase in capital
ratios raises expected profits by lowering interest expenses on uninsured debt. In the
theory of Signaling Hypothesis, (Berger, 1995) find a positive relationship between
capital and profitability. This theory suggests that the bank management signals private
information that future prospects are good by increasing capital.
The Basel Accord which requires banks to hold a minimum level of capital as a
percentage of risk-weighted assets is another interpretation. Higher levels of capital may
therefore denote banks with riskier assets, which translate, in turn, to higher revenues that
increase the profitability of the bank. Most studies are in agreement that statutory capital
requirement is important in reducing moral hazards; however, the debate is on how much
of the capital is enough. Bank regulators opt to have the higher minimum requirements to
cut-on case of bank failures, while bank management or bankers in general prefer a lower
requirements as this will enhance their competitiveness as well as enable them obtain
additional equity cheaply. Beckmann (2007) argue that high capital lead leads to low
profits since banks with a high capital ratio are risk-averse, they ignore potential [risky]
investment opportunities and, as a result, investors demand a lower return on their capital
in exchange for lower risk.
16
On the contrary, in emerging economies where external borrowing is difficult and capital
is expensive in terms the expected returns, highly capitalized banks face lower cost of
bankruptcy and lower need for external funding (Gavila et al, 2009). Using a sample of
10 Tunisian banks from 1980 to 2000 and a panel linear regression model, (Neceur,
2003) and (Sufian and Chong, 2008) after examining the impact of capital to the
performance of banks in Philippines from 1990 to 2005, reported a strong positive impact
of capitalization to ROA. The banking sector in Kenya provides an interesting case to
examine the impact of capital because the minimum statutory requirement has been
upgraded to Kshs 1billion in 2012. Capital adequacy is divided into Tier I and Tier II.
Tier I capital is primary capital and Tier II capital is supplementary capital, but this study
will focus on total equity of the banks as opposed to the minimum requirements.
2.3.2 Assets Quality
There seems to be a general agreement that profitability is directly related to the quality
of the assets on a bank’s balance sheet. It means that poor credit quality has a negative
effect on bank profitability and vice versa. This relation exists because an increase in the
doubtful assets, which do not accrue income, requires a bank to allocate a significant
portion of its gross margin to provisions to cover expected credit losses; thus, profitability
will be lower. Therefore, the evolution of the impairment losses on loans and receivables
explains a large part of the profitability of both commercial and savings banks
(Athanasoglou et al. 2008).
Credit risk, which is the quality of assets held by an individual bank, is one of the factors
that affect the health of an individual bank. The quality of assets held by a bank depends
on exposure to specific risks, trends in non-performing loans, and the health and
profitability of bank borrowers Baral (2005). Aburime (2008) asserts that the profitability
of a bank depends on its ability to foresee, avoid and monitor risks, possibly to cover
losses brought about by risks arisen. Hence, in making decisions on the allocation of
resources to asset deals, a bank must take into account the level of risk to the assets.
17
Poor asset quality and low levels of liquidity are the two major causes of bank failures.
Poor asset quality led to many bank failures in Kenya in the early 1980s. During that
period 37 banks collapsed following the banking crises of 1986-1989, 1993-1994 and
1998 Mwega (2009).
According to Waweru and Kalani (2009) many of the financial institutions that collapse
in 1986 failed due to non-performing loans (NPLs) and that most of the larger bank-
failures, involved extensive insider lending, often to politicians. The CBK measures asset
quality by the ratio of net non-performing loans to gross loans. A good measure of credit
risk or asset quality is the ratio of loan loss reserve to gross loans because it captures the
expectation of management with regard to the performance of loans. Hempel et al (1994)
observed that banks with high loan growth often assume more risk as credit analysis and
review procedures are less rigorous, however returns are high in such loans indicating a
risk and return trade-off.
Kosmidou (2008) applied a linear regression model on Greece 23 commercial banks data
for 1990 to 2002, using ROA and the ratio of loan loss reserve to gross loans to proxy
profitability and asset quality respectively. The results showed a negative significant
impact of asset quality to bank profitability. This was in line with the theory that
increased exposure to credit risk is normally associated with decreased firm profitability.
Indicating that banks would improve profitability by improving screening and monitoring
of credit risk.
2.3.3 Liquidity Management
Liquidity is risk arising from the possible inability of a bank to accommodate decreases
in liabilities or to fund increases on the assets’ side of the balance sheet. The loans
market, especially credit to households and firms, is risky and has a greater expected
return than other bank assets, such as government securities. Thus, one would expect a
positive relationship between liquidity and profitability (Bourke, 1989). On the other
18
hand, however, it could be that that the lower the funds held up in liquid investments the
higher the level of expected profitability (Eichengreen and Gibson, 2001).
Changes in credit risk may reflect changes in the health of a bank’s loan portfolio which
may affect the performance of the institution. (Duca et al,1990), among others, conclude
that variations in bank profitability are largely attributable to variations in credit risk,
since increased exposure to credit risk is normally associated with decreased firm
profitability. According to (Miller and Noulas, 1997) quality of loans made determines
bank’s credit risk such that the more financial institutions are exposed to high-risk loans,
the higher the accumulation of unpaid loans and the lower the profitability.
An important decision that the managers of commercial banks take refers to the liquidity
management and specifically to the measurement of their needs related to the process of
deposits and loans. The importance of liquidity goes beyond the individual bank as a
liquidity shortfall at an individual bank can have systemic repercussions (CBK, 2009). It
is argued that when banks hold high liquidity, they do so at the opportunity cost of some
investment, which could generate high returns (Kamau, 2009). The trade-offs that
generally exist between return and liquidity risk are demonstrated by observing that a
shift from short term securities to long term securities or loans raises a bank’s return but
also increases its liquidity risks and the inverse in is true. Thus a high liquidity ratio
indicates a less risky and less profitable bank. Hence, bankers are faced with the dilemma
of liquidity and profitability. Some studies emphasized the adverse effect of increased
liquidity for financial institutions stating that, although more liquid assets increase the
ability to raise cash on short-notice, they also reduce management’s ability to commit
credibly to an investment strategy that protects investors which, finally, can result in
reduction of the firm’s capacity to raise external finance (Uzhegova, 2010).
In Kenya the statutory minimum liquidity requirement is 20%. However, according to
(CBK, 2010), the average liquidity ratio for the sector was 41.9% in 2012, 40.4% in
2010, 39.8% in 2009, 37.0 % in 2008, and way above the minimum requirements. This
19
has baffled many financial analysts as to how could banks withhold such amount of cash
in a credit needy economy such as Kenya (Kamau, 2009). The CBK attributes this to the
banking industry’s preference to invest in the less risky government securities; (Kamau,
2009) attributes this liquidity problem to the restrictions placed on commercial banks at
the discount window, coupled with thin interbank market, a high reserve requirement and
preference of government securities. Thus given the above foregoing analysis, the given
Kenyan banking sector provides an interesting case to assess the effects of liquidity on
profitability.
2.3.4 Cost Efficiency
Since the early 1990s, advances in information, communications and financial
technologies have allowed banks to perform many of their traditional services more
efficiently. Consequently, the cost-to-income ratio, a proxy for cost efficiency, has been
declining almost everywhere to different degrees (Albertazzi and Gambacorta, 2009),
meaning that banks have lower expenses for a given level of output. Therefore most
studies suggest a positive and highly significant effect of efficiency on profitability. This
relation would imply that operational efficiency is a prerequisite for improving the
profitability of the banking system, with the most profitable banks having the lowest
efficiency ratios. On the other hand, (Berger, 1994) noted that managerial ability in
controlling costs (the so-called X-efficiency) is much more important than economies
of scale are on average and is consistently associated with higher profits. Banks
however, may have costs higher than the industry’s minimum for the same scale and
product mix because of poor management. Therefore, this study will aim to examine
whether there exists a direct relationship between efficiency and profitability in the
Kenyan banking system.
Poor expenses management is the main contributors to poor profitability (Sufian and
Chong 2008). In the literature on bank performance, operational expense efficiency is
usually used to assess managerial efficiency in banks. (Mathuva, 2009) observed that the
CIR of local banks is high when compared to other countries and thus there is need for
20
local banks to reduce their operational costs to be competitive globally. Overheads are
one of the most important components of the high interests rate spreads. An analysis of
the overheads showed that they were driven by staff wage costs which were
comparatively higher than other banks in the SSA countries.
2.4 Macroeconomic Determinants and Their Effects on Profitability
Macroeconomic determinants of bank profitability are those characteristics of a macro-
economy that affect the profitability of the banks operating within it. They vary in their
respective levels of significance from one economy to another and cannot be directly
controlled by individual shareholder and managerial decisions and activities. In the
literature, macroeconomic determinants of bank profitability include economic growth
(GDP), inflation and interest rates which will provide theoretical backup for the
explanatory variables that are included in the empirical estimations outlined in this paper.
2.4.1 Economic growth (GDP)
Bad economic conditions can worsen the quality of the loan portfolio generating credit
losses and increasing the provisions banks need to hold, thus reducing bank profitability.
In contrast, an improvement in economic conditions, in addition to improving the
solvency of borrowers, increases demand for credit by households and firms, with
positive effects on the profitability of banks (Athanasoglou et al, 2008). In the same
view, (Albertazzi and Gambacorta, 2009) conclude that the pro-cyclical nature of bank
profits derives from the effects that the economic cycle exerts on net interest income (via
lending activity) and loan loss provisions (via credit portfolio quality). Therefore, in
general, there is a positive relationship between bank profitability and economic growth.
2.4.2 Inflation
A widely used proxy for the effect of the macroeconomic environment on bank
profitability is inflation. The effect of inflation depends on whether banks’ wages and
other operating expenses increase at a faster rate than inflation. The question is how
mature an economy is so that future inflation can be accurately forecast and thus banks
21
can accordingly manage their operating costs. As such, the relationship between the
inflation rate and profitability is ambiguous and depends on whether or not inflation is
anticipated. An inflation rate fully anticipated by the bank’s management implies that
banks can appropriately adjust interest rates in order to increase their revenues faster than
their costs and thus acquire higher profits. On the contrary, unanticipated inflation could
lead to improper adjustment of interest rates and hence to the possibility that costs could
increase faster than revenues. (Demirguc-Kunt and Huizinga, 2000) attempted to identify
possible cyclical movements in bank profitability, the extent to which bank profits are
correlated with the business cycle.
2.4.3 Interest Rates
It is generally believed that a rising interest rate should lead to higher banking sector
profitability by increasing the spread between the saving and the borrowing rates. Studies
in the USA have shown that this relationship is particularly apparent for smaller banks.
They notice that the falling interest rates during recession lead to slower growth in loans
and increase in loan loss. Consequently, banks, particularly the small ones may have
difficulty in maintaining profit as market rates drops (Demirguc-Kunt and Huizingha,
2000).
In the essence of lend-long and borrow-short argument, banks, in general may increase
their lending rates sooner by more percentage points than their deposit rates. In addition,
the rise in the real interest rates will increase the real debt burden on the borrower. This in
turn, may lower asset quality, thereby inducing banks to charge a higher interest margin
in order to compensate for the inherent risk.
2.5 Theories and Models of Bank Profitability
Studies on the performance of banks started in the late 1980s/early 1990s with
the application of two industrial organizations models: the Market Power (MP) and
Efficiency Structure (ES) theories Athanasoglou et al (2006). The balanced portfolio
theory has also added greater insight in to the study of bank profitability
(Nzongang and Atemnkeng, 2006). Applied in banking the MP hypothesis posits that the
22
performance of bank is influenced by the market structure of the industry. There are two
distinct approaches within the MP theory; the Structure-Conduct-Performance (SCP) and
the Relative Market Power hypothesis (RMP). According to the SCP approach, the level
of concentration in the banking market gives rise to potential market power by
banks, which may raise their profitability. Banks in more concentrated markets are
most likely to make abnormal profits by their ability to lower deposits rates and to
charge higher loan rates as a results of collusive (explicit or tacit) or monopolistic
reasons, than firms operating in less concentrated markets, irrespective of their efficiency
Tregenna (2009). Unlike the SCP, the RMP hypothesis posits that bank profitability is
influenced by market share. It assumes that only large banks with differentiated products
can influence prices and increase profits. They are able to exercise market power and
earn non-competitive profits.
The ES hypothesis, on the other hand posits that banks earn high profits because they are
more efficient than others. There are also two distinct approaches within the ES; the X-
efficiency and Scale–efficiency hypothesis. According to the X-efficiency approach,
more efficient firms are more profitable because of their lower costs. Such firms tend to
gain larger market shares, which may manifest in higher levels on market
concentration, but without any causal relationship from concentration to profitability
(Athanasoglou et al, 2006). The scale approach emphasizes economies of scale rather
than differences in management or production technology. Larger firms can obtain lower
unit cost and higher profits through economies of scale. This enables large firms to
acquire market shares, which may manifest in higher concentration and then profitability.
The portfolio theory approach is the most relevant and plays an important role in
bank performance studies (Nzongang and Atemnkeng, 2006). According to the
Portfolio balance model of asset diversification, the optimum holding of each asset in a
wealth holder’s portfolio is a function of policy decisions determined by a number of
factors such as the vector of rates of return on all assets held in the portfolio, a vector
of risks associated with the ownership of each financial assets and the size of the
23
portfolio. It implies portfolio diversification and the desired portfolio composition
of commercial banks are results of decisions taken by the bank management.
Further, the ability to obtain maximum profits depends on the feasible set of assets and
liabilities determined by the management and the unit costs incurred by the bank for
producing each component of assets (Nzongang and Atemnkeng, 2006).
The above theoretical analysis shows that MP theory assumes bank profitability is
a function of external market factors, while the ES and Portfolio theory largely assume
that bank performance is influence by internal efficiencies and managerial decisions.
Several models of the banking firm have been developed to deal with specific aspects of
bank behavior but none is acceptable as descriptive of all bank behavior. Some of these
approaches are: univariant analysis, multiple discriminant analysis, multiple
regression analysis, canonical correlations analysis and neural network method. A
major limitation of the univariant analysis approach is that it does not recognize the
possibility of joint significance of financial ratios, while the standard correlations method
precludes the explicit calculation of marginal value of independent variables on the
dependent variable nor can the significance of individual explanatory factors be
determined. Multiple regression approaches correct for these limitations and will produce
comparable results to the discriminant analysis method.
An evaluation of the performance of the multiple linear regression technique and
artificial neural network techniques with a goal to find a powerful tool in
predicting bank performance was done by (Bakar and Tahir, 2009). Data of thirteen
banks in Malaysia for the period 2001-2006 was used in the study. ROA was
used as a measure of bank performance and seven variables including liquidity,
credit risk, cost to income ratio, size, concentration ratio, were used as
independent variables. They note that neural network method outperforms the multiple
linear regression method but it lacks explanation on the parameters used and they
concluded that multiple linear regressions, notwithstanding its limitations (i.e. violations
of its assumptions), can be used as a simple tool to study the linear relationship between
24
the dependent variable and independent variables. The method provides significant
explanatory variables to bank performance and explains the effect of the contributing
factors in a simple, understood manner. This study adopted this approach together with
the correction analysis to explore the determinants of commercial banks’ profitability in
Kenya.
2.6 Study Limitation
This study is constrained by lack of adequate literature from within the country. No
studies have been done locally to determine commercial banks profitability; hence, the
literature of this study is mainly based on other countries in Europe, Asia, USA and SSA.
Therefore, their finding may not be applicable to the case of Kenya.
The variable used in this study are not exhaustive as there factors that may influence the
performance of commercial banks. Such other factors may include monetary policies, tax
structure among others.
25
CHAPTER THREE
RESEARCH METHODOLOGY
3.0 Introduction
In line with achieving the objectives of the study, this chapter explains both the technique
and methodology to be used in this study. The chapter will therefore outline the
conceptual framework, model specification, estimation procedure, data sources and
operational framework.
3.1 Conceptual Framework
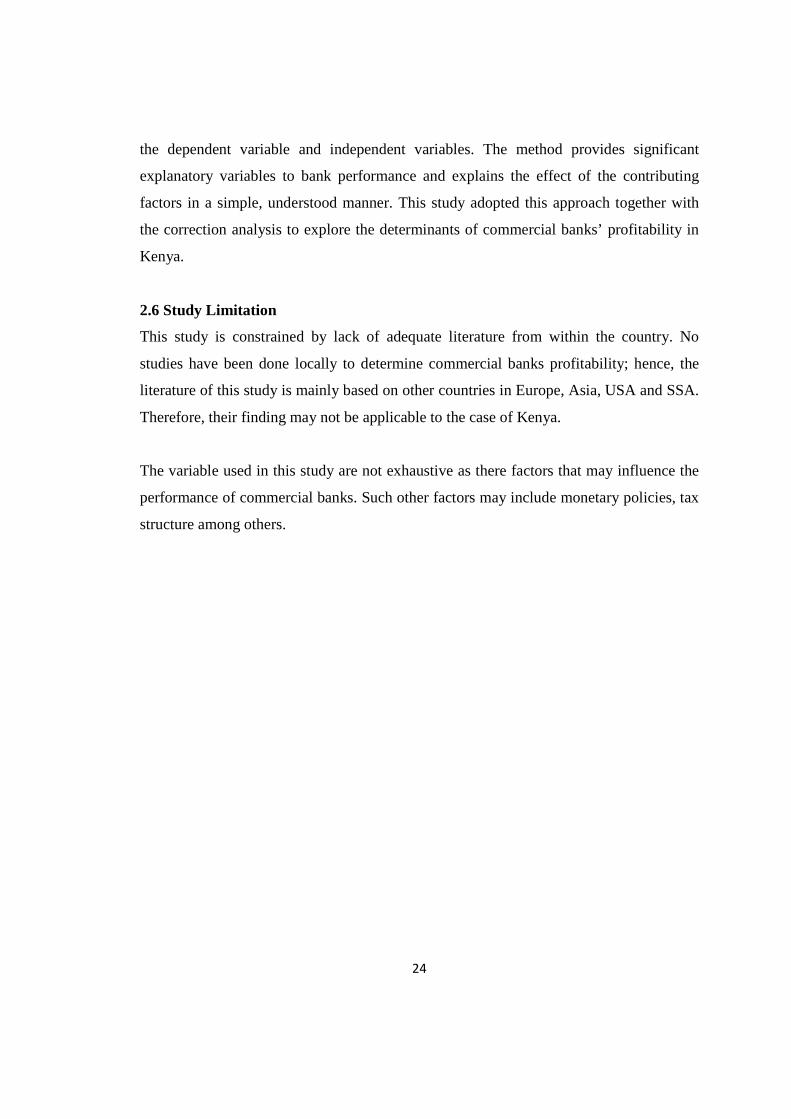
Figure 3.1: Diagrammatic Representation of the Relationship between Variables
The conceptual framework shows a diagrammatic relationship between the independent
variables and dependent variable filtered out from the literature review. It assumes a
linear relationship between the independent variable and dependent variables.
Independent variables
Dependent variable
AFFECTS
MACROECONOMIC FACTORS:
- Economic Growth (GDP) - Inflation - Real Interest Rate
BANK PROFITS:
- Return On Capital (ROA)
BANK SPECIFIC FACTORS:
- Capital adequacy - Asset quality - Liquidity Management - Cost efficiency

26
3.2 Model Specification
The consensus from the literature on bank profitability is that the appropriate
functional form of analysis is the multiple linear regression one. To this extent, (Short,
1979) and (Bourke, 1989) consider several functional forms and conclude that the linear
model produces results as good as any other functional forms. Thus, the general linear
regression model is given as:
Πi = C + Σ αBj + Σβ X +u………………………………. (i)
where Π is the dependent variable and is observation on profitability (ROA); the
independent variables include the intercept C, the j-th bank-specific characteristics,
Bj, the k-th macroeconomic variable, Xk, that all banks take as given. α and β are
coefficients while u is the error term.
Hence the model is given as:
ROA = C + α1CAP + α2ASQ + α3LIM + α4CEF + β1GDP + β2INF + β3RRR
+ e……………………………………………….……….. (ii)
Where;
ROA = Profitability of banking sector
CAP = Capital adequacy
ASQ = Asset quality
LIM = Liquidity Management
CEF = Cost efficiency
GDP = Economic growth
INF = Inflation rate
RRR = Real interest rates
e = random error term
27
Where C = constant for each bank (fixed effects), α = bank specific factors
coefficients, β = macroeconomic factors coefficient
3.3 Definition of Variables
Profitability of a bank is measured by its return on assets (ROA). The ROA,
defined as net income divided by total assets, reflects how well a bank’s
management is using the bank’s real investment resources to generate profits. In
this case it is the ratio of profit before tax to total assets.
As for the determining factors of bank performance, they are divided into internal
and external, and the description of them is provided in the following section.
The primary method of evaluating bank-specific determinants is by analyzing accounting
data. Financial ratios usually provide a broad understanding of the bank’s financial
condition since they are constructed from accounting data contained in the bank’s balance
and financial statements Bashir (2005). The bank-specific determinants of the bank’s
profitability are bank characteristics that are mainly influenced by bank’s management
decisions and policy objectives. They originate from bank account (balance sheets and
profit and loss account) and therefore, can be termed micro determinants of profitability.
Capital adequacy (CAP) which is the bank’s capital ratio, which is measured by total
equity over total asset, reveals capital adequacy and should capture the general
average safety and soundness of the financial institution.
Asset quality (ASQ) is defined as loan-loss provisions over total loans. It is a measure of
capital risk, as well as credit quality. If banks operate in more risky environments and
lack the expertise to control their lending operations, it will probably result in a higher
loan-loss provision ratio i.e. the ratio of non-performing loans to gross loans. Higher ratio
indicates poor asset quality. Hence, the ratio is expected to have a negative relationship
with profitability.
28
Liquidity management (LIM) is defined as the ratio of liquidity assets to total liability
deposits. Loans are the largest segment of interest bearing assets and are expected to
have a positive relationship with bank performance. Other things being constant, the
more the deposits that are transformed into loans, the higher the level of profit will be.
However, it could be the case that banks that are rapidly increasing their loan books have
to pay a higher cost for their funding requirements, and this could lead to a negative
impact on profitability.
Cost efficiency (CEF) this is defined as the ratio of operating costs (staff wages and
administrative expenses) to net operating income (net interest income, net foreign
exchange income, net fees and commission, and other income). Higher ratio indicates
inefficiency.
Economic growth (GDP) which is measured by the real GDP growth rate is hypothesized
to affect banking profitability positively. This is because the default risk is lower in
upturns than in downturns. Besides, higher economic growth may lead to a greater
demand for both interest and non-interest activities, thereby improving the profitability of
banks.
Inflation (INF) is measured through the consumer price index. High inflation is
associated with higher costs as well as higher income. If a bank’s income rises more
rapidly than its costs, inflation is expected to exert a positive effect on profitability. On
the other hand, a negative coefficient is expected when its costs increase faster than its
income.
Real interest rate (RRR) is expected to have a positive relationship with profitability.
29
3.4 Estimation Method
The study employs time series data analysis technique. The parameters were estimated
using the Ordinary Least Square (OLS) method and run on Eviews statistical package.
Since the study used time series data, a number of tests were conducted. Normality tests
were carried out to check for normality of the data including Kurtosis tests, Skewness
tests and Jarque-Bera tests. In addition, stationarity test was done using Augmented
Dickey-Fuller tests. The presence of unit root at levels prompted us to difference the data
used in our regression to avoid the problem of spurious and inconsistent regression
results. Other tests carried out included Harvey test, Breusch-Pagan, CUSUM test and
ARCH test.
3.5 Data Collection and Sources
The study employs time series data for the period 1983 to 2012. Data sources included
Bank Survey Reports and Bank Supervisory Report for the periods 1983 to 2012 from the
CBK and Economic Survey Reports of the same period from the KNBS.
30
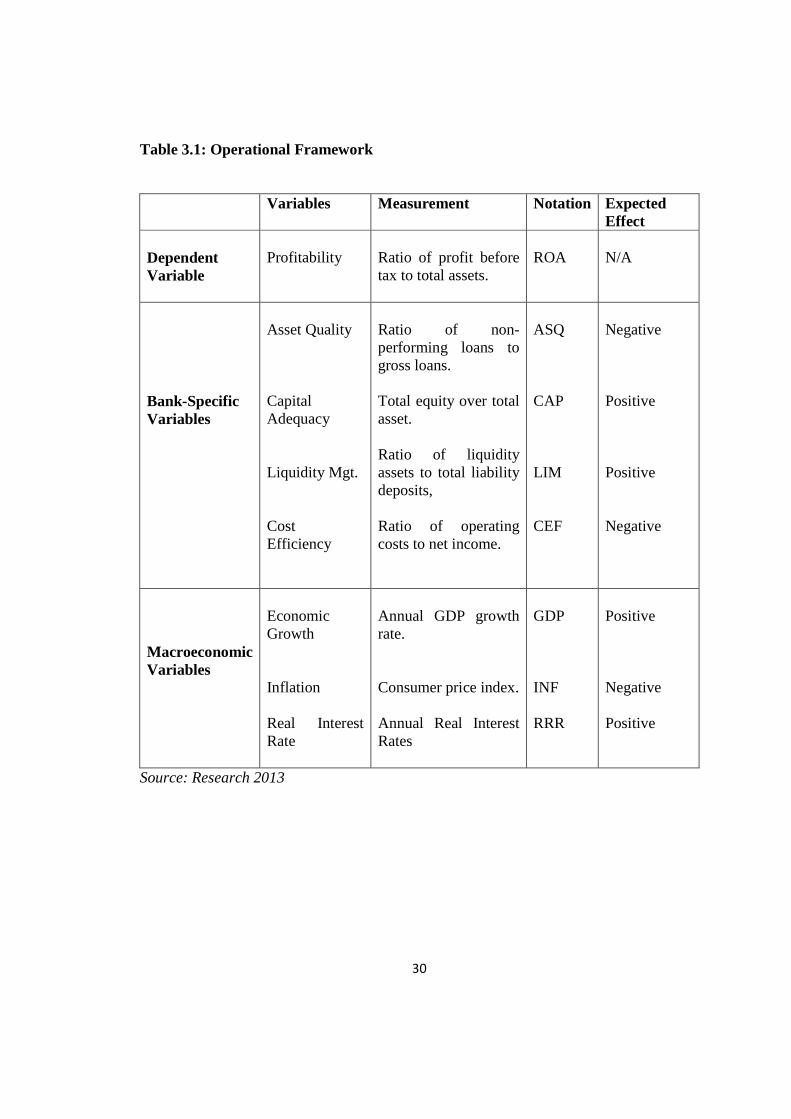
Table 3.1: Operational Framework
Variables Measurement Notation Expected Effect
Dependent Variable
Profitability
Ratio of profit before tax to total assets.
ROA
N/A
Bank-Specific Variables
Asset Quality Capital Adequacy Liquidity Mgt. Cost Efficiency
Ratio of non-performing loans to gross loans. Total equity over total asset. Ratio of liquidity assets to total liability deposits, Ratio of operating costs to net income.
ASQ CAP LIM CEF
Negative Positive Positive Negative
Macroeconomic Variables
Economic Growth Inflation Real Interest Rate
Annual GDP growth rate. Consumer price index. Annual Real Interest Rates
GDP INF RRR
Positive Negative Positive
Source: Research 2013
31
CHAPTER FOUR
EMPIRICAL RESULTS AND FINDINGS
4.0 Introduction
This chapter presents the empirical findings of the determinants of profitability of banks
in Kenya for the period 1983-2012 under study. The first section gives the descriptive
statistics, diagnostics tests, trend analysis, regression analysis and finally discussion of
the findings.
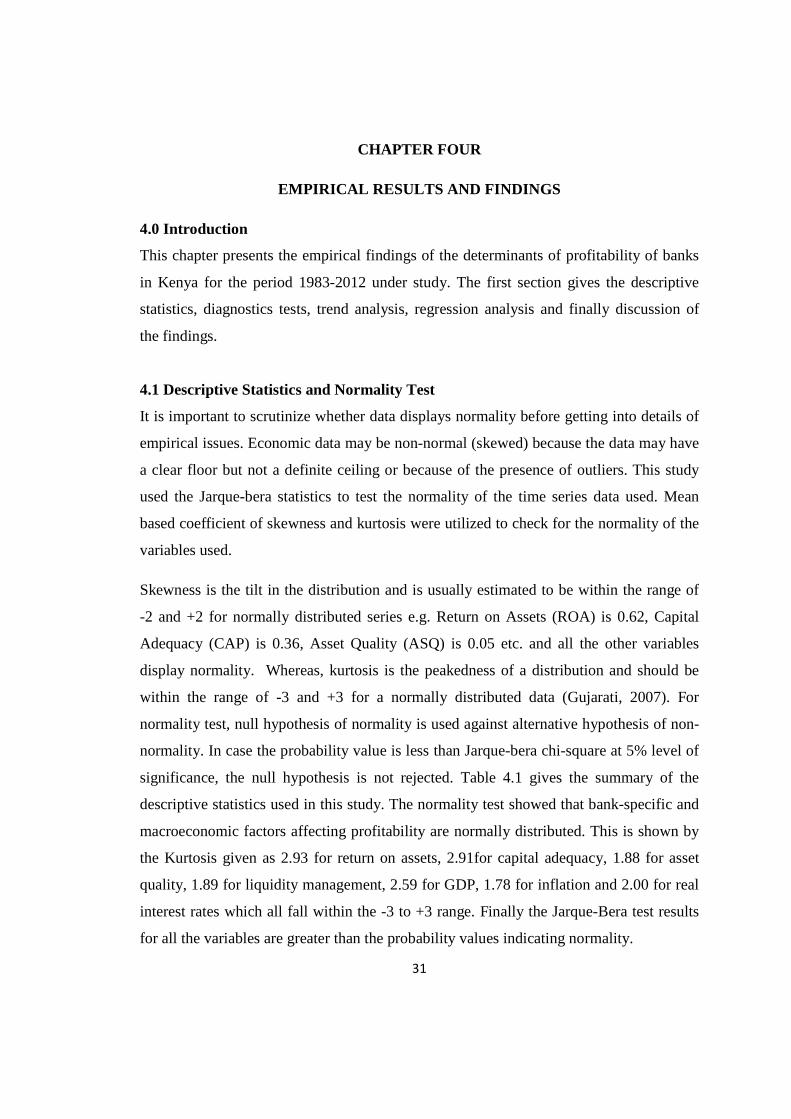
4.1 Descriptive Statistics and Normality Test
It is important to scrutinize whether data displays normality before getting into details of
empirical issues. Economic data may be non-normal (skewed) because the data may have
a clear floor but not a definite ceiling or because of the presence of outliers. This study
used the Jarque-bera statistics to test the normality of the time series data used. Mean
based coefficient of skewness and kurtosis were utilized to check for the normality of the
variables used.
Skewness is the tilt in the distribution and is usually estimated to be within the range of
-2 and +2 for normally distributed series e.g. Return on Assets (ROA) is 0.62, Capital
Adequacy (CAP) is 0.36, Asset Quality (ASQ) is 0.05 etc. and all the other variables
display normality. Whereas, kurtosis is the peakedness of a distribution and should be
within the range of -3 and +3 for a normally distributed data (Gujarati, 2007). For
normality test, null hypothesis of normality is used against alternative hypothesis of non-
normality. In case the probability value is less than Jarque-bera chi-square at 5% level of
significance, the null hypothesis is not rejected. Table 4.1 gives the summary of the
descriptive statistics used in this study. The normality test showed that bank-specific and
macroeconomic factors affecting profitability are normally distributed. This is shown by
the Kurtosis given as 2.93 for return on assets, 2.91for capital adequacy, 1.88 for asset
quality, 1.89 for liquidity management, 2.59 for GDP, 1.78 for inflation and 2.00 for real
interest rates which all fall within the -3 to +3 range. Finally the Jarque-Bera test results
for all the variables are greater than the probability values indicating normality.
32
Table 4.1: Normality Test Results (N = 30)
Mean Max Min Std.
Dev.
Skewness Kurtosis Jarque-
Bera
Prob.
Return on
Capital
2.10 4.70 0.20 0.14 0.62 2.93 1.94 0.38
Capital
Adequacy
17.08 23.00 15.30 0.59 0.36 2.91 2.97 0.07
Asset
Quality
22.85 48.80 1.20 1.53 0.05 1.88 1.57 0.45
Liquidity
Management
27.27 32.60 22.00 3.41 -0.03 1.89 1.53 0.46
Cost
Efficiency
64.39 77.00 40.10 1.78 -0.68 2.59 2.54 0.28
GDP 3.76 7.00 0.10 2.24 -0.23 1.78 2.13 0.34
Inflation 10.08 19.90 1.60 1.89 0.33 2.41 1.01 0.60
Real Interest
Rates
17.04 24.50 12.50 0.79 0.44 2.00 2.23 0.33
Source: Research 2013
4.2 Unit Root Testing
This study uses time series data, therefore it is important to check on the stationarity of
the data to avoid problems which may arise due to the presence of unit roots. Working
with non-stationary variables leads to spurious regression result from which further
inference is meaningless. Augmented Dickey-Fuller (ADF) test was therefore employed
to ascertain the stationarity status of the variables. The stationarity test was done solely to

33
determine whether the variables used were dependent on time. The unit root test used the
null hypothesis that the variables being tested are time invariant. The test was done at
three levels of significance namely at 1%, 5% and at 10%. The desirable status to
ascertain a stationary variable is excess negativity compared to any of the critical values.
Table 4.2 Summary of ADF Unit Root Tests Results before Differencing
VARIABLES ADF
TEST
CRITICAL
VALUE
AT 1%
CRITICAL
VALUE
AT 5%
CRITICAL
VALUE
AT 10%
ORDER
OF DIFF.
Return on Capital -0.676 -3.724 -2.986 -2.633 Level
Capital Adequacy -1.558 -3.699 -2.976 -2.627 Level
Asset quality 3.353 -3.689 -2.976 -2.625 Level
Liq. Management -1.992 -3.689 -2.976 -2.625 Level
Cost efficiency -2.117 -3.689 -2.976 -2.625 Level
GDP -2.564 -3.689 -2.976 -2.625 Level
Inflation -1.842 -3.689 -2.976 -2.625 Level
Real interest rates -2.004 -3.689 -2.976 -2.625 Level
Source: Research 2013
Table 4.2 shows that the all the variables were non-stationary at levels of testing. Hence
there was need to further integrate either at first or second order to determine whether
there was stationarity. Table 4.3 shows the test results.
34
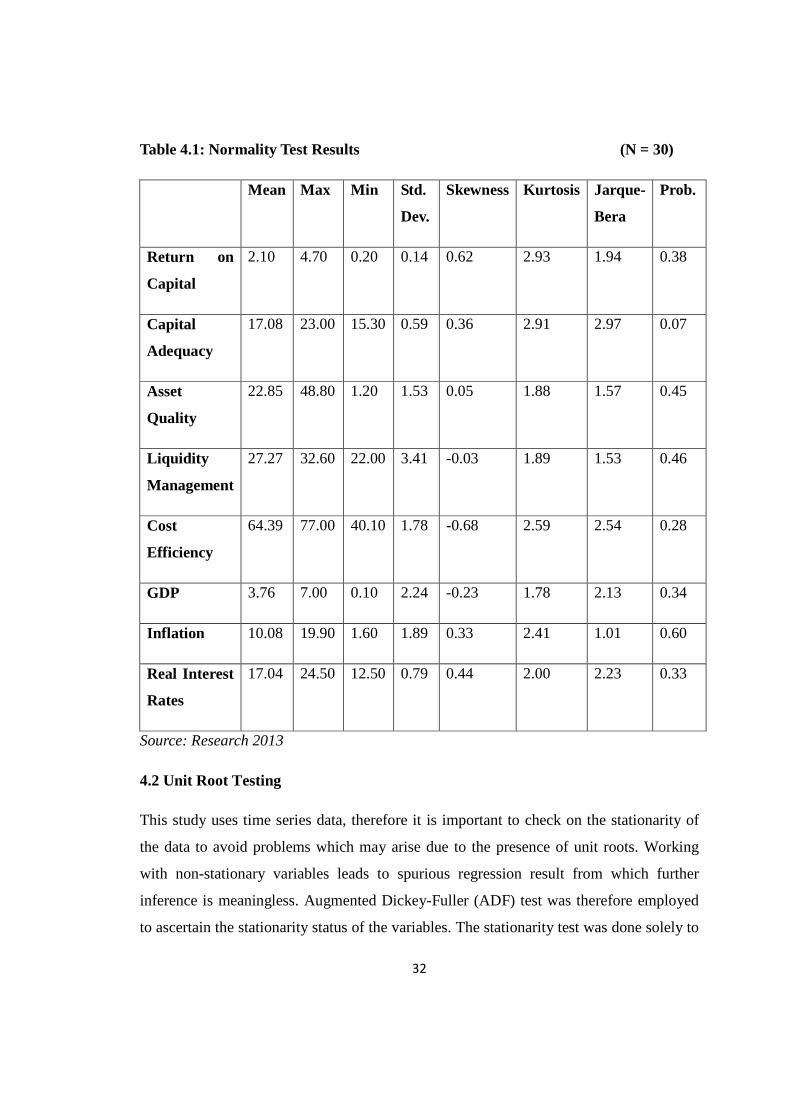
Table 4.3 Summary of ADF Unit Root Tests Results after Differencing
VARIABLES ADF
TEST
CRITICAL
VALUE
AT 1%
CRITICAL
VALUE
AT 5%
CRITICAL
VALUE
AT 10%
ORDER
OF DIFF.
Return on Capital -4.744 -3.724 -2.986 -2.633 I (1)
Capital Adequacy -9.950 -3.699 -2.976 -2.627 I (2)
Asset quality -5.353 -3.689 -2.976 -2.625 I (1)
Liq. Management -7.672 -3.689 -2.976 -2.625 I (2)
Cost efficiency -8.122 -3.689 -2.976 -2.625 I (1)
GDP -7.442 -3.689 -2.976 -2.625 I (1)
Inflation -6.835 -3.689 -2.976 -2.625 I (1)
Real interest rates -7.782 -3.689 -2.976 -2.625 I (1)
Source: Research 2013
Table 4.2.2 shows the summary of the Augmented Dickey-Fuller test results for
stationarity at either first or second order differencing. Results indicated that all the
variables were stationary. The ADF test results showed excess negativity compared to the
critical values at 1%, 5% and 10%. For example ADF test for Capital adequacy was
-9.950, Liquidity management was -7.672, GDP -7.442 etc. compared to their critical
values at 5% which were given as -2.976, -2.972, and -9.672 respectively. Since the ADF
values are less than the critical values, therefore, all the variables are stationery after
integration.
35
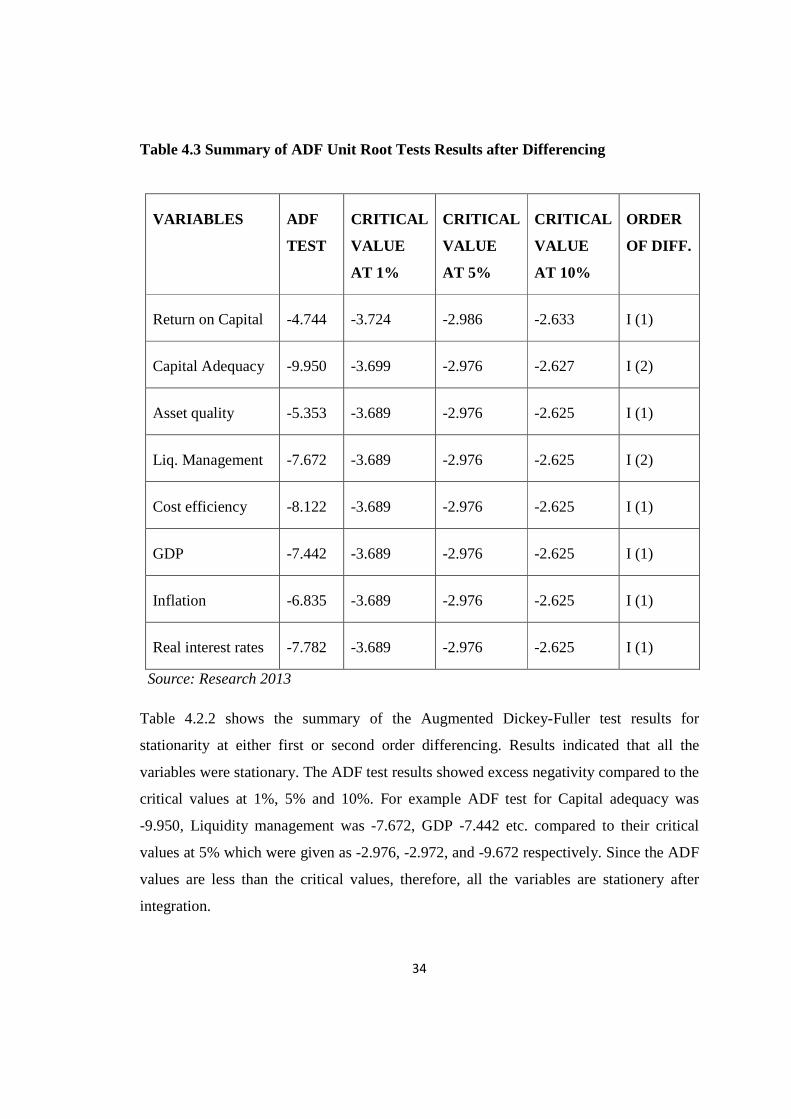
4.3 Cointegration analysis
Cointegration analysis was done to establish whether the variables that were non-
stationary at levels are cointegrated. Detrending of non-stationary variables to realize
stationarity may result to loss of long run properties. Cointegration suggests that in case
there is a long run relationship between two or more non-stationary variables, deviation
from this long run path are stationary.
In this study, we tested for cointegration using the (Granger, 1987) two step procedure
specified in the cointegrating regression as;
Xt = ao + a1zt +Et ………………………………. (i)
Et= (Xt – ao – a1zt) ……………………………… (ii)
Equation (ii) above is the residual of equation (i) and it is a I(1) series. The advantage of
the Engle-Granger two step procedure is that it prevents the errors in the long run
relationship from becoming infinitely large. It has an error correction mechanism (ECM).
In this study, our first step was estimation of a static (long run) model using the list
squares method. Residuals were then generated from the regression results of long run
equation for non-stationary variables. The stationarity of the residuals was then tested
using ADF. Table 4.4 shows the results for stationarity test on residuals.
Table 4.4 ADF Test for Cointegration
t-statistics Prob.*
ADF t-statistics -1.460195
0.0014
Test critical values: 1% level -3.679322
5% level -2.967767
10% level -2.622989
Source: Research 2013
36
The results in table 4.3 above shows that the residuals were found to be non-stationery at
1%, 5% and 10% levels of significance. This is because the ADF test statistics of -1.4602
was greater than the critical values of -3.679, -2.968 and -2.623 at 1%, 5% and 10% level
of significance respectively. Therefore, the residuals could not become the error
correction term; hence, an error correction formulation could not be adopted. Since
cointegration test results showed that the variables do not have a long run relationship,
regression to estimate profitability was therefore done at levels.
4.4 Trends in the Variables
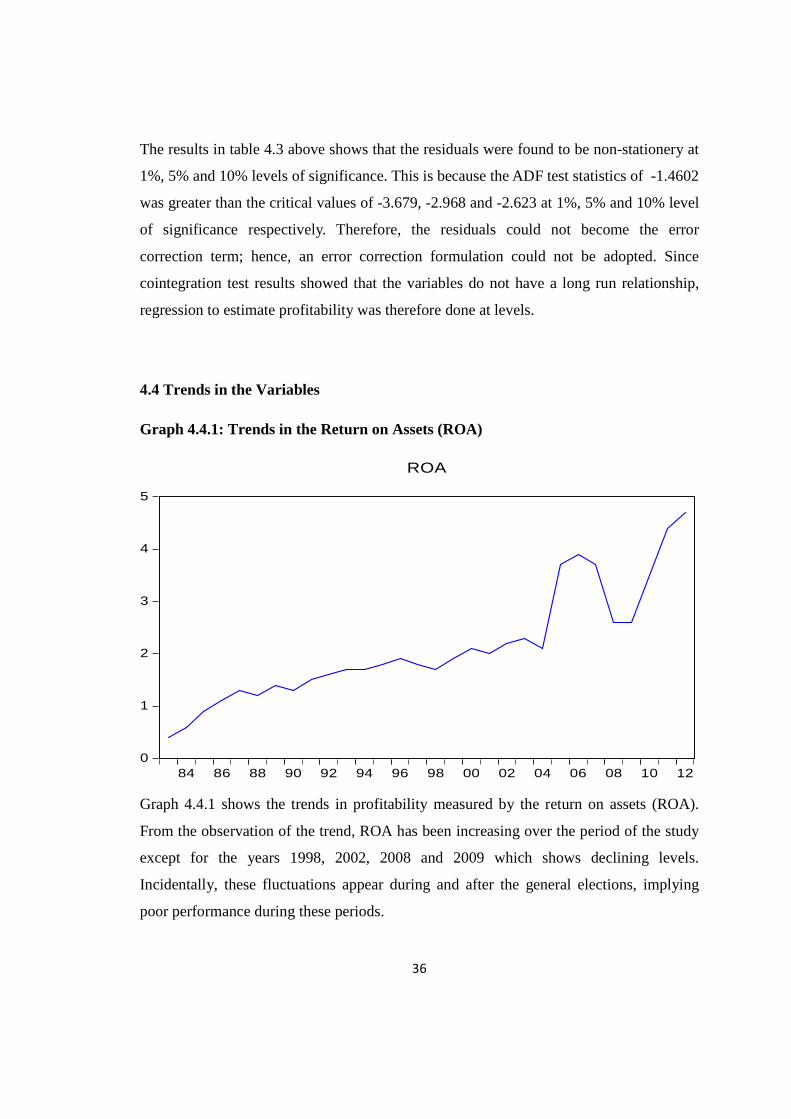
Graph 4.4.1: Trends in the Return on Assets (ROA)
0
1
2
3
4
5
84 86 88 90 92 94 96 98 00 02 04 06 08 10 12
ROA
Graph 4.4.1 shows the trends in profitability measured by the return on assets (ROA).
From the observation of the trend, ROA has been increasing over the period of the study
except for the years 1998, 2002, 2008 and 2009 which shows declining levels.
Incidentally, these fluctuations appear during and after the general elections, implying
poor performance during these periods.
37
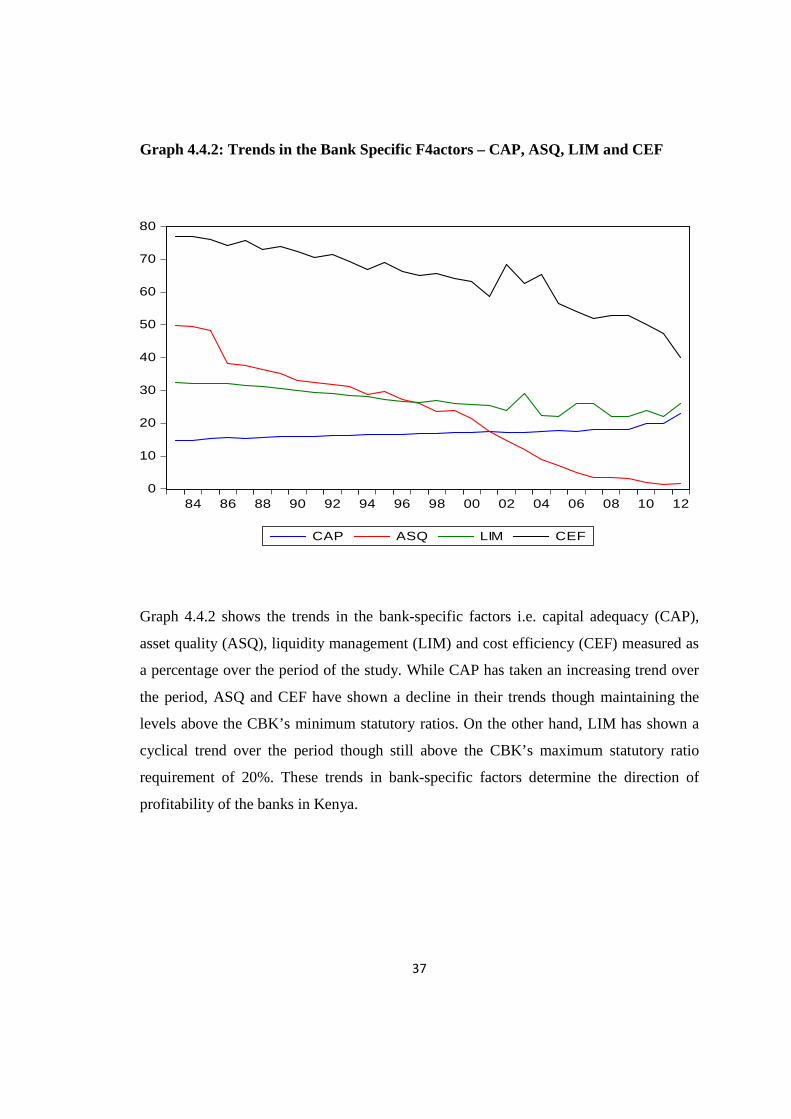
Graph 4.4.2: Trends in the Bank Specific F4actors – CAP, ASQ, LIM and CEF
0
10
20
30
40
50
60
70
80
84 86 88 90 92 94 96 98 00 02 04 06 08 10 12
CAP ASQ LIM CEF
Graph 4.4.2 shows the trends in the bank-specific factors i.e. capital adequacy (CAP),
asset quality (ASQ), liquidity management (LIM) and cost efficiency (CEF) measured as
a percentage over the period of the study. While CAP has taken an increasing trend over
the period, ASQ and CEF have shown a decline in their trends though maintaining the
levels above the CBK’s minimum statutory ratios. On the other hand, LIM has shown a
cyclical trend over the period though still above the CBK’s maximum statutory ratio
requirement of 20%. These trends in bank-specific factors determine the direction of
profitability of the banks in Kenya.
38
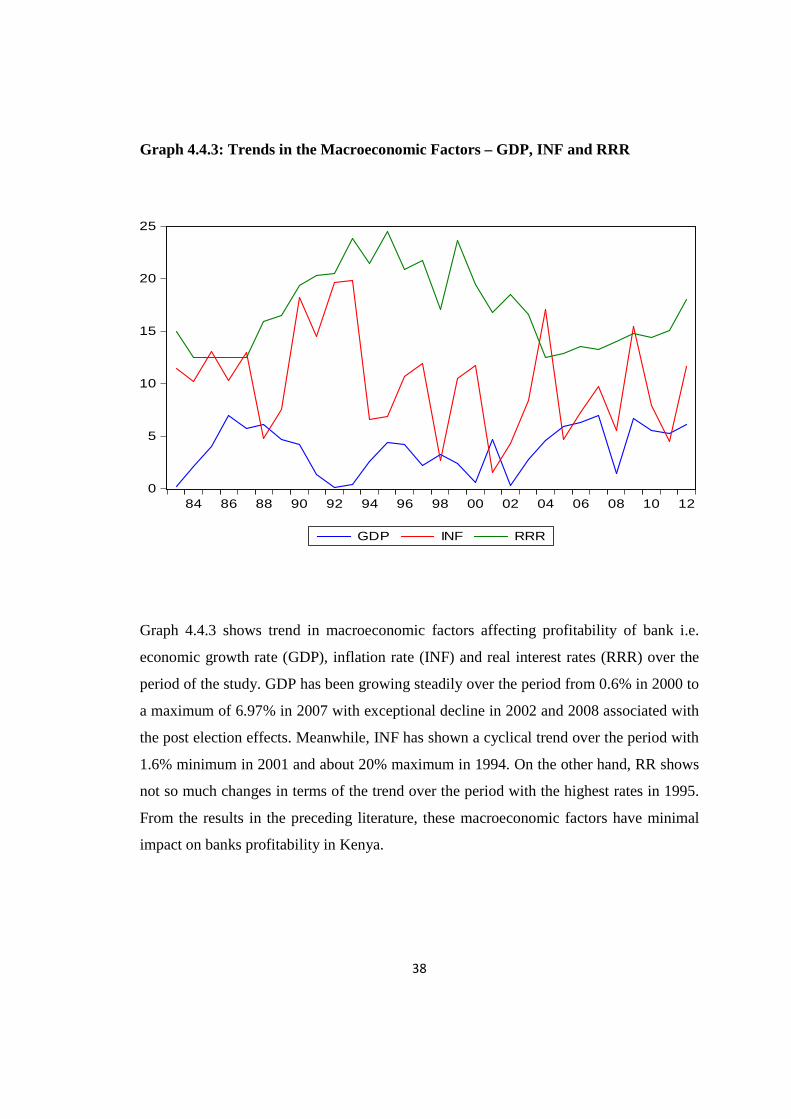
Graph 4.4.3: Trends in the Macroeconomic Factors – GDP, INF and RRR
0
5
10
15
20
25
84 86 88 90 92 94 96 98 00 02 04 06 08 10 12
GDP INF RRR
Graph 4.4.3 shows trend in macroeconomic factors affecting profitability of bank i.e.
economic growth rate (GDP), inflation rate (INF) and real interest rates (RRR) over the
period of the study. GDP has been growing steadily over the period from 0.6% in 2000 to
a maximum of 6.97% in 2007 with exceptional decline in 2002 and 2008 associated with
the post election effects. Meanwhile, INF has shown a cyclical trend over the period with
1.6% minimum in 2001 and about 20% maximum in 1994. On the other hand, RR shows
not so much changes in terms of the trend over the period with the highest rates in 1995.
From the results in the preceding literature, these macroeconomic factors have minimal
impact on banks profitability in Kenya.
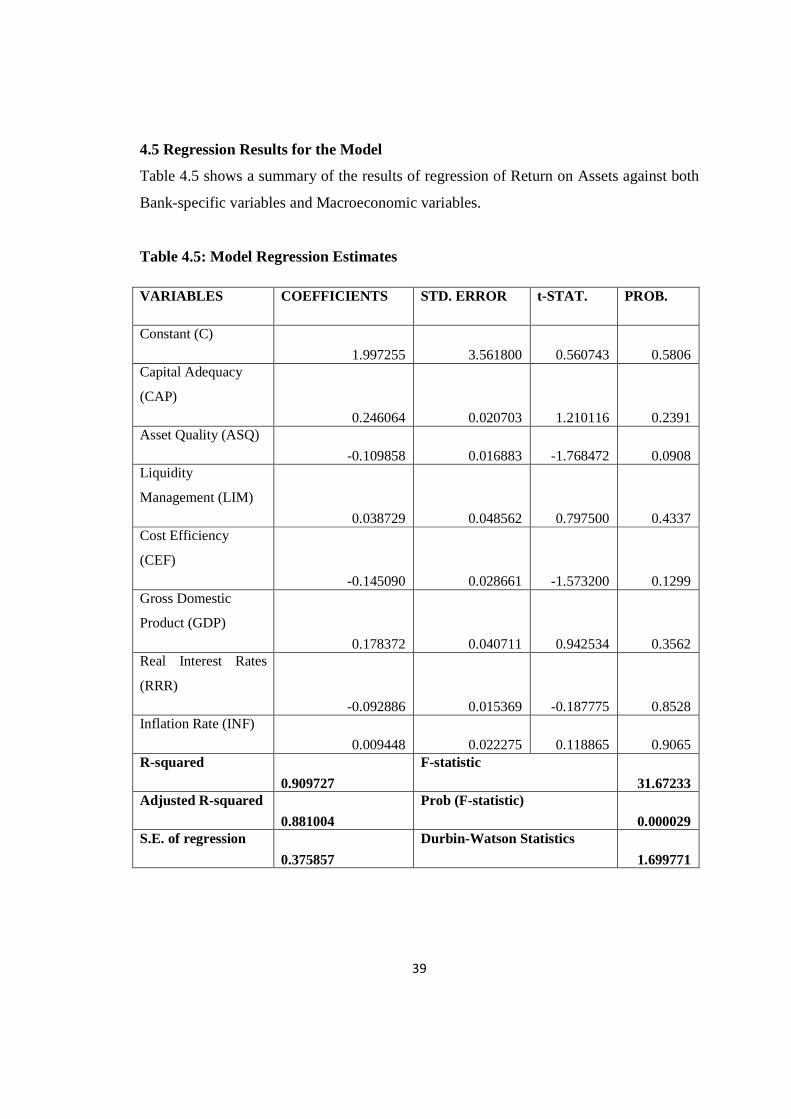
39
4.5 Regression Results for the Model
Table 4.5 shows a summary of the results of regression of Return on Assets against both
Bank-specific variables and Macroeconomic variables.
Table 4.5: Model Regression Estimates
VARIABLES COEFFICIENTS STD. ERROR t-STAT. PROB.
Constant (C)
1.997255 3.561800 0.560743 0.5806 Capital Adequacy
(CAP)
0.246064 0.020703 1.210116 0.2391 Asset Quality (ASQ)
-0.109858 0.016883 -1.768472 0.0908 Liquidity
Management (LIM)
0.038729 0.048562 0.797500 0.4337 Cost Efficiency
(CEF)
-0.145090 0.028661 -1.573200 0.1299 Gross Domestic
Product (GDP)
0.178372 0.040711 0.942534 0.3562 Real Interest Rates
(RRR)
-0.092886 0.015369 -0.187775 0.8528 Inflation Rate (INF)
0.009448 0.022275 0.118865 0.9065 R-squared
0.909727
F-statistic
31.67233 Adjusted R-squared
0.881004
Prob (F-statistic)
0.000029 S.E. of regression
0.375857
Durbin-Watson Statistics
1.699771

40
4.6 Diagnostic Tests
To assess the validity of the regression results, a number of diagnostic tests were carried
out. ARCH test, Harvey test and Breusch-Godfrey test were carried out to establish
whether the variance was constant across the observations. The results in Table 4.6
showed that heteroscedasticity was not a major problem since the f-statistics results in all
the tests were greater than the probabilities.
Table 4.6 Heteroscedasticity Tests
TESTS F-statistic Obs*R-squared
Prob. F(7,22)
Prob. Chi-Square (7)
ARCH 2.225654 2.208470 0.0008 0.1373
HARVEY 4.652030 17.90416 0.0025 0.0124
BREUSCH-GODFREY 5.662304 19.29199 0.0008 0.0073
Source: Research 2013
Overtime stability of coefficients was checked using Cusum test as shown in Figure 4.1.
The results of the Cusum test showed that the coefficients used in the study were stable at
5% significance level since they fall within -5 and +5 range and therefore could be used
for forecasting.
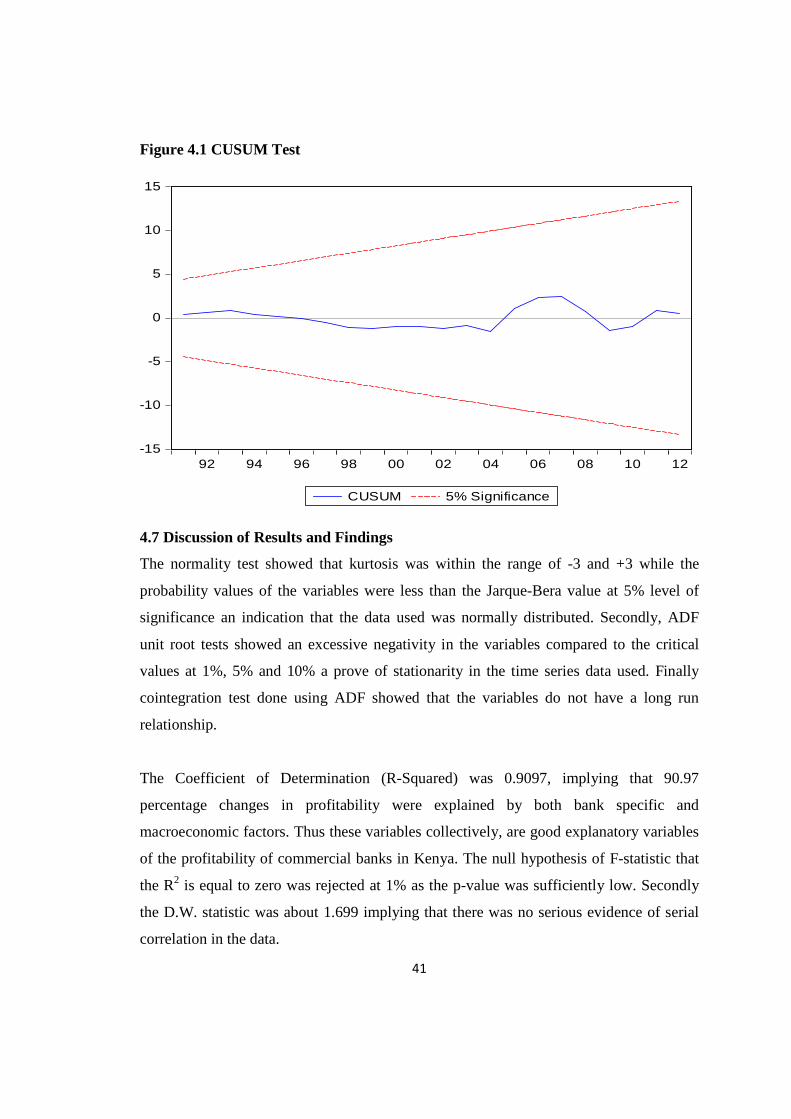
41
Figure 4.1 CUSUM Test
-15
-10
-5
0
5
10
15
92 94 96 98 00 02 04 06 08 10 12
CUSUM 5% Significance
4.7 Discussion of Results and Findings
The normality test showed that kurtosis was within the range of -3 and +3 while the
probability values of the variables were less than the Jarque-Bera value at 5% level of
significance an indication that the data used was normally distributed. Secondly, ADF
unit root tests showed an excessive negativity in the variables compared to the critical
values at 1%, 5% and 10% a prove of stationarity in the time series data used. Finally
cointegration test done using ADF showed that the variables do not have a long run
relationship.
The Coefficient of Determination (R-Squared) was 0.9097, implying that 90.97
percentage changes in profitability were explained by both bank specific and
macroeconomic factors. Thus these variables collectively, are good explanatory variables
of the profitability of commercial banks in Kenya. The null hypothesis of F-statistic that
the R2 is equal to zero was rejected at 1% as the p-value was sufficiently low. Secondly
the D.W. statistic was about 1.699 implying that there was no serious evidence of serial
correlation in the data.
42
The findings also showed that capital adequacy makes a significant contribution to
profitability of the commercial banks in Kenya, as the relatively high coefficient of equity
to assets ratio (CAP) of 0.246. The ratio is positive, significant and its effect remains
dominant. Therefore, an increase in capital leads to an increase in profitability. This
finding is consistent with previous studies of (Berger, 1995; Dermigu-Kunt and Huizinga,
1999; Ben Nacuer, 2003; and Kosmidou, 2006) and indicates that well capitalized banks
face lower costs of going bankrupt. This also suggests a reduced cost of funding or lower
need for external funding hence implying high profits.
Asset quality (ASQ) has a negative coefficient of -0.110. This means that a higher ratio
of asset quality (in terms of non-performing loans to gross loans) leads to lower
profitability. This is consistent with previous findings of (Kosmidou, 2008; and Flamini
et al, 2009). The findings show that local banks need to improve their process of
screening credit given to customers and monitoring of the credit risk. This is an important
indicator as local banks have had serious problems with the non-performing loans in the
past which have also led to collapse of many banks. These results support the need for
CBK’s move to establish a credit bureau aimed at helping banks reduce the rate of bad
loans in the industry and thus improving profitability.
As in the previous studies, the results concerning liquidity management (LIM) are mixed.
This ration has a positive effect on ROA, consistent with (Bourke, 1989; and Kosmidou,
2006). On the contrary, (Molyneux and Thorton, 1989; Guru et al, 1999) reveals a
negative sign which is only significant in the presence of other external factors. This
study found the effect of LIM as 0.039, implying that an increase in LIM leads to an
increase in profitability. The coefficient is however very weak and may have insignificant
impact on profitability of commercial banks.
As expected the coefficient of income-cost ratio or cost efficiency (CEF) is negative -
0.145 and very significant, suggesting that efficiency in expenses management is a robust
determinant of profitability of banks in Kenya. The study found that a 1% increase in
43
operational costs could results in 14.5% decrease in profitability. (Flamini et al, 2009);
(Pasiouras et al, 2006); (Guru et al, 1999; and Neceur, 2003) also confirm this inverse
relationship for Greece, Australia, Malasyia respectively. It is therefore obvious that a lot
needs to be done to reduce staff wage costs and administrative costs within the sector to
improve profitability. The strong negative impact of CEF indicates that banks are not able
to pass all their operating cost to customers which may be an indicator of the
competiveness and lack of market power within the sector.
Results of the macroeconomic variables indicators i.e. economics growth rate (GDP),
inflation rate (INF) and real interest rates (RRR) also have significant implication on
bank profits in Kenya. The coefficient of GDP is given as 0.178 meaning that increase in
GDP leads to increase in banks profitability hence the positive and significant coefficient.
RRR has a negative coefficient of (-0.092). This implies that adjustment of interest rates
upwards have a negative impact on profitability. Similarly, the negative association
between INF and bank profitability is consistent with the findings of previous studies like
(Dermiguk-Kunt and Huizinga, 1999). The INF coefficient in this study was (-0.009);
which is however, insignificant. Previous studies argue that positive association supports
the theory that inflation was unanticipated giving banks little or no opportunity to adjust
the interest rates accordingly, even though this has very minimal impact on profitability.
44
CHAPTER FIVE
CONCLUSION AND POLICY RECOMMENDATIONS
5.1 Conclusion
The liberalization of the Kenyan Banking System, the harmonization of the legal system
so as to meet the international standards, and the radical technological changes
(expansion of ATM network across the country, mobile banking, internet banking, etc)
have markedly affected the structure of the banking sector. The banks, through a process
of acquisitions, mergers and expansion have attempted to enforce their position in the
new banking era created by the adoption of modern technology. This strategy is expected
to exploit economies of scale and support the provision of new financial services, such as
asset management and financing etc. In addition, the expansion of the market share of
private banks is a step towards the direction of intensifying competition. In parallel, the
improvement of competitiveness of the state owned banks and the increase of the demand
for financial services act together so as to enforce further competition.
This paper investigates the determinants of commercial banks profitability in Kenya for
the 2000-2012 periods. This is also the main objective of the study. Two specific
objectives were derived from the main objective. The first objective was to determine the
effects of bank-specific factors on profitability of commercial banks in Kenya expressed
within the CAMEL framework. The second objective was to determine the effects of
macroeconomic factors on the profitability of commercial banks in Kenya which
included economic growth, inflation and real interest rates. The study employed panel
data technique and was analyzed using multiple linear regression models. The study
found out that profitability is significantly determined by the bank specific factors more
than the macroeconomic factors. Therefore, profitability of commercial is determined by
those factors that aim to increase capitalization, reduce operating costs and improve the
quality of assets through reduction of the non-performing loans and maintaining the right
levels of liquid assets. Thus it can be concluded that profitability in the Kenyan banking
sector is largely driven by managerial decision than market factors.
45
5.2 Policy Implications
Overall empirical findings provide evidence that profitability of Kenyan commercials
banks is influenced by both bank-specific factors that have a direct relationship with bank
management and macroeconomic factors that are not the direct result of a bank
managerial decision. These findings call for a number of policy interventions in Kenya;
given the low poor performance in terms of profitability. Low profitability levels
reflected lack of competiveness and inefficiency within the banking sector. Policies
would probably need to be directed at improving risk management and technology,
strengthening supportive information and bank supervision, developing inter-bank,
securities and equity markets and at maintaining macroeconomic stability.
At the bank level, the improvement of the profitability of Kenyan commercial banks need
to be conducted by reinforcement of the capitalization of banks through national
regulation programs, by reducing the proportion of non-interest bearing assets to the
benefit of bank loans.
The government and other concerned financial management institutions need to take into
account the main fabrics and other policy repercussions towards commercial bank
profitability that have gained considerable importance in Kenyan financial sector. This
could probably be achieved through undertaking comprehensive and rigorous stress
testing to avoid risks associated with market failures in the sector.
Supervisory and related services should be geared towards optimum utilization of
resources, prudent risk management, sound competitive environment and excellence in
service. For commercial banks in Kenya, there is need to be more risk vigilant related to
changing macroeconomic factors in liberalized regimes across the country. Further, it
would also be important to look into long term effects of inflation on the overall bank
performance and need to expect asymmetric effect of such uncertainties on bank’s
profitability.
46
REFERENCES
Abreu, M. and V. Mendes (2000), Commercial Bank Interest Margins and Profitability:
Evidence for Some EU Countries, presented on the 50th International Altantic
Economic Conference.
Albertazzi, U., Gambacorta, L., 2009. Bank profitability and the business cycle. Journal
of Financial Stability 5, 393–409
Anyanwaokoro, M. (1996) Banking Methods and Processes. Enugu: Hosanna
Publications.
Athanasoglou , Panayiotis P., Delis, Matthaios D. and Staikouras, Christos K. (2008 )
Determinants of Bank Profitability in South Eastern European Region, -MPRA
Paper No.10274.
Baral, K. J. (2005). Health Check-up of Commercial Banks in the Framework of
CAMEL: A Case Study of Joint Venture Banks in Nepal. The Journal of Nepalese
Business Studies. Vol II No.1.
Bashir, A. M. and M. K. Hassan (2003), Determinants of Islamic Banking Profitability,
presented on the ERF 10th Annual Conference.
Ben Naceur, S .and Goaied, M. 2010. “The Determinants of Commercial Bank Interest
Margin and Profitability: Evidence from Tunisia. Under Review at the Journal of
Frontiers in Economics and Finance, Vol.5, No. 1, pp. 106-130.
Berger, A. (1994), “The Relationship between Capital and Earnings in Banking, ”Journal
of Money, Credit and Banking, Vol. 27, No. 2, 432-456.
47
Bobáková, I.V. (2003) “Raising the Profitability of Commercial Banks”. BIATEC,
Volume XI, pp. 21-25.
Bikker, J.A., Hu, H., 2002. Cyclical patterns in profits, provisioning and lending of banks
and procyclicality of the new Basel capital requirements. BNL Quarterly Review
221, 143–175.
Bonin, J.P., Hasan, I. and P. Wachtel (2005). “Bank performance, efficiency and
ownership in transition countries.” Journal of Banking and Finance 29, 31-53.
Bourke, P. (1989), “Concentration and Other Determinants of Bank Profitability in
Europe, North America and Australia,” Journal of Banking and Finance, Vol. 13,
65-79
Calza, A., Gartner, C., Sousa, J., 2003. Modelling the demand for loans to the private
sector in the euro area. Applied Economics 35, 107–117.
Central Bank of Kenya (2000). Bank Supervision Annual Report 2000-2010. Central
Bank of Kenya, Nairobi.
Choi, S. & Kotrozo, J. (2006). Diversification, Bank Risk and Performance: A Cross-
country Comparison.
Claessens, S., Demirguc-Kunt, A. and H. Huizinga (2001). “How does foreign entry
affect domestic banking markets?” Journal of Banking and Finance 25, 891- 911.
Claeys, S., Vander Vennet, R., 2008. Determinants of bank interest margins in Central
and Eastern Europe: A comparison with the West economic systems 32, 197–216.
48
Dermerguc-Kunt,A. and Huizinga, H., 2001. Financial Structure and Bank Profitability in
Financial Structure and Economic Growth: A Cross-Country Comparison of
Banks, Markets and Development,(eds). Asli Dermirgue-Kunt and Rose Levine.
Cambridge ,MA:MIT Press.
Dietrich, A., Wanzenried, G., 2011. Determinants of bank profitability before and during
the crisis: Evidence from Switzerland. Journal of International Financial Markets,
Institutions and Money, doi:10.1016/j.intfin.
Duca, J. and M. McLaughlin (1990). “Developments affecting the profitability of
commercial banks.” Federal Reserve Bulletin, July.
Eichengreen, B. and H.D. Gibson (2001). “Greek banking at the dawn of the new
millennium.” CERP Discussion Paper 2791, London
Gavila, S. & Santabarbara, D. (2009). What Explains the low Profitability in Chinese
Banks.W/P30.
Gitman, L.J. (2007) Principles of Managerial Finance (Twelfth Edition). Boston, MA:
Pearson Education, Inc.
Goddard, J., Molyneux, P. and Wilson, J.O.S., 2004. The Profitability of European
Banks: Cross sectional and Dynamic Panel Analysis. Machester School, Vol.72
(3) pp.
Gujarati, D. N. (2007). Basic Econometrics. McGraw-hill. New York
49
Kamau, A.W. (2009). Efficiency in the Banking Sector: An Empirical Investigation of
Commercial Banks in Kenya. A thesis submitted in partial fulfillment of the
Requirements of Nairobi University for the Degree of Doctor of Philosophy.
Nairobi: University of Nairobi
Kosmidou, K. (2008). The determinants of banks profits in Greece during the period of
EU Financial integration. Journal of Managerial Finance.
Mathuva, D. (2009). Capital Adequacy, Cost Income Ratio and the Performance of
Commercial Banks: The Kenyan Scenario. International journal of Applied
Economics and Finance.
Maudos, J., de Guevara, J.F., 2004. Factors explaining the interest margin in the banking
sectors of the European Union. Journal of Banking and Finance 28, 2259–2281.
Miller, S. and A. Noulas (1997). “Portfolio mix and large-bank profitability in the USA.”
Applied Economics 29, 505-512
Molyneux, P. and J. Thornton (1992), “Determinants of European Bank Profitability: A
Note,” Journal of Banking and Finance, Vol. 16, No. 6, 1173-8.
Mwega, F.M. (2009). Global Financial Crisis: Kenya: Discussion series. Paper 7.
Naceur, S.(2003). The Determinants of the Tunisian Banking Industry Profitability: Panel
Evidence. [Online]. Available from: www.mafhoum.com/press6/ 174E11.
Panayiotis, P., Anthanasoglou Sophocles, Brissimis, N. and Mathaios, D. D., 2005. Bank
67 Specific, Industry-Specific and Macroeconomic Determinants of Bank
Profitability. Bank of Greece Working Paper, 25.
50
Pasiouras, F., Kosmidou, K., 2007. Factors influencing the profitability of domestic and
foreign commercial banks in the European Union. Research in International
Business and Finance 21, 222–237
Samad, Abdus , ( 2004 ) Bahrain's Commercial Bank Performances During 1994-2001,
Credit & Financial Management Review ( working paper )
Staikouras, C. and G. Wood (2003), The Determinants of Bank Profitability in Europe,
Paper presented at the European Applied Business Research Conference.
Sufian, F. & Chong, R. R. (2008). Determinants of Bank Profitability in a Developing
Economy: Empirical Evidence from Philippines. Asian Academy of Management
Journal of Accounting and Finance.
Tang, H., Zoli, E. and I. Klytchnikova (2000). “Banking crises in transition economies.
Fiscal costs and related issues.” World Bank Policy Research Working Paper No.
2484.
Toni Uhomoibhi, (2008), Determinants of Bank Profitability: Macroeconomic Evidence
from Nigeria , Deakin university, (working paper).
Uzhegova, O. (2010). The Relative Importance of Bank-specific Factors for Bank
Profitability in Developing Economies/P 2010/02.