Embed Size (px)
Citation preview

ABSTRACT
This is the second part on the design of a high aspect ratio HALE-UAV wing using composite materials. The first paper deals only with the static strength analysis. This paper is a continuation of the first paper and presents buckling and flutters analysis. The wing was made of a carbon/epoxy laminate with orthotropic arrangement, [0°/0°/45°/-45°]s. Buckling phenomenon was evaluated only at the upper wing box skin panel and used linear analytical equation to determine the critical buckling load in each skin panel. The results showed that the upper wing skin was not safe from buckling and it needs structural thickness improvement. Flutter analysis was then performed on this configuration by using numerical approach based on finite element structural models and doublet lattice method. This analysis used finite element software and implemented p-k method to compute the flutter conditions. It was found that the designed wing structure has high flutter speed and it was safe from flutter phenomenon.
Keywords: Buckling, Composite Structures, Flutter Analysis, High Aspect Ratio HALE Wing
Introduction
Recently, the development of High Altitude Long Endurance (HALE) aircraft has been the focus of research in several countries, since it can be used for several applications, such as scientific data collection, communications relay, and surveillance and reconnaissance missions [1-3]. This vehicle implements high
The Design of a High Aspect Ratio HALE Aircraft Composite Wing.
Part II: Buckling and Flutter Speed Analysis
Bambang K. HadiIndraPermana
Lightweight Structures Research GroupFaculty of Mechanical and Aerospace Engineering
Institute of Technology BandungJl. Ganesha 10, Bandung 40132
Indonesia
journal jMeche Vol 12.indd 13 4/20/2016 12:38:37 PM

14
Journal of Mechanical engineering (JMeche)
aspect ratio wing to obtain good aerodynamic performances supported by composite wing structures to reduce the weight of the aircraft. HALE UAV was designed to be able to fly in high altitude up to 65,000 feet and long endurance up to 36 hours. Some of the HALE aircrafts that has been operated before, such as RQ-4 NASA Global Hawk [4] and Boeing Phantom Eye [5] also use composite materials for the primary structures. The composite materials are currently used to substitute metal alloys because it has high strength to weight and stiffness to weight ratio. Research by Kennedy and Martin [6] showed that composite wing structure was about 34% to 40% lighter than the equivalent metal wing structure.
In this paper, buckling and flutter analyses of high aspect ratio composite wing aircraft are presented. These are important since buckling and flutter can produce catastrophic failure to the structure. The wing structure had been evaluated before by static analysis and it was found that it was safe from static failure. The previous study also showed that orthotropic laminate configuration of (0o/0o/+45o/-45o)s produced the lightest wing compared to quasi-isotropic and aluminum configurations. Therefore, in the present paper, only orthotropic laminate configuration was studied.
Buckling and flutter analyses were performed only for wing primary structures that consist of wing skin, spars, and ribs, without any control surface, payload, and other external loads. Buckling phenomenon was evaluated only at the upper wing box skin panel because it suffer higher compression load than the other parts. The only load acting on each panel was the compression load in span wise direction. The other type of buckling load, such as chord wise compression and shear load was assumed much smaller than span wise compression load. Thus, it can be neglected. The boundary conditions in all edges of each panel were assumed to be simply supported. Wing structure modification was limited only for the skin panel thickness. This modification was needed when the wing structure was not safe from buckling.
Flutter is one of the aeroelasticity phenomena that involve structural (inertia and elasticity) and unsteady aerodynamic forces and moments. Flutter can be defined as the dynamic instability from an elastic body in airflow [7]. This phenomenon can be predicted using several approach method, such as p method, k method, and p-k method. Flutter calculation in this paper were performed using MSC/NASTRAN that utilized p-k method to solve the flutter equation and doublet-lattice method to obtain aerodynamic parts in the calculation.
Naidu and Adali [8] designed a MALE UAV wingbox structures using combination of CFRP materials and sandwich structures. However, no detail CFRP lay-up configuration was presented. Romeo et al. [9] designed a wing box for solar powered HALE UAV, using GA algorithme. The composite analysis used progressive failure analysis to achieve Last Ply Failure loads, rather than First Paly Failure loads. However, the wing was modeled using long beam. In theaeroelastic analysis, Koohi [10] analysed model and aeroelasticbehaviour of high-aspect-ratio wing with large deflection capability. The analysis included geometric structural
journal jMeche Vol 12.indd 14 4/20/2016 12:38:37 PM

15
The Design of a high aspecT RaTio haLe aiRcRafT composiTe Wing. paRT ii
nonlinearity using finite element method. Stodiecket al [11] optimized composite wing laminates for aeroelastic tailoring. Lay-up configuration of (0o/±45o/90o)s was considered. Lastly, Richards [12] used design strategies common to rotorcraft blades and HALE aircraft wings to design a damage tolerant wind turbine blade.
The literature studies showed that the complete analysis of HALE aircraft wing has not been presented, that include lay-up configuration and static strength, buckling as well as flutter behaviours. Therefore, the novelty of this paper, is to provide a complete design and analysis for HALE aircraft wing.
Wing Structural Design
Wing geometry in this paper was adopted from Global Hawk RQ-4A wing as the baseline geometry. This aircraft is a modern HALE UAV aircraft that utilized high aspect ratio wing. Table 1 provides specifications of Global Hawk that is necessary for wing design. Nevertheless, the methodology presented in this paper can be used to design any HALE UAV aircraft wing.
Table 1: Global Hawk General SpecificationsWing Span 35.4 mLength 13.5 mHeight 4.2 mGross Take-off Weight 12,110.9 kgInternal Payload Capacity 680.4 kgPod Payload Capacity 317.5 kgFerry Range 20,372 kmMaximum Altitude 19.8 kmLoiter Velocity 343 kTASMaximum Endurance 31 hrs
The structure consists of 3 main components: 23 ribs with 80 cm rib spacing, 2 spars at 15% and 60% wing chord, and skin panels. The least weight was achieved when the lay-up configuration was (0o/0o/±45o)s. Therefore, this configuration was used in the buckling and flutter analysis in this paper. NASTRAN and shell elements were used extensively during the analysis.
The wing was divided into 9 main sections to define the components thickness. All wing components used carbon/epoxy T300/5208. From the study on the static strength analysis, the thickness distribution for each component was calculated. Table 2 gives the results. The total weight of the wing was found to be 647 kg.
journal jMeche Vol 12.indd 15 4/20/2016 12:38:37 PM
16
Journal of Mechanical engineering (JMeche)
Table 2: Distribution of Section Thickness Along the SpanRib
(mm)Skin (mm)
Spar (mm)
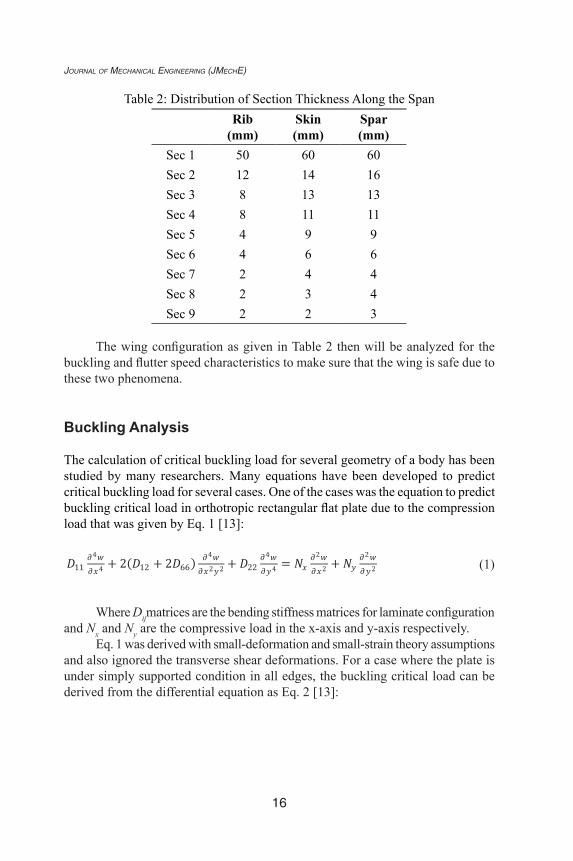
Sec 1 50 60 60Sec 2 12 14 16Sec 3 8 13 13Sec 4 8 11 11Sec 5 4 9 9Sec 6 4 6 6Sec 7 2 4 4Sec 8 2 3 4Sec 9 2 2 3
The wing configuration as given in Table 2 then will be analyzed for the buckling and flutter speed characteristics to make sure that the wing is safe due to these two phenomena.
Buckling Analysis
The calculation of critical buckling load for several geometry of a body has been studied by many researchers. Many equations have been developed to predict critical buckling load for several cases. One of the cases was the equation to predict buckling critical load in orthotropic rectangular flat plate due to the compression load that was given by Eq. 1 [13]:
The wing was divided into 9 main sections to define the components thickness. All wing components used carbon/epoxy T300/5208. From the study on the static strength analysis, the thickness distribution for each component was calculated. Table 2 gives the results. The total weight of the wing was found to be 647 kg.
Table 2Distribution of Section Thickness Along the Span
Rib Skin Spar Sec 1 50 60 60Sec 2 12 14 16Sec 3 8 13 13Sec 4 8 11 11Sec 5 4 9 9Sec 6 4 6 6Sec 7 2 4 4Sec 8 2 3 4Sec 9 2 2 3
The wing configuration as given in Table 2 then will be analyzed for the buckling and flutter speed characteristics to make sure that the wing is safe due to these two phenomena.
Buckling Analysis
The calculation of critical buckling load for several geometry of a body has been studied by many researchers. Many equations have been developed to predict critical buckling load for several cases. One of the cases was the equation to predict buckling critical load in orthotropic rectangular flat plate due to the compression load that was given by Eq. 1 [13]:
𝐷𝐷𝐷𝐷11𝜕𝜕𝜕𝜕4𝑤𝑤𝑤𝑤𝜕𝜕𝜕𝜕𝑥𝑥𝑥𝑥4 + 2(𝐷𝐷𝐷𝐷12 + 2𝐷𝐷𝐷𝐷66) 𝜕𝜕𝜕𝜕4𝑤𝑤𝑤𝑤
𝜕𝜕𝜕𝜕𝑥𝑥𝑥𝑥2𝑦𝑦𝑦𝑦2 + 𝐷𝐷𝐷𝐷22𝜕𝜕𝜕𝜕4𝑤𝑤𝑤𝑤𝜕𝜕𝜕𝜕𝑦𝑦𝑦𝑦4 = 𝑁𝑁𝑁𝑁𝑥𝑥𝑥𝑥
𝜕𝜕𝜕𝜕2𝑤𝑤𝑤𝑤𝜕𝜕𝜕𝜕𝑥𝑥𝑥𝑥2 + 𝑁𝑁𝑁𝑁𝑦𝑦𝑦𝑦
𝜕𝜕𝜕𝜕2𝑤𝑤𝑤𝑤𝜕𝜕𝜕𝜕𝑦𝑦𝑦𝑦2 (1)
Where Dijmatrices are the bending stiffness matrices for laminate configuration and Nx and Ny are the compressive load in the x-axis and y-axis respectively.
Eq. (1) was derived with small-deformation and small-strain theory assumptions and also ignored the transverse shear deformations. For a case where the plate is under simply supported condition in all edges, the buckling critical load can be derived from the differential equation as Eq.2 [13]:
(1)
Where Dijmatrices are the bending stiffness matrices for laminate configuration and Nx and Ny are the compressive load in the x-axis and y-axis respectively.
Eq. 1 was derived with small-deformation and small-strain theory assumptions and also ignored the transverse shear deformations. For a case where the plate is under simply supported condition in all edges, the buckling critical load can be derived from the differential equation as Eq. 2 [13]:
journal jMeche Vol 12.indd 16 4/20/2016 12:38:38 PM

17
The Design of a high aspecT RaTio haLe aiRcRafT composiTe Wing. paRT ii
𝑁𝑁𝑁𝑁𝑥𝑥𝑥𝑥 =𝜋𝜋𝜋𝜋2�𝐷𝐷𝐷𝐷11�
𝑚𝑚𝑚𝑚𝑎𝑎𝑎𝑎 �
2+2{𝐷𝐷𝐷𝐷12 +2𝐷𝐷𝐷𝐷66 }�𝑛𝑛𝑛𝑛𝑏𝑏𝑏𝑏�
2+𝐷𝐷𝐷𝐷22�
𝑛𝑛𝑛𝑛𝑏𝑏𝑏𝑏�
4�𝑎𝑎𝑎𝑎𝑚𝑚𝑚𝑚�
2�
1+𝛼𝛼𝛼𝛼�𝑎𝑎𝑎𝑎𝑏𝑏𝑏𝑏𝑛𝑛𝑛𝑛𝑚𝑚𝑚𝑚�
2 (2)
𝛼𝛼𝛼𝛼is the ratio between compression load in y-direction (𝑁𝑁𝑁𝑁𝑦𝑦𝑦𝑦 ) and x-direction (𝑁𝑁𝑁𝑁𝑥𝑥𝑥𝑥), while a and b are the length and width of the plate. In this paper, the compression load in y-direction is assumed to be much smaller than in x-direction, so that 𝑁𝑁𝑁𝑁𝑦𝑦𝑦𝑦 is assumed to be zero and the value of 𝛼𝛼𝛼𝛼 will also be zero. We assumed a simply-supported boundary conditions in all edges, since it will give the lowest buckling loads and thus a conservative approach.
Buckling critical load is reached when the combination of 𝑚𝑚𝑚𝑚 and 𝑛𝑛𝑛𝑛gives the lowest value of 𝑁𝑁𝑁𝑁𝑥𝑥𝑥𝑥 . If the value of 𝛼𝛼𝛼𝛼 is substituted with zero in Eq. (2), this will give the lowest value of 𝑁𝑁𝑁𝑁𝑥𝑥𝑥𝑥 by setting the value of 𝑛𝑛𝑛𝑛 = 1. The critical buckling load expression of Eq.2 reduces to Eq.3:
𝑁𝑁𝑁𝑁𝑥𝑥𝑥𝑥𝑥𝑥𝑥𝑥𝑥𝑥𝑥𝑥 = 𝜋𝜋𝜋𝜋2 �𝐷𝐷𝐷𝐷11 �𝑚𝑚𝑚𝑚𝑎𝑎𝑎𝑎�
2+ 2{𝐷𝐷𝐷𝐷12 + 2𝐷𝐷𝐷𝐷66 } �1
𝑏𝑏𝑏𝑏�
2+ 𝐷𝐷𝐷𝐷22 �
1𝑏𝑏𝑏𝑏�
4�𝑎𝑎𝑎𝑎𝑚𝑚𝑚𝑚�
2� (3)
Eq. (3) will be used to calculate critical buckling load in every upper wing-box skin panels.
Critical buckling loads were calculated for each upper wing-box skin panels. One panel was defined as a skin panel between 2 ribs and 2 spars. Thus, there will be 22 skin panels because the wing used 23 ribs and 2 spars.
Before calculating the critical buckling load, there was a simplification in the geometry of skin panels. The initial geometry of skin panel was not a rectangular flat plate, but it had a curvature that followed the airfoil geometry. Since the critical buckling load equation was derived for rectangular flat plate, the curved panel should be simplified into the flat one by project it to the flat plane. This simplification was valid to get the conservative results since the flat plate has lower second moment of inertia than the curved one. This will give the critical buckling load for flat plate is also lower than the curved plate.
The result of the buckling analysis is given Table 3. Table 3 shows that all upper panels failed due to buckling, since the value of the applied load is higher than the critical buckling loads, Nxcr. Therefore, the thickness of the upper skin panel must be increased to make sure that the load is lower than the critical buckling loads. The procedure was repeated until all the upper panels were safe from buckling.
(2)
α is the ratio between compression load in y-direction (Ny) and x-direction (Nx), while a and b are the length and width of the plate. In this paper, the compression load in y-direction is assumed to be much smaller than in x-direction, so that Ny is assumed to be zero and the value of α will also be zero. We assumed a simply-supported boundary conditions in all edges, since it will give the lowest buckling loads and thus a conservative approach.
Buckling critical load is reached when the combination of and gives the lowest value of Nx. If the value of is substituted with zero in Eq. 2, this will give the lowest value of Nx by setting the value of . The critical buckling load expression of Eq.2 reduces to Eq.3:
𝑁𝑁𝑁𝑁𝑥𝑥𝑥𝑥 =𝜋𝜋𝜋𝜋2�𝐷𝐷𝐷𝐷11�
𝑚𝑚𝑚𝑚𝑎𝑎𝑎𝑎 �
2+2{𝐷𝐷𝐷𝐷12 +2𝐷𝐷𝐷𝐷66 }�𝑛𝑛𝑛𝑛𝑏𝑏𝑏𝑏�
2+𝐷𝐷𝐷𝐷22�
𝑛𝑛𝑛𝑛𝑏𝑏𝑏𝑏�
4�𝑎𝑎𝑎𝑎𝑚𝑚𝑚𝑚�
2�
1+𝛼𝛼𝛼𝛼�𝑎𝑎𝑎𝑎𝑏𝑏𝑏𝑏𝑛𝑛𝑛𝑛𝑚𝑚𝑚𝑚�
2 (2)
𝛼𝛼𝛼𝛼is the ratio between compression load in y-direction (𝑁𝑁𝑁𝑁𝑦𝑦𝑦𝑦 ) and x-direction (𝑁𝑁𝑁𝑁𝑥𝑥𝑥𝑥), while a and b are the length and width of the plate. In this paper, the compression load in y-direction is assumed to be much smaller than in x-direction, so that 𝑁𝑁𝑁𝑁𝑦𝑦𝑦𝑦 is assumed to be zero and the value of 𝛼𝛼𝛼𝛼 will also be zero. We assumed a simply-supported boundary conditions in all edges, since it will give the lowest buckling loads and thus a conservative approach.
Buckling critical load is reached when the combination of 𝑚𝑚𝑚𝑚 and 𝑛𝑛𝑛𝑛gives the lowest value of 𝑁𝑁𝑁𝑁𝑥𝑥𝑥𝑥 . If the value of 𝛼𝛼𝛼𝛼 is substituted with zero in Eq. (2), this will give the lowest value of 𝑁𝑁𝑁𝑁𝑥𝑥𝑥𝑥 by setting the value of 𝑛𝑛𝑛𝑛 = 1. The critical buckling load expression of Eq.2 reduces to Eq.3:
𝑁𝑁𝑁𝑁𝑥𝑥𝑥𝑥𝑥𝑥𝑥𝑥𝑥𝑥𝑥𝑥 = 𝜋𝜋𝜋𝜋2 �𝐷𝐷𝐷𝐷11 �𝑚𝑚𝑚𝑚𝑎𝑎𝑎𝑎�
2+ 2{𝐷𝐷𝐷𝐷12 + 2𝐷𝐷𝐷𝐷66 } �1
𝑏𝑏𝑏𝑏�
2+ 𝐷𝐷𝐷𝐷22 �
1𝑏𝑏𝑏𝑏�
4�𝑎𝑎𝑎𝑎𝑚𝑚𝑚𝑚�
2� (3)
Eq. (3) will be used to calculate critical buckling load in every upper wing-box skin panels.
Critical buckling loads were calculated for each upper wing-box skin panels. One panel was defined as a skin panel between 2 ribs and 2 spars. Thus, there will be 22 skin panels because the wing used 23 ribs and 2 spars.
Before calculating the critical buckling load, there was a simplification in the geometry of skin panels. The initial geometry of skin panel was not a rectangular flat plate, but it had a curvature that followed the airfoil geometry. Since the critical buckling load equation was derived for rectangular flat plate, the curved panel should be simplified into the flat one by project it to the flat plane. This simplification was valid to get the conservative results since the flat plate has lower second moment of inertia than the curved one. This will give the critical buckling load for flat plate is also lower than the curved plate.
The result of the buckling analysis is given Table 3. Table 3 shows that all upper panels failed due to buckling, since the value of the applied load is higher than the critical buckling loads, Nxcr. Therefore, the thickness of the upper skin panel must be increased to make sure that the load is lower than the critical buckling loads. The procedure was repeated until all the upper panels were safe from buckling.
(3)
Eq. 3 will be used to calculate critical buckling load in every upper wing-box skin panels.
Critical buckling loads were calculated for each upper wing-box skin panels. One panel was defined as a skin panel between 2 ribs and 2 spars. Thus, there will be 22 skin panels because the wing used 23 ribs and 2 spars.
Before calculating the critical buckling load, there was a simplification in the geometry of skin panels. The initial geometry of skin panel was not a rectangular flat plate, but it had a curvature that followed the airfoil geometry. Since the critical buckling load equation was derived for rectangular flat plate, the curved panel should be simplified into the flat one by project it to the flat plane. This simplification was valid to get the conservative results since the flat plate has lower second moment of inertia than the curved one. This will give the critical buckling load for flat plate is also lower than the curved plate.
The result of the buckling analysis is given Table 3. Table 3 shows that all upper panels failed due to buckling, since the value of the applied load is higher than the critical buckling loads, Nxcr. Therefore, the thickness of the upper skin panel must be increased to make sure that the load is lower than the critical buckling loads. The procedure was repeated until all the upper panels were safe from buckling.
journal jMeche Vol 12.indd 17 4/20/2016 12:38:38 PM

18
Journal of Mechanical engineering (JMeche)
Table 3: Buckling Analysis of the Upper Wing with the Initial ConfigurationPanel Thickness
(mm)Nxcr
(N/m)Load(N/m)
Safe/Fail?
2 14 -9.15E+05 -5.56E+06 Fail3 14 -9.51E+05 -5.28E+06 Fail4 13 -7.95E+05 -5.02E+06 Fail5 13 -8.32E+05 -4.74E+06 Fail6 13 -8.74E+05 -4.43E+06 Fail7 11 -5.57E+05 -4.09E+06 Fail8 11 -5.90E+05 -3.78E+06 Fail9 11 -6.28E+05 -3.46E+06 Fail10 9 -3.68E+05 -3.15E+06 Fail11 9 -3.95E+05 -2.83E+06 Fail12 9 -4.27E+05 -2.50E+06 Fail13 6 -1.37E+05 -2.18E+06 Fail14 6 -1.51E+05 -1.86E+06 Fail15 6 -1.67E+05 -1.55E+06 Fail16 4 -5.48E+04 -1.25E+06 Fail17 4 -6.21E+04 -9.76E+05 Fail18 4 -7.14E+04 -7.23E+05 Fail19 3 -3.42E+04 -4.75E+05 Fail20 3 -4.06E+04 -2.87E+05 Fail21 2 -1.30E+04 -1.15E+05 Fail22 2 -1.41E+04 -2.51E+04 Fail
The final configuration is given in Table 4. Table 4 shows that the final configuration fulfills the buckling requirements. All panels are safe from buckling, since the loads are lower than the critical buckling loads. The final configuration will then be analyzed for flutter phenomena.
journal jMeche Vol 12.indd 18 4/20/2016 12:38:38 PM

19
The Design of a high aspecT RaTio haLe aiRcRafT composiTe Wing. paRT ii
Table 4: Critical Buckling Analysis for the Final Configuration
PanelInitial
thickness (mm)
Final thickness
(mm)
Nxcr (N/m)
Load (N/m)
Safe/Fail?
2 14 26 -5.87E+06 -5.56E+06 Safe3 14 25 -5.42E+06 -5.28E+06 Safe4 13 25 -5.66E+06 -5.02E+06 Safe5 13 24 -5.24E+06 -4.74E+06 Safe6 13 23 -4.84E+06 -4.43E+06 Safe7 11 22 -4.46E+06 -4.09E+06 Safe8 11 21 -4.11E+06 -3.78E+06 Safe9 11 20 -3.78E+06 -3.46E+06 Safe
10 9 19 -3.47E+06 -3.15E+06 Safe11 9 18 -3.17E+06 -2.83E+06 Safe12 9 17 -2.89E+06 -2.50E+06 Safe13 6 16 -2.63E+06 -2.18E+06 Safe14 6 14 -1.94E+06 -1.86E+06 Safe15 6 13 -1.71E+06 -1.55E+06 Safe16 4 12 -1.51E+06 -1.25E+06 Safe17 4 10 -9.92E+05 -9.76E+05 Safe18 4 9 -8.32E+05 -7.23E+05 Safe19 3 8 -6.78E+05 -4.75E+05 Safe20 3 6 -3.33E+05 -2.87E+05 Safe21 2 5 -2.13E+05 -1.15E+05 Safe22 2 3 -4.97E+04 -2.51E+04 Safe
Flutter Speed Analysis
In this paper, flutter bahaviours were analyzed by using finite element method for the structural parts, and doublet lattice method for the aerodynamic part. Unlike the wing model for the static strength analysis, the flutter model used 599 elements that are showed in Figure 1. The aerodynamic grid was developed to solve the aerodynamic parts of flutter equation. Figure 2 shows the configuration of aerodynamic grid, in which it used 80 panels along the span and 8 panels along the chord. The structural and aerodynamic models of the wing were disconnected
journal jMeche Vol 12.indd 19 4/20/2016 12:38:38 PM

20
Journal of Mechanical engineering (JMeche)
until the splines are defined to build an interpolation matrix. In this case, the surface splines were used to build an interpolation matrix between structural and aerodynamic models.
7 11 22 -4.46E+06 -4.09E+06 Safe8 11 21 -4.11E+06 -3.78E+06 Safe9 11 20 -3.78E+06 -3.46E+06 Safe
10 9 19 -3.47E+06 -3.15E+06 Safe11 9 18 -3.17E+06 -2.83E+06 Safe12 9 17 -2.89E+06 -2.50E+06 Safe13 6 16 -2.63E+06 -2.18E+06 Safe14 6 14 -1.94E+06 -1.86E+06 Safe15 6 13 -1.71E+06 -1.55E+06 Safe16 4 12 -1.51E+06 -1.25E+06 Safe17 4 10 -9.92E+05 -9.76E+05 Safe18 4 9 -8.32E+05 -7.23E+05 Safe19 3 8 -6.78E+05 -4.75E+05 Safe20 3 6 -3.33E+05 -2.87E+05 Safe21 2 5 -2.13E+05 -1.15E+05 Safe22 2 3 -4.97E+04 -2.51E+04 Safe
Flutter Speed Analysis
In this paper, flutter bahaviours were analyzed by using finite element method for the structural parts, and doublet lattice method for the aerodynamic part. Unlike the wing model for the static strength analysis, the flutter model used 599 elements that are showed in Fig. 1. The aerodynamic grid was developed to solve the aerodynamic parts of flutter equation. Fig. 2shows the configuration of aerodynamic grid, in which it used 80 panels along the span and 8 panels along the chord. The structural and aerodynamic models of the wing were disconnected until the splines are defined to buildan interpolation matrix. In this case, the surface splines were used to build an interpolation matrix between structural and aerodynamic models.
Fig 1. Wing Finite Element Model for Flutter CaseFigure 1: Wing Finite Element Model for Flutter Case
Fig. 2. Wing Aerodynamic Grid Model
Flutter analysis were performed at two level altitudes: sea level and 65,000 ft (19.8 km), in which it was the highest operational altitude of Global Hawk. This analysis was only limited at low and high subsonic only. The flutter case at supersonic speed was not studied in this paper because maximum cruising speed of the aircraft was only at high subsonic. This analysis utilized p-k method to solve flutter characteristic of wing and it needs normal modes analysis as the input.
Output of this analysis was the two plots, the frequency-velocity and damping-velocity plots. The first plot was used to determine the two or more modes that interact to create flutter and the second plot was used to predict the flutter speed and mode in one particular altitude and Mach number. Flutter speed can be determined by finding the speed at damping value that equal or larger than 0.03. This is in accordance with the prevailing regulation in which in this case it used MIL-A-8870B [13].
The interaction between inertia and elasticity of the structure determines the dynamic characteristics of the structure that is interpreted by normal modes and natural frequencies. In this paper, the first 10 modes and natural frequencies are generated as shown in Table 5. Figure 3 and 4 showed two important modes from the analysis.
Table 5. The First 10 Modes of the Aircraft WingNormal Modes
Frequency (Hz) Name
1 3.24 1st vertical bending2 9.91 1st mix vertical and in-plane bending3 10.38 2nd vertical bending4 22.97 3rd vertical bending5 33.58 1st in-plane bending6 41.24 4th vertical bending7 53.33 1st torsion
Figure 2: Wing Aerodynamic Grid Model
Flutter analysis were performed at two level altitudes: sea level and 65,000 ft (19.8 km), in which it was the highest operational altitude of Global Hawk. This analysis was only limited at low and high subsonic only. The flutter case at supersonic speed was not studied in this paper because maximum cruising speed of the aircraft was only at high subsonic. This analysis utilized p-k method to solve flutter characteristic of wing and it needs normal modes analysis as the input.
Output of this analysis was the two plots, the frequency-velocity and damping-velocity plots. The first plot was used to determine the two or more modes that interact to create flutter and the second plot was used to predict the flutter speed and mode in one particular altitude and Mach number. Flutter speed can be determined by finding the speed at damping value that equal or larger than 0.03. This is in accordance with the prevailing regulation in which in this case it used MIL-A-8870B [13].
The interaction between inertia and elasticity of the structure determines the dynamic characteristics of the structure that is interpreted by normal modes and
journal jMeche Vol 12.indd 20 4/20/2016 12:38:38 PM

21
The Design of a high aspecT RaTio haLe aiRcRafT composiTe Wing. paRT ii
natural frequencies. In this paper, the first 10 modes and natural frequencies are generated as shown in Table 5. Figure 3 and 4 show two important modes from the analysis.
Table 5: The First 10 Modes of the Aircraft WingNormal Modes
Frequency (Hz) Name
1 3.24 1st vertical bending2 9.91 1st mix vertical and in-plane bending3 10.38 2nd vertical bending4 22.97 3rd vertical bending5 33.58 1st in-plane bending6 41.24 4th vertical bending7 53.33 1st torsion8 65.09 5th vertical bending9 74.49 2nd in-plane bending
10 93.78 1st mix vertical bending and torsion
8 65.09 5th vertical bending9 74.49 2nd in-plane bending10 93.78 1st mix vertical bending and torsion
Fig. 3: The first bending mode with the frequency of 3.24 Hz
Fig.4: The first torsion mode (mode 7) with the frequency of 53.3 Hz
Fig. 5 shows flutter analysis result at sea level and Mach 0 for the first 10 modes. Mach 0 indicates a very low speed. Later, during the flutter analysis, the Mach number will be increased repeatedly. Fig. 5.a is the frequency-velocity plot in which it shows the different modes that interact to create flutter, while Fig. 5.b is the damping-velocity plot. Flutter phenomenon is indicated by the approaching of the frequency of two or more modes. As shown in Fig. 5, there are two modes in which its frequency are getting closer with increasing speed. They aremode no 2, which is the first mix vertical and in-plane bending mode, and mode no 7, which is the first torsion mode. The flutter speed can be determined from Fig. 5 in which it is shown by the speed at damping value that equal or larger than 0.03. In this case, the flutter speed is 444 m/s. These two plots are only for one particular altitude and Mach number. For flutter analysis at sea level, flutter analysis should be performed for several Mach number until the maximum cruising speed is reached. Thus, these similar analyses were performed and repeatedagain and the result is showed in Fig 6.
In order to make sure that the wing structure is safe from flutter phenomenon, the regulation says that the margin of safety between the flutter
Figure 3: The first bending mode with the frequency of 3.24 Hz
8 65.09 5th vertical bending9 74.49 2nd in-plane bending10 93.78 1st mix vertical bending and torsion
Fig. 3: The first bending mode with the frequency of 3.24 Hz
Fig.4: The first torsion mode (mode 7) with the frequency of 53.3 Hz
Fig. 5 shows flutter analysis result at sea level and Mach 0 for the first 10 modes. Mach 0 indicates a very low speed. Later, during the flutter analysis, the Mach number will be increased repeatedly. Fig. 5.a is the frequency-velocity plot in which it shows the different modes that interact to create flutter, while Fig. 5.b is the damping-velocity plot. Flutter phenomenon is indicated by the approaching of the frequency of two or more modes. As shown in Fig. 5, there are two modes in which its frequency are getting closer with increasing speed. They aremode no 2, which is the first mix vertical and in-plane bending mode, and mode no 7, which is the first torsion mode. The flutter speed can be determined from Fig. 5 in which it is shown by the speed at damping value that equal or larger than 0.03. In this case, the flutter speed is 444 m/s. These two plots are only for one particular altitude and Mach number. For flutter analysis at sea level, flutter analysis should be performed for several Mach number until the maximum cruising speed is reached. Thus, these similar analyses were performed and repeatedagain and the result is showed in Fig 6.
In order to make sure that the wing structure is safe from flutter phenomenon, the regulation says that the margin of safety between the flutter
Figure 4: The first torsion mode (mode 7) with the frequency of 53.3 Hz
journal jMeche Vol 12.indd 21 4/20/2016 12:38:38 PM
22
Journal of Mechanical engineering (JMeche)
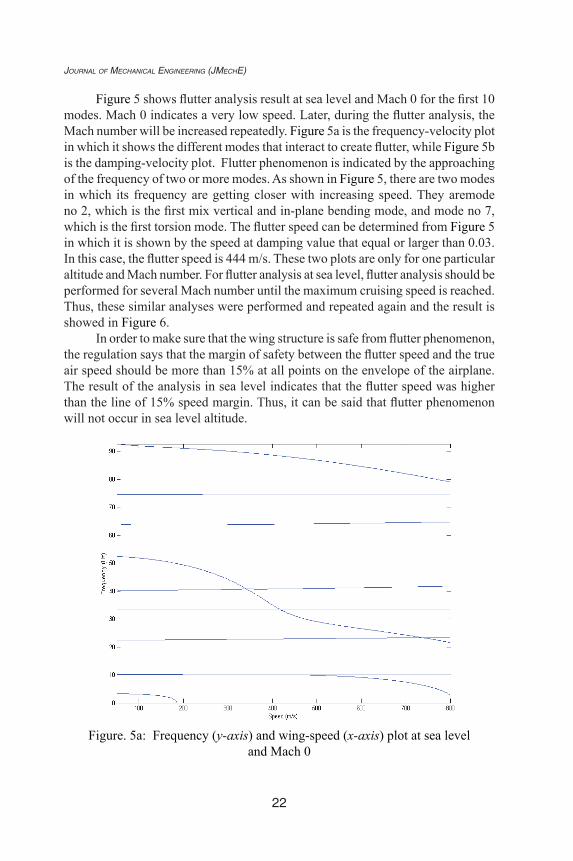
Figure 5 shows flutter analysis result at sea level and Mach 0 for the first 10 modes. Mach 0 indicates a very low speed. Later, during the flutter analysis, the Mach number will be increased repeatedly. Figure 5a is the frequency-velocity plot in which it shows the different modes that interact to create flutter, while Figure 5b is the damping-velocity plot. Flutter phenomenon is indicated by the approaching of the frequency of two or more modes. As shown in Figure 5, there are two modes in which its frequency are getting closer with increasing speed. They aremode no 2, which is the first mix vertical and in-plane bending mode, and mode no 7, which is the first torsion mode. The flutter speed can be determined from Figure 5 in which it is shown by the speed at damping value that equal or larger than 0.03. In this case, the flutter speed is 444 m/s. These two plots are only for one particular altitude and Mach number. For flutter analysis at sea level, flutter analysis should be performed for several Mach number until the maximum cruising speed is reached. Thus, these similar analyses were performed and repeated again and the result is showed in Figure 6.
In order to make sure that the wing structure is safe from flutter phenomenon, the regulation says that the margin of safety between the flutter speed and the true air speed should be more than 15% at all points on the envelope of the airplane. The result of the analysis in sea level indicates that the flutter speed was higher than the line of 15% speed margin. Thus, it can be said that flutter phenomenon will not occur in sea level altitude.
speed and the true air speed should be more than 15% at all points on the envelope of the airplane. The line of 15% margin is showed in the Fig. 10which marked with triangle symbol. The result of the analysis in sea level told us that the flutter speed was higher than the line of 15% speed margin. Thus, it can be said that flutter phenomenon will not occur in sea level altitude.
Fig. 5.a. Frequency (y-axis) and wing-speed (x-axis) plot at sea level and Mach 0.
Figure. 5a: Frequency (y-axis) and wing-speed (x-axis) plot at sea level and Mach 0
journal jMeche Vol 12.indd 22 4/20/2016 12:38:38 PM

23
The Design of a high aspecT RaTio haLe aiRcRafT composiTe Wing. paRT ii
Fig 5.b. Damping (y-axis) and Wing-speed (x-axis) plot at sea leval and Mach 0.
Fig 6. Wing Flutter at Sea Level
0
100
200
300
400
500
0.000 0.200 0.400 0.600 0.800
V (m
/s)
Mach Number
Wing Flutter at Sea Level
Flutter SpeedV TAS
1.15 V TAS
Figure 5b: Damping (y-axis) and wing-speed (x-axis) plot at sea level and Mach 0 Fig 5.b. Damping (y-axis) and Wing-speed (x-axis) plot at sea leval and
Mach 0.
Fig 6. Wing Flutter at Sea Level
0
100
200
300
400
500
0.000 0.200 0.400 0.600 0.800
V (m
/s)
Mach Number
Wing Flutter at Sea Level
Flutter SpeedV TAS
1.15 V TAS
Figure 6: Wing flutter at sea level
journal jMeche Vol 12.indd 23 4/20/2016 12:38:38 PM

24
Journal of Mechanical engineering (JMeche)
Similar analysis was done at 65,000 ft altitude and different Mach number. The result is given in Figure 7.Fig 5.b. Damping (y-axis) and Wing-speed (x-axis) plot at sea leval and
Mach 0.
Fig 6. Wing Flutter at Sea Level
0
100
200
300
400
500
0.000 0.200 0.400 0.600 0.800
V (m
/s)
Mach Number
Wing Flutter at Sea Level
Flutter SpeedV TAS
1.15 V TAS
Figure 7: Wing flutter at 65,000 ft
The coupling mode of flutter at 65,000 ft altitude and Mach 0 were mode 1; which is the first bending mode, and mode 7; which is the first torsion mode. The flutter speed is found to be 1,500 m/s. The flutter speed at 65,000 ft for each Mach number which is far above the 15% speed margin line. Therefore, it can be concluded that in 65,000 ft altitude, the wing was also safe from flutter phenomenon.
Conclusion
The buckling analysis for the internal configuration given by static strength analysis was found that the intial upper panel thickness was not safe from buckling. Therefore, the upper panel thickness should be increased in order to satisfy the buckling requirement. The thickness addition led to the increase of the wing structure weight for 23% from the initial configuration. This final configuration then was used in flutter analysis. Flutter of this wing occurred as a result of the interaction between first bending mode and first torsion mode of the wing. Flutter analysis showed that at two levels of altitude, flutter speed of the wing was higher than the aircraft cruising speed.Therefore, it can be concluded that thecomposite wing was safe from flutter, as well as buckling and static strength constraints. It can also be concluded that for the case of high-aspect-ratio-wing, such as HALE UAV, there is no couple between bending and torsion. Therefore, flutter was not the problem.
journal jMeche Vol 12.indd 24 4/20/2016 12:38:39 PM

25
The Design of a high aspecT RaTio haLe aiRcRafT composiTe Wing. paRT ii
References
[1] C.L. Nickol, C. L,” High Altitude Long Endurance UAV Analysis of Alternatives and Technology Requirements Development” NASA/TP-2007-214861, 2007.
[2] Z. Goraj, “ High altitude long endurance unmanned aerial vehicle of a new generation – a design challenge for a low cost, reliable and high performance aircraft.”, Bulletin of The Polish Academy of Sciences Technical Sciences, Vol. 52, No. 3, 2004.
[3] G. Frulla, and E. Cestino, ”Design, manufacturing and testing of a HALE-UAV structural demonstrator”, Composite Structures 83 (2008) 143–153.
[4] http://www.northropgrumman.com/Capabilities/NASAGlobalHawk/Documents/pageDocuments/NASA-GH_Data-Sheet.pdf, downloaded on 25th August 2015.
[5] http://www.boeing.com/news/frontiers/archive/2010/may/i_bds01.pdf, downloaded on the 25th August 2015.
[6] G.J. Kennedy and J.R.A. Martins, “A Comparison of Metallic and Composite Aircraft Wings Using Aerostructural Design Optimization”, American Institute of Aeronautics and Astronautics, 2006.
[7] R.L. Bisplinghoff, et al. “Aeroelasticity” Massachusetts: Addison-Wesley Publishing Company, 1955.
[8] Y. Naidu and S. Adali, “Design and Optimization of a Medium Altitude Long Endurance UAV Wingbox Structure”, R & D Journal of the South African Institution of Mechanical Engineering, 30 (2014), pp. 22-29.
[9] G. Romeo, F. Danzi and E. Cestino, “Multi-objective Optimization of the Composite Wing Box of Solar Powered HALE UAV”, 29th Congress ICAS, St Petersburg, Rusia, 2014, Sept 7-12.
[10] R. Koohi, H. Shahverdi and H. Haddadpour, “Modal and Aeroelastic Analysis of a High-Aspect-Ratio Wing with Large Deflection Capability”, Int J Advanced Design and Manufacturing Technology, Vol 8, No 1, March 2015, pp. 45-54.
[11] O.A. Stodieck, J.E. Cooper, P.M. Weaver and P. Kealy, “Optimization of Tow-Steered Composite Wing Laminates for Aeroelastic Tailoring”, AIAA Journal, 2015, pp. 1-13. DOI:10.2514/1.J053599.
[12] P.W. Richards,” Design Strategies for Rotocraft Blades and Hale Aircraft Wings Applied to Damage Tolerant Wind Turbine Blade Design”, Dissertation, School of Aerospace Engineering, Georgia Institute of Technology, May 2015.
[13] MIL-A-8870B., “Airplane Strength and Rigidity, Vibration, Flutter And Divergence”, 1987.
journal jMeche Vol 12.indd 25 4/20/2016 12:38:39 PM