Embed Size (px)
Citation preview

Scholars' Mine Scholars' Mine
Masters Theses Student Theses and Dissertations
1963
The design, construction, and calibration of an apparatus to The design, construction, and calibration of an apparatus to
determine the thermal conductivity of solids determine the thermal conductivity of solids
Alan Edward Stephenson
Follow this and additional works at: https://scholarsmine.mst.edu/masters_theses
Part of the Mechanical Engineering Commons
Department: Department:
Recommended Citation Recommended Citation Stephenson, Alan Edward, "The design, construction, and calibration of an apparatus to determine the thermal conductivity of solids" (1963). Masters Theses. 5939. https://scholarsmine.mst.edu/masters_theses/5939
This thesis is brought to you by Scholars' Mine, a service of the Missouri S&T Library and Learning Resources. This work is protected by U. S. Copyright Law. Unauthorized use including reproduction for redistribution requires the permission of the copyright holder. For more information, please contact [email protected].

THE DESIGN, CONSTRUCTION, AND CALIBRATION OF AN APPARATUS TO DETERMINE THE THERMAL CONDUCTIVITY OF SOLIDS
BYALAN EDWARD STEPHENSON
ATHESIS
submitted to the faculty of the SCHOOL OF MINES AND METALLURGY OF THE UNIVERSITY OF MISSOURI
in partial fulfillment of the work required for theDegree of
MASTER OF SCIENCE IN MECHANICAL ENGINEERING Rolla, Missouri
1963
Approved by

ACKNOWLEDGMENT
The author wishes to express his appreciation to Mr. Charles Roy Remington, Jr., Professor of Mechanical Engineering at the School of Mines and Metallurgy of the University of Missouri, for his suggestions and guidance throughout the development of this investigation.

iii
ABSTRACT
Many pieces of equipment have been designed to determine the thermal conductivity of solids. They all, however, depend on the application of Fourier's equation of heat conduction in solids to determine the thermal conductivity. The apparatus used in this investigation is a modification of the guarded hot plate method used by the American Society for Testing Materials. Operation of the device is given in a step by step procedure both as a guide for others and also to show how it was operated during calibration of the apparatus. Data obtained in the calibration is given in tabular and graphical form to show how the results compared with published data of the test specimens used. The difference between the experimental data and the published data appears to be a constant error which is explained and commented upon. The relative merits of the procedure used, as well as recommendations for improvement of the procedure, are given for the determination of the thermal conductivity of solids over a varying temperature range.

iv
TABLE OF CONTENTSPage
Acknowledgment.......... iiAbstract...................................................... iiiList of Figures.............................................. vList of Tables............................................... viIntroduction and Literature Review........................... 1The Design and Construction of Apparatus............. 6Apparatus Operation.......................................... 13Apparatus Operation Outline.................................. 18Experimental Procedure and Data.............................. 20Error Analysis............................................... 30Conclusions and Recommendations.............................. 32Bibliography.................................................. 35Vita 37

V
FIGURES
Page1. Apparatus.................................................... 72. Exploded Diagram of Heating Unit................ .......... 83. Wiring of Test Apparatus......................... .... ......114. Thermocouple Attachment to Test Specimens................... 145. Curve of Experimental and Published Data For Iron......... 256. Curve of Experimental and Published Data For Magnesium...... 277. Curve of Experimental and Published Data For Magnesia.......29

vi
TABLES
PageI. Experimental Data Obtained From Iron................. 24
II. Experimental Data Obtained From Magnesium............ 26III. Experimental Data Obtained From Magnesia............. 28

1
INTRODUCTION AND LITERATURE REVIEW
The thermal conductivities of a wide range of materials are required at various temperatures for design and research purposes. To give an idea of the procedure involved in the experimental determination of the thermal conductivity of solids, some of the more common methods are briefly described. All the designs are based upon a steady-state method in which a constant heat flow through the test specimen is produced by control of:
(a) an electrical input;(b) the temperature rise of a constant water flow through a
calorimeter, and
(c) a constant temperature gradient in a material of known thermal conductivity.
One major problem in the operation of s«Ch equipment is the prevention of unwanted heat loss or gain. This is usually effected by the use of suitably designed guard tubes or plates maintained at a requisite temperature. Thermocouples of copper and constantan, nickel-chrome and constantan, or platinum and platinum-rhodium, are used for temperature measurement since they can be installed easily and provide information on the distribution of temperature in the apparatus.
The design of the apparatus to be used for a certain material depends not only upon the thermal conductivity, temperature, and structure, but often upon the size and shape of test specimen available. However, the following descriptions which would deal with most materials, indicate the diversity of types required. More detailed information and

2
descriptions of the apparatus may be found in the references quoted.(a) Rod apparatus (1) with guard tube, both electrically heated
at the top and water-cooled at the bottom. The heat flow is based onthe temperature rise and the flow rate of the test-specimen cooling water.
(b) Composite rod apparatus (2) with guard tube, similar to (a), but the test rod consists of the test specimen and a standard rod of known thermal conductivity attached end to end. The heat flow is based upon the measured gradient in the standard rod as well as upon the water flow.
(c) Searle's apparatus (3) with an insulated rod heated by steam at one end and cooled by water at the other. Thermometers measure both the temperature rise of the cooling water and also intermittent points on the rod. A variation of this apparatus consists of a guard ring to improve the lagging arrangements. The original rod is surrounded bya hollow coaxial cylinder of the same material and is separated from it by a small air gap. The ends of the guard ring are held at the same temperature as the test specimen so that at any two opposite points on the rod and the cylinder are at practically the same temperature. The effect is one of almost perfect heat insulation.
(d) Theoretically best is the method with the spherical form. (4)An electrical heater is located within a spherical metal shell and a second, wider metal shell is located concentric to the first one. The space between is filled with homogeneous material to be tested. Then, from the energy supplied by the heater and the temperature at two radial distances, the thermal conductivity of the filling material may be found. This method has two special advantages: (1) the heat energy supplied by the heater passes the material to be tested in the required
3
direction without any losses; (2) the thermal conductivity at different temperatures can be found by a single experiment, if thermometers are arranged at more than two radial distances. The greatest difficulty with this apparatus is that spherical test specimens must be made.
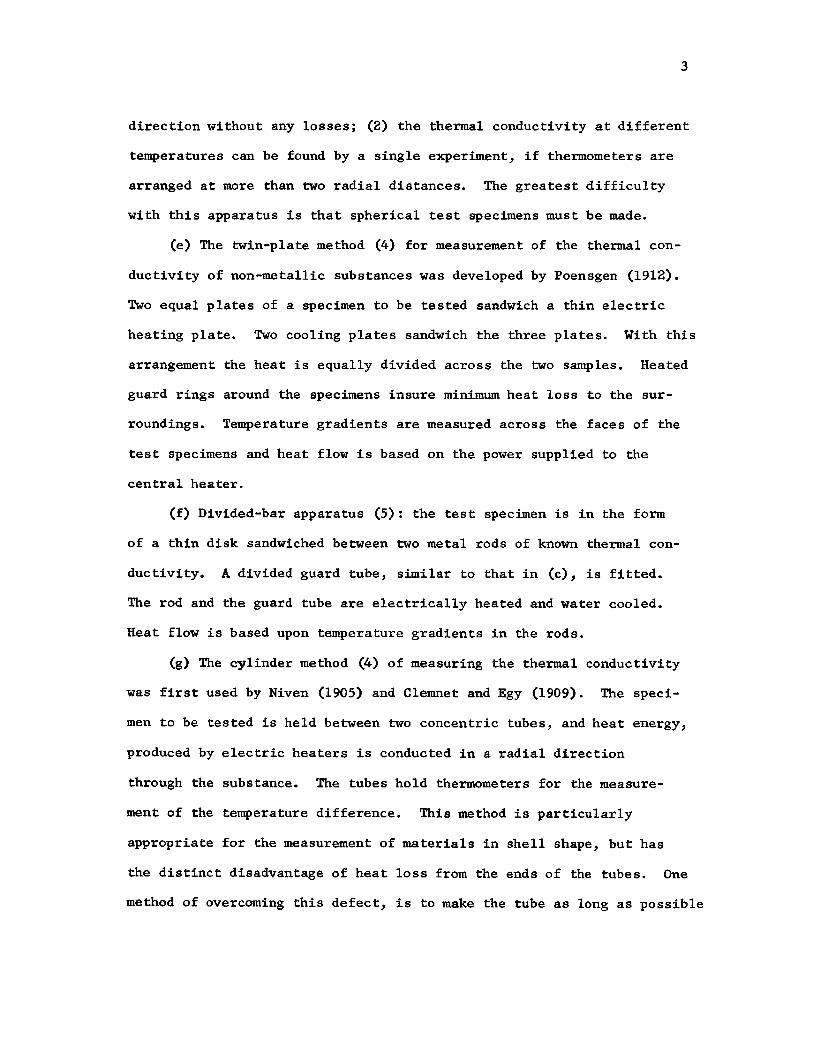
(e) The twin-plate method (4) for measurement of the thermal conductivity of non-metallic substances was developed by Poensgen (1912).Two equal plates of a specimen to be tested sandwich a thin electric heating plate. Two cooling plates sandwich the three plates. With this arrangement the heat is equally divided across the two samples. Heated guard rings around the specimens insure minimum heat loss to the surroundings. Temperature gradients are measured across the faces of the test specimens and heat flow is based on the power supplied to the central heater.
(f) Divided-bar apparatus (5): the test specimen is in the form of a thin disk sandwiched between two metal rods of known thermal conductivity. A divided guard tube, similar to that in (c), is fitted.The rod and the guard tube are electrically heated and water cooled.Heat flow is based upon temperature gradients in the rods.
(g) The cylinder method (4) of measuring the thermal conductivity was first used by Niven (1905) and Clemnet and Egy (1909). The specimen to be tested is held between two concentric tubes, and heat energy, produced by electric heaters is conducted in a radial direction through the substance. The tubes hold thermometers for the measurement of the temperature difference. This method is particularly appropriate for the measurement of materials in shell shape, but has the distinct disadvantage of heat loss from the ends of the tubes. One method of overcoming this defect, is to make the tube as long as possible
4
and to wire the electric heater homogeneously all over the length, but to use only a relatively short middle part of the arrangement for the measurement.
The foregoing descriptions are perhaps the most widely used methods in the measurement of thermal conductivity of solids. From the similarity between the flow of heat and of electricity, it might be suspected that heat-conductivity measurements could be made with the accuracy approaching that of electrical conductivity. Unfortunately, such is not the case. Temperature difference and heat flow are not as easily and accurately measured as their electrical analogies, potential difference and current. Furthermore, while there are perfect insulators for electricity, there are none for heat. The result is that thermal-conduction measurements are seldom of greater accuracy than one or two per cent probable error, and indeed the error is likely to be much larger than this unless great care is taken.
The mathematical theory of heat conduction in solids was first formulated by Jean Baptiste Fourier (1768-1830) and was set forth by him in his "Theorie analytique de la chaleur." (6) When different parts of a solid body are at different temperatures, heat flows from the hotter to the colder portions by a process known as conduction.
For example, if one end of a metallic poker is placed in a fire and allowed to remain there, the other end will in time become hot.The heat is thus conveyed to the further end of the poker by means of the particles of the poker itself, and this mode of conveyance is termed the conduction of heat. The time required for the further end to become hot and its degree of temperature increase, is a function of both the physical and metallurgical configuration of the poker. Thus a

5
simple experiment in the conducting powers of different metallic solids may be recognized.
To give a better visualization of this idea, consider a homogeneous plate of thickness x. Two parallel planes of area A are at constant temperatures of T^ and T^. Heat will flow from the hotter of these isothermal surfaces to the colder, and the quantity Q that will be conducted in time t will be given by
Q = k T1 - t2 Atx
or q = d2 = k T1 - T2 A dt x
where k is a constant for any given material known as the thermal conductivity of the substance. It is then numerically equal to the quantity of heat that flows in unit time through a unit area of a plate of unit thickness having a unit temperature difference between its surfaces.
It is the quantity, thermal conductivity, with which the apparatus described in this paper is primarily concerned. The apparatus used is similar to that described previously as the twin-plate method (e) with modifications made so that instead of using two samples of a specimen, as the twin-plate method does, only one sample of the specimen is necessary. All that is necessary to determine the thermal conductivity of the specimen is a knowledge of the rate of heat flow through a given area of specimen under a known temperature gradient.
6
THE DESIGN AND CONSTRUCTION OP APPARATUS
The design of the apparatus used in this experiment follows as closely as possible the specifications set forth by the American Society for Testing Materials. (7) One major modification, however, distingiushes the apparatus used in this experiment from that in the ASTM designation. This difference is the use of one test specimen in the determination of the thermal conductivity as opposed to two specimens.
The primary purpose for the use of two specimens is to equally divide the heat flux produced by the central heater, which is guarded on its periphery by a heated guard ring. With the use of two specimens, the heat flux divides and passes through the specimens mounted on either side of the central heater, thereby making it possible to account for the entire amount of heat which is produced by the central heater. The apparatus used in this experiment, on the other hand, insures the passage of the heat flux through the one specimen by not only guarding against heat losses around the periphery by a heated guard ring, but also by replacing the second specimen by another heating element. Then by careful control of the guard heating element and the lower unit, the heat flux produced by the central unit is insured to pass from the central unit through the test specimen to the heat sink.
Figure 2 shows an exploded drawing of the general configuration of how the test apparatus is arranged. The heating elements used are surface heating units which were taken from an electric range. The central unit and the guard ring are one unit separately controlled, and the

7
Figure 1 Apparatus
1 Potentiometer2 Thermos Bottle3 Heating Units4 Heat Sink5 Wattmeter6 Autotransformers

8
Exploded Drawing of Test ApparatusFigure 2
Asbestosplates
Central unit
Thermocoupleleads
Guard ring
Insulatingspacer
Thermocouplelead
Lower unit

9
lower unit is a second unit. Each unit was faced with an 1/8 inch aluminum plate (see Figure 2) on each side to insure a flat surface of contact for both the test specimen and insulating material to sit on.An 1/8 inch air gap was left between the central heater and the guard ring so that independent control of the two units could be realized.
Separating the central unit and the lower unit is insulating material, the composition of which is wood and cement. The exact physical properties are of no concern to the operation of the apparatus since both sides of the insulation are heated and, as will be explained later, the heat flow will be assumed to be zero.
Above the central unit (see Figure 2) is another insulating material. This material consists of two asbestos shingles % inch thick. Two pieces are used so that either a % inch test specimen or a 1 inch test specimen may be used. A circular hole, the diameter of the central unit plus the air gap, was cut in both asbestos plates to permit the placement of the test specimen directly onto the central unit and to have it surrounded by these plates.
The entire assembly shown in Figure 2 was then incased in a rectangular wooden box (see Figure 1) which was made with its internal dimensions the same as the diameter of the insulating materials so as to hold them in proper alignment. The top of the box is composed of the square upper plate (see Figure 2) which fits tightly into the top of the box. This entire assembly is further aided in its insulating properties by the stagnant air which remained in the box after placing the circular heating and insulating assembly within the square box.
The test specimen then must be one of two thicknesses, % inch or 1 inch, and equal in diameter to the central heating unit plus h the

10
width of the air gap between the central unit and the guard ring. A 4 inch diameter test specimen was used in this apparatus. The choice of either the % inch or 1 inch specimen will be explained later.
The heat sink used in conjunction with the previous assembly (see Figure 1) was an aluminum cylinder with aluminum plates welded in place as ends. Water was used as the cooling medium and was available at approximately 78 degrees Fahrenheit. The flow of water was controlled by a valve on the inlet line to the heat sink. Water passed from the line leading into the lower part of the heat sink (see Figure 1) through the cylinder and out the line at the top of the cylinder thus insuring that the heat sink was always filled with water and that the coldest, inlet water, was adjacent to the test specimen.
Energy is supplied to all units by 120 volt AC, with the line voltage controlled by three variac autotransformers which are adaptable to any load that is subject to control by voltage variation. The wiring of the autotransformers (see Figure 3) is done in parallel so that the voltage across each will be the same. The particular autotransformer used here was built by the General Radio Company of Massachusetts, of type W5L capable of carrying 8.5 to 11.0 amperes maximum while the voltage is varied from 0 to 120 volts.
Measurement of the power used by the central unit was accomplished by a Simpson model No. 880 dynamometer type wattmeter, (see Figure 1) capable of measuring on two scales, either 0 to 1000 watts or 0 to 2000 watts while carrying 10 to 15 amperes maximum. At full scale, the accuracy of the meter is plus or minus 1 percent being read on a 4% inch hand drawn scale, mirrored with a knife edge pointer to prevent parallax when making a reading.

11
Wiring of Test ApparatusFigure 3

12
Temperature measurements are accomplished by the use of thermocouples of iron and constantan and located as shown in Figure 2 and Figure 4. The emf produced in the thermocouples is measured with the aid of a Rubicon potentiometer model No. 2745 capable of measuring 0 to 16.1 millivolts, readable to plus or minus 0.001 millivolts on one scale, and 0 to 80.5 millivolts, readable to plus or minus 0.005 millivolts on the other scale. These ranges cover the entire range of the emf capable of being produced in thermocouples of iron and constantan.

13
APPARATUS OPERATION
The operation of the apparatus for the determination of the thermal conductivity of solids was purposely made as easy as possible to eliminate any possibility of error due to operating procedure. The following procedure was that used in the calibration of the apparatus.A step by step outline of the operating procedure may be found at the end of this section.
A 4 inch diameter sample was cut \ inch or 1 inch thick depending upon the availability of material, but primarily depending upon the predicted range of the thermal conductivity of the sample. For specimens believed to have a thermal conductivity below 50 Btu per hour per foot per degree Fahrenheit, a specimen approximately % inch thick was used. For all others above this value a 1 inch thick specimen was used. It was not necessary that the dimensions of the specimen be exactly as stated, but the dimensions were maintained as close as possible to those stated, and were known accurately for later computation.
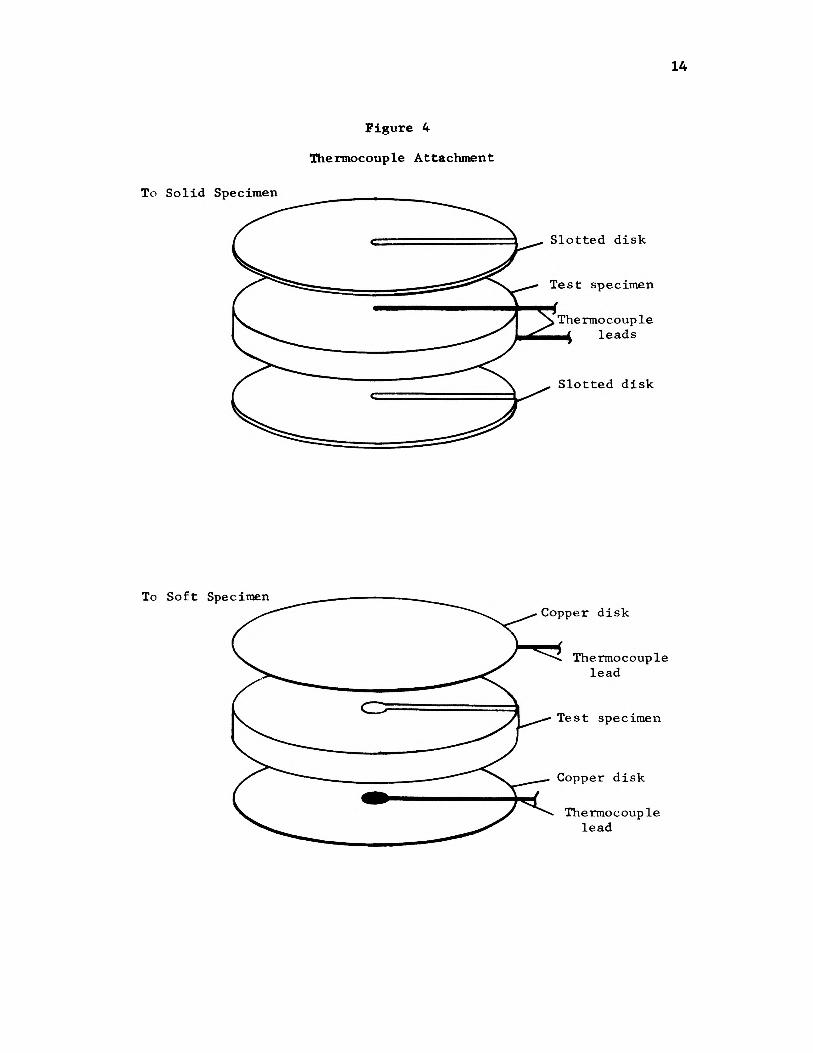
Thermocouples of 20 gauge iron-constantan were attached to both faces of the specimen by drilling two no. 47 holes 1/16 inch deep at the center of both faces. The thermocouples were peened into place in the two holes so that they were securely mounted. When magnesia was used as a test specimen, thermocouples were held in place by soldering thermocouples to two 0.020 copper plates and sandwiching (see Figure 4) the test specimen between them. It is advised that if this procedure is found necessary the thermocouples should be placed on the side of the copper plate toward the test specimen and should be attached to the
14
Thermocouple AttachmentFigure 4

15
copper plate with a rather generous amount of solder. This will allow the thermocouple to be pressed into the test specimen giving a large area of contact.
Next the thermocouple leads were run flush with the surface of the specimen and the two slotted 4 inch diameter aluminum disks (see Figure 4) were placed against the faces of the specimen. When the copper plates were used as the means of attaching the thermocouples, the aluminum disks were used as spacers. The purpose of the aluminum disks was to provide a flat surface for the test specimen when seated against the heat sink and the central heating unit.
The prepared specimen was placed in the unit and either one or two of the asbestos plates was used to surround the specimen depending upon the thickness of the specimen. In either case, the square cut plate was placed on top to provide a seal for the unit. The heat sink was then placed on the specimen, and a weight (approximately 10 pounds) was added to the heat sink to insure good contact between all heat conducting surfaces.
Power to all units and water to the heat sink was applied. The central unit was adjusted for the desired wattage leaving the lower unit and the guard ring turned off. Caution was used so that the central unit was not turned too high with the use of a specimen of low thermal conductivity. A wattage of 100 to 150 was used for 1 inch specimens, 50 to 75 for \ inch specimens, and 5 to 25 for insulating materials. After the desired temperature of the central unit was reached, the guard ring and the lower unit autotransformers were adjusted to comparable settings. Until the temperatures of all three
units were the same, it was not necessary that any readings be recorded.
16
With the lower unit at the same temperature as the central unit, no heat would flow between the two. Similarly, with the guard ring at the same temperature as the central unit, no heat would flow between the two. This then is the reason that the exact physical composition of the insulating material used between the lower unit and the central heating unit was of no concern. All of the heat produced by the central unit must pass through the specimen and the reading on the wattmeter was considered to be equal to the heat passing through the test specimen.
Once steady state was reached, that is all units are at the same constant temperature, readings of the temperatures on both faces of the test specimen were taken. Several readings were taken at 10 minute intervals to insure again that there was no change in temperature of either the central unit, the guard ring, or the lower unit.
Once a reading had been made and it was desired to determine the thermal conductivity at another mean temperature, two ways were used to change the temperature of the specimen. First, the input wattage was changed to the central unit. Second, the flow of water to the heat sink was changed. Both methods accomplished the same result, but the second method, i.e. the changing of the amount of water to the heat sink, resulted in a finer change while the first method, the changing of the input wattage, resulted in a rather coarse change. Whichever method was used, steady-state again had to be reached in all units by appropriate adjustments in the guard ring and the lower unit autotransformers.
The foregoing procedure was followed carefully, especially in regard to steady-state being reached, and calculation of the thermal conductivity of the test specimen was all that remained. The average

17
temperature of the upper and lower faces of the test specimen was considered as the temperature corresponding to the value of thermal conductivity of the test specimen. The location of the thermocouples below the surface of the test specimen was not considered in the calculation of the thermal conductivity, because this is taken into account in the calibration constant. The formula is as follows:
k = Q (3.413) t (1.92)(T2 - T]_) A
Where:k = thermal conductivity in Btu/(hr)(ft^)(°F/ft) q = input power in watts t = specimen thickness in feet
T2 = lower surface temperature of specimen in °FT^ = upper surface temperature of specimen in °FA = area of test specimen in square feet 3.413 = conversion constant for watts to Btu/hr1.92 = calibration constant

18
APPARATUS OPERATION OUTLINE
The following outline is offered as a means to operate the apparatus and to provide a brief outline. Detailed explanations of each step are found in the preceeding section.
1. Select a 4 inch diameter by 1 inch thick specimen (% inch for thermal conductivity below 50 Btu/(hr)(ft^)(°F/ft).
2. Attach two 20 gauge iron-constantan thermocouples to either face of the specimen by peening thermocouples tightly into two no.47 by 1/16 inch deep holes. (See alternate procedure for soft insulating materials to proceeding section.)
3. Place specimen into unit with the slotted disks being located on both faces of the specimen.
4. Apply power to all units and water to heat sink.5. Adjust power to central unit for desired level.6. Adjust power to guard ring and lower unit to comparable
settings on the autotransformers.7. Wait for steady-state of the central unit to be reached.8. Adjust autotransformers to lower and guard ring units so
that the temperatures are the same as that of the central unit.9. Check that steady-state of all units has been reached.
10. Read upper and lower temperatures of test specimen.11. Calculate thermal conductivity.
CAUTION: When making readings with the potentiometer, be sure that all thermocouple leads do not run close to a power lead to cause an

19
induced emf in the thermocouple lead. A grounded condenser in parallel with the thermocouple lead should be used on all leads where this difficulty exists.

20
EXPERIMENTAL PROCEDURE AND DATA
The experimental procedure used in the determination of an acceptable method of testing a specimen with the apparatus previously described was one of finding the most accurate and expedient method possible. Outlined in the preceeding section is a method for determining the thermal conductivity of a test specimen which is reliable and as expediant as could be devised. Prior to the determination of this method, other procedures were tried for their consistency and reliability, but none were as reliable as the one described. Among the modifications tried were that of permanently attaching the thermocouples to the central heating unit and the heat sink, thereby eliminating the necessity of attaching the thermocouples to the test specimen. This procedure did not produce results that could be depended upon as an operating procedure for the apparatus. An error produced by the contact resistance between the test specimen and the central heating unit and the heat sink entered into the thermal conductivity of the test specimen. Unless a very precise control of the amount of pressure that was applied to the unit at varied temperatures was used, reliable results could not be realized. This method was therefore not pursued further.
Another method of approach to an acceptable experimental procedure was to use thermocouples attached to a test specimen of constant thickness. The first thickness chosen was one inch. For the determination of thermal conductivities in excess of 50, this method proved to be very acceptable, but below this value and especially with the use of magnesia, heat losses around the periphery were large and temperatures of the test

21
specimen adjacent to the heat sink were the same as that of the heat sink. A constant thickness of \ inch was then tried, but the temperature drops in materials having a thermal conductivity in excess of 50 were so small that it made it almost impossible to read a difference on the potentiometer.
The operation of the apparatus is most reliable when operated with a 1 inch specimen with thermocouples attached to its faces. A specimen with a thermal conductivity believed to be less than 50, use a % inch specimen. A thermal conductivity of 50 as the dividing point between the use of either h inch or 1 inch specimens is an approximate value and may be varied from if necessary.
In the following tables and graphs, is a tabulation of the results obtained in operating the equipment as outlined in the preceeding section. The choice of materials was for the purpose of testing materials over a range that would encompass most materials that are in use today and that might be tested on this apparatus.
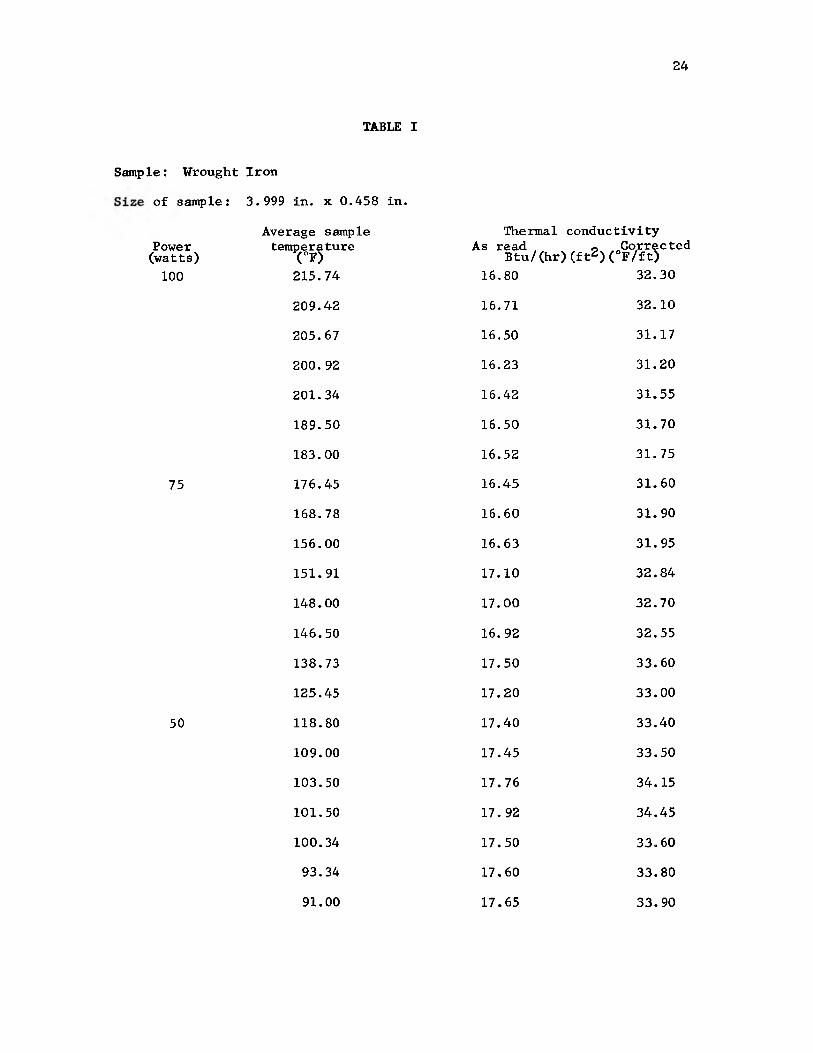
Table I is a listing of the calculated thermal conductivities as obtained from the running of the equipment using wrought iron. Values of thermal conductivity are given for wattages of 100, 75, and 50 watts supplied to the central heater. It was found that wattages in excess of 100 were not usable because it was almost impossible to stop oscillations in the temperature distribution so that a steady state could be reached. Below 50 watts the temperature difference across the test specimen was not great enough to be read accurately on the potentiometer. The column headed corrected thermal conductivity in the table is the thermal conductivity measured, multiplied by the calibrationconstant.

22
The graph following Table I is the information found in Table I plotted against published information (8)(9) to show graphically the accuracy of the results.
Table II, in a similar manner, shows results of experimental tests made on magnesium as the test specimen. It will be noted here that wattages higher than 100 were used, but temperatures much below those obtained with the iron sample were obtained. This was as expected due to the much higher thermal conductivity of magnesium and therefore the lower insulating properties to hold the heat. As with the iron sample, however, wattages below 50 watts were not used due to the very small temperature difference that developed with the lower wattages. The graph following Table II is, in a similar manner as with the iron, the information found in Table II plotted against published information (8)(9) to show graphically the accuracy of the results.
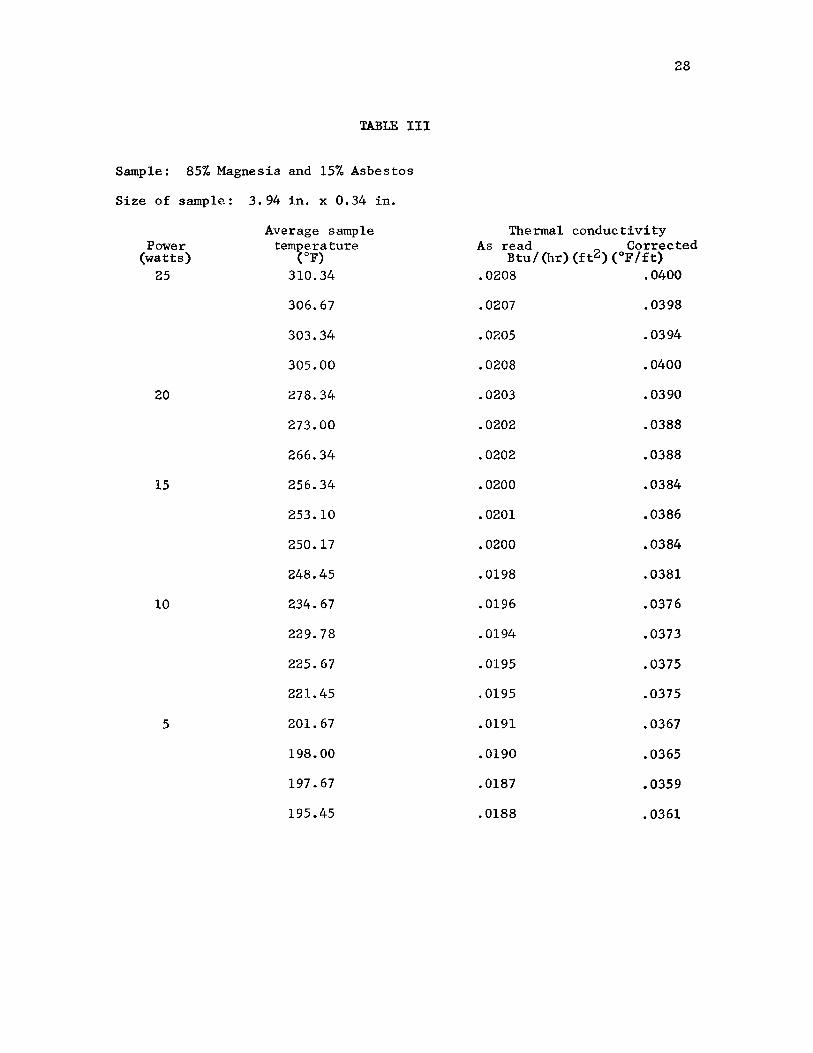
Table III is a tabulation of experimental results with 85% magnesia and 15% asbestos as the test specimen. Here it will be noted that the extremely high insulating properties of the test specimen did not allow wattages in excess of 25 to be used. Similarly, the experimental results are plotted on a graph following Table III against published results. (9)(10)
It should be noted that in the plot of the information for iron, magnesium, and magnesia, the experimental plot very closely parallels the published thermal conductivity plot. It was from this that a calibration constant was found. The published thermal conductivity at several temperatures was divided by the experimental value and a arithmetic average taken. The results are tabulated in the column headed

23
corrected thermal conductivity in each of the three Tables. It was found that an average calibration constant of 1.92 gave the best result to all experimental results. It is therefore this value that is used in the operating procedure of the apparatus as explained in the pre- ceeding section.
24
TABLE I
Sample: Wrought Ironof sample: 3.999 in. x 0.458 in.
Power(watts)Average sample temperature
<°F>Thermal conductivity
As read , 0 Corrected Btu/Chr) (ft2)(°F/ft)100 215.74 16.80 32.30
209.42 16.71 32.10
205.67 16.50 31.17
200.92 16.23 31.20
201.34 16.42 31.55
189.50 16.50 31.70
183.00 16.52 31.75
75 176.45 16.45 31.60
168.78 16.60 31.90
156.00 16.63 31.95
151.91 17.10 32.84148.00 17.00 32.70146.50 16. 92 32.55138.73 17.50 33.60
125.45 17.20 33.00
50 118.80 17.40 33.40109.00 17.45 33.50103.50 17.76 34.15101.50 17.92 34.45100.34 17.50 33.6093.34 17.60 33.8091.00 17.65 33.90

25

26
TABLE II
Size of sample: 4.025 in. x 1.015 in.Sample: Magnesium
Power(watts)
Average sample temperature
(°F)
Thermal conductivity As read Corrected
Btu/(hr)(ft2) (°F/ft)150 122.92 49.8 95.6
124.32 47.4 91.0
123.80 47.6 91.5123.50 47.5 91.3
125 115.34 47.0 90.3
113.67 47.3 90.8
113.07 48.0 92.2112.92 47.9 92.0
100 104.34 47.0 90.3
103.92 47.7 91.7103.92 47.7 91.7103.51 48.0 92.2
75 101.42 47.9 92.0
102.25 48.0 92.2
102.50 48.1 92.5
103.22 47.8 91.8
103.24 47.6 91.5
50 93.42 46.9 90.093.50 47.2 90.793.40 47.3 90.893.20 47.9 92.093.00 48.0 92.2

27
28
TABLE III
Sample: 85% Magnesia and 15% AsbestosSize of sample: 3. 94 in. x 0.34 in.
Average sample Thermal conductivityPower temperature As read ^ Corrected(watts) (°F) Btu/(hr) (f t^) (°T’/ft)
25 310.34 .0208 .0400306.67 .0207 .0398303.34 .0205 .0394305.00 .0208 .0400
20 278.34 .0203 .0390
273.00 .0202 .0388
266.34 .0202 .038815 256.34 .0200 .0384
253.10 .0201 .0386250.17 .0200 .0384248.45 .0198 .0381
10 234.67 .0196 .0376229.78 .0194 .0373225.67 .0195 .0375221.45 .0195 .0375
5 201.67 .0191 .0367198.00 .0190 .0365197.67 .0187 .0359195.45 .0188 .0361

29

30
ERROR ANALYSIS
The apparatus did not read directly the value of the thermal conductivity of the test specimens for the following reasons.
1. In the preparation of the test specimen, one will note that the thermocouples are not placed directly upon the surface of the test specimen itself but rather 1/16 of an inch below the surface. It was felt that it would be easier and quicker in the final computation for one to measure only the thickness of the test specimen and not worry about the exact location of the junction of the thermocouple. Itwas therefore decided to include this error directly in the calibration constant.
2. The insulating material placed between the lower unit and the central unit did have a heat flow across it. It was determined that by placing a wattmeter to the lower unit, and to the guard ring and central unit, the central unit and guard ring was producing more power than the lower unit and heat was being lost, more than likely, around the periphery of the insulating material. The only way to overcome this is to decrease the thickness of this material, but due to the physical makeup of the central unit it was impossible to do. It was therefore decided to add this leakage to the calibration constant.
The results from the apparatus after multiplying by the calibration constant, is not an exact value but is within reason. One will note from Table III that published data for the thermal conductivity of 857o magnesia and 15% asbestos is given from two sources. Neither agrees with the other nor does the corrected thermal conductivity read

31
with this apparatus agree with either of the two sources. It is felt, however, that computations involving the use of the thermal conductivity obtained from this apparatus will be completely reliable and within reason, if in making an analysis of a sample, one is cautious in making sure that steady-state has been reached, and also that no stray emf is induced into the thermocouple leads.

32
CONCLUSIONS AND RECOMMENDATIONS
The apparatus designed and used in this experimental investigation performed favorably in the measurement of thermal conductivity of solids. Repeated tests with all samples continued to indicate a consistent error which did not vary with an increase of temperature and power input. From this standpoint alone, the reliability of the apparatus becomes very evident.
The calibration constant, 1.92, which was found and used in conjunction with this apparatus, is not as favorable as would be desired. This indicates that an error of 52% is present within the apparatus and if it is left out of the computation of the thermal conductivity of a specimen, one might be mislead easily when using the apparatus. Any change made in the operating procedure will change this constant. For instance, if the weight was not added to the heat sink, or if the slotted disks were not used, the contact pressure at all conducting surfaces would not be the same and the calibration constant would be changed. From this standpoint, the reliability of the apparatus is greatly dependent upon one closely following the operating procedure set forth.
For practical purposes, this method of test is limited to the determination of the thermal conductivity of solids having conductivities in excess of 0.415 Btu/(hr)(ft^)(°F/ft). (7) This is speaking of the use of the guarded hot plate method which uses two samples in its test for thermal conductivity, and was modified to the use of one sample in this thesis. Materials having conductivities
33
pas high as 95 Btu/(hr)(ft )(°F/ft) were used in the apparatus in this investigation. The 52% error from this standpoint, and the consistency of the error, makes this method of determining the thermal conductivity of materials feasible.
Another difficulty which arises with the use of this apparatus,
is the variation from the steady-state temperature. This is particu
larly evident when the apparatus is being run at high power levels. Slight variations in the input power to the autotransformers is very noticeable in the central heating unit. It is not as noticeable in the lower unit or the guard ring unit because when steady-state is reached the settings on the autotransformers to these units are much lower than that to the central unit. If all settings were the same, the oscillations would in a sense be alike, and therefore cause no
trouble. Since they occur at different power inputs, high power levels are not feasible with the apparatus.
It is recommended that modifications in the design be made to further increase the reliability of the apparatus. One such modifica
tion is the change of input power from the existing 120 volts AC to 220 volts AC. This would entail using different autotransformers and wattmeter, but it is felt that larger ranges of temperatures could be realized without the necessity of using high power level settings on the autotransformers. In other words, a power input to the central heating
unit of 150 watts would be at a lower setting on the autotransformer
using 220 volts than on one using 120 volts, thus eliminating the steady-state oscillations which occur at high power level settings.
A second recommendation is that the insulating block used between
the central heating unit and the lower unit be replaced with a material

34
of higher conductivity. This will decrease the heat loss by decreasing
the temperature gradient which occurs from the surface of the block to
its center. A block of higher conductivity would be of more uniform
temperature throughout.
Another recommendation is that the test specimen be changed. A
test specimen approximately 3 inches thick with thermocouples on both
faces and at 1 inch increments along its axis in holes drilled to its
central axis would provide a means of determining the thermal conducti
vity at three temperatures simultaneously. This change would have to
be done in conjunction with the change of the available input power to
220 volts, for at present there is not enough power to do this.
A final recommendation, and one which is felt will have the
greatest effect upon improving the apparatus, is to make a change in
the method of determining the heat flow through the test specimen. At
present, a wattmeter measures the power into the central heater and in
cludes in its reading all losses in the apparatus. If instead of measur
ing power into the central heater, heat flow was measured which actual
ly goes through the test specimen by measuring the increase of temper
ature of the cooling water and its flow rate, a more accurate determina
tion of the heat flowing through the test specimen may be realized.The recommendations indicated are not meant to be a necessity,
but are offered as a means of improving the apparatus reliability and
also a means to decrease the calibration constant.

35
BIBLIOGRAPHY
1. Griffiths, E., and Schofield, F.H. (1928) Thermal and Ekectrical
Conductivity of Some Aluminum Alloys and Bronzes. J1 Inst. Metals,
vol. 39, No. 1.
2. Powell, R.W., and Hickman, M.J. (1939) The Physical Properties of
a Series of Steels. Iron and Steel Inst., London, p. 242.
3. Brown, R.C. (1952) Heat. Longmans, Green and Co., New York,
p. 509-512.4. Jakob, M. (1949) Heat Transfer, vol.l, Wiley, New York, p. 146-155.
5. Powell, R.W., and Griffiths, E. (1937) The Variations with Temper
ature of the Thermal Conductivity of Some Micas. Proc. Roy. Soc.
A., vol.163, p. 189.6. Ingersoll, L.R., and Zobel, O.J. (1948) Heat Conduction. McGraw-
Hill, New York, p. 1-4.
7. American Society for Testing Materials (1958) Thermal Conductivity of Materials by Means of the Guarded Hot Plate, vol. 5, p. 828-836.
8. Kern, D.Q. (1950) Process Heat Transfer. McGraw-Hill, New York,
p. 795-799.9. Brown, A.I., and Marco, S.M. (1958) Introduction to Heat Transfer.
McGraw-Hill, New York, p. 14-17.
10. Jakob, M., and Hawkins, G.A. (1950) Elements of Heat Transfer and
Insulation. 2nd ed., Wiley, New York, p. 13-19.
11. Stewart, B. (1888) Elementary Treatise on Heat. Clarendon Press,
5th ed., p. 260-278.
12. Maxwell, J.C. (1888) Theory of Heat. Longmans, Green and Co.,
p. 253-271.

36
13. Schenck, H. (1959) Heat Transfer Engineering. Prentice-Hall,
New Jersey, p. 267-273.14. Gebhart, B. (1961) Heat Transfer. McGraw-Hill, New York,
p. 428-9.15. Garslaw, H.S. (1921) Mathematical Theory of the Conduction of
Heat in Solids. MacMillan, London, p. 1-5.

37
VITA
The investigator of this research, Alan Edward Stephenson, was
born in Mt. Kisco, Westchester County, New York, in 1935. He received
his prepartory training in the public schools of Glens Falls, New York.
He enrolled in the University of Rochester, Rochester, New York,
in September, 1953 and pursued his studies in Mechanical Engineering
until he was called in June, 1954, to the services of the United States
Navy. He was placed on inactive duty in May, 1956, at which time he
went to work for McDonnell Aircraft Corporation, St. Louis, Missouri.
In January, 1959, he enrolled in the Missouri School of Mines and
Metallurgy pursuing the curriculum of Mechanical Engineering and re
ceived a Bachelor of Science degree in June, 1962. He has continued
his studies toward a Masters Degree in Mechanical Engineering at the
Missouri School of Mines and Metallurgy as a graduate assistant to the
present time.


