Embed Size (px)
Citation preview

SC I ENCE ADVANCES | R E S EARCH ART I C L E
ANTHROPOLOGY
1The University of Sydney, Sydney, NSW 2006, Australia. 2École française d’Extrême-Orient, 22 Avenue du Président Wilson, 75116 Paris, France.*Corresponding author. Email: [email protected]
Penny et al., Sci. Adv. 2018;4 : eaau4029 17 October 2018
Copyright © 2018
The Authors, some
rights reserved;
exclusive licensee
American Association
for the Advancement
of Science. No claim to
originalU.S. Government
Works. Distributed
under a Creative
Commons Attribution
NonCommercial
License 4.0 (CC BY-NC).
Dow
n
The demise of Angkor: Systemic vulnerability of urbaninfrastructure to climatic variationsDan Penny1*, Cameron Zachreson1, Roland Fletcher1, David Lau1, Joseph T. Lizier1,Nicholas Fischer1, Damian Evans2, Christophe Pottier2, Mikhail Prokopenko1
Complex infrastructural networks provide critical services to cities but can be vulnerable to external stresses,including climatic variability. This vulnerability has also challenged past urban settlements, but its role in casesof historic urban demise has not been precisely documented. We transform archeological data from the medievalCambodian city of Angkor into a numerical model that allows us to quantify topological damage to critical urbaninfrastructure resulting from climatic variability. Our model reveals unstable behavior in which extensive and cas-cading damage to infrastructure occurs in response to flooding within Angkor’s urban water management system.The likelihood and extent of the cascading failure abruptly grow with the magnitude of flooding relative to normalflows in the system. Our results support the hypothesis that systemic infrastructural vulnerability, coupled withabrupt climatic variation, contributed to the demise of the city. The factors behind Angkor’s demise are analogousto challenges faced by modern urban communities struggling with complex critical infrastructure.
loa
on November 2, 2018
http://advances.sciencemag.org/
ded from
INTRODUCTIONThe management of modern infrastructural networks that may bevulnerable to rare but catastrophic failure is of great concern (1–9).The destabilizing effect of extreme weather events, associated withplanetary-scale climate change (10), creates new risks to the stability ofthe urban environments in which most humans now live. These riskshave become more acute as urban conglomerations become larger,more complex, and trend toward low-density, dispersed settlementforms (11). Low-density urbanism is known to be stable over longtime periods (12) but demonstrates systemic instability above a givenscale and density (13). The occurrence of very large low-density urbansettlements in the preindustrial period provides an opportunity to in-vestigate the stability of urban networks over long time periods, par-ticularly when stressed by climatic variation.
Understanding of and adaptation to high-impact, low-frequencyweather events are hampered by limited long-term data. This is espe-cially so with respect to the complex social response to infrequent cli-matic perturbation (14). To our knowledge, quantitative evidence ofperturbation in networked urban infrastructure has not been demon-strated in the archaeological or historical record (15). In cases whereinfrastructure can be directly analyzed or credibly reconstructed, andwhere other aspects of the material culture or historical archive are ofadequate fidelity, it should be possible to resolve the rate and extent offailures or outages in infrastructural networks and to identify the specificarticulation between forcing processes, failing infrastructure, and socialresponse. Here, we analyze the largest urban infrastructural network ofthe preindustrial world, at Angkor in modern Cambodia, Southeast Asia.We assess the topology of the network and its vulnerability to catastroph-ic failure in response to climatic perturbation, and consider the implica-tions for the resilience of networked urban infrastructure.
System theory, complexity, and cascading failureIn a complex system with many interacting components, a catastrophicresponse may result from even a small local change or from a series ofaccumulated changes. Such a response may be amplified by positive
feedbacks, leading to a tipping point (16): a threshold beyond whichfurther change forces the system to rapidly, and often irreversibly,adopt a new structure and/or functions. For example, a tipping pointin a forest ecosystem may be reached when an initial perturbationbrought about by deforestation triggers a positive feedback betweenreduced regional precipitation, increased risk of wildfire, and acceleratedforest dieback, leading to further reductions in precipitation, and so on(17, 18). A physics-based perspective on a tipping point encompasses acritical regime characterized by phase transition when some macroscop-ic features of the system (e.g., density) undergo a sudden transformationin response to a change in an underlying parameter (e.g., temperature)affecting the system composition and/or the strength of internal inter-actions. This criticality may be an emergent property of self-organizingsystems (19).
One key symptom of systemic vulnerability in complex networks isthe tendency for relatively small perturbations to cascade outwardfrom a primary failure to trigger further failures in other dependentparts of the network that may be distal to the primary failure (8). Thisproduces an important nonlinearity, where the consequences of per-turbation may be much larger and more significant than the pertur-bation itself. The study of cascading failures in complex networks hasbeen a strength of network theory (20), providing realistic models ofcascading failures in electrical grids (21), traffic jams in transportationnetworks (22), as well as various models of the spread of epidemics(23). In each of these domains, cascade modeling could be used toidentify the presence of phase transitions and values of critical param-eters. In addition, the relationship between network topology andresilience can be explicitly examined. For example, scale-free networks(24, 25) may be resilient to small, frequent perturbations that may affectone or more nodes (26) but are extremely vulnerable to catastrophicfailure should one or more hubs fail (27). In instances where two ormore networks share components, as is frequently the case for moderninfrastructure (for example, railway lines and power grids), cascadingfailures can propagate rapidly between coupled networks (28). Ifcomplex infrastructural networks in premodern urban environmentsshare common topological and functional characteristics with moderncomplex networks, then it is possible that catastrophic infrastructuralfailure may also have occurred in the past. In some cases, systemicvulnerabilities may have played a role in the deterioration of social or
1 of 8
SC I ENCE ADVANCES | R E S EARCH ART I C L E
on Novem
ber 2, http://advances.sciencem
ag.org/D
ownloaded from
economic conditions within past urban environments, or even triggeredtipping points, leading to large-scale urban abandonment.
Angkor’s water distribution networkAngkor was the world’s most extensive city by the 13th century CE,covering an area of approximately 1000 km2 (Fig. 1) (29). Angkordeveloped from two urban centers around Ak Yum (7th and 8th cen-turies CE) and the Bakong (8th and 9th centuries CE). Epigraphicsources date the beginning of the Angkor period to 802 CE. Overthe subsequent 600 years, the city established a number of infrastructurenetworks, the most extensive of which was the network of canals, em-bankments, moats, and reservoirs used to capture, store, and distributesurface water resources (29–33). This infrastructural network servedseveral functions, most critically flood regulation and irrigation for ag-riculture, and developed to become both spatially extensive [covering upto 1200 km2; (31)] and internally complex, with many thousands ofindividual components that were, to a greater or lesser degree, depen-dent on other components elsewhere in the system. By the end of the11th century, this network had effectively reached its maximum lateralextent (30). The emplacement in the network of the last large reservoir(the Jayatataka) in the late 12th century CE represents a process ofurban reorganization and infrastructural infill that mirrors the shifttoward dense, highly structured city blocks within and surroundingthe temple enclosures (33). The network was likely continually main-tained and modified during its development, with some specific in-stances of modification known in the archeological remains of thenetwork (31). Maintenance of the network appears to have ceasedin concert with its breakdown and the coincident demise of the city.Angkor’s water management infrastructure was a true palimpsest, rep-resenting hundreds of years of extensification, intensification, andmodification, which had developed to become a massive, complex,and interdependent infrastructural network.
Angkor foundered during the 15th century. The CambodianChronicles report that the king and his administration relocated to“Middle Period” cities in the southeast, close to the modern capitalof Phnom Penh (34). While Angkor was never completely abandoned,its population fell precipitously, and many parts of the city weresurrendered to the encroaching forest. Attributing this extraordinarysocial transformation primarily to the sack of Angkor by the Siamese
Penny et al., Sci. Adv. 2018;4 : eaau4029 17 October 2018
in 1431 CE remains problematic (35), and the emerging consensus isthat several factors may have played a role in the decision to abandonthe city (33, 36, 37). Among these factors is a coincident period ofweakened summer monsoon rainfall and increased intraseasonal var-iability revealed in tropical tree ring indices (37, 38) and numerous oth-er proxy data sources through the tropical Asia Pacific (39–41). Twomultidecadal-scale droughts in the mid 14th and early 15th centuriesCE bracket a period of unusually intense summer monsoon rainfall thatresulted in significant damage to Angkor’s critical water managementinfrastructure (37). Historian Victor Lieberman (42, 43) argues that thedemise of Angkor during this period was part of a larger territorial frag-mentation across the whole of the region, in part related to climaticvariability. However, even within this context, Lieberman recognizesthat Angkor is unusual and that the collapse there was more wrenchingand longer lasting than elsewhere on the mainland [(43), p. 27]. Noother contemporary state-level polity in mainland Southeast Asia en-dured social upheaval of the same magnitude or duration.
For many years, it has been suggested that the city’s networkedinfrastructure played a role in the demise of Angkor (30) and, morerecently, that the city’s massive infrastructure articulated in some waywith climatic variability to produce that outcome (44). What we havelacked is a clear account of how that articulation operated from amechanistic point of view and what characteristic(s) of the city’s in-frastructure made it particularly vulnerable to catastrophic failure un-der the impact of internal and/or external perturbation.
Here, we investigate the topological vulnerability of Angkor’s waterdistribution network to erosion and sedimentation caused by (poten-tially extreme) variations in rainfall conditions. The model networkinterrogated here is based on the topology of Angkor’s historic waterdistribution network as it was in the 13th century CE. Modeling of thesystem in earlier time periods is not possible because the system is apalimpsest developed over 600 years or more, and earlier networkconfigurations have been lost or obscured by subsequent modification.We can know the topology of the final network configuration, how-ever, as there were no additional modifications to the system after itsfragmentation. The model is composed of 1013 edges (primarily ex-cavated canals, but also embankments, earthen dikes, roadways, andso on, that act to control and direct the flow of water) and 617 nodes(canal confluence or bifurcations, reservoirs, temple moats, and so
2018
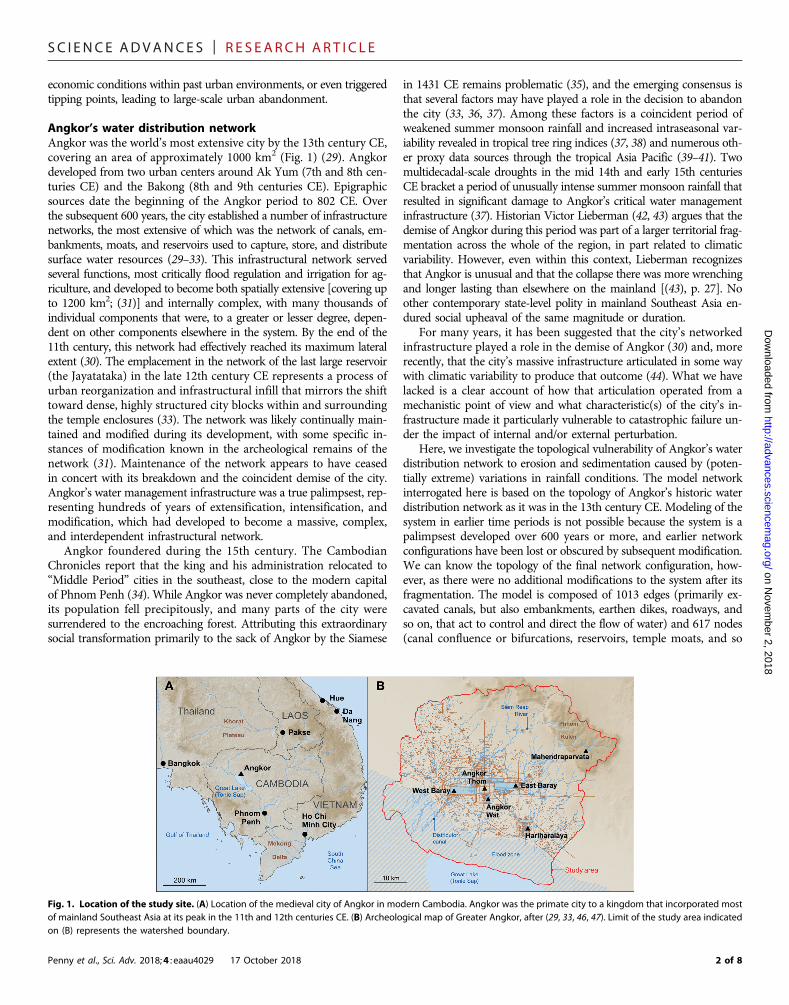
Fig. 1. Location of the study site. (A) Location of the medieval city of Angkor in modern Cambodia. Angkor was the primate city to a kingdom that incorporated mostof mainland Southeast Asia at its peak in the 11th and 12th centuries CE. (B) Archeological map of Greater Angkor, after (29, 33, 46, 47). Limit of the study area indicatedon (B) represents the watershed boundary.
2 of 8

SC I ENCE ADVANCES | R E S EARCH ART I C L E
on), which represent points at which edges meet or terminate. Thesenumbers include the super source and super sink (see Materials andMethods). We note that topological and physical vulnerability may bedistinct. That is, physical deformation of the structures composing thenetwork does not necessarily change their function in terms of waterdistribution. Here, the term “topological vulnerability” refers to thenetwork’s function in distributing water from the natural rivers to varioususe, storage, or discharge points within the network. We apply a simplenumerical simulation model of erosion and sedimentation within the wa-ter distribution network (Fig. 2) to identify whether these processes couldmarkedly alter the distribution of water through the network.
on Novem
ber 2, 2018http://advances.sciencem
ag.org/D
ownloaded from
RESULTSFor a given flood magnitude (g), three “phases” exist in topologicaldamage (Q) as a function of erosion (a) and sedimentation (b) (seeMaterials and Methods and the Supplementary Materials for detailson how these terms are defined and calculated; Fig. 3 and tables S1and S2). The first phase, which we refer to as phase 1, is character-ized by negligible damage to the water distribution network. In thisregion of parameter space, flooding does not produce erosion. As aincreases (and erosion threshold decreases), we come to phase 2, inwhich erosion occurs. The transition between phases 1 and 2 is char-acterized by a local maximum in Q, which we attribute to heterogeneityin erosion patterns. Heterogeneity is required for flow distribution to bealtered because of erosion (if all channels are eroded in proportion totheir initial flows, no change in the overall flow distribution occurs, andQ = 0). If sedimentation were not included in our model, this transitionwould still exist. This can be seen as an independence of Q on b untilafter the transition between phases 1 and 2 (Fig. 3B).
From phase 2, we can move into a feedback regime (phase 3) byincreasing b (that is, increasing the propensity for sedimentation).In this phase, incision of the flow path and subsequent flow capturestarves adjacent paths of flow, increasing the probability of sedimen-tation in those edges. This effect propagates to other dependent com-ponents of the network.
This unstable feedback regime is strongly dependent on floodmagnitude (g). Comparison of Figs. 3A and 4C demonstrates thatincreasing g substantially will expand the region of parameter spaceoccupied by the feedback regime (Fig. 4). For a wide range of a andb values, the damage mechanism robustly produces topologicaldamage as long as the flood magnitude is high enough that the ma-
Penny et al., Sci. Adv. 2018;4 : eaau4029 17 October 2018
jority of parameter space is within the unstable phase. Very largefloods will therefore quickly result in systemic instability in the waterdistribution network. The establishment of “pluvial” conditions overmainland Southeast Asia in the final decades of the 14th century (37),which is synchronous with radiometrically dated evidence of severe ero-sion within the network (see Materials and Methods), is likely to haveforced the network suddenly into this unstable phase space and likelycontributed to the fragmentation of Angkor’s infrastructure network.
While the positions of the transitions between phases 1, 2, and 3, aswell as the practical bounds of Q, depend on the topology upon whichthe simulation is performed, the model is applicable to any directed,acyclic network (see the Supplementary Materials for results from ageneric topology).
DISCUSSIONFrom a design standpoint, the spatial distribution of damage withinthis network is informative. While our primary result is valuable forassessing the validity of the hypothesis investigated, the water distributionnetwork itself has unique properties that can only be understood byexamining which parts are more or less susceptible to perturbation.
To localize changes to flow distribution within the network, wecalculated the average of Q on each edge (Qi)n over n = 3000 repeti-tions. A map representing these results for a particular set of conditions(g = 1, a = 0.9, and b = 0.9) is shown in Fig. 5. This map is represent-ative of the relative distribution for other values of control parameterstested as well. That is, while the magnitude of the damage depends ona, b, and g, its spatial distribution within the network does not. Damageis highest in upstream regions near the canals connected directly tosource nodes and dissipates through downstream bifurcations and re-combination points.
Some parts of the network appear robust to damage. Even whenthere is a large amount of water diverted from the main inputs, thedownstream branches tend to redistribute the flow in such a way thatit equilibrates in subsidiary regions such as the central urban area. Onthe other hand, the northern and western regions appear to accumulatemore damage relative to the central urban area and southeastern regions.
These results indicate that damage is most severe near upstreambifurcations, especially those areas that serve as the primary distributionforks for main inputs. The most robust regions are located downstreamof points at which damaged paths recombine. This is because damagecan represent either decreased or increased flow. If a depleted and
Fig. 2. Schematic of the numerical model of erosion and sedimentation, illustrated for a single bifurcation in the network. Channels (edges) are depicted asdark blue lines and junctions (nodes) as pale blue circles. The flow on each edge corresponds to the thickness of the blue lines. Initially, flow is distributed evenly. Inresponse to a heterogeneous increase in flow, one edge begins to erode, increasing its capacity and diverting water away from the neighboring edge. Sedimentationon this depleted edge, in turn, decreases its capacity and diverts more water along the eroded path, resulting in a damaged state in which the initial flow volume isunevenly distributed.
3 of 8

SC I ENCE ADVANCES | R E S EARCH ART I C L E
on Novem
ber 2, 2018http://advances.sciencem
ag.org/D
ownloaded from
flooded edge recombine at some downstream node, their respectiveperturbations cancel.
It should be noted that the results presented in Fig. 5 are aggregate.That is, they cannot explain the particular archeological observationsmade on the real landscape, which were derived from one of an infi-nite set of possible scenarios. That said, if we are to take these resultsliterally, they indicate that the infrastructural damage to waterwaysproduced by monsoon-driven flooding during the late 14th and early15th centuries would have had the most marked effects on the north-ern and western regions of the network, leaving the central and south-eastern regions relatively untouched from a functional perspective.The most marked evidence of erosive damage to the water distributionnetwork can be observed to the north and east of Angkor Thom, par-ticularly focused on the line of the Siem Reap River. As the primaryofftake from the source, this empirical evidence fits well with themodel output. However, excavations in the northwest sector ofGreater Angkor remain very limited, and it may be possible that fur-ther evidence of erosive damage is apparent in that area also.
Implications for stability of complex flow networksWe use a minimal three-parameter model of the water distributionnetwork of Angkor to determine whether the network was topologi-cally vulnerable to systemic failure when perturbed by low-frequency,high-magnitude weather events. We find that, above a critical flowvolume, damage to the network passes a threshold and becomes highly
Penny et al., Sci. Adv. 2018;4 : eaau4029 17 October 2018
unstable, resulting in the centralization of flow and a cascading func-tional breakdown of the network. Our model indicates that damage tothe network is focused on major distribution nodes close to the flowsource (that is, where the network captures flow from the natural riversystem). This agrees well with observations of the physical damage tothe system, and particularly the deep incision on the Siem Reap canal,which appears to have captured the majority of the natural flow fromthe Puok River. In the model, we find that damage diminishes indownstream reaches because of redistribution of load and the conse-quent equilibration of damage through distributary reaches.
We conclude thatAngkor’s urban infrastructure, particularly its verylarge and convoluted water distribution network, was prone to cascad-ing failure under the impact of high-amplitude but low-frequency cli-matic perturbation. This critical behavior was likely to have been theproduct of centuries of iterative development of water managementinfrastructure, creating a system that was at once very large, tightlyinterdependent, and characterized by the reuse of older, redundantinfrastructure. It follows that earlier, less extensive, or interdependentphases of the same network may demonstrate different characteristicsin terms of topological damage in response to climate forcing, and mayhave beenmore resilient than the network as wemodel it, at the peak ofits complexity in the 14th century CE.
We suggest that the functional breakdown of critical urban in-frastructure played a role in the broader demise of Greater Angkoras a viable urban complex in the 14th and 15th centuries CE. It
Fig. 3. Scaling of topological damage (Q) as a function of a and b (k = 1, g = 1) demonstrates three distinct regions of parameter space. The color plot in (A)represents the entire parameter space in a and b with the transition between regions (i) and (ii) dependent only on the erosion threshold, while the plots in (B) illustratehigher-resolution scans of “alpha” for fixed “beta” values, demonstrating a transition between regions (ii) and (iii) dependent on the thresholds for both erosion andsedimentation. Each datum point presented here corresponds to an average of 100 different flood configurations.
Fig. 4. Effects of flood magnitude (g) on Q. (A and B) Plots of Q as a function of a for k = 1, b = 0.001 (A), and b = 0.5 (B). (C) Color plot of Q as a function of a and b forg = 5 and k = 1.
4 of 8

SC I ENCE ADVANCES | R E S EARCH ART I C L E
on Novem
ber 2, 2018http://advances.sciencem
ag.org/D
ownloaded from
seems probable that Angkor’s water distribution network had beenfurther primed for catastrophic failure by long periods of droughtduring the 13th and 14th centuries, to which the functions of thenetwork, and presumably the agricultural practices of the Khmer, hadbecome equilibrated. Marked changes to the function of importantcomponents of the network are apparent in the remains of the system[such as alterations to the Siem Reap River and the reconfiguration ofthe outlet to the East Baray reservoir at Krol Romeas; (31, 37, 45)]. Theabrupt transition, in the middle of the 14th century CE, from pro-longed drought to particularly wet years, meant that the networkwas disequilibrated with prevailing weather. The subsequent adjust-ment of the system, through erosion of the major offtakes and central-ization of flow, exploited the systemic vulnerability shown by ourmodel and resulted in probable breakdown of the network.
There are two primary outcomes of this finding. First, the basicpathology of Angkor’s collapse is analogous to the challenges facedby networked urban infrastructures in the modern world. This wasnot an exotic catastrophe with no modern analog, nor was it the resultof unique exogenous forces. Second, this historic example of the cas-cading failure of critical infrastructure as a result of climate extremesreemphasizes the importance of building resilience into modern net-works, resilience engendered through modularity and redundancy, tocope with high-amplitude/low-frequency climatic extremes, of whichwe may, at present, have no historical or instrumental precedent.
MATERIALS AND METHODSMap dataThere is a long history of archeological remote sensing and mappingat Angkor, and comprehensive archeological maps representing thecomplete water distribution network have been produced and metic-
Penny et al., Sci. Adv. 2018;4 : eaau4029 17 October 2018
ulously ground verified (29, 30, 33, 46, 47). Some components of thenetwork (such as the large southwest-northeast distributor canal fromthe West Baray and several roads) continued outside of the mappedarea, and these were truncated at the watershed boundary (Fig. 1B).
The map was divided into 400, 7840-m2 grid squares in ArcGIS10, and all features functionally related to the distribution of waterin each grid square were given a number, a flow direction, and a di-mensionless weight value, according to the coding and classificationrules described below (see fig. S1). Metadata for each component(such as its type and geographical location) were also recorded.
Coding and classification of map dataAccess to and control of surface and ground water were critical forAngkor’s success as a low-density city, particularly in terms of floodcontrol in the urban core and agricultural productivity in the vast low-density sprawl that surrounds it. Yet, the city’s water distributionnetwork was not constructed with a single integrative function (as aplanned, unified single system for water management and distribution)but was a palimpsest created over several hundred years. As such, partsof the system may have ceased to function, have become redundant, orhave been repurposed while the city was active [the early centers ofMahendraparvata and Hariharalaya are obvious examples of such;(48, 49)]. The systemic complexity and interconnectedness of thenetwork emerged from its iterative growth, as well as the overprinting,modification, and redundancy of existing infrastructure. While this iswidely understood, the complete network is often treated as a single,functioning, engineered system with a set of shared purposes [see, inparticular, (32), but also 31)].
That the network is a diachronic artifact means that the functionalpart of the network at any given point in time may have been muchsmaller than our model indicates. From a network theory point ofview, this means that the network is not topologically static either dur-ing its growth or in its operation. Equally, the remains of the networkthat can be observed (and mapped) in the modern environment rep-resent only the endpoint of the network’s growth, not its evolution.However, irrespective of the intentions of the people who built andmaintained the network, or the use of its parts over time, the compo-nents of the network are still capable of influencing the flow of surfacewater because they remain physical topographical features in the land-scape. The age or original purpose of an individual component (edge)within the network is then irrelevant if its existence continues to in-fluence water flow. In most cases, individual components can be linkedmechanistically to other components in terms of flow connectivity, ir-respective of the age of the components or the specific intentions thatmay have motivated their construction. These simple principles—thatextant topographic features (canals, embankments, dikes, reservoirs,moats, and so on) influence the flow of surface water and that capturedwater flows downslope—form the basis of our approach to codingAngkor’s diachronic water management network.
Here, we took the network as it was represented in the archeologicalmaps as an accurate representation of the water distribution network, asit was (conservatively) well after the end of its growth, in the middle ofthe 14th century. We were specifically interested in this “time slice” be-cause it coincided with the “pluvial” episode associated with significantdisruption to and reorganization of the water distribution network (37).At that time, the Siem Reap canal incised up to 8 m below the landsurface, in its middle reaches. This is known to have occurred in the14th century [no earlier than 1268–1423 2s calibrated years CE usingthe IntCal13 database (50), with a median probability of 1345 CE;
Fig. 5. A map representing the average damage distribution in the network.This map was generated for control parameters g = 1, a = 0.9, and b = 0.9 [region(iii)]. The color of each edge represents the average Q value for that edge ⟨Qi⟩n,calculated from n = 3000 independent runs.
5 of 8

SC I ENCE ADVANCES | R E S EARCH ART I C L E
on Novem
ber 2, 2018http://advances.sciencem
ag.org/D
ownloaded from
1286–1440 2s calibrated years CE with the southern hemisphereSHCal13 dataset following (51), with an offset of 21 ± 6 yearsfollowing (52) and (53), with a median probability of 1356 CE]. Thatevent then represents a fundamental reorganization of the waterdistribution network at the end of the “Angkor 1” drought (37)and represents the final fragmentation and collapse of the network.The frequency of flood events that cause damage to the networkmust be lower than the rate of response in the receiving system (thatis, adjustment of the network topology through erosion or sedimen-tation) for the model to be applicable. The superdecadal frequency ofseasonal rainfall events likely to lead to significant flooding [as re-flected by the high Palmer Drought Severity Index values in tropicaltree ring indices (37)] indicates that this minimal requirement can bemet. Our simulated network incorporates all surface archeologicalfeatures that can be associated spatially and functionally with the wa-ter distribution network and is therefore the best approximation ofthe network as it was in the middle of the 14th century.
ModelThe cascade model used here is a generic, phenomenological model oferosion and sedimentation dynamics with aminimal number of controlparameters. We apply this dynamic model to an acyclic, directed treenetwork representing Angkor’s water distribution network, to test thesystem’s sensitivity to cascading failure (see fig. S7 for a degreedistribution of the network). Parameter validation is the most difficultaspect of modeling complex phenomena such as cascading failures ininfrastructural networks, and this is particularly so for ancient networks.For this reason, we chose to design a generic, phenomenological modelwith well-constrained control parameters that integrate innumerablephysical processes (such as rainfall, soil characteristics, human interven-tion capacity, local vegetation, channel design, etc.), which cannot be di-rectly measured. In our network, initially, each edge i in the graph ischaracterized only by a weightwi, which is based on the estimated capac-ity of the corresponding canal in the archeological data (see tables S1 andS2 for a list of symbols and control parameters). These dimensionlessweights are based primarily on the mapped width of the feature, whichacts as a surrogate for the true hydraulic radius of the ancient and nowlargely infilled canals.We then used these weights to calculate the relativedistributionof flowwithin thenetwork in the preflood condition: Startingat the source, flow was partitioned at nodes (junctions) in proportion tothe relative weights of the edges downstream from the node. This calcula-tion provided an initial flow value for each edge f oi (superscript denotesinitial condition, subscript denotes any individual edge i).
We assume that erosion and sedimentation are negligible in thisnetwork of low-gradient alluvial channels under stable rainfall con-ditions and that flow velocity vo is initially constant throughout thenetwork. Under these assumptions, we continue by assigning eachedge an initial flow capacity (coi ), which replaces wi as a surrogatefor the cross-sectional channel area under equilibrium conditions(coi ¼ f oi =vo). For convenience, we set vo = 1, so that throughout the net-work, the initial fluid velocity on each edge voi ¼ f oi
coi¼ 1.
After setting up these initial conditions, we introduced floodingas a gamma-distributed stochastic perturbation that (on average) in-creases flow rates throughout the network by a factor, g, of their initialvalues. This flood scenario increases the volume of water movingthrough the network. Angkor’s canal and storage network functionedto capture and control surface waters and to minimize destructiveflooding of the urban core by providing accommodation spaces forflood water (large reservoirs), fed by a network of excavated canals
Penny et al., Sci. Adv. 2018;4 : eaau4029 17 October 2018
(30). As such, our model assumes that flood flows within Angkor’swater distribution network were primarily restricted to the artificiallyincised channels—often further constrained by artificial levees ordikes—rather than occurring as widespread overbank surface flow.We note, also, that damage to the network that can be observed em-pirically indicates that damage presents as erosion (vertical incision,with few instances of lateral channel migration or avulsion) or sedi-mentation (infilling of canals particularly in the southern distributaryparts of the network) of the canals, rather than as evidence of broadcastflood deposits such as those associated with historical centers in north-ern Thailand (54, 55). Flood flow velocity, and thus stream power, ishigher in straight channels than an equivalent flow volume in naturallymeandering channels because the gradient of straight channels is higher(56). Relatively high stream power in straight channels and the inabilityof the canals to dissipate flood energy to floodplains result in rapidchanges in the geometry of incised, channelized networks during peakflow. Our model anticipates this dynamic response via a thresholdparameter a: The channel capacity increases if fluid velocity exceedsa threshold vi > voi a
�1, where a∈[0, 1] is a free parameter describingthe tendency for the channels to erode.
If canal capacity increases as a result of incision and/or wideningduring peak flow, then flow capture will create a feedback loopwhereby the increased hydraulic radius of the incising canal increasesthe proportion of flow delivered from the junction immediately up-stream of the eroding canal, thus encouraging further erosion. Whereflow capture results in a centralization of flow along a single path,rather than as a distributed flow through a drainage network, thereis a reciprocal starvation of flow and a decrease in fluid velocity incanals sharing upstream junctions with the incising flow path. Thisallows sedimentation to occur, thus reducing channel capacity in sub-sequent flow events. In our model, deposition of sediment due to de-creased velocity was implemented via a second threshold parameter b:Channel capacity decreases if fluid velocity on an edge falls below athreshold defined as bvoi ;where b∈[0, 1] is a free parameter describingthe tendency for sedimentation to occur.
The increment changes in channel capacity due to sedimentationor erosion depend on both the flow magnitude and the degree towhich the threshold condition is exceeded. Because channel capacityadjusts to accommodate changing amounts of flow, the network willstabilize if changes in velocity are insufficient to produce further ero-sion or sedimentation.
The free parameters determining the extent to which perturbationsare amplified in this way are the erosion and sedimentation thresholds(determined by a and b, respectively) and the flood magnitude factorg. Our model also contains a parameter k that determines the shape ofthe distribution from which flow perturbations are drawn. However,this parameter does not markedly alter the average behavior of thenetwork, so we will ignore its influence here. For the results presentedin the main text, we set k = 1, which is equivalent to distributing theperturbations exponentially with the rate parameter li ¼ ðgf oi Þ−1.
To examine the model’s behavior as a function of these free pa-rameters, we defined a value Q∈[0, 1] that represents the averagefactor by which flow on each channel in the damaged networkchanged relative to its initial value (Eqs. 3 and 4). That is, after theflood waters subside, and the initial flow levels are introduced atsource points, a value of Q = 1 represents a condition in which a singlepath through the network draws all the flow (i.e., the network hasbeen reduced to a single path from source to sink). On the other hand,if Q = 0, the distribution of water through the network is unchanged.
6 of 8

SC I ENCE ADVANCES | R E S EARCH ART I C L E
on Novem
ber 2, 2018http://advances.sciencem
ag.org/D
ownloaded from
This metric provides an unambiguous, well-constrained quantityrepresenting the topological damage to the network. It is importantto note that the value does not directly represent the physical damageto the network in the form of erosion and sedimentation. Instead, itquantifies the topological damage to the network’s ability to deliverwater to use points.
Sources and sinksWe designated nodes with no input as sources and nodes with nooutput as sinks. We approximated the watershed feeding the irrigationsystem as a virtual supersource connected to all physical source nodes.We set the weights of edges connecting the supersource to real sourcesequal to the sum of all weights exiting the real source nodes to whichthey connect. Similarly, we connected all sink nodes to a single virtualsupersink representing the aquifer, the Tonle Sap Lake, and all humanuse points (fig. S2). The weights of these edges can be set arbitrarily,since they have no neighbors (here, we set their weights equal to 1).Using this initial topology, we computed the relative equilibrium flowon each edge using our numerical model of flow distribution (fig. S1D).
Flood implementationIn our simulations of flooding, we defined the flood magnitude (g)as the proportion to which the average rainfall exceeds the total flowinto the network at equilibrium. We added this extra flow to thenetwork in the following way: The flow from the supersource increasesfrom its initial value ( feq) by a factor of [1 + g] (that is, ftot = feq + gfeq),and each edge in the network receives a unique perturbation (Xi) to itsinitial flow fo. In our implementation, X is a gamma-distributed ran-dom variable: Xi ~ G(k, qi), where k and qo = fogk
−1 are the “shape”and “scale” parameters defining the distribution, respectively (note thatfog is the average of the distribution from which the perturbation oneach edge is selected).
Cascading failure simulationsIn real systems, erosion and sedimentation rates depend on manyfactors such as the fluid velocity, the concentration of sedimentsuspended in the fluid, the vegetation in the channel walls, andthe material into which the channel is formed. In addition, changesin channel capacity over time would likely be influenced by humanactivity such as repair works. Our model simplifies this very complexset of conditions to focus on the primary role of fluid velocity inchannel erosion and sedimentation. It is worth noting here that ourmodel considers the topology fixed to a specific set of edges and nodesand therefore cannot account for effects such as flood waters breach-ing the banks of channels or the erosion of new channels. The dynam-ics can change the weights (capacities) associated with each edge butcannot cause the formation of new edges in the current implementation.
In addition to the assumption of fixed topology, we assume onlythat fluid flow is conserved and that channel capacity (cross-sectionalarea) increases from erosion or decreases from sedimentation at a ratethat is proportional to both the flow through the channel, and the de-gree to which the fluid velocity is above or below a predefined thresh-old for erosion or sedimentation, respectively. After specifying thecontrol parameters and initializing the network to its equilibriumstate, the flood flows were added to the supersource and to each ofthe edges. Then, the flow was distributed through the network, andnew edge capacities were calculated from the increased flow velocities.The damage to the network was then computed by distributing theequilibrium flow through the damaged network and calculating Q.
Penny et al., Sci. Adv. 2018;4 : eaau4029 17 October 2018
The simulation ended if Q converged to a specified degree. If not,the simulation incremented forward (t→ t′), and the process repeatedwith the new edge capacities. Here, we identified convergence as
jQðtÞ � Qðt′ÞjQðtÞ ≤ 5� 10�3 ð1Þ
During the cascade, erosion and sedimentation dynamics were notapplied to edges between the supersource and real source nodes, asthese represent disparate regions of the watershed. These edges main-tain the same flood flows throughout the simulation.
SUPPLEMENTARY MATERIALSSupplementary material for this article is available at http://advances.sciencemag.org/cgi/content/full/4/10/eaau4029/DC1Supplementary TextFig. S1. Conversion of archeological maps of 14th century Angkor into a directed, acyclicnetwork topology.Fig. S2. A map representing the Angkor network with supersource (S) and supersink (T)included.Fig. S3. A generic network showing equilibrium flow distribution at initialization.Fig. S4. To induce damage, random flood flows are added to each edge.Fig. S5. Final flow distribution resulting from the perturbation shown above, for a = 0.9, b = 0.9,and DQmin = 2 × 10⁻³.Fig. S6. Results of the model on a generic topology.Fig. S7. Probability distribution for indegree and outdegree of each node in the final networkrepresentation of Angkor’s water distribution network, with supersource and supersink omitted.Table S1. List of symbols for control parameters accompanied by their purpose in the overallalgorithm (role), brief description, and units.Table S2. List of symbols for noncontrol parameters, accompanied by their purpose in theoverall algorithm (role), brief description, and units.
REFERENCES AND NOTES1. L. Dueñas-Osorio, S. M. Vemuru, Cascading failures in complex infrastructure systems.
Struct. Safety 31, 157–167 (2009).2. S. M. Rinaldi, J. P. Peerenboom, T. K. Kelly, Identifying, understanding, and analyzing
critical infrastructure interdependencies. IEEE Control Syst. Mag. 21, 11–25 (2001).3. J. Ash, D. Newth, Optimizing complex networks for resilience against cascading failure.
Physica A 380, 673–683 (2007).4. C. Perrow, Organizing to reduce the vulnerabilities of complexity. J. Contingen. Crisis
Manage. 7, 150–155 (1999).5. A. Boin, A. McConnell, Preparing for critical infrastructure breakdowns: The limits of
crisis management and the need for resilience. J. Contingen. Crisis Manage. 15, 50–59(2007).
6. S. E. Chang, T. L. McDaniels, J. Mikawoz, K. Peterson, Infrastructure failureinterdependencies in extreme events: Power outage consequences in the 1998 IceStorm. Nat. Hazards 41, 337–358 (2007).
7. N. Santella, L. J. Steinberg, K. Parks, Decision making for extreme events: Modeling criticalinfrastructure interdependencies to aid mitigation and response planning. Rev. Policy Res.26, 409–422 (2009).
8. R. G. Little, Controlling cascading failure: Understanding the vulnerabilities ofinterconnected infrastructures. J. Urban Technol. 9, 109–123 (2002).
9. D. Helbing, Globally networked risks and how to respond. Nature 497, 51–59 (2013).
10. C. B. Field, V. Barros, T. F. Stocker, D. Qin, D. J. Dokken, K. L. Ebi, M. D. Mastrandrea,K. J. Mach, G.-K. Plattner, S. K. Allen, M. Tignor, P. M. Midgley, Managing the Risks ofExtreme Events and Disasters to Advance Climate Change Adaptation (Cambridge Univ.Press, 2012).
11. S. Angel, J. Parent, D. L. Civco, A. M. Blei, D. Potere, The dimensions of global urbanexpansion: Estimates and projections for all countries, 2000–2050. Prog. Plan. 75,53–107 (2011).
12. C. Isendahl, M. E. Smith, Sustainable agrarian urbanism: The low-density cities of theMayas and Aztecs. Cities 31, 132–143 (2013).
13. R. J. Fletcher, The Limits of Settlement Growth: A Theoretical Outline (Cambridge Univ.Press, 2007).
14. D. R. Easterling, G. A. Meehl, C. Parmesan, S. A. Changnon, T. R. Karl, L. O. Mearns, Climateextremes: Observations, modelling, and impacts. Science 289, 2068–2074 (2000).
7 of 8

SC I ENCE ADVANCES | R E S EARCH ART I C L E
on Novem
ber 2, 2018http://advances.sciencem
ag.org/D
ownloaded from
15. M. E. Smith, Sprawl, squatters and sustainable cities: Can archaeological data shed lighton modern urban issues? Cambridge Archaeol. J. 20, 229–253 (2010).
16. M. Scheffer, J. Bascompte, W. A. Brock, V. Brovkin, S. R. Carpenter, V. Dakos, H. Held,E. H. van Nes, M. Rietkerk, G. Sugihara, Early-warning signals for critical transitions.Nature 461, 53 (2009).
17. Y. Malhi, L. E. O. C. Aragão, D. Galbraith, C. Huntingford, R. Fisher, P. Zelazowski, S. Sitch,C. McSweeney, P. Meir, Exploring the likelihood and mechanism of a climate-change-induced dieback of the Amazon rainforest. Proc. Natl. Acad. Sci. U.S.A. 106,20610–20615 (2009).
18. T. M. Lenton, H. Held, E. Kriegler, J. W. Hall, W. Lucht, S. Rahmstorf, H. J. Schellnhuber,Tipping elements in the Earth’s climate system. Proc. Natl. Acad. Sci. U.S.A. 105,1786–1793 (2008).
19. P. Bak, C. Tang, K. Wiesenfeld, Self-organized criticality. Phys. Rev. A 38, 364 (1988).20. P. Crucitti, V. Latora, M. Marchiori, A topological analysis of the Italian electric power grid.
Physica A 338, 92–97 (2004).21. V. Cupac, J. T. Lizier, M. Prokopenko, Comparing dynamics of cascading failures between
network-centric and power flow models. Int. J. Elec. Power 49, 369–379 (2013).22. T. H. Cupertino, L. Zhao, Traffic congestion on clustered random complex networks, in
Complex Networks (Springer, 2011), pp. 13–21.23. R. Pastor-Satorras, C. Castellano, P. Van Mieghem, A. Vespignani, Epidemic processes in
complex networks. Rev. Mod. Phys. 87, 925–979 (2015).24. A.-L. Barabási, Scale-free networks: A decade and beyond. Science 325, 412–413 (2009).25. A. L. Barabási, E. Bonabeau, Scale-free networks. Sci. Am. 288, 60–69 (2003).26. R. Cohen, K. Erez, D. ben-Avraham, S. Havlin, Resilience of the internet to random
breakdowns. Phys. Rev. Lett. 85, 4626–4628 (2000).27. A. E. Motter, Y.-C. Lai, Cascade-based attacks on complex networks. Phys. Rev. E 66,
065102 (2002).28. S. V. Buldyrev, R. Parshani, G. Paul, H. E. Stanley, S. Havlin, Catastrophic cascade of failures
in interdependent networks. Nature 464, 1025–1028 (2010).29. D. Evans, C. Pottier, R. Fletcher, S. Hensley, I. Tapley, A. Milne, M. Barbetti, A
comprehensive archaeological map of the world’s largest preindustrial settlementcomplex at Angkor, Cambodia. Proc. Natl. Acad. Sci. U.S.A. 104, 14277–14282 (2007).
30. B. P. Groslier, La cité hydraulique angkorienne: Exploitation ou surexploitation du sol?Bull. Éc. Fr. Extr. Orient 66, 161–202 (1979).
31. R. Fletcher, D. Penny, D. Evans, C. Pottier, M. Barbetti, M. Kummu, T. Lustig; Authority forthe Protection and Management of Angkor and the Region of Siem Reap (APSARA)Department of Monuments and Archaeology Team, The water management network ofAngkor, Cambodia. Antiquity 82, 658–670 (2008).
32. M. Kummu, Water management in Angkor: Human impacts on hydrology and sedimenttransportation. J. Environ. Manage. 90, 1413–1421 (2009).
33. D. H. Evans, R. J. Fletcher, C. Pottier, J.-B. Chevance, D. Soutif, B. S. Tan, S. Im, D. Ea, T. Tin,S. Kim, C. Cromarty, S. De Greef, K. Hanus, P. Bâty, R. Kuszinger, I. Shimoda, G. Boornazian,Uncovering archaeological landscapes at Angkor using lidar. Proc. Natl. Acad. Sci. U.S.A. 110,12595–12600 (2013).
34. B.P. Groslier, Angkor and Cambodia in the Sixteenth Century: According to Portuguese andSpanish Sources (Orchid Press, 2006).
35. M. Polkinghorne, C. Pottier, C. Fisher, Evidence for the 15th century Ayutthayanoccupation of Angkor, in The Renaissance Princess Lectures: In Honour of Her RoyalHighness Princess Maha Chakri Sirindhorn on Her Fifth Cycle Anniversary (Siam Society,2018), pp. 98–132.
36. M. T. Vickery, Cambodia after Angkor: The chronicular evidence for the fourteenth tosixteenth centuries, thesis, Yale University, New Haven, Connecticut (1977).
37. B. M. Buckley, K. J. Anchukaitis, D. Penny, R. Fletcher, E. R. Cook, M. Sano, A. Wichienkeeo,T. T. Minh, Le C. Nam, T. M. Hong, Climate as a contributing factor in the demise ofAngkor, Cambodia. Proc. Natl. Acad. Sci. U.S.A. 107, 6748–6752 (2010).
38. E. R. Cook, K. J. Anchukaitis, B. M. Buckley, R. D. D’Arrigo, G. C. Jacoby, W. E. Wright, Asianmonsoon failure and megadrought during the last millennium. Science 328,486–489 (2010).
39. Q. Hua, D. Cook, J. Fohlmeister, D. Penny, P. Bishop, S. Buckman, Radiocarbon dating of aspeleothem record of paleoclimate for Angkor, Cambodia–Corrigendum. Radiocarbon 60,v–v (2018).
40. A. Sinha, K. G. Cannariato, L. D. Stott, H. Cheng, R. L. Edwards, M. G. Yadava, R. Ramesh,I. B. Singh, A 900‐year (600 to 1500 A.D.) record of the Indian summer monsoonprecipitation from the core monsoon zone of India. Geophys. Res. Lett. 34, L16707 (2007).
41. P. Zhang, H. Cheng, R. L. Edwards, F. Chen, Y. Wang, X. Yang, J. Liu, M. Tan, X. Wang,J. Liu, C. An, Z. Dai, J. Zhou, D. Zhang, J. Jia, L. Jin, K. R. Johnson, A test of climate, sun,and culture relationships from an 1810-year Chinese cave record. Science 322,940–942 (2008).
Penny et al., Sci. Adv. 2018;4 : eaau4029 17 October 2018
42. V. Lieberman, Strange Parallels: Volume 2, Mainland Mirrors: Europe, Japan, China, SouthAsia, and the Islands: Southeast Asia in Global Context, C. 800–1830 (Cambridge Univ.Press, 2003), vol. 2.
43. V. Lieberman, B. Buckley, The impact of climate on Southeast Asia, circa 950–1820:New findings. Mod. Asian Stud. 46, 1049–1096 (2012).
44. R. J. Fletcher, B. M. Buckley, C. Pottier, S. Y. S. Wang, Fourteenth to sixteenth centuriesAD: The case of Angkor and Monsoon Extremes in Mainland Southeast Asia, inMegadrought and Collapse: From Early Agriculture to Angkor (Oxford Univ. Press, 2017),pp. 275–314.
45. D. Evans, Applications of archaeological remote sensing in Cambodia: An overview ofAngkor and beyond, in Space, Time, Place, M. Forte, S. Campana, C. Liuzza, Eds.(Archaeopress, 2010), BAR International Series 2118, pp. 353–366.
46. C. Pottier, Carte archeologique de la region d’angkor-zone sud, thesis, Universite Paris III,Sorbonne Nouvelle, Paris (1999).
47. D. Evans, Putting Angkor on the map: A new survey of a Khmer ‘hydraulic city’ inhistorical and theoretical context, thesis, University of Sydney, Sydney, Australia (2007).
48. D. Penny, J.-B. Chevance, D. Tang, S. De Greef, The environmental impact of Cambodia’sancient city of Mahendraparvata (Phnom Kulen). PLOS ONE 9, e84252 (2014).
49. D. Penny, C. Pottier, R. Fletcher, M. Barbetti, D. Fink, Q. Hua, Vegetation and land-use atAngkor, Cambodia: A dated pollen sequence from the Bakong temple moat. Antiquity 80,599–614 (2006).
50. P. J. Reimer, E. Bard, A. Bayliss, J. W. Beck, P. G. Blackwell, C. B. Ramsey, C. E. Buck,H. Cheng, R. L. Edwards, M. Friedrich, P. M. Grootes, T. P. Guilderson, H. Haflidason,I. Hajdas, C. Hatté, T. J. Heaton, D. L. Hoffmann, A. G. Hogg, K. A. Hughen, K. F. Kaiser,B. Kromer, S. W. Manning, M. Niu, R. W. Reimer, D. A. Richards, E. M. Scott, J. R. Southon,R. A. Staff, C. S. M. Turney, J. van der Plicht, IntCal13 and Marine13 radiocarbon agecalibration curves 0–50,000 years cal BP. Radiocarbon 55, 1869–1887 (2013).
51. A. G. Hogg, Q. Hua, P. G. Blackwell, M. Niu, C. E. Buck, T. P. Guilderson, T. J. Heaton,J. G. Palmer, P. J. Reimer, R. W. Reimer, C. S. M. Turney, S. R. H. Zimmerman,SHCal13 southern hemisphere calibration, 0–50,000 years cal BP. Radiocarbon 55,1889–1903 (2013).
52. Q. Hua, M. Barbetti, Influence of atmospheric circulation on regional 14CO2 differences.J. Geophys. Res. Atmos. 112, D19102 (2007).
53. Q. Hua, M. Barbetti, U. Zoppi, D. Fink, M. Watanasak, G. E. Jacobsen, Radiocarbon intropical tree rings during the Little Ice Age. Nucl. Instrum. Methods Phys. Res. B 223–224,489–494 (2004).
54. S. Ng, S. H. Wood, A. D. Ziegler, Ancient floods, modern hazards: The Ping River,paleofloods and the ‘lost city’ of Wiang Kum Kam. Nat. Hazards 75, 2247–2263 (2015).
55. P. Bishop, D. Hein, M. Barbetti, T. Sutthinet, Twelve centuries of occupation of a river-banksetting: Old Sisatchanalai, northern Thailand. Antiquity 68, 745–757 (1994).
56. A. Simon, M. Rinaldi, Disturbance, stream incision, and channel evolution: The roles ofexcess transport capacity and boundary materials in controlling channel response.Geomorphology 79, 361–383 (2006).
Acknowledgments: We acknowledge the support and collaboration of the APSARA Authority,Cambodia. We thank V. Yauw for her work on an earlier version of the model presentedhere. Funding: This research was supported by The University of Sydney’s DVC ResearchStrategic Research Excellence Initiative (SREI-2020) project, “CRISIS: Crisis Response inInterdependent Social-Infrastructure Systems” (IRMA 194163), and the Australian ResearchCouncil Discovery Project DP170102574. D.E.’s contribution was funded by the EuropeanResearch Council (ERC) under the European Union’s Horizon 2020 research and innovationprogramme (grant agreement no. 639828). Author contributions: Conceptualization: D.P. andM.P. Methodology: D.P., C.Z., M.P., J.T.L., and N.F. Software: C.Z., N.F., and J.T.L. Formal analysis:C.Z., N.F., J.T.L., and M.P. Investigation: D.P., C.Z., D.L., D.E., and C.P. Writing, original draftpreparation: D.P., C.Z., and M.P. Writing, review and editing: D.P., C.Z., R.F., J.T.L., D.E., C.P.,and M.P. Competing interests: The authors declare that they have no competing interests.Data and materials availability: All data needed to evaluate the conclusions in the paperare present in the paper and/or the Supplementary Materials. Additional data related to thispaper may be requested from the authors.
Submitted 6 June 2018Accepted 12 September 2018Published 17 October 201810.1126/sciadv.aau4029
Citation: D. Penny, C. Zachreson, R. Fletcher, D. Lau, J. T. Lizier, N. Fischer, D. Evans, C. Pottier,M. Prokopenko, The demise of Angkor: Systemic vulnerability of urban infrastructure toclimatic variations. Sci. Adv. 4, eaau4029 (2018).
8 of 8

The demise of Angkor: Systemic vulnerability of urban infrastructure to climatic variations
Pottier and Mikhail ProkopenkoDan Penny, Cameron Zachreson, Roland Fletcher, David Lau, Joseph T. Lizier, Nicholas Fischer, Damian Evans, Christophe
DOI: 10.1126/sciadv.aau4029 (10), eaau4029.4Sci Adv
ARTICLE TOOLS http://advances.sciencemag.org/content/4/10/eaau4029
MATERIALSSUPPLEMENTARY http://advances.sciencemag.org/content/suppl/2018/10/15/4.10.eaau4029.DC1
REFERENCES
http://advances.sciencemag.org/content/4/10/eaau4029#BIBLThis article cites 45 articles, 9 of which you can access for free
PERMISSIONS http://www.sciencemag.org/help/reprints-and-permissions
Terms of ServiceUse of this article is subject to the
registered trademark of AAAS.is aScience Advances Association for the Advancement of Science. No claim to original U.S. Government Works. The title
York Avenue NW, Washington, DC 20005. 2017 © The Authors, some rights reserved; exclusive licensee American (ISSN 2375-2548) is published by the American Association for the Advancement of Science, 1200 NewScience Advances
on Novem
ber 2, 2018http://advances.sciencem
ag.org/D
ownloaded from