Embed Size (px)
Citation preview

ECOLOGICAL FACTORS AFFECTING THE DISTRIBUTION
//OF Paendoaonaa aolanaceartua IN KENYA
BY
JOHNSON
rg(S ¥BB8F8 HAS BERN ACCEPTED FOB THE D E G R E E Op, ..M [CftL T0B
O N i m a m u b Ja b y . l LACED 1N t h ®
A THESIS SUBMITTED IN PARTIAL FULFILMENT FOR THE DEGREE OF
MASTER OF SCIENCE IN THE UNIVERSITY OF NAIROBI.
JULY, 1982

DECLARATION
This thesis is my original work and has not been presented
for a degree in any other University.
This thesis has been submitted for examination with our
approval as University supervisors.
D r. D.M. Mukunya Date

A C K N O W L E D G E M E N T S
I wish to thank Dr. E.M. Gathuru and Dr. D.M. Mukunya,
my Supervisors for their constant guidance, advice and
encouragement during the course of this work.
I thank Mr. A.H. hamos, Senior Plant Pathologist,
Ministry o f Agriculture, for his helpful advice and enlighte
ning discussions. May I also thank the technical staff in
Crop Science Department, University of Nairobi and Plant
Pathology Section at the National Agricultural Laboratories
for their assistance in the laboratory and field work. In this
respect, I particularly thank Samson Kihara, Joyce Mungania and
George Shionda.
1 also wish to acknowledge my debt to my sponsor, the
Ministry o f Agriculture (Scientific Research Division) for
providing the scholarship and to Mrs. Janet K. Monyenye of
Box 59087, Nairobi, who tire lessly typed this work.
Finally I wish to thank my beloved wife, Grace, for
her understanding and continuous encouragement in d ifficu lt
times during which she could remain lonely as 1 was constan
t ly out working to complete this work in time.
i i i

T A B L E OF C O N T E N T S
ACKNOWLEDGEMENTS............................................................ i i i
TABLE OF CONTENTS.......................................................... i*
LIST OF TABLES........................................................ v iii
LIST OF FIGURES ...................................................... x
LIST OF PLATES........................................................ xi
LIST OF APPENDICES................................................ x ii
ABSTRACT ............................................................................ x i i i
1. INTRODUCTION ............................................................ 1
2. LITERATURE REVIEW................................................... 6
2:1 Introduction ................................................... 6
2:2 Economic Importance ..................................... 6
2:3 Symptomatology............................................... 8
2:4 E tio lo g y .......................................................... 10
2:5 Characteristics of Pseudomonas
solanacearum ................................................... II
2:6 Races and strains o f P. solanacearum . . . 12
2:7 E ffect of temperature on distribution
and survival of P. solanacearum.............. 15
3. MATERIALS AND METHODS........................................... 18
3:1 A survey of bacterial wilt of potatoes
in Central, Eastern and Rift Valley-
Provinces ........................................................ 18
3:2 laentification of Pseudomonas solanacearum .. 19
3:2:1 Isolation and storage ......................................... 19
3:2:2 Cultural characteristics ................................. 2C
i ▼
PAGE
V
PAGE
3:2:3 Biochemical characteristics .................................. 23
3:3 Identification o f races and biochemical
types of P. solanacearum ........................ ............... 26
3:1 Pathogenicity ............................................................. 27
3:5 Temperature ................................................................ 29
3:5:1 Effect of temperature on growth of P.
solanacearum on Kelman's medium........................... 29
3:5:2 Effect of Temperature on Development of Bac
te r ia l Wilt in Inoculated Potatoes kept under
Greenhouse and Growth Chamber Conditions .......... 30
3:5:3 Pseudomonas solanacearum Populations in the
rhizosphere at Various Temperatures.................... 32
3:6 Effect of altitude on wilt development ............. 33
3:6:1 Potato wilt assessment at low and high
altitudes ..................................................................... 33
3:6:2 Assessment of bacterial infection in potato
tubers .......................................................................... 31
3:7 Development of a serological laboratory test
for detection of P. solanacearum in potato
tubers of infected plants ...................................... 36
3:7:1 Preparation of antigens ......................................... 36
3:7:2 Preparation of antisera ......................................... 37
3:7:3 Determination of antisera titres ......................... 3®
3:7:1 Tube agglutination tests ....................................... 39
3:7:5 Slide agglutination tests ...................................... 10

v i
4 . RESULTS...................................................................................................... ^2
4:1 Survey Results .................................................. 42
4:1:1 Field symptoms .................................................. 45
4:2 Identification o f P. solanacearum............ 46
4:2:1 Isolation and storage .................................... 46
4:2:2 Cultural characteristics ............................... 47
4:2:3 Biochemical characteristics ....................... 47
4:3 Biochemical types and races of Pseudomonas
solanacearum is o la te d ........................... ......... 50
4:4 Pathogenicity.................................................... 53
4:5 Temperature ....................................................... 55
4:5:1 Influence of temperature on in vitro
growth of solanacearum........................... 55
4:5:2 Influence of temperature on ir vivo
growth of JP, solanacearum........................... 55
4:5:3 Influence o f temperature on P. solanacearum
populations in the rhizosphere .............. 65
4:6 Altitude ................................................................. 65
4:6:1 Influence of altitude on development of
w ilt symptoms ........................................................ 65
4:6:2 Influence o f altitude on infection of
potato tubers ........................................................ 67
4:7 Serology ................................................................. 69
PAGE

v i i
PAGE
4:7:1 Antisera t i t r e s ............................................. 69
4:7:2 Use and sp ecific ity of an tisera .................. 69
5. DISCUSSION AND CONCLUSIONS ................................... 72
6. REFERENCES .......................................................... 80
7. APPENDICES 87

v i i i
LIST OF TABLES
Table
1. Potato, tomato and egg-plant isolates
o f Pseudomonas solanacearum collected
from Nairobi area, Central, Eastern
and Rift Valley Provinces during long
and short rain seasons in 1980/81 ..............
2. Incidence of bacterial wilt of pota
toes in relation to altitude in Kenya . . . .
3. Incidence of bacterial wilt of pota
toes in relation to temperature in
Kenya ...................................................................
4. Colony characteristics of P. solanacearum
on Reiman's TZC medium after 48 hours o
incubation at 31 C ...........................................
3. Some biochemical characteristics of 34
isola tes of P. solanacearum collected from
potato growing areas in Kenya .....................
6. The e ffect of temperature on growth of
P. solanacearum biochemical type II
race 3 on Kelman's TZC medium ......................
7. The effect of temperature on growth of P.
solanacearum biochemical type III race 1
PAGE
21
43
44
48
49
56
on Kelman's TZC medium 57

Table PAGE
8. The mean so il temperatures in the green
house at various times of the day during
experimental seasons .................................................. 60
9. The average number of days taken for plants
inoculated with different concentrations of
P. solanacearum biochemical type II to wilt
during experimental seasons ..................................... 61
10. Influence o f temperature on development o f
bacterial wilt in potatoes inoculated with
P. solanacearum............................................................ 63
11. Infection percentage of potato by P. solana
cearum at Kamae and National Agricultural
Laboratories (NAL) during experimental seasons . . . 68
12. Titres of antisera produced from rabbits
injected with P. solanacearum biotype II .............. 70
13. Reaction of Agglutination tests for Coryne-
bacterium michiganense and Pseudomonas
solanacearum biotype II against P. solanacearum
biotype II antisera ...................................................... 70
14. Agglutination reaction of serial dilutions of
Pseudomonas solanacearum biochemical type II
vegetative ce lls against solanacearum
antisera prepared from four rabbits ...................... 71
i x

X
Figure PAGE
1. Growth temperature relationship of
P. solanacearum on Kelman's TZC medium............... 58
2. Determination of ID^q of Pseudomonas
solanacearum in glasshouse inocula
tion experiments done during four
seasons o f the year ................................................... 62
3. The e ffect of temperature on the mean
days to wilting o f Potato plants inoculated
with Pseudomonas solanacearum at various
Temperatures ................................................................. bU
U. The population density trends of P. solana
cearum after inoculations at various
Temperatures ................................................................. 66
LIST OF FIGURES
XI
Plate PAGE
1. The reaction of Nicotiana
tabacum >cv White hurley 40 hours
after being in filtrated with a sus
pension of Pseudomonas solanacearum
type III .................................................... 51
2. The reaction of Nicotiana tabacum cv White
burley 48 hours after being in filtrated
with a suspension of Pseudomonas
solanacearum biochemical type II ........................ 52
LIST OF PLATES
3. Eggplants showing wilt symptoms after
inoculation with Pseudomonas solanacearum
biochemical type II and III ............................. 54
x i i
LIST OF APPENDICES
PAGE
1. Formulae o f media and chemical
solutions ................................................................
2. Meteorological data for long and short rain
seasons 1980/81 at Kimakia in South Kinangop
near Kamae and National Agricultural
Laboratories .............................................................. 90
3. Population density trends of Pseudomonas
solanacearum in the rhizosphere of
inoculated potted potato 'plants at seven
so il temperatures ...................................................... 92

x i i i
A B S T R A C T
One hundred and thirty-eight potato farms were examined
for the presence of bacterial w ilt in Central^ Eastern and
Rift Valley Provinces. The altitude of these areas ranged
from 1390 m to 2790 m above the sea level and the mean annualotemperatures ranged from 12.1 C to 21.2°C. Twenty-one per
cent o f the farms were found infested with bacterial wilt.
The highest percentage o f infested farms lay between an
altitude of 1520 m and 2120 m. The disease incidences de
creased with elevations outside this sone.
Disease symptoms were used to identify diseased plants
in the fie ld . Thirty-three iso la tes collected were classi
fied as Pseudomonas solanacearum biochemical type II or race
3 of Buddenhagen, et a l. (1962). Potatoes (Solanum tuberosum)
were infected exclusively by th is biochemical type. Bio
chemical type III was isolated from egg-plant (S.
aelongena). This biotype was not isolated from potatoes and
was not found pathogenic to potatoes.
The optimum growth temperature of P. solanacearum in
vitro was 31°C. The minimum and maximum temperatures were
around 13°C and 35°C respectively. No growth was obtained
at 12°C and 37°C. The in vivo growth-chamber inoculation
experiments showed an increase in the rate of w ilt develop
ment as temperatures increased from H°C to 21°C. At higher
temperatures, the rate of wilt development decreased. Dose

XIV
response experiments in the greenhouse during four seasons
of the year shoved that the concentration of viable ce lls
required for of inoculated plants to wilt decreased witho oan increase in temperature from 16.9 C to 20.7 C.
oThe pathogen survived best in s o il at 24 C followed o oby 20 C and then 18 C. At these temperatures the bacteria
multiplied, reached a peak in the 14th day, then declined
slightly . The bacterial population remained almost constant o ofor 28 days at 14 C while at 28,30 and 33 C, the concentrations
of bacteria declined.
Most plants inoculated with the pathogen at high
altitude had latent infection . When tubers from these plants
were kept in humid conditions at 30°C, 2Qffi showed disease
symptoms. P. solanacearum was isolated from 3% o f externally
symptomless tubers and 14.9^ o f plants raised from symptom-
less tubers developed wilt symptoms under favourable conditions
P. solanacearum is a good immunogen. Antisera prepared
against the bacterium had titres ranging from 1/128 to 1/ 1024.
The antisera were found to be specific and could be used in
the laboratory for quick identification of P. solanacearum.

1. I N T R O D U C T I O N
Potato, (Solanum tuberosum), originated in the Chilean
area of South America (Saiaman, 1949). The plant was intro
duced into Kenya during the late 19th century by English
travellers. Early white settlers started growing potatoes in
Kenya highlands in the Rift Valley Province as soon as they
settled there in the late 19th century. The African farmers
in Kenya began the cultivation of the crop around 1918 purely
for home consumption as there was no provision for marketing
their produce. The areas growing potatoes subsequently
expanded from the Rift Valley into Kiambu, Murang'a and Nyeri
d istricts o f Central Province (Waithaka, 1975).
Potatoes have assumed great importance in Kenya both
as a subsistence food item and a cash crop. The crop is
cultivated on large and small scale farms mostly in Central,
Rift Valley and Eastern Provinces. Some potatoes are also
grown in Taita-Taveta d istr ict in Coast Province and K isii
d istrict in Nyanza Province. The tota l area under potato in
Kenya is estimated at 75,000- 100,000 hectares producing
between 400,000 and 500,000 metric tonnes o f the crop each
year, most o f which is consumed locally (Durr, and Lorenzl,
1980).
The crop grows best at an altitude between 1200 and
2800 m. These areas receive an average annual ra in fa ll of
between 850 and 1200 mm. The rainfall is distributed in two
rainy seasons, usually referred to as long-rain and short-rain

2
seasons. The long-rain season starts in March and continues
to June and the short-rain season starts in October and ends
in December. The ra in fa ll during the long-rains is , on the
average higher than during the short-rains. At the beginning
of each season, a potato crop is planted.
In Kenya, one of the objectives of potato production
is to achieve an increased production of the crop (Min. of
Agric. Kenya, 1974). This objective, however, is not
adequately achieved because the potato crop is usually
adversely affected largely by disease causing agents such as
fungi, bacteria, viruses and nematodes. Some of these agents
cause losses both in the fie ld and during storage. A l i s t of
some of these diseases is as follow s:-
late blight caused by Phytophthora infestans
early blight caused by Alternaria solani
bacterial wilt caused by Pseudomonas solanacearum
- bacterial soft-rot caused by Erwinia spp.
a mild mosaic caused by Potato virus I
a mosaic caused by Potato virus Y
le a f-r o l l , stunted growth caused by potato leaf r o l l virus
root-knot caused by Meloidogyne spp. e tc .
The most destructive diseases are: late blight and bacterial
w ilt.
Bacterial wilt o f potato was f ir s t reported in Kenya
in 1940 by Nattrass (1945 and 1946). He observed that the

3
symptoms of the disease appeared to be identical with those
of the Ring-rot caused by Corynebacteriua sepedonicum spp.
Attempts were made to demonstrate a gram-positive organism
since Corynebacterium spp. show gram-positive reaction, but
this fa iled . The identity of the pathogen, therefore,
remained doubtful for some time. Cultures of the organism were
studied by Dowson (1949) who identified the organism as an
"atypical” strain of Pseudomonas solanacearum. He called the
strain "atypical” because the Kenyan strain was found not to
discolour vascular bundles of potato host plants as had been
observed in other countries.
Crop losses are mainly due to the nature of damage
caused by the disease on crop plants. The foliage of the
infected plant become prematurely yellow and dies gradually or
may wilt suddenly without much change in colour. The stems
droop and shrivel and there is usually brown discolouration of
the vascular system. The infected tubers show discolouration
of vascular system. No tubers are formed in plants which are
attacked early during the stages of growth. The tubers on
plants infected in the middle of the growing season are small
and few and are found at harvest time in a ll stages of decay.
The w ilt pathogen can survive for several seasons in
the s o il and can be a cause of new outbreaks. In so il the
bacterium can survive as resting cells even at the wilting
point which in the potato growing areas is around 2$%
moisture (Min. of Agric. Kenya, 1966). The pathogen has also

been found to survive in crop debris, roots of alternative
hosts and volunteer tubers from earlier crops. These factors
make it d iff ic u lt to control Pseudomonas solanacearum by con
ventional means. It is possible, however, to control bacterial
wilt to a certain extent by a combination of planting wilt free
seed produced in areas cold enough for the .disease development
and reducing s o il contamination through crop rotation.
In Kenya, some investigations on the disease have been
carried out by various workers. The work of Nattras (1945 and
1946) has been outlined above. In I960, surveys of the potato
crop were carried out in Central Province and the results
showed that incidences of the disease in Nyeri and Kiambu dis
tr ic ts were 75 and 30% respectively. Results of two more
surveys carried out later in the province showed that incide
nces o f bacterial wilt increased from 405C in 1961 to 55/t in
1962 (Min. o f Agric. Kenya, I960, 1961 and 1962). Only two
strains of P. solanacearum were found to be present in Kenya
(Robinson and Ramos, 1964). The strains reported are bioche
mical type II and biochemical type III or race 3 and race 1
respectively o f Buddenhagen et al^., (1962).
S ta tistica l analysis o f the relationship between so il
temperature, ambient temperature and rate of wilting were
carried out by Ramos in 1971. He found that ambient tempera
ture was less influential in causing wilt as compared to so il
temperature. The so il temperature at which rates of wilting
of potato approached zero were calculated using regression

5
equations and was found to be 13.31°C. Other workers found
that- altitude influenced the incidences of the disease (Harris
and Michieka, 1972 and Harris 1976). The results of the
surveys on the potato crop which they carried out in Central
and Eastern Provinces, showed that wilt was found in 2/3 of the
crop examined in low zones (1300 m to 2100 n). In higher zone
(2100 m to 2700 m), wilt was found in 5% o f the fie lds examined.
The results clearly indicated great reduction o f incidences at
high altitudes.
Although some work on the bacterial wilt has been done
in Kenya, adequate information s t i l l lacks on the ecological
factors affecting distribution o f P. solanacearum in the country.
Since the disease is a major constraint in potato production
in this country, the study was undertaken with the following
objectives
1. to investigate the influence of altitude on
P. solanacearum biochemical type II race 3
2. to determine the possib ility o f latent infection
3. to investigate the occurrence of new bacterial
strains in various potato growing areas in
Kenya, and
4. to suggest suitable altitudes for certified
potato seed production based on the findings of
th is investigation.

2. LITERATURE REVIEW
Little was known about the incidence of bacterial wilt
of potatoes caused by Pseudomonas solanacearum prior to the
later part of the nineteenth century (Kelman, 1953). The
disease was f ir s t recognized and reported by Comes in Italy
in 1884. In 1890, Burrill described very b r ie fly a disease
of potatoes which had attracted his attention as something new
and which was probably this disease. He was the f ir s t person
to make pure cultures of the bacterium and inoculate the orga
nism into the potato. On the basis of the results he obtained
from the inoculations, Burrill concluded that the bacterium
was specific cause of tuber rot (Smith, 1914).
Following a brief study of wilt disease on tomato and
potato in Southern Mississippi, Halstead (1890 and 1891)
concluded that the causal agent was a bacterium. He suggested
that cucurbits were also attacked by the same bacterium. This
suggestion aroused the interest of Smith (1914) who began his
study of the disease in 1895. In 1896, he published the firs t
adequate description of the pathogen and demonstrated its
pathogenicity to potatoes.
2:2 Economic Importance
Bacterial wilt a ffects crops such as potatoes (Solanum
tuberosum), tomatoes (Ly coper si con esculentum), bananas (Musa sp.),
2:1 Introduction
6

7
tobacco (Nicotiana tabacum) etc, which are of economic impor
tance in practically every region between latitudes 4$°N and
4$°S of the world (Kelman, 1953, and Anonymous, 1977). The
disease causes heavy losses due to the destruction of the
affected crop plants. Premature death o f plants and reduction
in yield are the main ways in which bacterial w ilt causes econo
mic loss in crops. Secondary cause of decreased revenue from
potato is the rotting and decay of tubers during storage and
when in transit (Smith, 1914 and Kelman 1953). In 19H, Smith
observed that the disease had destroyed a great number of
fie lds of potatoes and tomatoes in the South-eastern region of
United States and had put an end to commercial growing of these
crops in Southern Mississippi, Alabama and parts of Florida.
In 1931, about 11% of tobacco seed-beds on 65 estates
in Sumatra were discarded because of the bacterial wilt pro
blem. There were also heavy losses on potato and tomato as
a result of which the cultivation of these crops was dis
continued in the same region (Kelman, 1953).
Surveys carried out in Kenya (Min. of Agric. Kenya,
I960, 1961 and 1962) showed that the disease was of economic
importance in the country. It was found that 73% of the
potato crop in Nyeri and 30% o f the crop in Kiambu districts
were infected in I960. When the disease incidences in Central
Province in 1961 and 1962 were compared, i t was found that the
number of crops infected rose from i+Cf% in 1961 to 33% in 1962.
These figures indicated that the disease was becoming serious
in Kenya and needed attention.

8
The mode of entry of Pseduomonas solanacearum into the
host tissue is usually through the root system (Kelaan, 1953)•
A wound is considered to be necessary for entrance of the
pathogen. Such a wound may be caused by parasitic fungi,
nematodes, insects and tools used during weeding. Following
entrance of the pathogen into host tissue, the length of time
which elapses before symptoms appear in the suscept is extremely
variable. It is dependent on the age, species o f plant attacked
and environmental factors. Smith (1914), found that the young
succulent plants developed c r it ic a l disease symptoms much more
rapidly than older plants.
The disease symptoms caused by P. solanacearum are those
of general w ilt followed by complete collapse o f affected plants
(Smith, 1914; Dowson, 1949} Kelman, 1953; and Harrison, I960).
The f ir s t symptom, usually noticed on a warm day, is slight
drooping of the tip of one or two of the lower leaves which
may easily be mistaken for a temporary shortage of so il
moisture (Harrison, I960). The affected leaves may recover
their turgidity towards evening. By the third day, two or
three leaves o f the affected plant are usually permanently
wilted. The lamina r o ll upwards and inwards from the margins
until the leaves are completely inrolled (Harrison, I960).
Sometimes only one branch of a potato h i l l may show fla c id ity .
In other cases i f onset of the disease is rapid, foliage of an
2 :3 Symptomatology

9
entire h ill may quickly droop and wilt without change in colour
(Smith, 1914; Kelaan, 1953 and Harrison, I960).
Harrison (I960), observed that the stems of affected
plants were v isib ly infected only for a distance of $ or 8 cm
from the old seed. When the stems were cut transversely at
a point above the ground level, there were no macroscopic signs
of the disease. He also found that even when considerable pres
sure was applied to the exterior of the stem, there was no
oozing of bacteria from the vascular ring. This is contrary
to what Smith (1896, 1914) reported.
Symptoms on infected tubers are brown discolouration of
the vascular ring with exudation of dirty-white, slimy masses
of bacteria when a cut tuber is gently pressed (Smith, 1914).
Harrison (I960) did not find any sign of disease externally
except for badly affected tubers. However, when the tubers
were cut transversely they showed white to creamy-white pockets
of diseased tissue in the vascular ring. The disease tissue
was o f putty-like consistency and was not slimy. Identical
symptoms were described by Nattrass (1945) in Kenya where an
atypical strain of P. solanacearum was reported. Similar
strains were reported in Portugal and India.
At the eyes or stolon end of a severely decayed potato,
a sticky exudate form which mixes with the s o il and causes it
to adhere to the tuber surface (Kelman, 1953). Plants attacked
early during the growing season form no tubers. The tubers
on plants infected in the middle of the season are small and few
and are found at harvest time in a l l stages of decay (Smith, 1914)*

10
In 1896, Smith published the firs t edequate description
of the causal agent of bacterial wilt of solanaceous plants and
demonstrated it s pathogenicity to potato. He named the bacte
rium Bacillus solanacearum E.F Smith, 1896. A number of generic
names have been suggested since then.
The f i r s t generic name (Bacillus) was proposed by Smith
(1896) because he thought the bacterium had peritrichous
flagella . Later, Smith placed the organism in the genus
Bacterium. In 1914, Smith suggested that the organism be
known as either _B. solanacearum or, following Migula's
c la ss ifica tion , as P. solanacearum because the pathogen was
found to be motile with a single polar flagellum.
The organism was again reclassified and placed in the
genus Phytomonas (Bergey, 1923)> but Dowson (1939 and 1943)
transferred i t to a new genus Xanthomonas, because i t differed
from typical members o f the earlier group in certain cultural
characteristics, later, i t was found that members of the genus
Xanthomonas were unable to u tilize asparagine as a sole source
of carbon and nitrogen in a synthetic medium, whereas jp.
solanacearum was able to u tilize this compound. This characteri
stic plus the absence of the typical yellow pigment in its colo
nies raised questions as to the reason of Dowson1s suggested
change in c la ss ifica tion . As a result, Dowson (1949) trans
ferred the organism back to the genus Pseudomonas. This is in
2 :4 E t i o l o g y
agreement with the classifica tion adopted in Bergey*s Manual of
11
Determinative Bacteriology,
Below ie a l is t of synonyms:
Pseudomonas solanacearum E.F. Smith, 19U
Bacillus solanacearum E.F. Smith, 1896
Bacterium solanacearum Chester, 1898
Phytomonas solanacearum (E.F. Smith) Bergey et a l, 1923
Xanthomonas solanacearum (E.F. Smith) Dowson, 1939
2:5 Characteristics of Pseudomonas snlanacearum
Smith (1896 and 19H) was the f ir s t person to describe
the causal agent of bacterial w ilt of potato. He observed that
single ce lls were rod-shaped and had rounded ends. Many of these
rods were 0.5 x 1.5/u. The sizes were, however, variable and were
influenced by the conditions under which growth was obtained. Rods
taken from young cultures in broth or nutrient agar were found to
be longer than those taken from old cultures.
Pseudomonas solanacearum is described in Bergey's Manual of
Determinative Bacteriology as gram-negative rods, measuring
0.5 - 0.7 by 1.5 - 2.5/um and motile by one to four polar flagella .
The bacterium shows distinct bipolar staining with methylene-blue,
carbol fuchsin or any of the alkaline aniline dyes (Smith, 1911).
Hayward (I960) indicated that the lack of a ffin ity for basic dyes
which result in bipolar staining was caused by the presence in the
ce lls o f massive inclusions of poly-^-hydroxybutyrate.
In determining the characteristic appearance of colonies of

12
P. solanacearum, conditions prevailing during incubation and
the type of substrate used are of great importance since they
influence bacterial growth (Smith, 1914). Smith observed that
colonies on solid media were usually irregularly round, slightly
raised, smooth and measured 3-5 mm in diameter. Appearance of
colonies of the bacterium have since been described by various
workers as irregular in shape, flu ida l, slightly raised, slimy
and creamy-white with pink-orange centres (Dowson, 1949; Kelman,
1954; Harrison, I960; Hayward I960 and French and Sequeira,
1970).
2:6 Races and strains of Pseudomonas solanacearum
It has been observed that (1) there is , in some cases,
apparent immunity of plants in a given area considered to be
suscepts elsewhere; (2) inoculations with pure cultures to
known hosts may fa i l to cause disease; and (3) atypical cultural
or physiological tra its in certain isolates have been detected
(Kelman, 1953). These observations indicate the possib ility of
the existence o f different strains within the species
Pseudomonas solanacearum E.F. Smith. Strain determination in
this species, however, is d if f ic u lt . The numerous hosts affected
by this pathogen, its wide geographic distribution, the intrinsic
complexities o f strain differentiation in this variable species,
have resulted in the development of several methods of c la s s if i
cation at subspecific level, including races, strains and
pathotypes, on the basis of widely different criteria (French
and Sequeira, 1970).

13
Harrison and Freeman (I960), after considerable cross-
precipitation purification, were able- to distinguish an
Australian potato strain of P. solanacearum from a Rhodesian
isolate on the basis o f differences in physiological reactions.
They did not obtain most specific antibody formation since
nucleoproteins were not used as immunogens. Natural host range,
reaction of d ifferen tia l hosts and colony appearance on tretra-
zolium medium, were used to c lassify several hundred P. solana-
cearum isolates obtained from a wide range of hosts in Central
and South America into three races. The races were characteri
zed as: race 1 which affects tobacco (Nicotiana tabacum) and
other solanaceous hosts; race 2 which causes w ilt of bananas,
Heliconia spp; and other Musaceous hosts; and race 3 which
a ffects potato (Solanum tuberosum), (Buddenhagen, e£_JLL* 1962).
The work of Sequeira and Averre (1961), showed that race 1
could be distinguished from race 2 isolates by the intense brown
pigment produced by the former when grown on a medium containing
tyrosine. Race 3 isolates produced small amount of this pig
mentation in the same medium.
Based on various physiological characteristics, Hayward
(1964), c la ss ified 95 isolates of P. solanacearum into major
biochemical type I ,I I ,I I I and IV. He found that a l l the isolates
obtained from potato formed a single group on physiological
reactions. He called the group biochemical type II which could
be differentiated from three other groups by i t s ab ility to
oxidize maltose, lactose and cellobiose and inability to
oxidize mannitol, sorbitol and du lcitol. This biotype

corresponds to race 3 of Buddenhagen et a l . , (1962) and it
attacks potatoes. Potatoes can also be affected by the broad-
range race 1 or biochemical type III (Buddenhagen and Kelman,
1964). Buddenhagen and Kalman (1964) also noted that in most
classifica tion schemes, colony morphology and virulence of
different isola tes on inoculated hosts could be used to dis
tinguish not only the three major races but a lso certain strains
within these races.
In 1966, Morton _et a l . , differentiated the three races of
P. solanacearum by serological methods. They found that P.
solanacearum was not closely related to other plant pathogenic
bacteria such as Corynebacterium michiganense, P. savastanoi,
P. syringae and Xanthomonas vesicatoria. Coleno et a l . , (1976)
observed that serotype scheme could be used for identification
of P. solanacearum.
Tobacco lea f in filtra tion technique was used by Lozano
and Sequeira (1970) to differentiate races of P. solanacearum.
£ach race showed a different reaction at the in filtrated area.
Thus race 1 isola tes caused no visible symptoms 24 hours after
inoculation, but a dark brown necrotic lesion appeared after
3b hours. Race 2 isolates induced hypersensitive reaction by
10-12 hours after in filtration and race 3 isolates caused a
yellowish discolouration of the in filtrated area by 48 hours
after inoculation. Colony morphology, melanin formation and
pathogenicity were useful in classification of isolates into
races and strains (French and Sequeira, 1970).

15
In Kenya, only two races of P. solanacearum have been
reported. These are race 1 and race 3. Nattrass (1945 and
1946) had reported that there were two strains o f P. soianacea-
rua both of which attacked potatoes in Kenya. However, in
1964, Robinson and Kanos reported that only one strain attacked
potatoes. The strain which was found to attack potatoes was
biochemical type I I . They also found that adequate differentia
tion between the biotypes was possible with only six carbohydra
tes. The carbohydrates they used were: glucose, lactose,
mannitol, sorb itol and cellob iose. Salicin was used as a nega
tive control. The work of Harris (1976) indicated that the
strain which causes the disease on potatoes in Kenya is a low
temperature strain.
2:7 Effect o f Temperature on Distribution and
Survival o f PseudomonaB solanacearum
Temperature is one of the environmental factors which
influence growth of bacteria. In 1896, Smith studied the
influence of temperature on the growth of P. solanacearum and
reported temperatures of 35-37°C as most favourable for growth
of the bacterium. Since then, other workers have found the
optimum temperature to be slightly lower. Thus, Harrison (I960)
observed that the optimum temperature of the potato isolates he
worked on was between 27°C and 28°C, the maximum temperature forothe isolates was 39 C and the thermal death point lay between
o47 and 31*5 C. Hayward (1964), observed that isolates fromopotato produced only a trace of growth at 37 C. Laboratory
16
experiments done by Harris (1976), showed that the growth rateo
of the bacterium was highest at 30 C and declined to zero obetween 15 and 12 C. He also observed a conspicuous effect on
altitude on incidences and severity of the bacterial wilt of
potatoes in Kenya. The results o f the surveys be conducted
indicated that at an altitude o f 2,400 m and above, the disease
was rare. In 1971, Ramos studied the temperatures at which
infection and wilting occured using sta tistica l analysis. He
found that ambient temperature was far less in fluential in
causing wilt as compared to s o il temperature. The so il tempe
rature at which rates o f wilting approached zero were calculatedo
using regression lines and were found to be 13.31 C for potatoes
(Ramos, 1971). Ramos (1976) a lso found that biochemical type
III race 1 had greater s o il survival ab ility than type II race 3.
Temperature plays an important role in the geographic
distribution o f the organism since i t is rarely found in areas
where the mean temperature fa lls below 10°C (Kelman, 1953).
The optimum temperature listed by Meier and Link (1923) forodevelopment o f bacterial wilt o f potatoes was between 25 C and
n O36 C. Below 12 C they found that the disease was inhibited.
Bacterial wilt o f potatoes is an important disease in
Australia (Lloyd, 1976). In his investigations, Lloyd found
that the disease occured in coo l temperate regions of New South
Wales. It was found that in such a cool temperate climate,
unlike tropical climate, alternative weed hosts were of l i t t le
consequence and therefore, the bacterium appeared to survive in
so il for 2-3 years in pieces of debris. The same findings were

17
observed by Graham et a l . . (1979) who,showed that the patho
gen could survive in plant debris and in latently infected
tubers. McCarter (1976), also studied the persistence of
P. solanacearum in a r t if ic ia lly infested soils and found that
the pathogen persisted at least for 4 years.

3. M A T E R I A L S A N D M E T H O D S
3:1 A Survey of Bacterial Wilt of Potatoes in Central,
Eastern and Rift Valley Provinces
A survey was carried out on the bacterial wilt of potatoes
in Central, Eastern and Rift Valley Provinces where potatoes
are grown in abundance. The survey was done during the long and
short rain seasons of 1980/81. The aim of the survey was to
determine the distribution and severity of bacterial wilt disease
in relation to altitude and also to investigate the possib ility
of occurence of new strains o f Pseudomonas solanacearum in
various potato growing areas in Kenya. Information was gathered
by asking farmers questions which had been previously prepared
and the responses were recorded on questionnaire forms. Field
observation were also recorded.
Selected routes were fallowed using a vehicle. At inter
vals of 10-15 kilometres, stops and v isits were made on potato
farms. The altitudes o f areas were measured using an altimeter
and the acreages of farms were roughly estimated and recorded
in hectares. Each farm was examined for the presence of any
plants showing wilt symptoms and the results were recorded as
"wilt present or absent" as applicable. Rows of potato crops
were then randomly selected and then healthy and diseased
plants were counted using a hand counter.
The disease symptoms as described by Kelman (1953) and
Harrison (I960), were used to differentiate a diseased plant
18

19
from a healthy one.
Samples of diseased materials were collected, labelled,
placed in polythene bags and brought into the laboratory at
National Agricultural Laboratories for isolation and id en tifi
cation of bacteria. Samples from other solanaceous crops, such
as egg-plants and tomatoes, which were found wilting in the
fie ld were also collected, brought to the laboratory and isola
tions were made from them.
3:2 Identification o f _£flfiudomonas solanacearum
3:2:1 Isolation and Storage
In the laboratory, the samples were washed thoroughly
in running tap water and then sectioned using alcohol-flame
sterilized scalpel and forceps. The sectioned pieces were placed
in sterile screw-capped tubes containing 5 nl sterile d istilled
water. These were allowed to stand for 15-30 *in to allow bac
teria to ooze out of the pieces. The resulting suspensions of
bacterial ooze were streaked on Kelman’ s tetrazolium (TZC)
medium (Jenkins and Kelman, 1976) using a sterile wire-loop.
oAfter incubating the cultures at 31 C for 18 hr discrete
single colonies with characteristic appearance resembling those
described by Kelman (1951) were picked using a sterile wire-loop
and suspended in sterile d is t illed water in small screw-capped
bottles. Sub-cultures were made on fresh Kelman's TZC media
to obtain pure cultures. A to ta l of 33 cultures were isolated
20
(Table 1) and were given seria l numbers in order of their
collection . Culture No. 13 was obtained from Commonwealth
Mycological Institute (C .M .l.) and it was run as a standard
culture in a l l identification tests.
Pure cultures were stored in sterile d istilled water ino
screw-capped bottles at room temperature (18-20 C) as described
by Kelman and Person, (1961). Routine checks were made at 3
months intervals on stored cultures by sub-culturing on
Kelman*s TZC medium to determine the stab ility of the virulent
type.
3:2:2 Cultural Characteristics of Pseudomonas solanacearum
Bacterial suspensions o f pure cultures were streaked on
Kelman's TZC medium in petri-dishes, incubated for 48 hr at o31 C and then colonies were observed visually for appearance in
colour, consistency, shape, formazan deposit and size. The
diameters of colonies were determined by superimposing a ruled
scale upon the longest axis of each colony (Kelman, 1954;
Hayward, I960 and 1964; Harrison, I960 and French and Sequeira,
1970).
Cultures of the isolates were used for the Gram-stain
reaction. For each isolate a dilute suspension was made in a
small drop o f sterile d is t illed water.
21
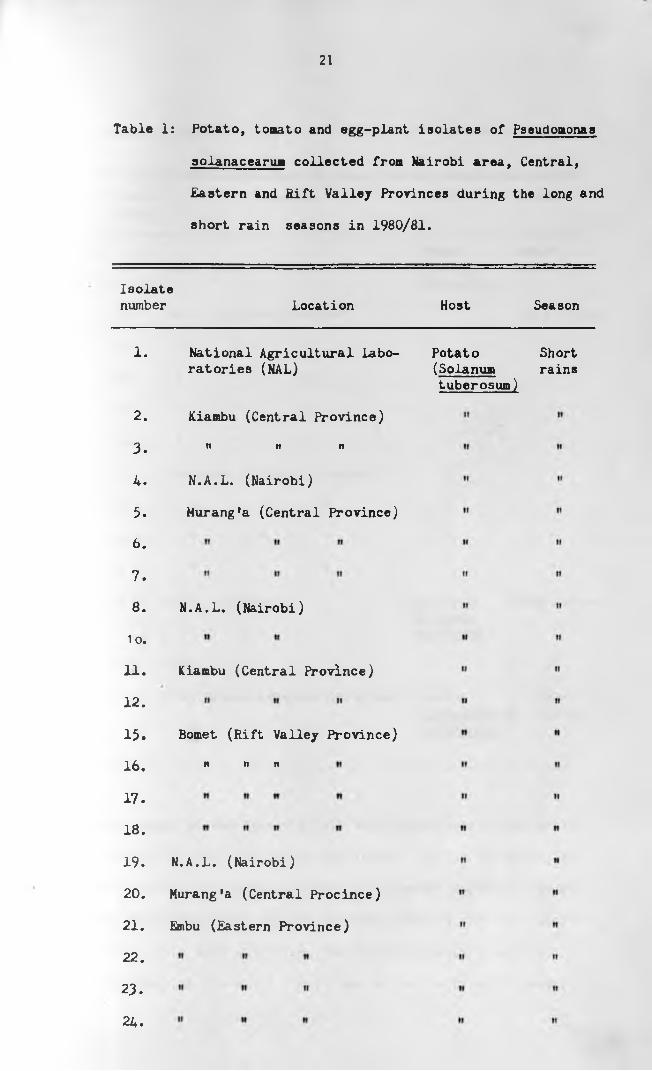
solanaccarua collected from Nairobi area, Central,
Eastern and Rift Valley Provinces during the long and
short rain seasons in 1980/81.
Table 1: Potato, tomato and egg-plant isolates of Pseudomonas
Isolatenumber Location Host Season
1.
2 .
3.
4.
5.
6.
7.
8.
1 o.
11.
12.
15.
16.
17.
18.
19.
20.
21.
22.
23.
24.
National Agricultural Laboratories (NAL)
Kiambu (Central Province)
n it n
N.A.L. (Nairobi)
Murang*a (Central Province)
N.A.L. (Nairobi)
Kiambu (Central Province)
Bomet (Rift Valley Province)
n n it
N.A.L. (Nairobi)
Murang'a (Central Procince)
Embu (Eastern Province)
Potato Short (Solanua rains tuberosum)
22
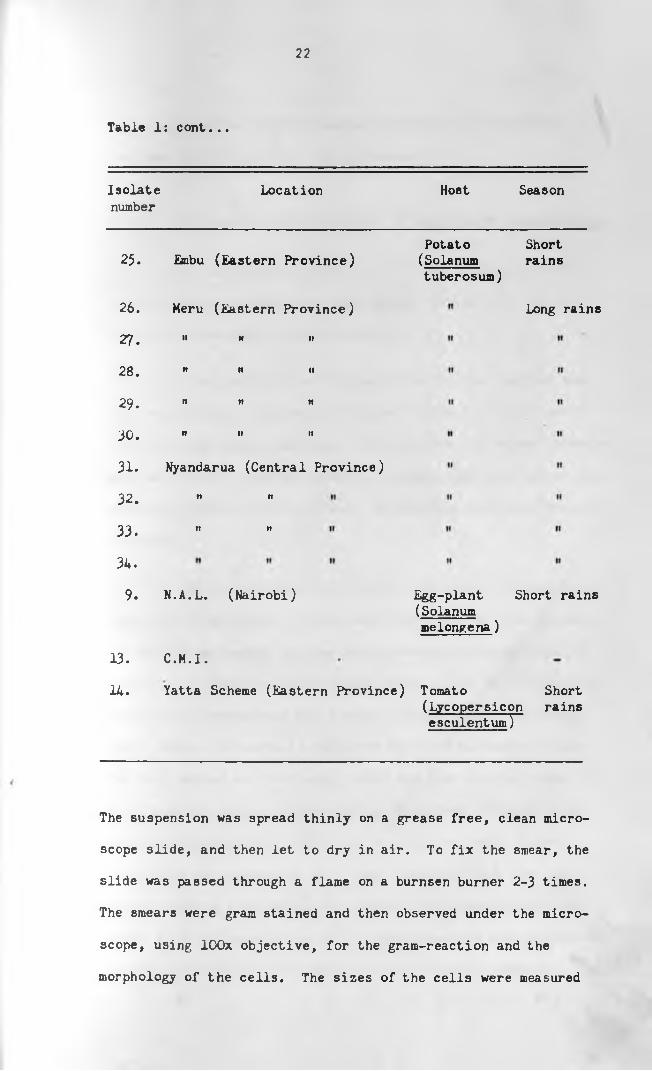
Table Is cont. . .
Isolate Location Host Seasonnumber
25. Embu (Eastern Province)
26. Meru (Eastern Province)
27. " " »
28. " " "
29. " " "
30. " » »
31-
32. " "
33. " "
34.
9. N.A.L. (Nairobi)
13.
14.
Nyandarua (Central Province)
C.M.I.
Potato(Solanumtuberosum)
Shortrains
Long rains
Egg-plant Short rains (Solanum melongena)
Yatta Scheme (Eastern Province) Tomato Short(Lycopersicon rains esculent um~]~~
The suspension was spread thinly on a grease free , clean micro
scope slide , and then let to dry in air. To fix the smear, the
slide was passed through a flame on a burnsen burner 2-3 times.
The smears were gram stained and then observed under the micro
scope, using lOQx objective, for the gram-reaction and the
morphology of the ce lls . The sizes of the ce lls were measured
23
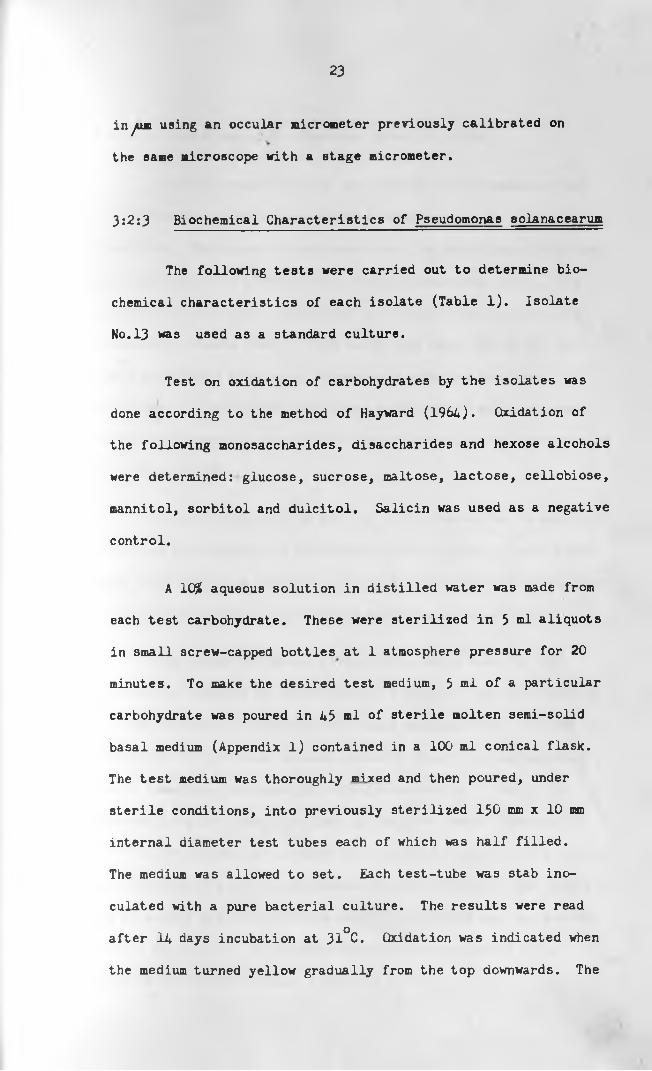
inyum using an occular micrometer previously calibrated on
the same microscope with a stage micrometer.
3:2:3 Biochemical Characteristics of Pseudomonas solanacearum
The following tests were carried out to determine bio
chemical characteristics of each isolate (Table 1 ). Isolate
No.13 was used as a standard culture.
Test on oxidation of carbohydrates by the isolates was
done according to the method of Hayward (1964). Oxidation of
the following monosaccharides, disaccharides and hexose alcohols
were determined: glucose, sucrose, maltose, lactose, cellobiose,
mannitol, sorbitol and d u lc ito l. Salicin was used as a negative
control.
A 1(# aqueous solution in d istilled water was made from
each test carbohydrate. These were sterilized in 5 ml aliquots
in small screw-capped bottles at 1 atmosphere pressure for 20
minutes. To make the desired test medium, 5 nil o f a particular
carbohydrate was poured in 45 ml of sterile molten semi-solid
basal medium (Appendix 1) contained in a 100 ml conical flask.
The test medium was thoroughly mixed and then poured, under
s ter ile conditions, into previously sterilized 150 mm x 10 mm
internal diameter test tubes each of which was half f i l le d .
The medium was allowed to set. Each test-tube was stab ino
culated with a pure bacterial culture. The results were readoafter 14 days incubation at 31 C. Oxidation was indicated when
the medium turned yellow gradually from the top downwards. The

control tubes remained olivaceous green in colour
Nitrate reduction test was done on a ll isolates to test
the presence o f the enzyme nitrate reductase in the bacterial
isolates. The nitrate reductase cause the reduction of nitrate
to n itr ite in the presence of a suitable electron donor. The
isolate cultures were inoculated into peptone water containing
potassium nitrate (KNO ). The tests were kept for 18 hr at o
31 C and then 1 ml of test reagent was added to the test
cultures. A red colour developing within a few minutes indica
ted the presence of n itrite and hence the a b ility of the organism
to reduce nitrate.
Investigation on the a b ility of the bacterium to denitrify
was done by covering the inoculated test cultures in test tubes
with sterile liquid paraffin. The gas produced was trapped under
o i l indicating the ab ility of the bacterium to denitrify.
The method of Kovacs (1956) was used to test for the
presence of oxidase in the bacterial isolates. The test depends
on the presence in bacteria of certain oxidases that catalyse the
transport of electrons between electron donors in the bacteria
and a redox dye-tetramethyl-p-phenylene-diamine. The dye is
reduced to a deep purple colour in positive tests . Whatman's
No.l f i l t e r papers were soaked in a freshly prepared 1% solution
of tetramethyl-p-phenylene-diamine dihydrochloride. The colony
to be tested was picked with a s ter ile wire-loop and was smeared
on the moist area. A positive reaction was indicated by an
intense deep-purple colour appearing within 5-10 sec.

25
To demonstrate the presence of catalase in the bacterial
iso la tes, a loopful of a 18 hr bacterial growth on Kelman's
TZC medium was placed on a clean microscope slide then a drop
of 20% hydrogen peroxide was added using a dropper. A positive
reaction was indicated by production of gas bubbles. In the
reaction, catalase enhances the production of oxygen from
hydrogen peroxide.
Hydrogen sulphide production ab ility by the bacterial
cultures was also tested because some organisms decompose
sulphur-containing amino acids to form hydrogen sulphide among
other products. A positive test is demonstrated by the format
ion of black insoluble ferrous sa lt . Whatman's No.l paper strips
were soaked in lead acetate solution and le t to dry. The strips
were then suspended over peptone water cultures which were theno
incubated for 96 hr at 31 C and observed daily for positive re
action.
Arginine hydrolysis test was done to test the presence
of arginine dihydrolyase in the bacteria c e lls . Arginine broth
was inoculated with the isolates and incubated at room tempera
ture (18-20°C). The change of colour from bright pink to brown
in this test indicated hydrolysis of arginine and consequently
the presence o f the pertinent enzyme.
The ab ility of the bacterium to hydrolyse starch was
tested by inoculating the bacterial cultures on starch agar and
looking for the presence of a clear zone around the inoculum
that would indicate starch hydrolysis.

26
3:3 Identification of Races and Biochemical
types of Pseudomonas solanacearum
To identify the isolates (Table 1) into races and bio
chemical types, the following characters were used:-
1. Biochemical characteristics
2. Colony characteristics and
3. Tobacco lea f in filtra tion reactions
Biochemical type determination of the isolates was done
according to the method of Hayward (19b4)> with some modifica
tion, using the basal medium with the composition shown in
appendix 1.
Five ml of 10 (W/V) sterile solution of test carbohy
drate was added to 45 nil of molten; cooled basal medium. The
solution was then dispensed in sterile plugged tubes (1 x 12.5 cm)
to a depth of about 4 cm. The medium was labelled according to
the carbohydrate added. The carbohydrates used were: glucose,
sucrose, maltose, lactose, cellobiose, sorbitol and dulcitol.
Salicin was used as a negative control.
The media were stab inoculated with pure bacterial cul
tures of the isolates. The results were observed after 3*7 and
14 days incubation at 31°C. Oxidation was indicated when the
medium turned yellow starting at the top and progressing down
wards.
The nitrate reduction test was carried out on a ll isolates
as described earlier

27
Detailed colony characteristics according to the method
of French and Sequeira (1970) were used to group the isolates
into races. Pure isolates (Table 1) were cultured on Kelman's
TZC medium and after incubation at 31°C for 48 hr> colony
characteristics were observed visually and described.
Tobacco leaf in filtra tion test was conducted using the
method of Lozano and Sequeira, (1970). This test was useful in
that it gave different tobacco leaf reactions for different races
Nicotiana tabacum L cv. "White burley" plants were used for ino
culations 30-45 days from the date of transplanting. The fu lly
expanded leaves were in filtrated by injecting water suspensions
of bacteria into the intercellu lar spaces with a hypodermic
syringe fit te d with a gauge 30 needle. The bacterial suspension
contained approximately 2 x 10 cells/m l. For each isolate two
plants were tested. The leaves of the control plants were
in filtrated with sterile d istilled water. The inoculated plants
were incubated under green-house conditions and leaf reactions
recorded a fter 24,48,72 and 96 hr.
3:4 Pathogenicity
All isolates (Table 1) were tested for their pathogenicity
on potato (Solanum tuberosum L. cv. Kerr's Pink) and egg-plant
(&. melongena). For each isolate three plants from the two
species above were tested. Root-wounding method of Winstead and
Kelman (1952) was used for inoculations with some modification.
The plants were grown in 17 cm diameter plastic pots f i l le c

28
with sterile s o il . Potato plants were inoculated when they
were 4 weeks old or when the 8th leaf was fu lly expanded and
the egg-plants were inoculated A weeks after transplanting.
Inocula of iso la tes were prepared by growing the cultures in
Kelman's medium, without tetrazolium salt for 48 hr at 31°C.
The bacteria were harvested by washing the surfaces of the
medium with ster ile water into 30 ml conical flasks. The
suspensions were then well shaken and their optica l densities
(O.D.) adjusted to read 0.3 using a portable colorimeter and a
blue f i l t e r . At this O.D., the concentration o f bacteria was o
approximately 107 cells/m l. This had been calculated previously
using the viable ce ll count method.
Inoculations were made by cutting the la tera l roots with
a scalpel along one side of the plant to a depth of approximately
4 cm and pouring 10 ml of a bacterial suspension over the severed
roots. Wilting symptom and reisolation of P. solanacearum from
the wilted plants were used as signs of pathogenicity.
Pathogenicity tests were also done on the following
varieties of potato using P. solanacearum biochemical types II
and I I I : Annet, Kenya Baraka, Desiree, Feideslolin, Roslin
Eburu (B53), Roslin Tana and Roslin Gucha.

29
3:5 Temperature
The investigations below aimed at finding out the e ffect
o f temperature on the following :-
in vitro growth of Pseudomonas solanacearum
in vivo m »i « i» and
populations of. P. solanacearum in the rhizosphere .
The findings may help to explain the e ffect o f temperature on
w ilt development in the fie ld .
3 :5 :1 E ffect of Temperature on Growth of
Pseudomonas solanacearum on Kelman's Medium
Isolates of P. solanacearum Nos. 8 and 9 (Table 1) were
used for these investigations. Isolate No.8 was randomly selec
ted to represent Hayward's (1964) biochemical type II or race 3
of Buddenhagen et a l . . (1962) and isolate No.9 was selected to
represent biochemical type III or race 1 of Buddenhagen et a l . .
(1962). The isolates were streaked separately on Kelman's TZC
medium using a sterile platinum wire-loop. The plates were
incubated at known temperatures until descrete single colonies
of reasonable sizes had grown. The length o f time taken for
such colonies to grow was recorded in hours.
A known number of colonies were then removed by cutting
o f f a piece o f the medium on which the colonies were growing.
These were shaken in 10 ml sterile d istilled water, in small
screw-capped bottles, for 3-1 minutes. The process was rep li
cated four times and the suspensions were used as follows:

30
six ten-fold serial dilutions were made from each of the
four replicates. Samples (0.1 ml) from each of the last
three d ilutions, of each replicate, were spread on each of
3 Kelman's TZC agar plates. After incubation for 18 hr at
31°C, the number of colonies growing on each plate were
counted. The number of ce lls per colony, generation time,
the number o f doublings and number of generations were
calculated. Curves based on the number of doublings in 18
hr against temperature were plotted.
The optimum temperature for P. solanacearum biochemical o
type II is 31 C (Harris, 1976). The bacterium grows poorly at o37 C (Harrison, I960) and the lower limit for growth of the
o o <bacterium is 15 C while at 13 C no growth is obtained (Harris,
1976). Because of these findings the following temperatures were
selected for this investigation:
Isolate No.8: 13,15,17,19,21,23,25,27,30,31,33,35 and 3A
Isolate No.9: 11,18,22,26,30,34,36 and 38°C
3:5*2 E ffect of Temperature on Development o f Bacterial
Wilt in Inoculated Potatoes kept under Greenhouse
and Growth Chamber Conditions.
(a ) Greenhouse experiments on the effect o f temperature
on the development of bacterial w ilt :
Greenhouse experiments to test the e ffe ct of temperature
on the development of wilt were carried out in November/Becember,
1980, February/March, April/May and June/July, 1981. Certified

31
potato tubers, cultivar "Kerr's pink", were grown and used
during each season. The potatoes were grown in plastic pots,
16 cm diameter f i lle d with sterilized s o il . When the plants
were U weeks old they were considered ready for inoculation and
were arranged into 10 blocks each containing 8 plants. Five
blocks were inoculated with P. solanacearum biochemical type II
(culture of iso la te No.8 in Table 1) and the remaining 5 blocks
were inoculated with biochemical type III (culture of isolate
No. 9 in Table 1 ).
Inocula of biotypes were obtained from 18 hr bacterial
cultures grown on Kelman's TZC medium without tetrazolium salt
to avoid pigmentation. Original suspensions of the biotypes
were made by washing the cultures with sterile d istilled water
into separate 100 ml sterilized conical flasks. These were well
shaken then the O.D. adjusted to 0.5 using a portable KKI. co lo -qrimeter. Such a suspension contained approximately 10 bacterial
ce ll per ml.
Six ten -fo ld serial dilutions from each o f the original
suspensions were prepared to give the following concentrations:
109 (o r ig in a l), 108, 107, 106, 105, lo \ and 103 ce lls
per ml. Each potted plant in a block was inoculated randomly
with one of these concentrations. The remaining plant in each
block, was used as a control. For the inoculations, root-wounding
method of Winstead and Kelman, (1952) was used as described earlier.
Observations were made daily and the number of days taken for each
plant to wilt were recorded. S oil temperatures were recorded daily
at the following times:

32
9 A.M. 12 M., 3 P.M., 8 P.M., and 3 A.M.
Curves based on wilting time against temperature were plotted
for each season and LD 30 estimated.
(b) Effect of Temperature on development of wilt in a Growth Chamber:
Potato plants were raised in plastic pots as described
earlier. When the plants were 4 weeks old, 15 of them were tra
nsferred into a growth-chamber set at a known temperature and
80 - 100$ humidity. Ten of the plants were inoculated each
with 10 ml o f 10 cells/m l of j\ solanacearum biochemical type
II using the root-wounding method of Winstead and Kelman, (1952).
The rest of the plants were used as controls. The number of days
taken for each test plant to wilt were recorded, a curve based
on the mean days to wilting against temperature was plotted. The
experiment was run at the following temperatures:
14, 18 , 20, 24 , 28, 30 and 33°C
3:5:3 Pseudomonas solanacearum Populations in the rhizosphere
at Various Temperatures
Potato plants, cultivar "Kerr's Pink", were placed in the
growth-chamber at known temperatures and inoculated as described
earlier. S o il samples (about 1 g each) were collected from three
separate pots having test plants and the 4th sample was collected
from one of the control pots. Samples were collected at the 7th,
14th, 21st and 28th day after inoculation. A stock borer 0.75 cm
in internal diameter was used to collect the s o il at a depth of
about 10 cm from the surface. These samples were taken to the

33
laboratory and the bacterial population determined as follows:
Each sample was shaken for 3-4 min in 10 ml s ter ile d istilled
water and then six ten-fold seria l dilutions were prepared.
Samples (0.1 ml) from each of the dilutions at 10 ^t 10 and
10” 6 were spread on 3 Kelman's TZC agar plates. After incuba-otion for 48 hr at 31 C, colony counts were made and the number
of bacteria per g of dry so il calculated. Curves based on mean
population density/g of so il against time in days were plotted.
3:6 Effect of Altitude on Wilt Development
3 :6 :1 Potato Wilt Assessment at Low and High Altitudes
The objective of the experiment was to investigate the
effect of altitude on wilt development in inoculated potato
plants. For th is , experiments were laid at Kamae Forest Station
and National Agricultural Laboratories. The s ite at the National
Agricultural Laboratories is approximately 17b0 m and was selec
ted to represent low altitude. Kamae Forest Station is located
at 2480 m and i t served as the high altitude s ite . At this
site the land was under afforestation and therefore considered
relatively free from the pathogen.
"Kerr's Pink" certified potato seed tubers were planted
at each site in 3 plots each ox3 m, with paths 1.5 m between
them. Diammonium phosphate fe r t iliz e r was applied during
planting at the rate of 500 Kg/ha. The spacing between plants
was 30 cm and 0.74 m between rows. There were 5 rows in each
plot and 20 plants in each row. Plants were sprayed with

Mancozeb (Zinc Manganese ethylene bis-dithiocarbamate) every
two weeks to control late blight. The spraying started when
the crop was 1 week old after emerging and continued until it
matured.
Inocula of P. solanacearum biochemical type II and III
were obtained from the 48 hr bacterial growth on Kelman*s TZC
media without tetrazolium sa lts . The suspensions were made in
ster ile d is t ille d water and adjusted to O.D. 0.5 using a colo
rimeter. A ll plants in the f ir s t plot at each site were inocu
lated with P. solanacearum biochemical type II and the plants
in the second plots were inoculated with biochemical type III .
Plants in the third plots were inoculated with sterile d is t ille d
water to serve as controls.
Inoculations were made by the stem puncture method of
Winstead and Kelman, (1952). A drop of the inoculum was placed
on the axil o f the third fu lly expanded leaf from the top, and
the stem was pierced by thrus.ting a scalpel-tipped dissecting
pin downward through the inoculum drop. All stems of each
plant were inoculated. The number of plants which showed
wilting symptoms were recorded.
The experiments were done in two seasons (during short
rainy season, 1980, and long rainy season, 1981). New plots
were used in the second season.
3:6:2 Assessment of Bacterial Infection in Potato Tubers
The aim of the experiment was to investigate the possi
b ility of latent infection of tubers which appeared healthy
35UNIVfcKMnQ Qt NAIKUBi UBRXRY
externally. Attempts were made to isolate P. solanacearum from
100 externally symptomless tubers obtained from infested experi
mental plots at Kamae. Sections of potato tuber tissue were
placed in s te r ile water contained in small screw-capped bottles.
These were stood on the bench for 15-30 min and the resulting
suspensions were streaked on Kelman's TZC medium. The plateso
were incubated for 48 hr at 31 C. The resulting bacterial growth
was examined and the suspected colonies were identified using
identification methods described earlier. The number of tubers
from which P. solanacearum was isolated were recorded.
In another observation, 562 externally symptomless tubers
from Kamae experimental plots were stored in the laboratory at
room temperature (18-20°C) for 3 weeks. The tubers were then
examined for exudate from the "eyes". The number of tubers which
revealed exudation were recorded. One hundred of the tubers whichoremained healthy in external appearance were incubated at 30 C
in a moist desiccator according to the method o f Graham, sit a^ .,
(1979). The tubers were examined daily for bacterial ooze from
the "eyes" and the record taken.
Another 150 tubers were planted in plastic pots 16 cm
diameter f i l le d with sterilized s o il. The plants were kept in
the greenhouse and were observed daily for disease symptoms.
As soon as the symptoms appeared, plants were cut at ground
level and stem sections were checked for streaming of bacterial
ooze. Suspensions obtained in this way were streaked on Kelman'sv
TZC medium to verify the presence of P. solanacearum. The number
of the plants which wilted was recorded.
36
3:7 Development of a Serological Laboratory Test For
Detection of P. solanacearum in Potato Tubers of
Infected Plant .
p. solanacearum can be isolated, in the laboratory, from
diseased material by plate-streaking. The bacterial cultures
obtained are then identified by techniques for studying cultu
ra l, morphological and biochemical characteristics of the
bacterium. This takes a long time and, therefore, there exists
need for a quick laboratory test to identify P. solanacearum.
P. solanacear»m has been found to be a good immunogen
(Digat and Cambra, 1976; Harrison and Freeman, 19b0 and Horton
et a l . , 1966). These workers have shown that antiserum against
solanar.p.apnm can be prepared and used for agglutination
tests.
This experiment is an endevour to prepare antiserum which
could be used in the laboratory for quick identification of P.
solanacearum in potato tubers of infected plant.
3 :7 :1 Preparation of Antigens
Two types of methods were used for the preparation of
antigens. Heat treated antigen was prepared according to the
method of Harrison and Freeman, (I960). P. solanacearum was
grown on Kelman's TZC medium without tetrazolium salt for 46
hr at 31°C. The growth was washed o ff with normal saline, and
after centrifugation for 10 min, the sediments were resuspended

37
in fresh normal saline, boiled for 2 hr and adjusted to a6
density of approximately 4x10 organisms per ml. This was
achieved by adjusting the O.D. of the bacterial suspension to
0.5 and then diluting this to about a half the concentration.
Formalin (0.2$%) was added as a preservative and the suspensions owere stored at 4 C until required.
Sonicated antigen was prepared by washing the organisms
in physiological saline three times and then adjusting the 8density to 5*10 ce lls per ml. These were disintegrated with
sonifier at 9-10 amps for one minute. After adding formalin
(0.25$) as a preservative, the antigen was kept at 4°C until
required for rabbit in jection (Morton, et al_., 1966).
3:7:2 Preparation of Antisera
Two rabbits were used for each batch o f antigen. Before
inoculations, a sample of blood was taken from the marginal ear
vein of each rabbit for normal sera preparation which were pre
served with equal volumes of glycerol and then stored at 4°C
until required.
Heat treated antigen was injected into rabbits Nos.l and
2 according to the schedule o f Harrison and Freeman, (i960).
The antigens were injected via a marginal ear vein using a
syringe fitted with a 25 gauge needle as follows: 0.5 ml, 0.5
ml, 1 ml, 1 ml, 2 ml, 2 ml at 3 day intervals, 5 nil 8 days later
and a final in jection of 3 ml after a further 12 days. Seven
days after the last in jection each rabbit was bled completely
and the clotted blood was centrifuged at l+p00 revolutions per
38
minute (r.p .m .) to separate antisera. These were preservedowith equal volumes of glycerol and stored at 4 C.
To prepare the antisera using sonicated antigens, rabbits
Nos 3 and 4 were injected intravenously on 1st, 4th, 8th 12th
and 19th day with 1 ,2 ,3 ,4 , and $ ml of antigen respectively. The
animals were bled on the 29th day and the antisera were prepared
and preserved as indicated above. The antisera were labelled
numerically in respect to the No. of rabbit from which they were
prepared.
3:7:3 Determination of Antisera Titres
The agglutination tests were conducted to determine the
titres of antisera prepared. The tests were carried out in
Dreyer's tubes by mixing a dilution series of antiserum with a
suspension o f a 24 hr old culture of P. solanacearum. The
dilution series of antiserum were prepared as follow s:
Twelve Dreyer's tubes were arranged in a metal rack and
numbered 1 to 12. Physiological saline (0.5 ml) was added to
a ll tubes except tube No.l. Into tube 1 and 2, 0.5 ml of
antisera was added. The dilution of antiserum in tube 2 was,
therefore, after thorough mixing 0.5 ml was withdrawn from
the tube 2 into tube 3> making the dilution of antiserum in
tube 3 to be £. This was continued t i l l a dilution of 1/1024
was obtained in tube 11. From this tube, 0.5 ml was withdrawn
and discarded. Into tube 12, a control system, 0.5 ml of normal
serum was added and after thorough mixing 0.5 ml was withdrawn
and discared. Into each tube, 0.5 ml of a 24 hr old culture of

39
P. sol&nacear urn suspended in physiological saline was added.
The dilutions, therefore, doubled. Thus, the dilution in tube
1 was i and that in tube 11 was 1/2048.
The contents were well shaken and then incubated over
night in a water-bath at 52°C. The highest dilution which
showed agglutination was recorded as the t itre o f the antiserum.
3:7:4 Tube Agglutination Tests
The objective o f this experiment was to test the speci
f ic ity and the laboratory use o f the antisera prepared above.
Five Dreyer's tubes, in each row, were arranged in 4
rows in a metal rack. Into each tube in the f i r s t row, 0.5 nil
of P. solanacearum suspended in physiological saline was added,
Also into each tube in the 2nd, 3rd and 4th rows, suspensions
of Corynebacterium michiganense, sap extracted from infected
potato tubers and sap extracted from healthy potato tubers were
added respectively.
The antisera prepared above were diluted in with
sterile physiological saline and then 0.5 ml o f antisera label
led 1 was added into a l l tubes, in the 1st column. Into the
2nd, 3rd and 4th columns, 0.5 nil o f antisera labelled 2,3 and
4 were added into each tube respectively. Into a l l tubes in
the 5th column 0.5 ml o f control normal serum was added. The
contents were well mixed, incubated overnight at 52°C in a
water-bath and then results o f agglutinations were recorded.

uc
3:7:5 S l id e A g g lu t in a t io n T e s t s
The o b j e c t i v e o f th e s e t e s t s was t o f in d ou t w hether
P. a o la n a cea ru m in i n f e c t e d p o t a t o t u b e r s c o u ld be d e t e c t e d by
th e a n t is e r a p re p a re d a b o v e .
A clean grease-free microscope slide was divided into
two sections with a grease pencil. Diseased potato tubers were
cut transversely and then squeezed to extract tuber sap which
was removed by use of a sterile wire-loop and placed on the two
sections of the slide. A drop of antiserum labelled No 1 was
added on to the sap on one portion of the slide while a drop o f
normal serum was added to the sap in the second portion of the
slide to serve as a negative control. The contents were thorou
ghly mixed and let to stand at room temperature for 2-5 minutes
and then the observations recorded. The procedure was repeated
for antisera labelled Nos. 2,3 and 4.
Tuber sap e x t r a c t e d fro m h e a lth y t u b e r s was a l s o t e s t e d
in t h e same way and r e s u l t s r e c o r d e d . T h is s e r v e d a s n e g a t iv e
c o n t r o l s .
The sp ecific ity of the antisera Nos. 1 ,2 ,3 and A were
tested using suspensions of P. solanacearum and Corynebacterium
sp. The former bacterium served as a positive control while
the latter served as a negative control.
To d e te rm in e th e h ig h e s t - d i lu t i o n o f t h e b a c te r iu m w h ich
c o u ld g iv e o b s e r v a b le a g g l u t in a t io n r e a c t i o n , a 24 hr c u l t u r e o f
P. so la n a ce a ru m was washed w ith p h y s i o l o g i c a l s a l i n e th e n p la c e d
u
in a screw-capped bottle. After shaking for 2-3 min, the
bacterial concentration in the suspension was adjusted too
10 cell/m l. ThiB was seria lly diluted and agglutination
tests performed on each dilution using a l l antisera. The
results gave the highest dilution of the bacterium which could
give observable agglutination reactions.

4. R E S U L T S
L:1 Survey Results
During the short-rainy and long-rainy seasons of 1980/81,
a tota l of 138 farms were visited in Central, Eastern and
Rift Valley Provinces and examined for the presence of bacterial
wilt of potatoes. Among these, 29 farms were found infested with
P. solanacearum. This accounted for 21% of the tota l number of
the farms visited . By grouping the farms into different altitude
zones (Table 2 ), i t was found that high percentages of the in fes
ted farms lay between 1520 m and 2120 m above the sea level. The
incidences of the disease decreased considerably at an altitude
of 2120 m and above. The survey also indicated infection in the
following potato cultivars: Roslin Eburu (B53)> Kenya.Akiba,
Anett, Kerr's Pink, Roslin Tana, Roslin Gucha, Feldesiolin and
Desiree.
Tne mean annual temperatures in Kenya are closely related
to ground elevation. For any given loca lity the mean annual air
temperature (T) can be calculated with reasonable precision from
the formula:
T - 30.2 - 6.5 x E (°C)
Where E is the elevation above mean sea level in
thousands of metres (Anonymous, 1970). When this formula was
applied, it was possible to present the data in Table 2 in
relation to temperature (Table 3). Results of th is calculation
indicated that areas with mean annual air temperature between
42

o o16.4 C ana 20.3 C had high percentage o f farms infested. The
percentage o f infested farms outside these temperatures declined.
Table 2: Incidence of bacterial wilt of potatoes in relation
to altitude in Kenya
Altitude zone in metres
No. o fplotsexamined
% of infested plots
Total area examined in Hectares
% acreage in category*
0 1
severit;
2
Above2580 37 8.1 61.8 99.1 0.9 0
2420-2580 25 4.0 34.7 98.0 2.0 0
2270-2420 14 7.1 13.6 94.9 5.1 0
2120-2270 20 25.0 14.6 70.5 28.8 0.7
1970-2120 . 9 33.3 4.9 67.4 22.4 10.2
1820-1970 12 58.3 5.9 28.5 23.7 47.8
1670-1820 7 42.9 0.7 57.1 14.3 28.6
1520-1670 6 O • o 1.8 66.6 16.7 16.7
Below •
1520 8 37.5 1.9 73.7 26.3 0
■“■Severity Category:
0 represents no plant wilting
1 " 1-5% plants wilting
2 M >5% plants wilting

u
Table 3: Incidence o f bacterial wilt o f potatoes in re la tion
to temperature in Kenya.
Temperature range in
0C
No. o fplotsexamined
% o finfestedplots
Total area examined in Hectares
% acreage in severity category*
0 1 2
Below 13*4 37 8.1 61.8 99.1 0.9 0
13.4 - 14.5 25 4.0 34.7 98.0 2.0 0
14.5 - 15.5 14 7.1 13.6 94.9 5.1 0
15.5 - 16.4 20 25.0 14.6 70.5 28.8 0.7
16.4 - 17.4 9 33.3 4.9 67.4 22.4 10.2
17•4 “ 18 * 4 12 58.3 5.9 -128,5 23.7 47.8
18.4 - 19.4 7 42.9 0.7 57.1 14.3 28.6
19.4 - 20.3 6 50.0 1.8 66.6 16.7 16.7
Above 20.3 8 37.5 1.9 73.7 26.3 0
♦Severity Category:
0 represents no plants wilting
1 ■2
1-5$ plants wilting
> 5$ plants wilting

45
4:1:1 Field symptoms of the disease
Symptoms on potatoes above ground level
In some plants, the whole h i l l was affected while in
others one or two stems were involved. Foliage of affected
plants had drooped and wilted without much change in colour.
The laminae were rolled upwards and inwards from the margins.
Some leaves, especially the lower ones showed slight yellowing.
Plants which were not severely infected had one or two wilted
leaves. These were plants in which in fection had just started.
The stems of badly infected plants had shrivelled. When
such stems were sectioned transversely, a brown discolouration of
the vapcular ring was observed. The stems of recently attacked
plants were s t i l l standing upright and cross-sections did not
reveal any discolouration of the vascular ring.
Symptoms of the disease on under ground parts o f potatoes
Some o f the potato tubers from diseased plants had no
visib le external symptoms of the disease. At the "eyes" or
stolon end of the tubers there was a sticky exudate which mixed
with the s o il and adhered to the surface of the tubers. When
the tubers were cut into halves, brown discolouration of the
vascular bundles was revealed in some tubers. On applying slight
pressure on the cut tubers, greyish-white bacterial slime oozed
out of the vascular rings. In some cases putty-like bacterial
mass came out of vascular rings on application of slight pres
sure to the cut tubers.

46
Symptoms of the disease on tomatoes and egg-plants
The infected tomato plants wilted suddenly. Distinct
epinasty of the petioles prior to wilting were apparent i f the
onset of the disease was slow. Adventitious roots developed on
the stems. Wilting symptoms appeared rapidly on egg-plants.
Symptoms on the foliage were similar to those produced by scor
ching due to high temperatures.
From the samples which were collected during the survey,
33 isolates o f P. solanacearum were obtained most of which were
isolated from potatoes. The 34th isolate was a standard culture
obtained from C.M.I. (Table 1 ). Isolate No.9 was obtained from
egg-plants which were grown in Nairobi at about 176C m above sea
level while iso la te No.14 was obtained from tomatoes which were
grown in Yatta Scheme at an elevation of approximately 1000 m
above sea level.
4:2 Identification of Pseuaomonas solanacearum
4:2:1 Isolation and Storage
In some cases pure cultures were obtained with the fir s t
plate-streaking and there was no need of sub-cultures. Charac
te r is t ic colonies of P. solanacearum appeared after 48 hr incu- obation at 31 C on Kelman's TZC agar plates. Pure cultures which
were stored in small screw-capped bottles containing sterile
water at room temperature (18 - 20°C), remained viable and
virulent up to six months.

47
4:2:2 Cultural characteristics
The morphology o f 48 hr cultures of a l l isolates (Table
1) incubated at 31°C on Kelman's TZC agar were observed and
described (Table 4). The colonies were sligh tly raised, slimy
and appeared creamy-white with pink-orange centres. They were
irregular in shape, and 2-5 mm in diameter. However, there
were also smaller and larger colonies than the ones described
above. The colonies were flu id a l in their consistency. The
bacterium was s tr ic tly aerobic, non-fluorescing and non-
fastidious. Thus, it could grow on synthetic medium containing
glucose and an inorganic nitrogen source such as ammonium chlo
ride. The c e lls were gram-negative, non-sporulating, straight
rods with rounded ends and 1.2 - 1.7 x 0.5 - O.byum in size.
4:2:3 Biochemical characteristics
The pathogen oxidized the following carbohydrates:
glucose, sucrose, maltose, lactose and ce llob iose . Sorbitol,
du lcito l and mannitol were not oxidized. The latter are alco
hols. Nitrate was reduced to n itr ite but den itrification did
not occur. The bacterium was catalase and oxidase positive,
argenine dihydrolase negative and did not produce hydrogen
sulphide or hydrolyse starch (Table 5).
A c c o r d in g t o B e r g e y 's M anual o f D e te r m in a t iv e B a c t e r i o -
l o g y p 9 7 4) t h e path ogen was c l a s s i f i e d and p la c e d in th e
gen u s Pseudom onas so la n acearu m E.F. S m ith .

us
Table 4: Colony Characteristics o f Pseudomonas solanacearum
on Kelman's TZC medium a fte r 48 hours incubation
at 31°C
Isolate Colony shape Colony Colour Consiste- Formazannumber size ncy formation
mm
irregu lar, smooth slime 2 - 5 Creamy Fluidal Pink fo r
deposition , entire edges, white ma zan depo
raised smaller colonies s it at the
were somewhat round centre
irregu lar, smooth 2 - 4 creamy Fluidal Pink
slime deposition, white intense
entire edges, raised deposi
tion
• toward
centre
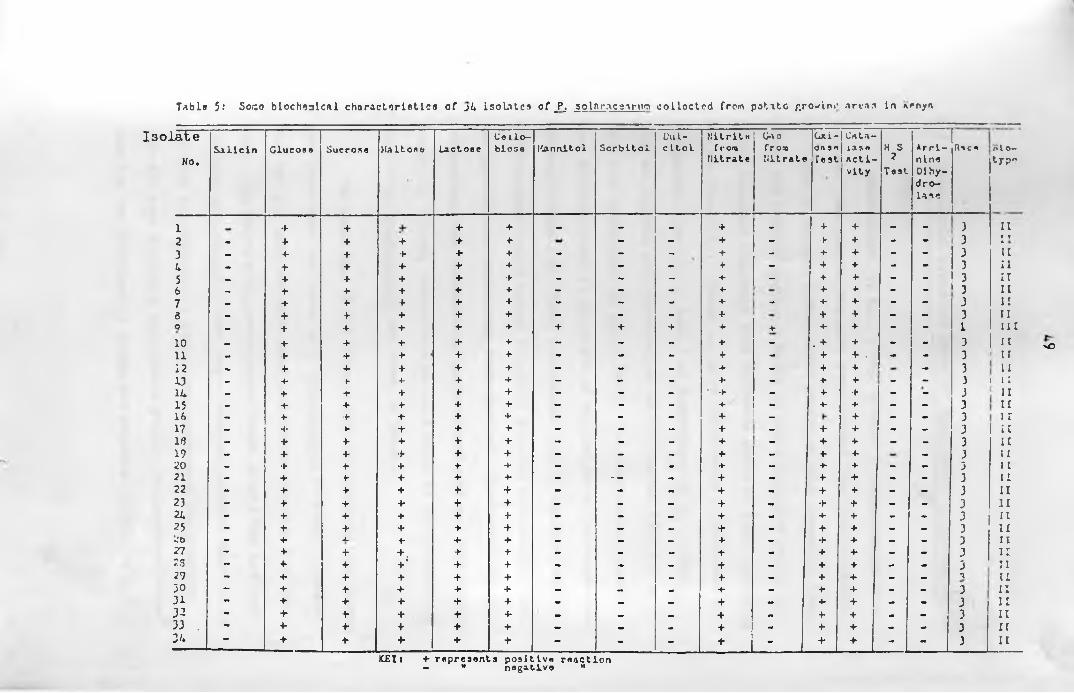
Table 5: So.to b lochoalcal chnractorintlca o f jU i solates o f _P_. solnrac aarum c o l l o c t c d from potato f.rOwinr .areas in arnyn
I s o l a t e
No.S ilicin Glucose Sucrose Maltose Lactose
Cello- biosa liannitol Sorbitol
L'u l- c l to l
Nitritefrom
Nitrate
GaofromNitrate
Gxi- oasn Te at
| C/ila-| USBi a ctivity
H S 2
Test.
Arri- nine Di hydrolase
Rscs
1_____
nl o— t y p *
1 + 4- 4* 4- mm - - 4 • 4 4 - - 3 112 — 4 4- 4- 4- 4- - - 4 - 4 4 - - 3 J f
3 — 4 4- 4- 4- 4- - - - 4 - 4 4 - - 3 IIu _ 4 4- 4- 4- 4- - - - 4 - 4 4 - - 3 115 _ 4 4 4- 4- 4- - - - 4 - 4 4 - - 3 IT6 _ 4 4- 4- 4- 4- - - - 4 4 4 - - 3 II7 — 4 4- 4- 4- 4- - - - + - 4 4 - - 3 1!3 — 4 4- 4- 4- 4- - - - 4 4 4 - - 3 II0 - 4 4- 4- 4- 4- 4 4 4 4 4 4 4 - - 1 III10 V* 4 4- 4- 4- + - - - 4 - . 4 4 - - 3 Jt11 - 4 4- 4* 4- 4- - - - 4 - 4 4 . - - 3 u12 — 4- 4* 4- 4- 4 - - - 4 • 4 + - 3 ii13 _ 4- 4- 4- 4- 4- - - - 4 - 4 4 - - 3 i 111U - 4- 4* 4- 4- 4* - - - 4 - 4 4 - - 3 1115 - 4- 4- 4- 4- 4* - - - 4 - 4 -4- - - 3 n16 - 4- 4- 4- 4- 4- - - - 4 - 4 - - 3 ir17 - 4- 4 4- 4- 4- - - - 4 - 4 4 - - 3 i i13 - 4- 4- 4- 4- 4- - - - 4 - 4 4 - - 3 ii19 - 4- 4- 4 4 4- - - - 4 - 4 4 - 3 u20 - 4 4 4 4 4* - - - 4 - 4 4 - - 3 1121 - 4- 4- 4- 4- 4- - - - - 4 - 4 4 - - 3 ii22 - 4- 4- 4- 4- 4- - - - 4 - 4 4 • - 3 n23 - 4- 4- 4- 4- 4- - - - 4 - 4 4 - - 3 n21 - 4- 4- 4- 4- 4- - - - 4 - 4 4 - - 3 i i25 - 4- 4- 4- 4* 4- - - - 4 - 4 4 - - 3 u2o - 4- 4. 4* 4- 4- - - — 4 - 4 4 - - 3 ii27 - 4- 4- 4-, 4- 4 - - - 4 - 4 4 - - 3 ir23 - 4- 4- 4-’ 4- 4 - - - 4 - 4 4 - - 3 ii29 - 4- 4- 4- 4- 4 - - - 4 - 4 4 - - a I u30 - 4- 4- 4- 4- 4 - — _ 4 - 4 4 - - 3 i i31 - 4- 4- 4- 4 4 - — • 4 • 4 4 - - 3 i i32 - 4- 4- 4- 4- + — mm • 4 _ 4 4 • - 3 ii33 . - 4- 4- 4- 4- 4 - — . 4 - 4 4 - - 3 ir2U — 4- 4- 4* 4 4 - - - 4 - 4 4 - - 3 ii
ICE 1 1 4 represents positive reaction- " negative "
nO

50
4:3 Biochemical types and Races o f Pseudomonas solanacearum
isolated
Buddenhagen, et a l . . (1962) grouped _P. solanacearum into
3 races. The species has also been divided into four biochemi
cal types by Hayward (1964) based mainly on acid formation from
sugars and den itrification . Based on these characteristics, 33
of the isolates collected from different parts o f Kenya including
the one from C.M.I. (Table 1 ), gave characteristic reactions o f
biochemical type I I , or race 3 o f Buddenhagen et a l . , (1962).
Only one isolate was characterized as biochemical type III or
race 1 of Buddenhagen a l . . (1962). The biochemical types
were differentiated on the basis of u tilization o f carbohydrates
and den itrification . Thus, biochemical type II oxidized a l l
carbohydrates tested except D ulcitol, Mannitol and Sorbitol and
the type did not produce gas from nitrates. Biochemical type I II
oxidized a ll the carbohydrates and produced some gas from nitrate
(Table $). Colony characteristics as a means o f d ifferentiating
races o f P. solanacearum are shown in Table 4.
The reactions of the tobacco leaf in filtra tion test showed
that there were two races of P. solanacearum in Kenya. Isolate
No.9 was the only one which gave a different reaction from the
rest. The reaction it gave appeared about 40 hr after the leaf
had been in filtra ted . There was a brownish necrotic reaction in
the area in filtrated . A yellow zone surrounded the brownish
necrotic area forming a halo (plate No.l). The reaction resem
bled the one described by Lozano and Sequeira, (1970) for P.

51
/
test control
Plate Is The reaction o f Nicotiana tabacum cv. White
burley 40 hr after being in filtrated with
a suspension of Pseudomonas solanacearum
biochemical type III

52
TEST CONTROL
Plate 2: The reaction of Nicotiana tabacum cv White
bur ley 48 hr after being in filtrated with
a suspension of Pseudomonas solanacearum
type II

53
solanacearum biochemical type III or race 1. The other
isolates showed yellowish discolouration of the in filtrated
areas, 48 hr after in filtra tion of the leaves. The size and
colour of the lesion did not increase or change after 96 hr
(Plate No.2 ). These reactions resembled those described by
Lozano and Sequeira, (1970) for P. solanacearum biochemical
type II or race 3 of Buddenhagen et a l . , (1962). The inocula
ted leaves of control plants remained symptomless until the
experiment was discontinued 2 weeks after in filtra tion .
4:4 Pathogenicity of Pseudomonas solanacearum
on Potatoes and Egg-plant
All isolates except isola te No.9 (Table l ) caused wilt
symptoms on potato plants 9-H days after inoculation and the
bacterium was recovered from the infected plants. P. solana
cearum was not re-isolated from potato plants inoculated with
isolate No.9 (biochemical type III race 1).
There were no bacterial w ilt symptoms in the following
cultivars of potatoes which were inoculated with the culture
of isolate No.9: Kerr's Pink, Anett, Rosiin Eburu (B53)>
Kenya Baraka, Desiree, Feldeslolin, Rosiin Tana and Rosiin
Gucha.
All the isolates (Table 1) including iso la te No.9 were
pathogenic to egg-plant. Such plants wilted 5-12 days after
inoculation and the bacterium was re-isoiated from them
(Plate No.3 ).

54
Plate 3: Egg-plants showing wilting symptoms after
inoculation with Pseudomonas solanacearum
biochemical type II and III.

55
4:5 Temperature
4:5:1 Influence of Temperature on in vitro Growth of Pseudomonas
solanacearum
The minimum temperature for growth of P. solanacearumo
biochemical type II was found to be 13 C. Growth was not oobtained at 12 C. It was also found that the maximum tempera-
o oture for growth was 35 C and no growth was obtained at 37 C
(Table 6). The optimum temperature for biochemical type II was
found to be 31°C, while that of biochemical type III was 30°C
(Tables 6 and 7 ).
The region of increased multiplication rate as shown by
the relationship of doubling time and temperature (Table 6) o owas between 25 C and 31 C. This region also represented the
temperatures at which generation time was lowest. This pattern
of the influence of temperature on biochemical type II was simi
lar to that o f biochemical type III (Table 7 ). Figure 1 is a
plot o f growth/temperature relationship of both P. solanacearum
biochemical type II and III .
4:5 :2 Influence of Temperature on in vivo Growth of Pseudomonas
solanacearum
April/May and June/July 1981 periods were cooler than
November/December 1980 and February/March 1981 periods (Table 8).
The average number of days taken before disease symptoms appeared
in inoculated plants increased as the bacterial concentration in

56
solanacearum biochemical type II race 3 on
Xelman's TZC medium
T a b le 6 : The e f f e c t o f t e m p e ra tu re on grow th o f Pseudom onas
Temperarute
°c
Number o f .c e l ls / colony after
48 hours
Generation Time in hours
Number of doublings after
48 hours
12 No growth - -
13 6 17.9 2.7
15 39 9.0 5.3
17 316 5.8 8.3
19 3,300 4.1 11.7
21 65,500 3.0 16.0
23 228,200 2.7 17.8
25 3 , 651,400 2.2 21.8
27 7 , 826,900 2.1 22.9
30 308,353,000 1.7 28.2
31 21, 151, 100,000 1.4 34.3
35 228,200 2.7 17.8
37 No growth — —
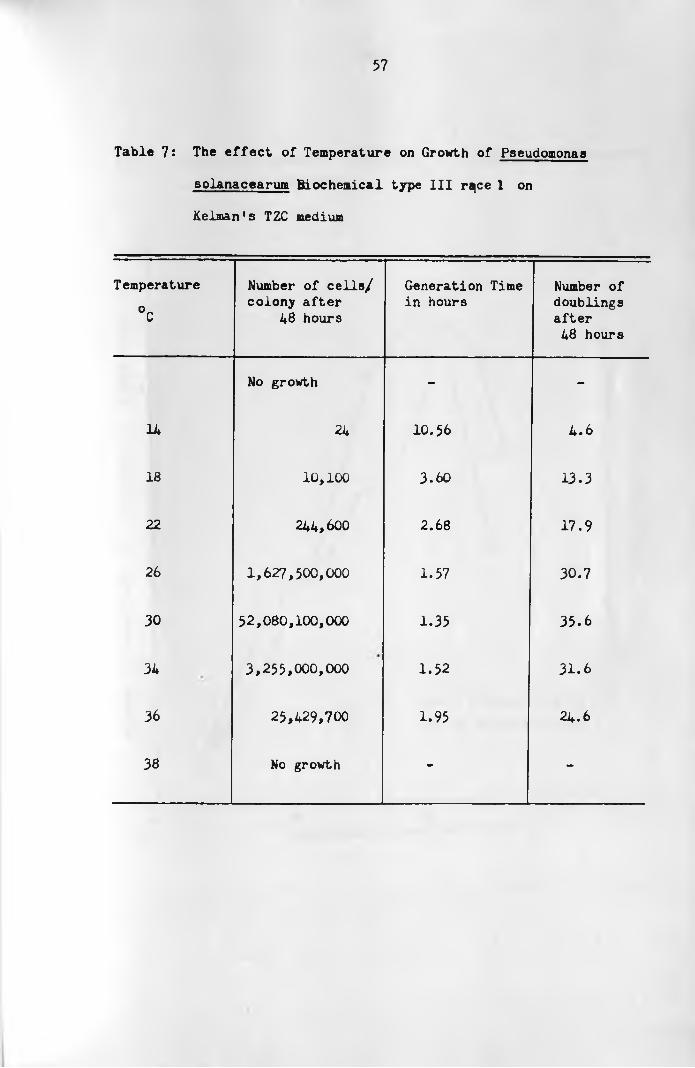
57
solanacearum Biochemical type III rqce 1 on
Kelman's TZC medium
Table 7: The effect of Temperature on Growth of Pseudomonas
Temperature
°c
Number of c e l ls / colony after
48 hours
Generation Time in hours
Number of doublings after
48 hours
No growth - -
14 24 10.56 4*6
18 10,100 3.60 13.3
22 244,600 2.68 17.9
26 1 , 627, 500,000 1.57 30.7
30 52, 080, 100,000 1.35 35.6
34 3 , 255, 000,000 1.52 31.6
36 25,429,700 1.95 24.6
38 No growth - -

NU
MB
ER
O
F
DO
UB
LIN
GS
IK
&
& H
OU
RS
O
F IN
CU
BA
TIO
N
58
Fig. I*.
L 0
30 -
20 -
10 -
0 *- 10
Grov;th Temperature Relationship of Psaudorr.oncs solariQcenrum
on Kelmans Medium.
_ i______________________________ i----------------------------------------------L— ? -20 30 l o
I NCUBAT I ON T E M P E R A T U R E IN *C
k

59
the inocula used decreased (Table 9). The average number of
days taken before disease symptoms appeared on plants for each
concentration was higher during the cooler seasons than during
the warmer seasons (Table 9). Determination o f seasonal LD^
were as follows:
November/December (1980) . . . . , ........104 - 105 cells/m l
February/March (1981) .......
April/Hay (1981) ........____ 105 - 106 cells/m l
June/July (1981) ................ 106 - 107 cells/m l
These results indicate that the LD q shifted gradually
from low bacterial concentrations during the warm seasons to
high bacterial concentrations during the cool seasons (Fig.2).
It is important to note that the plants inoculated with P.
solanacearum biochemical type III did not develop wilt symptoms.
When re-isola tion of the pathogen from these plants was attempted,
no P. solanacearum was recovered.
In a growth chamber, where temperatures were controlled
throughout the growing period, the wilt symptoms did not appear
at a l l in inoculated plants kept at 14°C. At 24°C the inoculated
plants took an average of 8.9 days before wilt symptoms appeared.
At 30°C the average number of days the inoculated plants took to
show wilt symptoms was higher than that at 24°C. This means thatothe inoculated plants took long to wilt at 30 C, very short time
to wilt at 24°C while the ones placed at 14°C never wilted
(Table 10). F ig .3 indicates that the optimum temperature for
wilt development was around 24° C.

6 0
Table 8: The mean s o i l temperature in the greenhouse at 15cm deep at
various times o f the day during experimental seasons.
SEASONS
9 AM
T
12 M
I M E
3 PM 8 PM 3 AM
AVERAGE
Nov./Dec. 1980 17.5 2 3.6 23.4 18.8 16.5 20.0
Feb./Mar. 1981 18.4 24.9 23.9 19.3 16.9 20.7
Apr./Hay 1981 16.8 20.1 21.4 18.7 16.6 18.7
June/July 1981 14 .2 18.1 19.9 18.1 14.4 16.9
oKey: Temperature recorded in C.

6 1
Table 9: The average number o f days taken for plants inoculated with
d iffe ren t concentration o f Pseudomonas solanaceanim bio
chemical type II to wilt during d ifferent experimental
seasons.
BACTERIAL CONCENTRATIONS (TREATMENTS)
AVERAGE NO. OF DAYS BEFORE DISEASE SYMPTOMS APPEARED
N0V/DEC.198O FEB/MAR 1981 APR/MAY1981
' JUNE/JULY 1981
(Original Suspension)
No. o f ce lls /m l = 10^ 14.4 14.6 11.0 14.6
108 16.4 15.2 16.2 15.2
107 15.5 17.0 15.2 18.6
!0 6 19.8 19.0 17.8 18.4
105 21.0 25.0 2 3 .0 14.0
1 0 K 22.3 18.0 2 4 .0 > 30
310 > 3 0 > 3 0 > 3 0 >30
0 (con trols ) > 3 o >3o > 3 o > 30
Keyi > represents more than

AV
ER
AG
E
NU
MB
ER
O
F D
AY
S
TO
WIL
TIN
G
l
Fig 2
30 -
20 -
310
DETERMINATION OF LD 50 OF Pseudomonos solonocearum IN GLASS HOUSE
DONE DURING THE FOUR SEASONS OF THE YEAR.
INOCULATION EXPERIMENT
LOG 10
K E Y
A 5 6
C O N C E N T R A T I O N OF V I A B L E C E L L S
8 9
O'N)

63
Table 10: Influence of temperature on development of
bacteria l wilt in potatoes inoculated with
Pseudomonas solanacearum
Temperature in Average number o f days beforeoC symptoms appeared
14 > 3 o
18 14.9
20 13.3
24 8.9
28 9.0
30 10.7
33 1 2 .1

DAY
S TO
W
ILTI
NG
Fig. 3- Effect of Temperature on the Mean Days to Wilting of Potato Plants Inoculated with p. aolanace&rum at Various Temperotures.

65
4 :5 :3 Influence of Temperature on Pse^donjypas solanacearum
Populations in rhizosphere
After inoculation of potted plants placed at a given tempe
rature i t was found that densities of the pathogen, generally
increased, reached a peak in 14 days and then declined gradually
(F ig.4 and appendix 3 ). High population densities were obtainedoin soils kept at 24 C. There was l i t t le change in the populations
of the pathogen at 14°C while at 33°C there was a sharp decline
(Fig. 4 ).
The populations of saprophytes were found to be generally
stable although there were slight declines in the lAth days. In
some cases it was quite d if f ic u lt to make counts because some
saprophytes could over-grow and mask the growth of P. solanacearum
as well as other saprophytes. Such plates were discarded and no
counts were made on them.
4:6 Altitude
4:6:1 Influence of Altitude on Development o f wilt symptoms
During the fir s t season 83$ of plants inoculated at N.A.L.
were infected and showed wilting symptoms while only 15$ showed
symptoms at the Kamae s ite . In the second season 91.9$ plants
were infected at N.A.L. and 26.4$ showed wilting symptoms at
Kamae (Table l l ) . This indicated that the percentage of infec
tion was higher in low' altitudes than at high altitudes. The
difference of percentage infection in the two seasons could be
attributed to differences in rain fall and temperatures during

MEA
N
PO
PU
LATI
ON
D
ENSI
TY
PER
GR
AM
OF
DRY
SOIL
Fig. 4 ; Populolion Density Trends of Pseudomonos solanoceorum offer Inoculations of Various Temperatures.
o
107 14
NUMBER OF DAYS21
AFTER INOCULATIONS28

67
the two seasons. The ra in fa ll was higher during the second
season than during the fir s t season (Appendix 2 ) ,
Plants inoculated with P. solanacearum biochemical type III
(Plants in plot No.2) did not show wilting symptoms (Table 11).
4 :6 :2 Influence of Altitude on Infection of Potato Tubers
_P. solanacearum biochemical type II or race 3 was iso
lated from 3 tubers out o f 100 tubers tested. This indicated
that some tubers were infected but they did not show disease
symptoms.
Thirteen tubers were observed oozing from the "eyes"
during the 4 weeks incubation at 30°C in moist dessicator.
Twenty-four others had been discarded because o f extensive tuber
breakdown caused by micro-organisms other than P. solanacearum.
The remaining 63 tubers were cut transversely and 7 of the cut
tubers revealed partial discolouration of vascular rings. They
oozed when they were squeezed.' It was observed that four o f the
seven tubers had sprouted and were capable of giving rise to new
plants.
A tota l o f 114 tubers out of the 150 which were planted,
germinated. Seventeen of the plants which grew up, developed
wilt symptoms. This number formed 14.9$ of the tubers which
germinated. The results o f these investigations indicated that
some plants and tubers which did not show wilt symptoms in it ia lly
had latent in fection .

Table 11: In fection percentage o f potato by Pseudomonas solnnacearum at Kamae and National
A gricu ltural Laboratories during experimental seasons
PLOT NO. 1 PLOT NO. 2 PLOT NO. 3
SEASON SITS No. o fplant s inoculated
No. o fplantsw ilted
%in fe ct io n No o f
plants inoculated
No. o f plants •wilted
%In fection
No. o fplantsinoculated
No. o fplantsw ilted
%In fe c t ic
1stSeason
N.A.L* ICO 83 83 98 0 0 ICO 0 0
2ndSeason 99 91 91.9 96 0 0 100 0 0
1stSeason
KAMAE 92 14 15.2 83 0 0 86 0 0
2ndSeason
87 23 26. U 89 0 0 91 0 0
Plot 1 x Plants in th is plot were inoculated with biochem ical type II
Piet 2 : Plants in th is p lo t were inoculated with biochem ical typo I I I
Plot 3 £ Plants in this plot were inoculated with sterile distilledwater to serve as controls.

69
4 :7 Serology
4 :7 :1 Antisera Titres
The antisera titres were determined by tube agglutination
method and are shown in Table 12. Rabbits No.l and 2 produced
antisera with 1/1024 and 1/512 t it r e s respectively. Rabbits
No.3 and 4 both produced antisera with 1/128 t it r e .
4:7 :2 Use And S p ecific ity of The Antisera
The results of tube agglutination tests are shown in
Table 13. No antisera gave serological reaction to Corynebac-
terium michiganense and the sap extracted from healthy potato
tubers. These two were included in the agglutination tests to
serve as negative controls. Bacterial suspension of P. solana—
cearum and sap extracted from infected potato tubers gave
homologous serological reactions against a l l the antisera. The
normal serum gave no reaction. The same pattern of results was
obtained when slid e agglutination tests were used (Table 13).
The highest bacterial dilution to give observable
agglutination reaction was 10 cells/m l (Table 14).

70
Table 12: Titres of antisera produced in rabbits in jected with Pseudomonas solanacearum biotype II
Antiserum Number Antiserum titre
1 1/1024
2 1/512
3 1/128
4 1/128
Table 13:
Reaction of Agglutination tests for Corynebacterium mlchiganense and Pseudomonas solanacearum biotype II against P. solanacearum biotype II antisera
Bacterial cultures and sap Antisera number Normalextracts from potato tubers serum
1 2 3 4
Corynebacterium michiganense - - - - -
Pseudomonas solanacearum + + + -
biotype II
Sap extracted from infected + + + + -potato tubers
Sap extracted from healthy potato tubers
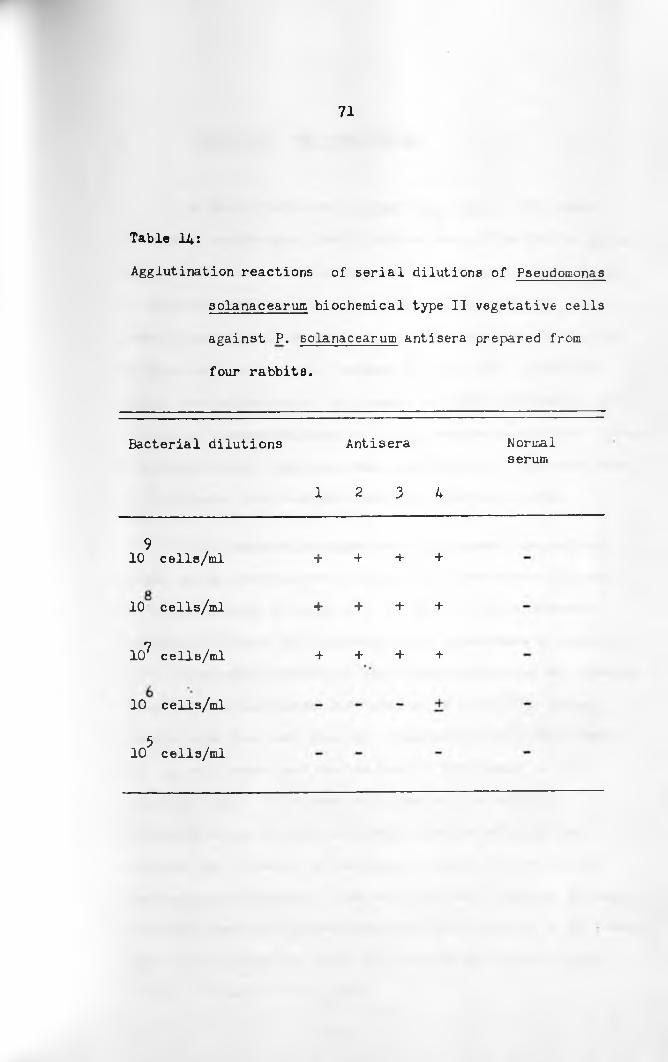
7 1
Table 14:
Agglutination reactions of se r ia l dilutions o f Pseudomonas
solanacearum biochemical type II vegetative ce lls
against P. solanacearum antisera prepared from
four rabbits.
Bacterial d ilutions
910 ce lle /m l
10 ce lls /m l
10 ce lls /m l
10 ce lls /m l
510 ce lls /m l
Antisera
1 2 3 4
+ -I- + +
+ + + +
+ + + +
Normalserum

5. DISCUSSION AND CONCLUSIONS
In Kenya, potatoes (Solanum tuberosum L), are grown
throughout a wide agroclimatic belt extending from 1200 m up to
2800 m above sea leve l (Harris, 1975)* Results o f the survey
on bacterial w ilt, carried out during 1980/81, covering the
potato growing zone, showed that at elevations below 1520 m the
disease was less serious. Between 1520 and 2270 m above sea
le v e l, the incidences of the disease were very high while above
2270 m the disease decreased with the increase in altitude. Above
2580 m the disease occurence was rare (Table 2). The same trend
of the disease occurence was observed by Harris in 1976.
When temperature ranges were substituted for altitude
zones, i t was observed that bacterial wilt was severe in areas
with temperatures of about 18°C (Table 3 ). The incidence of
occurence'bf^bacterial w ilt decreased with decrease in tempera
ture. Remarkable decrease in the disease incidences was observed
in areas with mean annual air temperature of 15-5°C. These
temperatures have been found to be limiting in w ilt development.o
The optimum temperature for the disease development is 21 C
(Harris, 1976). The disease distribution, therefore, is
obviously not as a result of direct effect of altitude but
re flects the influence o f correlated climatic factors such as
temperature and ra in fa ll. The reason why wilt declines in lower
altitudes where e d il temperatures are high, however, is not known
but i t is possible that other factors such as reduced ra in fa ll
become limiting (Harris, 1976).

73
Based on the survey results and earlier investigations
by other workers such as Harris, it could be suggested that
potato seed tubers should be produced in areas which have mean
annual s o il temperatures of 15°C and below. At this temperature,
w ilt does not develop and, therefore, there are high chances of
producing clean seed in order to eliminate dissemination of the
disease pathogen. Areas with an altitude of 2270 m and above
meet the requirements. There are many areas in potato growing
areas in Kenya which can be used for seed production. The fo l lo
wing areas are suitable: Kibirichia in Meru D istrict, most of
Nyandarua D istrict and Molo area in R ift Valley Province.
The wilt disease symptoms in the field were found to be
satisfactory in the identification o f the diseased potato plants.
Plants at various stages of disease development were observed.
Most of the affected plants retained the green colour after wil
t in g . Most of the farmers could recognize the diseased plants in
the fie ld and a good number of them knew the consequences of the
disease. Such farmers knew the steps to take to control i t .
The isolates collected during the surveys showed the same
characteristics as those described by Kelman (1954)» for
Pseudomonas solanacearum on Kelman's TZC agar (Table 4 ). The
clear cut correlation between the characteristic colony morpho
logy on Kelman's TZC agar and pathogenicity, made i t possible
to identify the bacterium on colony morphology alone. Following
the classification according to the Bergey's Manual of Determina
tiv e Bacteriology, the bacterium was placed in the nomenspecies

74
Pseudomonas solanacearum E.F. Smith.
Buddenhagen, et a l.., (1962) grouped P. solanacearum into
three races. The species has also been divided into four bio
chemical types by Hayward (1964) on the basis of acid formation
during the oxidation o f some carbohydrates and d en itrifica tion .
Based on these c r ite r ia , reactions o f tobacco leaf in filtra tion
tests and the d ifferentiation of races and strains o f P. solana
cearum on Kelman's TZC medium by the method o f French et a l . .
(1970), it was found that 33 of the isolates shown in Table 1
were P. solanacearum biochemical type II or race 3 o f Buddenhagen
et a l . , (1962), and only one isolate was biochemical type III or
race 1. Biochemical type II isolates were isolated from potato
(S. tuberosum) and tomato (Lycopersicon esculentum M ill), and
the biochemical type III was isolated from egg-plant (S. melongena)
Previous work in Kenya on P. solanacearum by Nattrass
(1945 and 1946), Robinson and Ramos (1964) and Harris (1976) showed
that there were only two races of the pathogen present in the coun
try . These workers reported the presence o f race 1 and race 3»
They found race 3 in high altitude areas and it attacked potatoes,
tomatoes and egg-plants. This race has also been found in the
Coast Province at Taita-Taveta h il ls . Although Taita h ills are
in the Coast Province, the area is 1000 - 1500 m above sea level
and potatoes and other solanaceous plants are cultivated. Some
infected potato tubers might have been taken there and that might
be the reason why biochemical type II of the pathogen is found at
the coast. For the same reason the pathogen is found in Yatta
Scheme in Eastern Province which is at about 1000 m above sea

75
le v e l . Race 1 is mainly found in low altitudes and it attacks
egg~plants, bringals, pepper and other solanaceous species. At
high altitudes this race is rare or absent.
In this work, only these two races were found present in
the country. This confirmed the previous findings. It was also
found that potatoes were attacked by race 3 only. This specifi
c ity was verified by the fact that the isolates collected from
the f ie ld during the survey (Table 1) were from different potato
cu ltivars grown in Kenya and a ll o f them were infected with
P. solanacearum biochemical type II or race 3 of Buddenhagen
et (1962) (Table 5)* The cultivars from which the pathogen
was isolated are Roslin Eburu (B 53), Roslin Tana, ^oslin Gucha,
Kenya Akiba, Anett, Kerr's Pink, Desiree, Kenya Baraka and
Feldeslolin.
Biochemical type III or race 1 was not isolated from
potatoes. When the nine potato cultivars above were inoculated
with the bacterium, they did not develop the disease symptoms
and the bacterium was not recovered from the plants in re-iso la
tion experiments. This indicated that the biochemical type III
strain found in Kenya does not attack potatoes.
The j j i v itro growth rate o f P. solanacearum was highest at
31 C and declined to zero at 12°C and 37 C (Table 6 and 7).
Fig. 1 shows the curves obtained from plots of number of doublings
in 18 hr incubation of P. solanacearum against incubation tempe
ratures. The number of doublings were highest at the incubation o otemperature of 31 C and lowest at 13 C. This corresponds to the

76
finding* of the growth rate shown here.
Temperature change frequently produces prompt, direct
and proportional alteration in the rate of b io log ica l processes
such as enzyme reactions, respiration and others. At temperatures
not far outside the normal range (e .g . 37°C for mammals), bio
lo g ica l processes are retarded or completely inhibited. This
phenomenon of the e ffe c t of temperature on b io log ica l processes
was clearly demonstrated by P. solanacearum on Kelman's TZC
medium. It i s , therefore, thought that such in v itro observa
tion s reveal the ro le o f temperature in the development of bac
t e r ia l wilt in nature. Thus, the growth rate of the bacteriumo ois retarded or completely inhibited at 12 C and 37 C and therefore,
disease does not develop, while at around the optimum temperatures
the growth rate is high and therefore, the bacterial populations
quickly reach the magnitude at which the disease development is
faster.oAt s o il temperatures o f around 14 C in vivo experiments,
w ilt did not develop while i t developed at the s o il temperatures oaround 24 C (Table 10 and Fig.3) and it declined at higher tempe
ratures. Harris (1976) indicated that the ceiling for wiltocorresponded with temperatures around 15 C and the optimum of
about 21°C. The results of this work indicated that the bacterial
growth rate was inhibited at 14-15°C and it was highest at 21-24°C.
It was found that the concentration of the viable ce lls
needed for wilt development depended on temperature. Results in
Tables 8 and 9 and F ig.2 indicate that cool seasons such as A pril/
May and June/July require high concentration of inoculum to cause

77
w ilt than warm seasons such as November/December and February/
March. These findings could be explained as being due to high
rate of growth of the pathogen at optimum temperatures and low
rates of growth at temperatures outside the optimum.
P. solanacearum survived best in s o il at 24°C followed by
20°C and 18°C. At these temperatures the population densities in
the rhlzosphere increased to a peak at the 14th day and then
declined s lig h tly . The concentration of bacteria remained con
stant for 28 days at 14°C s o il temperature. At 28,30 and 33 C the
concentration of bacteria declined (Fig. 4)« These results can
be explained as follow s: At the optimum temperatures (18-24 C)
the bacterial growth rate was high and the infected tubers as well
as roots produced bacterial ooze which nixed with the so il thus
increasing the population. At 14°C the bacterial growth was inhi
bited while at 28,30 and 33°C, the populations declined because the
bacterial death rate was higher than the growth rate. The results
show the same trend of P. solanacearum population density study
carried out by Ramos (1976). Ramos found that densities of both
biochemical types increased reaching a peak in 3-5 days, and then
sharply declining for biotype II and slowly for biotype III . The
differences in days at which the populations reached the peak in
the two experiments might have been due to the differences in the
experimental methods. Ramos carried out the bacterial population
studies on bare s o il columns and fie ld plots devoid of host covers
while in this work the studies were carried out using s o il on
which potato plants were growing. It can be concluded that popu
lation density and survival of P. solanacearum in so il are in flu e-

78
need by s o i l temperature and that the s o i l temperature in which P.
solanacearum survives best is from 18°C to 21 °C.. Under such con
d ition s w ilt development is expected to be most rapid.
At low temperatures potato plants may be latently infected
and therefore symptom expression fa i ls . This phenomenon occurred
at Kamae (Table 11). It means that the so il temperatures at Kamae
did not allow the bacteria l population to build up to the magnitude
that would cause the disease symptoms to appear, although the plants
were in fected . The latent in fection was, however, revealed when
potato tubers, obtained from Kamae experimental plot No. 1 during
the two seasons, showed disease symptoms under favourable conditions.
Thus, 3% of tubers obtained from apparently healthy plants were
found infected with P. solanacearum during the isola tion experiments.
Twenty per cent o f externally symptomless tubers kept under conditions
o f high humidity and at 30 C exuded bacterial ooze from the eyes or
had their vascular rings discoloured. Latent carriers of P. sola
nacearum regenerated as healthy tubers do but produced heavily
infected plants. About 1L. 9 of plants raised from externally
symptomless tubers wilted under greenhouse conditions.
It is thought that the low s o il temperatures at Kamae
caused some plants to be latently infected. When the tubers of these
plants were grown under favourable conditions, they produced in fec
ted plants. Latently infected tubers may cause serious disease
outbreaks in farms where the pathogen was previously absent. The
danger of using latently infected tubers as seed can be overcome by
screening potato seed lots before planting.
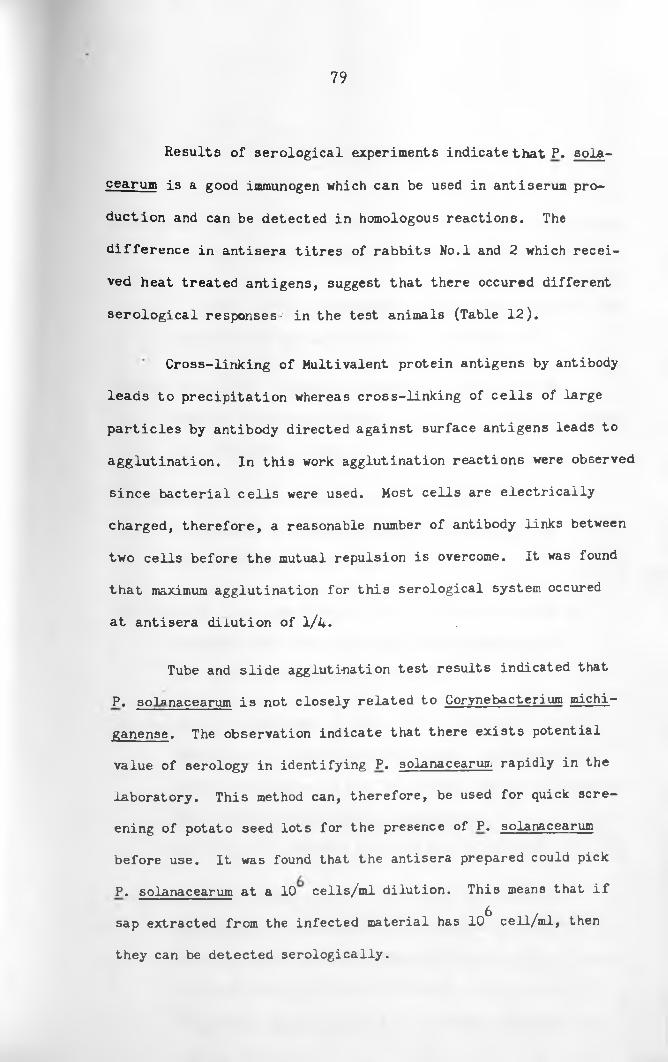
79
Results of serolog ica l experiments indicate that P. sola
ce arum is a good immunogen which can be used in antiserum pro
duction and can be detected in homologous reactions. The
d ifferen ce in antisera t itres of rabbits No.l and 2 which recei
ved heat treated antigens, suggest that there occured different
se ro log ica l responses- in the test animals (Table 12).
Cross-linking o f Multivalent protein antigens by antibody
leads to precipitation whereas cross-linking of c e l ls of large
p a rtic les by antibody directed against surface antigens leads to
agglutination. In th is work agglutination reactions were observed
since bacterial c e l ls were used. Most ce lls are e lectr ica lly
charged, therefore, a reasonable number of antibody links between
two ce lls before the mutual repulsion is overcome. It was found
that maximum agglutination for th is serological system occured
at antisera dilution of 1/4.
Tube and s lid e agglutination test results indicated that
P. solanacearum is not closely related to Corynebacterium michi—
ganense. The observation indicate that there ex ists potential
value of serology in identifying P. solanacearum rapidly in the
laboratory. This method can, therefore, be used for quick scre
ening of potato seed lots for the presence of P. solanacearum
before use. It was found that the antisera prepared could pick
P. solanacearum at a 10 cells/m l dilution. This means that i f6 ,sap extracted from the infected material has 10 cell/m l, then
they can be detected serologically .

6 R E F E R E N C E S
ANONYMOUS. 1970. The mean annual temperatures. National Atlas
of Kenya, 3rd ed. Survey of Kenya. Nairobi, pp 103.
__________, 1977. Plant disease distribution maps. Map No. 138.
Commonwealth Mycological In stitu tey Kew, England.
BERGEY, D.H. 1974. Manual o f determinative bacteriology.
Society of American Bacteriologists. William and Wilkins
Co., Baltimore, p 442.
BUDDENHAGEN. I.W ., L. SEQUEIRA and A. KE1MAN. 1962.
Designation of races in Pseudomonas solanacearum.
Phytopathology, 52:726 (A bstr.).
BUDDENHAGEN, I.W ., and KEIMAN. 1964. Biological aspects of
bacterial wilt caused by Pseudomonas solanacearum.
Ann. Rev. phythopathology, 2:203-230.
C0LEN0, A ., L. HINGAND and B. RAT. 1976. Some aspects of the
serology o f Pseudomonas solanacearum. Planning Confe
rence and Workshop on the Ecology and Control of bacterial
w ilt caused by Pseudomonas solanacearum.
N.C. State University, Raleigh, N.C. pp 110-119.
DIGAT, B. and M. CAMBRA. 1976. Specificity of antigens in
Pseudomonas solanacearum and application o f serology for
studying bacterial w ilt. Planning Conference and Workshop
on the Ecology and Control of bacterial wilt caused by
Pseudomonas solanacearum. N.C. State University, Raleigh,
N.C. pp 38-57.

81
DOWSON, W.J. 1939. On the systematic position and generic
names o f the gram negative bacterial plant pathogens.
Centbl. f . Bakt; A b t .l l . , 100:177-193.
______ . 1943. On the generic names Pseudomonas, Xanthomonas
and Bacterium for certain bacterial plant pathogens.
B rit. Mycol. Soc., Trans. 26:4-14.
______ . 1949. Manual o f bacterial plant diseases. Adam and
Charles Black, London p 183.
DURR, G. and G. LORENZL. 1980. "Potato production and u tiliza
tion in Kenya". Central Internacianal De La papa.
Technical University Berlin. University of Nairobi p 133.
FRENCH, E.R. and L. SEQUEIRA. 1970. Strains of Pseudomonas
solAnacear»Tn from Central and South America: a comparative
study. Phytopathology, 60:506-512.
GALLBGLY, M.E. Jr. and J.C. WALKER. 1949. Relation of
Environmental factors to bacterial w ilt of tomato.
Phytopathology 39:93&t946.
GRAHAM, J .; D.A. JONES and A.B. LLOYD. 1979. Survival of
Pseudomonas solanacearum race 3 in plant debris and in
latently infected potato tubers. Phytopathology, 69:1100-1103.
HALSTED, B.D. 1891. Bacteria. N.J. Agr. Exp. Sta. Ann. Rept. 11
and N.J. Agr. Col. Exp. sta. Ann. Rept. 3 (1890):347.
82
HARRIS, D.C. and A.O. MICHIEKA. 1972. Ecology o f bacterial
w ilt. Min. o f Agr. Ann. Kept. Vol. I I : p 50.
HARRIS, D.C , 1976. Bacterial w ilt in Kenya with particular
reference to potatoes. Planning Conference and workshop
on the Ecology and control o f bacterial wilt caused by
Pseudomonas solanacearum. N.C. State University,
Raleigh, N.C. pp 84-88.
HARRISON, D.E . I960. Bacterial Wilt of Potatoes
I. Field symptoms of the disease and studies on the causal
organism, Pseudomonas solanacearum. Variety Asiaticum.
Austr. J. Agric. Res. 12:854-871.
HARRISON, D.E. and H. FREEMAN. I960. Bacterial w ilt of pota
toes. II Serological relationship of two strains of
Pseudomonas solanacearum and a culture of Corynebacterium
sepedonicum. Austr. J. Agric. Res. 12:872-877.
HAYWARD, A.C . I960. A method for characterizing Pseudomonas
solanacearum. Nature. 186:405-406.
. 1964. Characteristics of Pseudomonas solanacearum.
J. Appl. Bact. 27:265-277.
_______ . 1976. Systematics and relationships o f Pseudomonas
solanacearum. Planning Conference and Workshop on the
Ecology and Control of bacterial wilt caused by Pseudomonas
solanacearum. N.C. State University, Raleigh, N.C. pp
6-21.

83
HAYWARD, A.C . 1976. Some techniques of importance in the
id en tifica tion of Pseudomonas solanacearum. Planning
Conference and Workshop on the Ecol. and Control of
bacterial w ilt caused by Pseudomonas solanacearum.
N.C. State University, Raleigh, N.C. pp 137-142.
JENKINS, S ., and A. KELMAN, 1976. Techniques fo r the study
of P. solanacearum. Planning Conference and Workshop on
the Ecology and control of bacterial wilt caused by
Pseudomonas solanacearum. N.C. State University,
Raleigh, N.C. pp 143-147.
KELMAN, A , 1953. The bacterial w ilt caused by Pseudomonas
solanacearum. A literature review and bibliography.
N.C. Agric. Exp. Stn. Tech. Bull. 99 P 194•
________ . 1 9 5 4 . The r e l a t i o n s h i p o f p a t h o g e n i c i t y i n Pseudomonas
solanarsapim to colony appearance on tetrazolium medium.
Phytopathology. 44:693-695.
KELMAN, A. and L.H. PERSON. 1961. Strains of P. solanacearum
d iffering in pathogenicity to tobacco and peanut.
Phytopathology. 51:158-161.
KOVACS, N . 1956. Identification of Pseudomonas pyocyanea by
the oxidase reaction. Nature. 178:703.
LLOYD, A.B . 1976. Bacterial w ilt in a cold temperature climate
of Australia. Planning Conference and Workshop on the eco
logy and control of bacterial wilt caused by Pseudomonas
solanacearum. N.C. State Univeristy, Raleigh, N.C. pp 134-135.

8 4
LOZANO, J.C. and L. SEQUEIRA. 1970. D ifferentiation of
races o f Pseudomonas solanacearum by a leaf in filtra tio n
technique. Phytopathology, 60:833-838.
MCCARTER, S.M , 1976. Persistance o f Pseudomonas solanacearum
in a r t i f i c ia l ly infected s o ils . Phytopathology. 66:998-1000.
MEIER, F.C. and G.K.K. LINK, 1923. Potato brown rot.
U.S. Dept. Agri. Bur. plant Ind. Cir. 1281, p 6.
MINISTRY OF AGRICULTURE, Kenya, I960. Annual Report
V o l.II: p 13.
________, 1961. Annual Report V o l.II : pp 14-15.
_______ , 1962. Annual Report V o l.II : pp 37-39.
_______ , 196L. A n nu a l Report Vol.I : pp 34-35.
_______ . 1965. A nnual Report V ol.II : p 27.
_______1966. Annual Report Vol. I : p 39.
_______ „ 1974. Horticultural development guidelines, p 48.
MORTON, D.J.; DUKES, P.D.; and S.R. Jr. JENKINS, 1966.
Serological relationships of races 1,2 and 3 of
Pseudomonas solanacearum. Plant Dis. Rept. 50:775-277.
NATTRASS, R.M . 1945. A new bacterial disease of the potato in
Kenya. E. Afr. Agrc. For. J. 10:162-163. ,
, 1946. Note on the bacterial wilt disease of the potato
in Kenya. E. Afr. Agric. For. J. 12:30.

85
RAMOS, A.H . 1971. Temperature relations studies o f P. sola-
nacearum. Min. o f Agr. Annual Report Vol.II p 14.
_____ . 1976. Comparison of Survival of two Pseudomonas solana-
cearum strains in s o il columns under consistant perfusion
and in fie ld plots devoid o f host covers. Planning and
Workshop on the Ecology and Control of bacterial wilt by
Pseudomonas solanacearum. N.C. State University, Raleigh,
N.C. pp 123-131.
ROBINSON, R.A. and A.H. RAMOS. 1964. Bacterial w ilt of potatoes
in Kenya. E. Afr. Agric. For. J. 30:59-64.
SALAMAN, R.N , 1949. The History and social influence of the
potato. University press, Cambridge p 685.
SEQUEIRA.L. and C.W. AVERRE, 1961. Distribution and pathogeni
city of strains of Pseudomonas solanacearum from virgin so ils
in Costa Rica. Plant, b is. Rept. 45:435-453.
SMITH, E.F , 1896. A bacterial disease of the tomato, egg-plant
and Irish potato ( Bacillus solanacearum nov. sp .). U.S.
Dept. A gric., Div. Veg. Phys. and Path., Bui. 12:1-28.
_____ , 1905. Bacteria in relation to plant diseases. V ol.l.
Washington D.C. Carnegie Institution p 285.
_____„ 1911. B a c t e r i a i n r e l a t i o n t o p la n t d i s e a s e s . V o l . I I .
Washington D.C. Carnegie Institution p 368.
______ , 1914. B a c t e r i a i n r e l a t i o n t o p la n t d i s e a s e s . V o l . I I I .
Washington D.C. Carnegie Institution, p 309.

86
WAITHAKA, J.H.G . 1975- Potato Cultivation in Kenya.
WINSTEAD, N.N. and A. KELMAN. 1952. Inoculation techniques
for evaluating resistance to Pseudomonas solanacearum
Phytopathology 12:628-634.

7. A P P E N D I C E S
A P P E N D I X 1
FORMULAE OF MEDIA AND CHEMICAL SOLUTIONS
1. Formula for preparation of Kelman's tetrazolium ch lo r id e I t z c ) medium ""
(a) Peptone 10 g
Glucose 10 g
Casein hydrolysate 1 g
D istilled Water 0.5 L
(b) Agar No. 3 10 g
D istilled water 0.5 L
(c ) 1% solution o f Tetrazolium chloride:
Dissolve a l l parts separately and dispense part
(a) and (b) in 100 ml aliquots in 250 ml scre-
capped b ottles . S terilize a l l parts at 1 atmos
phere for 20 minutes and store at room tempera
ture .
For use dissolve part (b) by steaming and mix
an equal volume of part (a) (100 mis of each part).
Add 1 ml of s ter ile part (c ) . Mix and pour into
p la tes .
2. Peptone Water
Peptone 10 g
Sodium chloride (Nacl) 5 g
Water 100C ml
Adjust pH to 8 .0 -8 .A and b o il to dissolve. F ilter and adjust
pH to 7 .2 -7 .4 . S terilize at 1 atmosphere for 15 minutes.
87

88
3. P hysiologica l Saline
Sodium Chloride (Nacl) 0.85 g
D istilled water 100 ml
Dissolve and s te r il iz e at 1 atmosphere pressure for
15 minutes.
4. Bromothymol Blue
Bromothymol blue 0.75 g
Alcohol (95%) 12.5 ml
D istilled water 37.5 ml
Dissolve the bromothymol blue in alcohol and then make up to
required volume with d is t ille d water.
5. Biochemical basal medium
NH4H2P04 1 g
Kcl 0.2 g
MgSO 7H20 0.2 g
'• Peptone 1 g
Bromothymol blue 10 - 20 ml
D istilled water 1 L
Adjust pH to 7 with 40% NaoH. Then add Agar 1.5 g. Dispense
in 45 nil aliquotes in 50 ml f l a s k s p lu g g e d w i t h c o t t o n w o o l . S t e r i
l iz e a t 1 a t m o s p h e r e f o r 20 m in u t e s .
6. Arginine broth
T r y p t o n e 5 g
Y e a s t e x t r a c t 5 g
K2HP0 , 2 g

L-Arginine monohydrochloride
Dextrose
3 g
0.5 g
D is tille d water 1 L
Dissolve by heating, adjust to pH 7, dispense in 5-10 ml
amounts and s te r il iz e at 1 atmosphere for 10 minutes.
7. Nitrate reduction test medium
Potassium n itrate, KNO (n itr ite free ) 0.2 g
Peptone 5*0 g
D istilled Water 1 D
Dispense in 5 nil aliquots and s te r iliz e at 121 C for 15 min.
Test reagents*
Solution A. Dissolve 8.0 g o f S u l p h a n i t i c acid i n
1 l i t r e o f 5N acetic a c i d .
Solution E. Dissolve 5.0 g .o f gd -naphthylamine in
1 l itr e o f 5N acetic acid.
♦Immediately before use, equal volumes of solutions
A and B were mixed to give the test reagent.

Appendix 2
M eteorological data fo r iliualtia Station-in South Kinangop noar Kanoe( froca September 1580 to JUI7 1581
OATH 1 2 3 4 3 6 7 a 9 10 11 12 13 14 15 16 17 18 19 20 21 22 23 24 25 26 27 28 29 30 31
SETT. M AX .TO ?. 16 .2 18 .2 1 8 .2 1 8 .0 1 4 .5 16 .7 1 9 .5 2 0 .5 19 .3 1 7 .5 1 9 .2 1 9 .5 1 9 .6 1 9 .5 1 7 .0 1 6 .5 19 .7 2 0 .7 2 2 .5 1 9 .5 1 8 .5 1 7 .0 1 8 .2 1 7 .2 1 7 -0 1 7 .6 1 7 .C 18- <->,19 20 \
1960 MTKI. TIMP. 5.1 4 .4 5 .7 5 .7 6 .7 4 . 0 4 .0 3 .0 3 0 6 .2 5*0 4 .2 3 -0 2 .4 4*C 7 , 0 3 .2 1 .2 3 .8 4 .0 4 .7 5 .6 7 0 7 .5 2 .5 5 .0 7 . 7 .2 |2.2 6. c;SLA Hi FALL HU N il K il 3 .0 1 .0 N il M il N il N il N il N il N il N il 1U1 T ra ce N il N il N il N il N il M il N il 3 9 .3 7 .6 N il N il 2.C N il r N il
OCT. KAX.TJiT. T O " 1 7 3 16.7 1 o 3 18 .2 12 .2 17-0 i * o 19.2 19.7 1 8 .5 1 8 .6 1 8 .5 1 7 .5 18 .1 1 9 .5 2 1 .o 21 .0 1 9 .0 1G.5 19 0 2 0 - o 2 0 .1 2 0 .3 2 0 . 0 2 0 - 0 20 (. 1 8 .6 117.0 17 .0 19 'CK 1M .TE3>. A. 5 2 .0 4 .0 3 .0 4 .5 3 .0 4 .2 4 .8 7 .2 6 .5 7 .2 5 .6 8 .2 7 0 6 .5 7 .5 5 -0 a . 0 4 .5 8 .6 7- O 4 .5 6 .5 7 .7 4 .5 3 .7 '5 . 5 P *0 j 7 .5 5 • 7 . OOCO0
HAIL FALL N il N il N il N il 0 .8 1 .0 1 5 .0 N il N il 1 .0 1 6 .5 2 3 .6 2 .4 1 .0 N il N il N il 1 8 .9 2 2 .0 4 .8 N il N il N il N il N il N il 2 0 .7 j 2 2 .0 J 17.0 0 .6 1 .0
NOV. MAX. TEMP. 18 .5 16-0 1 5 .3 16.0 1 7 .2 17 0 1 8 .5 1 5 .8 18 -0 1 7 .2 17 .0 19-0 2 0 .5 1 9 .4 19*0 1 8 * 0 1 8 .5 1 6 .8 1 9 .8 1 9 ,0 18 .7 1 7 .4 1 9 .2 1 3 .3 19 .1 1 8 .5 1 5 .7 1 9 . ] |20-O 2 1 .5M EU .XEiP. 6 .5 8 .O 8 . 0 7 .2 8 .0 7 .9 7 . 0 0 .4 2 .5 8 .2 8 • C 7 • O y .5 7 .6 4 .8 8 . 0 7 * 0 7 .8 6 .7 8 ' O 5 .2 5 .5 7 .5 8 .0 8 . C 8 .8 6 .2 j o . 2 7 .0
1930 SLAIN FALL. 1 6 .0 2 9 .5 2 7 .1 5 .2 18 .7 1 .4 3 5 .0 3 .6 1 6 .8 0 .6 4 3 .3 1 5 .0 1 .9 3 14 .7 2 3 .0 1 0 . 0 3 3 .2 2 .8 0 .7 5 .3 1 1 .0 5 .6 3*0 9 .5 1 -0 N il 7 .6 N il N il N il
DEC. KAX.THMP. 2 0 .5 2 0 .5 2 0 .5 2 0 -0 17 .0 1 5 .8 1 6 .5 1 6 .5 1 8 .5 1 7 .5 1 9 .6 1 9 .6 1 9 .3 18*0 1 9 .6 20-0 2 0 -0 2 2 .9 1 8 .2 1C. 2 2 0 .0 2 2 .7 1 9 .6 1 9 .2 1 9 .5 2 0 .2 2 0 .2 2 0 .3 20 O 2 1 .6 2 0 .7I960 inK L. t e s ?. 5 .0 5-C 5 .4 1 0 -0 1 0 .5 11 . 0 1 0 .3 1 0 .1 10 .5 1043 5 .5 7 .6 1 0 .5 9 .0 8 .3 6 . 4 9 * 0 1 0 .6 2.C 4 .2 6 » 5 6 ,0 7 .8 6 .8 9 .2 10*0 6 .7 4 .0 6 1 4 ; 5 .7
r a in f a l l M il M il M il 2 5 .0 1 9 .C 2 .3 3 .2 3 .8 N il N il 1 2 ,0 1 .0 N il N il N il 3 . 0 9 .3 12 .3 0 .5 N il 2 .8 N il N il N il N il M il N il N il N il N il N il
J AN. KAX.T.25>. 20-0 19 .7 1 9 .5 16 .0 1 9 .5 1 8 .3 1 9 .2 1 9 .5 1 9 .3 2 0 .0 1 9 .9 2 0 .2 21*0 2D O 2 0 . 0 2 0 .5 1 9 .5 1 9 .5 2 1 .6 2 1 0 **« e 21 -0 2 0 .5 2 1 .8 21-0 2 2 .2 2 0 .5 21.8| 2 2 .4 2 2 .6 1 9 .61931 HDnLTEUP. 7 .3 7 .5 6 .3 1 0 .0 lO .o 1 0 .0 9 .3 2 .3 2 .7 5 .5 8 .0 8 -0 8 .6 5 .8 6 .5 6 .0 10. O 5 .0 3 .6 5 .O 4 .0 7 .2 7 . 4 7 .8 6 .6 7 - 0 8 .4 5-0 3 .7 5 .4 8 0
RAINFALL8,1
N il 7 . 0 1 4 .4 N il 3 .3 3 .4 N il N il N il 1 .0 N il N il M il N il N il M il M il N il .N i l 2 :2 N il 0 .4 N i l N il N il N il N il M il 1 2 .2 0 .5
FES. K A X .T S Q . 2 0 .8 2 1 .5 2 1 .5 2 1 .3 1 3 .5 2 1 .3 2 0 .7 2 2 .5 23 .7 2 2 .5 2 2 .6 22 .7 20 .7 1 9 .6 2 0 .c? 1 7 .6 1 8 .5 20 0 2 0 . 0 2 0 .2 2 1 .2 2 2 .2 2 3 .7 23> 0 21 0 2 1 .7 23 C 2 3 * 0KU.X.TEX’ . 6 .2 6 .0 6 .0 3 .0 5.7 6 .7 5 .0 5 .2 6.0 9 .5 5 .5 6 .0 9 *0 1 1 .2 1 1 .8 1 1 . 0 1 1 - 0 7 .9 10 • J 9 .2 4 . 0 5 .6 8 .5 8 .5 7 .5 3 .8 5 .7 3 .5
U , 1931 RAINFALL m i 1111 m i U il N il M il N il M il N il N il N il N il 1 3 .5 1 5 .5 1 5 .5 8 .4 2 . 0 1 0 .8 8 .4 N il N il N il N il N il N il N il N il N il
H MA2CH HAX.TEM?. 2 2 .6 20 .7 2 1 .5 2 2 .5 2 2 .0 2 1 ,o 2 0 .2 2 0 .7 21*0 2 1 .5 1 9 .5 19*0 20*0 1 9 .2 1 9 .2 2 1 .5 1 9 .5 1 8 .7 1 8 .8 1 8 .5 1 9 .3 1 9 .5 20 O 2 0 .3 2 1 .5 1 8 .3 18 .L I S O 19 . * 1 6 .5 19 .>MIHI.TIHP. 8 .5 9 .5 2 .2 7 .6 5 . 0 7 . 0 1 0 .7 6 .3 8 .5 9 .0 1 1 .3 1 0 .9 1 1 .0 4 . 0 1 1 .2 0 .3 1 1 .2 9 .3 1 0 .2 10 .7 7 .6 1 0 .5 1 0 . | 1 1 .3 1 0 .3 1 0 .5 1 0 .5 9 .3 9 . 2 10 . 10 1
XRAa_NFAlL n i l N il M il M il N il 6 .5 N il M il N il 3 .4 N il 0 .2 5 .6 1 .9 1 .0 1 3 .9 12 .2 15*2 1 8 .4 1 7 .0 0 .6 4 1 .3 1 3 .8 5 .2 1 3 .5 4 - 0 2C .3 l . S 1 0 .2 15 l
C :
* * AP2L MAX. TEL?. 1 9 .5 1 8 .3 1 9 .0 2 0 -0 19-6 18»C 2 0 .0 21-.6 19.5 19 3 1 9 .0 1 8 .5 1 8 .5 1 9 .0 1 8 .5 1 6 .3 1 6 .5 1 6 .5 1 8 .2 1 7 .6 1 3 .5 1 8 .6 2 0 . i 1 5 .5 1 8 -0 1 6 .5 18-J 1 9 -0 1 9 .2 2 1 .2r l n , „ -, M lK I .T S ff. 9 .3 1 0 .0 9 .6 S .2 9 .2 7 .0 6 .2 6 * 0 7 .6 9 .0 1 0 -0 11 O 9 ,9 10* C 5 * 0 1 1 .5 11.7 1 1 .5 1 0 -0 9 .3 7 .4 5 .5 6 * 0 1 1 .2 9 1 0 1 1 .4 9 .6 7 .5 9 . 0 4 .95rr 1 9 o i
________RATI. r-J.1. 2 5 .7 3 .7 2 .8 1 .0 5 .6 0 .3 9 .5 3 7 .5 21 .1 4 .3 3 1 .2 9 1 .8 12 7 .6 1 6 .9 2 6 .5 2 7 .2 2 7 .3 16> 0 N il N il N il N il 18- 0 1 5 .5 3 2 -0 4 .2 5.1 0 .5 N il N il I
2 MAT >
X U .T Q V . 1 9 .5 13. O 19 .-o 1 7 .8 1 8 .5 1 7 .0 1 8 .0 17. O 1 4 .5 18 O 1 9 .2 1 8 .0 I1 7 .2 1 8 -0 1 7 .0 18 C 1 7 .5 1 6 o 1 4 * 0 1 4 .6 1 7 .3 1 6 .6 1 8 .0 17. 0 1 6 .5 1 6 .5 1 9 0 8 .5 13 .71
16 .319 . 1 0 .5 3 . 0 fl • 6 9. 0 5 * C 4 * O 1 0 .2 3 .4 1 0 .8 11.7 7 • 0 13.1 u - 0 8 . O 10*0 8 -O 4 v 0 1 0 . r> 3 - O 6 .2 8 ■ 5 .7 7 .6 7 .5 5 .5 4 5 7 C 8 .9 |ss e 15a : Q .
RAIL F< XL 14 .O 2 .2 M il 6 .4 1 4 .0 4 3 .6 4 4 .3 6 . 0 2 0 .0 3 .4 4 - 0 4 0 .4 j 26* O 6 2 .0 4 .5 26 .7 l e . o 2 4 .1 1 6 . o [ 3 . 7 1 .6 N il N il 1 .1 N il N il N il a 11 1 .0 N il jlK il
25j; j w g MAX.TEXT. 1 6 .5 17. 0 1 5 .0 1 9 iO 2 2 .5 1 5 .6 18*0 1 6 .5 17 .0 1 6 .2 1 6 .0 16 .1 1 6 .2 1 6 .5 1 7 .5 1 9 .0 1 6 .5 1 6 .0 1 6 .5 1 7 .5 1 7 .6 2 0 .5 1 9 .2 15*0 16 C 1 7 .0 16 .C 0 . 0 18 .2X» * ^ • 9 .2 7 .5 6 .6 3 .5 7 * O 8 .3 7 .5 9 .9 9 .3 9 . O 1 0 * 0 5 .O 6 .5 7 • 0 4 .2 7 1 O 7 .0 8 .8 5 .5 4 .3 3.7 8 .3 8 .5 9 i 0 7 .5 8 .4 s . ^ a • O 3 .1 5 .319wl RAIN r -■■ T. N il N il 0 .5 K il 2 . 0 2 . 0 4 .4 110 .3 1 .0 2 .1 N il N il K il N il N il 0 .6 N il N il N il N il 1 .0 N il 2 . 0 0 .3 N il 5 .8 u . 1 13.4.] 4 .7 ] K il
JULY U A X .T E T . ; p.° 1 8 .0 1 6 .0 1 6 .0 1 7 .0 1 7 .5 15*0 18 .8 1 5 .6 1 3 ,2 13 .6 1 5 .2 13,2 1 5 .6 1 5 ,0 1 5 .6 1 7 .0 13 .5 14 .3 1 5 ,0 1 5 .1 1 2 .8 1 4 .0 16 .8 1 5 .2 U . 0 11. 7 ] 1 2 .5 15*; I14. a 1 5 .5 11981 HXNI^Tai?. 547 6 . 0 5 .4 3 .2 3 . 0 7 .5 8 .6 8 . 0 7 .5 9 .3 9 . 0 7 * 0 9*0 8.9 8 .8 8 .5 7 .8 7 .6 7 .5 8 * 0 7 .3 7 . 4 7 . 4 4 .8 6 . 4 b .4 9.5 a.r 5 .7 /8 * Cl 8 .2 !NIL 6 .4 N il N il 1 .2 M il M il 2 . 0 2 .5 2 1 .4 0 .7 3 .0 1 .5 2 .2 4 .0 3 . 0 1 .2 1 .5 1 .4 N i l jO .S N il N il jN ll 14 * 0 1.3
■ ■ 1« i I X>c*. 5
__- LM l j

I
APPENDIX 2 C o n t .
Meteorological data for National Agricultural Research Laboratories,Nairobi, from September I960 to July 1981
TT7.-------7n-------71----------TCATS 1 2 1 ------- 4 “3--- 1 -------- 7 8 rT ~ 10 11 12 13 14 15 16 17 18 19 20 21 22 23 1 24 25 26 27
P47
SETT. MAX. TEN?. 2 3 .0 2 4 .5 2 4 .5 2 4 .5 2 1 .0 2 3 .0 2 6 .5 2 4 .0 2 6 .0 2 3 .0 2 5 .5 2 5 .0 . 2 6 .5 2 6 .5 2 1 .5 2 4 .0 2 7 .0 2 6 .0 2 7 .0 2 6 .5 2 4 .0 2 4 .5 2 4 .0 2 3 .0 2 4 .0 2 5 .0 2 4 .5 1 2 5 .0 2 5 .2 2 6 .3 1
1930 MINI. T2JF. 12 .0 1 1 .5 1 3 .5 1 3 .0 12 .8 9 .5 1 0 .5 1 0 .0 1 0 .0 1 2 .0 1 3 .0 1 2 .5 1 1 .5 1 1 .0 1 1 .5 1 2 .0 1 2 .5 1 1 .0 1 2 .0 1 2 .5 1 2 .5 1 3 .0 1 3 .3 1 3 .4 1 2 .5 1 2 .5 1 2 .5 1 3 .0 1 2 .0 ( 1 5 .2
RAINFALL N il N il N il 2 .3 N il N il N il N il N il N il N il N il N il N il N il N il N il N il N il N il N il N il 0 .8 9 N il N il N il N il N il N il N il
OCT. MAX. TEMP. 24 . 5 2 6 .0 2 5 .2 2 6 .5 2 6 .5 2 6 .5 2 6 .0 2 5 .0 2 6 .0 2 6 .0 2 7 .0 2 6 .0 2 4 .5 2 5 .0 2 5 .0 2 6 .0 2 7 .0 2 8 .0 2 7 .5 2 6 .0 2 6 .0 2 6 .0 2 7 .0 2 7 .0 2 7 .5 2 7 .0 2 7 .0 2 6 .0 2 3 .5 I ? 4* ; 2 5 .0i960 m in i , t h S' 1 6 .0 17 .2 1 7 .0 10 .2 13 .2 1 4 .8 1 0 .5 1 4 .5 13 .5 13 .0 1 3 .5 1 3 .5 13 .5 1 4 .5 1 4 .0 1 3 .5 1 3 .5 1 5 .0 1 5 .5 1 4 .5 1 4 .2 1 3 .8 1 3 .0 1 3 .0 1 4 .5 1 3 .2 1 4 .5 1 5 .0 1 4 .0 1 7 .5 1 1 .5
UADI PALL N il N il N il N il N il N il N il 8 .4 N il N il N il 8 .3 N il 2 .4 N il N il N il 0 .3 N il N il N il N il N il N il N il N il | N il 6 .6 N il iN il M l
NOV MAX.TEL?. 2 1 .5 2 5 .0 2 1 .5 2 1 .0 2 1 .5 2 2 .5 2 3 .0 2 1 .5 2 3 .5 2 3 .0 2 3 .0 2 3 .0 2 4 .0 2 5 .0 2 4 .5 2 4 .0 2 5 .0 2 1 .5 2 2 .0 2 2 .5 2 4 .5 2 4 .0 2 3 .0 2 3 .1 2 5 .0 2 4 .6 ! 2 2 . 0 j 1 9 .0 2 J .6 2 4 .0I960 MIN I . TEMP. 1 1 .5 1 2 .5 14 .0 1 2 .5 1 3 .5 1 4 .5 1 5 .0 1 4 .0 ' 1 4 .5 1 3 .5 1 2 .5 1 4 .0 1 4 .5 1 4 .0 15.0 1 4 .0 1 6 .5 1 6 .5 1 6 .5 1 6 .5 1 8 .5 1 5 .0 1 7 .5 1 4 .5 1 6 .0 14 . 5 | 1 6 .0 !1 2 .5 1 4 .0 1 6 .0
RAINFALL N il N il 1 2 .0 2 3 .0 10 .16 N il 2 0 .0 5 .2 2 .6 N il 4 .0 N il 1 5 .0 1 .7 N il 4 8 .3 1 8 .5 N il 2 .0 1 .0 2 4 .0 5 .8 5 .3 1 .0 N il 2 .4 j 9 .3 N il N il N il •
DEC MAX .T —'CP. 2 4 .5 2 3 .5 2 3 .5 2 3 .0 2 3 .0 2 0 .0 2 2 .5 2 0 .5 2 3 .0 2 2 .5 2 4 .0 2 4 .0 2 3 .5 2 2 .5 2 2 .5 2 3 .5 2 4 .6 2 3 .0 2 2 .0 2 3 .0 2 3 .5 i 2 4 .5 2 3 .5 2 3 .5 2 3 .5 2 3 .5 ! 2 4 .0 2 4 .0 2 4 .0 2 5 .0 2 5 .0I960 MINI.TEMP. 1 2 .5 12 .5 1 4 .0 1 5 .0 1 5 .0 1 5 .0 1 5 .0 1 3 .5 1 4 .5 1 4 .5 1 3 .0 1 4 .0 1 4 .5 1 6 .5 1 4 .5 1 3 .0 1 A .5 1 1 5 .5 1 4 .5 1 3 .5 13. 5 1 3 .3 1 3 .0 1 4 .5 1 8 .2 1 7 .5 1 2 .5 1 8 .5 1 1 .0 1 1 .5 1 3 .5
kA IN PALL N il N il N il N il 2 2 .0 4 .5 5 .5 7 .5 0 .7 0 .0 5 N il 0 .2 4 .3 N il N il N il . 7 . 4 1015 N il N il N il N il N il N il N il N il ! N il N il 1U1 N il N il
JAN. MAX.TEa>. 2 4 .0 2 4 .5 2 4 .0 2 2 .5 2 4 .5 2 5 .0 2 4 .5 2 4 .0 2 4 .0 2 4 .0 2 4 .5 2 5 .0 2 5 .5 2 5 .0 2 5 .0 2 5 .5 2 5 .0 2 4 .5 2 6 .0 2 6 .0 2 6 .5 2 6 .5 2 5 .5 2 5 .5 2 5 .5 2 6 .5 ! 2 6 .0 2 6 .5 2 7 .5 2 7 .5 2 4 .51921 MINI. TEMP 12 .0 12 .5 1 4 .0 1 4 .0 1 4 .0 1 4 .5 1 5 .0 1 2 .0 1 0 .5 1 1 .0 1 3 .0 1 3 .0 1 3 .5 1 3 .0 1 4 .0 1 4 .0 1 4 .0 1 4 .0 1 8 .5 1 7 .5 1 9 .5 1 7 .0 1 6 .5 1 9 .5 1 4 .5 1 4 .0 1 5 .5 1 3 .0 H .5 1 4 .0 1 4 .0
SAINFALL N il N il N il 1 .5 N il N il : ; n N il t u i N il N il N il N il N il N il N il N il N il N il N il N il N il 3 .2 N il N il N il 1 N il N il N il N il N il
F E B MAX. TIDC1 2 6 .0 2 6 .0 2 7 .0 2 6 .5 2 3 .2 2 6 .2 2 6 .0 2 7 .3 2 3 .0 2 8 .0 2 8 .0 2 8 .0 2 4 .0 2 6 .5 2 4 .0 2 6 .0 2 5 .0 2 7 .5 2 6 .5 2 7 .5 2 7 .0 2 8 .0 2 8 .5 2 9 .0 2 7 .5 2 8 .2 , 2 9 .0 2 9 .0 11901 KINI.TSSP. 1 2 .5 1 9 .0 12 .5 2 1 .2 16.7 1 7 .0 1 9 .0 1 9 .0 2 0 .0 15 12 1 3 .0 1 6 .0 1 6 .0 1 5 .5 1 6 .5 1 5 .5 1 6 .0 1 1 .5 1 6 .0 9 .0 1 0 .0 1 4 .0 8 .0 1 0 .0 i
RAINFALL N il N il ( i l l N il N il N il m i N il 2 .5 N il N il 1 .7 0 .5 0 . 4 0 .3 N il N il N il N il N il N il N il N il N il N il N il N il N il
MARCH H Ax.ras> 2 7 .5 2 7 .0 2 7 .0 2 7 .0 2 8 .0 2 7 .0 2 6 .0 2 7 .0 2 7 .0 2 7 .0 2 6 .5 2 6 .0 2 6 .5 2 7 .0 2 5 .0 2 7 .3 2 3 .0 2 4 .5 2 5 .0 2 5 .0 2 7 .0 25 . 5 •25.5 2 4 .0 ' 2 4 .0 2 4 .0 2 6 .0 2 3 .5 2 3 .51931 MINI. T E C . • I
RAIN FALL N il N il N il N il 2 9 .0 N il N il N il N il N il N il N il N il N il N il N il 7 .5 2 .8 a . . 5 .0 6 .0 N il 7 .3 1 .5 4 .5 , e N il - 3 .6 2 .0
AP2IL MAX. T2i T 2 5 .5 2 4 .0 2 4 .0 2 4 .5 2 3 .5 2 1 .5 2 4 .0 2 2 .5 2 6 .0 2 4 .5 2 1 .5 2 3 .0 2 3 .5 2 4 .0 2 2 .5 2 1 .0 2 0 .5 2 0 .5 2 2 .5 2 2 .5 2 2 .5 2 3 .5 2 4 .5 2 4 .2 2 2 .5 2 2 .5 i 2 2 .5 2 1 .0 2 3 .0 2 5 .01981 im :i .T E 3 > . I I
RAINFALL 2 7 .0 3 .2 1 9 .5 N il 3 4 .5 7 .0 N il N il 5 .8 2 7 .7 2 3 .6 3 2 .0 2 3 .5 5 .0 81.1 1 6 .0 4 2 .3 4 .2 0 .0 5 N il N il 5 .3 N il N il N il 4 .0 [ N il 0 .5 N il j 3 .0 ■ljMAT MAX.T:23 . 2 3 .5 2 3 .0 2 3 .5 2 2 .5 22 .7 2 3 .0 2 3 .0 2 2 .0 2 2 .0 2 3 .0 2 3 .0 2 4 .0 2 3 .0 2 3 .0 2 2 .0 2 3 .0 2 3 .0 2 3 .0 2 2 .0 2 3 .0 2 2 .0 2 3 .0 2 2 .0 2 2 .5 2 1 .5 12 1 .0 1'S t. J 2 2 .3 2 2 .5 2 3 .0 2 0 .0 11931 M L '!I .T E C . 1
RAINFALL 0 .1 3 .6 1 .8 2 .7 0 .2 8 .7 2 0 .5 3 4 .3 3 2 .8 N il N il 1 .3 2 0 .0 13 .3 0 .7 7 .5 N il N il 6 .5 4 .0 N il N il N il N il N il j N il j N il N il N il j 7 .0 N il
JUST max. temp. 2 0 .5 2 2 .5 2 1 .5 2 2 .0 2 2 .0 2 2 .5 2 2 .2 22 . 2 2 .2 2 1 .2 2 1 .5 2 2 .0 2 1 .5 2 2 .0 2 2 .5 2 4 .0 2 1 .5 2 2 .5 2 0 .5 2 3 .5 2 3 .0 2 4 .0 2 4 .5 2 1 .5 2 2 .5 j 2 2 .5 120 .51 2 2 .0 2 3 .0 2 2 .019S1 M IN I.TSI? 12 .0 1 4 .5 2 0 .5 1 6 .0 1 1 .0 9 .5 1 2 .5 12 .5 1 2 .5 1 0 .0 9 .0 3 .5 n . o : 1 0 .5 1 2 .5 1 0 .0| 9 . 5 ; 1 1 .5 1 0 .0 13.(1 1 1 .5
r a in f a l l 0 .5 N il N il N il " mi 1 .5 N il N il 1 .3 0 .7 N il N il N il mi N il N il N il N il N il N il N il N il N il N il j 1 .8 |N il IN il 2 .0 N il
JULY n ax . t s ? . 2 1 .0 2 2 .0 2 1 .0 2 1 .0 2 1 .5 1 9 .5 2 0 .5 2 4 .0 2 1 .0 2 1 .0 1 3 .5 2 0 .5 1 7 .5 2 1 .5 1 9 .5 1 3 .0 2 1 .5 1 6 .0 1S .0 1 6 .5 2 0 .5 1 9 .0 11 7 .5 2 3 .5---- T2 1 .0 ; 2 1 .5 |1 8 .0 1 1 8 .0 2 2 .5 \ 2 1 .3 2 0 .0
• * - MUTLICff 9 .0 9 .0 e .o 3 .0 9 .5 1 0 .0 1 2 .0 12 .0 1 2 .2 1 2 .0 1 1 .0 1 2 .5 12.J " 52 .0 1 2 .5 12 .0 1 0 .0 1 2 .0 1 1 .5 1 0 .5 9 .5 1 0 .0 9 .5 7 .5 8 .0 1 0 .0 9 .5 |1 2 .5 1 5 .0 /1 4 .C 1 2 .0 '1901 RAINFALL N il N il
mN il N il
. . ..........N il N il N il N il N il N il
111 11N il 3 .0 N il | N il N il N il T ra ce N il N il T ra ca T r a c . l . l N il j N il jN il N il N il N il
___1

A p p e n d i x 3
Population density trends of Pseudomonas fiolanacearum around the rhizosphere of inoculatod potted
Potato plants at seven soil temperatures.
TE“P E MATURE tn °C
Mean time tow i l t i n g ( i n d a y s )
P.solanacearum/q of soil at day
7 14 21 28
saprophytic /g cf soil at day bacteria
7 14 21 23
14TotalMeanSO
9.9990xin132:722x10®4.5215xl07
91.860x102.0666x10®8.8317xl07
2.0130xl092.236x10®1.43x10®
1.9770xl092.1966x10°1.6879x10®
2.630xl092.922x10°3.4197x10®
1.4040xl091.56x10°1.1374x10°
3.520xl093.9111x10°1.735x10°
4.160x10⁹ 4.622x10° 1.85x10°
i e 14.9TotalMeanS.O
3. HOxlO9 3.455xl08 2.8076xl08
S.OOOxlO98.8389x10®2.1774xl08
6.lOOxlO96.7770x10°5.7342x10°
1.310xl09 1.455x10° 2.5145x10°
3,746xl09 4.155x10° 2.2283x10°
2.820xlQ9
3.1333x10°2.122x10°
4.870xl095.4111x10°4.548x10°
4. C50xl'J94.50xl093.80197x10°
2013.3
TotalMeanSD
6.200xl096.8889xl084.411x10®
8.020xl098.9111x10®8.315x10®
4.0300xl09 4.4770x10® 4.124x10°
2.060xl09 2.289x10® 3.5698x10°
5.220xl095.80x10®2.082x10°
2.250xl092.50x10®3.949x10°
2.316xl392.5666x10®2.4469x10°
3.440xl093.e2xi0°6.554x10®
24 0.9TotalMeanSO
5.23xl09 5.8111xlG8 2.6955xl08
1.052xl010 1.16S3xlC9 9.169x10°
7.700xl09 8.555x10° 5.2946x10°
3.620xl09 4.022x10® 3.5046x10°
4.S20xl095.3555x10°2.7600x10°
2.370xl09 2.633x10® 2.319x10®
3.320xl0?3.659x10°3.92x10°
g4,410x10*4.5x10®4.703x10®
28 9.0TotalMeanSD
i.£l3xl010 1.681lxlO9 6.2455xl08
5.780xl09 6.4222x10® 8.3633xl07
2.830xl093.144x10°1.431x10®
2.510xlQ92.7839x10®1.2424x10®
5.70xl096.333x10°1.8669x10°
6.830xl097.5889x10®5.8831xl07
4.790xlQ95.3222x10°1.6184x10°
4.20xi094.665x10®2.114x10®
30 10.7TotalMaanSD
4.690xl095.2111xl083.028xl08
4.660xl095.1778x10®2.1022x10®
2.120xl092.3556x10°1.0410x10®
1,410xl09 1.5667x10° 3.OOxlO7
1.990xl092.2111x10°1.3596x10®
3.80xl093.6222x10°1.5098x10°
3.85500xl094.277x10°1.8773x10°
3.760xlCV4.2x10°7.106xl07
33
_______12.1
TotalMeanSO
3.190xl09 3.5444xl08 1.7222x10®
1.710X1091.900x10°4.77xl07
6.360x10°7.0667xl073.423xl07
5.660x10°6.2889xl07 2.529xl07
2,470xl092.7444x10°1.5613x10°
l.AOxlO9 1.5555x10° 4.2459xl07
1. SSQxlO92.0533x10°3.723xlD7
2.260xl092.5111x10°8.352xl£)7
KEY represents infinity
SD represents standard deviation