Embed Size (px)
Citation preview
The Data Avalanche
Jim GrayMicrosoft Research
[email protected]://research.microsoft.com/~Gray
Talk at HP Labs/MSR: Research Day
July 2004
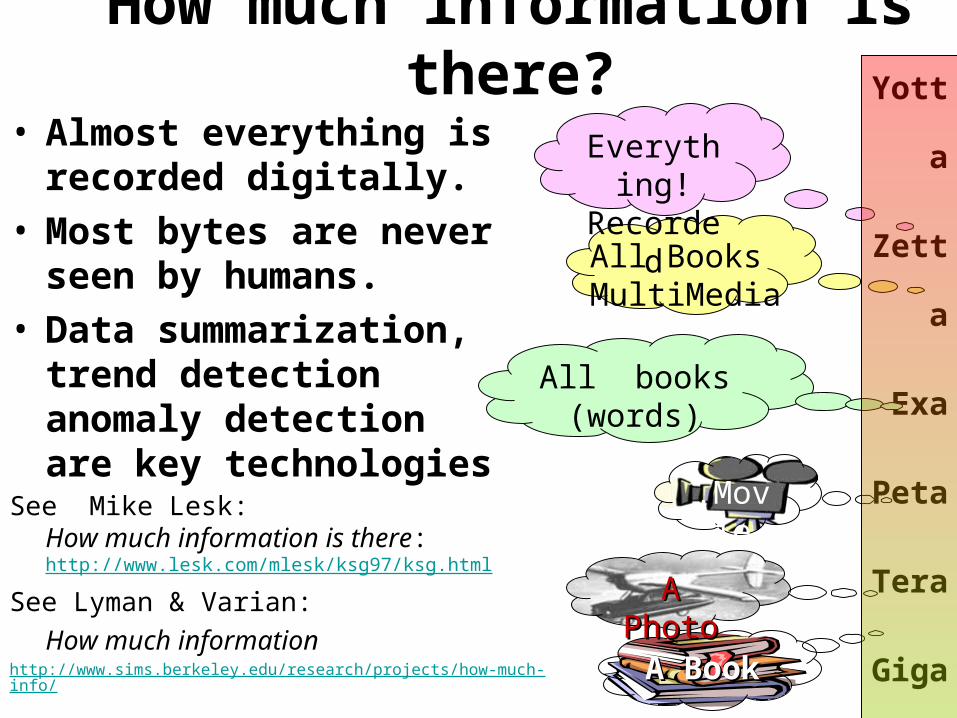
How much information is there?
• Almost everything is recorded digitally.
• Most bytes are never seen by humans.
• Data summarization, trend detection anomaly detection are key technologies
See Mike Lesk: How much information is there: http://www.lesk.com/mlesk/ksg97/ksg.html
See Lyman & Varian:
How much informationhttp://www.sims.berkeley.edu/research/projects/how-much-info/
Yotta
Zetta
Exa
Peta
Tera
Giga
Mega
KiloA BookA Book
.Movie
All books(words)
All Books MultiMedia
Everything!
Recorded
A PhotoA Photo
MemexAs We May Think, Vannevar Bush, 1945
“A memex is a device in which an individual stores all his books, records, and communications, and which is mechanized so that it may be consulted with exceeding speed and flexibility”
“yet if the user inserted 5000 pages of material a day it would take him hundreds of years to fill the repository, so that he can be profligate and enter material freely”
MyLifeBits The guinea pig• Gordon Bell is digitizing his life• Has now scanned virtually all:
– Books written (and read when possible)– Personal documents (correspondence, memos, email, bills, legal,0…) – Photos– Posters, paintings, photo of things (artifacts, …medals, plaques)– Home movies and videos– CD collection– And, of course, all PC files
• Recording: phone, radio, TV, web pages… conversations• Paperless throughout 2002. 12” scanned, 12’ discarded.• Only 30GB Excluding videos• Video is 2+ TB and growing fast
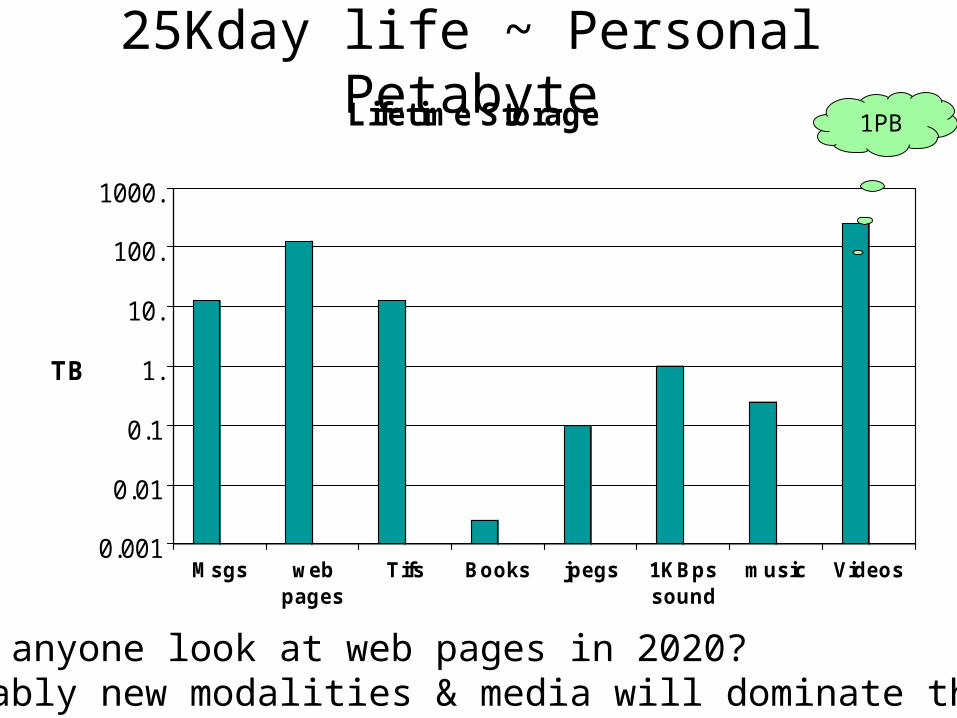
25Kday life ~ Personal Petabyte
0.001
0.01
0.1
1.
10.
100.
1000.
TB
Msgs webpages
Tifs Books jpegs 1KBpssound
music Videos
Lifetime Storage 1PB
Will anyone look at web pages in 2020? Probably new modalities & media will dominate then.
Challenges
• Capture: Get the bits in
• Organize: Index them
• Manage: No worries about loss or space
• Curate/ Annotate: automate where possible
• Privacy: Keep safe from theft.
• Summarize: Give thumbnail summaries
• Interface: how ask/anticipate questions
• Present: show it in understandable ways.
80% of data is personal / individual. But, what about the other 20%?
• Business– Wall Mart online: 1PB and growing….– Paradox: most “transaction” systems < 1 PB.– Have to go to image/data monitoring for big data
• Government– Government is the biggest business.
• Science– LOTS of data.
CERN Tier 0
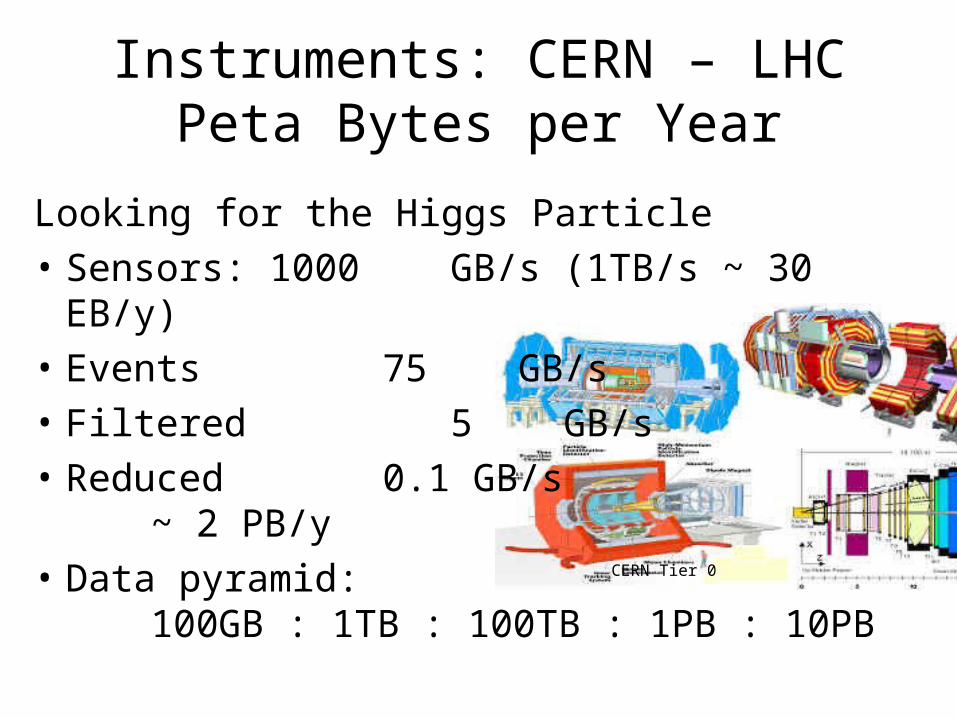
Instruments: CERN – LHCPeta Bytes per Year
Looking for the Higgs Particle
• Sensors: 1000 GB/s (1TB/s ~ 30 EB/y)
• Events 75 GB/s
• Filtered 5 GB/s
• Reduced 0.1 GB/s~ 2 PB/y
• Data pyramid: 100GB : 1TB : 100TB : 1PB : 10PB

Information Avalanche• Both
– better observational instruments and – Better simulations are producing a data avalanche
• Examples– Turbulence: 100 TB simulation
then mine the Information – BaBar: Grows 1TB/day
2/3 simulation Information 1/3 observational Information
– CERN: LHC will generate 1GB/s10 PB/y
– VLBA (NRAO) generates 1GB/s today– NCBI: “only ½ TB” but doubling each year, very rich dataset.– Pixar: 100 TB/Movie
Image courtesy of C. Meneveau & A. Szalay @ JHU
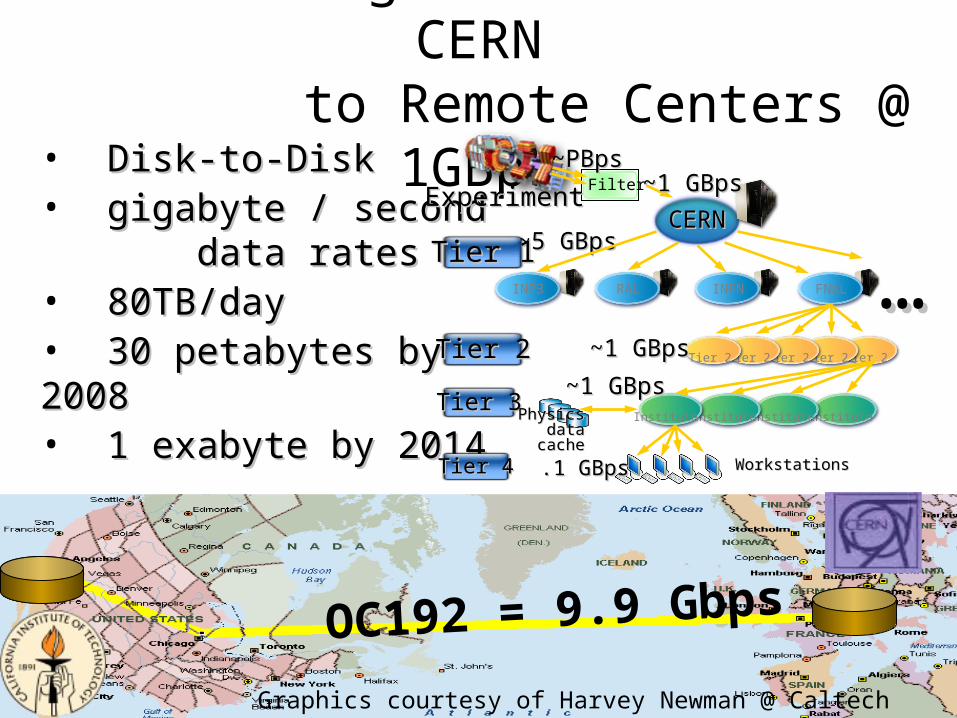
One Challenge: Move Data from CERN to Remote Centers @ 1GBps
• Disk-to-DiskDisk-to-Disk• gigabyte / secondgigabyte / second data rates data rates• 80TB/day 80TB/day • 3030 petpetabytes by 2008abytes by 2008• 1 exabyte by 20141 exabyte by 2014
~5 GBps~5 GBpsCERNCERN
Filter
Tier 2Tier 2
Tier 3Tier 3
Tier 1Tier 1
……INP3 RAL INFN FNAL
Tier 2
Institute
Tier 2Tier 2Tier 2Tier 2
Institute Institute Institute
Tier 4Tier 4
ExperimentExperiment ~1 GBps~1 GBps~PBps~PBps
.1 GBps.1 GBps
Physics Physics data data
cachecache
~1 GBps~1 GBps
~1 GBps~1 GBps
WorkstationsWorkstations
OC192 = 9.9 Gbps
Graphics courtesy of Harvey Newman @ Caltech
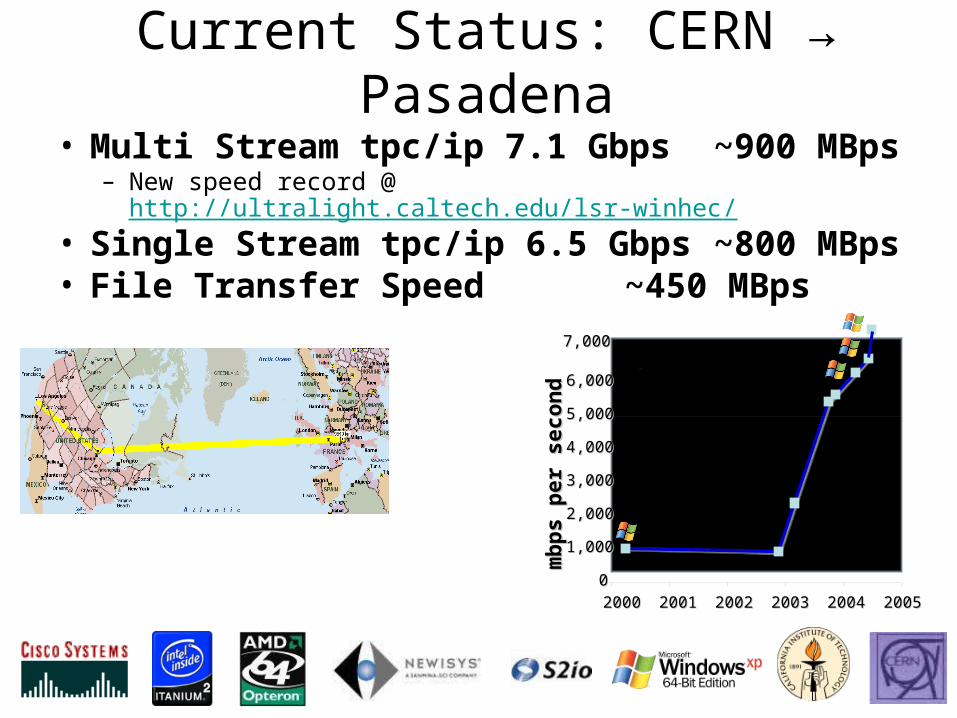
Current Status: CERN → Pasadena
• Multi Stream tpc/ip 7.1 Gbps ~900 MBps – New speed record @ http://ultralight.caltech.edu/lsr-winhec/
• Single Stream tpc/ip 6.5 Gbps ~800 MBps • File Transfer Speed ~450 MBps
mb
ps p
er
secon
dm
bp
s p
er
secon
d00
1,0001,000
2,0002,000
3,0003,000
4,0004,000
5,0005,000
6,0006,000
7,0007,000
20002000 20012001 20022002 20032003 20042004 20052005
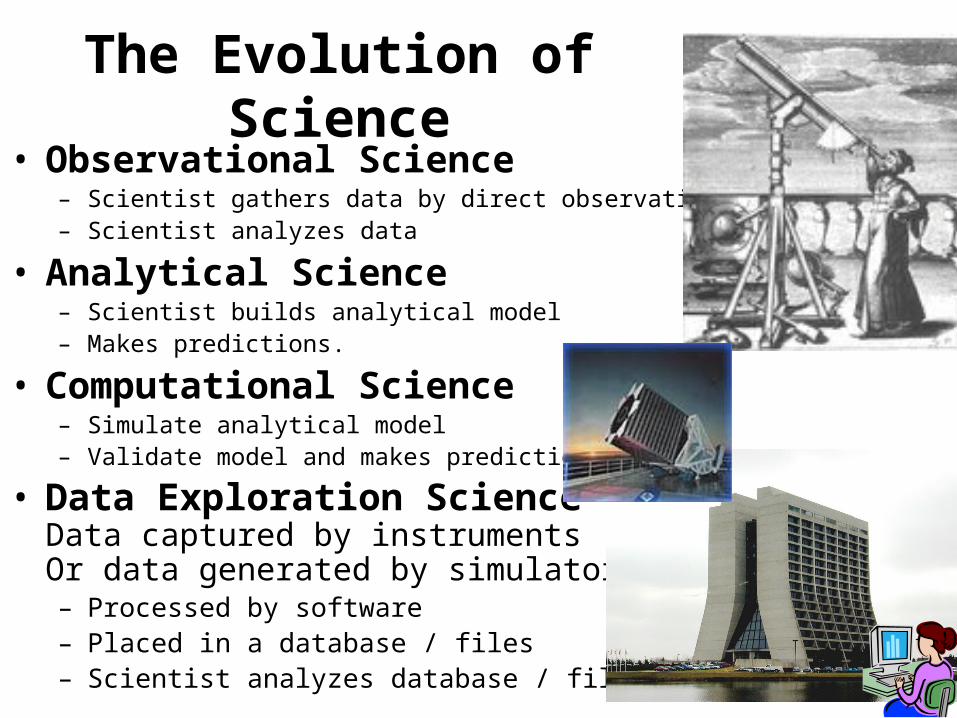
The Evolution of Science• Observational Science
– Scientist gathers data by direct observation– Scientist analyzes data
• Analytical Science – Scientist builds analytical model– Makes predictions.
• Computational Science – Simulate analytical model– Validate model and makes predictions
• Data Exploration Science Data captured by instrumentsOr data generated by simulator– Processed by software– Placed in a database / files– Scientist analyzes database / files
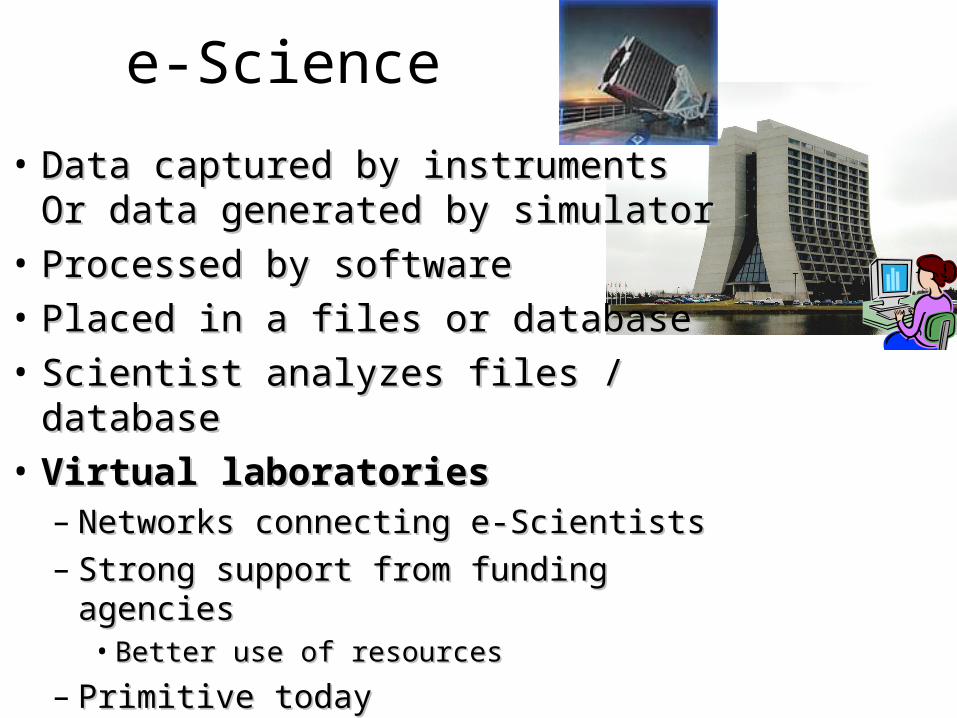
e-Science
• Data captured by instrumentsData captured by instrumentsOr data generated by simulatorOr data generated by simulator
• Processed by softwareProcessed by software
• Placed in a files or databasePlaced in a files or database
• Scientist analyzes files / databaseScientist analyzes files / database
• Virtual laboratoriesVirtual laboratories– Networks connecting e-ScientistsNetworks connecting e-Scientists– Strong support from funding agenciesStrong support from funding agencies
• Better use of resourcesBetter use of resources
– Primitive todayPrimitive today
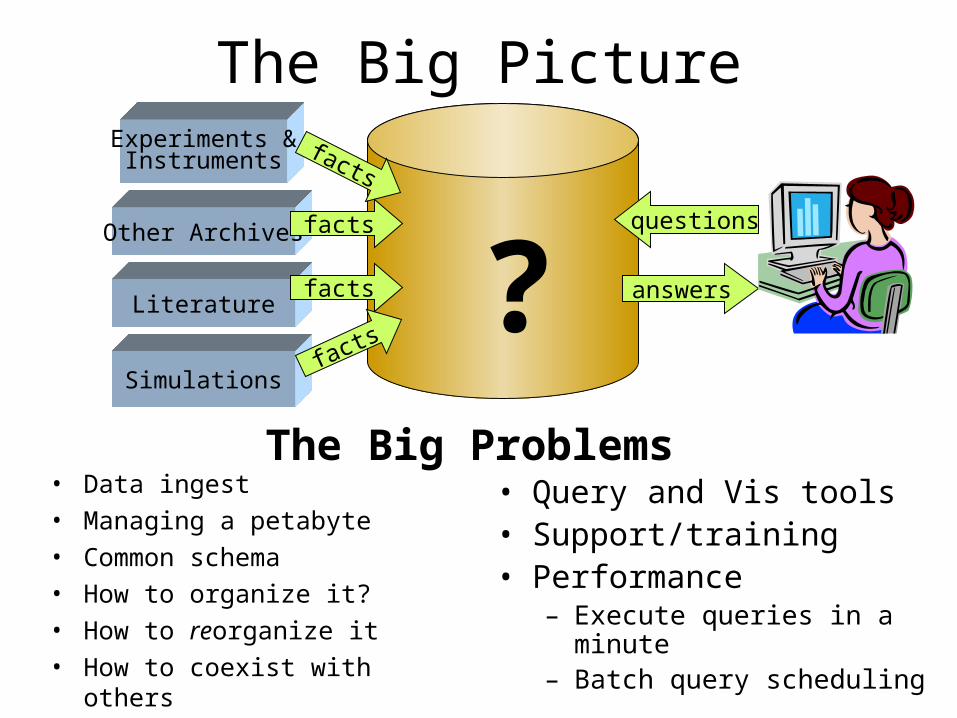
The Big PictureExperiments &
Instruments
Simulationsfacts
facts
answers
questions
• Data ingest • Managing a petabyte• Common schema• How to organize it?• How to reorganize it• How to coexist with others
• Query and Vis tools • Support/training• Performance
– Execute queries in a minute – Batch query scheduling
?The Big Problems
Literature
Other Archives facts
facts
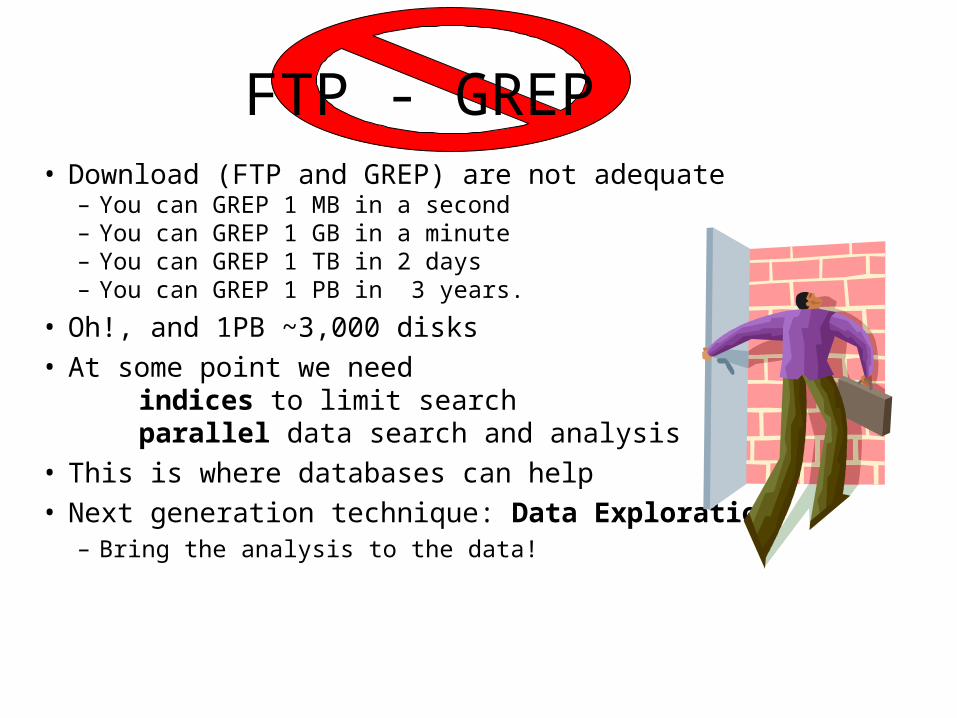
FTP - GREP • Download (FTP and GREP) are not adequate
– You can GREP 1 MB in a second– You can GREP 1 GB in a minute – You can GREP 1 TB in 2 days– You can GREP 1 PB in 3 years.
• Oh!, and 1PB ~3,000 disks
• At some point we need indices to limit searchparallel data search and analysis
• This is where databases can help
• Next generation technique: Data Exploration– Bring the analysis to the data!

Next-Generation Data Analysis• Looking for
– Needles in haystacks – the Higgs particle– Haystacks: Dark matter, Dark energy
• Needles are easier than haystacks• Global statistics have poor scaling
– Correlation functions are N2, likelihood techniques N3
• As data and computers grow at same rate, we can only keep up with N logN
• A way out? – Relax notion of optimal
(data is fuzzy, answers are approximate)– Don’t assume infinite computational resources or memory
• Combination of statistics & computer science
Analysis and Databases• Much statistical analysis deals with
– Creating uniform samples – – data filtering– Assembling relevant subsets– Estimating completeness – censoring bad data– Counting and building histograms– Generating Monte-Carlo subsets– Likelihood calculations– Hypothesis testing
• Traditionally these are performed on files• Most of these tasks are much better done inside a database• Move Mohamed to the mountain, not the mountain to Mohamed.
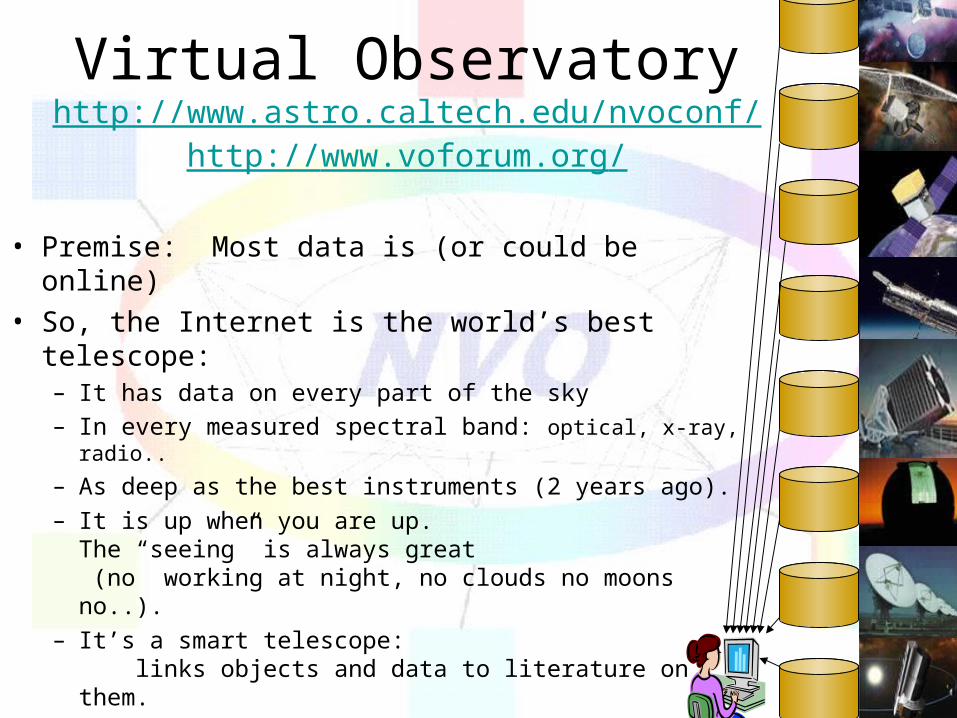
Virtual Observatoryhttp://www.astro.caltech.edu/nvoconf/
http://www.voforum.org/
• Premise: Most data is (or could be online)• So, the Internet is the world’s best telescope:
– It has data on every part of the sky– In every measured spectral band: optical, x-ray, radio..
– As deep as the best instruments (2 years ago).– It is up when you are up.
The “seeing” is always great (no working at night, no clouds no moons no..).
– It’s a smart telescope: links objects and data to literature on them.
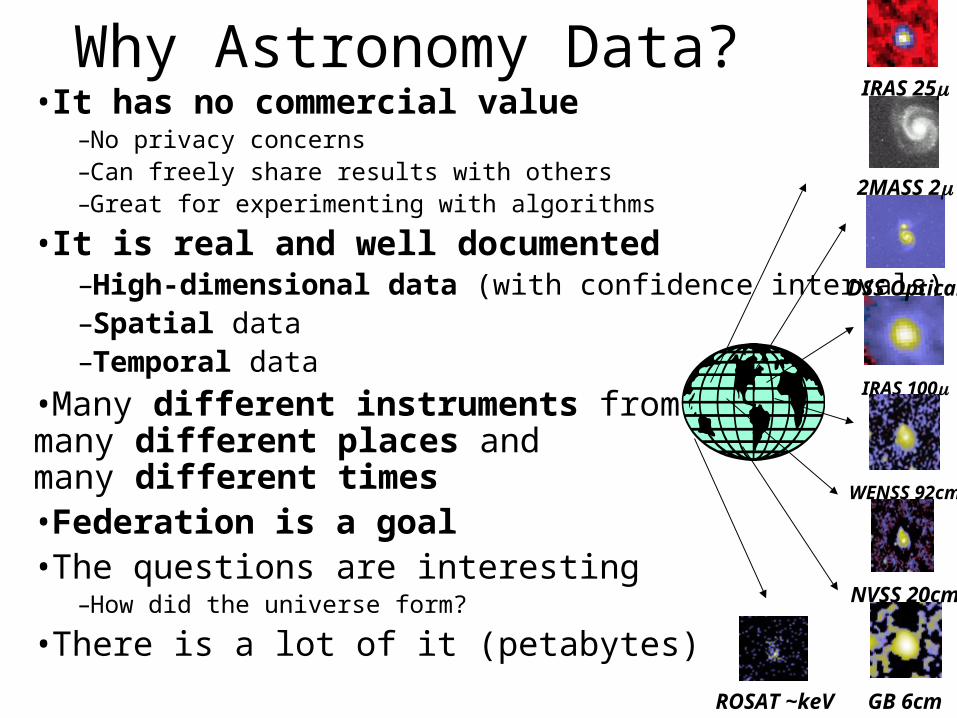
Why Astronomy Data?•It has no commercial value
–No privacy concerns–Can freely share results with others–Great for experimenting with algorithms
•It is real and well documented–High-dimensional data (with confidence intervals)–Spatial data–Temporal data
•Many different instruments from many different places and many different times•Federation is a goal•The questions are interesting
–How did the universe form?
•There is a lot of it (petabytes)
IRAS 100
ROSAT ~keV
DSS Optical
2MASS 2
IRAS 25
NVSS 20cm
WENSS 92cm
GB 6cm
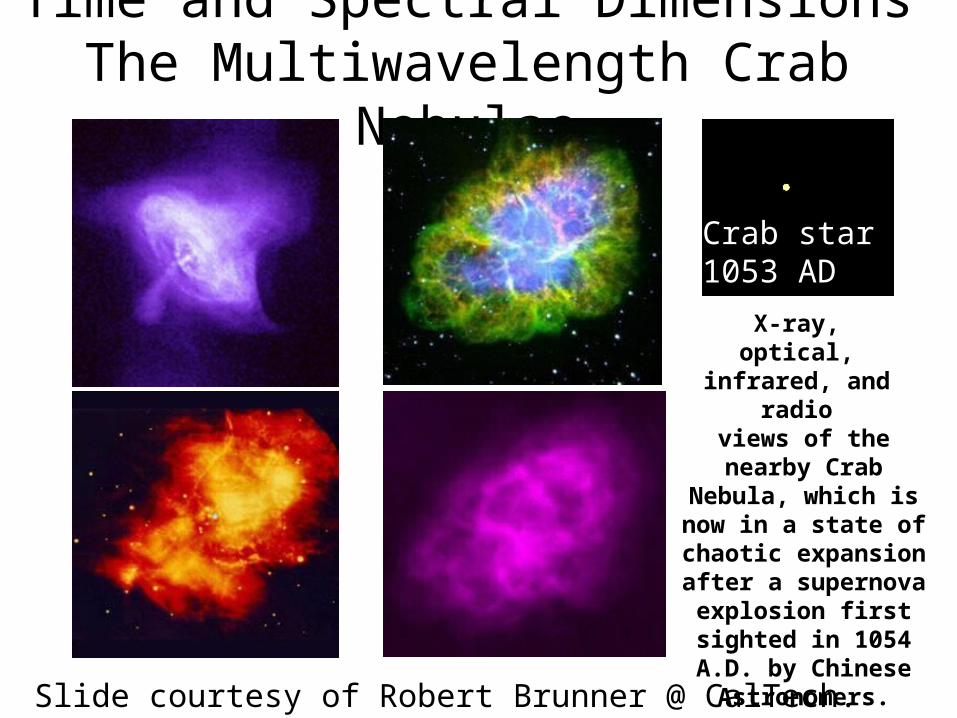
Time and Spectral DimensionsThe Multiwavelength Crab Nebulae
X-ray, optical,
infrared, and radio
views of the nearby Crab
Nebula, which is now in a state of
chaotic expansion after a supernova
explosion first sighted in 1054 A.D. by Chinese Astronomers.Slide courtesy of Robert Brunner @ CalTech.
Crab star 1053 AD
Memory in GB
1.0
10.0
100.0
1000.0
10000.0
100000.0
0 10 20 30 40 50 60 70 80 90 100
No of galaxies in Millions
CP
U t
ime
in h
rs1
4
32
256
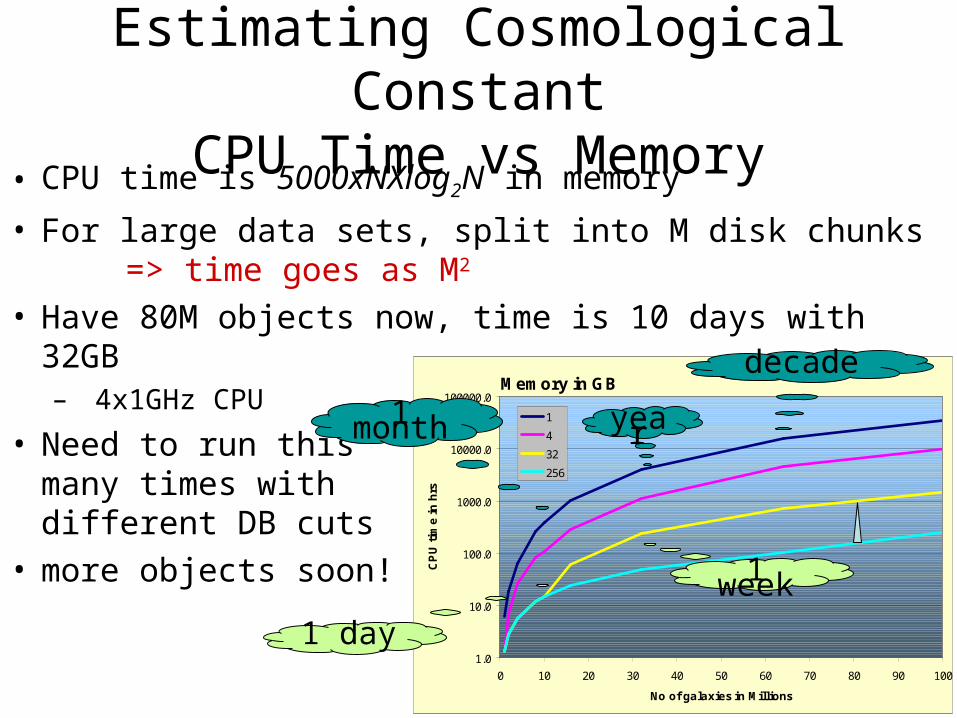
Estimating Cosmological ConstantCPU Time vs Memory
• CPU time is 5000xNXlog2N in memory
• For large data sets, split into M disk chunks => time goes as M2
• Have 80M objects now, time is 10 days with 32GB– 4x1GHz CPU
• Need to run thismany times withdifferent DB cuts
• more objects soon!
year
decade
1 week
1 day
1 month
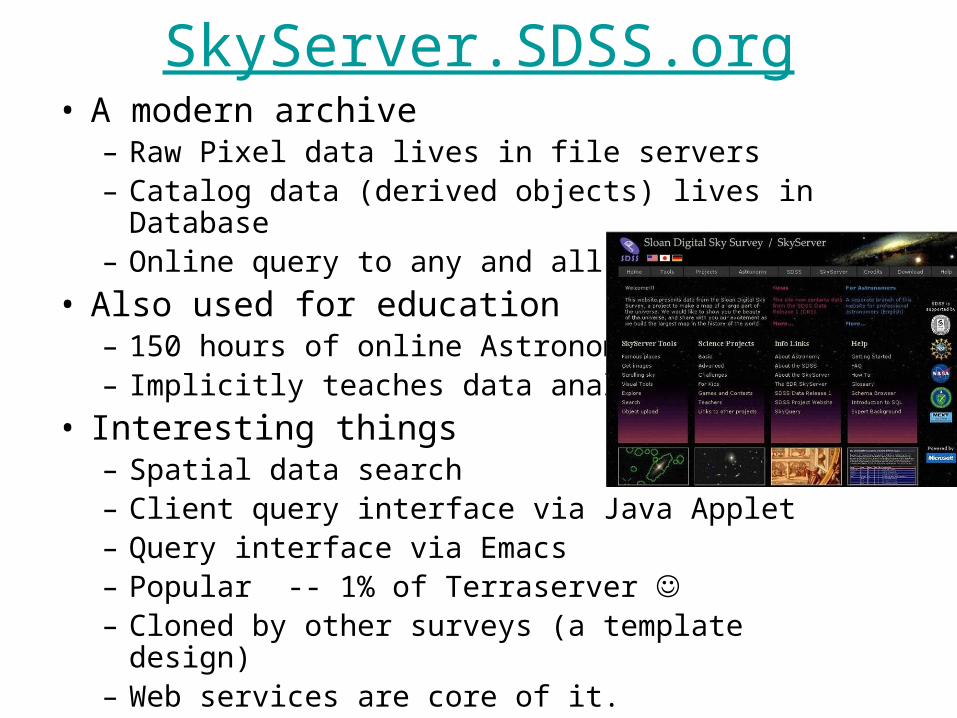
SkyServer.SDSS.org• A modern archive
– Raw Pixel data lives in file servers– Catalog data (derived objects) lives in Database– Online query to any and all
• Also used for education– 150 hours of online Astronomy– Implicitly teaches data analysis
• Interesting things– Spatial data search– Client query interface via Java Applet– Query interface via Emacs– Popular -- 1% of Terraserver – Cloned by other surveys (a template design) – Web services are core of it.
Demo of SkyServer
• Shows standard web server
• Pixel/image data
• Point and click
• Explore one object
• Explore sets of objects (data mining)
Federation
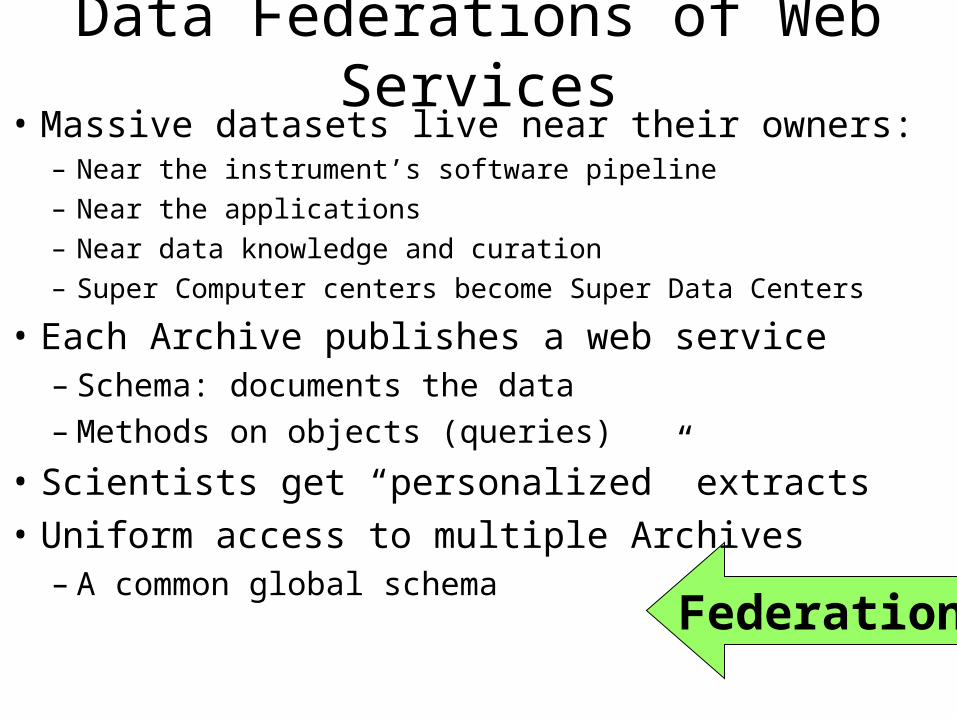
Data Federations of Web Services• Massive datasets live near their owners:
– Near the instrument’s software pipeline– Near the applications– Near data knowledge and curation– Super Computer centers become Super Data Centers
• Each Archive publishes a web service– Schema: documents the data– Methods on objects (queries)
• Scientists get “personalized” extracts
• Uniform access to multiple Archives– A common global schema
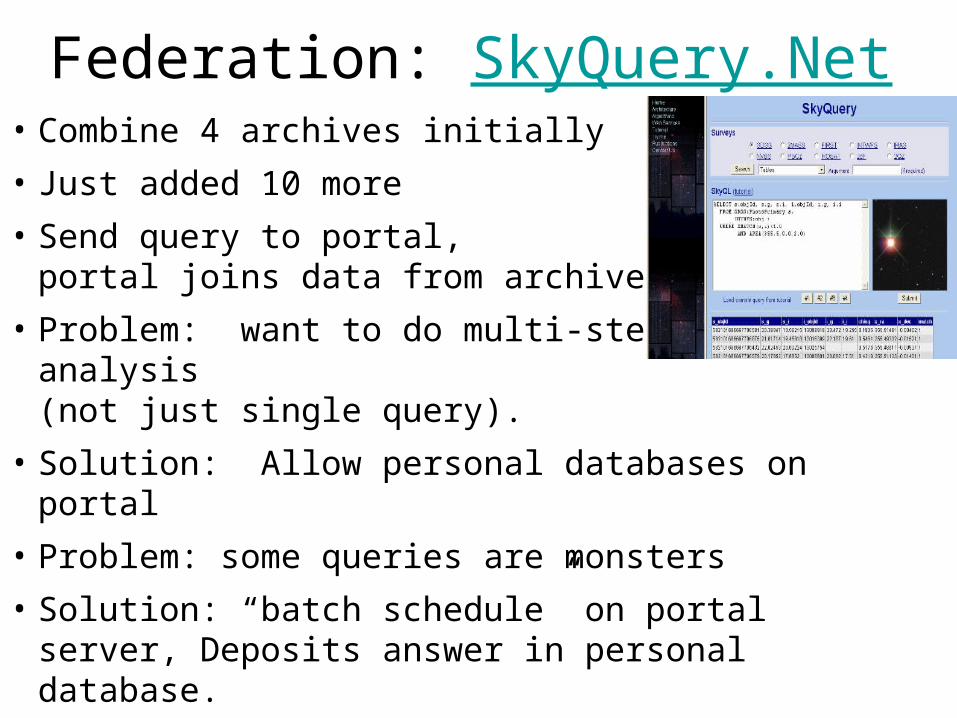
Federation: SkyQuery.Net• Combine 4 archives initially
• Just added 10 more
• Send query to portal, portal joins data from archives.
• Problem: want to do multi-step data analysis (not just single query).
• Solution: Allow personal databases on portal
• Problem: some queries are monsters
• Solution: “batch schedule” on portal server, Deposits answer in personal database.
2MASS
INT
SDSS
FIRST
SkyQueryPortal
ImageCutout
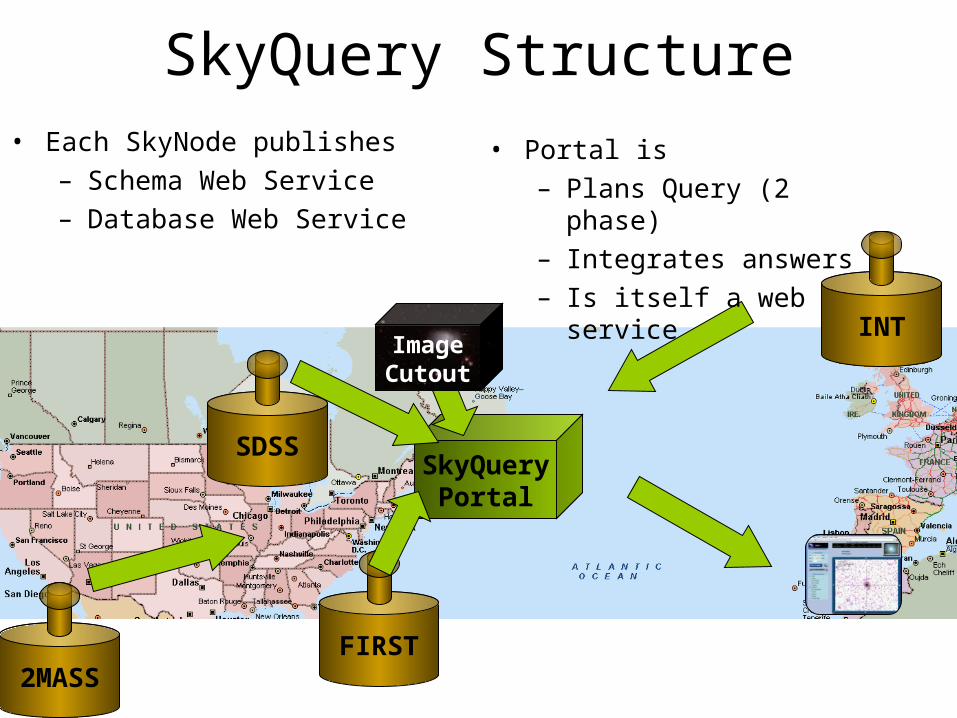
SkyQuery Structure• Each SkyNode publishes
– Schema Web Service– Database Web Service
• Portal is – Plans Query (2 phase) – Integrates answers– Is itself a web service

SkyQuery: http://skyquery.net/• Distributed Query tool using a set of web services• Four astronomy archives from
Pasadena, Chicago, Baltimore, Cambridge (England).• Feasibility study, built in 6 weeks
– Tanu Malik (JHU CS grad student) – Tamas Budavari (JHU astro postdoc)– With help from Szalay, Thakar, Gray
• Implemented in C# and .NET• Allows queries like:
SELECT o.objId, o.r, o.type, t.objId FROM SDSS:PhotoPrimary o,
TWOMASS:PhotoPrimary t WHERE XMATCH(o,t)<3.5
AND AREA(181.3,-0.76,6.5) AND o.type=3 and (o.I - t.m_j)>2
2MASS
INT
SDSS
FIRST
SkyQueryPortal
ImageCutout
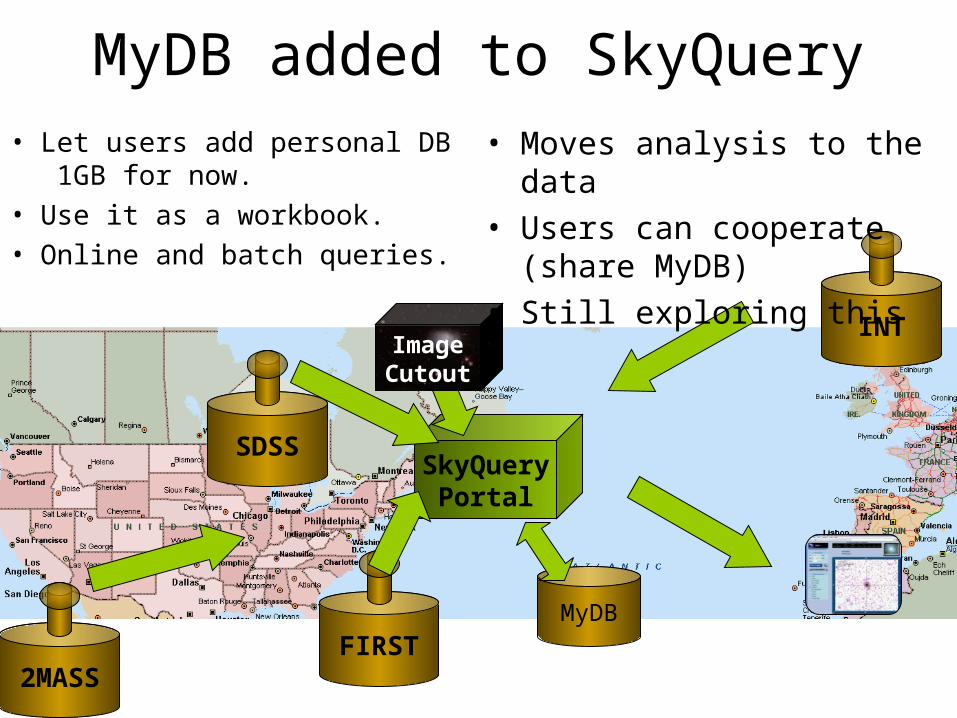
MyDB added to SkyQuery• Let users add personal DB
1GB for now.• Use it as a workbook.• Online and batch queries.
• Moves analysis to the data• Users can cooperate
(share MyDB)• Still exploring this
MyDB

The Big PictureExperiments &
Instruments
Simulationsfacts
facts
answers
questions
• Data ingest • Managing a petabyte• Common schema• How to organize it?• How to reorganize it• How to coexist with others
• Query and Vis tools • Support/training• Performance
– Execute queries in a minute – Batch query scheduling
?The Big Problems
Literature
Other Archives facts
facts