Embed Size (px)
Citation preview

World Development Vol. 74, pp. 333–351, 20150305-750X/� 2015 Elsevier Ltd. All rights reserved.
www.elsevier.com/locate/worlddevhttp://dx.doi.org/10.1016/j.worlddev.2015.05.010
The Dark Side of Chinese Growth: Declining Social Capital
and Well-Being in Times of Economic Boom
STEFANO BARTOLINI a and FRANCESCO SARRACINO b,*
a University of Siena, Italyb Research Division – STATEC, Luxembourg
Summary. — Over the last two decades, subjective well-being in China declined. Using data from the World Values Survey, we identifypredictors of the trend in life satisfaction in China during 1990–2007. Social comparisons and the decline of social capital explain thedecrease in well-being, and they are strictly connected to the increasing orientation of Chinese people toward materialistic values.The increasing role of social comparisons is also a key factor in the increase of well-being inequalities between income classes.� 2015 Elsevier Ltd. All rights reserved.
Key words — China, Easterlin paradox, economic growth, life satisfaction, social capital, Oaxaca–Blinder decomposition
* The authors would like to thank Ronald Inglehart, Andrew Clark, Chris
Welzel, Edouard Ponarin, Chris Swader, Roberto Foa, Malgorzata
Mikucka, Serban Tanasa, Bogdan Voicu and the colleagues of the
Laboratory for Comparative Social Research (Russia), of the GESIS
Leibniz Institute for the Social Sciences (Germany) and of STATEC
(Luxembourg) for their useful comments and constant support. Special
thanks to Josh Kjerulf Dubrow for his precious help with previous
versions of this work. Stefano Bartolini gratefully acknowledges the
support offered by CEPS/INSTEAD. The article was prepared within the
framework of a subsidy granted to the HSE by the Government of the
Russian Federation for the implementation of the Global Competitiveness
Program. The usual disclaimers apply. Final revision accepted: May 19,2015.
1. INTRODUCTION
Whether economic growth leads to higher well-being in thelong run—the so-called Easterlin paradox—is a disputed issue.Less controversial is the finding that, over time, social capitalis more closely associated to subjective well-being (SWB) thaneconomic growth. This suggests that we should explore thepossibility that durable improvements in the quality of liferequire new policies for building social capital. Most of theprevious studies focus on developed countries, whereas studiesfrom developing countries are rare. As such, the extant empir-ical literature says little about the generalizability of this con-clusion and the extent to which it concerns only developednations.
China is a crucial case for empirical research on this topicbecause it counts a large share of the world population, andbecause if there is a country where economic growth shouldhave played a relevant role for people’s well-being, it is China.The data we use begins in 1990, right after the TiananmenSquare Massacre, in a still extremely poor country oppressedby a dictatorship. Two decades later, China exhibits increasingsegments of western-style opulence, generally improved stan-dards of life, and greater political freedom, when comparedto the 1980s. The living conditions of hundreds of millionsof Chinese have significantly improved since 1990s withGDP per-capita growing by about 10% per year. During1990–2010, sustained Chinese growth dramatically decreasedthe number of people living with less than 1.25 US$ per day,while the percentage of rural population with access toimproved water sources raised from 56% to 85%. In the sameperiod the average annual growth of household final consump-tion expenditure was 6.5%. 1 China features all the ingredientsfor a big leap forward in subjective well-being.
Yet, these objective records are in striking contrast withthose from subjective perceptions. China is perhaps theworld’s largest example of the Easterlin paradox: Figure 1shows that, during 1990–2007, average life satisfaction sub-stantially dropped (Easterlin, Morgan, Switek, & Wang,2012).
Using data from the World Values Survey, we empiricallyexplore the factors that predict the disappointing trend ofwell-being in China. We investigate determinants of the
333
long-term trend of subjective well-being (1990–2007) and itsshorter term variations (1990–2001 and 2001–07). Moreover,we identify the winners and losers of economic growth by ana-lyzing what shaped the well-being in China’s lower, middle,and upper classes. We adopt the Blinder–Oaxaca method todecompose the variation of well-being over time and amongincome classes in two components: a part explained by thevariation in the endowments of each variable and a partexplained by changes in people’s preferences.
Our findings suggest that objective data do not adequatelycapture the increase in the importance of social comparisonsand the decline of social capital. These two powerful driversof the decline of well-being appear to be strictly connectedto the increasing orientation of Chinese people toward materi-alistic values. Our results suggest that Chinese values are prob-ably following a path launched by Deng Xiaoping at thebeginning of the Chinese transition to capitalism and symbol-ized by the motto, “to get rich is glorious”. Probably Deng didnot imagine that the kind of values he was promoting wouldbe so successful in frustrating the well-being of Chinese peo-ple, despite a glorious economic take-off. Furthermore, eco-nomic growth resulted in higher well-being inequalitybetween income classes: those in the lowest three deciles andthe middle-class experienced a marked reduction inwell-being, whereas people in the three highest deciles of theincome distribution experienced a slight improvement in theirconditions. The almost flat relationship between income and

500
1000
1500
2000
GD
P pe
r cap
ita
6.6
6.8
77.
27.
4Av
erag
e lif
e sa
tisfa
ctio
n
1990 1995 2000 2005 2010year survey
life satisfactionGDP per capita
Figure 1. Life satisfaction and income across time*. *Data about GDP per
capita (2000 US$) are extracted from the World Development Indicators,
The World Bank, http://data.worldbank.org/data-catalog/world-develop-
ment-indicators.
334 WORLD DEVELOPMENT
life satisfaction observed in 1990 turned into a steep relation-ship at the end of 2007.
Our figures from China resemble those from the US docu-mented by Bartolini, Bilancini, and Pugno, 2013: the decliningtrend of happiness in the US is almost entirely predicted bysocial comparisons and by the decline in social capital. Insum, the social qualities of economic growth are key to declin-ing SWB in the most celebrated growth stories of the past fewdecades, both in the developed and the developing world.
The paper is organized as follows: Section 2 reviews the lit-erature related to this paper. Section 3 illustrates the dataavailable for the present study and the relevant variables. Sec-tion 4 discusses the relevant methodological aspects. Section 5presents our findings about the evolution over time of subjec-tive well-being in the overall period and across sub-periodsand income classes. Section 6 concludes.
2. BACKGROUND
The relationship between economic growth and well-beingraised a lively debate in the past few decades. Easterlin(1974) pointed out that the US economic growth from the Sec-ond World War onward did not bring about significantimprovements in Americans’ SWB. This evidence underwentintensive scrutiny. The availability of large data-sets thatinclude several countries and long periods of time allowedscholars to test the existence of the paradox. Some scholarshave confirmed the paradox, and clarified that, in the shortrun, economic growth and well-being are associated, whereasin the long-run this positive relationship vanishes (Easterlin& Angelescu, 2009; Easterlin, Angelescu, Switek, Sawangfa,& Zweig, 2010). Some others have contested the existence ofthe paradox itself and claim that economic growth bringsabout better lives (Inglehart, Foa, Peterson, & Welzel, 2008;Sacks, Stevenson, & Wolfers, 2012, cha 3; Stevenson &Wolfers, 2008; Veenhoven & Vergunst, 2013).
Independently from whether economic growth matters forwell-being, social capital seems to matter more. The literaturedocuments that social capital (SC) is an important ingredientof people’s well-being (Helliwell, 2003, 2008; Uhlaner, 1989).In particular the quality of personal relationships has a large,substantive impact on well-being (Helliwell, 2006; Helliwell &
Putnam, 2004; Becchetti, Pelloni, & Rossetti, 2008; Bruni &Stanca, 2008).
Beyond the cross-sectional evidence, it is relevant that SCand SWB are also related over time. Recently, Bartolini,Bilancini, and Pugno (2013) showed that the decline in a widerange of measures of SC predicts the decline in US happinessover the past 30 years. This suggests that the erosion of socialcapital (Putnam, 2000) may be an important component of theexplanation of the American version of the Easterlin paradox,a result further confirmed for Germany (Bartolini, Bilancini, &Sarracino, 2013). Moreover, Bartolini and Sarracino (2014)show that, in a large sample of countries, economic growthis not correlated with the trends of well-being in the longrun, whereas such trends are strongly and significantly corre-lated with the trends of social capital. These findings aremainly drawn from developed countries, while the extent towhich social capital is associated over time with SWB in devel-oping countries remains an open issue.
An important contribution to address such issue comes fromChina because of the size and of the pace of its economicboom. There are at least two papers analyzing the trend ofSWB in China: Brockmann, Delhey, Welzel, and Yuan(2009) and Easterlin et al. (2012). Both papers stress theimportance of social comparisons as a cause for the disap-pointing trend of life satisfaction. The main idea is that eco-nomic growth brought about a dramatic improvement ineconomic conditions by raising people’s expectations abouttheir perspective situation. Chinese growth wenthand-in-hand with rapidly increasing income inequality. Theresult is that many Chinese people saw their absolute condi-tions improving, but not in relative terms. Their economicposition worsened when compared to that of large segmentsof the population, thus resulting in a decrease in well-being.
Moreover, Easterlin et al. (2012) emphasized the role of thedecay in the safety net as a prime cause of the decline inwell-being. They point out the similarity of the Chinese trendof well-being with those from Eastern European countries thatexperienced the transition from socialism to capitalism. WhatChina and Eastern Europe have in common is that, undersocialism, workers were guaranteed jobs and provided withan extensive safety net including health care, child care, andpensions. Post 1989 privatization was typically accompaniedby the erosion of the safety net, which in turn negativelyimpacted well-being.
We emphasize that the erosion of safety net may have been aconsequence of the decline in social capital and not only of thetransition to capitalism. Indeed, industrial revolutions arealways associated to a decline in the informal safety net con-nected to decaying familiar and communitarian relationships.Despite being the first experiment of transition from a socialistto a capitalist economy managed by a Communist party, theChinese take-off shares many features of all industrial revolu-tions: rapid urbanization, erosion of traditional institutions,pollution, reduced farmers’ access to land, and an increaseof income inequality. The diminished water flow and the pol-lution of the Yellow river basin—the core of Chinese agricul-ture—result from the industrial expansion and they are thecontemporary version of the environmental devastation thataccompanied the British Industrial Revolution. The expropri-ation of agricultural land for industrial purposes, that pro-vokes every year thousands of riots, has the same effect ofthe enclosures. 2 The reduction of the access to land pushesthe lower rural classes to feed the ranks of low-cost urbanlabor force on which the industrial take-off is based.
Thus, China mirrors the stylized facts typical of all indus-trial revolutions. These processes are associated with extensive

THE DARK SIDE OF CHINESE GROWTH 335
erosion of social capital and rapid changes in people’s values.For example, urbanization is a well-known cause of erosion ofsocial capital in rural areas. Between 100 and 200 million Chi-nese urban immigrants, lost a large part of their safety netrelated to their community. These phenomena, well-knownto development economists (Polanyi, 1968; Williamson,1995), clearly emerge from our figures on the decline of Chi-nese social capital and the upsurge of materialism. In this con-text, the transition to capitalism in China appears to haveexacerbated the destruction of safety net associated to thedecline of shared values and networks. This decline, influenceswell-being in various ways, well beyond the erosion of safetynet.
Besides Brockmann et al. (2009) and Easterlin et al. (2012),who analyze the trend of SWB, there is a number of contribu-tions on the relationship between quality of life and incomeinequality, government accountability, and materialistic val-ues in China. Knight and Gunatilaka (2011), using survey datafrom 2002, conclude that income comparisons have a domi-nant impact on Chinese SWB. Jiang, Lu, and Sato (2012)show that income inequality between urban migrants andurban residents has a negative impact on SWB. Similarly,Knight and Gunatilaka (2010) argue that the relatively greatunhappiness of urban migrants is largely explained by the feel-ings of relative deprivation that they develop. These feelingsare drawn from their reference groups of their new urban sur-roundings, characterized by greater income inequality. Thesepapers suggest that higher income inequality may have a neg-ative impact on SWB by exacerbating the importance “to keepup with the Zhous”. This is despite the fact that the Chinesemay perceive inequality as more fair than unfair, and as pro-viding chances for economic advancement of the industriousand ambitious (Whyte, 2010). Moreover, Cheung and Leung(2007) document that government accountability at the begin-ning of the millennium had significant effects on the life satis-faction of a sample of Beijing residents. Shek (2010) reviewsseveral studies relating the quality of life in China to macrosocietal conditions, family and individual quality of life.Finally, Steele and Lynch (2013a) show that life satisfactionin the past two decades became increasingly dependent onindividualist factors rather than collectivistic ones.
The value shift of Chinese people has been the object of var-ious studies on materialism. Podoshen, Li, and Zhang (2011)examined the rise of materialism and conspicuous consump-tion in post-revolution China. Using survey data, they foundsignificant differences in both materialism and conspicuousconsumption, with Chinese young adults scoring higher inboth variables. Only a few years before, Schaefer, Hermans,and Parker (2004) had found Chinese teenagers to be lessmaterialistic than teens in both Japan and the United States.This suggests a very quick spread of materialism in China.As for mature consumers, the situation does not seem differ-ent: Wei and Talpade (2009) found that overall, Chinesemature consumers are more materialistic than their Americancounterparts. A research by IPSOS found that the share ofChinese people agreeing that “I measure my success by thethings I own” was the largest (71%) among the 20 countriesanalyzed. 3
Consistently with these studies, we refer to materialism as apersonal value system attributing a high priority in life goals toextrinsic motivations and low priority to intrinsic motivations.The distinction between the two refers, respectively, to theinstrumentality—or lack thereof—of the motivations fordoing something about it (Kasser, 2002). The term extrinsicmeans that motivations are external to an activity, such as suc-cess, money, status, and image. Conversely, “one is said to be
intrinsically motivated to perform an activity when onereceives no apparent reward except the activity itself” (Deci,1971, p. 105).
Our work contributes to previous literature on the trend ofSWB in China in various regards. We propose an explanationof the life satisfaction gap based on a systematic analysis of thechanges over time in endowments and in preferences of thecorrelates of life satisfaction, using the Oaxaca–Blinderdecomposition. We focus on the role of social capital as a pre-dictor of well-being, along with a standard set of regressorsincluding social comparisons, employment status, freedomand control over one’s life and health. We adopt individuallevel data using a longer time-span than previous studies.Finally, we improve on the previous literature by explaining:(i) the changes in the distribution of SWB among incomeclasses; (ii) the decline of life satisfaction during 1990–2001and its recovery from 2001 onward.
3. DATA
We adopt data from the WVS (2009), a data-set providingcomparable information about economic, social, cultural,and political characteristics, surveying nationally representa-tive samples in each wave. This extensive data-set providesnational-level time-series on social capital, subjectivewell-being, and socio-demographic and economic controlsconcerning—among others—China from the early 1990s tothe year 2007.
The Chinese sample is made approximately of 1,000 obser-vations in each wave. The sample was selected by quota afterstratifying the population universe according to residence,gender, age, occupation, and education (WVS, 2009).
Subjective well-being (SWB) is proxied by reported life sat-isfaction, a variable ranging from 1 = “dissatisfied” to 10 =“satisfied” depending on the answers to the following ques-tion: “all things considered, how satisfied are you with yourlife as a whole these days?”. This data-set provides alsoanother proxy of SWB, namely feelings of happiness. How-ever, in the present article we will focus only on life satisfac-tion. The reasons are mainly two: first, life satisfaction isreported on a ten points scale, whereas happiness is on a fourpoint scale. Hence, the former provides a richer and more dif-ferentiated information than the second one. Second, althoughthe evidence from the two variables is usually consistent, it iscommonly held that happiness provides a more emotionalmeasure of well-being. On the contrary, life satisfactionreflects a more cognitive evaluation of well-being and is there-fore regarded as more reliable (Diener, 2006).
The three main explanatory variables of life satisfaction arehousehold income, financial dissatisfaction and social capital.Income is measured with an ordered scale of income intervals.Financial dissatisfaction is observed after inverting the scale ofanswers to the question: “how satisfied are you with the finan-cial situation of your household?” After recoding, the answersrange on a 10 points scale where higher numbers stand forgreater dissatisfaction.
We document an increasing trend of financial dissatisfactionthat may appear astonishing in a country that experiencedsuch an economic boom. As also noticed by Brockmannet al. (2009), such trend suggests that financial dissatisfactionis not shaped by absolute income. More specifically,D’Ambrosio and Frick (2012); D’Ambrosio and Frick(2007) show in a panel analysis that dissatisfaction is weaklypredicted by absolute income, and strongly correlates with ameasure of relative deprivation. In other words, financial

336 WORLD DEVELOPMENT
dissatisfaction is largely shaped by relative rather than abso-lute standards, thus reflecting social comparisons, i.e., individ-ual achievements with respect to what other people—withwhom the respondent compares herself—get. Moreover,including absolute income in our life satisfaction equationallows to control for its possible confounding effects on finan-cial dissatisfaction, thus leaving the latter to mirror relativeconcerns.
The (OECD, 2001, p. 41), consistently with Putnam (2000)defines social capital (SC) as “networks together with sharednorms, values and understandings that facilitateco-operation within or among groups”. To observe SC weuse proxies that are generally accepted and applied by the lit-erature on the argument: generalized trust, a measure of civic-ness, and associational activity (Costa & Kahn, 2003; Paxton,1999). 4
Trust in others is observed through answers to the followingquestion: “Generally speaking, would you say that most peo-ple can be trusted, or that you can’t be too careful in dealingwith people?” The resulting dichotomous variable is set to 1 ifthe respondent answers positively, 0 otherwise (Knack &Keefer, 1997).
The index of civic cooperation is based on answers to ques-tions if “claiming government benefits which you are not enti-tled to”, “avoiding a fare on public transport”, “cheating ontaxes if you have the chance”, or “accepting a bribe”, areacceptable. Answers to these questions range on a 1 (never jus-tifiable) to 10 (always justifiable) scale. For the purposes ofpresent work, each of these variables has been recoded so thatlarger values stand for stronger norms of civic cooperation. Toconstruct the variable we first run a factor analysis on the fourquestions and finally we generated an index of civic coopera-tion as the average of the four initial variables (for moredetails, please refer to the Appendix I). The index of civiccooperation mirrors the scale of its four original variables: itranges on a 10-point scale where higher values stand for highersense of civicness.
Our third proxy of SC is the respondent’s participation invarious kinds of groups and associations. Indeed, the WVSincludes a battery of questions concerning whether peoplebelong or actively participate in groups or associations. Thelist of organizations prompted during the interview is quitelong and contains—among others—religious, cultural, sport,professional, environmental, human rights, and political asso-ciations (for the complete list of groups or associations see theAppendix J). We measure associational activity with adichotomous variable set to 1 if the respondent participatesor performs unpaid voluntary work for at least one of thementioned groups or associations, 0 otherwise.
To allow comparison with previous studies, we furtherincluded controls for perceived freedom of choice and controlover one’s own life. This variable is observed on a scale from 1(“none at all”) to 10 (“a great deal”) to indicate how muchfreedom of choice the respondent feels to have over his/herown life.
Our key explanatory variables allow to study the evolutionof materialism over time because, while freedom of choice orcomponents of social capital as associational activities,civic-minded behavior and trust are intrinsically motivated, astrong emphasis on income and social comparisons is a typicalmaterialistic feature. Therefore we interpret an increasingdependence of Chinese well-being on extrinsically motivatedfactors and a lesser dependence on intrinsically motivatedones, as reflecting shifts in life priorities connected to thespread of materialistic values.
Finally, we included a standard set of socio-demographiccontrols such as gender, age, marital, and employment status,reported health and the region where the interview was con-ducted. In the first wave in 1990 the surveyed sample largelyconsisted of people from urban areas, while residents in ruralareas were seldom reached. In the subsequent waves a repre-sentative sampling of the urban and rural population wasensured. To account for the potential bias this could cause,we have included a control for the region where the interviewwas taken. Regional dummies allow to control for unobserveddifferences across regions and, together with the othersocio-economic variables, account for the potential differencesamong the initial and the subsequent samples. Furthermore,the possible bias toward an over-representation of urban pop-ulation in the first wave does not undermine our main findings,but would eventually strengthen them (see Section 5). Table 1summarizes the main variables used in this study together withsome descriptive statistics.
Percentages of missing data are on average below 10% thusthey do not raise concerns of seriously biasing the estimates(Allison, 2001; Little & Rubin, 2002; Schafer, 1997).
4. METHODOLOGICAL ASPECTS
Our aim is to predict the trend of SWB in China byquantifying the relative importance of the changes in thepredictors of life satisfaction. For this purpose we use theBlinder–Oaxaca decomposition. This technique allows usto decompose the well-being gap between the initial andthe final year of observations and to identify the extentto which changes over time in the levels and in the coeffi-cients of life satisfaction regressors explain the well-beinggap.
The Blinder–Oaxaca decomposition has been developed inthe early ’70s by Blinder (1973) and Oaxaca (1973) to studydiscrimination between men and women in the labor market.Recently, it has been applied also in other fields, includingthe literature on subjective well-being (Becchetti, Massari, &Naticchioni, 2010; Helliwell & Barrington-Leigh, 2010;Sarracino, 2012).
The decomposition method allows us to study group dif-ferences in an outcome variable by dividing its differential intwo parts: the explained one, accounting for differences inobserved characteristics of the population and the unex-plained one, measuring the differences in the coefficientsbetween two groups. The latter is generally considered a dis-crimination measure (Jann, 2008). For the purpose of thepresent article, the decomposition allows to identify howmuch of the overall differential in the average subjectivewell-being between two years can be ascribed to differencesin the set of characteristics as presented in Eqn. 1 (theexplained part) and to differences in how these characteris-tics are evaluated (the unexplained part).
We are aware that the ordered nature of the dependent vari-able would require ordered probit or logit techniques. How-ever, we adopted a linear model for ease of computation andcomparison of the coefficients across years. Moreover, therecent literature on subjective well-being demonstrated that,when the dependent variable has a sufficient number of cate-gories, linear models provide equivalent results of theirordered counterparts. In particular, Ferrer-i Carbonell andFrijters (2004) conclude that assumptions on ordinality or car-dinality of the answers to a subjective well-being question are“relatively unimportant to results”. 5

Table 2. Decomposition of the life satisfaction gap during 1990–2007 inChina
Satisfaction with life
DifferentialPrediction_1 6.832*** (104.84)Prediction_2 7.546*** (104.75)Difference �0.714*** (�7.35)
DecompositionExplained �0.462*** (�5.15)Unexplained �0.252*** (�3.94)
Observations 2,085
z statistics in parentheses.�p < 0:1.��p < 0:05.
*** p < 0:001.
Table 1. Descriptive statistics
Variable Mean Sd Min Max Obs Missing
Satisfaction with life 6.876 2.343 1 10 3,754 0Age 41.97 13.23 18 85 3,767 0Age squared 1,937 1,152 324 7,225 3,767 0Female 0.490 0.500 0 1 3,765 0Marital status – – 1 6 3,749 0Employment status – – 1 8 3,678 0.02Region – – 156,001 156,043 3,765 0State of health 3.805 1.001 1 5 3,758 0Freedom of choice 7.205 2.321 1 10 3,602 0.04Scale of incomes 4.293 2.142 1 10 3,400 0.10Ffinancial dissatisfaction 5.049 2.589 1 10 3,725 0.01Trust in others 0.548 0.498 0 1 3,715 0.01Index of civicness 9.127 1.385 1 10 3,760 0Social participation 0.560 0.496 0 1 3,763 0
THE DARK SIDE OF CHINESE GROWTH 337
A downside of the Blinder–Oaxaca approach is that theunexplained part captures also the potential effects of differ-ences in any unobserved variables (Jann, 2008).
Formally, the decomposition can be represented as follows:
DLS ¼ ½EðX fyÞ � EðX iyÞ�0 � b�|fflfflfflfflfflfflfflfflfflfflfflfflfflfflfflfflfflffl{zfflfflfflfflfflfflfflfflfflfflfflfflfflfflfflfflfflffl}
explained
þ ½EðX fyÞ0 � ðbfy � b�Þ þ EðX iyÞ0 � ðb� � biyÞ�|fflfflfflfflfflfflfflfflfflfflfflfflfflfflfflfflfflfflfflfflfflfflfflfflfflfflfflfflfflfflfflfflfflfflfflfflfflffl{zfflfflfflfflfflfflfflfflfflfflfflfflfflfflfflfflfflfflfflfflfflfflfflfflfflfflfflfflfflfflfflfflfflfflfflfflfflffl}
unexplained
ð1Þ
where DLS is the difference in average subjective well-beingbetween the final (fy) and the initial (iy) year of observations,EðX Þ is the yearly average of a vector of explanatory variablesmeasured at the beginning and at the end of the period of obser-vation, bfy and biy are vectors of coefficients and b� is a vector ofnon-discriminatory coefficients to quantify how much eachgroup of variables explains the overall difference of means.The vector of explanatory variables includes the usual predic-tors of happiness such as: gender, age and age squared, 6 mari-tal and employment status, income, financial dissatisfaction,subjective health, freedom of choice and control over one’s life,trust in others, index of civicness, participation in groups andassociations along with a dummy for each region of residence.
5. RESULTS
The results of the decomposition of the life satisfaction gapin China during 1990–2007 are presented in Table 2 anddetailed in Table 4 in the Appendix. In 1990 the average levelof life satisfaction amounted to 7.54 on a 10 points scale,whereas in 2007 it reduced to 6.83. Overall the Chinese subjec-tive well-being decreased by �7.1% during 1990–2007.Approximately 65% of this variation is explained by changesin the endowments between the two years. In other words, ifthe levels of each explanatory variables had not changed overtime, the well-being differential would have been 65% smaller.The remaining 35% of the life satisfaction gap remains unex-plained, that is to say it is related to changes in preferencesbetween the two periods.
Figure 2a and b graphically summarize the contribution ofthe main predictors of well-being to the life satisfaction gap.
Three main factors predict the well-being gap during 1990–2007: the erosion of social capital, the increase of financial dis-satisfaction and the changes in preferences; as for the latter, in2007 Chinese well-being was more strongly associated to social
comparisons and less strongly associated to social capital andto freedom of choice compared to 1990. The negative impactof this changes in preferences is only partially moderated bythe higher importance of health and of income. For what con-cerns the explained part of the gap, the negative impact of thechanges in social capital and financial dissatisfaction is onlyattenuated by a weak increase in freedom of choice and con-trol over one’s life.
Besides these variables, part of the well-being gap is alsoexplained by changes in socio-demographic predictors suchas marital status, employment status and the aging of the pop-ulation. During 1990–2007 the number of married peopledecreased, whereas those divorced or widowed increased. Atthe same time, also the importance that people attach to thesedimensions reduced. Similarly, the number of part-timeemployees, housewives, students, and unemployed peopleincreased significantly, while self-employed people reduced.According to Easterlin et al. (2012) the increase in unemploy-ment, due to the high rate of retrenchment from state-ownedenterprises, played a role in the decline of life satisfaction.Our calculations confirm this role, showing that the increasein unemployment (explained) accounts for about 1% of the lifesatisfaction gap (the unexplained part is non-significant).However, a major part of the life satisfaction gap is predictedby other factors.
Table 3 in Appendix A informs that all three proxies ofsocial capital sharply declined. Trust in others decreased by7%, the index of civic behavior reduced by 7.4%, while

1st
1st
1st1st
2nd
2nd
2nd
2nd
3rd
3rd
3rd
3rd4th
4th
4th
4th
5th
5th
5th
5th
56
78
Aver
age
leve
l of l
ife s
atis
fact
ion
1990 1995 2000 2005 2010year survey
Figure 3. Trends of life satisfaction by income quintiles of the Chinese
population.
02
46
810
aver
age
life
satis
fact
ion
0 2 4 6 8 10scale of incomes
1990 2007
Figure 4. Relationship between life satisfaction and income deciles in 1990
and 2007.
−.15
−.1
−.05
0.0
5
freed
om_c
hoice
healt
h
soc_
cap
soc_
compa
rison
s
incom
e
parameter estimate 90% conf. interval
(a) Explained
−.8
−.6
−.4
−.2
0.2
freed
om_c
hoice
healt
h
soc_
cap
soc_
compa
rison
s
incom
e
parameter estimate 90% conf. interval
(b) Unexplained
Figure 2. Detailed decomposition of the explained and unexplained part of
the life satisfaction gap during 1990–2007 in China. The y-axis reports the
changes in life satisfaction on a 10 points scale. The x-axis reports some
relevant explanatory variables. The bars represent the variation in life
satisfaction predicted by changes over time in the levels (explained) and in
the preferences (unexplained) of the set of explanatory variables. Note:
soc_cap stands for social capital and it refers to the summation of the effects
of trust in others, civic cooperation and social participation on well-being.
The summation is possible because the effects of the three proxies are
expressed in the same unit, i.e., changes of life satisfaction.
338 WORLD DEVELOPMENT
associational activity dropped by 3.4%. Overall, the decline ofsocial capital explains 21% of the explained gap and 13.5% ofthe overall life satisfaction gap. Given this erosion, if weassume that people’s preferences for social capital did notchange since 1990, the overall effect on life satisfaction wouldbe �1.8% rather than the predicted decrease of �7.1%. Inother words the decline of life satisfaction due to the erosionof social capital would be �5.3% smaller than the actualone. 7 To grasp how much the change in preferences for socialcapital affects life satisfaction, let’s assume that the endow-ments of social capital did not change since 1990. Thisamounts to compute the life satisfaction gap as if only prefer-ences had changed. Computations are presented in Table 7 inAppendix B. The change in preferences that happened during1990–2007 predicts a �6.6% decrease in life satisfaction, only
0.5% less than the actual decrease. In other words, the loss ofsocial capital endowments affects the life satisfaction gap lessthan the changes in preferences.
A further 15.5% of the gap is explained by a slight increase(+2.5%) in financial dissatisfaction (see Figure 2a). At thesame time, the importance of social comparisons for thewell-being of the average Chinese doubled compared to1990, thus further affecting people’s well-being (see Figure 2b).
Summarizing, there are two main sets of forces shaping thelife satisfaction gap between 1990 and 2007 in China:
� the variation of endowments of the correlates of life sat-isfaction: among these the increase of financial dissatis-faction and the erosion of social capital are the mainsources of the decrease in well-being. Remarkably, thetwo groups of variables exert a fairly comparable effecton well-being;
� the change of preferences: in 2007 people attach moreimportance than previously to social comparisons andincome, and lower importance to other dimensions suchas social capital and freedom of choice and control.
The massive shifts in preferences that we document, argu-ably, mirror the shifts in life priorities connected to the spreadof materialistic values. Our results document the increasingdependence of Chinese well-being on extrinsically motivated

−.4
−.3
−.2
−.1
0
freed
om_c
hoice
healt
h
soc_
cap
soc_
compa
rison
s
incom
e
parameter estimate 90% conf. interval
(a) Explained part of the gap
−4−2
02
THE DARK SIDE OF CHINESE GROWTH 339
factors and the lesser dependence on intrinsically motivatedones.
The possible bias toward an over-representation of urbanpopulation in the first wave (see Section 3) does not undermineour main findings, but would eventually strengthen them.Indeed, such bias would eventually lead to an under-estimation of the decline of social capital and, in particular,of trust in others which is normally higher in rural areas.Moreover, the rural–urban divide in developing countries isgenerally associated to an income inequality divide which isgreater in urban areas (Eastwood & Lipton, 2000). Chinamakes no exception to this regularity that makes cities anengine of social comparisons. Therefore, the above-mentioned sample bias would lead to conclude that the sharpincrease in the importance of social comparisons that we doc-ument is underestimated. Finally, the sample bias would makethe relationship between income and well-being steeperbecause in urban areas income differences matter more forwell-being, for instance, because of the lower availability offree or low-cost amenities. Hence, the strengthening over timeof the relationship between income and life satisfaction (seeFigure 4) does not depend on the sample bias because it wouldpoint to an even flatter relationship than the almost flat onethat we find in 1990. Finally, the 1990 survey would hardlybias upward life satisfaction—due to the disproportionate rep-resentation of groups with high life satisfaction—because in1990 virtually all socio-economic groups reported similaraverage levels of life satisfaction. Moreover, the trend of lifesatisfaction exhibited by the WVS is consistent with those byother data-bases (Easterlin et al., 2012).
(a) Explaining the evolution of well-being inequalities acrossincome classes
In a recent work Clark, Fleche, and Senik (2014) investigatewhether economic growth reduces well-being inequalities.Analysing a broad set of countries, the authors find a positiveanswer. However, this does not seem to hold for China(Easterlin et al., 2012) and present data confirm this conclu-sion: in the considered period the well-being inequality amongincome quintiles increased (see Figure 3).
In 1990 the average life satisfaction of the five quintiles ofthe Chinese income distribution was concentrated between 7and 8 points on the 10-points life satisfaction scale. The periodup to 2001 shows a generalized decrease in the average life
02
46
810
aver
age
life
satis
fact
ion
0 2 4 6 8 10scale of incomes
1990 2001
Figure 5. Anti-poor economic growth: life satisfaction and income deciles in
1990 and 2001.
satisfaction and a much higher dispersion across quintiles. Inabout 10 years the poorest income quintile lost about 1.5points in well-being, whereas the richest quintile lost about0.5 points. During the following 6 years the well-being condi-tions stopped worsening and possibly reverted. Overall, theaverage life satisfaction by income quintile in 2007 is more dis-persed than previously, thus confirming that, in China, eco-nomic growth increased well-being inequalities. In otherwords, the relationship between income and well-beingswitched from basically flat—a condition of substantial equal-ity—in 1990 to steep in 2007 (see Figure 4).
What is behind this transformation? What does explain thedifferent outcome in terms of well-being of Chinese incomeclasses? The following subsections describe the predictors of
−6
freed
om_c
hoice
healt
h
soc_
cap
soc_
compa
rison
s
incom
e
parameter estimate 90% conf. interval
(b) Unexplained part of the gap
Figure 6. Explained and unexplained part of the well-being gap for the
lower class during 1990–2001 in China. The y-axis reports the changes in life
satisfaction on a 10 points scale. The x-axis reports some relevant
explanatory variables. The bars represent the variation in life satisfaction
predicted by changes over time in the levels (explained) and in the
preferences (unexplained) of the set of explanatory variables. Note: soc_cap
stands for social capital and it refers to the summation of the effects of trust
in others, civic cooperation and social participation on well-being. The
summation is possible because the effects of the three proxies are expressed
in the same unit, i.e., changes of life satisfaction.

340 WORLD DEVELOPMENT
the well-being gap for the lower, the middle and the upperclass during 1990–2001 and 2001–07. People in the three low-est deciles of the income distribution belong to the lower class;people in the three highest deciles belong to the upper classand those in between belong to the middle class.
(i) The period 1990–2001The first phase of the Chinese economic growth can be defined
as anti-poor from the point of view of well-being. Figure 5 doc-uments that the 90s penalized much more the well-being of thepoorer income deciles than that of the richer ones.
During 1990–2001 the average life satisfaction of the poorerclass dropped by �1.64 points (that is to say a variation of�16.4%). Besides the socio-demographic changes, 81% of the
−1−.
8−.
6−.
4−.
20
freed
om_c
hoice
healt
h
soc_
cap
soc_
compa
rison
s
incom
e
parameter estimate 90% conf. interval
(a) Explained part of the gap
−2−1
01
23
freed
om_c
hoice
healt
h
soc_
cap
soc_
compa
rison
s
incom
e
parameter estimate 90% conf. interval
(b) Unexplained part of the gap
Figure 7. Explained and unexplained part of the well-being gap for the
middle class during 1990–2001 in China. The y-axis reports the changes in
life satisfaction on a 10 points scale. The x-axis reports some relevant
explanatory variables. The bars represent the variation in life satisfaction
predicted by changes over time in the levels (explained) and in the
preferences (unexplained) of the set of explanatory variables. Note: soc_cap
stands for social capital and it refers to the summation of the effects of trust
in others, civic cooperation and social participation on well-being. The
summation is possible because the effects of the three proxies are expressed
in the same unit, i.e., changes of life satisfaction.
life satisfaction gap is explained by changes in endowments,whereas the changes in preferences account for the remaining19% (see Tables 9 and 10 in Appendix C). The contribution ofeach of the relevant variables to the decomposition of the gapis graphically summarized in Figure 6.
During 1990–2001 the lowest three deciles of the income dis-tribution became largely dissatisfied with their financial situa-tion, shared lower levels of social capital, perceived lessfreedom of choice and control over their lives and less health(see Figure 6a). Among these, the effect of financial dissatisfac-tion was pivotal.
The negative impact for well-being of these changes is fur-ther reinforced by the changes in preferences (see Figure 6B).In 2001 well-being was considerably more related to financial
0.1
.2.3
freed
om_c
hoice
healt
h
soc_
cap
soc_
compa
rison
s
incom
e
parameter estimate 90% conf. interval
(a) Explained part of the gap
−10
12
freed
om_c
hoice
healt
h
soc_
cap
soc_
compa
rison
s
incom
e
parameter estimate 90% conf. interval
(b) Unexplained part of the gap
Figure 8. Explained and unexplained part of the well-being gap of rich
people during 1990–2001 in China. The y-axis reports the changes in life
satisfaction on a 10 points scale. The x-axis reports some relevant
explanatory variables. The bars represent the variation in life satisfaction
predicted by changes over time in the levels (explained) and in the
preferences (unexplained) of the set of explanatory variables. Note: soc_cap
stands for social capital and it refers to the summation of the effects of trust
in others, civic cooperation and social participation on well-being. The
summation is possible because the effects of the three proxies are expressed
in the same unit, i.e., changes of life satisfaction.
−.05
0.0
5
freed
om_c
hoice
healt
h
soc_
cap
soc_
compa
rison
s
incom
e
parameter estimate 90% conf. interval
(a) Explained part of the gap
02
4
THE DARK SIDE OF CHINESE GROWTH 341
dissatisfaction and less connected to social capital. The nega-tive effect of these two forces was only marginally offset bythe increase in income and in its importance.
In the same period also the middle class experienced a sub-stantial well-being loss of approximately �13%. Also in thiscase the largest part of the life satisfaction gap (about 91%)is accounted for by changes in endowments. Among them,the lion’s share belongs to the outburst of financial dissatisfac-tion. All other changes play a limited role, including thoseregarding preferences. The latter exhibit a higher importanceattached to social capital, income and social comparisonsand a smaller importance of health and freedom of choice(see Figure 7).
Rich people are those who lost less in terms of well-beingduring the 90s. In this period the average well-being of thethree upper deciles of the income distribution decreased by7%, less than half of the loss of the lower class. The changein endowments predicts an increase in life satisfaction due tothe fall in the financial dissatisfaction of the winners of theChinese economic race. However, this positive contributionis more than off-set by the negative contribution of the changein preferences. Among them, the greater importance of socialcomparisons and the loss of importance of freedom of choicehad a dominant effect on the increased importance of socialcapital, health and income (see Figure 8).
Summarizing, the change in the position and inclination ofthe relationship between life satisfaction and income during1990–2001 (see Figure 5) is largely related to changes in theendowments of the middle and the lower classes. In both cases,the increased financial dissatisfaction explains a large share ofthe overall variation. However, the lower class experienced agreater loss of life satisfaction mainly because it was the onlyclass to experience a decline in social capital. Moreover, theincrease in the importance of income and social comparisonsfor life satisfaction across all income classes suggests a gener-alized spread of materialistic values. Such spread seems rela-tively stronger among the lower classes, thus furthercontributing to the relatively greater diminution of theirwell-being. Indeed, the lower classes experienced a decreasein the importance attached to social capital, whereas suchimportance increased for the middle and the upper class. Onthe contrary, the moderate decrease in the life satisfaction ofthe upper class was entirely explained by changes in its prefer-ences, with a pivotal role for the higher importance of socialcomparisons and the lower importance of freedom of choiceand control.
02
46
810
aver
age
life
satis
fact
ion
0 2 4 6 8 10scale of incomes
2001 2007
Figure 9. Pro-rich economic growth: life satisfaction and income deciles in
2001 and 2007.
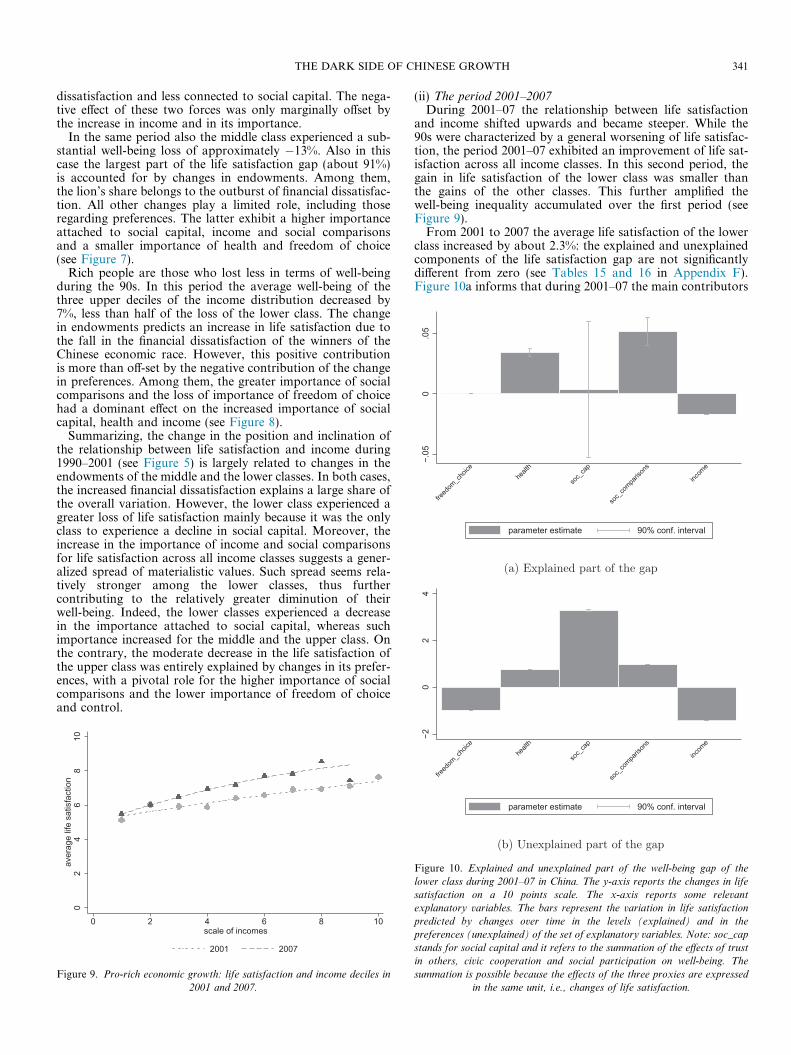
(ii) The period 2001–2007During 2001–07 the relationship between life satisfaction
and income shifted upwards and became steeper. While the90s were characterized by a general worsening of life satisfac-tion, the period 2001–07 exhibited an improvement of life sat-isfaction across all income classes. In this second period, thegain in life satisfaction of the lower class was smaller thanthe gains of the other classes. This further amplified thewell-being inequality accumulated over the first period (seeFigure 9).
From 2001 to 2007 the average life satisfaction of the lowerclass increased by about 2.3%: the explained and unexplainedcomponents of the life satisfaction gap are not significantlydifferent from zero (see Tables 15 and 16 in Appendix F).Figure 10a informs that during 2001–07 the main contributors
−2
freed
om_c
hoice
healt
h
soc_
cap
soc_
compa
rison
s
incom
e
parameter estimate 90% conf. interval
(b) Unexplained part of the gap
Figure 10. Explained and unexplained part of the well-being gap of the
lower class during 2001–07 in China. The y-axis reports the changes in life
satisfaction on a 10 points scale. The x-axis reports some relevant
explanatory variables. The bars represent the variation in life satisfaction
predicted by changes over time in the levels (explained) and in the
preferences (unexplained) of the set of explanatory variables. Note: soc_cap
stands for social capital and it refers to the summation of the effects of trust
in others, civic cooperation and social participation on well-being. The
summation is possible because the effects of the three proxies are expressed
in the same unit, i.e., changes of life satisfaction.

342 WORLD DEVELOPMENT
to the increasing life satisfaction were the decreased financialdissatisfaction and the improvement in perceived health.
The middle and the upper classes are those who gained themost from the second period of economic growth (approxi-mately 9.5%).
For what concerns the middle class, lower financial dissatis-faction explains about 2/3 of the increase in well-being. Thevariations of other endowments play a negligible role (see Fig-ure 11a). The remaining 1/3 of the increase in well-being isaccounted for by changing preferences: a higher importanceof income, of freedom of choice and control and, to a smallerextent, of health, and a lower importance of social compar-isons. Their positive impact on well-being is moderated bythe lower importance that people from the middle-class
0.2
.4.6
.8
freed
om_c
hoice
healt
h
soc_
cap
soc_
compa
rison
s
incom
e
parameter estimate 90% conf. interval
(a) Explained part of the gap
−2−1
01
freed
om_c
hoice
healt
h
soc_
cap
soc_
compa
rison
s
incom
e
parameter estimate 90% conf. interval
(b) Unexplained part of the gap
Figure 11. Explained and unexplained part of the well-being gap of the
middle class during 2001–07 in China. The y-axis reports the changes in life
satisfaction on a 10 points scale. The x-axis reports some relevant
explanatory variables. The bars represent the variation in life satisfaction
predicted by changes over time in the levels (explained) and in the
preferences (unexplained) of the set of explanatory variables. Note: soc_cap
stands for social capital and it refers to the summation of the effects of trust
in others, civic cooperation and social participation on well-being. The
summation is possible because the effects of the three proxies are expressed
in the same unit, i.e., changes of life satisfaction.
attached to social capital (see Tables 17 and 18 in AppendixG and Figure 11).
The Chinese at the top of the income distribution were thosewho gained the most both during 2001–07 and in the overallperiod. In the second phase of the economic growth, the aver-age happiness of the richest people increased by 9.7%, basicallyas much as the middle class. Figures from the decomposition inTable 20 point out that this effect was entirely explained bychanges in the endowments, whereas changes in preferencespredict a negligible variation of well-being. During 2001–07the Chinese upper class reported lower levels of dissatisfactionwith their financial situation, had more freedom of choice andcontrol over their lives and shared less social capital (see Tables19 and 20 in Appendix H and Figure 12a). Similarly to what
−.5
0.5
1
freed
om_c
hoice
healt
h
soc_
cap
soc_
compa
rison
s
incom
e
parameter estimate 90% conf. interval
(a) Explained part of the gap
−2−1
01
23
freed
om_c
hoice
healt
h
soc_
cap
soc_
compa
rison
s
incom
e
parameter estimate 90% conf. interval
(b) Unexplained part of the gap
Figure 12. Explained and unexplained part of the well-being gap of the rich
people during 2001–07 in China. The y-axis reports the changes in life
satisfaction on a 10 points scale. The x-axis reports some relevant
explanatory variables. The bars represent the variation in life satisfaction
predicted by changes over time in the levels (explained) and in the
preferences (unexplained) of the set of explanatory variables. Note: soc_cap
stands for social capital and it refers to the summation of the effects of trust
in others, civic cooperation and social participation on well-being. The
summation is possible because the effects of the three proxies are expressed
in the same unit, i.e., changes of life satisfaction.

THE DARK SIDE OF CHINESE GROWTH 343
happened to other Chinese people, if social capital had notbeen eroded, people’s subjective well-being would have beenhigher.
However, differently from the middle class, the upper classhad lost much less in terms of well-being during the period1990–2007. Hence, the net effect at the end of the 17 years con-sidered was an increase in well-being by 2.7% whereas the mid-dle class lost �3.4%. As for the lower class, the good news islimited to the halt of the worsening of its well-being. Fromthe point of view of well-being, the upper class was the onlywinner of the Chinese economic miracle.
In the period 2001–07 the predictors of the increase in the lifesatisfaction of the middle and upper classes have much in com-mon: both classes became more satisfied with their financial sit-uation, attached less importance to and shared less socialcapital, and were giving more emphasis to social comparisons.
In the overall period, the coefficients associated with finan-cial dissatisfaction have a similar U-shape across all socialclasses. Considering the whole sample, during 1990–2001social comparisons assumed a pivotal role for Chinesewell-being (from �0.19 in 1990 to �0.58 in 2001). In the sub-sequent period the importance of social comparisons attenu-ated (from �0.58 in 2001 to �0.34 in 2007). Nonetheless,the net effect of these changes was still very negative sincethe coefficient almost doubled during 1990–2007.
Summarizing, both the increase (1990–2001) and thedecrease (2001–07) in average life satisfaction appear to bemainly driven by opposite changes in the financial dissatisfac-tion in the lower and the middle class. Some role is played bythe spread of materialism recorded during 1990–2001 espe-cially among the lower class, that attenuated and eventuallyreverted in the subsequent period. In such changes in the val-ues of Chinese people, a major role is played by the impor-tance of social comparisons, sharply increasing across allincome classes in the first period, decreasing in the second per-iod. Moreover, in the 90s, the losses of social capital, healthand freedom of choice affected entirely the lower class, furtherpenalizing its well-being. The health decline reported by thelower class probably reflects the dissolution of the safety netemphasized by Easterlin et al. (2012): the collapse of socializedmedicine and the upsurge of health care costs.
2030
4050
Gin
i ind
ex
1980 1990
SWIID
Figure 13. Trend of income inequality in China between. Data are drawn from t
World Development In
6. CONCLUSION
Recent findings suggest that, in shaping changes of subjec-tive well-being, over the long run, social capital trends aremore important than economic growth. These findings, richof policy implications, derive mainly from evidence aboutdeveloped countries. This raises the question of the generalityof such conclusions and the extent to which they apply todeveloping countries.
China is a crucial case because of the gigantic scale of itsgrowth. China scores outstanding improvements in all indica-tors of standards of life, yet these objective records are in strik-ing contrast with those from subjective perceptions. In 2007the average Chinese felt substantially less satisfied with his/herlife than in 1990. To predict this change, our work applies theBlinder–Oaxaca decomposition on life satisfaction data of theWorld Values Survey, 1990–2007.
Our findings suggest that subjective data capture informa-tion that objective indicators do not adequately convey,namely, the increase in the importance of social comparisonsand the decline of social capital. These two powerful driversof the decline of well-being appear to be strictly connectedto the increasing orientation of Chinese people toward materi-alistic values. The decreasing role of sociability and theincreasing role of income comparisons in the life experienceand values of Chinese people are at the core of the declinein their well-being.
Important differences emerged between Chinese incomeclasses and time periods. Economic growth not only had a dis-appointing impact on average well-being, but it also increasedwell-being inequalities between income classes. China shiftedfrom a situation of substantial equality of well-being betweenincome deciles in 1990 to an unequal one in 2007.
Our results show substantial differences between the twosub-periods of 1990–2001 and 2001–07. The huge loss in aver-age life satisfaction in China in 1990–2001 was mainly concen-trated in the middle and lower classes. While absolute incomewas increasing, the upsurge of financial dissatisfaction nega-tively affected their life satisfaction. In a time of rapidlyincreasing prosperity and inequality, people’s rising expecta-tions were frustrated by the perception of being left behind.
2000 2010
WDI
he Standardized World Income Inequality Database (SWIID) and from the
dicators (WDI).

344 WORLD DEVELOPMENT
The spread of materialism, of social comparisons, and thedecline in social capital, all contributed to depress thewell-being of the Chinese lower class. These findings seem toreplicate previous observations on the conditions of the work-ing class (including those by Marx and Polanyi) characterizingall industrial revolutions. Similarly, the Chinese lower incomeclass’ perception of declining freedom of choice and control ofone’s own life may not be an isolated case. One does not needto think that “proletarians have nothing to lose but theirchains” to suspect that the transition to a market industrialeconomy may not be an easy walk to freedom for many com-ponents of the working class.
In 1990–2001 the outburst of social comparisons fullyinvolved the middle class that experienced a greater financialdissatisfaction. As a result, well-being decreased. Financial sat-isfaction increased only in the upper class, the real winners of theeconomic race. Nonetheless, the importance of social compar-isons for well-being increased across all income classes, predict-ing a limited fall in the life satisfaction of the upper class as well.
In China, during the period 2001–07, the softening of finan-cial dissatisfaction and the reduction of its importance for thewell-being of the lower and the middle classes predict the par-tial recovery of average life satisfaction. Changes in financialdissatisfaction affecting the lower and the middle classesseemed to drive the opposite changes of average life satisfac-tion. In the two sub-periods the uneven distribution of life sat-isfaction changes is unfavorable to the lower class, which losesmore when everybody loses and gains less when everybodygains. Such distribution is mainly explained by the uneven dis-tribution of the changes in financial dissatisfaction—unfavorable to the lower class in both sub-periods. In the 1990s, how-ever, the losses of social capital, health and freedom of choicewere entirely reported by the lower class, further penalizing itswell-being.
The positive trend of financial satisfaction since 2001 maymirror the attenuation of social comparisons. This may beconnected to the income redistribution policies launched bythe State Council in the aftermath of the Asian financial crisisof 1997–98 to support domestic demand. These policies werefurther reinforced by Hu Jintao after the change in leadership
in 2002 (Hung, 2008; Steele & Lynch, 2013b). The interruptionof the upsurge of income inequality (see Figure 13) may reflectsuch policy changes. In this period, the government underwenta serious effort to rebuild some of the safety net that haderoded earlier.
While financial dissatisfaction has a very large influence onthe change in average life satisfaction in both sub-periods, inthe overall period 1990–2007, social capital emerges as a com-parably important driver. This is consistent with previousstudies showing that the importance of social capital as a dri-ver of well-being over time increases as the length of time hori-zon of the analysis increases. Additionally, The increase ofmaterialism—rampant in the 1990s—plays a large role in theoverall period.
Summarizing, during 1990–2007, the good news for Chineselife satisfaction are limited to a 2.7% increase for the upperclass. The bad news is the 3.4% and 14.1% decrease in life sat-isfaction for the middle and the lower class, respectively. Therewas little gain in well-being, even for the few winners of theChinese economic miracle, and even these minimal gains werepaid at the price of substantial losses of life satisfaction for thegreat majority of people. This mirrors the picture of a countrythat grew rapidly yet unevenly. The increasing poverty ofsocial capital—especially for the lower class—was the darkside of rising economic wealth.
This study raises serious doubts about two popular opin-ions: (1) that growth is more important for the well-being ofdeveloping countries and (2) that social capital is a luxurygood that only rich countries can afford. Rather, we find theopposite: social needs seem to be crucial to the well-being ofpeople living in developing countries as well. China seems toexhibit surprising similarities with developed countries. Thedeclines of Chinese life satisfaction and American happinessin the past few decades are similar in that the decline of socialcapital and the increase in social comparisons play a crucialrole (Bartolini, Bilancini, & Pugno, 2013). In sum, the declinein social capital seems to be central to the major episodes ofthe Easterlin paradox in the developed and developing world(Bartolini, Bilancini, & Pugno, 2013).
NOTES
1. World Bank national accounts data and http://www.chinatoday.com/.
2. Since early 90s, China faced a proliferation of “mass incidents”
(cases of civil unrest officially recorded) that rose from under 9,000in 1993 to 180,000 in 2010. A substantial share of such incidents isdue to protests against the expropriation of agricultural land(Knight, 2013).
3. http://www.ipsos.com/content/global-attitudes-materialism-finances-and-family
4. The WVS allows to observe also another form of social capital,namely participation in political actions. However, in the case of China therelevant variables are observed only in one year thus preventing theanalysis over time. For this reason, political action is excluded frompresent analysis.
5. Ferrer-i Carbonell and Frijters (2004).
6. To account for the non-linearity between well-being and age, asquared term of the age variable has been included in the equation. Forease of interpretation, the new variable has been divided by 100.
7. See Table 8 in Appendix B for more details.
REFERENCES
Allison, P. (2001). Missing data. SAGE University Paper, 136.Bartolini, S., Bilancini, E., & Pugno, M. (2013). Did the decline in social
connections depress Americans’ happiness?. Social Indicators Re-search, 110(3), 1033–1059.
Bartolini, S., Bilancini, E., & Sarracino, F. (2013). Predicting the trend ofwell-being in Germany: How much do comparisons, adaptation andsociability matter?. Social Indicators Research, 3(114), 169–191.

THE DARK SIDE OF CHINESE GROWTH 345
Bartolini, S., & Sarracino, F. (2014). Happy for how long? How socialcapital and economic growth relate to happiness over time. EcologicalEconomics, 108, 242–256.
Becchetti, L., Massari, R., & Naticchioni, P. (2010). Why has happinessinequality increased? Suggestions for promoting social cohesion.ECINEQ working paper series, 177.
Becchetti, L., Pelloni, A., & Rossetti, F. (2008). Relational goods,sociability and happiness. Kyklos, 61(3), 343–363.
Blinder, A. (1973). Wage discrimination: Reduced-form and structuralestimates. Journal of Human Resources, 8, 436–455.
Brockmann, H., Delhey, J., Welzel, C., & Yuan, H. (2009). The Chinapuzzle: Falling happiness in a rising economy. Journal of HappinessStudies, 10, 387–405.
Bruni, L., & Stanca, L. (2008). Watching alone: Relational goods,television and happiness. Journal of Economic Behavior and Organiza-tion, 65(3–4), 506–528.
Cheung, C.-K., & Leung, K.-K. (2007). Enhancing life satisfaction bygovernment accountability in China. Social Indicators Research, 82(3),411–432.
Clark, A. E., Fleche, S., Senik, C., et al. (2014). The great happinessmoderation. In A. Clark, & C. Senik (Eds.), Happiness and economicgrowth: Lessons from developing countries. Oxford: Oxford UniversityPress.
Costa, D., & Kahn, M. (2003). Understanding the decline in social capital,1952–1998. Kyklos, 56, 17–46.
D’Ambrosio, C., & Frick, J. R. (2007). Income satisfaction and relativedeprivation: An empirical link. Social Indicators Research, 81(3),497–519.
D’Ambrosio, C., & Frick, J. (2012). Individual well-being in a dynamicperspective. Economica, 79, 284–302.
Deci, E. (1971). Effects of externally mediated rewards on intrinsicmotivations. Journal of Personality and Social Psychology, 18, 105–115.
Diener, E. (2006). Guidelines for national indicators of subjective well-being and ill-being. Journal of Happiness Studies, 7, 397–404.
Easterlin, R. (1974). Does economic growth improve the human lot? Someempirical evidence. In P. David, & W. Melvin (Eds.), Nations andhouseholds in economic growth (pp. 98–125). Palo Alto, CA: StanfordUniversity Press.
Easterlin, R., & Angelescu, L. (2009). Happiness and growth the worldover: Time series evidence on the happiness-income paradox. IZAdiscussion paper, 4060.
Easterlin, R. A., Angelescu, L., Switek, M., Sawangfa, O., & Zweig, J. S.(2010). The happiness-income paradox revisited. Proceedings of theNational Academy of Sciences, 107(52), 1–6.
Easterlin, R. A., Morgan, R., Switek, M., & Wang, F. (2012). China’s lifesatisfaction, 1990–2010. Proceedings of the National Academy ofSciences, 109(25), 9775–9780.
Eastwood, R., & Lipton, M. (2000). Rural-urban dimensions of inequalitychange. United Nations University, World Institute for DevelopmentEconomics Research 2003.
Ferrer-i Carbonell, A., & Frijters, P. (2004). How important is method-ology for the estimates of the determinants of happiness?. TheEconomic Journal, 114(497), 641–659.
Helliwell, J. F. (2003). How’s life?Combining individual and national variablesto explain subjective well-being. Economic Modelling, 20(2), 331–360.
Helliwell, J. (2006). Well-being, social capital and public policy: What’snew?. The Economic Journal, 116(510), 34–45.
Helliwell, J. (2008). Life satisfaction and quality of development. Workingpaper 14507. National Bureau of Economic Research.
Helliwell, J., & Barrington-Leigh, C. (2010). Viewpoint: Measuring andunderstanding subjective well-being. Canadian Journal of Economics,43, 729–753.
Helliwell, J. F., & Putnam, R. D. (2004). The social context of well-being.Philosophical Transactions: Royal Society of London Series BiologicalSciences, 359(1449), 1435–1446.
Hung, H.-F. (2008). Rise of China and the global overaccumulation crisis.Review of International Political Economy, 15(2), 149–179.
Inglehart, R., Foa, R., Peterson, C., & Welzel, C. (2008). Development,freedom, and rising happiness: A global perspective (1981–2007).Perspectives on Psychological Science, 3(4), 264–285.
Jann, B. (2008). A Stata implementation of the Blinder–Oaxacadecomposition. Stata journal, 8, 453–459.
Jiang, S., Lu, M., & Sato, H. (2012). Identity, inequality, andhappiness: Evidence from urban China. World Development, 40(6),1190–1200.
Kasser, T. (2002). The high price of materialism. Cambridge, MA: MITPress.
Knack, S., & Keefer, P. (1997). Does social capital have an economicpayoff? A cross-country investigation. The Quarterly Journal ofEconomics, 112(4), 1251–1288.
Knight, J. (2013). The economic causes and consequences of socialinstability in China. China Economic Review, 25, 17–26.
Knight, J., & Gunatilaka, R. (2010). Great expectations? The subjectivewell-being of rural–urban migrants in China. World Development,38(1), 113–124.
Knight, J., & Gunatilaka, R. (2011). Does economic growth raisehappiness in China?. Oxford Development Studies, 39(01), 1–24.
Little, R., & Rubin, D. (2002). Statistical analysis with missing data (2nded.). New York: John Wiley & Sons.
Oaxaca, R. (1973). Male-female wage differentials in urban labor markets.International Economic Review, 14, 693–709.
OECD (2001). The evidence on social capital. In The well-being of nations:The role of human and social capital (pp. 39–63). Paris: OECD.
Paxton, P. (1999). Is social capital declining in the United States? Amultiple indicator assessment. American Journal of Sociology, 105(1),88–127.
Podoshen, J. S., Li, L., & Zhang, J. (2011). Materialism and conspicuousconsumption in China: A cross-cultural examination. InternationalJournal of Consumer Studies, 35(1), 17–25.
Polanyi, K. (1968). The great transformation. Boston: Beacon.Putnam, R. (2000). Bowling alone: The collapse and revival of American
community. NY: Simon and Schuster.Sacks, D. W., Stevenson, B., & Wolfers, J. (2012). Subjective well-being,
income, economic development and growth. In P. Booth (Ed.), And thepursuit of happiness (pp. 59–98). London: The Institute of EconomicAffairs.
Sarracino, F. (2012). Determinants of subjective well-being in high andlow income countries: Do happiness equations differ across countries?.Journal of Socio-Economics.
Schaefer, A. D., Hermans, C. M., & Parker, R. S. (2004). A cross-culturalexploration of materialism in adolescents. International Journal ofConsumer Studies, 28(4), 399–411.
Schafer, J. (1997). Analysis of incomplete multivariate data. Chapman andHall/CRC, CRC Press Company.
Shek, D. T. (2010). Introduction: Quality of life of Chinese people in achanging world. Social Indicators Research, 95(3), 357–361.
Steele, L. G., & Lynch, S. M. (2013a). The pursuit of happiness in China:Individualism, collectivism, and subjective well-being during China’seconomic and social transformation. Social Indicators Research,114(2), 441–451.
Steele, L. G., & Lynch, S. M. (2013b). The pursuit of happiness in China:Individualism, collectivism, and subjective well-being during China’seconomic and social transformation. Social Indicators Research,114(2), 441–451.
Stevenson, B., & Wolfers, J. (2008). Economic growth and subjectivewell-being: reassessing the Easterlin paradox. IZA discussion paper3654.
Uhlaner, C. (1989). Relational goods and participation: Incorporatingsociability into a theory of rational action. Public Choice, 62,253–285.
Veenhoven, R., & Vergunst, F. (2013). The Easterlin illusion: Economicgrowth does go with greater happiness. EHERO working paper 2013/1.
Wei, Y., & Talpade, S. (2009). Materialism of mature consumers in Chinaand USA: A cross-cultural study. Journal of Behavioral Studies inBusiness, 1, 1–14.
Whyte, M. (2010). Myth of the social volcano: Perceptions of inequalityand distributive injustice in contemporary China. Stanford UniversityPress.
Williamson, J. G. (1995). Migration and city growth during industrialrevolutions. Urban Agglomeration and Economic Growth. Springer(pp. 79–104). Springer.
WVS (2009). World values survey 1981–2008 official aggregate v.20090901. Technical report, World Values Survey Association. Aggre-gate File Producer: ASEP/JDS, Madrid.

(6.65) (297.90)freedom_choice 0.0248*** �0.690***
346 WORLD DEVELOPMENT
APPENDIX A. LIFE SATISFACTION DECOMPOSITIONDURING 1990–2007
Table 3. Coefficients and X-values for 1990 and 2007 in China
b2007 b1990 bref X 2007 X 1990
Age �0.087 �0.011 �0.053 44.340 43.921Age squared 0.001 0.000 0.001 2139.795 2073.807Female �0.062 0.028 0.042 0.519 0.398How many childrendo you have
0.099 �0.002 0.063 1.873 2.224
Married 0.680 1.652 0.460 0.840 0.957Living together 0.112 3.158 0.439 0.010 0.003Divorced 0.052 0.836 �0.205 0.015 0.008Separated �0.738 0.826 �0.485 0.004 0.003Widowed 0.457 2.164 0.456 0.039 0.029Part time �0.011 0.080 �0.116 0.085 0.020Self-employed 0.158 0.160 0.216 0.042 0.236Retired �0.297 0.201 �0.110 0.051 0.061Housewife 0.081 0.320 �0.080 0.075 0.010Student �0.777 0.635 �0.082 0.019 0.003Unemployed �0.331 0.028 0.158 0.034 0.003Other �0.594 �0.124 �0.642 0.079 0.003Scale of incomes 0.070 0.010 0.027 3.983 3.179Financialdissatisfaction
�0.370 �0.207 �0.465 4.967 4.717
State of health 0.386 0.356 0.308 3.806 3.798Freedom of choice 0.197 0.294 0.169 7.344 7.197Trust in others 0.064 0.147 0.143 0.543 0.617Index of civicness 0.045 0.118 0.064 8.806 9.549Social participation 0.098 �0.024 0.116 0.374 0.711Constant 6.160 2.431 7.247 1.000 1.000
(4.80) (�133.37)soc_cap �0.0973*** �0.632***
(�5.70) (�37.02)Total �0.462*** �0.252**
(�3.67) (�2.00)Constant 3.729***
(2.93e+12)
Observations 2,085
t statistics in parentheses.Note: soc_cap stands for social capital and it refers to the summation ofthe effects of trust in others, civic cooperation and social participation onwell-being. The summation is possible because the effects of the threeproxies are expressed in the same unit, i.e., changes of life satisfaction.�p < 0:1.
** p < 0:05.*** p < 0:001.
Table 4. Detailed decomposition of the life satisfaction gap during 1990–2007 in China
Satisfaction with life
Differential Explained Unexplained
Prediction_1 6.832***
(7.50e+15)Prediction_2 7.546***
(3.85e+16)Difference �0.714***
(�7.35e+14)Age 0.0190** �1.592***
(2.39) (�200.47)Female 0.00508 �0.0484***
(0.97) (�9.19)How many childrendo you have
�0.0222*** 0.212***
(�3.51) (33.57)mar_stat �0.0479** �1.024***
(�1.97) (�42.15)empl_stat �0.0994*** �0.0337
(�3.40) (�1.15)Scale of incomes 0.0215 0.227***
(0.92) (9.71)Financial dissatisfaction �0.116*** �0.745***
(�6.15) (�39.50)Health 0.00254*** 0.114***
Line missing
APPENDIX B. THREE SCENARIOS FOR THE UNEX-PLAINED LIFE SATISFACTION GAP
Table 5 provides figures about the coefficients and theendowments for 1990 and 2007 for the three proxies of socialcapital. These figures are used to compute the life satisfactionvariation predicted by the proxies of social capital.
According to the unexplained side of the Oaxaca–Blinderdecomposition, the variation of life satisfaction due to differ-ences in the coefficients of social capital proxies is given by:
LSSCgap ¼ ½EðX 2007Þ0 � ðb2007 � bref Þ þ EðX 1990Þ0 � ðbref
� b1990Þ� ðB:1Þamounting to �0.63 (see Table 6).
How much does life satisfaction change when holding theendowment of social capital constant to its 1990 level? For-mally, the unexplained part of the Oaxaca–Blinder decompo-sition turns to be:
Table 5. Coefficients and X-values for the proxies of social capital
Variable b2007 b1990 bref X 2007 X 1990
Trust in others 0.064 0.147 0.143 0.543 0.617Index of civic cooperation 0.045 0.118 0.064 8.806 9.549Social participation 0.098 �0.024 0.116 0.374 0.711
Table 6. Life satisfaction variation due to differences in the coefficients ofsocial capital
Variable Dlife satisfaction
Trust in others �0.04Index of civic cooperation �0.68Social participation 0.09
Total �0.63
Table 7. Life satisfaction variation due to differences in social capitalcoefficients holding constant the levels of 1990
Variable Dlife satisfaction
Ttrust in others �0.05Index of civic cooperation �0.69Social participation 0.08
Total �0.66

Table 10. Detailed decomposition of the life satisfaction gap during 1990–2001 in China for the three lowest deciles of the income distribution
Satisfaction with life
Differential Explained Unexplained
Prediction_1 5.872***
(1.10e+18)Prediction_2 7.512***
(9.16e+16)Difference �1.640***
(�2.14e+16)Age 0.00647*** �0.146***
(1.45e+14) (�6.80e+16)Female �0.0202*** �0.109***
(�4.87e+15) (�5.68e+16)How many childrendo you have
0.00289*** �0.242***
(3.16e+15) (�2.20e+16)mar_stat �0.200*** 0.0741***
(�1.43e+15) (1.08e+16)empl_stat �0.00278*** 0.196***
(�2.27e+14) (5.46e+15)*** ***
Table 8. Life satisfaction variation due to differences in the coefficients ofsocial capital holding the 1990 values
Variable Dlife satisfaction
Trust in others �0.01Index of civic cooperation �0.08Social participation 0.008
Total �0.09
THE DARK SIDE OF CHINESE GROWTH 347
LSSCgap¼½EðX 1990Þ0 � ðb2007�bref ÞþEðX 1990Þ0 � ðbref �b1990Þ� ðB:2Þ
amounting to �0.66 (see Table 7).How much does life satisfaction change when holding the
coefficients of social capital constant to their 1990 values? For-mally, the unexplained part of the Oaxaca–Blinder decompo-sition turns to be:
LSSCgap ¼ ½EðX 2007Þ0 � ðb1990 � bref Þ þ EðX 1990Þ0 � ðbref
� b1990Þ� ðB:3Þamounting to �0.09 (see Table 8).
Scale of incomes 0.0172 1.271(1.66e+15) (4.87e+16)
Financial dissatisfaction �0.358*** �1.786***
(�1.90e+16) (�2.55e+17)Health �0.100*** �0.360***
(�3.70e+16) (�2.87e+18)*** ***
APPENDIX C. LIFE SATISFACTION DECOMPOSITIONFOR THE LOWER CLASS DURING 1990–2001
freedom_choice �0.0463 0.356(�1.36e+15) (4.18e+16)
soc_cap �0.0609*** �4.750***
(�3.43e+16) (�1.32e+17)Total �1.323*** �0.317***
(�3.03e+16) (�2.63e+15)Constant 4.829
Observations 635
t statistics in parentheses.Note: soc_cap stands for social capital and it refers to the summation of
the effects of trust in others, civic cooperation and social participation onwell-being. The summation is possible because the effects of the threeproxies are expressed in the same unit, i.e., changes of life satisfaction.�p < 0:1.��p < 0:05.
*** p < 0:001.
Table 9. Coefficients and X-values for 1990 and 2001 in China for the threelowest deciles of the income distribution
b2001 b1990 bref X 2001 X 1990
Aage �0.091 �0.048 �0.053 40.880 42.952Age squared 0.001 0.000 0.001 1809.769 1986.095Female �0.309 �0.073 �0.167 0.513 0.392How many childrendo you have
�0.129 0.004 �0.006 1.778 2.266
Married 2.139 1.976 1.923 0.838 0.950Living together 3.389 3.426 3.009 0.009 0.004Divorced �0.671 1.139 0.825 0.009 0.010Separated 0.000 0.377 0.333 0.000 0.002Widowed 1.317 2.556 2.197 0.034 0.033Part time 1.110 0.295 0.850 0.111 0.014Self-employed �1.932 0.387 0.466 0.009 0.247Retired �0.508 0.231 0.257 0.017 0.046Housewife 1.396 0.006 �0.532 0.085 0.012Student 0.000 0.751 0.979 0.000 0.004Unemployed 2.037 1.918 1.507 0.051 0.002Other �1.333 0.013 0.242 0.009 0.002Scale of incomes 0.686 0.165 0.123 2.427 2.288Financialdissatisfaction
�0.507 �0.196 �0.287 6.103 4.853
State of health 0.230 0.333 0.328 3.479 3.784Freedom of choice 0.328 0.276 0.252 6.974 7.158Trust in others 0.212 0.231 0.243 0.453 0.614Index of civicness �0.415 0.157 0.130 9.415 9.587Social participation 0.865 �0.039 0.113 0.718 0.712Constant 7.214 2.385 5.110 1.000 1.000
APPENDIX D. LIFE SATISFACTION DECOMPOSITIONFOR THE MIDDLE CLASS DURING 1990–2001
See Tables 11 and 12.
Table 11. Coefficients and X-values for 1990 and 2001 in China for the fourintermediate deciles of the income distribution
b2001 b1990 bref X 2001 X 1990
Age �0.074 0.102 �0.016 39.612 47.022Age squared 0.001 �0.001 0.000 1678.606 2350.067Female �0.288 0.386 �0.127 0.494 0.406How many childrendo you have
0.022 0.025 0.057 1.791 2.222
Married 0.702 �0.186 0.516 0.924 0.972Living together 0.000 0.000 0.000 0.000 0.000Divorced �0.822 0.000 �1.034 0.012 0.000Separated 0.000 �0.528 �0.014 0.000 0.006Widowed 0.379 0.000 0.095 0.018 0.022Part time �0.516 �0.738 �0.470 0.082 0.039
(continued on next page)
Line missing

Table 12. Detailed decomposition of the life satisfaction gap during 1990–2001 in China for the four intermediate deciles of the income distribution
Satisfaction with life
Differential Explained Unexplained
Prediction_1 6.324***
(5.90e+15)Prediction_2 7.622***
(2.90e+15)Difference �1.299***
(�4.59e+14)Age �0.0730 �4.215***
(�1.42) (�81.87)Female �0.0113 �0.288***
(�0.48) (�12.25)How many childrendo you have
�0.0244** 0.00835
(�2.00) (0.68)mar_stat �0.0376** 0.866***
(�2.32) (53.34)empl_stat 0.0729** 0.109***
(3.10) (4.64)Scale of incomes �0.0340 1.514***
(�0.47) (20.80)Financial dissatisfaction �0.722*** �1.587***
(�4.24) (�9.33)Health 0.00307** �1.045***
(2.51) (�855.68)freedom_choice �0.0253** �1.363***
(�2.76) (�148.76)soc_cap �0.0150*** 3.206***
(�4.66) (992.44)Total �1.182*** �0.117***
(�91.44) (�9.05)Constant 1.344***
(2.11e+12)
Observations 520
t statistics in parentheses.Note: soc_cap stands for social capital and it refers to the summation of
the effects of trust in others, civic cooperation and social participation onwell-being. The summation is possible because the effects of the threeproxies are expressed in the same unit, i.e., changes of life satisfaction.�p < 0:1.
** p < 0:05.*** p < 0:001.
Table 11 (continued)
b2001 b1990 bref X 2001 X 1990
Self-employed 0.166 �0.296 �0.183 0.009 0.211Retired 0.500 �0.450 �0.149 0.009 0.106Housewife 0.593 2.419 0.312 0.068 0.006Student �4.472 0.000 �4.002 0.003 0.000Unemployed 1.352 �1.569 0.993 0.038 0.006Other 0.476 �0.094 0.299 0.012 0.006Scale of incomes 0.065 �0.240 �0.073 5.221 4.756Financialdissatisfaction
�0.532 �0.179 �0.465 5.750 4.200
State of health 0.237 0.509 0.361 3.853 3.844Freedom of choice 0.125 0.313 0.164 7.124 7.278Trust in others 0.328 0.295 0.339 0.559 0.622Index of civicness 0.227 �0.095 0.143 9.473 9.479Social participation 0.042 �0.149 0.061 0.821 0.700Constant 5.218 3.874 4.326 1.000 1.000
348 WORLD DEVELOPMENT
APPENDIX E. LIFE SATISFACTION DECOMPOSITIONFOR THE UPPER CLASS DURING 1990–2001
See Tables 13 and 14.
Table 13. Coefficients and X-values for 1990 and 2001 in China for the threehighest deciles of the income distribution
b2001 b1990 bref X 2001 X 1990
Age �0.092 0.164 �0.123 40.287 42.447Age squared 0.001 �0.003 0.001 1751.591 1960.868Female 0.252 �0.747 0.153 0.493 0.447How many childrendo you have
�0.008 0.401 0.019 1.710 1.658
Married 0.572 0.000 0.884 0.880 0.974Living together 2.153 0.000 2.318 0.003 0.000Divorced 0.000 �5.104 1.053 0.000 0.026Separated �1.687 0.000 �1.762 0.003 0.000Widowed �0.037 0.000 0.226 0.022 0.000Part time 0.341 �0.975 0.256 0.092 0.026Self-employed 0.705 1.657 0.555 0.092 0.211Retired �0.386 3.386 �0.343 0.078 0.053Housewife 0.077 0.000 �0.037 0.056 0.000Student �0.260 0.000 �0.228 0.008 0.000Unemployed 0.547 0.000 0.385 0.045 0.000Other �0.734 0.000 �0.863 0.008 0.000Scale of incomes �0.066 �0.122 �0.072 7.838 7.868Financialdissatisfaction
�0.552 �0.307 �0.530 4.855 5.316
State of health �0.050 �0.196 �0.084 3.816 3.763Freedom of choice 0.239 0.417 0.236 7.315 7.342Trust in others 0.266 �1.089 0.198 0.571 0.632Index of civicness 0.094 �0.025 0.050 9.431 9.362Social participation 0.166 �0.016 0.115 0.866 0.737Constant 9.088 11.292 10.137 1.000 1.000
Table 14. Detailed decomposition of the life satisfaction gap during 1990–2001 in China for the three highest deciles of the income distribution
Satisfaction with life
Differential Explained Unexplained
Prediction_1 6.950***
(1.51e+16)Prediction_2 7.658***
(1.42e+16)Difference �0.708***
(�1.63e+15)Age �0.0133 �3.191***
(�1.03) (�246.63)Female 0.00699 0.451***
(1.02) (66.18)How many childrendo you have
0.000981 �0.680***
(1.22) (�847.16)mar_stat �0.104** 0.742***
(�2.45) (17.51)empl_stat �0.0518*** �0.363***
(�10.91) (�76.52)Scale of incomes 0.00217*** 0.439***
(12.00) (2425.81)Financial dissatisfaction 0.244*** �1.294***
(14.28) (�75.77)Health �0.00445 0.550***
(�1.42) (174.85)freedom_choice �0.00645*** �1.312***
(continued on next page)
Line missing

Table 14 (continued)
Satisfaction with life
Differential Explained Unexplained
(�32.63) (�6637.64)soc_cap 0.00634*** 2.106***
(3.81) (1263.88)Total �0.118 �0.590***
(�0.66) (�3.30)Constant �2.203***
(�2.58e+12)
Observations 397
t statistics in parentheses.Note: soc_cap stands for social capital and it refers to the summation ofthe effects of trust in others, civic cooperation and social participation onwell-being. The summation is possible because the effects of the threeproxies are expressed in the same unit, i.e., changes of life satisfaction.�p < 0:1.
** p < 0:05.*** p < 0:001.
Difference 0.230***
(1.95e+14)Age 0.0681** 0.857***
(3.18) (39.95)Female 0.00153 0.0557***
(1.24) (45.08)How many childrendo you have
0.0362*** 0.436***
(14.84) (178.70)mar_stat 0.0102 �1.771***
(0.62) (�107.07)empl_stat �0.0951*** �0.284***
(�10.98) (�32.73)Scale of incomes �0.0169*** �1.438***
(�1201.85) (�102462.93)Financialdissatisfaction
0.0516*** 0.967***
(7.25) (135.83)Health 0.0343*** 0.752***
(15.57) (341.60)freedom_choice 0.000277*** �0.983***
(52.13) (�185222.35)soc_cap 0.00343 3.281***
(0.10) (95.84)Total 0.169 0.0613
(0.92) (0.34)
THE DARK SIDE OF CHINESE GROWTH 349
APPENDIX F. LIFE SATISFACTION DECOMPOSITIONFOR THE LOWER CLASS DURING 2001–07
Table 15. Coefficients and X-values for 2001 and 2007 in China for the threelowest deciles of the income distribution
b2007 b2001 bref X 2007 X 2001
Age �0.028 �0.091 �0.038 46.295 40.880Age squared 0.000 0.001 0.001 2301.874 1809.769Female �0.203 �0.309 �0.105 0.498 0.513How many childrendo you have
0.115 �0.129 0.111 2.105 1.778
Married 0.117 2.139 0.348 0.860 0.838Living together 0.445 3.389 0.761 0.012 0.009Divorced 0.180 �0.671 �0.033 0.010 0.009Separated �0.805 0.000 �0.498 0.005 0.000Widowed �0.087 1.317 0.115 0.053 0.034Part time 0.149 1.110 0.133 0.078 0.111Self-employed 0.502 �1.932 0.419 0.041 0.009Retired �0.482 �0.508 �0.448 0.034 0.017Housewife 0.502 1.396 0.380 0.062 0.085Student �1.373 0.000 �1.476 0.009 0.000Unemployed �0.680 2.037 �0.498 0.047 0.051Other �0.754 �1.333 �0.897 0.095 0.009Scale of incomes 0.096 0.686 0.073 2.195 2.427Financialdissatisfaction
�0.348 �0.507 �0.392 5.971 6.103
State of health 0.445 0.230 0.428 3.559 3.479Freedom of choice 0.187 0.328 0.184 6.976 6.974Trust in others 0.026 0.212 0.050 0.533 0.453Index of civicness 0.012 �0.415 �0.008 8.845 9.415Social participation �0.110 0.865 0.011 0.266 0.718Constant 4.332 7.214 6.941 1.000 1.000
Table 16. Detailed decomposition of the life satisfaction gap during 2001–07in China for the three lowest deciles of the income distribution
Satisfaction with life
Differential Explained Unexplained
Prediction_1 6.102***
(5.21e+15)Prediction_2 5.872***
(7.40e+16)
Line missing
Constant �2.882***
(�8.04e+12)
Observations 697
t statistics in parentheses.Note: soc_cap stands for social capital and it refers to the summation of
the effects of trust in others, civic cooperation and social participation onwell-being. The summation is possible because the effects of the threeproxies are expressed in the same unit, i.e., changes of life satisfaction.�p < 0:1.
** p < 0:05.*** p < 0:001.
APPENDIX G. LIFE SATISFACTION DECOMPOSITIONFOR THE MIDDLE CLASS DURING 2001–07
Table 17. Coefficients and X-values for 2001 and 2007 in China for the fourintermediate deciles of the income distribution
b2007 b2001 bref X 2007 X 2001
Age �0.129 �0.074 �0.098 42.965 39.612Age squared 0.001 0.001 0.001 2029.233 1678.606Female �0.003 �0.288 �0.091 0.519 0.494How many childrendo you have
0.098 0.022 0.051 1.722 1.791
Married 0.975 0.702 0.759 0.826 0.924Living together �0.980 0.000 �1.122 0.006 0.000Divorced 0.301 �0.822 �0.023 0.020 0.012Separated �0.779 0.000 �0.767 0.003 0.000Widowed 0.682 0.379 0.407 0.026 0.018Part time 0.060 �0.516 �0.136 0.096 0.082Self-employed �0.106 0.166 �0.002 0.043 0.009Retired �0.191 0.500 �0.062 0.065 0.009Housewife 0.067 0.593 0.159 0.085 0.068Student �0.358 �4.472 �0.468 0.025 0.003Unemployed 0.219 1.352 0.683 0.022 0.038Other �0.337 0.476 �0.283 0.066 0.012
(continued on next page)
Line missing

Table 17 (continued)
b2007 b2001 bref X 2007 X 2001
Scale of incomes 0.156 0.065 0.040 4.952 5.221Financialdissatisfaction
�0.376 �0.532 �0.477 4.372 5.750
State of health 0.307 0.237 0.294 3.958 3.853Freedom of choice 0.204 0.125 0.163 7.532 7.124Trust in others 0.120 0.328 0.143 0.557 0.559Index of civicness 0.042 0.227 0.034 8.787 9.473Social participation 0.290 0.042 0.082 0.440 0.821Constant 6.761 5.218 7.010 1.000 1.000
Table 18. Detailed decomposition of the life satisfaction gap during 2001–07in China for the four intermediate deciles of the income distribution
Satisfaction with life
Differential Explained Unexplained
Prediction_1 7.282***
(9.89e+15)Prediction_2 6.324***
(6.16e+15)Difference 0.959***
(7.62e+14)Age 0.0557*** �1.378***
(8.06) (�199.32)Female �0.00221 0.143***
(�0.65) (41.70)How many childrendo you have
�0.00353 0.132***
(�1.21) (45.38)mar_stat �0.0803*** 0.256***
(�5.77) (18.36)empl_stat �0.0396*** �0.0400***
(�25.83) (�26.10)Scale of incomes �0.0108 0.446***
(�0.63) (25.78)Financial dissatisfaction 0.657*** 0.758***
(6.11) (7.04)Health 0.0310*** 0.270***
(11.76) (102.22)freedom_choice 0.0667*** 0.580***
(3.74) (32.47)soc_cap �0.0545 �1.749***
(�1.21) (�38.69)Total 0.642*** 0.317**
(6.19) (3.06)Constant 1.543***
(2.33e+12)
Observations 988
t statistics in parentheses.Note: soc_cap stands for social capital and it refers to the summation of
the effects of trust in others, civic cooperation and social participation onwell-being. The summation is possible because the effects of the threeproxies are expressed in the same unit, i.e., changes of life satisfaction.�p < 0:1.
** p < 0:05.*** p < 0:001.
350 WORLD DEVELOPMENT
APPENDIX H. LIFE SATISFACTION DECOMPOSITIONFOR THE UPPER CLASS DURING 2001–07
Table 19. Coefficients and X-values for 2001 and 2007 in China for the threehighest deciles of the income distribution
b2007 b2001 bref X 2007 X 2001
Age �0.118 �0.092 �0.103 42.331 40.287Age squared 0.001 0.001 0.001 1954.992 1751.591Female 0.092 0.252 0.233 0.620 0.493How many childrendo you have
0.039 �0.008 0.029 1.570 1.710
Married 1.440 0.572 0.848 0.818 0.880Living together 1.926 2.153 1.864 0.017 0.003Divorced �1.509 0.000 �1.726 0.008 0.000Separated 0.000 �1.687 �1.991 0.000 0.003Widowed 1.626 �0.037 0.271 0.033 0.022Part time �0.040 0.341 0.152 0.066 0.092Self-employed �0.562 0.705 0.329 0.033 0.092Retired 0.408 �0.386 �0.463 0.058 0.078Housewife �0.823 0.077 �0.265 0.083 0.056Student �1.382 �0.260 �0.884 0.041 0.008Unemployed 0.122 0.547 0.303 0.041 0.045Other �2.820 �0.734 �1.622 0.074 0.008Scale of incomes �0.362 �0.066 �0.153 7.364 7.838Financialdissatisfaction
�0.487 �0.552 �0.518 3.339 4.855
State of health 0.600 �0.050 0.072 4.174 3.816Freedom of choice 0.261 0.239 0.246 8.099 7.315Trust in others �0.042 0.266 0.194 0.521 0.571Index of civicness 0.025 0.094 0.107 8.718 9.431Social participation 0.025 0.166 �0.005 0.545 0.866Constant 11.333 9.088 9.130 1.000 1.000
Table 20. Detailed decomposition of the life satisfaction gap during 2001–07in China for the three highest deciles of the income distribution
Satisfaction with life
Differential Explained Unexplained
Prediction_1 7.926***
(3.41e+15)Prediction_2 6.950***
(1.68e+16)Difference 0.976***
(4.17e+14)Age 0.0145 �1.278***
(0.69) (�60.92)Female 0.0296*** �0.0968***
(10.25) (�33.53)How many childrendo you have
�0.00405 0.0798***
(�0.75) (14.70)mar_stat �0.0328** 0.780***
(�1.97) (46.78)empl_stat �0.158*** �0.255***
(�3.74) (�6.03)Scale of incomes 0.0725 �2.217***
(1.22) (�37.35)(continued on next page)
Line missing

Table 20 (continued)
Satisfaction with life
Differential Explained Unexplained
Financialdissatisfaction
0.785*** 0.270***
(10.03) (3.45)Health 0.0257 2.670***
(0.37) (38.56)freedom_choice 0.193*** 0.176***
(21.26) (19.34)soc_cap �0.0842** �0.882***
(�2.27) (�23.81)Total 0.951*** 0.0252***
(129.84) (3.44)Constant 2.245***
(3.09e+12)
Observations 480
t statistics in parentheses.Note: soc_cap stands for social capital and it refers to the summation of
the effects of trust in others, civic cooperation and social participation onwell-being. The summation is possible because the effects of the threeproxies are expressed in the same unit, i.e., changes of life satisfaction.�p < 0:1.
** p < 0:05.*** p < 0:001.
Wave 2
Justifiable: claiming government benefits .6669682 .5551534Justifiable: avoiding a fare on public transport .7524343 .4338426Justifiable: cheating on taxes .7656387 .4137974Justifiable: someone accepting a bribe .5649274 .6808571
Wave 3
Justifiable: claiming government benefits .6884222 .5260749Justifiable: avoiding a fare on public transport .7724496 .4033216Justifiable: cheating on taxes .7844648 .384615Justifiable: someone accepting a bribe .6200904 .6154879
Wave 4
Justifiable: claiming government benefits .7373559 .4563062Justifiable: avoiding a fare on public transport .7846328 .3843513Justifiable: cheating on taxes .8119551 .3407289Justifiable: someone accepting a bribe .7871107 .3804567
Wave 5
Justifiable: claiming government benefits .7772684 .3958539Justifiable: avoiding a fare on public transport .8067852 .3490976Justifiable: cheating on taxes .8470783 .2824584Justifiable: someone accepting a bribe .7956081 .3670077
Wave 6
Justifiable: claiming government benefits .7613381 .4203643Justifiable: avoiding a fare on public transport .7248758 .474555Justifiable: cheating on taxes .8180381 .3308137Justifiable: someone accepting a bribe .7286719 .4690373
THE DARK SIDE OF CHINESE GROWTH 351
APPENDIX I. FACTOR ANALYSIS FOR THE INDEXOF CIVICNESS
In the pooled sample, factor loadings range from.72 to.80thus suggesting that the four variables contribute equally tothe definition of civic cooperation. The picture does notchange much when observing results wave by wave. In thiscase, factor loadings stay approximately constant acrosswaves.
Table 21. Factor loading and unique variances for the pooled sample
Factor 1 Psi
Justifiable: claiming government benefits .7354614 .4590965Justifiable: avoiding a fare on public transport .7844583 .3846252Justifiable: cheating on taxes .8061527 .3501179Justifiable: someone accepting a bribe .7274631 .4707974
Table 22. Factor loadings and unique variances across waves
Factor 1 Psi
Wave 1
Justifiable: claiming government benefits .7966403 .3653643Justifiable: avoiding a fare on public transport .834389 .303795Justifiable: cheating on taxes .7776205 .3953064Justifiable: someone accepting a bribe .6871919 .5277673
Line missing
The slight variability among factor loadings both in thepooled sample and within waves support the decision to buildan aggregated index of civic cooperation resulting from theaverage of the four items. (see Tables 21 and 22).
APPENDIX J. LIST OF GROUPS AND ASSOCIATIONSMENTIONED IN THE WVS/EVS QUESTIONNAIRE
Respondents were asked to mention whether they belongedor were performing unpaid voluntary work for any of the fol-lowing list of associations:� social welfare service for elderly;� religious organization;� education, arts, music or cultural activities;� labor unions;� political parties;� local political actions;� human rights;� conservation, the environment, ecology, animal rights;� conservation, the environment, ecology;� animal rights;� professional associations;� youth work;� sports or recreation;� women’s group;� peace movement;� organization concerned with health;� consumer groups;� other groups.
ScienceDirectAvailable online at www.sciencedirect.com