Embed Size (px)
Citation preview

University of Central Florida University of Central Florida
STARS STARS
Electronic Theses and Dissertations, 2004-2019
2015
The CT20 peptide as an agent for cancer treatment The CT20 peptide as an agent for cancer treatment
Rania Bassiouni University of Central Florida
Part of the Medical Sciences Commons
Find similar works at: https://stars.library.ucf.edu/etd
University of Central Florida Libraries http://library.ucf.edu
This Doctoral Dissertation (Open Access) is brought to you for free and open access by STARS. It has been accepted
for inclusion in Electronic Theses and Dissertations, 2004-2019 by an authorized administrator of STARS. For more
information, please contact [email protected].
STARS Citation STARS Citation Bassiouni, Rania, "The CT20 peptide as an agent for cancer treatment" (2015). Electronic Theses and Dissertations, 2004-2019. 5006. https://stars.library.ucf.edu/etd/5006

THE CT20 PEPTIDE AS AN AGENT
FOR CANCER TREATMENT
by
RANIA BASSIOUNI
B.S. University of Central Florida, 2010
A dissertation submitted in partial fulfillment of the requirements
for the degree of Doctor of Philosophy
in the Burnett School of Biomedical Sciences
in the College of Medicine
at the University of Central Florida
Orlando, Florida
Summer Term
2015
Major Professor: Annette Khaled

ii
© 2015 Rania Bassiouni

iii
ABSTRACT
Due to cancer recurrence and the development of drug resistance, metastatic breast
cancer is a leading cause of death in women. In the search for a new therapeutic to treat
metastatic disease, we discovered CT20p, an amphipathic peptide based on the C-terminus of
Bax. Due to inherent properties of its sequence and similarity to antimicrobial peptides, CT20p
is a promising cytotoxic agent whose activity is distinct from the parent protein (e.g. does not
cause apoptosis). CT20p is not membrane permeable but can be introduced to cells using
polymeric nanoparticles, a method that promotes efficient delivery of the peptide into the
intracellular environment.
We demonstrated that CT20p was cytotoxic using triple negative breast cancer (TNBC)
cell lines, primary breast tumor tissue, and breast tumor murine xenografts. Importantly, normal
breast epithelial cells and normal primary breast cells were resistant to the lethal effects of the
peptide. Examination of multiple cellular processes showed that CT20p causes cell death by
promoting cytoskeletal disruption, cell detachment, and loss of substrate-mediated survival
signals.
In order to identify the intracellular target of CT20p, we performed pull-down
experiments using a biotinylated peptide and found that CT20p binds directly to a type II
chaperonin called chaperonin containing T-complex (CCT), which is essential for the folding of
actin and tubulin into their native forms. The resulting effect of CT20p upon the cytoskeleton of
cancer cells is disruption of vital cellular processes such as migration and adhesion. CCT gene
expression and protein levels were examined across several breast cancer cell lines, and we
found that susceptibility to CT20p correlated with higher CCT levels. Using human cancer

iv
tissue microarrays, we determined that CCT was present in significantly higher amounts in tumor
tissues compared to normal tissues and that expression often increased with advanced cancer
stage. These results indicate that CCT is a promising therapeutic target for the treatment of
metastatic breast cancer and suggest that the use of cancer-targeted nanoparticles loaded with
CT20p is a novel and effective therapeutic strategy for cancers, such as TNBC, that recur and are
refractory to current treatments.

v
Dedicated to
the important individuals in my life
who have remained behind the scenes,
without whom this journey would not have been possible.

vi
ACKNOWLEDGMENTS
I would like to thank my advisor, Dr. Annette Khaled, for her guidance, support, and
encouragement. She has taught me the tangibles and intangibles of being a scientist. I am
grateful for her mentorship and the experiences I’ve had during my time in her laboratory.
Thank you to my committee: Dr. Alvaro Estevez, Dr. Deborah Altomare, and Dr. Jihe
Zhao. I am honored to have had constant feedback from a group of scientists I admire. Your
comments have been invaluable.
Thank you to Dr. J. Manuel Perez and Orielyz Flores for providing the nanoparticles
used throughout this work.
A very special thank you to past and present members of the Khaled lab, especially Dr.
Rebecca Boohaker, Dr. Kathleen Nemec, Dr. Michael Lee, Dr. Arati Limaye, and Ashley Iketani
for sharing their knowledge, expertise, skills, and company with me. I have learned from each of
you, and I am grateful.
Thank you to Dr. Cristina Fernandez-Valle and Nicklaus Sparrow for assistance with
fixed-cell microscopy, and to Dr. Alicja Copik and Jeremiah Oyer for assistance with live-cell
microscopy.
Thank you to Dr. Priya Vishnubhotla for your clinical insights, and helping bridge the
bench and the bedside. Thank you to Dr. Amr Khaled for tirelessly studying and scoring tissue
samples. Your expertise has been instrumental in demonstrating the significance of this work.

vii
TABLE OF CONTENTS
LIST OF FIGURES ...................................................................................................................... xii
LIST OF TABLES ....................................................................................................................... xiv
LIST OF ABBREVIATIONS ....................................................................................................... xv
CHAPTER 1: INTRODUCTION ................................................................................................... 1
The disease: triple negative breast cancer ....................................................................... 1
Peptides as therapeutic agents ......................................................................................... 3
Initial characterization of CT20p .................................................................................... 4
CHAPTER 2: THE CT20 PEPTIDE CAUSES DETACHMENT AND DEATH OF
METASTATIC BREAST CANCER CELLS BY PROMOTING MITOCHONDRIAL
AGGREGATION AND CYTOSKELETAL DISRUPTION ......................................................... 5
Introduction ..................................................................................................................... 5
Materials & Methods ...................................................................................................... 7
Cell culture and reagents. ............................................................................................ 7
CT20p-nanoparticle synthesis. .................................................................................... 7
Assays of cell viability ................................................................................................ 8
Live cell imaging ........................................................................................................ 8
Detection of mitochondrial fusion .............................................................................. 9
Measurement of mitochondrial bioenergetics ............................................................. 9

viii
Detection of actin polymerization ............................................................................. 10
Measurement of mitochondrial membrane potential ................................................ 10
Detection of proteins by western blot ....................................................................... 11
Cellular adhesion assay ............................................................................................. 11
Measurement of cell surface integrin expression ...................................................... 11
In vivo studies ........................................................................................................... 12
Statistical analysis ..................................................................................................... 12
Results ........................................................................................................................... 13
CT20p localizes to mitochondria in breast cancer cells and causes cell death. ........ 13
CT20p promotes the fusion-like aggregation of mitochondria ................................. 15
CT20p impairs mitochondrial distribution................................................................ 17
CT20p disrupts cell attachment and cytoskeletal organization................................. 18
CT20p causes breast cancer cell death in vitro and in vivo ...................................... 20
Figures........................................................................................................................... 22
Discussion ..................................................................................................................... 33
CHAPTER 3: TARGETING THE CHAPERONIN CCT WITH THE CT20 PEPTIDE
INDUCES CYTOSKELETAL DISRUPTION AND BREAST CANCER CELL DEATH ....... 36
Introduction ................................................................................................................... 36
Materials & Methods .................................................................................................... 37
Cell culture and reagents ........................................................................................... 37

ix
Cellular adhesion assay ............................................................................................. 38
Measurement of cell viability ................................................................................... 38
Measurement of oxygen consumption and extracellular acidification ..................... 38
Immunoblotting......................................................................................................... 39
Quantitation of gene expression ................................................................................ 40
Pull-down experiments ............................................................................................. 40
Migration assay ......................................................................................................... 41
Fixed-cell immunofluorescence ................................................................................ 42
Overexpression of CCTβ .......................................................................................... 43
Immunohistochemistry ............................................................................................. 43
Statistical analysis ..................................................................................................... 44
Results ........................................................................................................................... 44
CT20p is cytotoxic to a variety of TNBC cell lines.................................................. 44
CT20p’s cytotoxic effects are independent of cellular metabolism .......................... 46
CT20p binds to the chaperonin CCT ........................................................................ 48
CT20p interacts directly with CCTβ ......................................................................... 50
CCT levels vary across TNBC cell lines .................................................................. 51
CT20p’s interaction with CCT has functional consequences ................................... 51
CCT overexpression increases susceptibility to CT20p ........................................... 53

x
CCT has potential as a clinical marker for breast cancer .......................................... 55
Figures & Tables ........................................................................................................... 58
Discussion ..................................................................................................................... 72
CHAPTER 4: POTENTIAL OF CCT AS A TARGET IN VARIOUS HUMAN CANCERS ... 75
Introduction ................................................................................................................... 75
Materials & Methods .................................................................................................... 76
Immunohistochemistry ............................................................................................. 76
Statistical analysis ..................................................................................................... 77
Results ........................................................................................................................... 77
CCTβ is not a marker of disease in colonic carcinomas ........................................... 77
Hepatocellular carcinomas express higher CCTβ than normal hepatic tissue .......... 78
Prostate adenocarcinoma overexpresses CCTβ ........................................................ 80
Lung small cell carcinomas are high expressers of CCTβ........................................ 81
Figures........................................................................................................................... 84
Discussion ..................................................................................................................... 89
CHAPTER 5: DISCUSSION ........................................................................................................ 92
APPENDIX A: CELL DEATH & DISEASE COPYRIGHT RELEASE ................................... 97
APPENDIX B: CANCER CELL & MICROENVIRONMENT COPYRIGHT RELEASE ........ 99
APPENDIX C: IACUC PERMISSIONS.................................................................................... 102

xi
APPENDIX D: IRB PERMISSIONS ......................................................................................... 109
REFERENCES ........................................................................................................................... 111

xii
LIST OF FIGURES
Figure 1: CT20p dose response in MDA-MB-231 cells ............................................................... 22
Figure 2: CT20p causes breast cancer cell-specific death ............................................................ 23
Figure 3: CT20p localizes to the mitochondria and increases the mitochondrial membrane
potential in breast cancer cells .......................................................................................... 24
Figure 4: CT20p localizes to the mitochondria............................................................................. 25
Figure 5: CT20p causes fusion of mitochondria in breast cancer cells ........................................ 26
Figure 6: Mitochondrial appearance upon induction of fusion or inhibition of fission ................ 27
Figure 7: Mitochondrial movement and velocity decreases with CT20p treatment in breast cancer
cells. .................................................................................................................................. 28
Figure 8: CT20p treatment reduces cell adhesion and integrin levels in breast cancer cells ........ 29
Figure 9: Detection of F-actin is reduced upon CT20p treatment in breast cancer cells .............. 30
Figure 10: CT20p treatment impairs growth of breast tumors implanted in mice ........................ 31
Figure 11: Uptake of nanoparticles in MDA-MB-231 and MCF-10A cells ................................. 32
Figure 12: CT20p has cytotoxic activity in TNBC cell lines ........................................................ 58
Figure 13: CT20p cytotoxicity does not correlate with metabolism............................................. 59
Figure 14: Biotin-CT20p pulls down interacting proteins in MDA-MB-231 cell lysates ............ 60
Figure 15: CT20p binds CCTβ in the cellular environment ......................................................... 62
Figure 16 : CT20p binds directly to CCTβ ................................................................................... 63
Figure 17: CCT expression varies across TNBC cell lines........................................................... 64
Figure 18: Consequences of CT20p treatment include loss of migration ability and tubulin
architecture ........................................................................................................................ 65

xiii
Figure 19: DIC images accompanying immunofluorescent staining of tubulin .......................... 66
Figure 20 : CCT overexpression increases the susceptibility of MCF-10A cells to CT20p ......... 67
Figure 21: Representative images of CCTβ tissue scoring parameters ........................................ 68
Figure 22: Breast cancers express higher levels of CCTβ than normal tissue .............................. 69
Figure 23: High levels of CCTβ are associated with a decreased survival rate of breast cancer
patients .............................................................................................................................. 71
Figure 24: Analysis of CCTβ staining in colon tumor tissue ....................................................... 84
Figure 25: Analysis of CCTβ staining in liver tumor tissue ......................................................... 85
Figure 26: Analysis of CCTβ staining in prostate cancer tissue ................................................... 86
Figure 27: Analysis of CCTβ staining in lung tumor tissue ......................................................... 87

xiv
LIST OF TABLES
Table 1: Proteins identified via mass spectrometry to interact with CT20p-Biotin ..................... 61
Table 2 : Sample sizes for breast tissue analysis .......................................................................... 70
Table 3: Sample sizes for colon, liver, prostate, and lung tissue analysis .................................... 88

xv
LIST OF ABBREVIATIONS
mitochondrial membrane potential
2-DG 2-deoxyglucose
AIB1 amplified in breast 1
ANOVA analysis of variance
ATCC American Type Culture Collection
ATP adenosine triphosphate
Bax Bcl-2 associated protein X
Bcl-2 B-cell lymphoma 2
BT-549 human breast carcinoma cell line
CAT cancer adjacent tissue
CCT chaperonin containing TCP1, with subunits denoted by greek letters
CD29 cluster of differentiation 29, also known as integrin β1
CD61 cluster of differentiation 61, also known as integrin β3
cDNA complementary DNA
COOH carboxylated nanoparticles
CT threshold cycle
CT20p CT20 peptide
CT20p-Biotin biotin-tagged CT20p
CTRL control conditions
DAPI 4',6-diamidino-2-phenylindole
DIC differential interference contrast microscopy

xvi
DiI 1,1'-dioctadecyl-3,3,3'3'-tetramethylindocarbocyanine perchlorate
DMEM Dulbecco’s modified Eagle’s Media
DMSO dimethyl sulfoxide
DNA deoxyribonucleic acid
Drp1 dynamin related protein 1
DOX doxorubicin encapsulated in nanoparticles
ECAR extracellular acidification rate
EDTA Ethylenediaminetetraacetic acid
EGF epidermal growth factor
EMT epithelial-mesenchymal transition
ER estrogen receptor
ER stress endoplasmic reticulum stress
FBS fetal bovine serum
FCCP carbonyl cyanide-p-trifluoromethoxyphenylhydrazone
FITC fluorescein isothiocyanate
FOL folate-decorated nanoparticles
H & E hemotoxylin and eosin
HBPE-NPs hyperbranced polyester nanoparticles
HCC hepatocellular carcinoma
HCT116 human colorectal carcinoma cell line
HEPES 4-(2-hydroxyethyl)-1-piperazineethanesulfonic acid
Her2 human epidermal growth factor receptor
HSP90 heat shock protein 90

xvii
IACUC Institutional Animal Care and Use Committee
IDC invasive ductal carcinoma
IRB Institutional Review Board
JC-1 fluorescent mitochondrial stain; indicator of mitochondrial membrane potential
MCF-10A Michigan Cancer Foundation 10A, human breast epithelial cell line
MCF-10A(CCT) MCF-10A cells transiently transfected to overexpress CCTβ
MCF-10A(T) MCF-10A cells that have undergone spontaneous EMT-like transformation
MDA-MB-231 MD Anderson metastatic breast 231, human carcinoma cell line
MDA-MB-436 MD Anderson metastatic breast 436, human carcinoma cell line
MDA-MB-468 MD Anderson metastatic breast 468, human carcinoma cell line
Mdivi-1 small molecule inhibitor of Drp1
MFN2 mitofusin 2
MFN2-YFP YFP-labeled mitofusin 2
MSL mesenchymal stem-like
MWCO molecular weight cut-off
NA numerical aperture
NP-40 nonyl phenoxypolyethoxylethanol
OCR oxygen consumption rate
OPA1 optic atrophy 1
p38 MAPK p38 mitogen-activated protein kinase
PBS phosphate-buffered saline
PC Pearson’s coefficient of correlation for colocalization studies
PCR polymerase chain reaction

xviii
PR progesterone receptor
PVDF polyvinylidene difluoride
RHO rhodamine
RHO-CT20p rhodamine-labeled CT20p
RNA ribonucleic acid
rpm revolutions per minute
RPMI Roswell Park Memorial Institute media
RQ relative expression
RT-PCR reverse transcription polymerase chain reaction
SDS-PAGE sodium dodecyl sulfate polyacrylamide gel electrophoresis
SPR surface plasmon resonance
SRCC signet-cell ring carcinoma
STAT3 Signal transducer and activator of transcription 3
STR short tandem repeat
TCP1 Tailless-complex protein 1
TNBC triple negative breast cancer
TNM The TNM Classification of Malignant Tumors
UNT untreated control;
VDAC-1 voltage-dependent anion channel 1

1
CHAPTER 1: INTRODUCTION
The disease: triple negative breast cancer
Breast cancer is the most commonly diagnosed cancer in women in the United States and
around the world [1, 2]. It can affect a variety of races, ages, ethnicities, and geographies [3]. In
the United States, it is second only to lung cancer in cancer-related deaths in women [4].
However, in many other countries, it is the leading cause of death [1]. Due to improved
diagnostic methods and increased awareness of the disease, the incidence rate of breast cancer
has been increasing over the past few decades [4]. However, this is coupled with a decreased
mortality rate, and an increased 5-year survival rate due to advances in medicine and early
detection [3, 4]. Nevertheless, there are discrepancies among races in this regard, with death rates
being significantly higher in African American women than White women, even though overall
incidence is lower in African-American women [4]. Some forms of breast cancer are also
associated with higher death rates, as will be discussed below. Therefore, research continues into
finding more effective treatments that are broadly applicable.
Treatment for breast cancer usually involves surgery to remove the primary tumor,
combined with other standard cancer treatment regimens such as radiation and chemotherapy.
When metastasis has occurred, systematic therapy is preferred, as surgery and radiation cannot
treat the extent of the disease. Systematic therapy includes chemotherapy, as well as hormone
therapies and targeted therapies that are made possible by the molecular characteristics of many
breast cancers.
The hormones estrogen and progesterone stimulate the growth of some breast cancers.
Breast cancers that are estrogen receptor (ER) or progesterone receptor (PR) positive may be

2
treated with hormone therapies that target these receptors and therefore inhibit their stimulatory
effect on cancer cell growth. Drugs that block estrogen from binding to receptors on cancer cells,
such as tamoxifen, have been effective in treatment of ER positive cancers [5]. Tamoxifen is
often combined with aromatase inhibitors, which block the body’s production of estrogen. These
combination treatments have proved effective at treating ER and PR positive breast cancers [6]
Another molecular marker of breast cancer is the growth factor receptor Her2.
Approximately 20% of breast cancers overexpress Her2, causing faster growth and greater
aggressiveness of these tumors [7]. Targeting Her2 with monoclonal antibodies such as
trastuzumab, also known as Herceptin, has proven to be very effective for treating Her2 positive
cancers. Trastuzumab is approved in the United States for all Her2 positive cancers, and has
drastically improved the prognosis of what was once the deadliest form of breast cancer.
Histopathological determination of ER, PR, and Her2 status of breast cancers is now used
in the clinic to determine effective courses of treatment for breast cancer patients. However,
approximately 20% of breast cancers do not express any of these receptors, and are known as
triple negative breast cancer (TNBC). Due to the lack of targets, TNBC is more difficult to treat
than other subtypes. It is also associated with a higher risk of relapse and metastasis, and a
poorer prognosis and survival rate [8]. Beyond surgery, radiation, and chemotherapy, treatment
options for TNBC are limited. Continuing research is needed to develop effective therapeutic
agents for treatment of aggressive breast cancers that are not responsive to standard therapies,
such as TNBC.

3
Peptides as therapeutic agents
Developing peptides as therapeutic agents for treating cancer offers many benefits over
small molecule drugs. In clinical applications, peptides modeled after proteins with known
functions may have reduced off-target effects and a decreased chance of developing drug
resistance, which results in low toxicity. Peptides are also cost-effective to produce and are
amenable to modifications. A major advantage is the potential to design peptides that target
specific protein-protein interactions or organelles, like the mitochondria [9, 10]. While organelle
targeting sequences, such as mitochondrial targeting sequences, are known and characterized,
their use is largely restricted to targeting non-peptide cargo rather than as a component of a
“peptide drug” [11].
One strategy is to derive peptides from previously characterized, endogenous cellular
proteins. This approach takes advantage of the information available on the localization and
function of the protein from which the peptide is derived and could inform of the potential
molecular target and action of the peptide In our studies, we examine a 20 amino acid α-helical
peptide developed from the α9 transmembrane domain of the pro-apoptotic protein, Bax. This
peptide, henceforth referred to as CT20p, is amphipathic and shares similarities with anti-
microbial peptides, such as the presence of a tryptophan and two C-terminal lysines. Although
derived from an apoptotic protein and retaining cytotoxic activity, CT20p, due to its inherent
features, may have unique actions unrelated to the parent protein that could have significant
clinical impact.

4
Initial characterization of CT20p
Initial biophysical studies of CT20p revealed that the peptide has the capacity to form
membrane pores in lipid vesicles [12, 13]. However, the membrane selectivity and biological
relevance of CT20p pore formation remains unknown, as lipid vesicles are only an
approximation of biological structures. Furthermore, it was undetermined whether the structure
and sequence of CT20p contributed to the potential for more complex biological activity,
perhaps in a way that could cause catastrophic intracellular events in a cancer cell.
To examine the effects of CT20p on mammalian cells, we employ a delivery system of
hyperbranced polyester nanoparticles (HBPE-NPs) to effectively and efficiently transport the
peptide into the intracellular environment [14]. Early experiments employing CT20p revealed
that it was cytotoxic to HCT116 colorectal cancer and MDA-MB-231 breast cancer cell lines
[15]. The cell death induced by CT20p was not a result of caspase activation, nor was it rescued
by the anti-apoptotic protein Bcl-2, providing the first indication that the peptide functions by a
mechanism distinct and beyond that of the parent protein Bax [15].
The studies described in subsequent chapters explore the intracellular actions of CT20p.
We detail the various cellular consequences of CT20p treatment, as well as identify a target of
the direct action of CT20p. Among our findings is that CT20p can localize to the mitochondria,
but exerts its action predominantly by disturbing the cell’s cytoskeleton, causing loss of
architectural support followed by cell detachment and cell death. The intracellular target of
CT20p was identified as the chaperonin CCT, which is the obligate chaperonin for cytoskeletal
proteins actin and tubulin. Our studies describe the potential of both CT20p as a therapeutic, and
of CCT as a target in cancer therapy.

5
CHAPTER 2: THE CT20 PEPTIDE CAUSES DETACHMENT AND
DEATH OF METASTATIC BREAST CANCER CELLS
BY PROMOTING MITOCHONDRIAL AGGREGATION AND
CYTOSKELETAL DISRUPTION
Introduction
Mitochondria are promising therapeutic targets given their role in regulating metabolism,
cell death, and powering cytoskeletal changes involved in cell motility [11, 16-18]. Emerging
evidence in the literature indicates that the ability of breast cancer cells to migrate and
metastasize, which depend on cytoskeletal changes, may be linked to mitochondrial morphology
and subcellular localization [19, 20]. Thus disrupting mitochondrial function would not only
impact energy production but also cell adhesion and migration. What is lacking are new
therapeutic agents that modulate mitochondrial dynamics and decrease the ability of this
organelle to move and produce localized amounts of ATP that drive cytoskeletal change. Such
an agent could effectively impair cancer cell invasion, attenuating migration and inducing the
death of highly metastatic cancer cells.
Therapeutic peptides that can target the mitochondria of cancer cells and induce cell
death hold significant promise and may represent an avenue to restrain migration and metastasis
[21]. Many cancer therapeutic peptides fall under the umbrella of naturally occurring anti-
microbial peptides that form pores in membranes, facilitating the release of intra-membrane
contents [21, 22]. In mammalian systems, these peptides are relatively inactive against the
plasma membrane, but if transfected or delivered into the cell they exhibit pore-forming activity
towards the prokaryotic-like membrane of the mitochondria. Considerable effort has been
expended developing synthetic peptides to trigger mitochondrial membrane permeability
changes and promote cytochrome C release and apoptosis; however, these approaches do not

6
specifically harness differences between normal and cancerous cells, which often harbor
mutations in proteins that govern apoptosis. An attractive alternative is to develop peptides from
endogenous mitochondrial-localized proteins with documented functions. Numerous examples
of this strategy exist, including the Nur77 peptide, VDAC-1 peptides and more recently peptides
derived from Bax [23-27]. Despite the advantages of these approaches, many concerns remain
such as bioavailability and off-target effects.
We previously reported that a peptide derived from the C-terminus of Bax, CT20p, had
similarities to anti-microbial peptides [25], forming pores in artificial lipid vesicles and releasing
intravesicular contents [12, 13]. When expressed in cells, CT20p localized to the mitochondria,
promoting cell death, even in cells deficient in Bax, indicating that the peptide functioned
independently of the parent protein and potential defects in the apoptotic machinery [25].
However, the hydrophobic nature of CT20p, the inability to penetrate plasma cell membranes,
and general problems with peptide stability in serum challenged the direct use of CT20p. An
optimal solution was encapsulation of CT20p in hyperbranched polymeric nanoparticles (HBPE-
NPs) that could be decorated with targeting ligands to concentrate the peptide in tumors [14, 25].
CT20p-HBPE-NPs (henceforth referred to as CT20p) killed colon and breast cancer cells,
causing tumor regression in mice [11] . Nevertheless, the key intracellular actions of CT20p that
lead to cell death remained unknown. Here we report that CT20p impairs mitochondrial
movement and distribution and has deleterious effects on integrins and F-actin polymerization,
causing cell detachment and death in a cancer specific manner. These findings suggest that
CT20p has potential clinical use as a novel mitochondrial-targeting, anti-metastatic agent.

7
Materials & Methods
Cell culture and reagents.
MDA-MB-231 cells (ATCC HTB-26) were cultured in DMEM (Cellgro) with 10% fetal
bovine serum and 1% penicillin-streptomycin. MCF-10A cells (ATCC CRL-10317) were
cultured in Mammary Epithelial Cell Growth Media (Lonza) with 1% penicillin-streptomycin.
Cells were authenticated by STR profiling (ATCC). CT20p (Ac-
VTIFVAGVLTASLTIWKKMG-NH2) and rhodamine-tagged CT20p were commercially
synthesized (Biopeptide Co., Inc) at >98% purity. Human tissues were transported in RPMI on
ice. Upon receipt, tissues were washed thoroughly in PBS containing 1% penicillin-
streptomycin and 5 g/mL Fungizone (Life Technologies). Tissues were minced and digested in
0.1% collagenase I (Gibco) at 37°C for 2 hours. Differential centrifugation as described by
Speirs et al was used to obtain an epithelial-enriched cell fraction [28]. Cells were maintained in
Mammary Epithelial Cell Growth Media (Lonza) at 37°C and 5% CO2. Human tissues were
deidentified and the protocol for use was approved by the Institutional Review Boards (IRB) at
the University of Central Florida and Florida Hospital.
CT20p-nanoparticle synthesis.
CT20p was encapsulated into hyperbranched polymeric nanoparticles (HBPE-NPs)
following a previously reported method [14, 25]. In brief, 36 µL of CT20p (0.05 µg/µL) solution
in 250 µL of DMSO were mixed in 250 µL of a DMSO solution containing the HBPE polymer
(12 mg) for a ratio of ~ 0.15 g peptide: 1 mg nanoparticles. The resulting polymer/CT20p
mixture in DMSO was added to deionized water (2.5 mL) to form the HBPE (CT20p) NPs. The
resulting NPs were purified using a PD-10 column and dialyzed (MWCO 6-8K) against PBS

8
(pH=7.4). Dynamic light scattering and zeta potential analysis of the nanoparticle reveals a size
diameter of 88±2 nm and zeta potential of -54.5 mV. The HBPE NPs (above) contain functional
carboxylic groups on their surface that results in a negative charge. For targeting the folate
receptor to concentrate the nanoparticles in tumors, folic acid was conjugated to HBPE-NPs as
previously described [29].
Assays of cell viability
Short-term survival was assessed using the flow cytometry based Sytox AADvanced and
F2N12S Violet Ratiometric Apoptosis kit according to the manufacturer’s protocol (Invitrogen).
Long-term survival of cells was measured by clonogenic survival assay [30]. The dose of CT20p
that kills approximately 50% of the cells in 48 hours was determined to be ~3.5 nM (75 µg
nanoparticles/ml) (Fig. 1). To induce hypoxia-mimicking conditions, 200 µM CoCl2 was added
to the media.
Live cell imaging
Cells were plated in 35mm glass-bottom dishes (MatTek) coated with 10 µg/mL
fibronectin (Sigma) for MDA-MB-231 or 3.25 µg/cm2 Cell-Tak (BD Biosciences) for MCF10A
cells. Cells were treated with CT20p and stained with 25nM Mitotracker Green or 500 nM ER-
Tracker Green (Life Technologies). Images were acquired with a PerkinElmer UltraView
spinning disc confocal system, with AxioObserver.Z1 stand (Carl Zeiss), in a humidity and
temperature-controlled chamber (LiveCell). Time-lapse movies were acquired using a Plan-
Apochromat 63x Oil DIC objective. Images were processed with Volocity software
(PerkinElmer). Live cell imaging was also used to track mitochondrial movement and velocities
calculated using the Volocity software (PerkinElmer).

9
Detection of mitochondrial fusion
Cells, seeded in 24-well glass-bottom dishes (MatTek), were transfected with mitoDendra
[31] using TransIT-LT1 transfection reagent (Mirus) according to the manufacturer’s protocol
and treated with CT20p. Live cell confocal imaging was performed using Zeiss LSM 710
confocal microscope and ZEN 2010 software. Images were obtained using a Zeiss 63x Plan-
Apocromat oil immersion lens (NA=1.4), pinholes adjusted for an optical section thickness of
1μm for each channel, and a 488/543 dual dichroic. Photoconversion of mitoDendra was
achieved by exposing a region of interest within a cell to the 488nm light from an Argon laser set
to 5mW (20% power) with 5-20 iterations (depending on the mitoDendra expression levels) at a
pixel dwell time of 1.27μs. Non-photoconverted mitoDendra was visualized by excitation at
488nm (Argon laser at 0.05mW, 0.2% power) and emission light collected at 500-540nm.
Photoconverted mitoDendra was visualized by excitation at 543nm (HeNe543 laser at 0.13mW,
10% power) and emission light collected at 555-700nm. Fluorescence for the non- and
photoconverted mitoDendra were captured separately, while DIC images were captured
simultaneously. Maximum intensity projections were created and the resulting single z-slice
movies were optimized using ZEN 2010 software. MFN-2 overexpression was performed using
pMFN-2-YFP (Addgene) and cells transfected as described above.
Measurement of mitochondrial bioenergetics
Culture plates for use in the Seahorse XFe24 analyzer were coated with Cell-Tak (BD
Bioscience) at 3.5 g/cm2 and cells seeded at 60,000 cells/well. Oxygen consumption rates were
measured following the manufacturer’s protocol. For metabolic profiling, injections of
oligomycin (1 μM), FCCP (0.3 μM), rotenone (0.1 μM), and antimycin A (2 μM) were used.

10
The mitochondrial coupling efficiency was calculated as: % coupling efficiency = [1 –
(minimum oligomycin response/final basal measurement)] X 100. To measure ATP, cells were
treated with CT20p and total cellular ATP determined using the ATPlite luminescence-based kit
(PerkinElmer) according to the manufacturer’s protocol. Luminescence was read with an
Envision plate reader (Perkin Elmer).
Detection of actin polymerization
Immunohistochemistry was performed as previously described [30, 32]. For detection of
total actin levels, cells were incubated with a Beta-actin primary antibody (Cell Signaling)
followed by incubation with an AlexaFluor546 conjugated goat anti-mouse secondary antibody
(Invitrogen). For detection of F-actin and DNA, cells were stained with AlexaFluorH633-
phalloidin and DAPI (Invitrogen). Cells were visualized with a Zeiss LSM 710 microscope.
Images shown in figures were obtained using a Zeiss 63x Plan-Apocromat oil immersion lens,
while images acquired for F-actin quantification were obtained using a Zeiss 40x Plan-
Apocromat oil immersion lens. To determine the average F-actin levels per cell, the number of
pixels above background intensity was quantitated and then divided by the number of cells in the
image (Volocity software, Perkin Elmer). At least three images, containing 9-29 cells, per
condition were quantified.
Measurement of mitochondrial membrane potential
The mitochondrial membrane potential () was measured by flow cytometry (488 nm
excitation and 530 nm (green)/585 nm (red) emission) using the dye JC-1 at a final concentration
of 1 M (Life Technologies). For live cell imaging, cells were seeded on glass, treated with

11
CT20p, and stained with 1uM JC-1 and imaged on the Ultraview spinning disk confocal
microscope (PerkinElmer) as described above.
Detection of proteins by western blot
Mitochondrial fractionation was performed as previously described [33]. Mitochondrial
lysates or whole cell lysates were subjected to SDS-PAGE, transferred to Immobilon-FL
membranes (Millipore) or PVDF membranes and probed with primary antibodies against MFN-2
(Millipore), OPA1 (Novus Biologicals), integrin α5 (Cell Signaling), integrin αV (Cell
Signaling) and prohibitin (Abcam) or p38 MAPK (Santa Cruz). Fluorescent detection was
achieved by incubation with an IRDye 800CW anti-mouse or anti-rabbit secondary antibody,
followed by imaging with an Odyssey detection system (LI-COR). Densitometry was analyzed
using ImageJ software.
Cellular adhesion assay
A standard crystal violet adhesion assay was performed as previously described [34].
Plates were uncoated or coated with 20 μg/mL fibronectin (Sigma) and cells were seeded at a
density of 25,000 cells/well. Following treatment with peptides at time points indicated in the
figure, cells were fixed and stained with 5 mg/mL crystal violet. Absorbance at 595 nm was read
on an EnVision plate reader (Perkin Elmer).
Measurement of cell surface integrin expression
Cells, treated with CT20p, were washed with 5% FBS in PBS and stained with FITC
mouse anti-human CD61, PE mouse anti-human CD29 (BD Bioscience), or a corresponding
isotype control antibody (BD Bioscience). Data was acquired with an Accuri C6 flow cytometer
and analyzed with FCS Express (Denovo) software.

12
In vivo studies
Female, 6-8 week old, Foxn1nu/Foxn1nu nude mice (Charles River) received
subcutaneous injections of ~106 MDA-MB-231 cells. Tumors were detected by ultrasound
(VisualSonics Vevo 2100). Mice bearing tumors (~1.5-8 mm2) received tail vain injections of 5
µg HBPE-NPs (untargeted or folate receptor targeted) encapsulating CT20p, or control
nanoparticles as described in the figure. Folate-targeted doxorubicin was used as a positive
control. Two injections, after 0 and 7 days, were administered to each mouse in each group over
a two-week period, and tumor size was monitored by ultrasound. For tissue staining, a standard
hematoxylin & eosin protocol was performed. An animal study protocol was approved by the
Institutional Animal Care and Use Committee (IACUC) at the University of Central Florida.
Statistical analysis
For each figure, representative experiments are shown that were replicated a minimum of
three times. For microscopy, multiple fields were acquired for each representative image. Two-
way ANOVA was used to compare different agents and different time points within each
experiment with a statistically significant difference defined as a P value of less than 0.05.
Calculations were performed with Prism (GraphPad). For the mouse studies, given the size of
the standard deviation of the tumors and the difference in the means between groups of control
and treated mice, at a minimum of n=5 for each group, at 95% power the P values were less than
0.05.

13
Results
CT20p localizes to mitochondria in breast cancer cells and causes cell death.
Elaborating on recently published findings, we initially sought to ascertain if the
cytotoxic actions of CT20p on breast cancer cells was specific for cancer cells when compared to
normal breast epithelial cell. As previously reported, the CT20 peptide can be encapsulated in
polymeric hyperbranched nanoparticles, at an efficiency of 95%, and delivered into various types
of tumor cells types [25]. Treatment conditions and cell viability are routinely assessed with each
batch of CT20 nanoparticles by measuring percent apoptosis (indicated by increased membrane
asymmetry), to establish the dose that kills approximately half of the cells in 48 hours. A
representative experiment (along with a comparative clonogenic survival assay) is shown in
Figure 1. Typically the dose of CT20p that causes about 50% death of cancer cells within 48
hours is ~3.5-4.0 nM CT20p (75-100 μg nanoparticles/ml) (Fig. 1A). This is the dose used for
all experiments shown herein. This same dose is also less toxic with normal epithelial cells (Fig
1A). It is important to note that increasing the dose does increase the rate at which cells die. A
time course of CT20p treatment, encompassing early and late time points, is shown in the
viability assay in Figure 2A. No markers of late apoptotic or necrotic cell death were detected at
3 or 6 hours post-CT20p treatment. We confirmed our previous findings that death, indicated by
changes in plasma membrane symmetry and permeability, was detectable 24 hours after CT20p
treatment in MDA-MB-231 cells [11]. MCF-10A cells were more resistant to the cytotoxic
effects of the peptide at all time points examined (Fig. 1A). Hence, the intramolecular events
that underlie the cancer-specific cell death induced by CT20p likely occur within the first few
hours of treatment before cells display characteristics features of cell death. The cytotoxic
effects of CT20p are not cell line specific because we observed a similar cancer-specific killing

14
trend using freshly isolated breast tumor cells and normal breast epithelial cells from a cancer
patient. In Figure 2B, we show that CT20p killed 48% of the breast tumor cells by 48 hours but
only 10% of the normal epithelial cells.
To track the intracellular localization of CT20p, we labeled the N-terminus of the peptide
with rhodamine (RHO) and encapsulated RHO-CT20p in HBPE-NPs. Previously, we detected
CT20p in mitochondrial-enriched cell fractions [25]. To visualize the association of CT20p with
intracellular organelles, we stained metastatic MDA-MB-231 breast cancer cells or MCF-10A
breast epithelial cells with Mitotracker Green or ER-Tracker Green. Live cell confocal
microscopy enabled detection of co-localized RHO-CT20p (red fluorescence) with organelles
(green fluorescence). In MDA-MB-231 and MCF-10A cells, internalization of RHO-CT20p was
observed within one hour and total red fluorescence indicated that uptake was equivalent (Fig.
3A). Co-localization of RHO-CT20p with mitochondria was detected between 1-3 hours in
MDA-MB-231 cells but not in MCF-10A cells (Fig. 3A). CT20p did not co-localize with the
endoplasmic reticulum (ER) in either cell type (Fig. 3B). Quantitation (Pearson coefficient (PC))
of the co-localization of CT20p with organelles was based on correlating the strength of the
linear relationship between the red and green fluorescent channels. CT20p associated with
mitochondria in MDA-MB-231 cells (PC=0.909) but less so in MCF-10A cells (PC=0.136) (Fig.
2C). Z-planes from the composite images in Figure 1 are shown in Figure 4. These results
suggest that the initial association of CT20p with mitochondria may depend on inherent
metabolic or morphological differences unique to breast cancer cells.
To examine changes in mitochondrial morphology and as a consequence of CT20p
treatment, we used the mitochondrial specific dye, JC-1. The monomeric form of JC-1 in the
cytosol fluoresces green, while mitochondrial-associated JC-1 fluoresces red, with its intensity

15
dependent on the . MDA-MB-231 and MCF-10A cells, treated with CT20p for 0 and 3 hours,
were stained with JC-1 and fluorescence was analyzed by flow cytometry. At the 3 hour time
point, MDA-MB-231 cells, in contrast to MCF-10A cells, exhibited marked
hyperpolarization upon CT20p treatment (Fig. 3D). These results were confirmed by confocal
microscopy (Fig. 3E). Moreover, CT20p altered the distribution of mitochondria in MDA-MB-
231 cells but not MCF-10A cells, causing significant clustering of mitochondria (Fig. 3E).
CT20p promotes the fusion-like aggregation of mitochondria
To investigate the nature of the mitochondrial aggregation observed in CT20p-treated
MDA-MB-231 cells (Fig. 3E), we next examined mitochondrial fusion. To visualize
mitochondrial fusion, cells were transfected with mitoDendra and time-lapse, laser scanning
confocal microscopy performed [31]. Photoconversion of mitoDendra in a restricted region of
the cell generated red mitochondria that were monitored over time for fusion with unconverted
green mitochondria. In Fig. 5A, a schematic shows the experimental design. Cells transiently
transfected with mitoDendra were treated at time 0 with CT20p; 90 minutes later a small region
in each cell was photoactivated to produce red mitochondria. Images were then captured 30
minutes and 1 hour later, encompassing a CT20p treatment window from 1-1/2 to 3 hours. As
shown in Figure 5B, mitochondria in control MDA-MB-231 cells did not fuse in the time
interval observed. Note that in the DIC image, green fluorescent mitochondria in control MDA-
MB-231 cells were distributed throughout the cell, especially at the extensions or protrusions
(Fig. 5B). Significantly, the movement of a MDA-MB-231 control cell (see arrows) was
captured, highlighting the heightened motility of these cells in the absence of CT20. In MDA-
MB-231 cells treated with CT20p, fusion of red and green mitochondria was visible as indicated

16
by the appearance of yellow fluorescence (Fig. 5C). The DIC images of CT20p-treated MDA-
MB-231 cells showed the aggregation of green fluorescent mitochondria (Fig. 5C) that was
previously observed upon JC-1 staining (Fig. 3E). In control or CT20p-treated MCF-10A cells,
no mitochondrial fusion was detected (Figs. 5D-E). DIC images verify cell attachment
throughout imaging. Additional controls, not shown, included the use of an irrelevant peptide
which resulted in outcomes similar to the untreated controls.
The aggregation of mitochondria observed in MDA-MB-231 cells caused by CT20p may
be a consequence of mitochondrial fusion machinery activation. To determine whether CT20p
affected the levels of fusion proteins, the mitochondrial localization of Mitofusin 2 (MFN2) [35,
36] and OPA1 [23] were examined by western blot (Figs. 5F-G). In MDA-MB-231 cells, MFN2
and OPA1 increased following 3 hours of treatment with CT20p (Fig. 5F) and coincided with the
time points at which mitochondrial fusion was observed (Fig. 5C). In contrast, mitochondrial-
localized MFN2 was undetectable in CT20p-treated or untreated MCF-10A cells and only a
slight increase in OPA1 was noted (Fig. 5G). Previously, others had shown that over-expression
of MFN2 caused mitochondrial clustering and cell death [37]. To determine whether
overexpression of MFN2 mimicked the effects of CT20p that we observed in MDA-MB-231
cells, we transfected cells with an MFN2-YFP construct. Cells were also stained with
Mitotracker-Red. Overexpression of MFN2-YFP in both MDA-MB-231 and MCF-10A cells
caused membrane blebbing and morphological changes associated with cell death together with
mitochondrial clustering (Fig. 6A). Moreover, blocking fission with Mdivi-1 [38], a small
molecule inhibitor of the fission protein, Drp1, in MDA-MB-231 cells, caused similar effects on
mitochondria clustering, followed by mitochondrial depolarization and cell death as indicating
using the probe, JC-1 (Fig. 6B). Based on these results, perturbing the mitochondrial

17
fission/fusion machinery in cancer cells represents a viable means for triggering cell death that
may, in part, account, for the actions of CT20p.
CT20p impairs mitochondrial distribution
Referring to the DIC images in Figure 5B, CT20p-treated MDA-MB-231 cells exhibited
a rounded morphology with decreased membrane protrusions. Closer examination of
mitochondrial distribution in CT20p-treated MDA-MB-231 cells by confocal microscopy at 2
hours post-treatment revealed the retraction of mitochondria from membrane ruffles/protrusions
(stained by MitoTracker Green) (Fig. 7A). In contrast, mitochondria in MCF-10A cells were
localized throughout the cell, even after CT20p treatment (Fig. 7B). A possible explanation for
the altered mitochondrial distribution in CT20p-treated cells is that the peptide was impairing
mitochondrial movement. To examine this, cells treated with CT20p were stained with
MitoTracker Green and time-lapse images were obtained at a rate of 5 images/second. The
velocity of mitochondrial movement was determined by tracking individual mitochondria using
Volocity post-analysis software. This analysis revealed that the mitochondria of MDA-MB-231
cells were moving faster than the mitochondria of MCF-10A cells, and movement was reduced
by CT20p treatment (Fig. 7C: see arrows). Calculation of average mitochondrial velocities
under each condition revealed that CT20p caused a four-fold decrease in mitochondrial velocity
in MDA-MB-231 cells as compared to control cells (Fig. 7D).
Since CT20p treatment significantly impacted mitochondrial morphology and movement,
we next examined mitochondrial bioenergetics. Cellular ATP levels were measured 3 hours
post-CT20p treatment and a decrease upon CT20p treatment in MDA-MB-231 cells but not
MCF-10A cells was noted in comparison to untreated cells or control nanoparticles (Figs. 7E-F).

18
Next, we examined the effect of CT20p upon oxygen consumption and mitochondrial coupling
efficiency at the time points that we observed mitochondrial clustering (3-6 hours post-CT20p
treatment), using the Seahorse XFe24 Analyzer. While we observed inherent differences in
mitochondrial respiration and coupling efficiency between MDA-MB-231 and MCF-10A cells,
CT20p had little to no effect on these processes (Fig. 7G). Hence, while the mitochondrial
energy production machinery seemed unperturbed by CT20p at the time points examined,
localized loss of ATP due to mitochondrial aggregation or extracellular release could account for
decreased ATP levels (Fig. 7F). Since it was possible that mitochondrial fusion could alter
cytoskeletal dynamics [6], we next sought to determine if the action of CT20p upon
mitochondria could lead to loss of cell adhesion and deregulate the cytoskeleton.
CT20p disrupts cell attachment and cytoskeletal organization
Localization of mitochondria to cell protrusions is critical for cancer cell migration [20,
39]. Loss of mitochondria redistribution to these regions following CT20p treatment may
therefore have detrimental consequences on cell attachment and motility. We examined whether
CT20p impaired cell attachment with a crystal-violet based cellular adhesion assay. Briefly,
cells were seeded to dishes coated with fibronectin, a known substrate for α5β1 integrins,
followed by treatment with CT20p [40]. In contrast to the CT20p-treated MCF-10A cells that
remained attached, MDA-MB-231 cells detached from the substrate by 6 hours of CT20p
treatment (Fig. 8A-B). Subsequent iterations of this experiment with either uncoated plates or
control nanoparticles revealed similar results. Based on these observations, we determined
whether CT20p-mediated detachment of MDA-MB-231 cells from fibronectin was accompanied
by alterations in integrins such as α5β1 and αVβ3, which are known to be aberrantly expressed in

19
breast cancer [41-44]. Cells were treated with CT20p for 0, 3, and 24 hours and the surface
expression of integrins 1 and 3 integrins was evaluated via flow cytometry with fluorescent
antibodies (Fig. 8C). In MDA-MB-231, but not MCF-10A cells, β1 decreased after 3 hours of
CT20p treatment whereas surface levels of β3 were not altered until after 24 hours (Fig. 8C).
Since CT20p-treated MDA-MB-231 cells detached by 6 hours (Fig. 8A), the early detection of
reduced 1 integrin levels was significant. Assessment of surface expression of 5 and V
integrins was not possible due the lack of available antibodies for flow cytometry, therefore
western blots for 5 and V integrins were performed. In MDA-MB-231 cells, but not MCF-
10A cells, expression of α5 integrin decreased after 3 and 6 hours of CT20p treatment (Fig. 8D).
The αV integrin also decreased upon CT20p treatment in MDA-MB-231 cells or but not in
MCF-10A cells. The decrease in α5 integrin expression detected by western blot at 3hrs post
CT20p treatment (Fig. 8D) mirrored the decreased surface expression of β1 seen by flow
cytometry (Fig. 8C). Thus it is possible that CT20p causes cell detachment, in part, through a
reduction in integrin levels, specifically the early decrease of the α5β1 complex.
Another consequence of the reduced mitochondrial movement induced by CT20p could
be decreased actin polymerization. Recently, others have shown that mitochondrial
redistribution was required for actin polymerization [20]. To examine this, cells were stained
with Mitotracker Red, the F-actin specific dye phalloidin-AF633 (pseudocolored green), the
nuclear stain DAPI (blue) and imaged by confocal microscopy. CT20p treatment for 3 and 6
hours in MDA-MB-231 cells impaired mitochondrial distribution and dramatically reduced the
amount of F-actin detected (Fig. 9A). In control MDA-MB-231 cells (0 hr), as well as control
and CT20p-treated MCF-10A cells, F-actin was detectable (Fig. 9A-B). F-actin levels were
quantitated and revealed a general decrease in F-actin in CT20p-treated MDA-MB-231 cells over

20
time, with statistically significant changes noted at the 6-hour time point compared to control
cells (Fig. 9C). No significant changes were noted in the expression of beta-actin (Fig. 9D).
Therefore, we concluded that CT20p, in addition to its actions on the mitochondria, inhibited the
polymerization of actin filaments in breast cancer cells but not in breast epithelial cells.
CT20p causes breast cancer cell death in vitro and in vivo
To continue our investigation into the cytotoxic effects of CT20p, we examined the
lethality of the peptide under hypoxic conditions associated with tumor environments. Increased
cell death of MDA-MB-231 cells that were treated with CT20p for 48 hours was detected under
hypoxia mimicking conditions (Fig. 10A), indicating that the cytotoxicity of the peptide was
likely unimpaired under low oxygen conditions.
Next, we assessed the capacity of CT20p to act as a therapeutic agent in vivo in a murine
breast tumor model. MDA-MB-231 cells were subcutaneously implanted in mice and tumor
growth measured by ultrasound and calipers. Groups of mice with tumors (~5-8 mm2) were
given two sets of intravenous injections of CT20p over a two-week period. Post-treatment tumor
size was monitored by ultrasound (every 2-3 days). Two different HBPE-NPs were used for
delivery: untargeted carboxylated (COOH) nanoparticles (used in in vitro experiments) and
folate-decorated (FOL) nanoparticles that target cells expressing folate receptors, such as MDA-
MB-231 cells [44]. From our previous studies, we knew that untargeted and folate-targeted
nanoparticles were equally effective in vitro, however we anticipated that the folate-targeted
nanoparticles would concentrate more effectively in tumors when intravenously introduced.
Further, to improve circulation of the nanoparticles and prevent uptake by the reticuloendothelial
system, nanoparticles were pegylated, which did not impair uptake by cells (Fig.11). Mice were

21
treated twice with HBPE-NPs and the net change in tumor size, determined during the 14 day
period for each group of mice, is shown in Figure 10B. When CT20p was delivered in COOH-
NPs, tumor growth was inhibited. When delivered in FOL-NPs, which promoted increased
concentration of the nanoparticles within tumors, CT20p caused significant tumor regression,
with little to no tumor detected after 14 days. In contrast, tumors continued to grow in mice
receiving only PBS or HBPE-NPs with an irrelevant peptide. As a positive control, a group of
mice received FOL-targeted doxorubicin (DOX). CT20p proved as effective if not better than
DOX, an established agent employed in breast cancer chemotherapy that can display adverse
systemic effects. Hematoxylin & eosin stained sections of liver and spleen (where untargeted
HBPE-NPs could accumulate) from CT20p treated mice were evaluated by a pathologist and
found to have no overt signs of necrosis or damage, while targeted tumor tissue did display areas
of necrosis (Fig. 11). In a representative experiment shown in Figure 10C, we display ultrasound
images from three mice in which tumors growth was monitored for ~1 month. During this time,
one mouse, whose tumor was ~8mm2 after two weeks, was treated with FOL-CT20p twice,
while another mouse was treated with FOL-CT20p in a similar manner but the tumor had grown
for one week and was ~1.5mm2. In both instances, CT20p impaired tumor growth indicating that
its activity could be independent of tumor size. However, note that tumor vascularity can affect
intravenous delivery of drugs. While preliminary, these results indicate that CT20p encapsulated
in nanoparticles can be targeted to tumors and as such has promising use as an anti-cancer agent.

22
Figures
Figure 1: CT20p dose response in MDA-MB-231 cells
MDA-MB-231 cells were treated with CT20p at doses from 0-5600 nM (peptide) and long term survival
assessed by clonogenic assay as described in Methods. Control (CTRL) was an irrelevant peptide
encapsulated in nanoparticles.

23
Figure 2: CT20p causes breast cancer cell-specific death
(A) MDA-MB-231 cells and MCF-10A cells were treated with CT20p, delivered in nanoparticles as described in Methods, for the indicated
time points. Cells were stained with Sytox AADvanced and F2N12S dyes, and cell viability was assessed by flow cytometry. Three cell
populations are identified and denoted as V (viable), A (apoptotic), and N (necrotic). Percentages of viable cells (black) and
apoptotic/necrotic cells (red) are shown. (B) Normal breast epithelial cells and breast tumor cells were isolated as described in the Methods,
treated with CT20p and cell viability examined as described above.

24
Figure 3: CT20p localizes to the mitochondria and increases the mitochondrial membrane potential in breast cancer cells
(A-B) MDA-MB-231 and MCF-10A cells were treated with rhodamine labeled CT20p (RHO-CT20p), delivered in nanoparticles as described
in Methods, stained with Mitotracker green (A) or ERtracker green (B) for the indicated times, and analyzed by live cell imaging. Co-
localization is denoted by yellow fluorescence. Scale shown is 25µM (MDA-MB-231) and 10M (MCF-10A). Inset magnification scale is
5µM. (C) Co-localization coefficients of RHO-CT20p were calculated from data in A and B. *p>0.05. (D-E) MDA-MB-231 and MCF-10A
cells were treated with CT20p as in (A-B), stained with the mitochondrial permeable dye, JC-1, and analyzed by flow cytometry (D) and
confocal microscopy (E). H, high; M, mid; and L, low indicate mitochondrial membrane potential. Scale shown is 10 µM.

25
Figure 4: CT20p localizes to the mitochondria
Supplemental Figure 2. CT20p localizes to the mitochondria. MDA-MB-231 and MCF-10A cells were
treated with rhodamine labeled CT20p (RHO-CT20p), delivered in nanoparticles as described in
Methods, stained with Mitotracker green (A) or ERtracker green (B) for the indicated times, and analyzed
by live cell imaging. Co-localization is denoted by yellow fluorescence. Z-planes and extended focus
images for the 3 hour time point are shown.

26
Figure 5: CT20p causes fusion of mitochondria in breast cancer cells
(A) Experimental plan is shown in schematic. At time 0, cells expressing MitoDendra, a photo-
activatable mitochondrial targeted fluorescent protein to monitor fusion, were treated with CT20p,
delivered in nanoparticles, as described in Methods. After 90 minutes, cells were photo-activated to
produce red mitochondria and images were acquired 30 and 60 minutes later. Mitochondrial fusion was
thus observed between 1-1/2 to 3 hours post-CT20p treatment. (B-E) MDA-MB-231 cells (B-C) or
MCF-10A cells (D-E) were treated as described in (A). The green represents un-converted mitoDendra,
the red is photo-activated mitoDendra, and the yellow results from fusion of red and green mitochondria.
Arrows and inset indicate areas of photo-activation and movement of cells. Cells were untreated (CTRL)
(B, D) or treated with CT20p (C, E) as described in (A)... Representative images were acquired from
time-lapse movies taken over a 90-minute period. Scale shown is 20,000 nM or 20 M. The scaling of
the images was adjusted in panel B to show the movement of cells within a larger field of vision. Similar
movement was not observed in MCF-10A cells or upon treatment with CT20p. (F-G) Mitochondria
lysates from MDA-MB-231 cells (F) and MCF-10A cells (G), treated with CT20p delivered in
nanoparticles, were subjected to SDS-PAGE and immunoblotted for fusion proteins, MFN2 and OPA1.
Prohibitin is a loading control for mitochondrial proteins. Fold changes were determined by densitometry
for each blot. Images were cropped to improve presentation.

27
Figure 6: Mitochondrial appearance upon induction of fusion or inhibition of fission
(A) MDA-MB-231 cells and MCF-10A cells were transfected with pMFN2-YFP and live cell imaging
performed over a 22-hour period. At the final time point, cells were stained with Mitotracker red.
Snapshots from the 6, 14 and 22 hour time points were acquired from time lapse movies. (B) MDA-MB-
231 cells were treated with MDivi-1 (5M), stained with JC-1 and live cell imaging performed over a 24
period. Snapshots were acquired from the 1, 3 and 24 hour time points form the time lapse movies.

28
Figure 7: Mitochondrial movement and velocity decreases with CT20p treatment in breast cancer cells.
(A-B) MDA-MB-231 cells (A) or MCF-10A cells (B) were untreated or treated with CT20p, delivered in
nanoparticles as described in Methods, for 0-2 hours and stained with Mitotracker-green. Time-lapse
movies were acquired at 5 images/sec for 2 minutes. Representative endpoint images from movies are
shown. (C) Digitally magnified images show mitochondria from representative images (A-B). Scale for
images is 12 µM (A, B) and 6 µM (C). (D) Mitochondrial velocity calculations were made with Volocity
software (Perkin Elmer) using data from (A-B). (E-F) Intracellular ATP levels were measured in MDA-
MB-231 cells (E) and MFC-10A cells (F) untreated (UNT), treated with CT20p as above or an irrelevant
peptide (CTRL) for 3 hours. (G-H) MDA-MB-231 or MCF-10A cells were untreated or treated with
CT20p as above for 3 hours and which point (see red arrow) mitochondrial stress analysis was performed
using the Seahorse XFe24 analyzer. Oxygen consumption (G) and mitochondrial coupling efficiency (H)
was determined following timed additions of inhibitors as described in Methods. Assay time was ~ 2
hours, for a total CT20p treatment time of ~5 hours. *p>0.05.

29
Figure 8: CT20p treatment reduces cell adhesion and integrin levels in breast cancer cells
(A-B) MDA-MB-231 (A) and MCF-10A (B) cells were untreated (CTRL) or treated with CT20p, delivered in nanoparticles as described in
Methods, and cell adhesion measured at time points indicated using a standard crystal violet adhesion assay. *p<0.05. (C) MDA-MB-231 and
MCF-10A cells, treated with CT20p as above, for 0, 3 and 24 hours, were analyzed for 1 (CD29) and 3 (CD61) integrins by flow cytometry
using fluorescently-tagged antibodies as described in Methods. Median peaks values are shown in table. (D) Cell lysates from MDA-MB-231
and MCF-10A cells, treated with CT20p as above for 0, 3, 6 and 24 hours were immunoblotted for expression of 5 and V integrins. p38
MAPK is shown as loading control for whole cell lysates. Fold changes refer to the representative blots shown. Images were cropped to
improve presentation.

30
Figure 9: Detection of F-actin is reduced upon CT20p treatment in breast cancer cells
(A-B) MDA-MB-231 cells (A) and MCF-10A cells (B) were treated with CT20p, delivered in
nanoparticles as described in Methods, for the times indicated. Cells were stained with Mitotracker red
and then fixed and stained with DAPI (nucleus) (blue) and Phalloidin for F-actin (pseudo-colored green)
as described in Methods. Scale shown is 20,000 nM or 20 M and inset magnification scale is 5 µM.
(C) Average F-actin per cell was determined as described in Methods. *p<0.05. (D) Cells above were
treated with CT20p for 3 hrs and then Mitotracker red was added. Cells were fixed and stained with
DAPI (nucleus) (blue) and b-actin (total actin) (green). Images were visualized by fluorescent
microscopy. Scale is 20,000 nm or 20 M.

31
Figure 10: CT20p treatment impairs growth of breast tumors implanted in mice
(A) MDA-MB-231 cells were treated with CT20p under “hypoxia-mimicking” conditions as described in
Methods. After 48 hours, cells were stained with Sytox AADvanced and F2N12S dyes, and cell viability
was assessed by flow cytometry (see Figure 1A). Populations are denoted as V (viable), A (apoptotic),
and N (necrotic). Percentages of viable cells (black) and apoptotic/necrotic cells (red) are shown. (B)
Mice (n=5) with subcutaneous tumors (MDA-MB-231 cells) were treated twice (after ~ 0 and 7 days from
tumor detection) with PBS control, folate-receptor targeted doxorubicin (FOL-Dox), folate-receptor
targeted control nanoparticles with an irrevelant peptide (FOL-NP) or folate-receptor targeted CT20p
nanoparticles (FOL-CT20p) over a two week period as described in Methods. Non-targeted nanoparticles
loaded with CT20p (COOH-CT20p) were also used. *p<0.05. (C) Representative ultrasound images
shown from mice treated with PBS, or FOL-CT20p are shown. Tumor growth curves indicate the size of
tumors and the times (arrows) of treatment over a 36 day period. Ultrasound images were acquired at the
endpoint of the experiments.

32
Figure 11: Uptake of nanoparticles in MDA-MB-231 and MCF-10A cells
(A) Pegylated or unpegylated nanoparticles loaded with DiI dye were used to show equal uptake by
MDA-MB-231 and MCF-10A cells using flow cytometry. (B) Tumor, liver and spleens were acquired
from mice treated with control HBPE-NPs or CT20p-HBPE-NPs at the endpoint of the experiments.
Tissue was fixed, embedded, sectioned mounted on slides and processed for hematoxylin and eosin (H &
E) staining following standard procedures. Images for tumor and liver were acquired at 200X total
magnification and spleen at 100X total magnification. Necrotic tissue was identified by a pathologist.

33
Discussion
In our study, we describe a novel therapeutic peptide, CT20p, based on the C-terminus of
Bax, which displays cancer-specific cytotoxic activity. In susceptible cancer cells, CT20p
localized to mitochondria and promoted fusion-like aggregation, mitochondrial membrane
hyperpolarization, and hindered mitochondrial movement. Furthermore, CT20p reduced integrin
expression and impaired polymerization of the actin cytoskeletal prior to cancer cell detachment
and death. As a result, treatment of mice, bearing subcutaneous tumors, with CT20p delivered in
HBPE-NPs targeted to the folate receptor, led to complete tumor regression. Therefore, CT20p,
by disrupting mitochondrial redistribution and the cytoskeleton, could limit metastatic cancer cell
movement and hasten the death of these cells.
Mitochondria are highly motile organelles, which possess the capability to re-localize to
subcellular regions of a cell depending on local energy demands [18]. Recent evidence indicates
that mitochondria in cancer cells are physiologically different from non-transformed cells [20].
One study showed that cancer cell mitochondria preferentially rely on HSP90 chaperones, to
maintain energy production during tumor progression and metastasis [45]. Moreover, two other
studies suggested a role for dynamic mitochondrial changes in the support of cancer cell motility
[19, 20]. Silencing the expression of the fission protein Drp1 in MDA-MB-231 and MDA-MB-
436 cells caused mitochondria to assume an elongated morphology and reduced the invasiveness
of these cells [20]. Further, the polarity of mitochondrial localization in metastatic cells was
associated with cell directional movement, and the disruption of fusion and fission interfered
with mitochondrial localization and cell migration velocity [19]. Therefore, altering the
fragmented mitochondrial phenotype that may be a metabolic adaptation in metastatic breast

34
cancer cells could impair essential biological activities on which these cells have come to rely.
Indeed, deregulation of mitochondrial fission can alter cell cycle progression, impair
mitochondrial function and promote mitochondrial loss [46, 47].
There is precedent for the effect that CT20p has on mitochondrial physiology. A study of
the soluble, monomeric form of Bax revealed that it interacts with and regulates MFN2
homotypic complex formation, thus favoring mitochondrial fusion [48]. This fusion-inducing
activity of Bax is separable from the oligomerized form which inserts into the mitochondrial
membrane to induce apoptosis. However, it is unknown how Bax interacts with MFN2 to
regulate fusion and if a particular domain within Bax is driving this interaction. It remains to be
determined whether the C-terminus of Bax could exhibit similar actions towards MFN2 as does
the full-length protein, but it is possible given our findings that CT20p promotes a fusion-like
aggregation of mitochondria that is accompanied by elevated levels of MFN2. An alternative
explanation, existing literature suggests that, by forming a pore, Bax could participate or favor
mitochondrial fusion [49]. In previous studies of CT20p, we found that the peptide formed pores
in mitochondrial-like lipid vesicles [13]. It may be that by forming pores, CT20p enables the
fusion or aggregation of mitochondria that prevents the redistribution of this organelle. CT20p
could also interfere with the movement of cellular components on microtubules, disrupting
interactions such as that between MFN2 and Miro-1, and retard the transport of cargo, like
mitochondria or integrins.
The effective use of therapeutic peptides derived from endogenous proteins is challenged
by the lack of optimal delivery strategies. In our studies, we capitalized on the hydrophobic
nature of CT20p and the use of HBPE-NPs that can be conjugated to targeting ligands to guide
them to specific cell surface targets [14]. The HBPE-NPs protected CT20p while in circulation

35
and allowed efficient uptake by targeting tumor cells. Once taken up by cells, the peptide was
released from the nanoparticles and bound to mitochondria in cancer cells as we have shown in
our studies. Further, we validated that CT20p affects the cytoskeleton, a “druggable node” for
metastatic disease [50], in part by impairing mitochondrial redistribution to energy demanding
regions of the cell, like cell protrusions. The next step to fully exploit the clinical utility of
CT20p, and is the focus of continuing studies, is identifying the unique aspects of cancer cell
mitochondria that are targeted by the peptide.

36
CHAPTER 3: TARGETING THE CHAPERONIN CCT
WITH THE CT20 PEPTIDE INDUCES CYTOSKELETAL DISRUPTION
AND BREAST CANCER CELL DEATH
Introduction
Breast cancer is the most commonly diagnosed cancer, and the second leading cause of
death, in women in the United States [2], a trend that is mirrored worldwide [1]. Although
effective treatments have reduced the mortality associated with the disease significantly, new
therapeutics are needed to address gaps in treatment repertoire. Particularly needed are
treatments aimed towards triple negative breast cancers – those that do not express estrogen,
progesterone, and Her2 receptors. Triple negative breast cancer (TNBC) is associated with a high
risk of metastasis and recurrence, and has been difficult to treat in a targeted manner [8].
We have previously presented CT20p, a hydrophobic peptide derived from the C-
terminal of Bax, as a cytotoxic agent when delivered to cancer cells [15, 51]. The hydrophobicity
of CT20p allows it to be efficiently incorporated into hyperbranched polyester nanoparticles
(HBPE-NPs), providing a means of effective delivery to cells [14, 15, 51]. Nanoparticle
encapsulation not only increases stability of the peptide, but also allows for targeted delivery
when the nanoparticle is decorated with various ligands. When delivered to breast and colon
cancer cells, CT20p caused cell death and tumor regression in mice [15, 51]. Exploring the
mechanism of CT20p’s action has been the subject of our recent work.
Many anti-cancer therapeutic peptides studied have been naturally occurring anti-
microbial agents. These peptides have the ability to penetrate not only microbial membranes, but
also the mammalian mitochondrial membrane [21, 22]. Due to the similarity of CT20p to these
peptides in sequence and the ability to permeabilize lipid vesicles [12, 13], we had previously
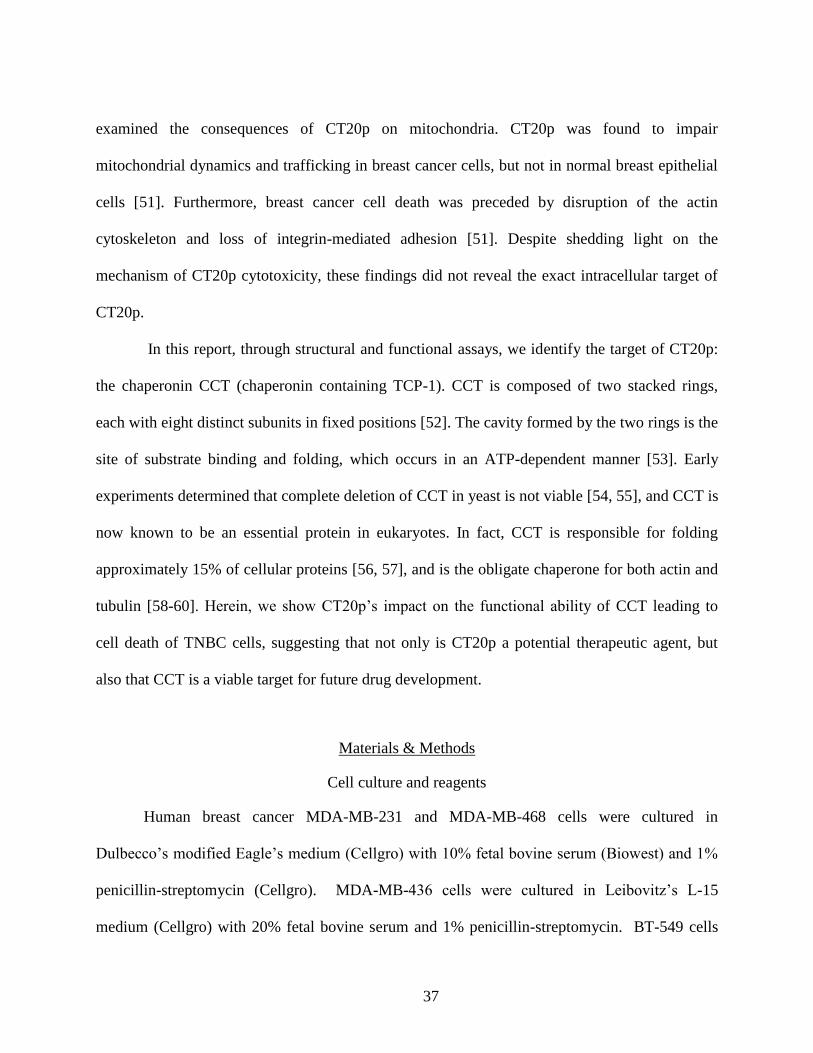
37
examined the consequences of CT20p on mitochondria. CT20p was found to impair
mitochondrial dynamics and trafficking in breast cancer cells, but not in normal breast epithelial
cells [51]. Furthermore, breast cancer cell death was preceded by disruption of the actin
cytoskeleton and loss of integrin-mediated adhesion [51]. Despite shedding light on the
mechanism of CT20p cytotoxicity, these findings did not reveal the exact intracellular target of
CT20p.
In this report, through structural and functional assays, we identify the target of CT20p:
the chaperonin CCT (chaperonin containing TCP-1). CCT is composed of two stacked rings,
each with eight distinct subunits in fixed positions [52]. The cavity formed by the two rings is the
site of substrate binding and folding, which occurs in an ATP-dependent manner [53]. Early
experiments determined that complete deletion of CCT in yeast is not viable [54, 55], and CCT is
now known to be an essential protein in eukaryotes. In fact, CCT is responsible for folding
approximately 15% of cellular proteins [56, 57], and is the obligate chaperone for both actin and
tubulin [58-60]. Herein, we show CT20p’s impact on the functional ability of CCT leading to
cell death of TNBC cells, suggesting that not only is CT20p a potential therapeutic agent, but
also that CCT is a viable target for future drug development.
Materials & Methods
Cell culture and reagents
Human breast cancer MDA-MB-231 and MDA-MB-468 cells were cultured in
Dulbecco’s modified Eagle’s medium (Cellgro) with 10% fetal bovine serum (Biowest) and 1%
penicillin-streptomycin (Cellgro). MDA-MB-436 cells were cultured in Leibovitz’s L-15
medium (Cellgro) with 20% fetal bovine serum and 1% penicillin-streptomycin. BT-549 cells

38
were cultured in RPMI (Cellgro) with 8ug/mL insulin (Santa Cruz), 10% fetal bovine serum, and
1% penicillin-streptomycin. Breast epithelial MCF-10A cells were cultured in Mammary
Epithelial Cell Growth Media (Lonza) with 1% penicillin-streptomycin. All cell lines were
obtained from ATCC and used for experiments prior to passage 10. CT20p (Ac-
VTIFVAGVLTASLTIWKKMG-NH2) and biotin-tagged CT20p were commercially synthesized
(Biopeptide Co., Inc) at >98% purity. Purified recombinant CCTβ derived from E.coli was
obtained commercially (MyBioSource) at >90% purity.
Cellular adhesion assay
96-well tissue culture plates were coated with 20 ug/mL fibronectin (Sigma) overnight at
4°C. Cells were then seeded in the plates at a density of 10,000 cells/well. Cells were treated
with varying doses of CT20p for 48 hours. Plates were then shaken at 1400 rpm for 15 seconds,
washed, and fixed with 10% neutral buffered formalin (Leica). Adhered cells were stained with 5
mg/mL crystal violet (Sigma) and absorbance at 595 nm was read on an EnVision plate reader
(Perkin Elmer).
Measurement of cell viability
Cells at 60% confluency were treated with CT20p at a dose of 75 ug/mL for varying
lengths of time. Following treatment, cells were collected and stained with Sytox AADvanced
and F2N12S Violet Ratiometric Apoptosis kit (Invitrogen). Data was acquired by flow cytometry
on a FACS Canto (BD Biosciences), and analyzed with FCSExpress software (DeNovo).
Measurement of oxygen consumption and extracellular acidification
24-well culture plates for use with the Seahorse XFe24 analyzer were coated with Cell-
Tak (BD Bioscience) at 3.5 ug/cm2. Cells were then seeded at 60,000 cells/well and allowed to

39
adhere overnight. Measurements of oxygen consumption rate and extracellular acidification rate
were obtained using a Seahorse XFe 24 analyzer (Seahorse Bioscience). To obtain mitochondrial
metabolic profiles, injections of oligomycin (1 uM), FCCP (0.3 uM), rotenone (0.1 uM), and
antimycin A (2 uM) were performed. The mitochondrial coupling efficiency was calculated as:
[1 – (minimum oligomycin response/final basal measurement)] X 100
To obtain glycolytic metabolic profiles, injections of glucose (10 mM), oligomycin (1
uM), and 2-deoxy-D-glucose (100 mM) were performed. Glycolytic reserve capacity was
calculated as: maximum oligomycin response – maximum glucose response. All reagents were
obtained from Seahorse Bioscience.
To test the effect of CT20p on metabolic processes, cells were treated with CT20p at a
dose of 75 ug/mL for 24 hours post-seeding, and prior to running the assay. Metabolic capacity
was defined as the maximum recorded measurement in both mitochondrial and glycolytic
contexts. CT20p-treated results were calculated as a percentage of untreated results.
Immunoblotting
Cell lysates were obtained by mechanical douncing in fractionation buffer consisting of
210 mM sucrose, 70 mM mannitol, 10 mM HEPES, 1 mM EDTA, pH 7.4. Lysates were
centrifuged at 1,000xg for 10 minutes at 4°C, and the supernatants were subjected to SDS-
PAGE, followed by transfer to Immobilon-FL membranes (Millipore). Blots were probed with
primary antibodies against CCTβ (Millipore), CCTΔ (Abcam), CCTε (Abcam), or p38 (Santa
Cruz) . Detection was performed by incubation with IRDye 800CW or IRDye 680CW secondary
antibodies (LI-COR), followed by imaging on the Oddysey detection system (LI-COR).
Quantificition of Western blots was performed with Image Studio software (LI-COR). Proteins

40
of interest were quantified relative to p38 loading controls, then normalized to the level in MCF-
10A cells.
Quantitation of gene expression
RNA was obtained from cells using Trizol (Invitrogen) according to the manufacturer’s
protocol. cDNA was synthesized from 2.5 µg RNA using the iScript Advanced cDNA Synthesis
kit (Bio-Rad). Quantitative real-time PCR was performed on a 7900HT Fast Real-Type PCR
system (Applied Biosystems). Reactions were prepared in triplicate using SSoAdvanced
Universal SYBR Green Supermix (Bio-Rad) and PrimePCR Assays to the following proteins:
CCT2, CCT4, CCT5, and GAPDH (Bio-Rad). Levels of CCT subunits were compared to the
endogenous control GAPDH. Expression levels were calculated relative to the lowest expressed
subunit: CCT4 in MCF-10A cells. Relative expression (RQ) values were calculated using the
formulas:
ΔCT = CT of target gene (CCT) - CT of endogenous gene (GAPDH)
ΔΔCT = ΔCT – reference gene (MCF10A CCT4)
RQ = 2-ΔΔCT
Pull-down experiments
Lysate pull-downs were performed with 200ug cell lysate, obtained by douncing as
described above. Lysates were pre-cleared with streptavidin-agarose beads (Pierce), then
incubated with 10ug of CT20-Biotin or biotin for 3 hours at room temperature, followed by
overnight incubation at 4°C with streptavidin-agarose beads. Beads were washed thoroughly
with wash buffer (25 mM Tris, 150 mM NaCl, 0.1% NP40, pH7.4), then heated in 4x loading
buffer (Invitrogen) for analysis by SDS-PAGE. Mass spectrometric analysis was performed by

41
Moffit Cancer Center (Tampa, FL). Mass spectrometry results presented are of proteins with at
least two unique peptides identified, and that were not recovered with biotin-only pull down.
In-cell pull downs were performed by first delivering CT20p-Biotin encapsulated in
nanoparticles to viable cells at a dose of 75 ug/mL for varying lengths of time. Following
treatment, cells were collected and lysed by douncing. 200ug of cell lysate were then incubated
with streptavidin-agarose beads overnight at 4°C, and pull-down was completed as described
above.
For competition pull downs, 200ug of pre-cleared cell lysate were first incubated with the
competing peptide for 1 hour at room temperature, followed by incubation with the CT20p-
Biotin for 1 hour at room temperature. The amounts of competing peptide and CT20p-Biotin
were varied as described in the Results section. Samples were then incubated with streptavidin-
agarose beads overnight at 4°C.
Pull-downs with recombinant CCTβ were performed in 20 mM Tris-HCl buffer. 0.1 nmol
of CCTβ was used for each pull down, and the amount of CT20p-Biotin was varied between 0.1
nmol and 4 nmol.
Migration assay
The Oris cell migration assembly kit (Platypus Technologies) was used. Cells were
stained with CellTrace Violet (Life Technologies) according to manufacturer’s protocol.
Stoppers were placed in wells of a 96-well plate before cells were seeded at a density of 30,000
cells per well. For experiments involving CT20p treatment, treatments with CT20p were began
18 hours following seeding and allowed to continue for 24 hours. Treatments were done in
quadruplicate. At the end of the treatment period, stoppers were removed to create an exclusion

42
zone that the cells would migrate into. MDA-MB-231 cells were allowed to migrate for 10
hours. MCF-10A and MCF-10A EMT cells were allowed to migrate for 20 hours. Following the
migration period, fluorescent images were obtained using a Plate Runner HD (Trophos). One set
of wells had stoppers removed immediately before imaging and served as the control that
provided the pre-migration area. Images were analyzed by ImageJ software (NIH) by using the
wand tool to automatically define and measure the migration zone. % closure was calculated as
[(pre migration area – migration area)/ pre migration area] x 100.
Fixed-cell immunofluorescence
Cells were seeded on glass coverslips (Fisher) in a 6-well plate at a density of 150,000
cells/well. Cells at 60% confluency were treated with CT20p or left untreated for 24 hours. After
CT20p treatment, cells were stained with Mitotracker Red CMXRos (Life Technologies) at a
concentration of 200nM for 30 minutes, before being fixed in ice cold methanol for 10 minutes
at -20°C. Cells were then permeabilized in 0.1% Triton X-100 for 10 minutes at 37°C. Samples
were blocked in 5% normal goat serum (Santa Cruz) for 30 minutes at 37°C, then incubated with
primary antibody α-tubulin (DM1A) (Santa Cruz) for 3 hours at 37°C. Secondary antibody was
goat α-mouse IgG-FITC (Santa Cruz) and was applied for 1 hour at room temperature.
Coverslips were mounted in UltraCruz mounting media (Santa Cruz), which contains DAPI for
nuclear staining. Images were obtained with a Zeiss LSM 710 microscope, using a Zeiss 63x
Pan-Apocromat oil immersion lens and Zeiss Zen software. To determine average tubulin levels
per cell, the amount of FITC fluorescence intensity per region of interest was divided by the
number of cells in the field. At least four images containing between 5 and 12 cells were
quantified for each condition. Image analysis was done using Volocity software (Perkin Elmer).

43
Overexpression of CCTβ
MCF-10A cells were transiently transfected with CCTβ, expressed from a pcDNA 3.1 (+)
vector (GenScript). Transfections were performed with LT1 reagent (Mirus) according to the
manufacturer’s instructions. To assess protein expression, cells were harvested 24 hours
following transfection and subjected to immunoblotting for CCTβ. To assess transfection
efficiency, parallel transfections were carried out with GFP under the same conditions, and the
percentage of GFP+ cells was determined using an Accuri C6 cytometer (BD Bioscience). For
viability assessment, cells were treated with CT20p at a dose of 75 µg/mL for 24 hours.
Treatments were started 24 hours after transfection.
Immunohistochemistry
Tissue arrays containing multiple samples of human breast cancer tissue were purchased
from US Biomax. Catalog numbers for the specific arrays analyzed are as follows: BR1002a,
BR10010b, BR963a, and HBre-Duc150-Sur01. Information about the tissue type, tumor grade,
and receptor status were provided. Array HBre-Duc150-Sur01 also provided information on
survival/deceased status of the patient, as well as duration of monitoring in months. Tissues were
analyzed using anti-CCTβ primary antibody (LifeSpan Biosciences) diluted 1:100 in Antibody
Diluent (Leica). Staining of tissue arrays was performed by a Bond-Max Immunostainer (Leica),
with an epitope retrieval buffer of EDTA pH 9.0 (Leica). Polymer Refine Detection reagents
(Leica) were used, which include a hematoxylin counterstain. Scoring of CCTβ staining was
done by a pathologist based on staining intensity, as described in Figure 21.

44
Statistical analysis
Experiments were replicated at least 3 times, with representative data presented in this
report. For migration and microscopy experiments, data was analyzed using a student’s t-test to
compare treated and untreated results. For scoring of CCTβ staining in tissue samples, one-way
ANOVA was used to compare staining between the various groups. Survival data was analyzed
by log-rang (Mantel-Cox) test. Calculations were performed using GraphPad Prism software
(GraphPad). Statistical significance was defined as p<0.05.
Results
CT20p is cytotoxic to a variety of TNBC cell lines
Among the challenges of treating TNBC has been the vast heterogeneity of these cancers
at a molecular level. Gene expression profiling has been employed broadly to better understand
molecular drivers of breast cancer [61]. Analysis of gene expression of triple negative tumors has
led to definition of several subgroups based on differential expression patterns, including basal-
like, mesenchymal-like, and mesenchymal stem-like subtypes [62]. Indeed, TNBC cell lines
were variably sensitive to therapeutic agents in keeping with the genetic pathways upregulated in
the different subtypes [62]. To obtain a representative sampling of TNBC subtypes for our
studies, we have examined four TNBC cell lines: MDA-MB-468 of the basal-like 1 subtype; BT-
549 of the mesenchymal-like subtype; and MDA-MB-231 and MDA-MB-436 of the
mesenchymal stem-like subtype. These were contrasted to the normal breast epithelial line MCF-
10A.
To study CT20p as a therapeutic agent, we have employed an efficient delivery system
consisting of hyperbranched polyester nanoparticles (HBPE-NPs). The peptide is effectively

45
sequestered upon formation of the nanoparticle, but low pH, such as that found in the endocytic
environment of the cell, induces release of the cargo from the HBPE-NPs [14, 15]. We have
previously seen that uptake of HBPE-NPs is comparable in MDA-MB-231 and MCF-10A cells
using dye-loaded HBPE-NPs (data not published) and rhodamine-labeled CT20p encapsulated in
HBPE-NPs [51]. Therefore, all experiments involving CT20p delivery to cell lines were
performed with HBPE-NPs.
We examined the effect of CT20p on our panel of cell lines by measuring the impact on
cellular adhesion. Metastatic cells are known to vary their adhesion patterns as dictated by their
environment [63], and targeting adhesion ability could mitigate metastasis. We have previously
reported that CT20p caused cell detachment prior to cell death in MDA-MB-231 cells, which
correlated with abnormal cytoskeleton organization and decreased integrin expression on the cell
surface [51]. To examine the remaining cell lines, plates were coated with fibronectin to provide
an appropriate substrate for adhesion, and cells were treated with CT20p for 48 hours at varying
doses (Fig. 12A). CT20p was found to cause a dose-dependent loss of adhesion, most notably in
MDA-MB-231 and MDA-MB-436 cells. Interestingly, both of these cell lines fall into the
mesenchymal stem-like (MSL) subtype of TNBC [62]. CT20p’s effect varied among the cell
lines, with MCF-10A and BT-549 cells being particularly unaffected by treatment. This data also
led us to determine an effective working concentration of 75 ug nanoparticles per mL, which is
equivalent to ~3.5 nM CT20p. Treating at this dose would allow us to observe the molecular
effects of the peptide prior to cell death.
We have previously shown that MDA-MB-231 cells were highly susceptible to CT20p,
with a 70% decrease in viability following treatment. Conversely, breast epithelial MCF-10A
cells displayed only minimal loss of viability upon treatment [51]. To complete this data, we also

46
assessed the cytotoxicity of CT20p to the remaining cell lines. To do this, cells were treated with
the effective dose of CT20p in a time course-experiment, and membrane symmetry and
permeability were examined by flow cytometry (Fig 12B). The cell lines displayed varying
susceptibilities to CT20p, with the degree of cytotoxicity correlating with the loss of adhesion
observed in each cell line. MDA-MB-436 cells were most sensitive to CT20p, displaying
characteristics of cell death as early as 6 hours of treatment. BT-549 cells, on the other hand,
were resistant to the effects of the peptide. This supported the adhesion data indicating that
MDA-MB-231 and MDA-MB-436 cells, those of the MSL subtype, are highly susceptible to the
CT20p.
Therefore, while we had previously postulated that the effect of CT20p was cancer cell
specific, as evidenced by MCF-10A cells being unaffected, we now observe that the cytotoxic
effect is also varied among cancer cell lines. Hence, the target of CT20p’s action that elicits a
cell death response is likely a variable factor in cancer cells. This is supported by evidence in the
literature showing that TNBC cells respond variably to a variety of chemotherapeutic drugs [62,
64].
CT20p’s cytotoxic effects are independent of cellular metabolism
In an effort to understand the varying efficacy of the cytotoxic mechanism of CT20p, we
turned to examination of the intracellular environment. The subtypes of TNBC vary in their
utilization of various metabolic processes, and their reliance on signaling pathways, such as EGF
signaling, that may influence metabolism [62]. Because a portion of the CT20p delivered to the
cell localizes to mitochondria [51], we examined whether the cell’s metabolic environment was a

47
driver of CT20p’s effect. To characterize the metabolic phenotype of our TNBC cell lines, we
measured both mitochondrial oxidative respiration and glycolytic flux.
To gain a full understanding of the cell’s metabolic responses, inhibitors and stimulators
were applied over the course of the assay. By introducing glucose, oligomycin, and 2-
deoxyglucose (2-DG) in sequence, we were able to first activate glycolysis before complete
inhibition. Glycolytic profiles, displayed as extracellular acidification rate (ECAR), were
inherently varied among the cell lines (Fig. 13A). Glycolytic reserve capacity, which represents
the difference between the maximum glycolytic flux induced by oligomycin and the basal flux
induced by glucose, also varied (Fig. 13B).
To create an oxidative phosphorylation profile, oligomycin, FCCP, rotenone, and
antimycin A were used to induce both down regulation and upregulation of respiration,
represented by oxygen consumption rate (OCR). As with glycolysis, the cell lines varied in their
reliance on oxidative phosphorylation (Fig. 13D). This was also represented by the mitochondrial
coupling efficiency. Coupling efficiency provides a measure of how efficiently the cell couples
electron transport to energy generation, and is elucidated by the response to oligomycin, inhibitor
of the F1FO ATPase. As expected, normal breast epithelial MCF-10A cells are reliant on
oxidative phosphorylation, while the cancer cells tend to be more glycolytic. Even so,
heterogeneity exists among the various cancer cell lines in their metabolic phenotypes. The
metabolic pattern did not correlate with the susceptibility of the cells to CT20p, leading us to
believe that the cells’ metabolic state does not drive the effects of the peptide.
We also looked at the effect of CT20p on cellular metabolism by pre-treating the cells
with CT20p prior to running metabolic stress tests. Glycolytic capacity (Fig. 13C) and
respiration capacity (Fig. 13F) were calculated for treated cells with respect to untreated cells.

48
None of the cell lines displayed metabolic responses to CT20p that could explain the cytotoxicity
pattern. Previously, we had also seen similar results in MDA-MB-231 and MCF-10A cells
indicating that the peptide is not acting through metabolic disruption [51].
CT20p binds to the chaperonin CCT
Up to this point, much of our work with CT20p has been aimed at its mitochondrial
effects. We have found that the peptide, although derived from the C-terminal of Bax, does not
induce effects similar to the parent protein, such as mitochondrial pore formation to initiate
apoptosis [15, 65]. We therefore explored the possibility that CT20p could interact with targets
outside the mitochondria. To identify cellular targets of CT20p, a pull-down was performed
using biotin-tagged CT20p to probe for interacting proteins in MDA-MB-231 and MCF-10A cell
lysates. We previously showed that N-terminal additions did not impair the intracellular
localization or cytotoxicity of CT20p [51]. CT20p pulled down groups of proteins unique to
MDA-MB-231 cells and not found in MCF-10A cells. Bands from the gel containing the unique
proteins were excised and analyzed by mass spectrometry (Fig. 14).
A number of proteins that interacted with CT20p were identified. Of particular interest
were proteins that were involved with the cytoskeleton, as our previous finding revealed that
CT20p caused impaired adhesion and inhibition of actin polymerization [51]. A sample of
relevant findings is shown in Table 1. Biotin-CT20p directly pulled down seven of the eight
subunits of the T-complex protein 1 (TCP1), also known as the CCT (chaperonin containing
TCP1) complex. This complex is a type II chaperonin, composed of eight individual subunits
denoted as alpha, beta, gamma, delta, epsilon, eta, theta, and zeta, and is principally responsible
for the folding of actin and tubulin into their native forms [57, 59, 60]. In addition to CCT, our

49
pull down identified many other interactors with CT20p (Table 1), and many of these, including
STAT3, p53, and huntingtin, are known to be clients of CCT [66-68].
To confirm that CCT is an intracellular target of CCT, several experiments were
performed. We first confirmed the results of our mass spectrometry experiment by probing
lysates from the TNBC cell lines and MCF-10A cells with CT20p-biotin. Proteins pulled down
by CT20p-biotin were then recovered and analyzed by blotting for the beta subunit of CCT
(CCTβ) (Fig. 15A). This subunit was chosen because it was the most highly recovered and
identified by mass spectrometry, with 6 unique peptides identified. CT20p was able to interact
with CCTβ in all cell lines, more so in the MSL subtypes, indicating that the peptide-CCT
interaction is variable to some degree across cell lines (Fig. 15A). Biotin only was used as a
negative control, and did not result in pull-down of CCT.
Because pull downs performed in cell lysates may emphasize non-specific protein
interactions, we designed an in-cell pull down assay to better reflect interactions in the
intracellular environment. To do this, biotin-tagged CT20p was encapsulated in HBPE-
nanoparticles and delivered to viable MDA-MB-231 and MCF-10A cells, followed by gentle cell
lysis and recovery of CT20p-biotin and its binding partners. Blotting for CCTβ revealed that the
CT20p-CCT interaction does occur intracellularly, and is detectable as soon as 3 hours after
treatment in MDA-MB-231 cells, but not in MCF-10A cells (Fig. 15B). However, CT20p
treatment does not affect total CCTβ protein levels in either cell line, as shown by examining
whole cell lysates. Because biotin’s hydrophilic nature prevents it from being encapsulated in
nanoparticles, nanoparticles containing DiI were used as a control to exclude the possibility that
the interaction may be a nanoparticle effect, and therefore an artifact of the delivery mechanism
(Fig. 15C). Indeed, no pull down was detected with DiI-loaded nanoparticles.

50
In addition to confirming the CT20p-CCT interaction, the in-cell pull down validates that
CT20p delivered via HBPE-nanoparticles is able to access the cytosolic compartment. It also
confirms that that CT20p is able to access and bind to CCTβ even when the entire CCT complex
is assembled, and that the interaction is stable and detectable for several hours. The lack of
binding of CT20p to CCTβ in MCF-10A cells may account for the decreased susceptibility of
these cells to CT20p.
CT20p interacts directly with CCTβ
We next moved to elucidate the nature of the interaction between CT20p and the CCT
complex. One pressing question was whether CT20p interacted directly with any of the subunits,
or whether the recovery of CCT in the pull down was due to indirect interaction through an
alternate primary binding partner. Because the beta subunit of CCT (CCTβ) was recovered with
the greatest number of peptides in the mass spectroscopy results, we examined whether CT20p
formed a direct interaction with this subunit. Purified recombinant CCTβ was obtained
commercially, and biotin-tagged CT20p was used to confirm an interaction through pull-down
(Fig. 16A).
By varying the molar ratio of CT20p to CCTβ, we were able to determine that while
CT20p does interact directly with CCTβ, efficient pull down is best achieved at ratios greater
than 1:1 (Fig. 16A). However, this does not exclude the possibility of CT20p binding directly to
multiple subunits of the CCT complex, thereby increasing the efficiency of pull-down when the
entire complex is present. The results of the in-cell pull down (Fig 15B) indicate that the reverse
is not true – the quaternary structure of the CCT complex does not mask CT20p binding sites.

51
CCT levels vary across TNBC cell lines
After establishing that CT20p binds directly to CCTβ, we next moved to determine
whether CCTβ was the intracellular target of CT20p that potentiated the cytotoxic properties of
the peptide. Because we have previously studied the susceptibility of TNBC cell lines to CT20p
(Fig 12), we examined baseline levels of CCT in each of the cell lines. We examined CCT
protein levels by assaying for three CCT subunits: beta (β), delta (δ), and epsilon (ε), which are
known to make direct contact with actin [69] (Fig 17A). Quantification of the relative protein
levels revealed that MDA-MB-231 and MDA-MB-436 cells contained the highest amounts of
the CCT subunits (Fig. 17B). These two cell lines are also the most sensitive to the cytotoxicity
of CT20p, suggesting a possible correlation between CCT protein levels and CT20p’s effect, and
supporting the hypothesis that CT20p may be targeting the CCT complex.
We also examined CCT gene expression levels in these cell lines. As shown in Figure
17C, gene expression of the three subunits varied among cell lines. MDA-MB-231 cells
displayed the highest level of both protein and gene expression levels, while MCF10A cells
displayed the lowest. In fact, all the TNBC cell lines expressed higher levels of the CCT subunits
than the MCF-10A cells. However, relative gene expression did not always correlate with
relative protein expression, most notably in the case of BT-549 cells. However, studies
performed by others have shown that expression levels of CCT do not always correlate with
activity levels [70]. Regulation of the CCT complex at the protein level, rather than the transcript
level, may therefore be a more important factor in its activity.
CT20p’s interaction with CCT has functional consequences
Our previously published observations on the effects of CT20p on breast cancer cells
include loss of actin distribution throughout the cell, especially in the filapodia [51]. As actin

52
dynamics are necessary for cellular migration, and therefore metastasis, we examined the effect
of CT20p on the motility of MDA-MB-231 cells. By using stoppers at the time of cell seeding,
an exclusion zone was created that cells would later migrate into. Immediately following
removal of the stoppers, the pre-migration area can be determined. After allowing migration for
10 hours, the migration area of untreated cells was compared to cells treated with CT20p at two
different doses for 24 hours (Fig. 18A). The pre-migration area, based on the control, is defined
by a white circle, while the migration area is outlined in red. After quantification of the areas as
described in Materials & Methods, % closure was calculated for each condition (Fig. 18B).
CT20p significantly impaired movement even at a dose of 75 ug/mL, and migration was nearly
eliminated at 150 ug/mL. At this dose, after 24 hours of treatment, cells have not yet undergone
detachment and death, as evidenced by the consistent cell densities in Fig. 18A. Therefore, loss
of ability to migrate horizontally is an early consequence, consistent with previous data showing
loss of actin architecture as soon as 3 hours after CT20p treatment [51].
We also examined CT20p’s effect on the other main client of CCT, tubulin. We
employed fixed cell immunofluorescence to visualize tubulin in MDA-MB-231 cells before and
after 24 hours of CT20p treatment. Cells were stained with α-DM1A antibody specific to tubulin
(pseudo-colored green), Mitotracker Red, and the nuclear stain DAPI (pseudo-colored blue), and
images were obtained by confocal microscopy. Immediately apparent was the significant loss of
tubulin architecture in CT20p treated cells compared to untreated cells (Fig. 18C). Upon closer
examination, loss of mitochondrial distribution throughout the cell is also observed. This is not
unexpected, as mitochondria traffic along the tubulin network for proper distribution.
Quantification of the amount of tubulin per cell confirms a significant decrease after CT20p
treatment (Fig. 18D).

53
As a comparison to the effect of CT20p on MDA-MB-231 cells, we also examined the
tubulin architecture of MCF-10A cells after peptide treatment (Fig. 18E) Unlike MDA-MB-231
cells, there was no significant loss of tubulin per cell in MCF-10A cells (Fig. 18F). Additionally,
microscopy reveals that overall cell shape and mitochondrial distribution remain unchanged in
MCF-10A cells upon CT20p treatment (Fig. 18E). Corresponding DIC images for both MDA-
MB-231 and MCF-10A cells are provided in Figure 19, and confirm cell attachment and overall
cell shape.
We have previously shown that MCF-10A cells do not display a loss of polymerized
actin upon CT20p treatment [51]. In Figure 1A, we also determined that a treatment of 75 µg/mL
of CT20p does not cause detachment of MCF-10A cells. Together, this data supports the
observation that the effect of CT20p varies in different cell lines, with a higher severity in MDA-
MB-231 cells than in MCF-10A cells.
CCT overexpression increases susceptibility to CT20p
Having established that MCF-10A cells are less susceptible to CT20p cytotoxicity, we
examined whether manipulating the level of CCTβ in these cells changed susceptibility in
response to CT20p. We attempted to increase CCTβ levels in MCF-10A cells in two distinct
ways. We first overexpressed CCTβ directly in MCF-10A cells by transient transfection. We also
encouraged MCF-10A cells to undergo transformation by culturing them at low cell density. It
has been shown that MCF-10A cells are highly sensitive to cell confluency, and that when grown
too sparsely, they will spontaneously undergo an EMT-like process [71]. This includes

54
phenotypic changes, as well as upregulation of classic mesenchymal markers such as vimentin
and N-cadherin [71].
We therefore cultured MCF-10A cells at sub-optimal confluency until phenotypic
changes were observed (Fig. 20A). The transitioned cells, referred to heretofore as MCF-10A(T),
also exhibited highly increased migration (Fig. 20B). After 20 hours of migration time, MCF-
10A cells do not completely cover the exclusion zone, while MCF-10A(T) cells do. The
increased potential for movement is supportive of the transformation the cells have undergone.
Studies are currently in progress to compare epithelial and mesenchymal markers on MCF-
10A(T) cells to those on MCF-10A cells.
We confirmed CCTβ overexpression in transiently transfected MCF-10A cells, referred
to as MCF-10A(CCTβ) (Fig 20C, D). We also observed that MCF-10A(T) cells expressed higher
levels of CCTβ than MCF-10A cells, demonstrating the need of highly migratory cells for
increased CCT activity (Fig. 20C, D). We also examined the level of CCTδ and CCTε subunits
in the three MCF-10A variants. We discovered that transfection of CCTβ alone did not prompt
the cells to upregulate expression of other CCT subunits (Fig. 20C), a phenomenon which has
also previously been reported in yeast [72]. However, the MCF-10A(T) cells contained high
levels of all three CCT subunits, indicating that these cells have overexpressed the entire CCT
complex (Fig. 20C). These three variants therefore provide models to study the effect of CT20p
in three different conditions.
We treated the three variants of MCF-10A cells with CT20p at a dose of 75 ug/mL for 24
hours, then examined cell viability by staining with Sytox AADvanced and F2N12S as described
earlier in the Results section. Normal MCF-10A cells exhibit a modest decrease in viability upon
CT20p treatment (Fig 20E), going from 97% to 85% viability. However, both MCF-10A(CCTβ)

55
and MCF-10A(T) cells demonstrated markedly greater cell death, dropping to 64% and 40%
viability, respectively.
Increasing CCTβ levels therefore directly increases susceptibility to CT20p. Additionally,
the high level of cell death seen in MCF-10A(T) cells may indicate that CT20p is more cytotoxic
when the entire CCT complex is present in high levels. This raises an interesting question: does
CCTβ retain functional activity when overexpressed separate from the CCT complex? There is
precedence for individual, unassembled CCT subunits exerting unique physiological effects in
both yeast and human cells [72-74]. It could then be possible that CCTβ alone retains some
function of the parent complex that makes it susceptible to CT20p inhibition when
overexpressed.
CCT has potential as a clinical marker for breast cancer
Our data so far has led us to believe that not only is CT20p a viable agent for cancer
therapy, the CCT complex may also be a promising target. Impairment of the CCT complex by
CT20p results in catastrophic intracellular events that lead to cancer cell death. To gain an
understanding of the clinical relevance of the correlation of CCT expression with disease, several
breast cancer tissue arrays containing many individual tissue cores were examined for CCTβ
expression by immunohistochemistry. Each core was then scored by a pathologist on a scale
from 0 to 4 based on CCTβ staining intensity. Figure 21 provides representative staining
associated with each score, as well as guidelines for assigning a score to a sample.
We first examined whether cancer tissue expressed more CCTβ than healthy cancer-
adjacent tissue. On average, invasive ductal carcinoma (IDC) displayed staining at least three
times greater than cancer-adjacent tissue (CAT) (Fig. 22A). Additionally, CCTβ staining was

56
significantly increased in more highly invasive primary tumors characterized as T3 or T4, than in
those less invasive cancers characterized as T1 or T2 (Fig. 22A). The T score is a measurement
of the invasiveness of the primary tumor and is a component of TNM grading, which is a
commonly used clinical descriptor of breast cancers. Table 2 provides the number of cores
analyzed, or the sample size, for each group. Representative images of CAT and IDC in Figure
22C are provided to illustrate the increasing CCTβ staining intensity, correlating with increased
disease severity.
In an attempt to understand the molecular signaling pathways that may be driving the
expression of CCT in breast cancer, we next analyzed the scored results by receptor status. We
compared samples that had high estrogen receptor (ER ++/+++), progesterone receptor (PR
++/+++), and Her2 (Her 2+/3+) expression levels, as detailed in the literature accompanying
each tissue array. Samples that had no expression of any of these receptors were designated as
triple negative breast cancer (TNBC). As seen in Figure 22B, TNBC samples were highly
variable in CCTβ expression, correlating with what we had previously seen in our TNBC cell
lines (Fig. 17). No significant correlation was made with CCTβ staining and ER or HER2
expression, but PR ++/+++ samples were uniformly high in staining (Fig 22B). These findings
suggest that the PR signaling pathway may be a driver of CCT expression, but that CCT may
also be used as a clinical target for TNBC on a case-by-case basis.
In addition to correlating CCTβ levels with tumor severity, we also examined survival
rates of patients with invasive ductal carcinoma containing low and high levels of CCTβ. Tissue
samples were scored as described in Figure 21, and then grouped by CCTβ expression. Tissues
with a score of 0, 1, and 2 were characterized as low CCTβ expressers, at the recommendation of
a pathologist. Samples scoring 3 or higher were characterized as high CCTβ expressers. Using

57
survival data provided with the tissue array, we were able to compare the percent survival over
time between the two groups (Fig. 23). Patients with tumors containing high CCTβ exhibited a
poorer survival rate than those with tumors containing low CCTβ. The final survival percentage
for the high CCTβ group was 59.98%, while the low CCTβ group had a more favorable survival
percentage of 77.03% (Fig.23). While the difference was not statistically significant, with a p-
value of 0.0608, the trend indicates that CCTβ levels may be higher in tumors that are likely to
be life-threatening. We will expand this analysis by obtaining more samples that are
accompanied by survival data, as a larger sample size will be necessary to determine a true
correlation with statistical significance.

58
Figures & Tables
Figure 12: CT20p has cytotoxic activity in TNBC cell lines
(A) Several triple negative breast cancer (TNBC) cell lines and one control breast epithelial line (MCF-
10A) were treated with CT20p at increasing doses for 48 hours, and adhesion was determined using a
crystal violet adhesion assay as described in Materials and Methods. The percentage of adhesion relative
to dose 0 is displayed. (B) CT20p was delivered to several breast cancer cell lines for the length of time
indicated in the figure. Cell viability was assessed by staining with Sytox AADvanced and F2N12S dyes,
which are indicator of membrane permeability and asymmetry, respectively. Quadrants are displayed to
divide cell populations, and the percentage of viable cells in the lower right quadrant is indicated in red.
As cells undergo apoptosis and necrosis, the population will lose membrane symmetry and increase
permeability, shifting to the left and up.

59
Figure 13: CT20p cytotoxicity does not correlate with metabolism
(A) The glycolytic profiles of the TNBC cell lines were determined using a Seahorse XF24 analyzer. The
dotted lines represent injection points of compounds used to induce a metabolic response: glucose,
oligomycin, and 2-DG. Glycolysis is represented by extracellular acidification rate (ECAR). (B)
Oxidative phosphorylation profiles of the cell lines were obtained by measuring oxygen consumption rate
(OCR) after injection of oligomycin, FCCP, and rotenone/antimycinA. The glycolytic capacity (C) and
mitochondrial coupling efficiency (D) of each cell line was calculated from the metabolic profile data. (E-
F) Cells were treated with CT20p for 24 hours prior to performing the metabolic assays, and glycolytic
capacity (E) and mitochondrial coupling efficiency (F) of untreated and CT20p-treated cells was
determined.

60
Figure 14: Biotin-CT20p pulls down interacting proteins in MDA-MB-231 cell lysates
Biotin-tagged CT20p was used to pull-down interacting proteins in MCF-10A and MDA-MB-231 cells,
as described in Materials & Methods. The gel was silver stained, and the two indicated bands that were
present in the MDA-MB-231 pull down were excised and evaluated by mass spectrometry. A selected list
of proteins present in each band is shown, with the number of identified peptides indicated in parentheses.
More information on these proteins can be found in Table 1.

61
Table 1: Proteins identified via mass spectrometry to interact with CT20p-Biotin

62
Figure 15: CT20p binds CCTβ in the cellular environment
(A) CT20p-Biotin (denoted CT20) was used to pull down interacting proteins in TNBC cell lysates as
described in Materials & Methods. Biotin only (denoted B) was used as a control. Pull downs were
analyzed by immunoblotting for CCTβ. (B) An “in-cell” pull down was performed in MDA-MB-231 and
MCF-10A cells as described in Materials and Methods. Briefly, CT20p-biotin encapulated in HBPE-
nanoparticles was delivered to viable cells, followed by cell lysis and recovery of interacting proteins.
Pull downs, as well as whole cell lysate samples, were analyzed, and CCTβ and p38 were detected by
Western blot. (C) As a control for the “in-cell” pull down, DiI dye encapulated in HBPE-nanoparticles
was delivered to viable MDA-MB-231 and MCF-10A cells, followed by cell lysis and recovery of bound
proteins. CCTβ and p38 were detected by Western blot.

63
Figure 16 : CT20p binds directly to CCTβ
Purified recombinant CCTβ was tested for interaction with CT20p as described in Materials and Methods.
Lane 1 contains 0.1 nmol of CCTβ, the total amount used for each pull down. Lanes 3-5 were probed with
increasing amounts of biotin-tagged CT20p. CT20p-biotin was able to pull down CCTβ in a
concentration-dependent manner. Biotin alone (lane 2) did not pull down CCTβ.

64
Figure 17: CCT expression varies across TNBC cell lines
(A) Levels of three CCT subunits (beta, delta, and epsilon) were examined by western blot across TNBC
cell lines. P38 is used as a loading control. (C) The protein levels of the subunits were quantified per total
protein and normalized to the levels in MCF-10A cells. (D) Gene expression of the three subunits was
analyzed by quantitative RT-PCR as described in Materials and Methods. The values were determined
relative to MCF-10A gene expression of each subunit. The genes CCT2, CCT4, and CCT5 correspond to
CCTβ, CCTδ, and CCTε, respectively.

65
Figure 18: Consequences of CT20p treatment include loss of migration ability and tubulin architecture
(A) MDA-MB-231 cells were fluorescently stained and seeded around stoppers in a 96-well plate, as
described in Materials and Methods. Cells were then treated with CT20p at 75 or 150 ug/mL for 24 hours.
Removal of the stoppers created an exclusion zone, outlined in white. Control cells had stoppers removed
immediately before data acquisition, and represent the pre-migration area. Remaining conditions were
allowed to migrate into the exclusion zone for 10 hours before images were obtained with a Plate Runner
HD. The leading edge of migrating cells after the migration period is outlined in red. (B) The migration
areas were analyzed using Image J software, and the % closure of the exclusion zone was calculated as in
Materials and Methods. ** p<0.001, *** p<0.0001 (C-F) MDA-MB-231 cells (C) and MCF-10A cells
(E) were stained with DAPI (blue), Mitotracker Red (red) and α-DM1a antibody to tubulin (green) as
described in Materials and Methods. Untreated cells were compared to cells that had been treated with
CT20p for 24 hours. Tubulin architecture and mitochondrial distribution can be seen in the inset. Scale
bars represent 50 μm and inset is magnified by a factor of 2.2x. The average amount of tubulin per cell in
MDA-MB-231 (D) and MCF-10A (F) cells was determined. *** P<0.0001.

66
Figure 19: DIC images accompanying immunofluorescent staining of tubulin
MDA-MB-231 cells (in panel A) and MCF-10A cells (in panel B) were stained with DAPI (blue),
Mitotracker Red (red) and α-DM1a antibody to tubulin (green) as described in Materials and Methods.
Untreated cells were compared to cells that had been treated with CT20p for 24 hours. Fluorescent images
and DIC images were obtained. Scale bars are shown on the merge image and represent 50 μm.

67
Figure 20 : CCT overexpression increases the susceptibility of MCF-10A cells to CT20p
(A) Phase contrast images of MCF-10A and MCF-10A(T) cells illustrate differences in morphology. (B)
MCF-10A and MCF-10A(T) cells were subjected to a migration assay for 20 hours as described in Figure
18A, and in Materials & Methods. The pre-migration area is defined in red. (C) MCF-10A cells were
transfected to overexpress CCTβ as described in Materials & Methods. The levels of CCT subunits were
examined in these cells, as well as in MCF-10A and MCF-10A(T) cells. p38 is used as a loading control.
(D) The level of CCTβ relative to total protein was quantified in the three MCF-10A variants. (E) The
MCF-10A variants were treated with CT20p at a dose of 75 ug/mL for 24 hours. Viability was then
assessed by staining with Sytox AADvanced and F2N12S, followed by flow cytometry as described in
Figure 12B. The viable cells are in the lower-right quadrant, and their percentage is displayed in red.

68
Figure 21: Representative images of CCTβ tissue scoring parameters
Human breast cancer tissue arrays were analyzed by immunohistochemistry for CCTβ, as explained in
Materials and Methods. Tissue cores were scored by a pathologist based on intensity of staining. The
scoring ranged from 0 to 4. Presented here are representative images of the staining associated with each
score. Images are at 200x total magnification. General guidelines for assigning a score are described as
follows:
Score of 0: no staining
Score of 1: faint, focal cytoplasmic staining
Score of 2: weak cytoplasmic staining throughout sample (not focal)
Score of 3: intense staining that does not obscure nucleus
Score of 4: very intense staining, or intense staining that obscures nucleus

69
Figure 22: Breast cancers express higher levels of CCTβ than normal tissue
(A) Human breast cancer tissue arrays were analyzed by immunohistochemistry for CCTβ, as explained
in Materials and Methods. Tissue cores were scored by a pathologist based on intensity of staining. For
analysis, tissues were characterized as cancer adjacent tissue (CAT) and invasive ductal carcinoma (IDC).
IDC was furthermore divided by tumor severity as T1/T2 (less severe primary tumor) and T3/T4 (more
severe primary tumor). CCTβ staining was compared between groups, with * indicating p<0.05 and ***
indicating p<0.0001. (B) CCTβ staining was correlated to high levels of receptor expression. Displayed
are estrogen receptor (ER ++/+++), progesterone receptor (PR ++/+++), Her2 (Her2 2+/3+), and TNBC. *
indicates p<0.05 and ** indicates p<0.0001. (B) Representative images of CAT and IDC at various T
grades are provided to illustrate varied levels of CCTβ. Pathologist’s score is indicated in parenthesis.
Images are at 200x total magnification.

70
Table 2 : Sample sizes for breast tissue analysis

71
Figure 23: High levels of CCTβ are associated with a decreased survival rate of breast cancer patients
A human breast cancer tissue array containing samples of invasive ductal carcinoma from 146 patients
was analyzed by immunohistochemistry for CCTβ. Survival data, including survival/deceased status and
duration of monitoring in months, was provided for each tissue sample. CCTβ staining intensity was
scored as described in Figure 21. Samples scoring 0, 1, and 2 were categorized as low CCTβ (n=45),
while samples scoring 3 or higher were categorized as high CCTβ (n=101). Percent survival was
compared between these two groups.

72
Discussion
In our study, we have presented evidence that CT20p, a peptide with cytotoxic effects in
breast cancer cells, induces its actions by targeting the chaperonin CCT. TNBC cell lines were
found to have varying CCT levels that mirror their susceptibility to CT20p’s cytotoxic actions.
CT20p binds to CCT from all the cell lines, and makes at least one direct interaction with the
CCTβ subunit. Among the consequences of CT20p treatment is loss of migration, due to loss of
actin polymerization, and catastrophic loss of tubulin architecture. We were able to directly link
CT20 to CCTβ by demonstrating increased susceptibility to the peptide upon overexpression of
CCTβ in MCF-10A cells. Finally, a broad analysis of CCT expression in breast cancer tissue
samples revealed that high CCT levels corresponded with higher disease severity.
Of great interest from our findings is that CCT may potentially serve as a clinical
biomarker of disease. There is precedent tying CCT to cancer. Recent evidence has shown that
CCT may contribute to the ability of breast cancer to metastasize to bone by folding AIB1,
which aids growth ability on rigid substrates [75]. Beyond breast cancer, the zeta subunit of CCT
has been found to act in an oncogenic manner in hepatocellular carcinoma, promoting cellular
growth and correlating with increased severity and poor prognosis in clinical cases [76]. More
broadly, the beta and epsilon subunits of CCT were found to be overexpressed in both
hepatocellular and colorectal cancers [77, 78]. These studies concluded, as we do here, that CCT
expression may be used as a marker for cancer progression. Importantly, because CCT has been
shown to be overexpressed in colorectal, hepatocellular, and now breast cancer, it may also play
a significant role in other types of cancer as well. The potential to use CCT as a marker in a
broad spectrum of cancers is intriguing and has not yet been explored in full.

73
In addition to CCT’s clinical potential in disease characterization, we have shown that
targeting CCT may be a viable strategy for treatment of cancer. Our observations are compatible
with findings that CCT activity is critical for cell cycle progression, and depletion of CCT with
siRNA in Swiss 3T3 mouse fibroblasts causes cell cycle arrest [79]. Furthermore, this study also
used an inhibitory antibody against CCTε to modulate, but not eliminate, CCT’s folding activity,
and observed loss of cell motility and cytoskeletal disorganization [79], very similar to the
effects we have seen upon CT20p treatment. Studies in yeast have shown that mutations in the
alpha subunit of CCT cause impaired DNA replication and inhibited progression through mitosis
[80].
Targeting CCT would then be most feasible if cancer cells express and rely on the
chaperonin more heavily than normal cells. Early studies in mice have shown the level of CCT
in cells to be correlated to the cell’s needs for the folding substrates of CCT, especially when
cells are rapidly proliferating, such as during development and spermatogenesis [81, 82]. In
mouse cell lines, it was found that CCT expression not only correlated with growth rate, but was
regulated in a cell-cycle dependent manner [83]. It is then logical that in the context of cancer,
this effect would be multiplied, due to the high proliferative demands of these cells. Indeed,
recent work comparing various cancer cell lines has found CCT to be more highly expressed
than in non-cancerous cells, with notably high expression in MDA-MB-231 cells [70].
Overall, we have shown that CT20p is an effective cytotoxic agent in breast cancer cells
due to its ability to cause cytoskeletal disruption and loss of cell motility, followed by cell
detachment and death. The finding that CT20p interacts with the chaperonin CCT provides a
mechanism by which this may occur. The combination of a cancer-specific cytotoxic agent in
CT20p and a potential molecular target in CCT provide many avenues for exploration. In the

74
near future, it will be interesting to elucidate the precise nature of the interaction between CT20p
and CCT, and therefore the inhibitory mechanism of CT20p. However, by identifying CCT as a
potential target for anti-cancer therapy, we can expand beyond using CT20p to more specific
anti-CCT acting agents. Given the links between CCT and cancer development, progression, and
metastasis, discovering methods of effectively targeting this complex will be the subject of
continuing studies.

75
CHAPTER 4: POTENTIAL OF CCT AS A TARGET
IN VARIOUS HUMAN CANCERS
Introduction
The chaperonin CCT is essential for proper folding of actin and tubulin, and is therefore
necessary for a functional cytoskeleton. CCT is known to be expressed at high levels in rapidly
proliferating cells during normal developmental processes, due to high demand for cytoskeletal
biogenesis [81, 82]. Studies have shown that CCT is essential for cell cycle progression in both
yeast and mammalian cells, and that disruption of CCT’s activity results in cytoskeletal
disorganization and cell cycle arrest [79, 80]. CCT is therefore an essential complex for normal
cell function.
In addition to actin and tubulin, CCT has been shown to be responsible for folding the
p53 and Von-Hippel Lindau tumor suppressors [67, 84] and the oncoprotein cyclin E [85]. There
is therefore likelihood for the involvement of CCT in cancer development. Highly proliferative
cancer cells are also likely dependent on CCT for cytoskeletal support. A study analyzing levels
of CCT protein and its activity in cancer cell lines revealed that cell lines have varying reliance
on CCT, but that CCT was more impactful in cancer cells than in normal cells [70]. More
specifically, the CCTθ subunit has been found to be upregulated in hepatocellular carcinoma, and
to play an important role in the proliferation of these cells [76]. A similar correlation has also
been seen with CCTα and CCTβ in both hepatocellular carcinoma and colonic carcinoma [78]
and with CCTε in colorectal carcinoma. Our work presented in Chapter 3 provides evidence that
CCTβ is also significantly overexpressed in invasive ductal breast carcinoma, and that increased
CCTβ levels correspond to increased disease severity (Fig 21). Work by others also suggests that

76
CCTα and CCTβ may be upregulated by driver oncogenes that are responsible for tumorigenesis
in breast cancer [86].
Taken together, the evidence strongly suggests that CCT may be upregulated in a broad
range of cancers. Significant overexpression of CCT in cancer is intriguing on two fronts. First,
CCT may be useful as a biomarker in clinical settings for diagnosis of disease severity. Second,
CCT is a promising target for cancer therapy, as depletion of CCT in cancer cells has been
shown to cause cell cycle arrest and growth inhibition [76, 86].
In Chapter 3, we have shown that the CT20 peptide binds directly to the CCTβ subunit,
and that CT20p treatment of breast cancer cells caused cytoskeletal disorganization, loss of
adhesion, and cell death. In the work presented in this chapter, we examine the levels of CCTβ in
tissue samples of various other cancer types. In addition to expanding our analysis of breast
cancer samples, we have investigated patterns of CCTβ expression in liver, colon, and lung
cancer. Our analysis reveals lung cancer to be a promising model to study the importance of
CCT in cancer, as well as a likely candidate to benefit from CCT-targeted therapy.
Materials & Methods
Immunohistochemistry
Tissue arrays containing multiple samples of human cancer tissue were purchased from
US Biomax. Catalog numbers for the specific arrays analyzed are as follows: BC041115a,
BC03118, CO484A, EN801A, LC802A, LC726b, PR803b, PR631. Information about the tissue
type, TNM, score, tumor grade, and stage were provided (when applicable). Tissues were
analyzed using anti-CCTβ primary antibody (LifeSpan Biosciences) diluted 1:100 in Antibody
Diluent (Leica). Staining of tissue arrays was performed by a Bond-Max Immunostainer (Leica),

77
with an epitope retrieval buffer of EDTA pH 9.0 (Leica). Polymer Refine Detection reagents
(Leica) were used, which include a hematoxylin counterstain. Scoring of CCTβ staining was
done by a pathologist based on staining intensity.
Statistical analysis
One-way ANOVA was used to compare mean scoring between the different groups
defined by various tissue parameters. Tukey’s multiple comparison test was used to compare
significance between individual groups. Calculations were performed with GraphPad Prism
software (GraphPad). Statistical significance was defined as p < 0.05.
Results
CCTβ is not a marker of disease in colonic carcinomas
Because CCTβ has previously been shown to be highly expressed in colonic carcinomas
[78], we chose to look further into this cancer type. A previous study has shown that both CCTα
and CCTβ are more highly expressed in colonic carcinoma than in matched healthy tissue from
the same patient [78] However, this study did not differentiate between type or grades of colon
carcinomas. A second study examined CCTβ and CCTε specifically in colonic adenocarcinoma,
and found that increased protein expression correlated with increased severity and decreased
patient survival [77].
We examined a colonic carcinoma tissue microarray for CCTβ expression by
immunohistochemistry. We compared normal colon tissue to three subtypes of carcinomas:
adenocarcinoma, mucinous adenocarcinoma, and signet-ring cell carcinoma (SRCC). The sample

78
sizes of each of these groups are presented in Table 3. Of these, SRCC is most aggressive, with
significantly reduced survival rates compared to the other two subtypes [87].
While our analysis did indicate that SRCC contained higher CCTβ than adenocarcinoma
and mucinous adenocarcinoma, the difference was not statistically significant (Fig. 24A).
Additionally, normal colonic tissue stained highly for CCTβ, indicating that this tissue may
present a high background of CCTβ expression.
We also examined the correlation of CCTβ with tumor grade, which is an indication of
cellular differentiation. Grade 1 indicates well-differentiated cells that appear normal, while
grade 3 indicates poorly differentiated cells that grow abnormally and aggressively. However,
due to the morphological characteristics of SRCC, these cannot be assigned a grade. The analysis
was therefore limited to adenocarcinoma and mucious adenocarcinoma. No correlation of grade
with CCTβ was determined in these subtypes (Fig. 24B). CCTβ is therefore not likely involved
in the dedifferentiation process of these carcinomas.
Because colorectal cancer patients often do not present with symptoms until the disease
has become more advanced, detection of late-stage disease is common. The carcinoma samples
present on the tissue microarray we analyzed were all classified as T3 or T4, indicating high
invasiveness of the primary tumor. We were therefore unable to compare CCTβ levels T1/T2
tumors and T3/T4 tumors, as we did with breast cancer tissues (Fig. 22).
Hepatocellular carcinomas express higher CCTβ than normal hepatic tissue
Along with colorectal cancer, there is precedence in the literature for the link between
CCT and hepatic carcinoma. The study referenced above concerning CCTα and CCTβ in colon
cancer also examined the expression of these subunits in hepatocellular carcinoma (HCC)

79
samples [78]. Both subunits were found to present in higher amounts in HCC cells than in
adjacent non-cancer tissue [78]. Additionally, a separate study found CCTθ to be highly
expressed in HCC, with higher expression of CCTθ correlating with poorer survival rates [76].
Data linking CCT to HCC cell proliferation provides considerable evidence that CCT may play a
role in development of hepatic cancers [78].
Using tumor tissue microarrays, we were able to examine CCTβ levels in normal hepatic
tissue and two subtypes of hepatic carcimona: hepatocellular carcinoma (HCC) and
cholangiocellular carcinoma. HCC arises from transformed hepatocytes and accounts for
approximately 80% of primary liver cancers [88]. Cholangiocellular carcinoma arises in the bile
ducts, and while less common, is associated with therapeutic resistance and poor prognosis and
survival rates [89].
CCTβ was found to be expressed more highly in both HCC and cholangiocellular
carcinoma when compared to normal hepatic tissue (Fig. 25A). However, this difference was
only statistically significant (p<0.05) in HCC. We then further divided HCC samples based on
TNM score. The T score is a measure of primary tumor invasiveness [90]. T1 refers to a single
tumor that has not invaded the vasculature, while T2 may refer to a single tumor with vascular
invasion, or multiple small tumors less than 5 cm. T3 tumors may be larger than 5 cm, and
invade a major branch of the portal or hepatic veins. Finally, T4 tumors have invaded nearby
organs [90]. We therefore looked to see whether CCTβ staining correlated with tumor
invasiveness. Due to limited T1 and T4 sample size, we only examined T2 and T3 HCC samples.
We found that in HCC samples, both T2 and T3 samples expressed significantly more CCTβ
than normal hepatic tissue (Fig. 25B). However, there was no difference between T2 and T3
samples.

80
We also divided the HCC samples by grade, a measure of cell differentiation. As grade
increases from 1 to 3, cell borders become less distinct, and nuclei become hyperchromatic and
occupy a large percentage of the cell [90]. Moreover, high grade HCC has been shown have
poorer prognosis [91]. A progressive increase in CCTβ staining was seen with increasing grade
(Fig. 25C). Grade 3 HCC, characterized by poor differentiation and aggressive growth, expressed
significantly higher levels of CCTβ than the other grades and normal hepatic tissue.
Representative images are provided to illustrate the increase in CCTβ staining when comparing
normal hepatic tissue to low-grade HCC and high-grade HCC (Fig. 25C).
Prostate adenocarcinoma overexpresses CCTβ
In our effort to understand the expression pattern of CCTβ in various cancers, we also
examined carcinomas that have not been previously described in the literature in this context. To
this end, we have chosen to examine additional cancers that are impactful to society. Prostate
cancer is the most commonly diagnosed cancer in men, and the second leading cause of death in
men after lung cancer [92]. The most common form of prostate cancer is adenocarcinoma, which
originates from the gland cells that secrete prostate fluid.
We examined the levels of CCTβ staining in prostate adenocarcinoma and found
significantly increased levels when compared to normal prostate tissue (Fig. 26A). This supports
the trend seen in breast cancer and liver cancer subtypes that express more CCTβ than normal
tissue. We then grouped adenocarcinoma samples by TNM score, into T2, T3, and T4 group.
According to the College of American Pathologists, T2 tumors are confined within the prostate,
T3 tumors have extended beyond the prostate capsule, and T4 tumors have invaded into adjacent

81
tissues [93]. Increasing T score therefore indicates spread and invasiveness of the primary tumor.
We detected a trend of increasing CCTβ staining as T score increased from T2 to T4 (Fig. 26B).
We also examined the correlation between CCTβ and Gleason grade. As a measure, the
Gleason grade takes into account histological architecture and cellular differentiation. As
Gleason grade increases, cellular appear less differentiated and there is a loss of normal prostate
gland architecture [94]. It is therefore reflective of aggressiveness and malignancy. Gleason
scores 1 and 2 still resemble normal prostate tissue, and are therefore rarely assigned. When we
examined Gleason grades 3 through 5, a very slight trend was seen in CCTβ staining with
increased grade (Fig. 26C), but it was not as pronounced as that seen with T score (Fig. 26B).
We finally grouped the tissue samples by stage. Staging in prostate cancer takes into
account both the TNM score and the Gleason grade to assign a stage to the patient, which then
determines prognosis and drives treatment decisions. Increased stage indicates higher severity of
disease and poorer prognosis. Again, a trend of increasing CCTβ staining was seen with
increasing stage (Fig. 26D). Overall, the data suggests that as severity of the prostate cancer
increases, regardless of the measure used to represent this, CCTβ expression also increases.
Lung small cell carcinomas are high expressers of CCTβ
We next studied lung cancer, the deadliest cancer in the United States. Although it is not
the most commonly diagnosed cancer in neither men nor women – those are prostate cancer and
breast cancer, respectively – lung cancer is responsible for the most deaths in both genders [92].
In fact, estimates for 2015 indicate that lung and bronchus cancer will be responsible for more
than a quarter of total cancer deaths – more than prostate, breast, and colorectal cancers
combined [92].

82
The 5- year survival rate of lung cancer is only 17.8%, which is much lower than the
90.5% and 99.6% survival rates for breast and prostate cancer, respectively [4].Contributing to
the severity of the disease is the fact that symptoms often do not appear until an advanced stage.
More than 50% of lung cancers are diagnosed after the cancer has metastasized from the primary
site, and these are associated with only a 4% 5-year survival rate [4]. The extent of the disease
cannot be understated, and research into treatments has become a priority.
Lung cancer is classified into three main broad classes. The first, non-small cell lung
cancer (NSCLC), accounts for more than 80% of cases. NSCLC can be further divided into
subtypes based on histological characteristics. These subtypes include adenocarcinoma and
squamous cell carcinoma. The second class of lung cancer is small cell lung cancer (SCLC),
which accounts for 10 to 15% of cases. SCLC is more aggressive, faster spreading, and more
likely to recur than NSCLC. It is associated with a 5-year survival rate of only 6%, compared to
21% for NSCLC [92]. The final class of lung cancer is neuroendocrine carcinoma. This includes
carcinoid and atypical carcinoid tumors. These cancers are rare and slow spreading, and have a
better prognosis than other lung cancers.
We first examined whether any subtype of lung cancer was associated with high levels of
CCTβ staining. When compared to normal tissue, all lung cancer subtypes expressed
significantly higher CCTβ (Fig. 27A). Noticeably, small cell carcinomas and carcinoid tumors
stained consistently high, with CCTβ staining intensity more than three times that of normal lung
tissue. These two subtypes were also statistically significant when compared to all other
subtypes, with p<0.001 (not indicated on graph).
Squamous cell carcinoma also scored significantly higher than normal lung tissue. Figure
27B provides images representative of staining in normal tissue, squamous cell carcinoma, and

83
small cell carcinoma. Because these two subtypes contribute to a large proportion of lung cancer
cases and are difficult to treat, we explored each of them in greater detail. In lung cancer, T score
refers to the size and invasiveness of the primary tumor [95]. When squamous cell lung
carcinoma (SqCLC) was grouped by TNM score, we found a small increase in CCTβ staining in
T3/T4 samples compared to T1/T2 samples (Fig. 27C). However, the difference was not
statistically significant. When small cell lung carcinoma (SCLC) samples were examined in the
same sway, CCTβ staining was uniformly high across TNM scores (Fig. 27D). Representative
pictures of various TNM scores of SCLC illustrate the consistently high staining (Fig. 27E).

84
Figures
Figure 24: Analysis of CCTβ staining in colon tumor tissue
(A) CCTβ was detected in colon carcinoma tissue samples by immunohistochemistry as described in
Materials & methods. Samples were grouped by subtype, as defined by the literature accompanying the
array. No subtypes of colon carcinoma were found to express more CCTβ than normal colon tissue. (B)
Adenocarcinoma and mucinous adenocarcinoma samples were grouped by grade, a measure of cell
differentiation, and CCTβ staining was compared among groups. No trends were revealed correlating
CCTβ to tumor grade.

85
Figure 25: Analysis of CCTβ staining in liver tumor tissue
(A) Hepatic carcinoma and normal tissue samples were assessed for CCTβ expression by
immunohistochemistry as described in Materials & Methods. Normal hepatic tissue was compared to two
subtypes of carcinoma: cholangiocellular carcinoma and hepatocellular carcinoma. Significance indicated
is in reference to normal hepatic tissue. (B) Hepatocellular carcinoma (HCC) samples were grouped
according to TNM score, and T1/T2 samples were compared to T3/T4 samples. While both were
significantly higher than normal hepatic tissue, there was no difference between progressive T scores. (C)
HCC samples were grouped by grade, and CCTβ staining was compared among grades. Grade 3 HCC
stained significantly higher for CCTβ than the other grades. (D) Representative photos indicate the
difference between CCTβ expression in high grade and low grade HCC. * = p<0.05, *** = p<0.001

86
Figure 26: Analysis of CCTβ staining in prostate cancer tissue
(A) CCTβ was detected in prostate tissue samples by immunohistochemistry. Staining intensity was
compared between normal prostate tissue and prostate adenocarcinoma. (B-D) Adenocarcinoma samples
were grouped by TNM score (B), Gleason grade (C), and stage (D) to examine whether CCTβ staining
exhibited trends correlating to cancer severity. All indicated significance is in relation to normal prostate
tissue. * = p<0.05, ** = p<0.01, *** = p<0.001

87
Figure 27: Analysis of CCTβ staining in lung tumor tissue
(A) CCTβ expression was examined in tissue samples of several different lung cancer subtypes by
immunohistochemistry as described in Materials & Methods. Significance indicated is in reference to
normal lung tissue. (B) Representative photos depict the low levels of CCTβ in normal lung tissue,
compared to elevated levels in both squamous cell and small cell carcinomas. (C) Squamous cell lung
cancer (SqCLC) samples were grouped according to TNM score. T1/2 samples were compared to T3/T4
samples. Significance indicated is in reference to normal lung tissue. (D) Small cell lung cancer (SCLC)
samples were also grouped by TNM score, and the CCTβ staining the various groups was compared. Significance is in reference to normal lung tissue. (E) Representative photos portray the high levels of CCTβ present in SCLC, regardless of TNM score. * = p<0.05, ** = p<0.01, *** = p<0.001, **** = p<0.0001.

88
Table 3: Sample sizes for colon, liver, prostate, and lung tissue analysis

89
Discussion
In this study, we have analyzed tissue samples from various cancer and normal tissues in
an effort to characterize the potential of CCT as both a biomarker and a target in cancer
treatment. Using tissue microarrays, we were able to study CCTβ levels by
immunohistochemistry in a large amount of samples. This also had the benefit of providing
cancers of a variety of stages, severities, and histological characteristics. We were therefore able
to conduct a broad analysis of CCTβ levels across colon, prostate, liver, and lung tissue
specimens.
Although colon cancer has been previously reported to overexpress CCTβ [78], we were
unable to confirm these findings in our sample set. Our analysis revealed that normal colon tissue
contained high background levels of CCTβ, making it difficult to detect an increase in carcinoma
samples. However, this data can be revisited in the future for reanalysis. It will be important to
obtain more samples, as the sample size was small for both normal and carcinoma tissues.
Additionally, studying the corresponding H&E stained tissues may help the pathologist reach a
revised determination of CCTβ staining in the normal tissues. Therefore, while our findings
concerning colon cancer were not conclusive, future reanalysis may reveal patterns not seen in
this study.
Hepatocellular carcinoma was found to express higher levels of CCTβ than normal tissue,
which supports previously reported observations [76, 78]. No correlation was found between
CCTβ expression and TNM score. However, there was a strong positive correlation with tumor
grade, with higher grade associated with high CCTβ staining. As tumor grade is a reflection of
malignancy, it may be of note that CCTβ is expressed at high levels in poorly differentiated,

90
highly aggressive hepatocellular carcinomas. Similar to our observations with hepatic carcinoma,
we found that prostate adenocarcinoma expressed significantly higher levels of CCTβ than
normal prostate tissue. In prostate adenocarcinoma samples, there was a correlation between
CCTβ staining and TNM score, Gleason grade, and disease stage.
Analysis of lung cancer samples revealed the highest scoring cancer subtypes in this
study: small cell lung carcinoma and lung carcinoid tumor. Further analysis revealed that small
cell carcinoma expressed high CCTβ regardless of TNM or tumor severity. As this is a
particularly deadly form of lung cancer, identifying a target that is consistently present at all
stages of the disease would be very beneficial toward developing a treatment.
The potential of targeting the CCT complex in cancer has not been thoroughly explored.
In recent years, links between CCT and colon carcinoma [77, 78], hepatocellular carcinoma [76,
78], and breast cancer [75, 86] have emerged. However, inhibitors targeting CCT have not yet
been widely developed. To date, only one therapeutic agent targeting CCT has been discovered.
N-iodoacetyl-tryptophan, a synthetic small molecule, has been found to disrupt the interaction
between CCT and tubulin, causing apoptosis through an ER-stress dependent mechanism [96,
97]. Our finding that CCT is also overexpressed in prostate cancer and lung cancer may increase
awareness of this protein complex as a target for cancer therapy.
In contrast to N-iodoacetyl-tryptophan, CT20p does not cause death through a traditional
apoptotic mechanism [15]. We have also employed a nanoparticle delivery system that has been
shown to efficiently deliver peptide both to cancer cell lines in vitro, and to breast tumor murine
xenographs in vivo. While development of CT20p as a therapeutic in breast cancer has yielded
promising results, the potential to expand into study of other cancer types is very valuable.

91
Characterizing the levels of CCT in several different cancers has therefore provided a broad
application for CCT inhibitors in general, and CT20p in particular.

92
CHAPTER 5: DISCUSSION
The results presented in this dissertation describe the therapeutic potential of CT20p for
cancer treatment. CT20p is an amphipathic, 20 amino acid peptide derived from the C-terminus
of the apoptotic protein of Bax. While the peptide does retain some properties of the parent
protein, such as mitochondrial localization and cytotoxic activity, it differs in its cytotoxic
mechanism. Unlike Bax-induced apoptosis, death induced by CT20p is not caspase dependent,
and cannot be rescued by expression of anti-apoptotic proteins such as Bcl-2 [15]. Although
CT20p functions unlike Bax, it was able to cause death of breast cancer and colorectal cancer
cells in culture [15]. We therefore sought to understand the intracellular events that occur upon
CT20p’s entry into the cell, in an effort to further the development of CT20p as a therapeutic
agent.
The finding that CT20p was cytotoxic to MDA-MB-231 breast cancer cells, but not to
MCF-10A breast epithelial cells, provided two model cell lines in which to study CT20p activity.
We found that CT20p was able to localize to the mitochondria in the breast cancer cells, and that
this was accompanied by mitochondrial aggregation and loss of mitochondrial movement.
However, mitochondrial function and metabolism were not impaired. The lack of functional
consequences to the mitochondria provided the first indication that while CT20p does localize to
the mitochondria, it does not act directly on the mitochondria in a way that causes cell death.
Rather, the mitochondrial effects seen may have been secondary consequences of the effect of
CT20p on another cellular process, which had not yet revealed itself. The ability of CT20p to
localize to the mitochondria is likely due to its inherent structure – it is an amphipathic peptide

93
that shares sequence similarity with antimicrobial peptides that may act on mitochondrial-like
membranes[21].
However, other observations were made that did further the understanding of CT20p’s
actions. Breast cancer cells were found to detach from their extracellular growth substrate before
cell death occurred. This was explained by the finding that the cells exhibit decreased expression
of integrins on the cell surface as soon as 3 hours after CT20p treatment. The actin cytoskeleton
was also significantly disrupted in breast cancer cells upon CT20p treatment. Together, this data
indicated that death caused by CT20p was therefore the result of a loss attachment, depriving the
anchorage-dependent cells of necessary survival signals.
The implication that CT20p may be targeting the cytoskeleton was plausible in light of
the data. However, the intracellular target of CT20p had yet to be determined. We broadened our
study by examining the effect of CT20p in several additional TNBC cell lines, and found that the
susceptibility of the cell lines to CT20p varied. However, the metabolic processes of the all the
cell lines remained unchanged, allowing us to shift our focus away from the mitochondria in the
search for the target of CT20p. Instead, we examined whether the underlying cause of
detachment and death was a result of CT20p’s interaction with a cytosolic protein.
An advantage to CT20p, and peptide therapeutics in general, is its ability to be easily
modified without altering its functionality. We had used this to our advantage by conjugating
rhodamine dye to the N-terminus of CT20p, which allowed us to microscopically track the
intracellular localization of the peptide. By the same principle, we were also able to use a biotin-
tagged CT20p as bait to recover interacting cellular proteins. By probing cell lysates with biotin-
CT20p, we recovered interacting proteins that were then identified by mass spectrometry.
Interestingly, none of the proteins identified to interact with CT20p were located in the

94
mitochondria or involved in mitochondrial function. This doesn’t exclude the possibility that
CT20p does interact with mitochondrial proteins, but it strengthens the hypothesis that the
majority of CT20p’s cellular consequences occur as a result of interactions in the cell’s cytosol.
From the mass spectrometry results, we identified the chaperonin CCT as an interactor of
CT20p. CCT is the obligate chaperone for the cytoskeletal proteins actin and tubulin [57], and it
has been shown that depletion of CCT or inhibition of its subunits resulted in cytoskeletal
disorganization, cell cycle arrest, and loss of motility [79]. As we had observed similar cellular
effects upon CT20p treatment, we moved to further elucidate the interaction between CT20p and
the CCT complex. Using recombinant CCTβ protein, we were able to confirm a direct interaction
between CT20p and this subunit. By delivering biotin-tagged CT20p to viable cells via HBPE-
NPs, we were also able to confirm that the interaction of CT20p and CCTβ is occurs in the
cellular environment.
Returning to our TNBC cell lines, we found that cell lines with high levels of CCT were
highly vulnerable to CT20p toxicity. MCF-10A breast epithelial cells, which contain the lowest
levels of CCT, exhibited an increased susceptibility to CT20p when transfected to overexpress
CCTβ. Therefore, CT20p cytotoxicity is directly dependent on the levels of the CCT complex,
and possibly individual CCT subunits.
Recently, there is increasing evidence to suggest that the subunits may demonstrate
unique individual functions when not incorporated in the CCT complex. CCTε, for example, has
been found to play a role in regulating actin expression via the Serum Response Factor pathway
[98], while CCTδ can associate with the plasma membrane and affect cell shape [74]. CCTα
alone is capable of alleviating toxicity resulting from aggregates of polyglutamine-extended
huntingtin [73]. Furthermore, experiments in yeast have determined that overexpression of each

95
individual CCT subunit yields unique phenotypic and physiological consequences [72]. Similar
results were seen when each subunit was individually mutated [99]. While no unique function
has yet been attributed to CCTβ, our data suggest that it too may be functional when
overexpressed as a monomer. CT20p may then functionally inhibit both the complete CCT
complex and individual monomer subunits.
Identifying CCT as the the target of CT20p opens up an interesting field of study from a
cell biology perspective. From a clinical perspective, we were interested in whether CCT was
expressed in primary human cancers, therefore making CT20p a feasible therapeutic agent. In
tissue samples, CCTβ was found to be expressed at significantly higher levels in invasive ductal
carcinoma than in normal breast tissue. Similar trends were seen in hepatocellular carcinoma,
prostate adenocarcinoma, and several varieties of lung carcinomas. Additionally, CCTβ levels
increased with increasing tumor severity in breast invasive ductal carcinoma and hepatocellular
carcinoma. Studies carried out by other groups have shown similar trends in colorectal
carcinoma as well [78]. Other work has directly implicated CCT in the oncogenesis of
hepatocellular carcinoma and breast cancer [76, 86].
The overexpression of CCT in a wide variety of cancers is promising and increases its
potential as a druggable target. However, in TNBC tissue samples, CCTβ expression was found
to be highly variable. This mirrors our findings in TNBC cell lines, and can be explained by the
high heterogeneity of TNBC at the genetic level [62]. This heterogeneity results in differential
responses to chemotherapeutics, and must be taken into account when designing a treatment plan
for patients with the disease [64]. CT20p may therefore be applicable for TNBC treatment on a
case-by case basis, and may be most beneficial when combined with other treatments.

96
Our survey of CCTβ staining in tissues has revealed CT20p may be most beneficial as a
therapeutic in other types of cancers, namely prostate adenocarcinoma, squamous cell lung
cancer, and small cell lung cancer. Small cell lung cancer, which had consistently high CCTβ
expression regardless of cancer severity, is especially in need of effective therapeutics as it is a
highly aggressive cancer with a poor survival rate. Small cell lung cancer cell lines may also
provide a better model for the optimization of CT20p in vitro.
Overall, this work demonstrates the feasibility of CT20p as a cancer therapeutic. The
peptide can effectively be delivered to cancer cells via HBPE-nanoparticles, whereupon it causes
cell-line specific cell death. Intracellularly, CT20p targets the chaperonin CCT by making at
least one direct interaction with the CCTβ subunit. The folding substrates of CCT, actin and
tubulin, are consequently affected, leading to cytoskeletal disruption. CCT is a favorable target
for cancer therapeutics due to its high expression in several human cancers, and its significance
in highly aggressive cancers. Hence, CT20p exhibits potential for future development as a
therapeutic that effectively targets an essential oncogenic process.

97
APPENDIX A: CELL DEATH & DISEASE
COPYRIGHT RELEASE

98

99
APPENDIX B: CANCER CELL & MICROENVIRONMENT
COPYRIGHT RELEASE

100

101
A portion of the material presented in Chapter 1: Introduction was originally published as:
Some aspects of the text were reworded for relevance to this dissertation.
The Creative Commons license text can be accessed at:
https://creativecommons.org/licenses/by/3.0/legalcode

102
APPENDIX C: IACUC PERMISSIONS

103

104

105

106

107

108

109
APPENDIX D: IRB PERMISSIONS

110

111
REFERENCES
1. Ferlay, J., et al., Cancer incidence and mortality worldwide: sources, methods and major
patterns in GLOBOCAN 2012. Int J Cancer, 2015. 136(5): p. E359-86.
2. U.S. Cancer Statistics Working Group, United States Cancer Statistics: 1999–2011
Incidence and Mortality Web-based Report. 2014; Available from: www.cdc.gov/uscs.
3. American Cancer Society. Breast Cancer Facts & Figures 2013-2014, I. Atlanta:
American Cancer Society, Editor 2013.
4. Howlader N, N.A., Krapcho M, Garshell J, Miller D, Altekruse SF, Kosary CL, Yu M,
Ruhl J, Tatalovich Z, Mariotto A, Lewis DR, Chen HS, Feuer EJ, Cronin KA (eds), SEER
Cancer Statistics Review, 1975-2012, based on November 2014 SEER data submission,
posted to the SEER web site, April 2015, National Cancer Institute. Bethesda, MD:
http://seer.cancer.gov/csr/1975_2012/,.
5. Davies, C., et al., Relevance of breast cancer hormone receptors and other factors to the
efficacy of adjuvant tamoxifen: patient-level meta-analysis of randomised trials. Lancet,
2011. 378(9793): p. 771-84.
6. Dowsett, M., et al., Meta-analysis of breast cancer outcomes in adjuvant trials of
aromatase inhibitors versus tamoxifen. J Clin Oncol, 2010. 28(3): p. 509-18.
7. Carey, L.A., et al., Race, breast cancer subtypes, and survival in the Carolina Breast
Cancer Study. JAMA, 2006. 295(21): p. 2492-502.
8. Anders, C.K. and L.A. Carey, Biology, metastatic patterns, and treatment of patients with
triple-negative breast cancer. Clin Breast Cancer, 2009. 9 Suppl 2: p. S73-81.
9. Rangel, R., et al., Combinatorial targeting and discovery of ligand-receptors in
organelles of mammalian cells. Nat Commun, 2012. 3: p. 788.
10. Szeto, H.H. and P.W. Schiller, Novel therapies targeting inner mitochondrial membrane-
-from discovery to clinical development. Pharm Res, 2011. 28(11): p. 2669-79.
11. Constance, J.E. and C.S. Lim, Targeting malignant mitochondria with therapeutic
peptides. Ther Deliv, 2012. 3(8): p. 961-79.
12. Garg, P., et al., Transmembrane pore formation by the carboxyl terminus of Bax protein.
Biochim Biophys Acta, 2013. 1828(2): p. 732-42.
13. Tatulian, S.A., et al., Molecular basis for membrane pore formation by Bax protein
carboxyl terminus. Biochemistry, 2012. 51(46): p. 9406-19.

112
14. Santra, S., C. Kaittanis, and J.M. Perez, Aliphatic hyperbranched polyester: a new
building block in the construction of multifunctional nanoparticles and nanocomposites.
Langmuir, 2010. 26(8): p. 5364-73.
15. Boohaker, R.J., et al., Rational development of a cytotoxic peptide to trigger cell death.
Mol Pharm, 2012. 9(7): p. 2080-93.
16. Smith, R.A., et al., Mitochondrial pharmacology. Trends Pharmacol Sci, 2012. 33(6): p.
341-52.
17. Szewczyk, A. and L. Wojtczak, Mitochondria as a pharmacological target. Pharmacol
Rev, 2002. 54(1): p. 101-27.
18. Campello, S., et al., Orchestration of lymphocyte chemotaxis by mitochondrial dynamics.
J Exp Med, 2006. 203(13): p. 2879-86.
19. Desai, S.P., et al., Mitochondrial localization and the persistent migration of epithelial
cancer cells. Biophys J, 2013. 104(9): p. 2077-88.
20. Zhao, J., et al., Mitochondrial dynamics regulates migration and invasion of breast
cancer cells. Oncogene, 2012.
21. Boohaker, R.J., et al., The use of therapeutic peptides to target and to kill cancer cells.
Curr Med Chem, 2012. 19(22): p. 3794-804.
22. Lien, S. and H.B. Lowman, Therapeutic peptides. Trends Biotechnol, 2003. 21(12): p.
556-62.
23. Kolluri, S.K., et al., A short Nur77-derived peptide converts Bcl-2 from a protector to a
killer. Cancer Cell, 2008. 14(4): p. 285-98.
24. Arbel, N. and V. Shoshan-Barmatz, Voltage-dependent anion channel 1-based peptides
interact with Bcl-2 to prevent antiapoptotic activity. J Biol Chem, 2010. 285(9): p. 6053-
62.
25. Boohaker, R.J., et al., Rational Development of a Cytotoxic Peptide To Trigger Cell
Death. Mol Pharm, 2012.
26. Garcia-Saez, A.J., et al., Peptides derived from apoptotic Bax and Bid reproduce the
poration activity of the parent full-length proteins. Biophys J, 2005. 88(6): p. 3976-90.
27. Valero, J.G., et al., Bax-derived membrane-active peptides act as potent and direct
inducers of apoptosis in cancer cells. J Cell Sci, 2011. 124(Pt 4): p. 556-64.
28. Speirs, V., et al., Short-term primary culture of epithelial cells derived from human
breast tumours. Br J Cancer, 1998. 78(11): p. 1421-9.

113
29. Santra, S. and J.M. Perez, Selective N-alkylation of beta-alanine facilitates the synthesis
of a poly(amino acid)-based theranostic nanoagent. Biomacromolecules, 2011. 12(11): p.
3917-27.
30. Lee, M.W., et al., N-methyl-N'-nitro-N-nitrosoguanidine activates multiple cell death
mechanisms in human fibroblasts. DNA Cell Biol, 2007. 26(9): p. 683-94.
31. Magrane, J., et al., Mitochondrial dynamics and bioenergetic dysfunction is associated
with synaptic alterations in mutant SOD1 motor neurons. J Neurosci, 2012. 32(1): p.
229-42.
32. Sparrow, N., et al., The actin-severing protein cofilin is downstream of neuregulin
signaling and is essential for Schwann cell myelination. J Neurosci, 2012. 32(15): p.
5284-97.
33. Yamaguchi, H., et al., Epothilone B analogue (BMS-247550)-mediated cytotoxicity
through induction of Bax conformational change in human breast cancer cells. Cancer
Res, 2002. 62(2): p. 466-71.
34. Humphries, M.J., Cell adhesion assays. Mol Biotechnol, 2001. 18(1): p. 57-61.
35. Santel, A. and M.T. Fuller, Control of mitochondrial morphology by a human mitofusin. J
Cell Sci, 2001. 114(Pt 5): p. 867-74.
36. Eura, Y., et al., Two mitofusin proteins, mammalian homologues of FZO, with distinct
functions are both required for mitochondrial fusion. J Biochem, 2003. 134(3): p. 333-
44.
37. Huang, P., T. Yu, and Y. Yoon, Mitochondrial clustering induced by overexpression of
the mitochondrial fusion protein Mfn2 causes mitochondrial dysfunction and cell death.
Eur J Cell Biol, 2007. 86(6): p. 289-302.
38. Cassidy-Stone, A., et al., Chemical inhibition of the mitochondrial division dynamin
reveals its role in Bax/Bak-dependent mitochondrial outer membrane permeabilization.
Dev Cell, 2008. 14(2): p. 193-204.
39. Arismendi-Morillo, G., et al., Mitochondrial network in glioma's invadopodia displays an
activated state both in situ and in vitro: potential functional implications. Ultrastruct
Pathol, 2012. 36(6): p. 409-14.
40. Nagae, M., et al., Crystal structure of alpha5beta1 integrin ectodomain: atomic details of
the fibronectin receptor. J Cell Biol, 2012. 197(1): p. 131-40.
41. Barkan, D. and A.F. Chambers, beta1-integrin: a potential therapeutic target in the battle
against cancer recurrence. Clin Cancer Res, 2011. 17(23): p. 7219-23.

114
42. Berry, M.G., et al., Integrin expression and survival in human breast cancer. Eur J Surg
Oncol, 2004. 30(5): p. 484-9.
43. Desgrosellier, J.S. and D.A. Cheresh, Integrins in cancer: biological implications and
therapeutic opportunities. Nat Rev Cancer, 2010. 10(1): p. 9-22.
44. Meier, R., et al., Breast cancers: MR imaging of folate-receptor expression with the
folate-specific nanoparticle P1133. Radiology, 2010. 255(2): p. 527-35.
45. Caino, M.C., et al., Metabolic stress regulates cytoskeletal dynamics and metastasis of
cancer cells. J Clin Invest, 2013. 123(7): p. 2907-20.
46. Parone, P.A., et al., Preventing mitochondrial fission impairs mitochondrial function and
leads to loss of mitochondrial DNA. PLoS One, 2008. 3(9): p. e3257.
47. Rehman, J., et al., Inhibition of mitochondrial fission prevents cell cycle progression in
lung cancer. FASEB J, 2012. 26(5): p. 2175-86.
48. Hoppins, S., et al., The soluble form of Bax regulates mitochondrial fusion via MFN2
homotypic complexes. Mol Cell, 2011. 41(2): p. 150-60.
49. Papanicolaou, K.N., M.M. Phillippo, and K. Walsh, Mitofusins and the mitochondrial
permeability transition: the potential downside of mitochondrial fusion. Am J Physiol
Heart Circ Physiol, 2012. 303(3): p. H243-55.
50. Quintela-Fandino, M., A. Gonzalez-Martin, and R. Colomer, Targeting cytoskeleton
reorganisation as antimetastatic treatment. Clin Transl Oncol, 2010. 12(10): p. 662-9.
51. Lee, M.W., et al., The CT20 peptide causes detachment and death of metastatic breast
cancer cells by promoting mitochondrial aggregation and cytoskeletal disruption. Cell
Death Dis, 2014. 5: p. e1249.
52. Liou, A.K. and K.R. Willison, Elucidation of the subunit orientation in CCT (chaperonin
containing TCP1) from the subunit composition of CCT micro-complexes. EMBO J,
1997. 16(14): p. 4311-6.
53. Valpuesta, J.M., et al., Structure and function of a protein folding machine: the
eukaryotic cytosolic chaperonin CCT. FEBS Lett, 2002. 529(1): p. 11-6.
54. Chen, X., D.S. Sullivan, and T.C. Huffaker, Two yeast genes with similarity to TCP-1 are
required for microtubule and actin function in vivo. Proc Natl Acad Sci U S A, 1994.
91(19): p. 9111-5.
55. Miklos, D., et al., Primary structure and function of a second essential member of the
heterooligomeric TCP1 chaperonin complex of yeast, TCP1 beta. Proc Natl Acad Sci U S
A, 1994. 91(7): p. 2743-7.

115
56. Thulasiraman, V., C.F. Yang, and J. Frydman, In vivo newly translated polypeptides are
sequestered in a protected folding environment. EMBO J, 1999. 18(1): p. 85-95.
57. Kubota, H., Function and regulation of cytosolic molecular chaperone CCT. Vitam
Horm, 2002. 65: p. 313-31.
58. Frydman, J., et al., Function in protein folding of TRiC, a cytosolic ring complex
containing TCP-1 and structurally related subunits. EMBO J, 1992. 11(13): p. 4767-78.
59. Yaffe, M.B., et al., TCP1 complex is a molecular chaperone in tubulin biogenesis.
Nature, 1992. 358(6383): p. 245-8.
60. Gao, Y., et al., A cytoplasmic chaperonin that catalyzes beta-actin folding. Cell, 1992.
69(6): p. 1043-50.
61. Perou, C.M., et al., Molecular portraits of human breast tumours. Nature, 2000.
406(6797): p. 747-52.
62. Lehmann, B.D., et al., Identification of human triple-negative breast cancer subtypes and
preclinical models for selection of targeted therapies. J Clin Invest, 2011. 121(7): p.
2750-67.
63. Cheung, K.J. and A.J. Ewald, Illuminating breast cancer invasion: diverse roles for cell-
cell interactions. Curr Opin Cell Biol, 2014. 30: p. 99-111.
64. Masuda, H., et al., Differential response to neoadjuvant chemotherapy among 7 triple-
negative breast cancer molecular subtypes. Clin Cancer Res, 2013. 19(19): p. 5533-40.
65. Lee, M.W., et al., The CT20 peptide: more than a piece of bax. Can Cell Microenviron,
2014. 1(e266).
66. Kasembeli, M., et al., Modulation of STAT3 folding and function by TRiC/CCT
chaperonin. PLoS Biol, 2014. 12(4): p. e1001844.
67. Trinidad, A.G., et al., Interaction of p53 with the CCT complex promotes protein folding
and wild-type p53 activity. Mol Cell, 2013. 50(6): p. 805-17.
68. Kitamura, A., et al., Cytosolic chaperonin prevents polyglutamine toxicity with altering
the aggregation state. Nat Cell Biol, 2006. 8(10): p. 1163-70.
69. Llorca, O., et al., Eukaryotic type II chaperonin CCT interacts with actin through specific
subunits. Nature, 1999. 402(6762): p. 693-6.
70. Boudiaf-Benmammar, C., T. Cresteil, and R. Melki, The cytosolic chaperonin CCT/TRiC
and cancer cell proliferation. PLoS One, 2013. 8(4): p. e60895.

116
71. Sarrio, D., et al., Epithelial-mesenchymal transition in breast cancer relates to the basal-
like phenotype. Cancer Res, 2008. 68(4): p. 989-97.
72. Kabir, M.A., et al., Physiological effects of unassembled chaperonin Cct subunits in the
yeast Saccharomyces cerevisiae. Yeast, 2005. 22(3): p. 219-39.
73. Tam, S., et al., The chaperonin TRiC controls polyglutamine aggregation and toxicity
through subunit-specific interactions. Nat Cell Biol, 2006. 8(10): p. 1155-62.
74. Spiess, M., et al., Over-expression analysis of all eight subunits of the molecular
chaperone CCT in mammalian cells reveals a novel function for CCTdelta. J Mol Biol,
2015.
75. Chen, L., et al., Chaperonin CCT-mediated AIB1 folding promotes the growth of
ERalpha-positive breast cancer cells on hard substrates. PLoS One, 2014. 9(5): p.
e96085.
76. Huang, X., et al., Chaperonin containing TCP1, subunit 8 (CCT8) is upregulated in
hepatocellular carcinoma and promotes HCC proliferation. APMIS, 2014. 122(11): p.
1070-9.
77. Coghlin, C., et al., Characterization and over-expression of chaperonin t-complex
proteins in colorectal cancer. J Pathol, 2006. 210(3): p. 351-7.
78. Yokota, S., et al., Increased expression of cytosolic chaperonin CCT in human
hepatocellular and colonic carcinoma. Cell Stress Chaperones, 2001. 6(4): p. 345-50.
79. Grantham, J., K.I. Brackley, and K.R. Willison, Substantial CCT activity is required for
cell cycle progression and cytoskeletal organization in mammalian cells. Exp Cell Res,
2006. 312(12): p. 2309-24.
80. Camasses, A., et al., The CCT chaperonin promotes activation of the anaphase-
promoting complex through the generation of functional Cdc20. Mol Cell, 2003. 12(1): p.
87-100.
81. Kubota, H., et al., Structure and expression of the gene encoding mouse t-complex
polypeptide (Tcp-1). Gene, 1992. 120(2): p. 207-15.
82. Silver, L.M., et al., Synthesis of mouse t complex proteins during haploid stages of
spermatogenesis. Dev Biol, 1987. 119(2): p. 605-8.
83. Yokota, S., et al., Cytosolic chaperonin is up-regulated during cell growth. Preferential
expression and binding to tubulin at G(1)/S transition through early S phase. J Biol
Chem, 1999. 274(52): p. 37070-8.

117
84. Hansen, W.J., et al., Diverse effects of mutations in exon II of the von Hippel-Lindau
(VHL) tumor suppressor gene on the interaction of pVHL with the cytosolic chaperonin
and pVHL-dependent ubiquitin ligase activity. Mol Cell Biol, 2002. 22(6): p. 1947-60.
85. Won, K.A., et al., Maturation of human cyclin E requires the function of eukaryotic
chaperonin CCT. Mol Cell Biol, 1998. 18(12): p. 7584-9.
86. Guest, S.T., et al., Two members of the TRiC chaperonin complex, CCT2 and TCP1 are
essential for survival of breast cancer cells and are linked to driving oncogenes. Exp Cell
Res, 2015. 332(2): p. 223-35.
87. Thota, R., X. Fang, and S. Subbiah, Clinicopathological features and survival outcomes
of primary signet ring cell and mucinous adenocarcinoma of colon: retrospective
analysis of VACCR database. J Gastrointest Oncol, 2014. 5(1): p. 18-24.
88. McGlynn, K.A., J.L. Petrick, and W.T. London, Global Epidemiology of Hepatocellular
Carcinoma: An Emphasis on Demographic and Regional Variability. Clin Liver Dis,
2015. 19(2): p. 223-238.
89. Razumilava, N. and G.J. Gores, Cholangiocarcinoma. Lancet, 2014. 383(9935): p. 2168-
79.
90. College of American Pathologists, Protocol for the Examination of Specimens From
Patients With Hepatocellular Carcinoma, C.o.A. Pathologists, Editor 2011.
91. Lauwers, G.Y., et al., Prognostic histologic indicators of curatively resected
hepatocellular carcinomas: a multi-institutional analysis of 425 patients with definition
of a histologic prognostic index. Am J Surg Pathol, 2002. 26(1): p. 25-34.
92. American Cancer Society. Cancer Facts & Figures 2015, 2015, American Cancer
Society: Atlanta.
93. Srigley, J.R., et al., Protocol for the examination of specimens from patients with
carcinoma of the prostate gland. Arch Pathol Lab Med, 2009. 133(10): p. 1568-76.
94. Epstein, J.I., et al., The 2005 International Society of Urological Pathology (ISUP)
Consensus Conference on Gleason Grading of Prostatic Carcinoma. Am J Surg Pathol,
2005. 29(9): p. 1228-42.
95. Butnor, K.J., et al., Protocol for the examination of specimens from patients with primary
non-small cell carcinoma, small cell carcinoma, or carcinoid tumor of the lung. Arch
Pathol Lab Med, 2009. 133(10): p. 1552-9.
96. Lin, Y.F., et al., Intracellular beta-tubulin/chaperonin containing TCP1-beta complex
serves as a novel chemotherapeutic target against drug-resistant tumors. Cancer Res,
2009. 69(17): p. 6879-88.

118
97. Lin, Y.F., Y.F. Lee, and P.H. Liang, Targeting beta-tubulin:CCT-beta complexes incurs
Hsp90- and VCP-related protein degradation and induces ER stress-associated apoptosis
by triggering capacitative Ca2+ entry, mitochondrial perturbation and caspase
overactivation. Cell Death Dis, 2012. 3: p. e434.
98. Elliott, K.L., et al., A novel function of the monomeric CCTepsilon subunit connects the
Serum Response Factor pathway to chaperone-mediated actin folding. Mol Biol Cell,
2015.
99. Amit, M., et al., Equivalent mutations in the eight subunits of the chaperonin CCT
produce dramatically different cellular and gene expression phenotypes. J Mol Biol,
2010. 401(3): p. 532-43.


![WELCOME []...Anabolic Steroids Anabolic Agent Stimulants Peptide Hormones Dieuretics Street Drugs (Heroin;Marijuana, etc. Ephedra, Ephedrine (OTC meds). DISCOURAGED substances: Creatine](https://img.dokumen.tips/doc/110x75/5f0d43bc7e708231d4397c40/welcome-anabolic-steroids-anabolic-agent-stimulants-peptide-hormones-dieuretics.jpg)