Embed Size (px)
Citation preview
The Credit Cloud: China Will LeapfrogThe U.S. In The Race For $53 TrillionIn Corporate Funding
Corporate & Government Ratings:
Jayan U Dhru, Senior Managing Director, New York 212-438-7276; [email protected]
Primary Credit Analysts:
Terry E Chan, CFA, Melbourne (61) 3-9631-2174; [email protected]
David C Tesher, New York 212-438-2618; [email protected]
Eduardo Uribe-Caraza, Mexico City (52) 55-5081-4408; [email protected]
Paul Watters, CFA, London (44) 20-7176-3542; [email protected]
Table Of Contents
Asia-Pacific--Has China Created A Corporate Credit Bubble?
U.S.--Continuing Economic Recovery Will Fuel Financing Needs
Europe--Trying To Get Back On Track
Latin America--Meeting A Growing Need
Downside Risk For Funding In The Western Economies
Increased Liquidity Among Western Economies Is A Partial Offset
A Fine Balance
Appendix
Related Research
WWW.STANDARDANDPOORS.COM/RATINGSDIRECT MAY 14, 2013 1
1132346 | 300000480
The Credit Cloud: China Will Leapfrog The U.S. InThe Race For $53 Trillion In Corporate Funding(Editor's Note: Stress in the eurozone, global fiscal and budgetary gridlock, uncertainty surrounding central bank monetary
policies, and robust corporate issuance conditions fueled by investors' thirst for yield continue to generate storm clouds over the
global financial landscape. At this critical juncture, will the financial storm be blown to sea or will darker clouds begin to roll in?
Through a series of reports in 2013 titled "The Credit Cloud," Standard & Poor's Ratings Services aims to provide insight on the
competing forces that can influence corporate credit quality and alter the fragile equilibrium that currently exists in the global
corporate credit landscape.)
China is number one. At least it will soon be in terms of nonfinancial corporate debt. Standard & Poor's Ratings
Services forecasts that China's outstanding corporate debt will catch up and surpass the U.S.'s to represent the largest
amount globally within the next two years. We expect the debt needs of China, with its higher nominal GDP growth
rate, to reach $18 trillion over the next five years ending 2017--a significant share of the estimated $53 trillion of global
refinancing and new money requirements over this period. (Watch the related CreditMatters TV segment titled, " $53
Trillion For Global Corporate Debt Funding Needs Over The Next Five Years, Says Standard & Poor’s", dated May 14,
2013.)
Overview
• Globally, nonfinancial corporations will demand up to $53 trillion in refinancing and new debt needs over the
next five years. China will likely surpass the U.S. as the world's largest corporate debt borrower by 2014 or
2015.
• The Asia-Pacific region will seek $27 trillion, pushing its debt to $32 trillion outstanding by 2017, exceeding the
U.S., Canada, the eurozone and the U.K. combined.
• As the U.S. economy recovers, corporates will seek $13 trillion for refinancing and to make up for recent
underinvestment in capital expenditures.
• Eurozone and U.K. corporations will seek $10 trillion, constrained by a low-growth environment marked by
tough loan renewal conditions.
• Latin America's corporations will seek $1.4 trillion, primarily to support growing consumption and proposed
energy and infrastructure projects.
• While downside risks exist, such as credit rationing from Western banks and a potential Chinese economic
correction, our base case assumes that the banks and capital markets will be able to handle these 2013-2017
refinancing and new funding requirements.
Asia-Pacific continues to lead the way among global regions in terms of financing requirements for nonfinancial
corporate borrowers. North America is second, bolstered by a strengthening U.S. economic recovery, as evidenced by
improving housing, employment, and consumer sentiment metrics. Meanwhile, financing needs in the eurozone are
relatively subdued as the continent struggles with only marginal economic growth at best. While there has been a
pickup in Latin America, led by Brazil, the region's share remains comparatively small.
Of the $49 trillion-$53 trillion in financing (which includes both rated and unrated bonds and loans) that we estimate
WWW.STANDARDANDPOORS.COM/RATINGSDIRECT MAY 14, 2013 2
1132346 | 300000480

nonfinancial corporates will need from 2013-2017, outstanding debt to be refinanced accounts for about $34.7 trillion,
and new money that borrowers will seek to fund growth makes up $14.7 trillion-$18.7 trillion (see table 1). The
developed Western economies of the U.S., Canada, the eurozone, and the U.K. account for about $18 trillion, or 53%,
of the refinancing amount. Of the Asia-Pacific region's almost $16 trillion refinancing need over the five-year period,
China's $8 trillion accounts for about half.
Table 1
Nonfinancial Corporate Debt Demands*
--For 2013-2017--
--New debt demand (bil.
US$)--
--Total debt
demand (bil. US$)--
Total debt
(bil. US$)
2012
Refi
demand
(bil. US$)#
Real local
currency GDP
CAGR
assumed¶
Nominal local
currency GDP
CAGR assumed¶
1x nom
GDP
growth§
1.2x nom
GDP
growth† 1x§ 1.2x†
Asia-Pacific20,838 15,628 N/A N/A 9,040 11,628 24,668 27,256
Australia 1,101 826 3.1% 5.1% 223 288 1,049 1,114
China 10,994 8,246 8.4% 11.5% 7,346 9,321 15,592 17,566
Hong Kong 457 343 4.1% 8.1% 218 270 560 612
India 862 647 6.5% 13.4% 529 702 1,176 1,348
Indonesia 141 106 6.4% 12.4% 87 113 193 219
Japan 5,179 3,884 1.3% 2.3% (227) (115) 3,657 3,769
Korea 1,335 1,001 3.7% 6.2% 535 647 1,536 1,648
Malaysia 393 295 5.2% 7.5% 179 220 474 515
Singapore 189 141 3.9% 5.7% 47 60 188 201
Thailand 187 140 4.7% 7.2% 103 123 243 263
North America13,178 9,884 N/A N/A 3,594 4,408 13,477 14,291
U.S. 12,185 9,139 3.0% 5.1% 3,413 4,179 12,552 13,318
Canada 993 745 2.2% 4.2% 181 228 925 973
Europe
(Eurozone and
U.K.)
11,158 8,369 N/A N/A 1,719 2,066 10,088 10,434
Eurozone 9,199 6,899 1.0% 2.5% 1,393 1,654 8,292 8,554
U.K. 1,959 1,469 1.6% 3.8% 326 411 1,795 1,880
Latin America1,083 812 N/A N/A 351 626 1,163 1,439
Brazil 830 623 3.3% 7.2% 221 410 843 1,032
Mexico 253 190 3.3% 9.1% 130 217 320 407
Total 46,257 34,693N/A N/A
14,703 18,728 49,396 53,420
*See appendix for details regarding data calculations. #Assumes that the debt matures roughly pro rata over an average seven-year period. So
for five years, it is 5/7, which is rounded up to 75%. ¶Based on International Monetary Fund April 2013 (current prices) projections--real local
currency GDP growth, nominal local currency GDP growth, and implied foreign exchange rate forecasts against US$; except Latin America
nominal and real GDP, Standard & Poor's. §Assumes debt grows at the same rate as GDP over the next five years. †Assumes debt grows at 1.2x
the rate of GDP over the next five years (except for Latin America: 1.5x). CAGR--Compound average growth rate. N/A--Not applicable.
China is poised to overtake the U.S. as the country with the world's largest corporate debt wall in 2014 (if debt grows
at 1.2x nominal GDP growth) or 2015 (assuming 1.0x nominal GDP growth). In the former scenario, China's
WWW.STANDARDANDPOORS.COM/RATINGSDIRECT MAY 14, 2013 3
1132346 | 300000480
The Credit Cloud: China Will Leapfrog The U.S. In The Race For $53 Trillion In Corporate Funding

nonfinancial corporations would owe $13.8 trillion in 2014, versus U.S. corporations' $13.7 trillion--and, in the latter
scenario, $14.7 trillion in 2015 versus $14.1 trillion (see chart 1).
In a similar vein, but over a longer-term horizon, Asia-Pacific could have more corporate debt than North America, the
eurozone, and the U.K. combined by 2017, regardless of whether debt grows at 1.2x the nominal GDP growth of each
country or 1.0x nominal GDP. In the 1.2x scenario, Asia-Pacific's nonfinancial corporates would owe US$32.5 trillion,
versus the US$30.8 trillion combined total of their peers in North America, the eurozone, and the U.K. In the 1.0x
scenario, the projected figure is US$29.9 trillion for the Asia-Pacific versus US$29.7 trillion for the two other regions
(see chart 2). (Note: The cited $32.5 trillion, $30.8 trillion, $29.9 trillion, and $29.7 trillion figures are the sums of new
funding and refinancing plus the residual debt that did not require refinancing during 2013-2017 (collectively "the
balance outstanding"). Because of the addition of the residual debt, these amounts are higher than the amounts shown
in the "Total debt demand" columns of table 1, which are the sums of new funding and refinancing ("demand flow").)
Funding requirements for Brazil and Mexico, representing Latin America's largest emerging economies, would only
reach US$1.4 trillion by 2017, despite the region's economy growing at a faster rate (1.5x the rate of GDP) than the rest
of the world.
WWW.STANDARDANDPOORS.COM/RATINGSDIRECT MAY 14, 2013 4
1132346 | 300000480
The Credit Cloud: China Will Leapfrog The U.S. In The Race For $53 Trillion In Corporate Funding

Asia-Pacific--Has China Created A Corporate Credit Bubble?
Asia-Pacific's nonfinancial corporates, on the backs of Chinese companies, are lining up for $25 trillion-$27 trillion in
refinancing and new financing in the next five years. New financing could stack up Asia-Pacific's debt wall to as much
as $32.5 trillion by 2017--60% higher than at the end of last year. Within the next five years, China's economic
expansion could see its nonfinancial corporates looking for $16 trillion-$18 trillion in financing. As it stands, the
country's credit boom has resulted in outstanding corporate debt of 134% of GDP, the second highest (after the
financial center of Hong Kong) in our sample of economies.
Why has China's corporate credit been growing so fast? Simply put, high levels of investment, primarily in
manufacturing, real estate, and infrastructure, have supported the country's strong economic growth rate, particularly
over the past five years--and credit is fueling this investment. The corporate sector is the primary beneficiary of such
credit, given that the household sector is relatively underdeveloped, with domestic banks being the largest lenders,
though a significant shadow banking sector (credit intermediation outside the regular banking system) does exist.
While China is now on a lower growth trajectory than in the prior decade, the trajectory is still very high by global
standards. The country's banks, like many other Asian banks, have not come under the same stresses that banks in
Europe and U.S. have in recent years. Thus, Chinese banks have the financial capacity to continue lending.
Consequently, absent a more substantial rebalancing of the economy toward consumption, away from investment,
China's corporate debt growth is likely to continue at a fast pace for the foreseeable future.
China has had a remarkable three-decade run without suffering a year of recession. In fact, for the past two decades,
China has never reported an annual real GDP growth number below 7.5% or a nominal GDP number below 6%. While
it is tempting to say that China's economy can grow at such a level for another 20 years, we suggest that the risk of a
WWW.STANDARDANDPOORS.COM/RATINGSDIRECT MAY 14, 2013 5
1132346 | 300000480
The Credit Cloud: China Will Leapfrog The U.S. In The Race For $53 Trillion In Corporate Funding

correction may continue to be building.
One downside risk is the likely lower productivity of investment that has been occurring since 2008. Among a sample
of 32 economies, China has the highest risk of an economic correction because of low investment productivity.
Chinese companies have been borrowing to make capital investments, primarily in manufacturing, real estate, and
infrastructure--fueling economic growth. There had been a growth spike in nominal credit to private sector in 2009,
which runs counter to the fall in nominal and real GDP growth that year (see chart 3).
Chart 3
The situation is compounded by the restricted flow of information and lack of transparency in China. Besides the rapid
credit expansion in 2009-2010 and resulting high private-sector-credit-to-GDP ratio, other risks from a banking
perspective include the significant increase in property prices, relatively weak payment and corporate governance
culture, and market distortions created by state ownership in banks. Further complications include the existence of
local government financing platforms as borrowers and shadow banking's role in lending.
A substantial portion of corporate credit in China resides with state-owned enterprises (SOEs). Our survey last year of
the top 100 corporates in China highlighted that about 80% of such corporates are SOEs. Although some of the SOEs
are publicly listed, there continues to be a high degree of information asymmetry between the SOEs and external
WWW.STANDARDANDPOORS.COM/RATINGSDIRECT MAY 14, 2013 6
1132346 | 300000480
The Credit Cloud: China Will Leapfrog The U.S. In The Race For $53 Trillion In Corporate Funding

stakeholders. Our study also showed that borrowers' financial risk profiles are, on average, relatively weak. We assess
most companies come in at around the "significant" level--the fourth of our six rankings of financial risk (see "Business
Risk/Financial Risk Matrix Expanded," Sept. 18, 2012). Large companies tend to cluster in the "intermediate" and
"highly leveraged" categories. On the other hand, their business risk profiles are mostly stronger.
China has admirably managed through the global financial crisis, especially by their adept handling of stimulus
spending. While this track record provides comfort, unintended consequences of government policy decisions could
possibly trigger an economic correction. For example, in an attempt to rebalance the economy to depend less on
investment and more on consumption, government policy may cause investment to scale down faster than
consumption can compensate for the slack. This could result in a fairly quick rise in the banks' nonperforming loans
above currently manageable levels. Such a scenario is not necessarily disastrous. Rather, it could be cathartic in
reducing economic inefficiencies, allowing China to embark on its next stage of economic development. This is
particularly pertinent considering that China's working population is forecasted to decline in the next few years,
removing the advantage of the demographic dividend that the country has enjoyed in recent decades.
(See the Related Research section at the end of this article for a list of Standard & Poor's recently published reports
regarding China's credit situation.)
U.S.--Continuing Economic Recovery Will Fuel Financing Needs
We estimate that U.S. nonfinancial corporates will need to borrow $12.6 trillion-$13.3 trillion in the five years through
2017 (up from as much as $11.7 trillion for 2012-2016), as the recovery in the world's biggest economy takes hold.
About one-third of the total will likely be new financing. In 2012, U.S. non-financial corporates raised a record $674
billion in bonds. Companies will likely use the bulk of new financing for capital expenditures--and, to a lesser extent,
for shareholder returns and mergers and acquisitions (M&A)--as they make up for underinvestment in the wake of the
recent financial crisis and recession. Many firms have cut costs, but with the economy improving, they need to grow
top-line revenue, as it is difficult to solely cut one's way to prosperity. Funding for capital expenditures and M&A is
one way to accomplish this goal.
U.S. leveraged loan volume reached $465 billion last year--a 24% increase from 2011 and the third-highest year behind
pre-recession 2006 and 2007. In all, outstanding debt among U.S. nonfinancial corporations reached $12.2 trillion--an
increase of 6% from $11.5 trillion in 2011. Based on still current favorable credit market conditions and projected
economic expansion, the wall of U.S. nonfinancial corporate debt could grow to as much as $16.4 trillion by 2017.
We estimate that there was a shortfall in capital investment by the U.S. nonfinancial corporate borrowers we rate of
$175 billion from 2009 until the end of 2011 (see "The Credit Overhang: U.S. Corporations Have Underinvested By
$175 Billion To Bolster Cash," Dec. 12, 2012). Many speculative-grade issuers, in particular, focused on fortifying their
balance sheets, building liquidity, and enhancing profitability by cutting fat from their cost structures, rather than
investing for long-term growth. This period of underinvestment finally reversed course in 2012, fueled by robust
spending in second half of the year.
Meanwhile, U.S. corporates' record cash balances--now earning minimal interest income--as well as signs of strength
WWW.STANDARDANDPOORS.COM/RATINGSDIRECT MAY 14, 2013 7
1132346 | 300000480
The Credit Cloud: China Will Leapfrog The U.S. In The Race For $53 Trillion In Corporate Funding

in the U.S. economy, especially in housing and employment figures, suggest that companies will soon increase stock
buybacks and dividends. We believe debt financing will be an integral part of this. Last year, nonfinancial companies in
the S&P 500 Index increased share repurchases and dividends by about 3%, to $595 billion (consisting of a 5% decline
in repurchases and 15% growth in dividends). Based on higher dividend payments and announced dividend increases
in the first quarter of this year, 2013 will likely top last year's total. Likewise, share buybacks (both completed and
announced) have increased meaningfully since the beginning of the year, with the recent announcement by Apple a
prime example.
In addition, M&A in North America will likely increase this year, as long as the positive momentum in the U.S.
economy continues and the European economic and banking outlook does not deteriorate markedly. Favorable credit
markets, sizable corporate cash reserves, and companies in maturing industries seeking to grow through acquisition all
augur well for an increase in M&A. Despite the record level of cash held by U.S. corporates, large acquisitions will
likely involve debt issuance because of low domestic cash balance and repatriation concerns. We also expect growing
participation by financial buyers and sellers that have very high levels of uninvested funds at their disposal to further
drive new financing needs. (See "Conditions Are Ripe For North American M&A To Surge In 2013," April 8, 2013.)
Europe--Trying To Get Back On Track
In the aftermath of the sovereign debt and financial crises that hit Europe, it seems clear that the combination of
expansionary monetary policy and multiyear fiscal consolidation is not likely to put the region's economy back on a
steady growth track anytime soon. In this environment, we expect nonfinancial companies in the European Economic
and Monetary Union (eurozone) and the U.K. to maximize their financial flexibility. They will likely achieve this by
preserving free cash flow, maintaining high cash balances, and refinancing on a timely basis--including diversifying
their funding sources at a faster pace than has been seen to date.
As a consequence, we have reduced our expectations for the overall corporate funding requirement in the eurozone
and U.K. for 2013-2017. We now estimate a total funding requirement of $10.0 trillion-$10.4 trillion, down from our
previous estimate of $10.5 trillion-$10.9 trillion last year. This puts Europe firmly into the slow lane compared with the
rest of the world. Over the next five years, we estimate that European corporate debt could fall to 20% of the global
total, from 24% at the end of 2012. Notably, we project that China's corporate debt will likely be at least 50% above
that of Europe by the end of 2017, despite being at a similar level today.
We also expect that European corporates have a lot further to go to wean themselves off their reliance on bank debt
for term funding, particularly in the eurozone. While this is happening slowly at present, we expect the pace to pick up
once the economic uncertainties in Europe dissipate and companies develop a greater appetite for additional term
debt. Falling yields in the bond market can only help support this process.
At the end of last year, banks provided almost 86% of outstanding private nonfinancial corporate debt in the
eurozone--just four percentage points lower than in 2008 and significantly higher than the 63% and 51% that the banks
provided in the U.K. and U.S., respectively. This is particularly relevant given our forecast that eurozone corporations
will need about $5.9 trillion to refinance existing corporate bank debt over the next five years. While we expect that
WWW.STANDARDANDPOORS.COM/RATINGSDIRECT MAY 14, 2013 8
1132346 | 300000480
The Credit Cloud: China Will Leapfrog The U.S. In The Race For $53 Trillion In Corporate Funding

local banks will renew the vast majority of existing loans to small and medium-size enterprises (those firms most at
risk), maturities and terms may be more onerous given the capital constraints that banks face.
Of greater concern--though, perhaps, not in the short term, because of lack of demand--is companies' need for new
financing to fund growth. We estimate that the new money requirement for nonfinancial eurozone corporations could
be as high as $1.65 trillion over the next five years.
While total corporate debt has grown modestly in the past year--rising 1.1% in the eurozone and 2.8% in the U.K.--this
has all come from the bond markets. The outstanding volume of bank debt in the eurozone shrank 0.9% last year,
while outstanding bonds increased 15%, according to the European Central Bank. In the U.K., the shift was similar,
with outstanding corporate loans falling 1.8% and bonds growing 11%.
Putting this all together, in the next few years we can envisage eurozone corporate bond issuance picking up to
between €130 billion to €190 billion (US$170 billion-US$250 billion) per year as the proportion of bank to bond activity
moves towards 70/30. On top of this, given funding pressures from overstretched governments, the European
Commission is targeting the continent's private sector to fund a large part of their Europe 2020 long-term investment
program. Potentially sized at around 1.5 trillion-2.0 trillion euros ($2.0 trillion-$2.6 trillion) in total over the period
2013-2020, we estimate that institutional investors will likely be called on to invest between €50 billion and €70 billion
($65 billion-$90 billion) annually in the bond market once the program becomes established. Depending on the final
risk sharing and guarantee arrangements that will be put in place after the current consultation concludes, there is a
real risk that the institutional financing of this infrastructure program ends up competing for investor euros with what
would already be a challenging level of euro-denominated bond issuance on a net basis by eurozone corporations.
Latin America--Meeting A Growing Need
Despite Latin America's relatively small share of nonfinancial corporate debt accounting for less than 5% of the
worldwide total, regional funding requirements are on the rise. The increasing demand of a growing and young middle
class fueling consumer spending, many Latin American countries' large investments in the energy sector and overall
infrastructure to catch up with decades of underinvestment, and the ongoing consolidation in several regional
industries leading to M&A opportunities (see "Economic Growth And Opportunities In Several Markets Will Fuel M&A
Activity In Latin America," April 10, 2013) will be some of the factors contributing to larger funding requirements in the
years to come.
Our forecast calls for Latin American corporate funding requirement needs to grow at a multiple of 2x regional GDP in
the next two to three years, and to gradually decline to 1.2x-1.5x afterward. Our overall five-year forecast is 1.5x
average GDP growth, which would bring the funding requirements to about $1.4 trillion for Brazil and Mexico in 2017.
Funding needs by other Latin American economies would add to this amount. Our base case still assumes that
regional banks and debt capital markets will continue to provide the majority of liquidity for Latin American
companies to refinance their debt maturities and fund their growth. Of course, long-term growth will depend very
much on enduring business-friendly public policies and an improved institutional framework in each of the countries in
the region.
WWW.STANDARDANDPOORS.COM/RATINGSDIRECT MAY 14, 2013 9
1132346 | 300000480
The Credit Cloud: China Will Leapfrog The U.S. In The Race For $53 Trillion In Corporate Funding

On the other hand, the refinancing of $1.1 trillion of debt in Brazil and Mexico, the largest debt issuers in the region,
could be an issue if economic conditions in the eurozone or in the world's other large markets were to deteriorate, or if
economic policies in the key regional markets change for the worse.
We believe that banks and institutional investors will continue to provide the liquidity necessary for the refinancing of
Latin American corporate debt, considering the overall regional positive economic prospects ahead (Standard & Poor's
baseline assumption calls for regional growth to pick up to about 3.2% in 2013 and 3.4% in 2014--see "Latin America’s
Economic Growth Should Pick Up in 2013-2014 But Remain South of Prerecession Levels," April 23, 2013). Still, the
interconnection of the global banking system and swings in investor appetite could pose some threat. Also, temporary
industry disruptions in a few regional sectors (e.g., Mexican low income housing) and the downward pressure on
commodity prices stemming from weaker Asian demand could negatively affect the financial performance of regional
producers--and ultimately have an impact on their funding needs and refinancing alternatives. Still, under our
base-case scenario, we expect the regional demand for funds to increase in coming years.
About $100 billion of bonds that Standard & Poor's rates in Latin America will mature in the next five years and nearly
75% of them are rated at an investment-grade level, which should make for low refinancing risk. Lower-rated
borrowers' refinancing will likely continue to depend on benign economic conditions and investor appetite for high
yields, given the aversion of some of the larger banks and institutional investors to take on that type of risk. So the
likelihood of a few of these bonds defaulting is still present. However, the good news is that more regional companies
rated in the 'BB' category (and of course above) are finding funding in the debt capital markets as they take advantage
of low interest rates and a burgeoning investor class. Nonfinancial corporate bonds already represent close to 25% of
the total funding needs in Brazil and Mexico. Meanwhile, given growth prospects in the region, some of the larger
financial institutions expect to continue growing their loan portfolios (accounting for the lion's share of credit to the
private sector) by 10-20% in the next couple of years, with a focus on medium-size enterprises.
Downside Risk For Funding In The Western Economies
We have premised our debt projections on a recovery following historical patterns. Yet that is not at all certain given
the myriad of uncertainties that prevail. Not least, Western banks may continue to ration credit as they seek to repair
their balance sheets, and reassess their risk thresholds. Moreover, the largest U.S. banks could curtail their lending as
they stash away more capital to meet what could soon be much stricter requirements (see "Brown-Vitter Bill:
Game-Changing Regulation For U.S. Banks," April 25, 2013). Lack of confidence in the strength of recovery and tight
credit conditions could certainly weigh on growth prospects.
In the unlikely downside scenario of the U.S., eurozone, and U.K. experiencing similar nominal GDP cumulative
average growth rates as they did for the past four years (2.4%, 0.7%, and 1.7% per annum respectively) over the next
five years, their collective refinancing and new funding needs for 2013-2017 would decline to $19 trillion-$20 trillion, or
18%-20% down from our base case $24 trillion to $25 trillion. In turn, the global corporate need would fall to $45
trillion-$48 trillion.
Still, while downside risks remain, our base-case assumption is that banks and capital markets will largely be able to
WWW.STANDARDANDPOORS.COM/RATINGSDIRECT MAY 14, 2013 10
1132346 | 300000480
The Credit Cloud: China Will Leapfrog The U.S. In The Race For $53 Trillion In Corporate Funding

meet borrowers' financing needs--in part because of the still very accommodative monetary policy of U.S. and
European authorities. But the balance is tenuous. Governments and banking regulators are not as well positioned as
they were last year to counter adverse conditions, having already exhausted much of their fiscal and monetary
arsenals. Furthermore, some countries are struggling to implement austerity measures to deal with their own sovereign
debt and deficit problems. This may impede their ability to respond to additional economic turbulence. Depending on
the severity of a flare-up, a wider set of borrowers than just those that are highly leveraged could find their financing
and refinancing needs in jeopardy.
While most of the economic and regulatory challenges that banks face are similar in the U.S. and Europe, we believe
there could be more severe effects on lending in the eurozone, where banks have been slow to trim their corporate
exposures, which is likely to put further pressure to curtail lending in unfamiliar regions or sectors. Beyond having to
adapt to a sovereign debt crisis and economic slump, European banks continue to work toward meeting
capital-adequacy and stress-testing standards as part of the Basel III accord. This will likely have more profound
consequences for corporate borrowers in Europe because they rely more on banks than the bond market for funding
than their U.S. counterparts. The effects may be exacerbated for borrowers with comparatively weak credit quality or
those sectors where banks have a high concentration of risk.
We do not expect U.S. lenders to incorporate Basel III standards for several years, as firm rules have not been
established by the Federal Reserve. At the same time, U.S. banks may limit their loan growth because of the higher
regulatory cost of capital that domestic rules may require. This could mean that traditional relationship lending--such
as general-purpose credit facilities--may become more expensive or less available.
The corporate bond market in the U.S. has demonstrated its ability to make up any shortfall, providing more than $550
billion in corporate funding in each of the past three years. The less-developed bond market in Europe presents greater
challenges for corporates. By our calculations, if eurozone corporations were to raise 25%-30% of their new funding
requirements in the bond markets (up from about 15% historically), this would amount to between $170 billion and
$250 billion each year. According to Eurostat, prior to 2012 (which was a record-breaking year for corporate
euro-denominated bond issuance, when net issuance reached a $134 billion equivalent), there were only two years
since 2000 when net issuance even came close to $100 billion. As such, the liquid U.S. bond market can and does
provide a partial offset to capacity constraints in Europe.
Meanwhile, Asian banks are, in our view, likely to continue lending, although at a rate in line with decelerating
economic growth. In some Asian countries, such as China, a large portion of bank lending may be state-directed so
that financing capacity isn't subject to the same limitations as in Western markets.
Increased Liquidity Among Western Economies Is A Partial Offset
A partial offset to the funding risk is the ever-growing pile of liquid assets sitting on the sidelines in the U.S. and
eurozone corporate balance sheets, totaling $4.85 trillion at the end of 2012 (see appendix note). These balances have
built up as companies have focused on managing overheads, maximizing free cash flow, and minimizing discretionary
expenditures in response to the recessionary concerns in U.S. and eurozone. While each region's corporate balance
WWW.STANDARDANDPOORS.COM/RATINGSDIRECT MAY 14, 2013 11
1132346 | 300000480
The Credit Cloud: China Will Leapfrog The U.S. In The Race For $53 Trillion In Corporate Funding

sheet cash is substantial relative to each region's GDP (14.6% of U.S. GDP and 21.0% of eurozone GDP), the additional
financial flexibility this cash provides can be gauged by calculating the excess liquid assets relative to the years before
the financial crisis. On this basis, the corporate cash buffer is significantly higher in the eurozone than in the U.S. This
may reflect the U.S.'s better progress in taking policy actions to turn its economy around, translating into higher
business confidence levels, as well as greater confidence in the depth of liquidity available in the U.S. debt capital
markets. By our calculations, liquid assets have increased by about 4.8% of GDP in the eurozone over the past six
years, compared with the average level over the period 1999-2006, equivalent to €460 billion euros. On the same basis,
excess liquid assets in the U.S., while still meaningful, are substantially less, at 1.8% GDP, equivalent to $280 billion.
Further, the cash is not evenly distributed. In the U.S., certain rating categories--mainly investment grade (i.e., those
companies rated 'BBB-' or higher) and industries (e.g., technology and health care) hold a larger share of the cash pile.
The top 25 largest cash holders, which make up less than 2% of Standard & Poor's total rated issuers, account for
about 45% of total cash and short-term investments. In contrast, issuers in the speculative-grade category (rated 'BB+'
or lower), specifically in the 'B' and 'CCC/C' rating categories, have not benefited as much from the overall
strengthening of liquidity.
Accessibility of the cash is also a concern. In the U.S., for example, companies with global operations hold significant
portion of their cash overseas, which is subject to taxes as high as 35% upon repatriation. Cash flow generated
domestically is mostly earmarked for dividends and share repurchases, while cash flow generated overseas generally
sits idle. The cash imbalance continues to grow as a result. Standard & Poor's estimates that of the top 10 largest cash
holders in U.S., 80% of their cash was held overseas as of year-end 2012 versus 77% in 2011 (based on six out of 10
companies that disclosed this information). As seen with Apple Inc.'s record $17 billion bond issuance in April
earmarked for shareholder returns, these issuers continue to access the debt market as a form of balance sheet
arbitrage.
Overall, Standard & Poor's believes that while there is some scope for these liquid assets to be deployed to support and
supplement companies' growth needs, the excess over and above the average levels that prevailed prior to the
financial crisis is quite limited relative to the amount of financing required over the next five years. For the U.S., the
$260 billion excess is only equivalent to just over 2% of the overall financing requirement, while in Europe, the €460
billion would provide a more meaningful 7% of the projected financing requirement over the next five years.
A Fine Balance
All told, the growing demand for financing by nonfinancial corporate entities around the world could squeeze some
borrowers, especially those at the speculative-grade level, through the higher cost or shifting availability of capital--if
only at the margins. With the U.S. crawling to an economic recovery, Europe mired in recession, and the financing
requirements in Asia-Pacific taking center stage with China likely to soon become the world's largest debtor nation,
banks around the world are shoring up their balance sheets and rethinking their appetite for risk. Having spent much of
their fiscal and monetary capacity in recent years, governments and regulators do not have the same headroom to
battle adverse conditions as they once did. And for those who believe in the old adage "what goes up must come
down," it must seem that China's incredible three-decade-long economic growth trajectory will soon have to come to
WWW.STANDARDANDPOORS.COM/RATINGSDIRECT MAY 14, 2013 12
1132346 | 300000480
The Credit Cloud: China Will Leapfrog The U.S. In The Race For $53 Trillion In Corporate Funding
an end. Still, despite the remaining downside risks, we believe that the banks and capital markets will have the capacity
to meet borrowers' needs over the next five years.
Appendix
Comparison to 2012 estimates and data sources
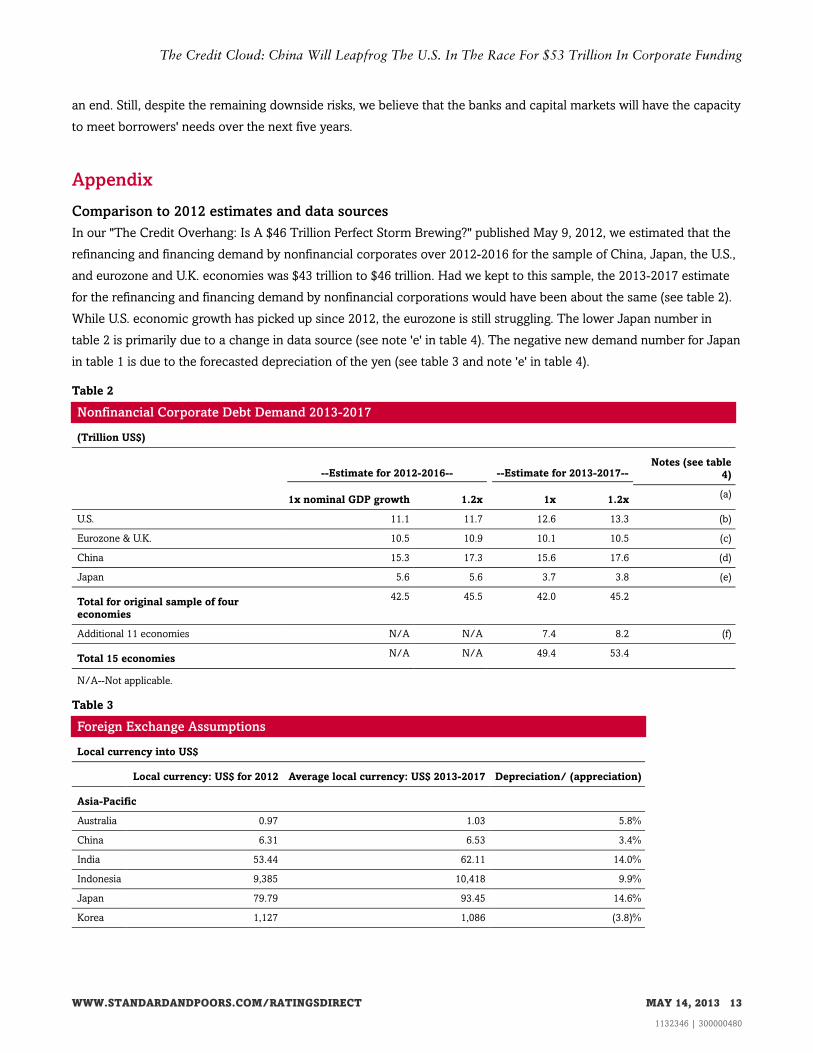
In our "The Credit Overhang: Is A $46 Trillion Perfect Storm Brewing?" published May 9, 2012, we estimated that the
refinancing and financing demand by nonfinancial corporates over 2012-2016 for the sample of China, Japan, the U.S.,
and eurozone and U.K. economies was $43 trillion to $46 trillion. Had we kept to this sample, the 2013-2017 estimate
for the refinancing and financing demand by nonfinancial corporations would have been about the same (see table 2).
While U.S. economic growth has picked up since 2012, the eurozone is still struggling. The lower Japan number in
table 2 is primarily due to a change in data source (see note 'e' in table 4). The negative new demand number for Japan
in table 1 is due to the forecasted depreciation of the yen (see table 3 and note 'e' in table 4).
Table 2
Nonfinancial Corporate Debt Demand 2013-2017
(Trillion US$)
--Estimate for 2012-2016-- --Estimate for 2013-2017--Notes (see table
4)
1x nominal GDP growth 1.2x 1x 1.2x(a)
U.S. 11.1 11.7 12.6 13.3 (b)
Eurozone & U.K. 10.5 10.9 10.1 10.5 (c)
China 15.3 17.3 15.6 17.6 (d)
Japan 5.6 5.6 3.7 3.8 (e)
Total for original sample of four
economies
42.5 45.5 42.0 45.2
Additional 11 economies N/A N/A 7.4 8.2 (f)
Total 15 economiesN/A N/A 49.4 53.4
N/A--Not applicable.
Table 3
Foreign Exchange Assumptions
Local currency into US$
Local currency: US$ for 2012 Average local currency: US$ 2013-2017 Depreciation/ (appreciation)
Asia-Pacific
Australia 0.97 1.03 5.8%
China 6.31 6.53 3.4%
India 53.44 62.11 14.0%
Indonesia 9,385 10,418 9.9%
Japan 79.79 93.45 14.6%
Korea 1,127 1,086 (3.8)%
WWW.STANDARDANDPOORS.COM/RATINGSDIRECT MAY 14, 2013 13
1132346 | 300000480
The Credit Cloud: China Will Leapfrog The U.S. In The Race For $53 Trillion In Corporate Funding

Table 3
Foreign Exchange Assumptions (cont.)
US & Canada
US N/A N/A N/A
Canada 1.00 1.04 3.8%
Eurozone & U.K.
Eurozone 0.78 0.76 (2.6)%
U.K. 0.63 0.65 3.1%
Latin America
Brazil 1.99 2.05 2.9%
Mexico 13.36 13.48 0.9%
N/A--Not applicable.
Source: International Monetary Fund
Table 4
Notes For Table 2
“The Credit Overhang: Is A $46 Trillion
Perfect Storm Brewing?” article published
May 9, 2012
"The Credit Cloud: China Will Leapfrog The U.S. In The Race For $53 Trillion
In Corporate Funding"
(a)Refinancing and new financing demand
We assume that for the five-year period
2012-2016:
We assume that for the five-year period 2013-2017:
(i) refinancing demand is equal to three-quarters
of outstanding debt at end-2011;
(i) refinancing demand is equal to three-quarters of outstanding debt at end-2012;
(ii) new financing demand equals either 1x times
or 1.2x the cumulative average growth rate of
nominal U.S. dollar-equivalent GDP multiplied by
outstanding debt at end-2011.
(ii) new financing demand equals either 1x or 1.2x the cumulative average growth rate of
nominal local currency GDP multiplied by outstanding debt at year-end 2012. The new
financing demand is translated to U.S. dollar based on forecast average exchange rate
for the five-year period.
Nominal GDP growth rates rather than real rates
because money supply is nominal. For example,
in an economy with zero real GDP growth and
5% inflation, corporates are likely to seek 5%
more in nominal terms when rolling over their
financing.
The modified approach in (ii) is taken to address possible fluctuations in local
currency-U.S. dollar exchange rates, which may mask or exaggerate debt growth. For
example, using U.S. dollar-equivalent GDP growth for Japan would have shown
negative GDP and debt growth, if a yen depreciation against the U.S. dollar is assumed.
For GDP, Standard & Poor's estimates. GDP: Based on International Monetary Fund’s World Economic Outlook database April
2013's GDP and foreign exchange rates (see table 3), except Latin America’s, which are
based on Standard & Poor’s estimates.
(b)U.S.
Data source
Debt securities and loans: from Federal Reserve's
Flow of Funds Accounts of the U.S. (Z.1 release),
March 7, 2013. Table L.101--sum of nonfinancial
corporate businesses' commercial paper (line 19)
and corporate bonds (line 21).
Same as in prior year’s article.
GDP growth assumption
-- Higher because of economic recovery.
WWW.STANDARDANDPOORS.COM/RATINGSDIRECT MAY 14, 2013 14
1132346 | 300000480
The Credit Cloud: China Will Leapfrog The U.S. In The Race For $53 Trillion In Corporate Funding

Table 4
Notes For Table 2 (cont.)
(c)Eurozone
Data source
Debt securities and loans: from European Central
Bank Statistics
Same as in prior year’s article.
GDP growth assumption
-- Marginally lower because of still-difficult economic conditions.
U.K.
Data source
Debt securities and loans: from Office for
National Statistics.
Same as in prior year’s article.
GDP growth assumption
-- Marginally lower because of still-difficult economic conditions.
(d)China
Data source
-- For debt securities: Asianbondsonline -- For debt securities: Bank for International Settlements (BIS) Quarterly Review
December 2012
-- For loans: IMF. -- For loans: BIS’s "Long series on total credit and domestic bank credit to the private
nonfinancial sector" (http://www.bis.org/statistics/credtopriv.htm) credit data less
above debt securities data.
We changed the data source because the BIS series separates loans to nonfinancial
corporations and loans to households, which allows us to exclude the latter.
GDP growth assumption
-- Marginally lower because of lower growth trajectory.
(e)Japan
Data source
-- For debt securities: Asianbondsonline -- For debt securities: Bank for International Settlements (BIS) Quarterly Review,
December 2012
-- For loans: IMF. -- For loans: BIS’s "Long series on total credit and domestic bank credit to the private
nonfinancial sector" (http://www.bis.org/statistics/credtopriv.htm) credit data less
above debt securities data.
We changed the data source because the BIS series separates loans to nonfinancial
corporations and loans to households, which allows us to exclude the latter. For Japan,
this has resulted in a lower starting figure for outstanding debt. Consequently,
refinancing and new financing demand estimates are lower.
GDP growth assumption
-- Marginally higher because of monetary easing (we are using nominal GDP).
Foreign exchange assumption
-- We are assuming a significant depreciation of the yen against the U.S. dollar in this
article (see table 3). This, in turn, results in a lower projected U.S. dollar-equivalent debt
number than if the yen-U.S. dollar rate was held constant.
(f)Additional economies
-- Australia, Brazil, Canada, Hong Kong, India, Indonesia, Korea, Malaysia, Mexico,
Singapore, and Thailand.
WWW.STANDARDANDPOORS.COM/RATINGSDIRECT MAY 14, 2013 15
1132346 | 300000480
The Credit Cloud: China Will Leapfrog The U.S. In The Race For $53 Trillion In Corporate Funding
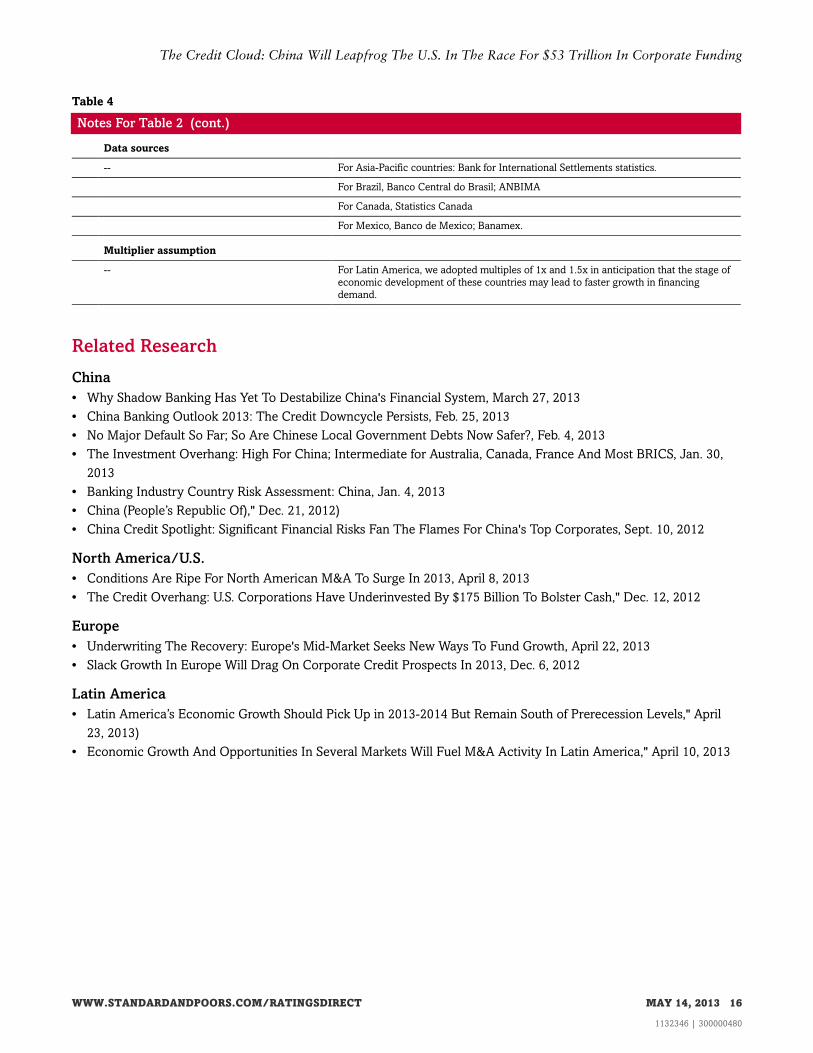
Table 4
Notes For Table 2 (cont.)
Data sources
-- For Asia-Pacific countries: Bank for International Settlements statistics.
For Brazil, Banco Central do Brasil; ANBIMA
For Canada, Statistics Canada
For Mexico, Banco de Mexico; Banamex.
Multiplier assumption
-- For Latin America, we adopted multiples of 1x and 1.5x in anticipation that the stage of
economic development of these countries may lead to faster growth in financing
demand.
Related Research
China
• Why Shadow Banking Has Yet To Destabilize China's Financial System, March 27, 2013
• China Banking Outlook 2013: The Credit Downcycle Persists, Feb. 25, 2013
• No Major Default So Far; So Are Chinese Local Government Debts Now Safer?, Feb. 4, 2013
• The Investment Overhang: High For China; Intermediate for Australia, Canada, France And Most BRICS, Jan. 30,
2013
• Banking Industry Country Risk Assessment: China, Jan. 4, 2013
• China (People’s Republic Of)," Dec. 21, 2012)
• China Credit Spotlight: Significant Financial Risks Fan The Flames For China's Top Corporates, Sept. 10, 2012
North America/U.S.
• Conditions Are Ripe For North American M&A To Surge In 2013, April 8, 2013
• The Credit Overhang: U.S. Corporations Have Underinvested By $175 Billion To Bolster Cash," Dec. 12, 2012
Europe
• Underwriting The Recovery: Europe's Mid-Market Seeks New Ways To Fund Growth, April 22, 2013
• Slack Growth In Europe Will Drag On Corporate Credit Prospects In 2013, Dec. 6, 2012
Latin America
• Latin America’s Economic Growth Should Pick Up in 2013-2014 But Remain South of Prerecession Levels," April
23, 2013)
• Economic Growth And Opportunities In Several Markets Will Fuel M&A Activity In Latin America," April 10, 2013
WWW.STANDARDANDPOORS.COM/RATINGSDIRECT MAY 14, 2013 16
1132346 | 300000480
The Credit Cloud: China Will Leapfrog The U.S. In The Race For $53 Trillion In Corporate Funding
S&P may receive compensation for its ratings and certain analyses, normally from issuers or underwriters of securities or from obligors. S&P
reserves the right to disseminate its opinions and analyses. S&P's public ratings and analyses are made available on its Web sites,
www.standardandpoors.com (free of charge), and www.ratingsdirect.com and www.globalcreditportal.com (subscription) and www.spcapitaliq.com
(subscription) and may be distributed through other means, including via S&P publications and third-party redistributors. Additional information
about our ratings fees is available at www.standardandpoors.com/usratingsfees.
S&P keeps certain activities of its business units separate from each other in order to preserve the independence and objectivity of their respective
activities. As a result, certain business units of S&P may have information that is not available to other S&P business units. S&P has established
policies and procedures to maintain the confidentiality of certain nonpublic information received in connection with each analytical process.
To the extent that regulatory authorities allow a rating agency to acknowledge in one jurisdiction a rating issued in another jurisdiction for certain
regulatory purposes, S&P reserves the right to assign, withdraw, or suspend such acknowledgement at any time and in its sole discretion. S&P
Parties disclaim any duty whatsoever arising out of the assignment, withdrawal, or suspension of an acknowledgment as well as any liability for any
damage alleged to have been suffered on account thereof.
Credit-related and other analyses, including ratings, and statements in the Content are statements of opinion as of the date they are expressed and
not statements of fact. S&P's opinions, analyses, and rating acknowledgment decisions (described below) are not recommendations to purchase,
hold, or sell any securities or to make any investment decisions, and do not address the suitability of any security. S&P assumes no obligation to
update the Content following publication in any form or format. The Content should not be relied on and is not a substitute for the skill, judgment
and experience of the user, its management, employees, advisors and/or clients when making investment and other business decisions. S&P does
not act as a fiduciary or an investment advisor except where registered as such. While S&P has obtained information from sources it believes to be
reliable, S&P does not perform an audit and undertakes no duty of due diligence or independent verification of any information it receives.
No content (including ratings, credit-related analyses and data, valuations, model, software or other application or output therefrom) or any part
thereof (Content) may be modified, reverse engineered, reproduced or distributed in any form by any means, or stored in a database or retrieval
system, without the prior written permission of Standard & Poor's Financial Services LLC or its affiliates (collectively, S&P). The Content shall not be
used for any unlawful or unauthorized purposes. S&P and any third-party providers, as well as their directors, officers, shareholders, employees or
agents (collectively S&P Parties) do not guarantee the accuracy, completeness, timeliness or availability of the Content. S&P Parties are not
responsible for any errors or omissions (negligent or otherwise), regardless of the cause, for the results obtained from the use of the Content, or for
the security or maintenance of any data input by the user. The Content is provided on an "as is" basis. S&P PARTIES DISCLAIM ANY AND ALL
EXPRESS OR IMPLIED WARRANTIES, INCLUDING, BUT NOT LIMITED TO, ANY WARRANTIES OF MERCHANTABILITY OR FITNESS FOR
A PARTICULAR PURPOSE OR USE, FREEDOM FROM BUGS, SOFTWARE ERRORS OR DEFECTS, THAT THE CONTENT'S FUNCTIONING
WILL BE UNINTERRUPTED, OR THAT THE CONTENT WILL OPERATE WITH ANY SOFTWARE OR HARDWARE CONFIGURATION. In no
event shall S&P Parties be liable to any party for any direct, indirect, incidental, exemplary, compensatory, punitive, special or consequential
damages, costs, expenses, legal fees, or losses (including, without limitation, lost income or lost profits and opportunity costs or losses caused by
negligence) in connection with any use of the Content even if advised of the possibility of such damages.
Copyright © 2016 Standard & Poor's Financial Services LLC, a part of McGraw Hill Financial. All rights reserved.
WWW.STANDARDANDPOORS.COM/RATINGSDIRECT MAY 14, 2013 17
1132346 | 300000480