Embed Size (px)
Citation preview

“The costs of inequality: capitalism & democracy at cross-
purposes” Robert H. Wade
LSE
March 2014

Alternative title
• “From labor Kism to ‘patrimonial Kism’ & from democratic democracy to ‘plutocratic democracy’”
• Patrimonial Kism = where Y from capital, especially inherited capital, dominates total Y distribution
• Plutocratic democracy = where preferences of rich dominate public policy

Economists have long ignored income IN
• Martin Feldstein (Economics, Harvard): “Income inequality is not a problem in need of remedy” (1998)
• Robert Lucas (Economics, Harvard, Nobel laureate): “Of the tendencies that are harmful to sound economics, the most seductive and … poisonous is to focus on questions of distribution” (2004)
• Willem Buiter (chief econ Citigroup, ex- LSE): “Poverty bothers me. Inequality does not. I just don’t care” (FT, 2007)

Why have economists ignored inequality?
• (1) Trade-off b/w “efficiency” (econ growth) and “equity”.
• (2) Kuznets curve: Gini follows inverted U trajectory as GDPPC rises
• (3) Technological change is skill-biased. The more highly skilled righly get higher remuneration.
• These explanations “set minds at rest”. Imply that capitalism distributes material benefits equitably without intervention by the state.
International organizations have long ignored inequality
• World Bank & IMF
• They consider “inequality” too “political”. “Poverty”, “efficiency” “a-political”
• G20 ignores inequality

US public unconcerned abt IN
• Recent Gallup poll: “What do you think is the most important problem facing this country today?”
• Top of list: federal government (21%) • “Gap b/w rich & poor” came far down: only 4%.

But, inequality becoming controverial
• Obama: 4 Dec 2013: growing Y gap is a “defining challenge of our time”
• Pope Francis
• Recent publications from World Bank, even IMF

World Economic Forum: Global Risks 2012 Report
• Respondents to Global Risks Survey scored economic, environmental, geopolitical, societal & tech risks over next 10 years by (a) likelihood & (b) impact
• Top 3 (combined score): (1) chronic fiscal imbalances, (2) severe income disparity = (2) water supply crises
• BBC News Business headlined its report “Stark inequality ‘top global risk’”, 12 Jan 2012

My argument: reasons for using public policy to curb Y IN
• (1) There are powerful built-in forces producing indefinitely rising income inequality & concentration
• (2) Higher levels of inequality (within OECD) associated with higher economic, social, health, & political costs

But first…
• Overview of inequality trends in OECD
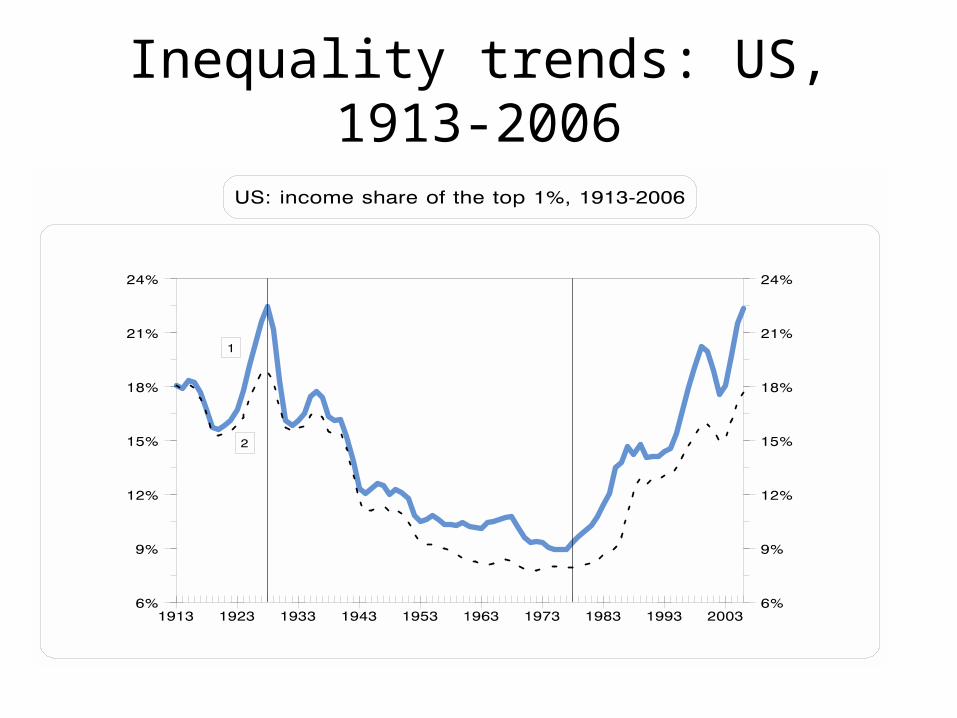
Inequality trends: US, 1913-2006
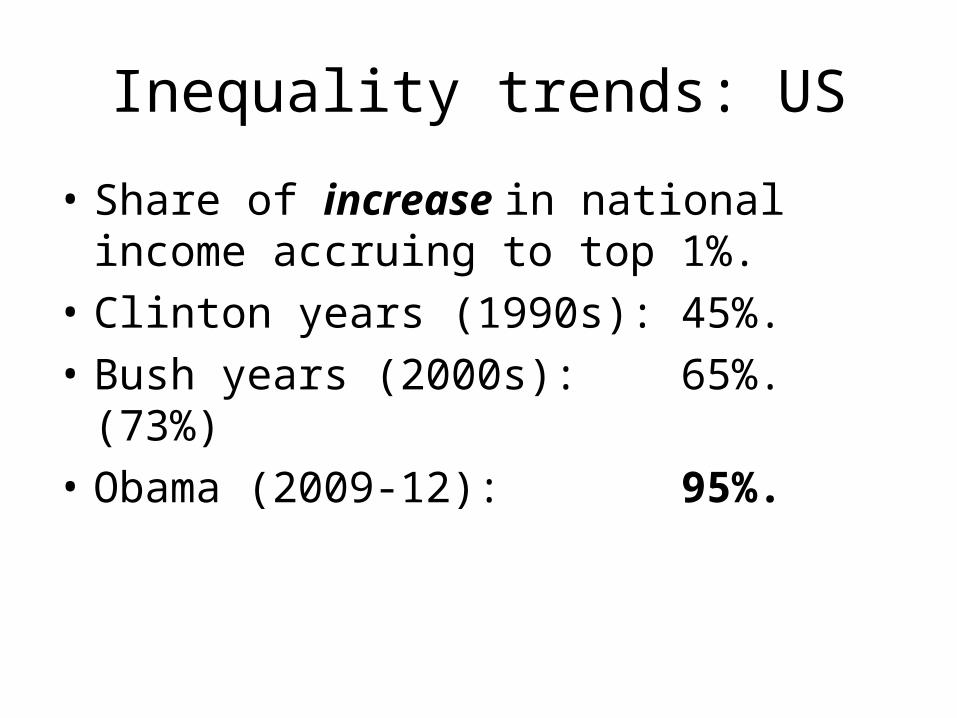
Inequality trends: US
• Share of increase in national income accruing to top 1%.
• Clinton years (1990s): 45%.
• Bush years (2000s): 65%. (73%)
• Obama (2009-12): 95%.
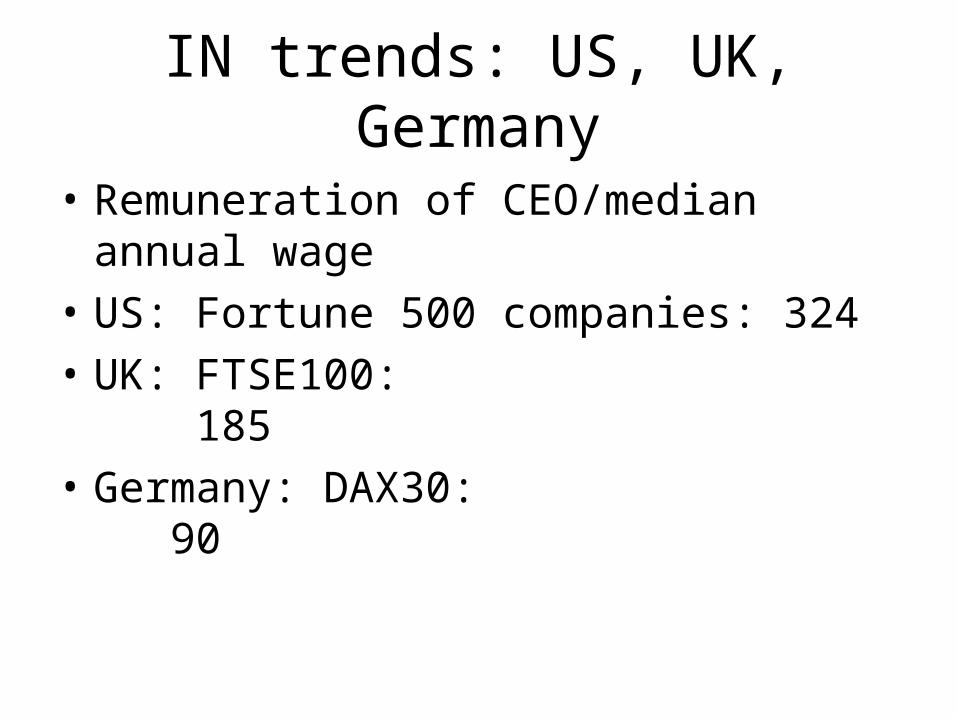
IN trends: US, UK, Germany
• Remuneration of CEO/median annual wage
• US: Fortune 500 companies: 324
• UK: FTSE100: 185
• Germany: DAX30: 90

IN trends: US & Iceland

Iceland: household income, 1993-2010 (top line = top 1%; bottom line = median, including realized K gains)

IN trends: NZ, 1984-2011

IN trends: Scandinavia, 1870-2010

Inequality has risen throughout OECD (Gini)
• B/w mid 1980s and 2010 Gini coefficient rose in all OECD countries (except Greece?).
• NB: We shd give primary attention to wealth inequality, not income inequality; but little data

Inequality in OECD by regions (Gini)
• 1. Latinos & Mid East
• 2. Anglos
• 3. European Mediterraneans
• 4. Northwestern Europeans
• 5. East-Central Europeans• Source: OECD Income Distribution and Poverty
http://stats.oecd.org/Index.aspx?DataSetCode=IDD (1 August 2013)
“Americanization” of world Y concentration
• World-wide the top 10%, and top 1%, have enjoyed much larger % increases in income than lower income categories, over 1988-2008
• 1988-2008 saw biggest 2-decade increase in global income (& wealth) concentration during past 200 years.

Conclusion: during neoliberal era since 1980s…
• Very rich have soared ahead, esp in Russia & Ukraine, Latin America, EAsia & Anglo c’ies, leaving behind not only manual workers (diminishing minority) but also middle class masses (doctors, teachers, lawyers, architects, civil servants, business executives below the top, most politicians).
Momentum towards higher Y concentration
• T. Piketty Capital in the Twenty-First Century, 2014
• Kuznets-curve argument -- Y IN will eventually stabilize & subside on its own, via free mkt -- is wrong.
• Causes making for more IN will dominate for a long time ahead from 2014.
• Western world moving towards “patrimonial Kism”, in which commanding heights of economy & polity in hands of those with inherited wealth.

Piketty’s mechanism
• (1) Private rate of return to owners of capital (machinery, land, housing, financial instruments, etc.) grows faster than output & wages.
• (2) Within wages, growing share goes to executives at top (super-stars & super-managers)
• (3) So income from capital & super-wages increasingly dominates total income distribution

Piketty’s mechanism (ctd)
• (4) Profits & super-wages are reinvested, & generate more profits.
• (5) Inherited wealth grows faster than the economy, generating higher Y concentration in next generation.
• (6) Diffusion of knowledge & skills does not offset
• “The past devours the future”, globally (Piketty, 571)
•(See Eduardo Porter, 2014, “Free market is no remedy for disparity”, INYT, 13 March)

World labor income as share of world gross output, 1980-2011 UNCTAD TDR 2013
chart 1.4

Terrifying consequences
• Costs of higher income inequality & concentration:
• (1) Economic growth
• (2) Financial fragility & crises
• (3) Social & health
• (4) Political

Costs of IN: economic growth
• IMF Discussion Note, Feb 2014• (1) “Lower net IN [after taxes & transfers] is
robustly correlated w faster & more durable growth, for a given level of redistribution”.
• (2) “Redistribution [via taxes & transfers] appears generally benign in terms of its impact on growth” (p.2)
• (3) “It wld be a mistake to focus on growth & let IN take care of itself….the resulting growth may be low & unsustainable” (p.25)
• IMF Staff Discussion Note: J. Ostry, A. Berg, C. Tsangarides, 2014, “Redistribution, inequality & growth”, Feb.

Costs of Y IN: financial fragility & crises
• See The Flaw (David Sington)

Costs of IN: social & health
• Wilkinson & Pickett, 2009, The Spirit Level: Why More Equal Societies Almost Always Do Better.
• Sold 250,000+ copies, translated into 27 languages
• See CHARTS

Wilkinson & Pickett, The Spirit Level
Index of: • Life expectancy• Math & Literacy
• Infant mortality• Homicides• Imprisonment• Teenage births • Trust• Obesity• Mental illness
– incl. drug & alcohol addiction
• Social mobility
www.equalitytrust.org.uk
Health and social problems are worse in more unequal countries
Ind
ex o
f h
ealt
h a
nd
so
cial
pro
ble
ms

www.equalitytrust.org.ukWilkinson & Pickett, The Spirit Level
Neither health nor social problems are related to national income per head
Index of: • Life expectancy• Math & Literacy
• Infant mortality• Homicides• Imprisonment• Teenage births • Trust• Obesity• Mental illness
– incl. drug & alcohol addiction
• Social mobility
Ind
ex o
f h
ealt
h a
nd
so
cial
pro
ble
ms

Italy
UK
FranceSwitzerland
AustriaFinland
GermanyBelgium
Norway
Czech RepublicSweden
Australia
Canada
Spain
US
Denmark
Netherlands
y = -0,2403x + 186,5
R2 = 0,3161
176
177
178
179
180
181
182
183
184
185
20 25 30 35 40 45
Gini index of inequality, various years
Av
erg
ag
e h
eig
ht
of
ad
ult
ma
ke
s (
ce
nti
me
ters
)

Inequality & social mobility
• Across countries there is inverse correlation b/w inequality & rate of intergenerational social mobility.
• Time series data less clear; but likely that in any one country IN tends to cumulate across generations (as Piketty argues)
• Explanation: The greater the gains from being in elite, the more the elite will fight to ensure their children stay there (“glass floor”).

Conclusion abt social & health costs of IN
• Wilkinson & Pickett:
• “If you want to live the American dream, go to Denmark.”
• http://www.ted.com/talks/richard_wilkinson

Political effects of income IN
• Little research on political effects
• Standard workhorse model in pol sci & economics is “median voter” model: governments are most responsive to preferences of median voter
• Hence, rising IN does not tend to skew public policy towards preferences of wealthy

But, Louis Brandeis (US Supreme Crt 1916-39)
• “We must make our choice. We may have democracy or we may have wealth concentrated in the hands of a few, but we can’t have both”.
• Who is right, mainstream political scientists or L. Brandeis?

Political costs: preferences of rich determine public policy
• M. Gilens, 2005, “Inequality and democratic responsiveness”, Public Opinion Quarterly, 69, 5, 778-96.
• B.Page, L. Bartels, J. Seawright, 2013, “Democracy & the policy preferences of wealthy Americans”, Perspectives on Politics, March, v.11, n.1

Page et al conclusions
• Top 1% of Americans are “extremely active politically and … much more conservative than the American public as a whole with respect to important policies concerning taxation, economic regulation and especially social welfare programs” (p.51)

Differences in preferences by income (Page et al)
• “The legal minimum wage should be high enough to prevent full-time workers from being in poverty”
• Agree: wealthy (with annual income of more than $1 million) = 40%; general public = 78%

Differences in preferences
• “The government in Washington ought to see to it that everyone who wants to work can find a job”
• Agree: wealthy = 19%; general public = 68%

Wealthy agree, general public disagrees…
• “Minimum wage must not be linked to cost of living”
• “Capital gains shd not be taxed, or taxed much less than income”
• “Top economic priority today (since 2008) to cut budget deficit, not reduce unempt”
• “Cut budget deficit by cutting social spending, not by raising taxes. If taxes to be raised, sales taxes, not income or capital gains tax”

Wealthy oppose, public favors…
• Health insurance for everyone
• More spending on public schools
• Regulation of banks which protects public against predatory lending

What shapes preferences of wealthy? “Money-empathy gap”
• Research by social psychologists on consequences of social class (of some having much more money than others)
• Conclusion: those living high on socio-econ ladder are less empathetic, more selfish, etc. than those lower down (Carnegie, Gates et al. exceptions)
• Paul Piff, Psychology, Berkeley

Money-empathy gap: US
• (1) Paul Ryan, chair of House Budget Cttee: “We don’t want to turn the safety net into a hammock that lulls able-bodied people to lives of dependency and complacency” (Krugman, 2013a, emphasis added).
Money-empathy gap: NZ
• NZ PM John Key: “Anyone on a benefit actually has a lifestyle choice. If one budgets properly, one can pay one's bills” (2011)

Whose preferences count? Gilens, 2005
• High “representational bias”: • “When Americans with different
income levels differ in their policy preferences, actual policy outcomes strongly reflect the preferences of the most affluent but bear virtually no relationship to the preferences of poor or middle-class Americans.”

US representational bias (ctd)
• “The vast discrepancy … in government responsiveness to citizens with different income levels stands in sharp contrast to the ideal of political equality that Americans hold dear….representational biases of this magnitude call into question the very democratic character of our society”. [1] Martin Gilens, 2005, “Inequality and democratic responsiveness”, Public
Opinion Quarterly, 69, 5, 778-96, at 794 and 778, emphasis added.
In USA: “economic policy is made by the top 1% for the top 1%”.
• Eg national minimum wage fell in real terms by 1/3 in 1975-2011.
• % of private sector wkers in unions: 23% -> 6.6%
• Late Oct 2013, 47 m Americans had food stamp benefits cut

Conclusions on representational bias
• (1) As inequality (concentration) increases, the rich make it harder for non-rich to have voice in how society is run.
• (2) Wealthy are “super-verting” the state, floating free from tax & usual obligations of citizenship, while profiting from privatization/ outsourcing of public services.
• They remain loyal to national pageantry – flag, military parades

UK & Europe?
• RHW to Simon Hix, head of Govt Dept, LSE:
• “What is evidence on ‘representational bias’ in UK and Europe?”
• SH: “That’s a good question….Sounds like something I should work on. Thanks for the idea!”

A French plutocrat celebrates loss of democracy
• Bernard Arnault, French, 10th richest person on earth: “Businesses, esp international ones, have ever greater resources, & in Europe they have acquired the ability to compete with states … Politicians’ real impact on the economic life of a country is more & more limited. Fortunately.” (2000, emphasis added,
quoted in Serge Halimi, 2013, “Tyranny of the one per cent”, Le Monde Diplomatique (English), May 1).
• Implies that private sector firms can best regulate themselves.

Why are middle classes politically apathetic ?
• Why aren’t middle classes more angry against the super-rich? Why can’t Left parties harness middle class anger at being left behind?
• Gary Runciman: “most people’s lives are governed more by resentment of narrow inequalities…& the preservation of small differentials” than by the larger picture of social injustice.
• Middle classes fearful of loss of middle class status; more anxious looking down than looking up.
• Lukewarm about “redistribution” = those below them will be pulled up, threatening their status.

Social democratic (SD) agenda
• In previous “Hard Times” Left gained electorally
• Not this time. Center-right continues to win • Mainstream Left has lost its political
narrative. Voters angry at unemployment & spending cuts go to Hard Left or Far Right
How to curb “plutocratic democracy” & “patrimonial Kism”
• (1) Public financing of electoral efforts
• (2) Capital tax
• (3) Unconditional basic income (UBI)
• (4) From “redistribution” to “predistribution”

(1) Curbing plutocratic democracy: public electoral financing
• Key: more public financing, less private financing of electoral campaigns
• Evidence: among 15 developed countries grouped into 5 categories by level of public support, those with less public support have lower turnout rates & lower public spending on “personal security”/ GDP (education, health, pensions). (Jay Mandle, 2004, “The politics of democracy”, Challenge Jan-Feb, 53-63)
• Group 1:US: no public support; lowest turnout (federal); lowest “personal security”/GDP.
• Group 5: Austria, France, Germany, Italy: highest public support (parties, campaigns, media); 2nd highest turnout; highest personal security

(1) Political finance reform (ctd)
• But, cautionary tale: fate of UK Commission on Standards in Public Life, 2011, “Political party finance: ending the big donor culture”.
• It was launched with fanfare at Westminster. It died at the end of the launch.

(2) Capital taxation
• Low hanging fruit: tax unearned income (eg dividends) and wealth (eg inherited estates) at same tax rate as ordinary income, not much lower (as in US under Bush).
• Better: progressive annual tax on individuals’ wealth (net value of assets owned)
• All assets included: real estate, financial, business, at market value
• Objective: (1) to stop unlimited growth of global wealth IN, (2) help regulation of financial system, (3) raise revenue, allowing Y tax rates to be lowered

(2) K taxation (ctd)
• How to do it:
• (1) Everyone must report capital ownership as condition of property right.
• (2) Financial authorities must share information
• National tax authorities shd receive all info to calculate net wealth of every citizen

(3) Unconditional basic Y (UBI)
• UBI high enough for every adult to receive enough to eat, clothe and house themselves, unconditionally
• Why? People shd be “free” to chose paid or unpaid work, rather than constrained to seek only paid work out of fear for their survival

(4) Predistribution
• Focusing on taxes & transfers to make “market” income distribution more equal is like mopping the floor while the tap still running.
• Need to focus more on making market Y distn more equal. Why?
• (1) Mkt Y distribution is main determinant of net Y distribution
• (2) “Tax the wealthy” always leaves SDs vulnerable to conservatives’ “you want to punish the wealth-creators & reward the losers”
Predistribution
• Wide range of institutions & policies sold on grounds of “efficiency” tend to channel income upwards:
• Eg corporate governance law• Trade union law• “Light touch” financial regulation• Intellectual property rights law• Central bank priority to “anti-inflation credibility”
has high cost in long-term unemployment

“Inequality assessments”
• Before early 1980s few World Bank projects had any environmental impact assessment. After early 1980s all projects with any kind of environmental impact had to be subject to professional assessment.
• Social democrats should institute regular procedures for assessing distributional consequences of all govt policies

Organizing political support?
• I have emphasised changing the ideas with which SDs appeal to electorate
• If elite is monolithic with unified vision, little prospect
• But elite not monolithic; SDs have to appeal to segments of wealthy
• This top-down strategy has to be complemented with bottom-up strategy (“real world utopias”, Erik Ohlin Wright)

References• R. Wade, 2012, “Why has income inequality remained on the sidelines of public policy for so long?”, Challenge, 55, 3, May-
June, 21-50.• R. Lucas, 2004, “The industrial revolution: past and future”, Annual Report Essay 2003, Federal Reserve Bank of
Minneapolis, May 1. • W. Buiter, 2007, “Economists’ forum”, Financial Times, Feb 14. • Agence France-Presse, 2013, “IMF strongly suggests countries tax the rich to fix deficits”, October 11.• Martin Gilens, 2005, “Inequality and democratic responsiveness”, Public Opinion Quarterly, 69, 5, 778-96, at 794 and 778,
emphasis added. • Paul Krugman, 2013a, “War on the unemployed”, New York Times, June 30. • National Business Review, 2011, “Key stands by ‘some poor make poor choices’ foodbank comment”, Feb 21.• Paul Krugman, 2013b, “Persecuted plutocrats”, IHT, 28-29 Sep, p.7 • B. Page, L. Bartels, J. Seawright, 2013, “Democracy and the policy preferences of wealthy Americans”, Perspectives on
Politics 11, 1. • Dean Baker, 2006, The Conservative Nanny State, Washington DC, Center for Economic Policy Research. • Dean Baker, 2011, The End of Loser Liberalism, Washington DC: Center for Economic Policy Research• Josh Bivens, 2012, review of Baker 2011, Challenge, May-June, 129-136 • Nicky Hager, 2006, The Hollow Men: A Study in the Politics of Deception, Craig Potton, Nelson, New Zealand • George Monbiot, 2013, “Superversion not subversion is the real threat to the state”, Guardian, 15 October.
Key source:
• Dean Baker, 2006, The Conservative Nanny State
• Dean Baker, 2011, The End of Loser Liberalism
• Baker shows that many institutions & policies sold as “good for efficiency” in fact are good mainly for chaneling income & influence up to the top

Global govc needs overhaul
• Oxford Martin Commission for Future Generations, chaired by Pascal Lamy
• Some of you could form your own Commission for Future Global Governance, write a critique/ comment on the above.
• Eg how to reform G20, IMF, World Bank

My argument
• (1) Income/wealth inequality rising in most countries over past 30 years. In OECD, Anglo c’ies have highest income concentration. Most people’s income stagnant or falling in past 15 yrs. Shall not discuss reasons.
• (2) “Inequality machine” driving democratic governments in many western countries, especially Anglo, to allow their democracy to slip towards “plutocracy”.

My argt (ctd)
• (3) Why? They have become so dependent on small, affluent minority for finance.
• (4) If governments or politicians do not follow preferences of this wealthy minority – when those preferences differ from preferences of middle- & low-income groups -- they are likely to be rendered ineffective, or toppled.

My argt (ctd)
• (5) So governments enact laws and policies in line with preferences of wealthy; which boost the fortunes of the wealthy.
• Result: (1) virtuous circle b/w wealth & influence from the point of view of wealthy. (2) Vicious circle from the point of view of everyone else, whose incomes are squeezed as income concentration at top rises.
• (6) Implications for “social democratic” agenda?

UK: Thatcher’s “monetarism”
• Alan Budd, 1991: Mrs Thatcher’s government “never believed for a moment that this [high interest rate policy & contraction of public spending] was the correct way to bring down inflation. They did, however, see that it would be a very, very good way to raise unemployment, and raising unemployment was an extremely desirable way of reducing the strength of the working classes…. What was engineered …was a crisis of capitalism which has allowed the capitalists to make high profits ever since”.

Money-empathy gap: US
• (2) AIG = US insurance giant that played crucial role in creating global econ crisis; US govt bailed it out.
• Became ward of federal govt, but continued paying giant bonuses.
• Robert Benmosche, CEO, AIG, compared public anger at bonuses to lynchings in Deep South; bonus backlash is “just as bad & just as wrong”
• (3) Stephen Schwarzman, CEO, Blackstone Grp, criticised proposal to close loophole (which allows executives to pay only 15% taxes on much of income): “It’s a war; it’s like when Hitler invaded Poland in 1939”. (Krugman, 2013b)

Markets & democracy
• Most westerners agree, “democracy” & “markets” essential to just & prosperous world.
• But, what if “markets” are driving political systems away from (substantive) democracy?
• “Market forces” income/wealth concentration public policy reflects preferences of wealthy erosion of democracy
• What if Brandeis is right?

Examples of govt intervention on behalf of rich:
• (1) Wall St bailouts in 2008
• UST & Fed gave trillions of $ in subsidized loans to Wall St banks in 2008. Yet this government intervention on behalf of executives, shareholders, bondholders – who include richest people – not seen as “intervention in market”.
• Virtually no banker has been subject to criminal prosecution.
Examples of govt intervention on behalf of rich:
• (2) banks too big to fail• Conservatives claim to believe in “free market”.
But few argue against allowing banks to become “too big to fail”.
• Banks too big to fail obtain finance at below market rates, because creditors believe they are protected by govt gttee.
• This enriches executives, shareholders, bondholders.
• It is NOT free market economics. But conservatives present it as free mkt economics, which sounds better than plutocratic economics .

Govt intervention on behalf of employers
• (3) labor law
• Eg secondary boycotts: If workers in a restaurant go on strike, & if union of food delivery drivers refuses to deliver food, union faces fines & officials face prison.
• This is NOT a free market. This is govt intervention on behalf of employers.
Govt intervention on behalf of employers:
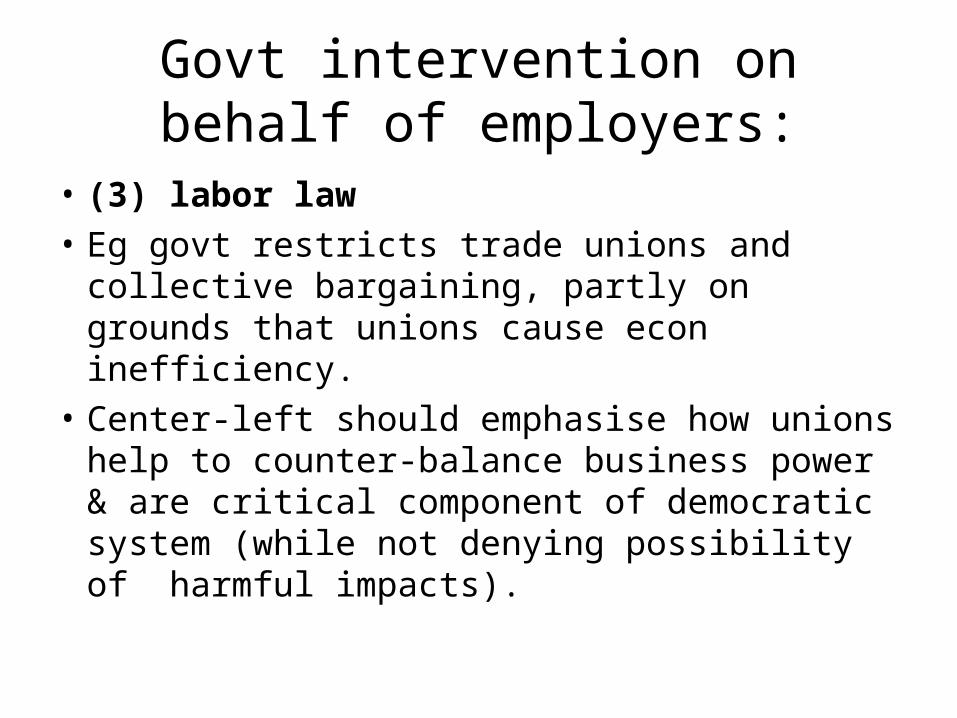
• (3) labor law
• Eg govt restricts trade unions and collective bargaining, partly on grounds that unions cause econ inefficiency.
• Center-left should emphasise how unions help to counter-balance business power & are critical component of democratic system (while not denying possibility of harmful impacts).

Govt intervention for the rich
• (4) Stock market & housing market
• SDs should not applaud soaring stock market and soaring house prices as indicators of “success”.
• SDs should emphasise (a) bubbles are followed by “trubbles”; (b) bubbles increase concentration of income at top

Conclusion
• Capitalist market is driving up Y inequality, esp Y concentration in many c’ies, esp Anglos.
• Y inequality at Anglo levels has significant costs, including political costs to democracy.
• Major determinant of after-tax distribution is pre-tax distribution. So don’t rely on larger tax-transfer system to curb rising inequality
• Knowing how income is distributed before taxes is first step in formulating policies/laws for reducing Y inequality, especially Y concentration

Costs of inequality long ignored
• Why?
• “When inequality is the common law of a society, the greatest inequalities do not call attention to themselves.”
• Democracy in America, A. de Tocqueville.

Empirical propositions: US
• (1) Rising IN associated with rising pol polarization & paralysis
• (2) Substantial differences of policy preferences b/w wealthy and middle- & low-income respondents
• (3) Policy preferences of wealthy shaped by “money-empathy gap”
• (4) Public policy reflects preferences of wealthy

World Bank has long ignored income inquality
• Eg World Development Reports
• Eg World Devt Report 2006: Equity & Development
• Executive Board said: “Inequality is political concept. We are a-political organization. We can talk abt reducing poverty & about expanding opportunities, which are both a-political; not about reducing inequalities.”

G20 ignores inequality
• St Petersburg Summit, Sept 2013, communique, 12,000 words: no mention of “income inequality”, one mention of “income distribution” (para 30)
• 3 mentions of “inclusive growth” or “inclusive labor markets”
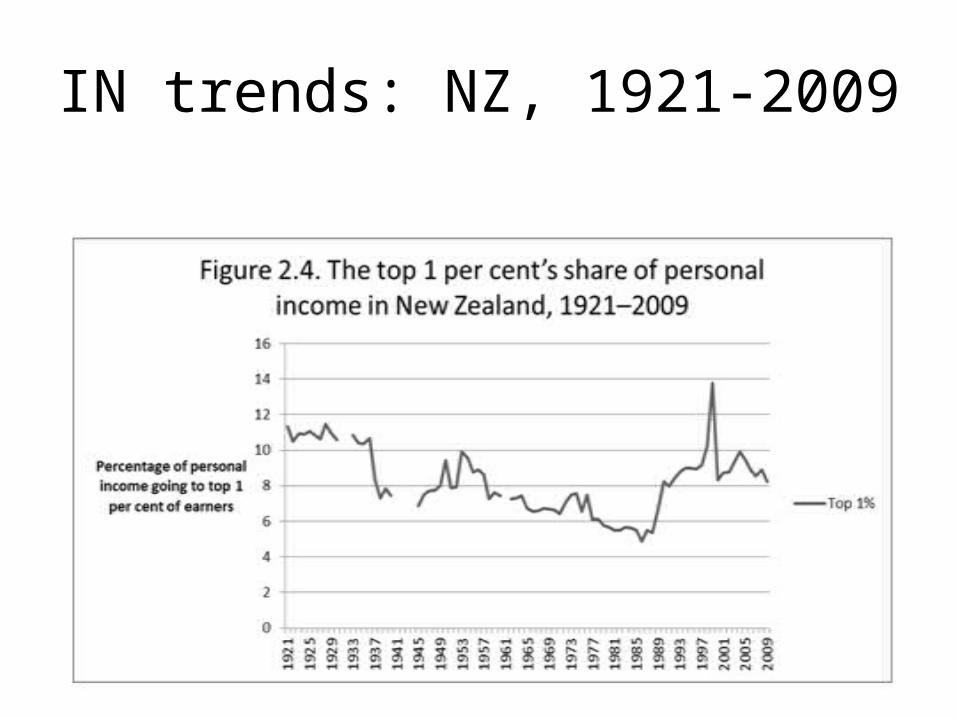
IN trends: NZ, 1921-2009
Explanation of recent concern about Y concentration
• Only recently has data become available about Y at the top (Piketty & Saez).
• Clear that “skill-biased technological change” cannot explain huge concentration of Y in top 1%.
• Clear that Kuznets curve is not empirically valid to describe trajectory of countries’ Gini coefft as GDPPC rises
• Occupy Movement?
Political costs: (1) political paralysis
• Political polarization/paralysis correlates with income concentration
• US evidence: McCarty, Poole, Rosenthal, Polarized America, 2006.

US IN – pol polarization/paralysis: closely correlated

US income distribution & political polarization, 1913-98.
• Political polarization was measured ingeniously as follows. An annual sample of votes in House of Representatives. If 100% of republicans voted yes and 100% of democrats voted no, that vote scored 1. A fifty/fifty division in both parties would score 0. Scores averaged for the year.
• Source: Nolan McCarty, Keith Poole, Howard Rosenthal, Polarized America: The Dance of Ideology and Unequal Riches, MIT Press, 2006.
But, some recent concern
• Eg WB has recently issued reports on income distribution, national & international
• IMF sent shock waves at Annual Meetings (11-13 Oct 2013). “Fiscal Monitor: Taxing Times”, noted steep cuts in top tax rates since early 80s, said “Scope seems to exist in many advanced ecies to raise more revenue from the top of the income distn”. Added that this wld also help to fight growing income inequality.

What is causing the recent concern?
• New data on Y concentration (Piketty & Saez)
• Evidence that Kuznets inverted U is not valid
• Arguments that causes of IN may continue to drive IN ever higher (Piketty)
• Evidence on economic, social, health and political costs of high IN (= Anglo & above)
Differences in preferences
• “The federal government should provide jobs for everyone able and willing to work who cannot find a job in private employment”
• 8% of wealthy agree
• 53% of general public agree
UK & Europe (ctd)
• We wld expect that representational bias in favor of rich is higher in majoritarian voting systems (especially US) & lower in proportional representational systems (where votes of low-income groups can be more influential).
• But some evidence suggests that wealthy’s preferences becoming more influential in NWEurope (excluding Scandinavia)

OECD: affluence-influence
• Across 18 OECD countries since 1960, c’ies with largest increases in shares of income in top 1% have seen largest cuts in top rate taxes
• Increases in top income share do not translate into increases in long-term econ growth
• T. Piketty, E. Saez, S. Stantcheva, 2011, “Optimal taxation of top labor incomes: a tale of three elasticities”, NBER working paper 17616

(1) SDs shd avoid characterization as “pro-state”
• Reject conservatives’ framing: “we are anti-government/ pro-free market; you want ever-larger government to protect interests of disadvantaged
• = we are pro-freedom, you are anti-freedom
• Emphasise that conservatives don’t push for free markets when free mkt policies would harm interests of wealthy.
(2) SDs shd focus on Y concentration -- causes & costs
• Don’t just focus on “inequality” (Gini). Focus on trends in share of top 1%
• Emphasise that, whatever the technological causes of IN within bottom 99%, income concentration in top 1% is caused by politics & policies
• Highlight how wide array of institutions, rules, policies favor the already affluent.

Causes of income concentration
• QE, house booms, stock mkt booms, distribute income & wealth upwards, b/c inequality of asset ownership
• Today, central bks convinced that super-easy money the least bad way to stimulate western economies.
• Y concentration effects ignored: cheap money is pushing stock mkts & house mkts to new records.(Mike Nolan, 2013, “Banks risk getting stuck in ‘Q.E. trap’, INYT 28 Nov.).
More causes: rigged markets
• Fed’s priority to “anti-inflation credibility” has high cost in long-term unemployment
• Strong intellectual property laws give govt-gtteed profits to pharma, software, etc.
• Strong dollar benefits finance, hurts mfg • Weak financial regulation benefits finance• Corporate governance law benefits CEOs• Trade union law benefits employers

Costs of inequality
• Emphasise costs of Y concentration (while acknowledging benefits). Economic, social, health, political.
• Use these costs to criticize conservatives for pursuing an agenda of advancing the interests of the wealthy. This should be politically advantageous, given that large majority have been on stagnant or falling incomes as income IN soared.
Costs of concentration (ctd)
• Don’t just talk about “improving equality of opportunities”
• Emphasise how IN today limits inter-generational social mobility tomorrow

(3) Predistribution
• Shift attention from changes in tax/spend (redistribution) to changes in market income distribution (predistribution)
Why shift attention to predistribution?
• (1) Mkt income distribn is main determinant of disposable income distribn.
• (2) Using taxes to take away income already earned, then redistributing to others, always difficult politically. Conservatives say: “They [SDs] want to penalize winners & reward losers. We champion hard work & innovation.”

(4) Present big finance as a problem, not solution
• Economic textbooks say finance “lubricates” the economy
• Not true: finance sector lends mainly to property & financial asset mkts, less for production of goods & services
• Eg UK, US, Canada, Australia, Holland, Sweden
• Big finance dominates politics

Epigraph (2): Machiavelli, 1520
• When “only the powerful propose laws, not for the common liberty but to augment their own power”, the state is corrupted and its foundations are undermined.

Epigraph (3): President Truman
• “I could never lend myself to any transaction, however respectable, that would commercialize on the prestige and dignity of the office of the presidency”. (See
George Packer, The New Yorker.)

Epigraph (4): President Clinton I
• Mr Clinton earned $17 mn in 2012 making speeches. Common price, $500,000 per speech. One to a Lagos company for $700,000.
• Maureen Dowd, “Money, money, money”, IHT 19 Aug 2013, p.7).

Argument
• Y IN (within-country) likely to keep rising for decades into future. Eg USA: top 1% currently accrues abt 22% disposable Y. Strong momentum towards 30+%.
• Higher levels of IN associated with higher economic, social, health & political costs.
• Strong state & international action could reduce inequality. But such action blocked by “representational bias” in (plutocratic) democracies in favor of rich.
• Widespread grassroots activism to democratise political systems is a necessary condition for reining in IN. What shd be policy goals of activism?

R Rubin on “too big to fail”
• Rubin, quoted in D Rothkopf, 2012, Power, Inc.• DR asked RR whether “too big to fail” a problem• RR: “No, don’t you see? Too big to fail isn’t a
problem with the system. It is the system. You can’t be a competitive financial institution serving global corporations of scale without having a certain scale yourself. The bigger multinationals get, the bigger financial institutions will have to get”.
• Implication: big banks must be propped up