Embed Size (px)
Citation preview

The Cost of the Diabetic Foot
Jonathan Labovitz, DPM
Associate Professor
Western University of Health Sciences
Pomona, CA, USA
Medical DirectorFoot & Ankle Center
Western University of Health Sciences
Pomona, CA, USA

Disclosures
Speaker’s Bureau:
• None
Honorarium:
• None
Consultant:
• Volcano Corporation
Stockholder:
• None
Grant/Research Support:
• None
Medical/Scientific Boards:
• None

The Diabetes Burden
Diabetic spends 2.3x more than non-diabetic
• $1 of every $5 spent on diabetic patient
• $1 of every $10 spent on diabetes
Diabetes costs 2007 – 2012
Ettaro L, et al. Pharmacoeconomics 2004; ADA Diabetes Care 2008
PrevalenceDirect costs
2007 2012 % Change
26% $116 B $176 B 51.7%
Overall Cost Cost of Complications
40% Cardiovascular/PAD 28 - 31%
Neurological 30%

The Diabetes Burden: DFU Costs
29.1 MM
• DM prevalence• CDC 2014 (all ages, 2012)
4%
• DFU prevalence • 1 - 7% annually
$5,391
• Cost per Episode• Fife C. Wounds 2012
$6.3 B
• Annual cost of DFU• 1 - 7% = $1.6 B - $10.9 B
CDC. National Diabetes Statistics Report, 2014
What happens when diabetes
prevalence is 1 in 3 Americans in 2050?

Cost of the Diabetic Foot
What makes up the cost?
• Inpatient vs. Outpatient
• Complications
• Technology

Inpatient vs. Outpatient
DM with complications
• 1.4% of national costs ($5.38B)
• Medicare = approx. 1/2 of costs
Healthcare spending: Acute care
All-cause = nearly 33% Diabetes mellitus = 50%
ED visits (2010)
Source: HCUP Statistical Briefs #160, 2013; HCUP Statistical Briefs #167, 2013
Neurological Peripheral Circulatory
% DM ED visits 36% (675,000) 0.8% (94,000)
% DM Admit from ED 41% 1.5%

RX Volume & $/unit
INPATIENT $/unit
OUTPATIENT Volume
ER/OTHER $/unit
Inpatient vs. Outpatient
0
20
40
60
Excess $ Inpt. Outpt. Rx
$/p
er
pat
ien
t (i
n $
10
0)
1987
2000-01
2010-11
Change in U.S. Spending in Diabetes Mellitus
55%
24%
15%
6%
% of growth
Zhuo X, et al. Diabetes Care 2015

Inpatient vs. Outpatient
Hospitalization main cost driver in diabetic foot?
• 9-20% of DFU require hospitalization
• Accounts for 74-84% of total costs
Hunt NA. Plastic Reconstr Surg 2011; Hicks CW. J Vasc Surg 2014
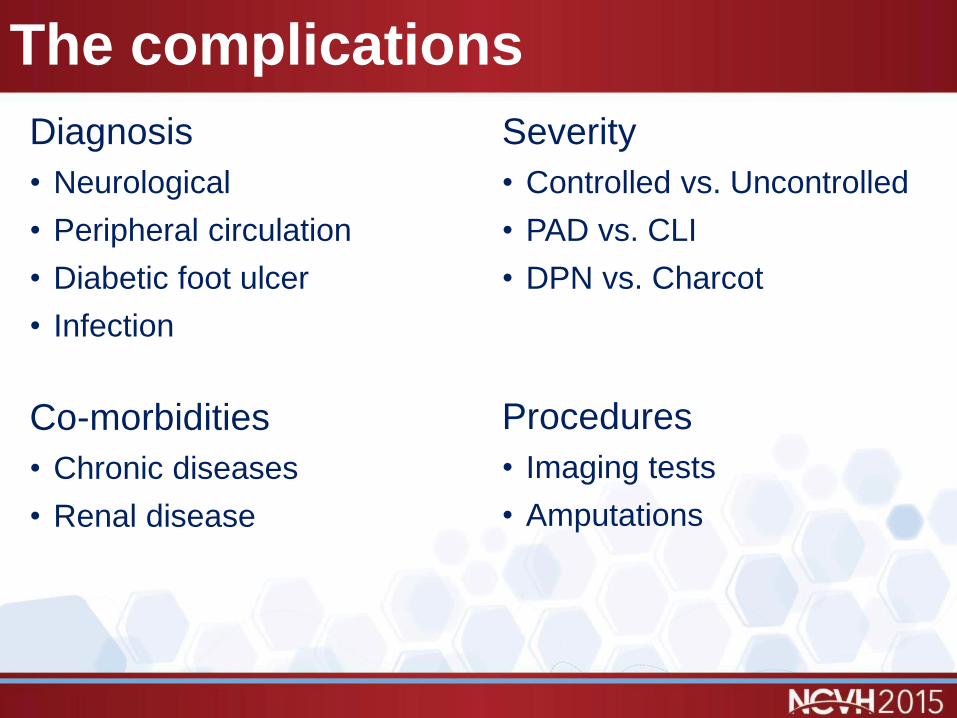
The complications
Diagnosis
• Neurological
• Peripheral circulation
• Diabetic foot ulcer
• Infection
Co-morbidities
• Chronic diseases
• Renal disease
Severity
• Controlled vs. Uncontrolled
• PAD vs. CLI
• DPN vs. Charcot
Procedures
• Imaging tests
• Amputations
LOS 84.0%
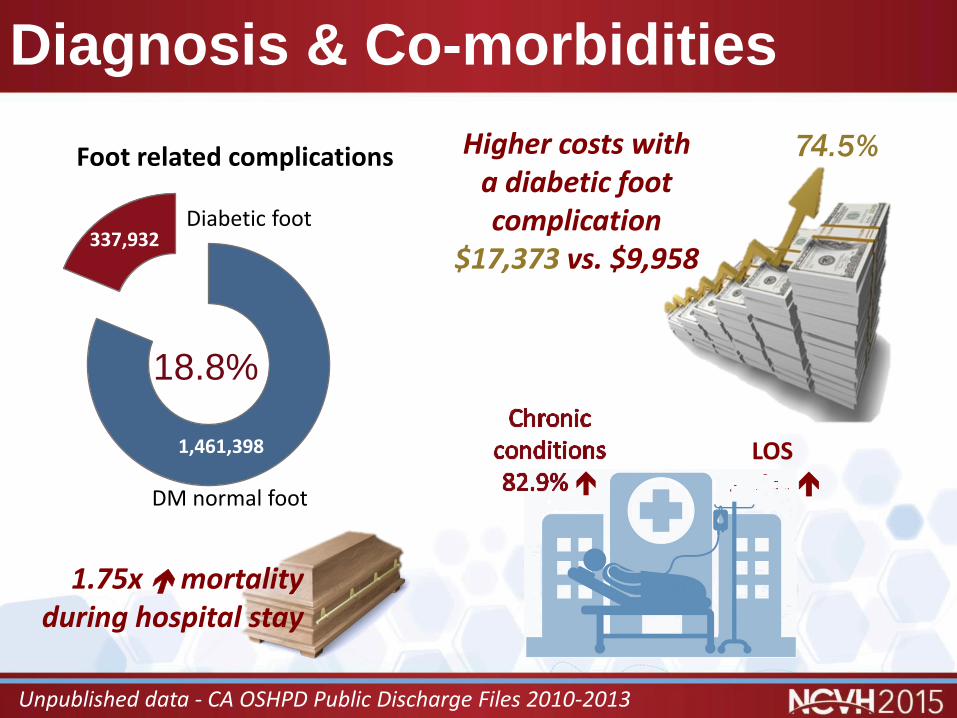
Diagnosis & Co-morbidities
1,461,398
337,932
Foot related complications
18.8%
Unpublished data - CA OSHPD Public Discharge Files 2010-2013
1.75x mortality during hospital stay
Higher costs with a diabetic foot complication
$17,373 vs. $9,958
74.5%
DM normal foot
Diabetic foot

Diagnosis & Co-morbidities
N Cost LOS Chronic conditions Mortality
No complication 1,461,398 $ 9,958 3.5 5.3 0.67%
Complication 337,932 $ 17,373 6.4 9.7 1.17%
% Difference 74.5% 84.0% 83.0% 74.6%
Unpublished data - CA OSHPD Public Discharge Files 2010-2013
DM no complication
DM + complication DM + DPN DM + PAD DM + DFU
DM + Infection
(-) HD $ 9,958 $ 17,373 $ 13,673 $ 20,579 $ 18,977 $ 16,783
(+) HD $ 12,779 $ 26,222 $ 16,473 $ 27,610 $ 26,987 $ 28,381
% Difference
28.3% 50.9% 20.5% 34.2% 42.2% 69.1%
The Hemodialysis Effect
The Diabetic Foot
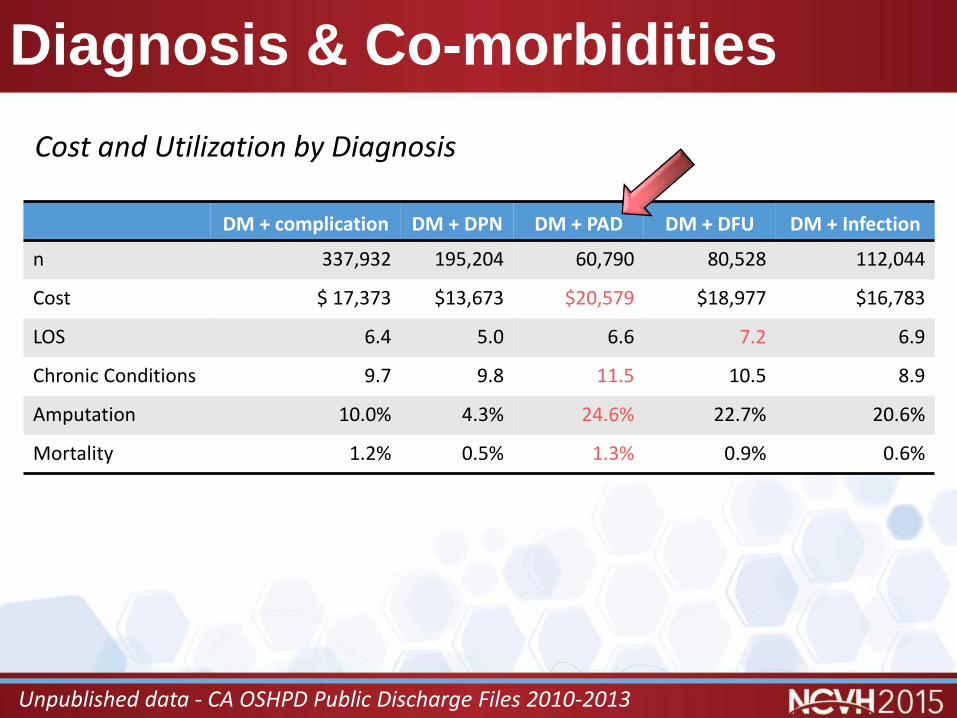
Diagnosis & Co-morbidities
Unpublished data - CA OSHPD Public Discharge Files 2010-2013
DM + complication DM + DPN DM + PAD DM + DFU DM + Infection
n 337,932 195,204 60,790 80,528 112,044
Cost $ 17,373 $13,673 $20,579 $18,977 $16,783
LOS 6.4 5.0 6.6 7.2 6.9
Chronic Conditions 9.7 9.8 11.5 10.5 8.9
Amputation 10.0% 4.3% 24.6% 22.7% 20.6%
Mortality 1.2% 0.5% 1.3% 0.9% 0.6%
Cost and Utilization by Diagnosis

Diagnosis & Co-morbidities
Diabetic Foot Ulcers
Most expensive chronic wound ($5,391 per patient)
• 2x cost of other chronic ulcers
• Cost drivers: Rx (systemic Abx, pain meds)
Comorbidities (renal failure, ≥ 2 comorbidities)
Current tobacco
Inpatient costs ($13,258)
• Increasing mean cost/patient YoY 2005-2010
• Factors: Increased co-morbidities, revascularization, minor LEA
• Likely sicker patient population with greater attempt at limb salvage
Fife C., Wounds 2012; Hicks CW. J Vasc Surg 2014

Diagnosis
by Diagnosis
Source: HCUP Statistical Briefs #154, Readmissions to U.S. Hospitals by Procedure, 2010
Gangrene
1.88.5
97.8
20.3
0
20
40
60
80
100
Readmit/1,000 % readmit
w/out complications
with complications
DM readmissions 2010
31.6
21.3
20.3
17.2
11.2
8.5
0 5 10 15 20 25 30 35
Gangrene
Chronic ulcer skin
DM with complications
Peripheral artherosclerosis
Skin/SubQ infections
DM w/out complications
Percentage readmitted
2nd highest readmission rate
7.2
22.619.9 20.6
23.6 23.5
13.6 14.1
0
5
10
15
20
25
DM with complications % Readmitted

Procedures: Amputations
25% of amputations needed multiple OR visits
• LOS 47.2%
• Hospital charges 60.2%
Amputation N Cost LOS
Amputation 31,919 $28,193 9.3
No Amputation 1,735,492 $12,211 4.4
Minor 23, 769 $26,214 8.6
Major 13,726 $34,671 11.4
Unpublished data - CA OSHPD Public D/C Files 2010-2013; Ashry et al. 1998

Procedures: Revascularization
Revascularization Amputation
PAD, No revascularization
Endovascular Surgical Minor Major
COST $ 15,540 $ 37,589 $ 39,552 $ 26,214 $ 34,671
Revascularization
Revascularization (endovascular or bypass) ± limb salvage is cost-effective compared to amputation• Improved years of function• Improved years of limb salvage• Improved QALY
Barshes 2012; Barshes 2014

Procedures
by Procedure
Source: HCUP Statistical Briefs #154, Readmissions to U.S. Hospitals by Procedure, 2010
Highest readmission rate
(30 most common procedures)
Lower extremity
amputation
0
5
10
15
20
25
30
1-17 18-44 45-64 65+ Medicare Medicaid Private Uninsured
% R
ead
mit
ted
LEA
Debridement
11th highest readmission
rate by
procedure
19.1%
28,394 readmissions
22.8
20.7
19.1
16 18 20 22 24
Amputation of lowerextremity
LE vascular bypass
Debridement wound,infection, or burn
% Readmitted

Severity
Diabetic Foot Ulcers
Statistically significant
N = 2,253
22% progressed to higher grade ulcer
24% ulcer-related hospitalization = 77% of charges
30% amputation rate
Grade CostVascular
(Adequate vs. Inadequate)Age
(<65 v 65+)Progress higher severity
(No progress vs. Yes progress)
I $ 1,892 $ 1,716 $ 2,433 $ 2,772 $ 1,597 $ 1,892 $ 14,009
II $ 4,345 $ 3,269 $ 6,762 $ 5,776 $ 3,756 $ 3,848 $ 30,381
III $ 12,255 $ 11,258 $ 14,003 $ 14,518 $ 10,861 $ 9,083 $ 30,528
IV/V $ 27,721 $ 11,686 $ 34,845 $ 33,502 $ 25,518
Average $ 13,065 $ 5,218 $ 23,372 $ 16,390 $ 11,925 $ 3,063 $ 20,136
Stockl K, et al. Diabetes Care 2004

Severity: DPN vs. Charcot Foot
Amputations
Cost and Adjusting for Chronic Disease
Other significant cost drivers in Charcot: DFU, Infection, Osteomyelitis
Minor Major
Complication n Cost n Cost
DPN 6,869 $ 22,932 1,566 $ 31,110
Charcot Foot 423 $ 28,820 529 $ 32,084
DPN Charcot Foot Difference
# chronic conditions 10.37 11.08 0.71 (6.8%)
Cost of chronic disease $ 18,118 $21,242 $ 3,124 (17.2%)
Adjusted cost $ 18,717 $ 21,242 $ 2,525 (13.9%)
Each additional chronic disease contributes $842.46 in total costs in DPN patients (R2=0.798)
Poster Presentation: Diabetic Limb Salvage Meeting, Washington, DC 2014
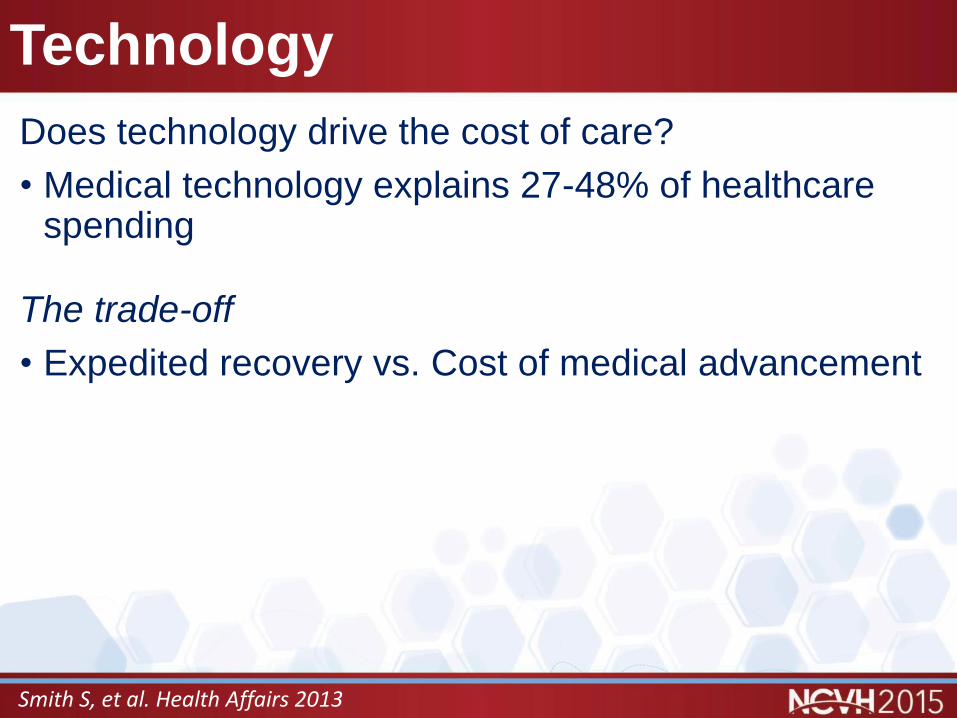
Technology
Does technology drive the cost of care?
• Medical technology explains 27-48% of healthcare spending
The trade-off
• Expedited recovery vs. Cost of medical advancement
Smith S, et al. Health Affairs 2013

Technology: Skin graft substitutes
Modeling Cost Effectiveness
Study Graft Economics

Technology: Skin graft substitutes
Graft Size
5,546
159 Apligraf (cm2)
purchased
applied
154
68.2
Epifix (cm2)
purchased
applied
6.2
2.15
Apligraf®
EpiFix®
Grafts/person
$9,216
$1,669
Apligraf®
EpiFix®
Cost/person
Cost Minimization (not CEA)Resource utilization
97.1%
55.8%
Zelen CM, Gould L, Serena, TE, et al. Int Wound 2014.

Technology: Negative Pressure
Apelqvist J, et al., 2008, Braackenburg A, et al., 2006; Moues CM, et al., 2005
Significant decrease in resource utilization caused decrease cost despite expense of equipment - Apelqvist, AM J Surg, 2008
9.9
120
11
118
36.1 38.8
10.6
43
4
41
27.3 26
0
20
40
60
80
100
120
140
Inpt LOS Procedures Outpt visits Dressing Δ Cost/pt ≥8 wks tx
Avg. cost toheal
MWT
NPWT
(Cost in $1,000s)
Other studies Revenue neutral (NPWT = higher material cost, lower nursing time)

Dollars and Sense: Personal cost
Depression prevalence 10.7% - 16.7% in outpatient DFU (Vileikyte 2009; Vedhara K, 2010)
5.6% increased cost
LOS
31.2%
longer
Unpublished data - CA OSHPD Public Discharge Files 2010-2013
Inpatient foot complications ± depression
11.1%
6.4%
0.0% 10.0% 20.0%
Footcomplication
No footcomplication
Depression prevalence in diabetic inpatient care in CA, 2010-2013

Dollars and Sense: Personal cost
Opportunity Costs
Financial hardship a major issue
• DFU 50-79% unemployed or unable to work
HRQOL
Diabetes lower than general population
• Higher than most other chronic illness
• Presence of complications is most important variable• Foot ulcers/Foot infections lower all physical and psychosocial domains
• Active ulcer lower QoL than healed ulcer or minor amputation
Van Acker K, et al., 2014; Hogg FRA, et al., 2012; Goodridge D, et al. 2005

• Increasing prevalence expect higher
total costs
• Inpatient, severity of health, Rx, and
amputations drive costs
• High personal & societal cost

The Cost of the Diabetic Foot
Jonathan Labovitz, DPM
Associate Professor
Western University of Health Sciences
Pomona, CA, USA
Medical DirectorFoot & Ankle Center
Western University of Health Sciences
Pomona, CA, USA