Embed Size (px)
Citation preview

MARCH 2015WWW.JRF.ORG.UK
REPORT
THE COST OF THE CUTS: THE IMPACT ON LOCAL GOVERNMENT AND POORER COMMUNITIESAnnette Hastings, Nick Bailey, Glen Bramley, Maria Gannon and David Watkins Universities of Glasgow & Heriot-Watt
As we stand at the half-way point of the government’s austerity programme, this timely report examines its impact on local government, with evidence from national data and local case studies.
• The most deprived areas have borne the brunt of the cuts. On one key measure, the most deprived English authorities have had a level of cut nearly six times higher than the cut experienced in the least deprived areas.
• Councils have employed imaginative strategies to balance budgets, minimising impacts on front-line services to date. But the need for cuts to continue to at least 2018/19 means there will inevitably be greater ‘retrenchment’ in the coming years.
• Austerity has catalysed council efforts to find more efficient ways of working and encouraged new forms of partnership, particularly with health services. But it has also fragmented services and created barriers to collaboration due to the scarcity of resources and the strain on basic services.
• Cuts are clearly beginning to bite, particularly in relation to services for children and young people and neighbourhood upkeep. Even small cuts can have impacts on poorer communities, limiting lives and diminishing support for all but the most urgent and extreme cases.
• While local devolution and greater reliance on civic responsibility are welcomed by local government, without coherent central support and investment, such efforts can only ever be ad hoc, and risk leaving gaps in services through which the poorest and most disadvantaged in society will fall.

CONTENTS
1 Introduction 052 National picture of the scale and incidence of the cuts 093 Strategies to manage austerity: the four case studies 314 The cost of the cuts: the view from service users 475 The cost of the cuts: the view from front-line service
providers 646 The cost of the cuts for the voluntary sector 847 The cost of the cuts for poorer people and places 958 Key findings and recommendations 116
Notes 122 References 123 Acknowledgements 125 About the authors 126

List of figures1 Cumulative real change in spending power by class of
authority in England, 2010/11–2015/16 112 Real percentage change in spending power by class of
authority and deprivation band, 2010/11–2015/16 123 Real budget changes for ‘other education’ and ‘all
other services’ for English all-purpose authorities by deprivation band, 2010/11–2014/15 13
4 Real budget changes for ‘other education’ and ‘all other services’ for English all-purpose authorities by broad region, 2010/11–2014/15 14
5 Real budget changes by service for English all-purpose authorities by deprivation band, 2010/11–2014/15 15
6 Real budget changes by service for English district councils by deprivation band, 2010/11–2014/15 16
7 Per Capita Expenditure Profile by deprivation bands for English All-Purpose Authorities, 2010/11 and 2014/15 17
8 Adjusted real total local government spending in Scotland, 1996/07–2015/16 18
9 Real expenditure trends by service, Scottish local government, 1996/07–2014/15 19
10 Real spending changes in local services in England and Scotland, 2010/11–2014/15 20
11 Expenditure per capita on non-education services at 2014 prices by Deprivation Band for Scottish Local Authorities, 2010/11 and 2014/15 23
12 General satisfaction with councils in England, 2012/13–2014/15 24
13 Trends in overall satisfaction with local government in Scotland, 2007–12 25
14 Change in use of universal public and private services, 1999–2012 26
15 Budget gaps for the four case studies 3416 Comparison of savings by headline strategy, 2011-13
and 2013-16 3717 Renfrewshire Investment spend by sphere - 2012/13
to 2014/15 4518 Real budget change in English local authorities by
distributional character of service (per cent, excluding education), 2010–14 97
19 Real budget change in English local authorities by distributional character of service (£million, excluding education), 2010–14 98

20 Relative savings in four case studies by distributional character of services, 2010/11–2015/16 99
21 Proportion of total spend by case studies by distributional character of service, 2011/12–14/15 100
22 Proportion of savings by case stduies by distributional character of service, 2011–13 and 2013–16 101
List of tables1 Real expenditure change by Scottish local authorities, in
percentage and per capita terms, 2010/11–2014/15 212 Real budget spending change by deprivation band,
Scottish local authorities, 2010/11–2014/15 223 Changes in non-domestic (business) rate income for
all-purpose authorities in England with the highest and lowest changes, 2009/10–2014/15 29
4 Coping with the cuts: headline strategies 365 Investment expenditure in Renfrewshire by activity,
2012/13 to 2014/15 39

05
1 INTRODUCTION The story of how local government has coped so far with severe reductions to budgets as a result of central government austerity measures has been told in a variety of reports. These include earlier studies conducted by this research team (Hastings et al, 2012; 2013a; 2013b), and other national studies such as those by the Audit Commission (2013), National Audit Office (NAO, 2014) and IFS (2014). There are also some local studies such as Hard times, new directions? (Fitzgerald et al, 2014), which focuses on London authorities. The story that these reports tell with respect to the scale and nature of the cuts as well as how local government has responded can be broadly summarised as follows:
• Local government has suffered a faster rate of cuts than most other areas of government spending. Deep cuts have already been implemented, leading to a 27% reduction in the spending power of the sector in England between 2010/11 and 2014/15. Authorities with greater concentrations of disadvantaged population groups have suffered faster or deeper cuts, particularly those in urban areas.
• So far, local government has coped with budget contraction, demonstrating resilience and a capacity to adjust to a new funding landscape. At the time of writing, all councils have managed to set balanced, legal budgets by delivering the required savings each year. While there have been some high-profile protests about some of the measures, there has not been a national outcry from the public about reductions and withdrawals of council services.
• One reason for this may be that local authorities have attempted to shelter front-line services by loading savings onto ‘back-office’ functions or making other kinds of efficiency saving. Many have also tried to protect those services on which poorer groups and areas are most reliant, such as social work and social care. This has meant that services such as planning or those associated with environmental maintenance have had to absorb higher levels of savings.
• Local government has begun to change as a result of the cuts. Councils have coped with the necessity of making savings by withdrawing from some services and refocusing others on the needs of the most disadvantaged or vulnerable. They have also attempted to redesign services in ways that not only make savings but have the potential to be more effective. As well as new collaborations and service models, councils have sought to manage austerity by passing some responsibility for outcomes to other public bodies, the voluntary sector and individual citizens.

06The cost of the cuts: the impact on local government and poorer communities
In this report, we take this story further. We provide some of the most detailed evidence to date of the impact of austerity on council services and on the people who use them. We also explore some of the challenges and constraints that councils face as they try to manage budget reductions in ways that do not damage the effectiveness of services. This report highlights how councils continue to respond creatively to the very challenging fiscal context in which they find themselves operating. However, it will undoubtedly be an uncomfortable read for those who argue that it is possible for councils to keep absorbing funding cuts without damaging the effectiveness of services. With less than half of the spending cuts planned as part of the current government’s deficit reduction programme to 2018/19 actually implemented (IFS, 2014), the report details how pressures and cracks are beginning to show. It suggests that, if budget cuts continue at the scale and speed planned, the capacity of local councils to deliver many of the services that are enjoyed by a cross-section of society, and on which the most disadvantaged and vulnerable rely, will be undermined.
About this research and the reportThis report is the culmination of a major research project that has been in operation since 2011. The study involved a national analysis for England and Scotland, and four local authority case studies (three English, one Scottish). It has used a mix of quantitative techniques such statistical modelling and analysis of national and local budgetary information, as well as qualitative approaches including interviews and focus groups with senior and front-line staff from councils and voluntary organisations, and with service users, plus ‘shadowing’ of front-line council staff as they went about their work. We have also obtained feedback from government and other experts designed to validate the national analysis, and from senior staff in the case studies to confirm our understanding of their approaches. A separate Technical Report provides a series of appendices which give a more detailed account of the various aspects of the study design (Hastings et al, 2015), although each of the following chapters also includes some outline information about methods. While the report builds on the analysis in earlier publications from this project, it can be read as a standalone piece of research.
This report aims to take forward the story about how local government has tackled austerity in several key ways. It aims to:
• provide the most up-to-date national picture of the scale, nature and distribution of the cuts to council budgets currently available
• explore how the strategies adopted by the case study councils have evolved or been adapted as the process has continued
• introduce a new comparative element by examining the cuts process in Scotland alongside that in England
• provide substantial new evidence on the impact of the cuts from the front line using evidence from service users, ‘street-level’ service providers and voluntary organisations
• reconsider a key message of the earlier reports and ask: how far will councils be able to protect the services relied on most by poorer communities if the cuts continue, particularly at their current pace?
Of course, austerity is being implemented as part of a wider political and policy agenda, and this affords both opportunities and challenges to local government. Key aspects of this wider agenda include:

071 Introduction
• a long-standing agenda designed to bring about public service reform. Aspects of this agenda pre-date austerity and reflect a broadly shared ambition to find ways of working that are smarter, more integrated and collaborative. This includes finding ways to pool budgets and data between agencies. Such ambitions have underpinned a variety of service redesigns as well as driving the continuing search for innovative models of service delivery. The public service reform agenda has developed a little differently in Scotland than in England. In Scotland, a key aim of reform is to improve the capacity of services to reduce inequalities as well as deliver innovative solutions. This is seen to rest on four ‘pillars’: prevention, partnership, people and performance. Public service reform in England since 2010 has not tended to be driven by the inequalities agenda, and the discourse of prevention has been much less prominent over the period, although recent initiatives such as Better Start suggest a growing interest. Moreover, the recent report of the Service Transformation Challenge Panel (2014) gives prominence to the need to develop new, ‘person-centred’, holistic approaches to service provision, particularly for people with multiple and complex needs.
• changes to the relationship between national and local government. This involves devolving more powers to local government. In England, for example, councils have been given incentives through the funding system to pursue economic growth. In both England and Scotland, local authorities have been given greater financial freedoms through reductions in the ring-fencing of funding streams from central government. Systems of central performance monitoring have been removed or scaled back. In both countries, councils have been given the power to develop their own schemes to relieve the burden of council tax for low-income households. One view is that this is a freeing-up of local government from restrictions imposed by national government. Another view is that such changes are about national government devolving responsibility or risk to local government by reducing long-established policies for equalising resources between places, and making local government responsible for local problems if the economy, and hence local tax income, does not grow.
• initiatives designed to accelerate the development of a mixed economy of service provision by reducing the size and role of state provision. In this agenda, the argument is that the activities of public agencies effectively ‘crowd out’ private and third-sector activity, and that more space needs to be made for these sectors as well as community bodies and individuals to make their distinctive contributions and to take on more responsibility.
• reform of the welfare system to ‘make work pay’ as well as reducing the cost of welfare to public spending. This element of the political and policy framework is of enormous relevance given the focus of this research on poor people and places. It is not just how austerity is impacting on local government budgets that is important for such groups but wider changes to the welfare system in particular. In addition, they face deteriorating conditions of work and a growth of ‘in-work’ poverty; increases in the cost of living which exceed wage or benefit increases, and increased conditionality on access to benefits.

08The cost of the cuts: the impact on local government and poorer communities
The report is structured as follows:
• In Chapter 2 we provide an up-to-date analysis of the scale and distribution of funding cuts and changes to spending power for local government in England and Scotland.
• Chapter 3 revisits the strategies devised by three case studies in England to manage austerity, and introduces the Scottish case study. It considers the evidence of strategic council officers on the challenges and constraints the councils face in trying to make savings while protecting, and indeed trying to improve, the effectiveness of services.
• Chapters 4, 5 and 6 consider the impacts of austerity from a front-line rather than strategic perspective. In turn, the chapters explore the nature of changes to services from the perspectives of service users, operational council staff and staff working in local voluntary organisations.
• Chapter 7 brings into focus how poorer groups and places are being affected by council cuts.
• Chapter 8 summarises the key messages and offers some policy implications and recommendations.

09
2 NATIONAL PICTURE OF THE SCALE AND INCIDENCE OF THE CUTS
This chapter updates the national analysis of the scale and distribution of the cuts discussed in our 2013 reports of the project (Hastings et al, 2013a; 2013b). It includes analysis of the latest Chartered Institute of Public Finance and Accounting (CIPFA) data released in summer 2014. It discusses the scale and distribution of cuts between types of local authority in both England (Part A) and Scotland (Part B), and includes some reflections on these, drawing primarily on our own analyses but also referencing recently published studies by the National Audit Office (NAO) which tell a similar story. There is also an analysis of trends in public satisfaction with council services (Part C). The chapter concludes by reflecting on the prospects for local government in the coming years (Part D).

10The cost of the cuts: the impact on local government and poorer communities
Part A. Pattern of cuts in England 2010/11–2014/15
Building further on analyses developed in previous phases of this research, we here examine the prospects for local government spending resources in England up to 2015/16, and the actual net changes in budgeted spend up to 2014/15. We continue to use a base year of 2010/11, based on the original settlement and budgets for that year, prior to the 2010 general election and the succession of cuts instituted from the summer of 2010. Unless otherwise stated, all changes are expressed in real terms allowing for general inflation (using the ‘GDP deflator’).
Figure 1 confirms that the strong downward trend in the real level of spending resources available to English local authorities has continued into 2014/15 and is expected to carry on into 2015/161. The overall average cut in England amounts to 27% in real terms. For metropolitan districts and London boroughs (inner and outer), the cumulative real cut by 2015/16 will have reached 31% and 32% respectively, and for unitary authorities 28%. However, the shire areas (counties and districts combined) – which had already seen the lowest level of cuts up to 2014/15 – will see a moderation of impact in 2015/16, with an overall cut over the five years of 18%. As discussed in our 2013 Coping with the cuts? reports (Hastings et al, 2013a; 2013b), these cuts will bring the share of local government in the national economy to its lowest level for the last two decades.
The NAO published its study, The impact of funding reductions on local authorities, in November 2014. This shows a very similar overall picture of real-terms reductions in spending power averaging 25% between 2010/11 and 2015/162. Although the main cuts are triggered by grant reduction, the NAO report points out that the semi-frozen state of council tax means real-terms reductions in that source of income, while income from fees and charges has also fallen in real terms over this period. The NAO also acknowledges the sizeable increase in local authority reserves as an understandable and prudent response to growing financial uncertainty.

112 National picture of the scale and incidence of the cuts
Year
Figure 1: Cumulative Real Change in Spending Power by Class of Authority, England 2010-15
Source: Authors’ analysis of CIPFA and Local Government Funding Settlement data. Figures exclude school funding and public health, and allow for the localisation of council tax support – see Technical Report (Hastings et al 2015) for details.
-0.35
-0.25
-0.3
-0.2
-0.15
-0.05
-0.1
0P
erce
nt
2012
2011
2010
2013
2014
2015
Inner London Outer London Met District Unitary Shire Co+Dis
There is more similarity than difference in the spending power trajectories for the different classes of local authority, although Outer London seemed to take a sharper hit in the first year or so while, as noted, shire areas seem to be being treated progressively more favourably. With the latter, there has also been a shift of funding support from the districts to the counties. The NAO (ibid.) found that metropolitan districts were more likely to show signs of financial stress – for example having to make unplanned mid-year cuts, or having auditors who expressed a lack of confidence in the authority’s ability to meet the savings targets in the medium term.
While this captures broader urban–rural differences to some extent, perhaps the greatest area of concern has been the treatment of authorities across the deprived to affluent spectrum. Figure 2 shows the percentage real-terms cuts broken down by class of authority and deprivation banding, using the government’s 2010 Index of Multiple Deprivation (IMD) to divide authorities into five equal bandings in terms of their low-income score (IMD1 being the most deprived, and IMD5 the most affluent).
Within each class of authority, there is a clear tendency for the percentage cuts to be greatest in the most deprived category and least in the most affluent; note that some classes of authority do not have members across the whole deprivation range. Since deprived authorities tend to have higher absolute levels of expenditure to start with, reflecting their higher needs, the absolute scale of cuts (or as measured in £ per head of population) tends to be markedly greater for the more deprived areas, as shown below when we look at budgets.

12The cost of the cuts: the impact on local government and poorer communities
Figure 2: Real change in Spending Power 2010-2015 by Class of Authority and Deprivation Band (percent)
Source: Authors’ analysis of CIPFA data. Figures exclude school funding and public health, and allow for the localisation of council tax support – see Technical Report for details.
-70
-50
-40
-10
0P
erce
nt
LA Class
Inne
r Lo
ndon
Out
er L
ondo
n
Met
Dis
tric
t
Uni
tary
Cou
nty
Dis
tric
t
-20
-30
-60
-80
Most deprived IMD2 IMD3 IMD4 Least deprived
We can now look at the actual budget decisions made by local authorities, cumulated over the period from our 2010/11 base to 2014/15 (the financial year at the time of writing). These budget decisions reflect elements of local discretion, including varying use of balances and, in an increasing number of cases, defiance of the government’s strong policy encouragement to continue freezing council tax. One very important issue affecting local government budgets is the changing structure of educational provision and associated support services, driven in significant measure by the government’s academies programme. Although we exclude schools budgets from the analysis, we do include other ‘non-school’ educational spending but generally show it separately. This spending includes the range of support and administrative backup services traditionally provided centrally by local authorities and not delegated to schools, including specialised provision (e.g. music), special educational needs (SEN) support, inspection and advice, welfare support to deprived pupils and so forth.
In general, when presenting budget changes, we use changes measured in real terms per head of population, which allows for both general inflation in costs and for changes in overall population. This gives a fairer picture of the real scale of cuts, and deals with some problems that would otherwise arise in certain services where income is significant. However, we also refer where important to the picture in terms of percentage real changes as well – in general these give a similar picture.
Figure 3 looks at real spending changes for the broad service groupings of ‘other education’ (the non-school services) and all other services; the latter are far greater in absolute terms. It covers ‘all-purpose authorities’ only, to exclude counties and districts, which have very different kinds of service responsibility. As in Figure 2, authorities are divided into deprivation bands. Both groups of services have seen substantial cuts, in the range £50–£200 per head. Within the ‘other education’ category, the highest level of reduction

132 National picture of the scale and incidence of the cuts
appears to have been in moderately affluent authorities. Nevertheless, it remains true that the smallest reduction was in the most affluent areas, with very and moderately deprived areas seeing an intermediate level of cutback. While this is slightly speculative, the changes in non-school ‘other education’ may have been influenced by differential penetration of the academies programme in different regions and types of area.
Figure 3: Real Budget Changes by Other Education vs Other Services for English All Purpose Authorities by Deprivation Band, £ /head, 2010-14
Source: Authors’ analysis of CIPFA data. Figures for ‘all other services’ exclude school funding and public health, and allow for the localisation of council tax support – see Technical Report for details. ‘All-purpose authorities’ excludes county and district councils.
-200
-150
0
£/he
ad
Service
Oth
er E
duca
tion
Oth
er S
ervi
ces
-50
-100
-250
Most deprived IMD2 IMD3 IMD4 Least deprived
For all other services combined (covering the overwhelming majority of spending), the pattern is much clearer and starker. The most deprived areas saw the largest cuts, around £222 per head. The level of cut is lower for intermediate levels of deprivation and is lowest (under £40 per head) in the most affluent local authorities. The absolute level of cut in real terms is 5.6 times higher in the most deprived fifth of areas compared with the least deprived, for this group of services. The pattern is similar when expressed in percentage terms, with a cut 4.3 times higher in the most deprived band, compared with the least deprived.
There is also a regional pattern, which to some extent reflects the urban–rural differences. Figure 4 shows the pattern for the broad service groups. For the ‘other education’ spend, the cut is greater in the South than in the North or Midlands, but for all other services, the cuts are greater in London and in the Midlands and North, and markedly less in the South.

14The cost of the cuts: the impact on local government and poorer communities
Figure 4: Real Budget Changes by Other Education vs Other Services for English All Purpose Authorities by Broad Region, £ per head, 2010-14
Source: Authors’ analysis of CIPFA data. Figures for ‘all other services’ exclude school funding and public health, and allow for the localisation of council tax support – see Technical Report for details. ‘All-purpose authorities’ excludes county and district councils.
-200
-150
0£/
head
Service
Oth
er E
duca
tion
Oth
er S
ervi
ces
-50
-100
-250
North Mids South London
Figure 5 provides a more detailed breakdown of ‘all other services’, again distinguishing the five deprivation bandings across the all-purpose authorities. Here, there is a fairly consistent pattern. Across all services except transport, the cuts are greatest for the most deprived areas and lowest for the two least deprived groups. Particularly striking is the situation for social care spending (combining children and adult services). This has actually risen in real terms in the least deprived categories (by £28 per head or 8%) while falling strongly in the most/more deprived categories (by £65 per head or 14%). Other services with a notably large difference between deprived and affluent areas are housing and planning.

152 National picture of the scale and incidence of the cuts
Figure 5: Real Budget Changes by Service for English All Purpose Authorities by Deprivation Band, £/head, 2010-14
Source: Author’s analysis of CIPFA data. ‘All-purpose authorities’ excludes county and district councils.
-60
-20
0
40£/
head
Service
Tran
spor
t
Soc
Car
e
Hou
sing
Cul
ture
Envi
ron
Pan
nnin
g
20
-40
-80
Cen
tera
l
Most deprived IMD2 IMD3 IMD4 Least deprived
The analysis for shire county authorities shows a similar story for social care, but a flatter picture for some services including culture and planning. It should be noted that there are no shire counties in the two most deprived bands, however.
The NAO (2014) argues that local authorities have to protect or prioritise ‘statutory’ services, and that therefore certain other services will inevitably suffer disproportionately. While one may debate exactly what statutory obligations entail in relation to different services, there is clearly some mechanism of this kind at work. Children’s social care has generally been protected or enhanced, and some elements of environmental regulation (e.g. waste collection) have seen lower levels of cut, whereas services such as planning and ‘supporting people’ services (discretionary social care with a preventative or enabling focus) have seen cumulative cuts of the order of 45%. The NAO argues, and we would concur, that it is implausible that further cuts of the same order of magnitude can be made to the ‘non-statutory’ services in the coming years; for example, there are considerable pressures on planning arising from the government’s growth and housing supply agendas as well as the recovery of the development industry. In the coming period, therefore, it is likely that services that have hitherto been somewhat protected, notably adult social care, will begin to see more substantial cuts. This may in turn lead to significant tensions with other public bodies, notably the NHS (e.g. in relation to issues of ‘bed-blocking’ in acute hospitals).
The equivalent analysis for district councils (Figure 6) shows a strikingly consistent picture of systematically greater cuts in more deprived areas, for all of the six service groups included in their remit. In this instance, transport shows a common pattern with the other services.
The implications of the distribution of cuts across services, in terms of the distributional impact across households with different levels of deprivation, are discussed further in Chapter 7.

16The cost of the cuts: the impact on local government and poorer communities
Figure 6: Real Budget Changes by Service for English District Councils by Deprivation Band, £/head, 2010-14
Source: Authors’ analysis of CIPFA data.
-20
-5
0£/
head
Service
Tran
spor
t
Hou
sing
Cul
ture
Envi
r R
egul
Pla
nnin
g
Cen
tral
-10
-15
-25
Most deprived IMD2 IMD3 IMD4 Least deprived
It is also worth putting the changing levels of spending in this period of austerity into context by considering the overall pattern of per capita spending across the socio-economic deprivation spectrum, in 2010/11 and in 2014/15. Government statements have pointed out that more deprived authorities still receive more grant and have more spending power than more affluent areas, even after the cuts3. Figure 7 shows that this statement is true, but that the gap has narrowed considerably. The difference between the most and least deprived bands has fallen from 45% in 2010/11 to just 17% in 2014/15. There has been a pronounced flattening out in the profile, and indeed it can be seen that now the most affluent areas actually spend more than the middle band.

172 National picture of the scale and incidence of the cuts
Figure 7: Per Capita Expenditure Profile by deprivation bands for English All-Purpose Authorities, 2010/11 and 2014/15
Source: Authors’ analysis of CIPFA ‘Financial and general statistics 2010/11 and 2014/15 estimates’. Figures in 2014/15 prices. Figures exclude school funding and public health, and allow for the localisation of council tax support – see Technical Report for details.
100
300
1000
Service
IMD
1
IMD
5
700
500
0
2010 2014
IMD
2
IMD
3
IMD
4
200
400
800
600
900
The higher spending in more deprived authorities has long been supported by central government resource allocation systems on the basis that these authorities face greater needs for many services and hence need greater resources in order to offer the same standard of service. As we show in Chapter 7, the bulk of local authority spending is on services that low-income groups are more likely to need, such as social care, and so this would seem to be appropriate. The issue of how much more spending is needed in more deprived localities has been much debated over many years4. However, a flattening out of this magnitude is a very significant change in the system and one that seems on the face of it hard to justify.
Part B. Pattern of cuts in Scotland 2010/11–2014/15
Scotland has been going through a period of austerity and cutbacks in local authority service spending that parallels that in England. Scottish local government lost 11% of its spending power between 2010/11 and 2014/15, a substantial cut, but clearly not as pronounced as in England5. Before looking in more detail at changes since 2010/11, we put this in context by looking – in Figures 8 and 9 – at changes over a somewhat longer period, going back to the major structural reform of Scottish local government in 1996 (the equivalent data for England were presented in Figure 2.1 in Hastings et al, 2013b). It can be seen that overall revenue spending rose quite strongly from 2000/01 to 2005/06, then at a rather modest rate up to 2009/10. There was quite a sharp reduction in 2011/12, then an apparent pause, followed by more moderate reductions in 2013/14 and 2014/15. According to the Scottish government’s budget, local government spending in 2015/16 will be approximately constant in real terms.

18The cost of the cuts: the impact on local government and poorer communities
Year
Figure 8: Adjusted Real Total Local Government Spending, Scotland, 1996-2015
Source: Authors’ analysis of Scottish local government financial statistics reports (1996–2012) and Scottish government provisional outturn and budget estimates reports (2013-14). Note: Adjusted for changes in service responsibility, but including police and fire services. All data in 2015/16 prices.
0
4000
2000
6000
8000
12000
10000
16000£m
2009
2005
2003
2001
1999
1997
1995
2011
2013
2015
Adj Real Total
14000
2007
The policy context for this included a Concordat between the Scottish government (SNP-led since 2007) and local government which has entailed an ongoing freeze on council tax levels and the absorption of most separate specific grant programmes into the general resource grant (i.e. the removal of significant ring-fencing). The other major source of revenue, the non-domestic (business) rate, is pegged to increase only with general inflation.
Figure 9 looks at timelines for the major service groups in Scottish local government. School education remains fully within local government, without an academies programme complicating things, so it is shown in this analysis. Real spending on this service fell markedly from 2009/10 to 2014/15, having previously increased strongly. Social care spending roughly doubled from the mid-1990s to 2009/10, and since then has been roughly flat. Police and fire services expenditure increased up to 2009/10, then fell sharply before levelling off – since 2013 these services have moved from local to central government control. Other services generally increased up to 2009/10 and since then have fallen back.
Under devolution, the Scottish government has responsibility for local government spending policy, but its overall funding is determined by Westminster through the Barnett formula and other post-devolution arrangements. Thus, while there is no direct mechanism to bring about the same level of cuts as have been imposed in England, resource constraints limit the extent to which Scotland can follow a completely different path. Going forward, there are many reports in the media of an intensifying phase of budget cuts having to be imposed by Scottish local authorities. However, it is difficult to reconcile these with the figures traced in Figure 8 up to 2015/16. From discussion with our Scottish case study and national representatives of local government, it appears that there have been significant additional responsibilities placed by the Scottish government or

192 National picture of the scale and incidence of the cuts
parliament on local authorities in this period (e.g. free school meals, childcare for three-year-olds), which have a quantifiable impact on spending. In measuring net change, we are not thereby revealing the somewhat greater cuts in existing services required to balance the books alongside these new spending commitments. However, our analysis of changes in England is affected to some extent by the same problem (although we have allowed for two major changes in responsibility – public health and council tax support).
Year
Education
Figure 9: Real Expenditure Trends by Service Scottish Local Government 1996-2014
Source: Authors’ analysis of Scottish local government financial statistics reports (1996–2012) and Scottish government provisional outturn and budget estimates reports (2013-14).
0
1000
2000
3000
4000
5000
6000
£m
1994
1996
1998
2000
2002
2008
2006
2004
2012
2010
2014
2016
Social Care Police & Fire Transport Environmental
Planning & Dev Cultural & Rel Other Services
Figure 10 presents a comparison of real-terms cuts by services between Scotland and England. It should be noted that these figures do not reflect changes in population. Although education, the largest service, has experienced real cuts in Scotland, the magnitude of these appears less than in England but it should be stressed that this comparison is affected by the academies programme in England, which takes some ongoing expenditure out of local government. At the same time, as showed above, England has experienced very sharp cuts in non-school educational support spending, which does not appear to have been replicated to the same extent in Scotland.
In both countries, social care remains a priority area, due partly to demographic trends and partly to policies to strengthen social care support to the NHS. The net effect is to see expenditure reducing only very slightly in this period, in both countries.
Transport expenditure has been significantly reduced in both countries, but with larger reductions in Scotland. Housing general fund expenditure, which largely covers homelessness, supporting people and private sector activity, has seen some of the largest reductions in both countries, but the cuts in England have been greater. The combined area of culture, environment and planning spending has also been reduced by large amounts

20The cost of the cuts: the impact on local government and poorer communities
(c. 40%) in England, but much less in Scotland. The ‘central and other’ category is one where Scotland has seen greater cuts than England.
The totals for all service spending excluding education (and police and fire services) give a reasonably comparable basis for comparing the two countries. Here we see lesser cuts in Scotland (10%) compared with England (17%). A wider total, for all local government including loan charges, shows a bigger discrepancy but this is affected by the problems of comparison involving education and possibly also by differences between the two countries in new service responsibilities for local government in this period.
Figure 10: Real Spending Changes in Local Services, England and Scotland, 2010-14
Source: Authors’ analysis of CIPFA financial data and budget estimates (England) and Scottish local government financial statistics reports and Scottish government provisional outturn and budget estimates reports.
-20
-25
-30
-35
-40
-45
-5
0
Per
cent
Service
Educ
atio
n
Tran
spor
t
SocC
are
Hou
sing
Cul
tEnv
Plg
Cen
th0t
h
Non
Ed S
ervi
ces
-10
-15
-50
England Scotland
All
LG in
c. I.
c
As in England, there has been considerable variation between different local authorities in the extent of expenditure reduction between 2010/11 and 2014/15. Table 1 presents summary measures of real change in percentage and per capita terms (including education). The range is from -13.0% or £655 per capita in Eilean Siar to +3.5% or £55 per head in Shetland. Shetland is the only authority showing positive change in this period. Other authorities with relatively large percentage reductions include our case study of Renfrewshire along with several other authorities in the West of Scotland. In some of these authorities, a declining population offsets some of the reduction so the per capita loss is lower than average (examples include Inverclyde, West Dunbartonshire and North Ayrshire). Renfrewshire’s per capita reduction is above the national average but not by as much as its percentage cut. Other authorities with growing populations such as Highland, Orkney and East Lothian have cuts in per capita terms that are greater than their percentage change would indicate.
There are less clear patterns in terms of deprivation than we found in England and we return to this point below. Differences by urban–rural or sub-regional location are also less than we found in England. One tendency is for reductions to be greater in the West of Scotland than in the East but

212 National picture of the scale and incidence of the cuts
this reflects patterns of population and economic change, not least because the grant funding formulas used in Scotland are relatively dominated by population factors. The West–East difference is -7.4% vs -4.5% in percentage terms, or -£215 vs -£174 per capita. Table 1: Real expenditure change by Scottish local authorities, in percentage and per capita terms, 2010/11–2014/15
Local authority % Per capitaEilean Siar -13.0 -654.5
Angus -9.9 -282.2
Argyll & Bute -9.6 -247.3
Renfrewshire -8.3 -208.4Inverclyde -8.2 -174.9
East Ayrshire -7.7 -201.7
Stirling -7.7 -240.7
Dumfries & Galloway -7.5 -190.1
North Lanarkshire -7.4 -207.0
West Dunbartonshire -7.2 -154.7
North Ayrshire -6.8 -164.0
East Dunbartonshire -6.6 -167.6
Glasgow City -6.6 -211.8
Highland -6.5 -249.9
Scottish Borders -6.4 -180.9
Aberdeenshire -6.1 -226.4
East Lothian -5.9 -233.6
Dundee City -5.9 -189.1
Midlothian -5.7 -218.8
South Lanarkshire -5.6 -151.7
Orkney Islands -4.9 -345.3
East Renfrewshire -4.9 -159.7
Moray -4.5 -182.9
South Ayrshire -4.4 -114.1
Aberdeen City -3.7 -169.0
Edinburgh, City of -3.7 -143.8
Falkirk -3.7 -132.1
Perth & Kinross -3.3 -129.5
West Lothian -2.5 -112.1
Fife -2.2 -73.4
Clackmannanshire -1.7 -80.4
Shetland Islands 3.5 55.0
Scotland -5.7 -180.7
Source: Scottish Government (annual) provisional outturn and budget estimates.
As noted above, it may be argued that the scale of cuts measured here understates the extent of cuts to established services because budgets have to make room for new commitments mandated by the Scottish parliament or government. Renfrewshire, for example, has calculated that in the five years to 2015/16 it lost 17% in grant in real terms – in spending power terms that would be about 14%, and there is some uncertainty about how one should

22The cost of the cuts: the impact on local government and poorer communities
account for the council tax reduction scheme, which might reduce it further. What is clear is that the reduction in spending power is greater than the 8% net change shown in Table 1 above.
A key finding in England has been that spending has reduced more, in both percentage and per capita terms, in more deprived localities. Does the same apply in Scotland? Table 2 presents a summary analysis for all services and all services excluding education to facilitate comparison with England. The table suggests that, in Scotland, the cuts have not been markedly greater in more deprived authorities. It is true that the most affluent authorities saw a slightly smaller percentage reduction than the most deprived (-7.1% vs -9.4%, or -4.5% vs -7.2% excluding education), and that there was some graduation over the deprivation bands, albeit with band 4 (fairly affluent) seeing quite a large cut, compared with band 3. The difference in per capita terms was smaller than in England, with the comparison between the most affluent and the most deprived being £38 per head for all services and £45 excluding education. This is in the context of a lesser overall magnitude of cuts, but for all-purpose authorities in England, the comparable difference was £182 per head for non-education services. In Scotland the smallest cut was experienced by authorities in the middle band.
We cannot say definitively why the pattern in Scotland is different. One element is probably that many of the specific grants streams that favoured more deprived locations have effectively continued whereas they were scrapped in England; in Scotland, they were merged into the general grant after 2008 but live on within the current funding formula. More importantly, the Scottish funding allocation system has never given as strong a recognition of the higher costs associated with deprivation as that in England, meaning that cuts in grant have less of a redistributive effect. The overall result, therefore, is that the changes in England have brought the system there closer to that in Scotland.
Table 2: Real budget spending change by deprivation band, Scottish local authorities, 2010/11–2014/15
Low-income deprivation band
% All
% exc educ
Per capita All
Per capita exc educ
SIMD1 (poorest) -9.4 -7.2 -277.7 -142.7
SIMD2 -9.1 -5.9 -241.5 -92.8
SIMD3 -6.2 -1.8 -178.5 -42.9
SIMD4 -8.0 -5.8 -252.4 -122.7
SIMD5 (most affluent)
-7.1 -4.5 -240.2 -98.2
Scotland -7.9 -5.1 -237.1 -99.8
Source: Scottish Government provisional outturn and budget estimates.
Figure 11 shows the distribution of relative expenditure levels on non-education services across the deprivation bands, on a comparable basis with Figure 7 above for England. This indicates that the shape of the distribution has not changed very much in Scotland, in contrast with the change shown for England in Figure 7. There has not been the same degree of ‘flattening’, but the most deprived areas started the period with a lower deprivation ‘premium’ in 2010 in Scotland than in England (29% vs 45%).

232 National picture of the scale and incidence of the cuts
Figure 11: Expenditure per capita on non-education services at 2014 prices by Deprivation Band for Scottish Local Authorities, 2010/11 and 2014/15
Source: Scottish Government provisional outturn and budget estimates
200
600
2000
Service
SIM
D1
SIM
D5
1400
1000
0
2010 2014
SIM
D2
SIM
D3
SIM
D4
400
800
1600
1200
1800
Part C. Are cuts impacting on public satisfaction with services?
One of the comments made about our 2013 reports was that, notwithstanding cuts in local spending, some surveys appeared to suggest that the general public was still relatively satisfied with local services. We therefore decided to review what general evidence we could find, as of 2014, to shed further light on this. In particular, we reviewed evidence from the UK Poverty and Social Exclusion Surveys of 1999 and 2012, LG-Inform data published by the Local Government Association (LGA), predecessor national surveys in England (the Place and BVPI surveys), and the Scottish Household Survey.
It must be emphasised that there are problems and limitations with such evidence. There are probably time lags between changes in services and the general public’s awareness of them, and further lags between awareness and the publication of survey results. Even the most recent data from these surveys is one or two years out of date. And, as has been demonstrated in the earlier reports from this study, many local authorities managed to concentrate most of their cuts in the first two years (2010–12) on ‘efficiency’ savings in an effort to minimise the impact on front-line services.
The most recent data available are from the published high-level outputs from the LG-Inform system run by the LGA. This provides quarterly snapshots based on a sample size of just over 1,000 per quarter across England. By pooling these into three groups corresponding roughly to the three financial years 2012/13–2014/15, we can begin to discern trends (Figure 12). It should be noted that the indicators are not asking people to pass judgement on the current quality of council services or, indeed, how these have changed. Instead they refer in a rather generalised way to the state of the area, the operations and communications of the council, value for money (VFM) of services, and general trust in the council. In virtually all

24The cost of the cuts: the impact on local government and poorer communities
cases, satisfaction has fallen and dissatisfaction or other negative responses have increased. The direction of change is clearly adverse, even though the margins of change are not as yet very large. For the reasons given above, we would not necessarily expect large responses to be being manifested as yet.
Figure 12: General satisfaction with councils 2012/13-14/15 (LG Inform – England)
Source: LG-Inform (England).
60
50
40
30
20
10
90
Per
cent
Service
Satis
fied
Are
a P
lace
to L
ive
Satis
fied
Way
Cou
ncil
Run
s Th
ings
Agr
ee C
ounc
il P
rovi
des
VFM
Cou
ncil
Doe
s A
ct o
n C
once
rns
Keep
s U
s W
ell I
nfor
med
Dis
satis
fied
Are
a
Dis
satis
fied
Way
Run
s
Dis
agre
e V
FM
Doe
s N
ot A
ct
Doe
s N
ot K
eep
Info
rmed
Trus
t Loc
al C
ounc
il
80
70
0
2012/13 2013/14
Do
Not
Tru
st
2014/15
Also, it should be pointed out that, although the coding of some of the questions may not be exactly comparable, it does appear that on roughly equivalent questions asked in BVPI 2006 and the Place Survey in 2008, satisfaction scores were lower then than in 2012. That would be consistent with a story of local government improving its performance in the period 2006–2012, for most of which time it was benefiting from significant real-terms increases in spending.
For Scotland, we can refer to three waves of the Scottish Household Survey between 2007 and 2012 when relevant questions were asked. Figure 13 looks at timelines for a range of overall satisfaction indicators which are similar to those reviewed above, although here two questions are directly about high-quality services and services designed for needs. The general picture is one of a levelling-off or downturn in satisfaction after 2009, following a previous increase, although in some cases improvement continues to 2012 (‘does its best with the money’, ‘good at listening’).

252 National picture of the scale and incidence of the cuts
Year
Good at communicating services
Figure 13: Trends in Overall Satisfaction with Local Government in Scotland 2007-12
Source: Scottish Household Survey.
0
10
20
30
40
50
60
2006
2007
2008
2009
2010
2012
2011
2013
High quality services
Good at communicating performance
Good at listening I can influence decisions
Services designed for needs
Does its best with the money Addressing key issues
Per
cent
The Scottish Household Survey also looks at satisfaction with three key local services, one of which is directly in local government (schools) and another of which is partly influenced by local government (public transport), while the third (health services) provides a benchmark. Again, we see a picture of improvement up to 2009 followed by a levelling-off and, in the case of public transport, a decline.
The UK Poverty and Social Exclusion Survey provides some rather sharper measures of service usage and adequacy over the longer period 1999–2012, for Great Britain and for Scotland. Respondents in this nationally representative sample of households were asked about their use of and views on each of a range of public and private services. Possible responses were: used, adequate; used but inadequate; not used because inadequate or unavailable; not used because they could not afford it; and not used because they did not want to use it. Clearly, this comparison reflects changes over a longer period that will have been affected by societal changes as well as changes in spending and provision, with mainly positive changes in the earlier part of the period and negative changes towards the end.
Figure 14 looks at changes across a range of universal public and private services, ranked in descending order in terms of the change in the proportion responding ‘use-adequate’. In this period, only three services saw increases in reported usage – bus services, train services and corner shops. Clearly for these services more people chose to use them and fewer rated them as inadequate. At the other end of the scale, a lot of local public services saw a decline in usage and an increasing number of respondents found them inadequate or unaffordable. These included local government

26The cost of the cuts: the impact on local government and poorer communities
services in the cultural and leisure field such as libraries, evening classes, public sports, museums, galleries and community halls. In some cases, notably libraries, this decline in usage partly reflected changing preferences, perhaps associated with greater online access to information. These patterns of change over the longer term may help to account for the willingness of local authorities to contemplate cuts in budgets for these services.
Figure 14: Change in Usage and Constraints for Universal Public & Private Services 1999-2012, ranked by net increase in constraints
Source: UK Poverty and Social Exclusion Survey, 1999 and 2012.
10
5
0
-5
-10
-15
20
Per
cent
Service
Mus
eum
s &
Gal
l
Den
tist
Opt
icia
n
Even
ing
Cla
sses
Che
mis
t
Ban
k, B
S
Pos
t Off
ice
Doc
tor
Com
mun
ity H
al
Pub
Trai
n/tu
be S
tatio
n
Supe
rmar
ket
Pub
lic S
port
s
Libr
arie
s
Cor
ner
Shop
-20
Bus
Ser
vice
s
Use - Adequate Use - Inadequate Dont use - Inadeq/unavailable
Don't Use Can't Afford Don't Use Don't Want
15
A similar analysis in relation to a range of children’s services6 provided a generally positive picture, showing a large increase in usage of many of these services, and some reduction in inadequacy ratings between 1999 and 2012, although these remain prominent in some cases, such as play facilities. This was a period when national and local government supported considerable investment in enhancing services for children. However, these gains are likely to be adversely affected after 2012 by cuts in some of these services, particularly those supported by the non-school education budgets in England.
Part D. Prospects for the medium term
The current UK government has announced a broad policy of further ‘fiscal consolidation’ (essentially cuts) looking forward to 2018/19, although details of how this will be achieved remain to be determined. In practice, fiscal policy from 2016 will be determined by the outcome of the 2015 general election, although all parties concede the need for further cuts.

272 National picture of the scale and incidence of the cuts
In relation to the coalition government approach, local government spending (excluding schools) is part of the ‘unprotected’ area of public spending (i.e. not NHS, schools or overseas aid). A recent report by the Institute for Fiscal Studies (IFS 2014:40) estimates that departmental spending on unprotected services will have fallen by 4.6% a year in real terms between 2010/11 and 2015/16; this is similar to but a bit lower than our estimates for the rate of fall in real local authority budgets in England over this period of just over 5% a year (see Part A and Figure 1 above). Local government has done a bit worse than average across the ‘unprotected’ sector because of the partial protection of services such as police. The IFS report predicts that, without further cuts in welfare, unprotected services would need to reduce at a faster rate of 7% a year between 2015/16 and 2018/19. This is partly why the Chancellor has raised the prospect of further welfare cuts, of the order of £12bn. Such cuts would enable the annual rate of reduction in unprotected budgets to be brought down to 4.5% a year – in other words, ‘no worse’ than in the recent period. However, the cumulative impact would still be a 35% real reduction from 2010/11 levels by 2018/19 (and somewhat worse than that for local government).
The IFS report points out that the gross level of cuts in the unprotected sector may be greater still because of new policy commitments made by the current government, adding up to £6bn (2% of the total). These new commitments will have to be financed from greater cuts elsewhere. They also point to the costs of demographic changes – a rising total population with a rising proportion of elderly people. In a recent commentary, Emmerson and Johnson (2014) seek to correct an impression that the UK is most of the way through the process of cuts and consolidation – on any reasonable, consistent measure, we are only about half-way through in 2014/15.
Local authorities in England have some ‘wriggle room’ by virtue of the fact that they have some (highly circumscribed) control over some of their sources of finance, notably council tax. In England, an increasing proportion of councils have ignored government exhortations and have increased council tax within the margin allowed without triggering a referendum. In 2014, half the counties and most metropolitan districts and unitary authorities chose to increase band D council tax by up to 1.99%. (Ministers are currently considering reducing the threshold for a referendum to just 1%). This could be seen as a large-scale revolt, south of the border.
In Scotland, the policy context and the rules or incentives are slightly different, which probably accounts for the fact that all local authorities have continued to maintain the council tax freeze instituted in 2008. The financial penalty from raising council tax in Scotland is generally seen as too severe to be contemplated. In addition, there is probably something closer to a consensus among local governments as a collective and the Scottish government, covering overall grant settlements, relative freedom from ring-fencing, cost of new burdens and council tax levels. Third, our analysis suggests that the scale of cuts has been less severe in Scotland.
The notion that some services are relatively protected applies within local government too. Many authorities protect or prioritise social care, and also make provision for demographic pressures creating increasing levels of demand. This is reflected in our findings on budget changes. The overall effect, however, is to see proportionately much larger cuts in some other services, notably non-school educational support, housing, culture and planning. These four services saw cuts of between 27% and 44% over the four years to 2014/15 according to CIPFA data. If we are indeed only half-way through planned cuts, then one might infer that at the end of the

28The cost of the cuts: the impact on local government and poorer communities
process, these services will have been reduced in scale and scope by between 55% and 88%. This may indeed be the reality for some services. In other cases (e.g. planning), such extreme cuts are unlikely to be acceptable or achievable (as the NAO report (2014) discussed in Part A above suggested). That in turn may mean that the degree of protection currently afforded social care may be ended.
Another emerging policy theme is that of fiscal devolution, with post-referendum changes proposing more fiscal devolution to the Scottish government, and proposals for more financial powers to be given to ‘city regions’, or to local government more generally. It can be argued that the present government has supported this through its ‘localism’ policies and through the reduction in the use of specific, ring-fenced grants. These proposals are often linked to ideas about giving local authorities both more incentives and more means to promote economic growth in their areas. The change in local finance implemented in England in 2013/14, entailing retention by local authorities of up to half of the incremental growth in non-domestic rate (NDR) income, is an important aspect of this strand of policy; similar change is under consideration in Scotland. Policies and projects to promote economic growth also feature in the local budget strategies adopted by local authorities, under the general banner of ‘investment’, as reviewed in Chapter 3.
Although the localisation of NDR income is only in its second year, it is not too early to draw attention to the potential risks associated with this scheme. Local economies and the associated business property tax base can contract as well as expand, in the short- and medium term, and particular local authorities can show quite large changes. This is illustrated in Table 3, which shows real-terms changes in NDR income collected per capita between 2009 and 2014, for selected local authorities at the top and bottom of the growth league in that period.
This particular period was affected by the later stages of the recent major recession, followed by the early stages of the subsequent recovery. In fact, only 19 out of 121 single-tier authorities in this analysis showed real growth in NDR income per capita in this period, whereas over 100 showed a decline. The fact that particular authorities can see quite extreme growth or decline is illustrated in Table 3. There seems to be a haphazardness, or cyclical vulnerability, which could undermine the ‘city-region devolution’ model. For example, the leading candidate city region is Manchester, but Manchester and its neighbour Trafford saw big reductions, as did new-growth cities Milton Keynes and Peterborough, along with West London/Heathrow oriented boroughs (Kingston, Hounslow, Hillingdon, Slough, Reading and Windsor). ‘Safety-net’ arrangements are intended to apply to authorities standing to lose a large amount in one year but these have to be financed by a levy on gaining authorities, thus dulling the incentives within the scheme.
Are there systematic tendencies in these changes? It is possible to discern a cluster of central London boroughs in the high-growth group, notable Westminster, Camden and Kensington & Chelsea, and to point out that these are predominantly affluent areas albeit with significant pockets of poverty. In this period, growth was negative on average (by £30–50 per capita on average) in all broad regions except London. In the Midlands and the South, it was positive or neutral in the most affluent fifth of areas compared with negative in the less affluent and deprived areas. Thus there is some clear risk of a systematic reinforcement of the disadvantage of areas subjected to relative economic decline.
Overall, there is a trade-off with mechanisms of this kind between, on the one hand incentivising growth and financing the associated investment,

292 National picture of the scale and incidence of the cuts
and on the other protecting local services from sudden, unexpected loss of funding while ensuring reasonable equity between more and less economically fortunate areas.
Table 3: Changes in non-domestic (business) rate income for all-purpose authorities in England with the highest and lowest changes, 2009/10–2014/15
Local authority(highest)
Realchange
£ /capita
Local authority(lowest)
Realchange
£ /capitaWestminster 2,200 Portsmouth -82
Camden 539 Windsor and Maidenhead -83
Kensington and Chelsea 411 Leicester City -86
Bracknell Forest 181 Bolton -91
Hartlepool 154 Kingston upon Thames -91
Hammersmith and Fulham
86 Reading -93
Southwark 50 Peterborough -95
Newham 36 Nottingham -108
Bath and North 35 Swindon -114
East Riding of Yorkshire 28 Luton -134
Islington 28 Southampton -134
Stockton-on-Tees 25 Manchester -143
Leeds 16 Trafford -155
Medway 14 Hillingdon -158
Merton 13 Hounslow -165
Rutland 13 Milton Keynes -168
North Lincolnshire 13 Slough -184
Lambeth 4 Redcar and Cleveland -190
South Tyneside 2 Tower Hamlets -248
Source: CIPFA financial and general statistics budget estimates.
Concluding reflections
A number of important findings emerge from this chapter. The first concerns the overall rate of cuts. Local authorities in England have lost 27% of their spending power between 2010/11 and 2015/6 in real terms. The extent of cuts in Scotland was markedly less (only around 11% in net terms), although Scottish authorities have had to fund significant additional spending responsibilities within this. The second is that, in England, more deprived authorities have continued to see a greater rate of cuts. The result is that the additional resource given to more deprived areas in recognition of the greater demands on services has been reduced – from an extra 45% to just 17%. In Scotland, the cuts have been more evenly distributed but it never had as progressive a system as England. The result has been a convergence between the two countries on a funding system with relatively limited recognition of differential needs. However, local government in Scotland

30The cost of the cuts: the impact on local government and poorer communities
continues to have a higher level of spending per capita overall, and in most service categories, than England.
A third finding is that the cuts in local government now appear to be affecting public satisfaction with services. Up to now, the reductions are not very large but then the data only cover the period up to about 2012 due to time lags between collection and publication. Even by then, however, we can see falling satisfaction, rising dissatisfaction and other negative judgements, and an increasing proportion of people who feel services are unavailable or inaccessible.
Looking ahead, we draw two conclusions about the likely future direction of changes. First, it seems clear that cuts in local government funding are likely to continue and, at least on current coalition government plans, the pace is likely to be similar. It is generally accepted that less than half the spending cuts planned until 2018/19 have been implemented.
Second, it is likely that the funding position of local authorities in England will become increasingly uneven as the impact of the new system for business rates takes effect. Looking back at the last period, there is considerable variation in the level of growth in business rates, for much of which it is difficult to discern clear patterns. This in turn suggests that local policy is likely to be just one factor among many affecting growth. Future funding levels will be shaped to some extent by the lottery of economic growth.

31
3 STRATEGIES TO MANAGE AUSTERITY: THE FOUR CASE STUDIES
Introduction
Chapter 2 has set the scene with a national overview of the scale of the financial challenge facing local authorities in England and Scotland. The rest of this report examines how councils have responded and the consequences of this. It does this by reporting on detailed research on four case study authorities. This chapter examines the strategies they adopted to address their budgetary challenges and the constraints they faced in implementing them. For the three English authorities, this is an update on the picture provided in the Coping with the cuts? Reports (Hastings et al, 2013a; 2013b). In this report, we also set the English cases alongside our Scottish case study where there are many similarities but also important differences. Later chapters provide evidence on the impacts of these cuts.
This chapter begins by briefly introducing the four councils and the scale of the budgetary challenge they faced. It then provides an overview of their broad strategies or visions for the future, followed by more detailed analysis of their savings plans and how these have evolved over the last five years. It then summarises the views of senior officers on the main challenges or constraints they have faced in implementing these strategies. In the last section, we focus in more detail at one important difference between the Scottish and English experience.
The case study councils
Four councils participated as case studies in this research, three from England and one from Scotland. The English case studies were selected to achieve regional spread, variety in relation to political control and to include two authorities with high concentrations of disadvantaged households – as these were known to be experiencing the severest budget cuts – as well as a more affluent counterpart7. Only unitary authorities were considered and London authorities were excluded as a separate project had this focus

32The cost of the cuts: the impact on local government and poorer communities
(Fitzgerald et al, 2014). The Scottish authority selected was also relatively deprived.
A final – and critical – criterion was that the case studies would be prepared to work ‘open book’: to give the research team complete access to budgetary information and savings plans, and to permit interviews with a range of senior and front-line staff.
The four case studies chosen are described briefly below. There is more detail on the English authorities in Hastings et al (2013a; 2013b).
• Coventry City Council is the largest of our English case study authorities with a population of 330,000 in 2013. It is relatively deprived with 33% of the population living in areas in the most deprived decile within England. The Labour Party has traditionally governed Coventry but, for the period 2003–06, no party had overall control. Then from 2006 to 2008, the Conservative Party held control. From 2008 to 2010 was another period where there was no overall control. Labour won the 2010 election outright and strengthened its position in the 2011 and 2012 local elections. Labour currently has 43 of the 54 council seats in Coventry, with the Conservatives holding the remaining 11 seats.
• Milton Keynes Council is the smallest of the three English case study authorities with a population of 256,000 in 2013 but it is growing a little faster (6% between 2010 and 2013, compared with 4% in the other two English case study authorities). It has a younger population profile, with fewer older people. It is the least deprived of the three English authorities with 11% of its population in the most deprived quintile – about average for England. The council has been under no overall control since 2006. At the time of writing, there are 25 Labour councillors, 18 Conservative, 13 Liberal Democrats and one UKIP councillor. Milton Keynes had been governed by a Conservative minority administration since May 2012, but in June 2014 the Labour Party replaced this in another minority administration. The analysis in this report relates to the period covered by the previous Conservative administration.
• Newcastle City Council has a population of 287,000 (2013). It is slightly more deprived than Coventry, with 37% of its population in the most deprived 10% of areas in England. The council has historically been run by Labour administrations but, between 2004 and 2011, it was run by the Liberal Democrats. The current Labour administration dates from May 2011 and further strengthened its position in the May 2012 elections. There have been no Conservative councillors in the city since 1995.
• Renfrewshire Council is notably smaller than the English case study authorities (population 174,000 in 2013) and, unlike them, its population was stable between 2010 and 2013. Using the Scottish deprivation index, 15% of the council’s population is in the most deprived decile of areas in Scotland. Renfrewshire Council was controlled by an SNP–Liberal Democrat coalition from 2007 to 2012. In the 2012 local elections, the Labour party won 22 of the 40 seats to lead the council with the SNP as the main opposition with 15 seats. The Conservatives, Liberal Democrats and an Independent occupy the remaining three seats.

333 Strategies to manage austerity: the four case studies
The scale of the budget gap
In Chapter 2, we presented the national picture by looking at data on changes in expenditure. These changes are driven by funding pressures or constraints that arise from changes in income. In recent years, these have been dominated by the cuts in government grants. Authorities also face unavoidable expenditure pressures resulting from rising costs (salaries, general inflation), growing demand for many services (driven by population growth and ageing, and other factors) or policy decisions that create new expenditure streams. There are no national data on expenditure pressures but they are reported by individual authorities in annual budget documents (albeit in ways which are not always directly comparable or wholly consistent).
The combination of funding and expenditure pressures is termed the budget gap. This is the sum that authorities need to find each year through savings in existing expenditure in order to set a balanced budget. In very broad terms, funding pressures and expenditure pressures have contributed roughly the same amount to the overall budget gap during the period examined here.
As we would expect, given the national picture presented in Chapter 2, each of the councils had to contend with substantial reductions in its funding or funding pressures. Over the five years from 2011/12 to 2015/16, the average annual reduction in funding was 5% in Newcastle and 3% in Coventry and Milton Keynes. The slower pace of cuts in Scotland meant that Renfrewshire’s annual reduction averaged 1.4%% a year. In cumulative terms, Newcastle lost 22% of its funding over the period, while Coventry and Milton Keynes lost 14% and 13% respectively. Renfrewshire lost 7% cumulatively in the same time period.
With expenditure pressures added in, however, the total budget gap is significantly larger (Figure 15). This budget gap is a much better guide to the scale of the challenge facing authorities. The largest annual gap was in the first of the five years shown, reflecting the frontloading of cuts (Hastings et al, 2013a). It is clear, however, that all four authorities have experienced a sustained budget gap every year across this period. It has been particularly high in Newcastle and Renfrewshire (averaging 10% and 11% respectively). While it has been slightly lower in Coventry and Milton Keynes (average 7% in both cases), gaps of this scale remain a substantial shortfall in resources to tackle, particularly when they recur over a number of consecutive years.

34The cost of the cuts: the impact on local government and poorer communities
Year
Figure 15: Budget gaps for the four case studies
Sources: The main sources for funding gaps and expenditure pressures are local authority budget reports. Authorities take different approaches to the presentation of figures and our analysis is based on an attempt to standardise where possible, as well as comparison of local authority figures with those published by national government based on local authority financial returns.
0
2
4
6
8
10
16%
of b
udge
t in
prev
yea
r
2011
/12
2012
/13
2013
/14
2014
/15
2015
/16
Newcastle
12
14
Coventry Milton Keynes Renfrewshire
Note: Further discussion of expenditure pressures can be found in Hastings et al (2013b), while Appendix A in Hastings et al, 2015 details how the Scottish case study was put on a comparable basis with the English cases.
Broad strategies and overall visions
The four councils all have broad strategic visions for their areas and it is important to view the more specific strategies they have adopted for closing the budget gaps within these overarching plans. While each is expressed in distinctive terms, they share four common elements, albeit with varying emphasis between these (see Box 3.1). These are:
• promoting economic growth for the benefit of local residents• enhancing quality of life for individuals and communities, often linked to
ideas of active citizenship• reducing or mitigating inequalities and promoting inclusion• restructuring and streamlining the council to make it more efficient.
It should also be noted that, even before the period covered in this report, each of the councils had been engaged in major internal transformation and efficiency programmes. Coventry had established a ‘value-for-money’ partnership from 2007 to help identify and deliver savings and, by June 2009, had introduced its transformation programme titled ‘A Better Council for a Bolder Coventry’, which has delivered the bulk of its savings. Newcastle introduced its value-for-money assessment framework in 2006 in order to make savings around council contracts and also began a major corporate

353 Strategies to manage austerity: the four case studies
transformation programme. Milton Keynes began making efficiencies through its own value-for-money strategy prior to 2010 while also engaging in major restructuring under its ‘Organisational Transformation Programme’. Renfrewshire was making efficiencies under its ‘Transforming Renfrewshire Programme’ before 2010.
Box 3.1: Broad strategic visions
In Coventry, the council plan 2015-18 sets out its vision for the years ahead. This has three main strands:
• ‘globally connected’ concerns promoting sustainable economic growth for Coventry and ensuring that all residents benefit from it;
• ‘locally committed’ means improving the quality of life for all Coventry residents, and doing this by working with local communities and in particular vulnerable groups; and
• ‘delivering our priorities’ covers the mechanisms through which they will achieve their goals (maximising assets, reducing operating costs
Milton Keynes, council plan (under development) will cover five main areas:
• cost reduction; a drive to reduce all costs associated with the council;• new models of service delivery; to reconsider the purpose of the
council and to engage the public about alternative ways to deliver and access services;
• outcomes-based commissioning; working with partners, to allow a broader approach than with current commissioning arrangements; and
• commercialisation; to increase awareness of the cost of service delivery with the development and implementation of new income-generation ideas.
Newcastle’s vision stresses the need to become a cooperative council working with both partner agencies and communities to improve the wellbeing of all residents. The plan covers four main areas:
• ‘working city’ outlines the council’s plans around generating economic growth and bringing good-quality employment to Newcastle;
• ‘decent neighbourhoods’ describes getting communities involved in their area and encompasses an active citizenship element around service provision but also includes an element of social inclusion through community involvement;
• ‘tackling inequalities’ centres around closer working between health and social care and involves major changes to how services are designed and delivered in those areas, and tackling the inequality and discrimination which prevents people from fulfilling their true potential’; and
• ‘fit for purpose council’ describes how the council will continue to streamline and restructure in order to become a cooperative council offering quality services with fewer resources.

36The cost of the cuts: the impact on local government and poorer communities
Renfrewshire’s plans are outlined in its ‘Better Council Change Programme’ (2014-2017):
• The council is keen to improve the local economy, and through its ‘Invest in Renfrewshire’ programme aims to work with local businesses to reduce youth unemployment and support growth.
• It has made the health and wellbeing of children and families a key part of its plans. The Early Years Strategy is a key part of this, with preventative, wrap-around services for families. It has established an Anti-Poverty Commission to identify actions and policies that have a positive impact on those living in poverty.
Tackling the budget gap
Within these overarching visions, each council has developed concrete strategies or activities designed to produce savings and close its budget gaps. A key part of our research has been the detailed analysis of these savings. In Coping with the Cuts? (Hastings et al, 2013a; 2013b), we analysed the savings strategies in two ways. First we looked at which services had been targeted, focusing in particular on the extent to which authorities protected services that are used most by poorer households. We will return to this aspect when we review the impact of the cuts on poorer households and communities in Chapter 7.
Here we concentrate on the second aspect, which was the mechanism or means of achieving the savings. We developed a novel framework, distinguishing three ‘headline’ strategic approaches: investment, efficiency and retrenchment. Table 4 provides definitions and describes some of the specific sub-strategies that each is designed to capture. For each authority, budget documents were scrutinised to identify which strategy was used to achieve the saving. Some 1,600 budget lines were assigned to categories within the framework, with our judgements validated with feedback from the case studies (see, Annex C Hastings et al 2015 for details).
Table 4: Coping with the cuts: headline strategies
Headline strategy Definition Specific sub-strategiesInvestment Actions that aim to reduce
the need for council services or reduce the cost of services in future
• Encourage economic growth or increase the returns from employment
• Accelerate own capital investment
• Preventative revenue spend
Efficiency Actions that aim to reduce costs of council services without changing service levels as far as the public are concerned
• Reduce ‘back-office’ and ‘fixed’ costs
• Income generation or loss reduction
• Seek savings from external providers
• Redesign front-line services

373 Strategies to manage austerity: the four case studies
Retrenchment Actions that reduce the council’s role in terms of the services it provides and for whom
• Renegotiate division of responsibilities between council and other agencies
• Renegotiate division of responsibilities between council and citizenry
• Individual charges (for existing services)
• Reduce the range of services supported by the local authority
• Continue to provide the service on a universal but reduced level
• Continue to provide the service but target towards ‘need’
Figure 16 summarises the analysis of the savings using our framework, showing the proportion of savings accounted for by each mechanism. The data are split into two time periods to identify change over time. The first covers the two years 2011/12–2012/13 (‘early’ austerity) and the second the three years 2013/14–2015/16 (‘later’ austerity)8. Three key findings emerge:
• efficiencies have made up the majority of savings although their share is declining
• investment savings have been very modest, though there are some signs of growth
• retrenchment has been relatively modest but is clearly growing in three of the four authorities.
Figure 16: Comparison of 2011-2013 and 2013-2016 savings by headline strategy
Sources: The main source of the savings data has been the council budget reports 2010/11-2015/16. The detailed information for Milton Keynes and Newcastle is given in appendices to the main budget reports. Some further data relating to a number of the proposals were also available through published equality impact assessments.
10
30
40
70
80
90
100
Per
cent
60
50
20
0
Investment Efficiency Retrenchment
2011
-201
3
2013
-201
6C
oven
try
2011
-201
3
2013
-201
6M
ilton
Key
nes
2011
-201
3
2013
-201
6N
ewca
stle
2011
-201
3
2013
-201
6R
enfr
ewsh
ire

38The cost of the cuts: the impact on local government and poorer communities
InvestmentInvestment strategies have been a key priority for all of the case study councils although, as Figure 16 shows, they have not usually delivered substantial savings in the period covered by our analysis. These are measures intended to dampen demand for services, generating long-term savings. Specific strategies fall into two main strands. The first is focused on promoting economic growth, largely through investments by councils’ capital budgets, as well as from joint working with partners such as local enterprise partnerships or investment vehicles such as City Deals. Growth is intended to reduce the demand for services associated with unemployment and poverty. The second strand uses the revenue spend of councils and other agencies on preventative services, i.e. those where expenditure is seen as reducing demand for other services in the present or future.
Looking at the first strand, economic development strategies include a number of ambitious interventions designed to catalyse investment in the physical infrastructure of council areas, and therefore increase their attractiveness in relation to further investment. As part of its £450m capital programme, Newcastle is investing £60m over five years in an ‘accelerated development zone’ in the city centre, while in Coventry, a £59m investment underpins a major city-centre regeneration plan, ‘Friargate’, anchored by the relocation of the majority of the council’s central functions to the development. Both councils are using recently available central government support for these initiatives: in Newcastle the City Deal status negotiated with central government and in Coventry a £12.7m grant from the Regional Growth Fund. In Milton Keynes, major investment in waste disposal facilities, regeneration linked to (older) estates and taking advantage of new transport links are under way, but a key issue for the council is how to manage the impact of growth: both on its capital budgets in terms of the need to fund the infrastructure to support housing and other forms of development; and on its revenue budgets as a consequence of increased demand for services. It was the first council in England to introduce a ‘roof tax’ (essentially a rolled-up developer contribution in return for contracted investment in infrastructure) designed to offset some of the costs of the infrastructure necessary to support development. In the Scottish case study, the ‘Invest in Renfrewshire’ initiative – designed to attract new business to the area – has been under way for some years. Renfrewshire is also part of the Greater Glasgow City Deal.
All four authorities have plans to foster the employability of disadvantaged groups. Newcastle has worked with partners such as JobCentre Plus to create a not-for-profit initiative, ‘Newcastle Futures’, which aims to get long-term unemployed people into employment. The council is investing £9m over three years with the local enterprise partnership to support youth employment by more closely aligning its economic development agenda with education and skills training. Renfrewshire has invested in employability through its ‘Invest in Renfrewshire’ programme, committing £8m over three years to initiatives that include a focus on supporting young people into employment. As part of an attempt to demonstrate a commitment to inclusive growth, all four case study councils are taking steps to become living wage employers.
Turning to the preventative side of investment strategies, the view of the three English councils is that austerity has constrained or indeed ‘squeezed out’ the capacity of councils to undertake the level of preventative work required. However, all three have invested in adoption services in order increase adoption rates and reduce the costs associated with looked-after children and young people. In Newcastle, the council has made substantial

393 Strategies to manage austerity: the four case studies
capital investment in assisted and independent living projects, and has sought out additional revenue resources via the Troubled Families and Better Start programmes. In Coventry, relatively small-scale opportunities have arisen as a result of the transfer of the budget for public health to the council, while in both Coventry and Milton Keynes, children’s social care services have been redesigned to deliver more early intervention activity. Sometimes investment is not about additional spend but about affording a degree of protection to services central to controlling demand. In Milton Keynes, intermediate or ‘re-ablement’ care is one of the few services that has not seen a reduction in staffing.
In contrast, the Scottish case study has been able to invest much more of its revenue budget into ‘preventative’ work. This has included: new investments in early years provision to support vulnerable families with coordinated services for children aged 0–8; employability initiatives often focused on young people; interventions designed to tackle poverty, promote financial inclusion and mitigate some of the impacts of welfare reform; and investment in housing-related support for older adults. As Table 5 indicates, the scale of such investments grew over a three-year period and amounted to more than £15m in 2014/15. Table 5: Investment expenditure in Renfrewshire by activity, 2012/13 to 2014/15
2012/13£m
2013/14£m
2014/15£m
Employability 1.173 3.673 3.5
Early years 0.754 3.244 4.285
Welfare reform 0.246 1.33 6.5
Older adults 0.36 0.63 0.946
Total 2.533 8.877 15.231
Strategic officers are of the view that this expenditure is beginning to have some impact. They suggest that those aspects of cost pressures that come from increases in demand, such as demographic or socio-economic change, have been reduced by around £1.5m a year. However, while prevention work may have dampened cost pressures, these nonetheless continue to grow.
Strategic officers in the three English case studies were shown the investment spend figures from Renfrewshire. Each was clear that their authority did not have the capacity for this scale of revenue expenditure. As one indicated:
“English authorities have not had space in which to fund preventative measures. Coventry has, for example, refocused some level of expenditure into preventative work in children’s social care, but only as part of a much wider transformation programme for the service which has sought to reduce overall levels of spending.”
Newcastle had recently bid for new, central government Better Start funding, enjoying success with two out of three bids. Additional resources were now available to support a redesign of children’s social care services, while a successful bid for Transformation Challenge funding will support families with complex dependencies. However, council officers expressed some frustration that the contraction of core council budgets, as well as cuts

40The cost of the cuts: the impact on local government and poorer communities
in Early Intervention Grant and the removal of the ring-fence on funding for the Sure Start initiative, have hampered work in this area. Indeed, scarce time and resources had to be expended in order to access new funds, whereas it would be better to “have a level of funding at council level to do it ourselves”, in the words of one interviewee. We return to the issue of how differences in the scale and pace of cuts to council budgets between England and Scotland may create differentials in the opportunities that councils have to undertake ‘invest to save’ work in the final section of this chapter.
EfficiencyEfficiencies are measures that reduce costs without reducing front-line service provision. They include activities such as: reductions and reorganisations of internal corporate functions such as finance or human resources; reducing the council’s ‘property footprint’ as central services and local facilities are consolidated at fewer sites; and service redesigns and new ways of working (such as integrated and generic working). This definition of efficiency – and the categorisation of the actual savings plans of the councils accordingly – may therefore be thought to be a fairly generous definition, as it not only incorporates pure ‘back-office’ reforms but also some of the service redesigns and innovations that the public service reform agenda suggests can be achieved without compromising service quality.
It is clear that all four areas have had significant reductions in employee numbers since 2011/12. While some of these losses may be attributed to retrenchment (see below), the great majority reflect efficiency savings. For the period 2011/12 to 2013/14 Newcastle lost 1,598 staff due to redundancies. It should be noted that the majority of redundancies were voluntary. Coventry had reduced its workforce by 16%, which is equivalent to 1,849 full time equivalents (FTEs). In comparison, Milton Keynes and Renfrewshire saw slightly lower reductions, losing 12% and 11% of their workforce respectively. It should be noted that prior to 2011/12, Renfrewshire had already seen a large reduction in posts, shedding 897 FTEs between 2009/10 and 2010/11.
In our earlier reports, we reported concerns that efficiency measures were becoming harder to identify, and that savings would increasingly be generated by measures that indicate a retrenchment in the role of councils. There is some evidence for this (see Figure 16 above). All three English authorities have increasingly been forced, by the scale and cumulative impact of cuts, to adopt retrenchment strategies but Renfrewshire has been able to sustain the level of efficiencies up to 2015/16.
Furthermore, there are some indications of a change in the nature of efficiency measures over time. In Milton Keynes, while early actions included redesigns of a number of services such as landscaping, street cleansing and services for children and young people, some later efficiency gains have been made not just by reducing staff, but also by re-evaluating the roles of remaining staff, leading to pay reductions, as well as other changes in terms and conditions. A substantial number of the efficiencies achieved in the later period have also been made by renegotiation of the council’s contract with external providers, resulting in transferring staff from a private sector vehicle back into council employment, making savings of £2.29m in the process in part through reduced terms and conditions.
Another aspect of efficiency discussed in the earlier reports was whether measures of the nature and scale implemented by the councils could have less direct or even hidden impacts on front-line services. In Chapter 5 we consider this question by exploring how these measures are experienced and viewed by operational council staff as well as by staff from voluntary organisations.

413 Strategies to manage austerity: the four case studies
RetrenchmentRetrenchment measures are those that result in a reduction in the role of local government in the provision of services as a whole or to particular groups. It might not therefore indicate an actual reduction in service: a key aspect of the strategies adopted by the case study councils has been to renegotiate the relative responsibilities of different agencies for key outcomes. Some such initiatives aim to deepen partnership and collaboration, and reflect ambitions to integrate services. In Renfrewshire, a multi-agency hub is being developed involving various council services concerned with community safety and environmental upkeep, alongside the police. Other examples represent attempts to ensure that other public agencies make a greater financial contribution to meeting local needs. In Newcastle, efforts to renegotiate relative responsibilities of partner agencies with respect to those entitled to NHS care illustrate how savings on council budgets can be achieved while safeguarding the outcomes of service users. Thus, the council had identified that a relatively low proportion of its adult social care service users were considered eligible for NHS funding. It then worked to develop a more robust health referral system, resulting in increased levels of eligibility for NHS continuing care provision. Milton Keynes is also making similar efforts with regards to both adult social care and mental health services.
The role of councils can also be reduced when responsibility for services or facilities is passed to citizens and local community bodies. As Chapter 1 indicated, in England in particular, the policy framework emphasises enhancing the capacity of citizens to – as one senior officer explained – “come forward and fill the gap as our services diminish”. All three English councils have savings plans based on the premise that citizens will take more responsibility for the upkeep of the local environment or the wellbeing of elderly neighbours. They have also encouraged community bodies to take over ownership and management of local buildings or facilities.
In Milton Keynes, this has been a key element of the council’s savings plans since the outset, with the establishment of a Community Asset Transfer (CAT) programme. This has been focused on the transfer of mainly leisure and community facilities as well as open spaces to parish councils and third-sector organisations. In addition to pools and leisure services, Newcastle’s plans also encompass an element of adult social care, with community members involved in the ‘co-production’ of services. Neighbours are exhorted to take ‘personal responsibility’ for ‘looking after each other’. Newcastle is also keen to promote behavioural change in relation to environmental cleanliness and maintenance services. As a result of service contraction, the council is “accepting that it does not have the… resources… to do what we’ve done in the past” (senior officer, 2012). These changes to street cleansing, green space, parks maintenance and grass-cutting will involve 200 FTE losses and are estimated to provide £7.5m in savings for the period 2013–16.
The clearest form of retrenchment is that which leads to straightforward reductions in services. These include the reduced frequencies in street cleansing and grounds maintenance introduced by all four case studies, as well as instances where a service is now provided from fewer locations. In the three English case studies, this is a feature of the redesign of children’s centres.
At the time of writing, it appears that forms of retrenchment resulting in service reductions are likely to become more significant from now on. In November 2014, proposals to radically reshape services across Coventry began to emerge. A new plan – labelled ‘City Centre First’ – outlines large-scale closures of children’s and family centres, community centres, adult

42The cost of the cuts: the impact on local government and poorer communities
education facilities, libraries and suburban offices, with the expectation that such services are consolidated into just five large ‘super hubs’ in different parts of the city. Coventry Council also announced plans to shed 1,000 additional posts by 2017 (Coventry City Council, 2014). Newcastle and Milton Keynes have also indicated that a dramatic change in service reductions is about to take place.
Interestingly, despite the relative degree of protection afforded to Scottish councils by the slower pace of cuts, Renfrewshire views the immediate future with some considerable concern, suggesting that there is insufficient recognition in funding formulas of the variations in deprivation. The council estimates a funding gap of £30m over the next two years. However, in contrast to the English authorities, the council sees scope to tackle this gap largely via further efficiencies: streamlining corporate support services and further improvements to procurement. At the same time, the council is also ‘starting a dialogue now with local people about what our priorities are and the financial pressures we are under. We will be open and upfront about the decisions we have to take’ (Renfrewshire Council, 2014).
Strategies in action: constraints and challenges
In interviews with senior staff, several consistent themes were identified across the authorities as major constraints or challenges that were faced by authorities as they tried to pursue these strategies.
Slow returns from growth and challenges for inclusionIn relation to economic growth strategies, two major challenges faced implementation. First, while strategic officers were keen to emphasise that a growth in jobs was apparent as a result of these activities, they acknowledged that such plans would only begin to yield substantial returns over the medium- to long term. One senior officer suggested that benefits would only begin to accrue “in seven to ten years’” while for another it was “a twenty-year plan”.
Second, it was noted earlier in the chapter that there was concern about how inclusive the economic development strategies could be. Despite the activities described above, senior officers were not able to state categorically that more disadvantaged groups were enjoying significant benefits, or that evidence was therefore emerging of levels of need and demand beginning to reduce. Indeed, such discussions tended to turn on rising rather than falling levels of need: “demand is always growing, you can never go too fast on growth”. One senior officer was quite clear that the challenge that his council faced was not a difficulty in attracting “global firms, but in ensuring that investment spreads to all”. Another identified the need to develop strategies “beyond growth” that would tackle “low incomes” and “low-waged jobs”: “How can we ensure that success is enjoyed by more?”
Perhaps surprisingly, senior officers would not be drawn on whether the pattern of funding cuts described in Chapter 2 – such that the most severe cuts affected authorities with the greatest concentrations of deprivation and (perhaps) economic challenge – presented a further impediment to taking forward growth in an inclusive way. Indeed, one officer suggested that it was “yesterday’s argument” that economic prosperity would be driven by a redistribution of public resources. There was a strong sense from the English authorities, as one officer said, of a ‘new normal’, in which survival for councils means being substantially less reliant on central government funding and policy priorities; becoming as self-sufficient as they can, as

433 Strategies to manage austerity: the four case studies
quickly as they can, and finding new ways to meet needs alongside other partners and agencies.
Loss of strategic capacity and complexity of changesTwo major barriers to developing long-term and substantial strategies to deliver savings and improve services were identified. First, there is the loss of strategic capacity within authorities. Our 2013 reports discussed the views of senior council officers on the impact of such measures, identifying some concerns about the hidden cost of reductions to senior staff as well as internal reorganisations in relation to strategic capacity. This theme was revisited in the final set of consultations with senior officers, and was raised most vociferously by those based in the English councils. A sense of frustration was evident that “a diminishing pool of capacity” was undermining the ability of senior staff to do “what we all know we need to do” – in particular to devise “new models, new ways of working, spot the genuinely transformative ideas and scale them up”. Another suggested that local government needed “headroom, to allow the new conversations to play out – what services do we need, what are the models for providing them?”
Second, in addition to austerity, some officers also expressed the view that in the wider policy environment “there is too much complexity and change… too many unknown unknowns”. For one senior officer, national legislative change – even welcome change, such as the Care Act 2014 – was putting “capacity under strain”: “these are good things to do, but to try and manage that level of change at the same time as budget cuts – that’s the problem”. Another emphasised the uncertainty created by the annual nature of announcements from central government to councils about their exact level of grant, while councils themselves were moving to three-year budgetary cycles in a deliberate attempt to plan more strategically. Finally, whereas senior officers in England welcomed the fact that some resources had been provided via various central government departments to support the integration and transformation agendas, there was a view that these would be more effective if streamlined and pooled.
Pace of change and uneven capacities In relation to retrenchment strategies in particular, two main concerns were expressed. The first was the pace of change. There was a view that the pace as well as the scale of cuts militated against councils taking a more considered, analytical view of “what the community could reasonably be expected to take on, and what the council should ideally continue to do”. There was evidence that steps were beginning to be taken to develop community capacity in these respects. In Coventry, “conversations at community level” were under way, designed to foster understanding of “just how profound the changes on the way are” and of the need for local people to think about how to respond and what contribution they could make. In Newcastle, one budget proposal for the 2015/16 round involves refocusing council-led community empowerment activity on developing the capacity of local bodies to take on more responsibility for the local environment.
However, there was a clear sense of significant challenges and constraints in delivering the scale of citizen responsibility required to seamlessly fill the gaps left by retractions in council services. While a range of senior officers identified specific examples where citizens had come forward as individuals or as collectives to get involved in services, there was a sense that the space between what citizens could do and what councils still had the capacity to do had opened up more rapidly than some had expected. The time and financial resources that could be marshalled to close this space were “not as much as

44The cost of the cuts: the impact on local government and poorer communities
we’d like, of course they’re not”. Second, there was concern about inequalities between communities in
their ability to respond to retrenchment by taking on roles as providers. It was felt that these differences were being masked at present by past investments in community capacity-building. Differential capacities by socio-economic deprivation “were not as evident as you might expect”, according to one officer, because capacity-building activities funded under the neighbourhood renewal programmes of the previous government had been focused on more disadvantaged localities. As current community development activities had generally been scaled right back, concern was expressed about “what happens when this runs dry, with the next generation?”. There was also concern that the intensification of need in some localities might impinge on the appetite of residents to take on these new responsibilities: “when it’s about food, about just surviving day to day, why would you want to take all this on too?”
Differences between Scotland and England
In this last section, we focus on the differences between Scotland and England noted earlier in the chapter. The key question is how Renfrewshire managed to fund the scale of investment spend summarised in Table 5 above.
According to senior officers within Renfrewshire, investment of this scale has been possible because of the slower pace of grant cuts in Scotland compared with England. This has provided the council with an opportunity to deliver as a senior finance officer indicated “the savings that it requires over the medium term quicker than it necessarily needed to in order to merely balance the budget year on year” (emphasis added). By doing so, it can create capacity each year to redirect more resources to prevention-orientated priorities such as those identified earlier.
While Renfrewshire Council has had access to co-funding from a number of sources, its own resources have still made up the bulk of the investment. Figure 17 shows the total funds by stream. The council contributes the majority of the investment funding for employability initiatives, providing 85% in 2012/13 and 94% in 2014/15. The rest is from wider EU funding streams. For early years investment, the council’s contribution rises from 56% to 76% by 2014/15. The total investment for older adult services over the three years has been £3.15m with the council contributing £0.6m in both 2012/13 and 2013/14. In 2014/15 the council’s investment increased to £0.9m as the funds from an NHS top-slice were reduced.
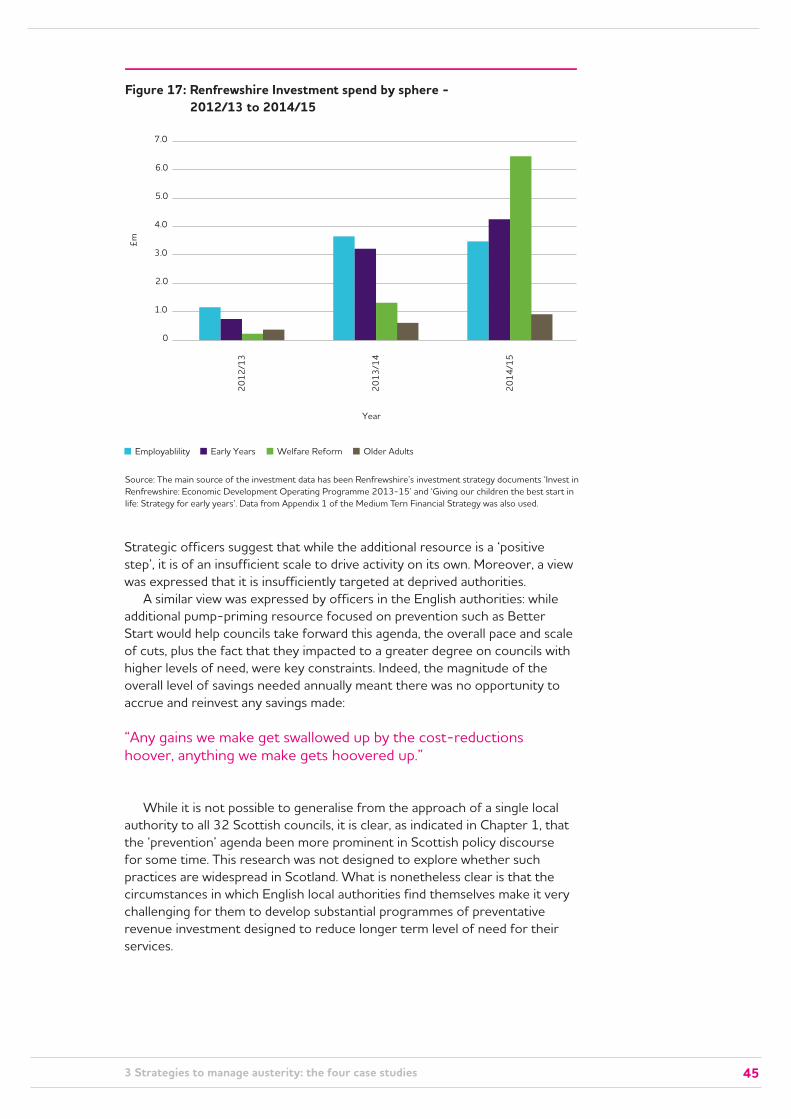
453 Strategies to manage austerity: the four case studies
Figure 17: Renfrewshire Investment spend by sphere - 2012/13 to 2014/15
Source: The main source of the investment data has been Renfrewshire’s investment strategy documents ‘Invest inRenfrewshire: Economic Development Operating Programme 2013-15’ and ‘Giving our children the best start in life: Strategy for early years’. Data from Appendix 1 of the Medium Tern Financial Strategy was also used.
1.0
3.0
4.0
7.0£m
Year
6.0
5.0
2.0
0
Employablility Early Years Welfare Reform
2012
/13
2013
/14
2014
/15
Older Adults
Strategic officers suggest that while the additional resource is a ‘positive step’, it is of an insufficient scale to drive activity on its own. Moreover, a view was expressed that it is insufficiently targeted at deprived authorities.
A similar view was expressed by officers in the English authorities: while additional pump-priming resource focused on prevention such as Better Start would help councils take forward this agenda, the overall pace and scale of cuts, plus the fact that they impacted to a greater degree on councils with higher levels of need, were key constraints. Indeed, the magnitude of the overall level of savings needed annually meant there was no opportunity to accrue and reinvest any savings made:
“Any gains we make get swallowed up by the cost-reductions hoover, anything we make gets hoovered up.”
While it is not possible to generalise from the approach of a single local authority to all 32 Scottish councils, it is clear, as indicated in Chapter 1, that the ‘prevention’ agenda been more prominent in Scottish policy discourse for some time. This research was not designed to explore whether such practices are widespread in Scotland. What is nonetheless clear is that the circumstances in which English local authorities find themselves make it very challenging for them to develop substantial programmes of preventative revenue investment designed to reduce longer term level of need for their services.

46The cost of the cuts: the impact on local government and poorer communities
Concluding reflections
The challenges facing the case study councils are severe, as funding and cost pressures have combined to produce budget gaps of between 7% and 11% each year for a period of five years. All four councils have not only made the savings required to close these gaps, but have also demonstrated considerable dexterity as they have tried to find ways of delivering savings in a manner that minimises the effects on services. They continue to cope and indeed innovate.
Some may view this as evidence that austerity is ‘working’ – it is driving change within local government. However, the evidence from the case studies is that councils were attempting to develop more effective and efficient ways of working prior to austerity. Our view is that, whilst austerity has undoubtedly catalysed a creative rethinking and reshaping of local government, there is a danger that not all of this change will deliver real benefits over the long term. The pace and scale of central government cuts have undoubtedly reduced the time and the resources available to develop the optimal solutions needed to deliver both sustained improvement and reduced costs over the long term. Indeed, the conditions under which solutions to austerity and public sector reform are being generated must increase the risk that innovation does not deliver the expected benefits. Moreover, as the following chapters show, despite the best efforts of the senior players in the case study councils, the effectiveness of some front-line services is being compromised as they attempt to ‘square’ a most challenging circle.
Of course, senior players in local government know that there is worse to come. It is inevitable that councils will increasingly be forced to manage austerity via retrenchments rather than efficiencies. A key question is via what kinds of retrenchment? Those that reduce and withdraw valued services, or those that reduce council costs but yet find alternative ways to deliver services and protect outcomes? There is a real danger that the cumulative impacts of year-on-year budget gaps of the scale noted for the case studies reduce the scope for the former and make the latter much more likely. Moreover, the constraints on preventative activity – particularly in England – mean that levels of need and demand will continue to grow as services shrink.
Finally, it is important to recall that this study has focused on the efforts of four councils, and that these volunteered to take part and to open up their budgets and strategies to scrutiny. The resilience evidenced by these willing volunteers may not – indeed, we would suggest, cannot – be replicated across the sector. The scale of cuts to local government budgets planned but not yet implemented must pose a significant threat to the viability of some councils.

47
4 THE COST OF THE CUTS: THE VIEW FROM SERVICE USERS
Introduction
Chapter 3 explored how our four case study councils have made savings in order to balance their budgets. This chapter begins to look at the impacts of these changes by examining the views of service users in the general public. The key question here is, do service users feel that services have deteriorated and, if so, in which service areas do they most notice the impacts of savings?
To date, survey evidence has suggested a slight fall in the level of public satisfaction with English local authorities between 2012 and 2014 as well as a plateauing of satisfaction in Scotland since 2009 (as reviewed in Chapter 2). However, there has not been the sharp decline that we might have expected given the scale of the cuts. Some have interpreted this as indicating that services have not been missed or that local authority spending was misdirected. Alternatively, it may be that the broad-brush questions asked in surveys may not be good at picking up on the very varied patterns of change.
This chapter therefore reports on detailed, qualitative evidence of individual perceptions and experience of changes to services. The evidence comes from focus groups convened in each case study area9 and from in-depth, follow-on interviews with selected participants designed to draw out more detailed testimony on the impact of the cuts on themselves, their family and wider neighbourhood. Fifty-nine service users participated in the research. In most cases, research participants were parents living with at least one child from toddlers to young people. At times, we also bring in evidence from interviews with voluntary sector organisations to corroborate service users’ views, although Chapter 6 presents this more fully.
The decision to focus on parents was made because it was expected that this group would have experienced change in relation to services that both they and their children used. It was hoped that this group would be able to reflect on changes to services for older people which might affect their own parents or other older relatives or friends. However, only a few of the participants were in this position, so an additional focus group specifically with older people was convened in one of the case studies to provide some additional illustrative evidence on this issue.

48The cost of the cuts: the impact on local government and poorer communities
In three of the four case study councils, one focus group was convened with people living in a severely disadvantaged neighbourhood and a second in a neighbourhood with towards average levels of deprivation. This was to capture whether there were distinctive experiences of cuts according to levels of neighbourhood disadvantage. Appendix D in Hastings et al 2015 gives more detail on the characteristics of service-user participants and the neighbourhoods they were drawn from, as well as the conduct of the focus groups and follow-on interviews.
Changes to services in four spheres dominated the discussions:
• The earliest and most prominent change service users perceived was with respect to services that affect neighbourhood environmental quality. A key concern was that levels of cleanliness and maintenance had deteriorated. Part A examines the impact of this on service users.
• Services for children and young people were considered to have been significantly affected. These issues are the focus of Part B.
• Part C explores results in relation to some other services, notably libraries and leisure, and housing, adult social work and social care.
• Some service users were concerned about access to services, linked both to problems with mobility across the city and with the centralisation of services. Others were experiencing difficulties in contacting council staff and finding council services busier. These areas of concern are the focus of Part D.
The chapter is concerned with the ‘costs’ to service users of the austerity strategies implemented by the councils, particularly the different means used to achieve savings under the investment, efficiency and retrenchment strategies (see Chapter 3 for definitions). Service users tend not to think in terms of strategies but in terms of services that affect their lives, and the chapter is structured to reflect this. Nevertheless, we can compare the services where they note changes with the analysis of savings discussed in Chapter 3. It is clear that, in the vast majority of cases, the services noted by users as having deteriorated are those that had been targeted for retrenchment, although participants did also notice busier offices and more staff under stress, which may be the result of efficiency measures.
There is some discussion in this chapter of whether service changes are experienced differently according to levels of neighbourhood deprivation. More detailed discussion of whether and how poorer groups and places experience additional or disproportionate impacts as a consequence of austerity measures is reserved for Chapter 7.
Part A. Services focused on neighbourhood environmental quality
It was in this sphere that perhaps the most substantial as well as the earliest impacts were being felt by service users. As Chapter 3 indicated, reductions or reconfigurations of services such as street cleansing and parks or grounds maintenance were a key feature of the strategies to manage austerity in all four case study councils. In two councils, the level of street lighting had also been reduced. While the cleanliness of streets and parks and the maintenance of roads are perennial issues in feedback on council services there is evidence from earlier research that increased levels of investment in and monitoring of environmental cleanliness had led to improved outcomes

494 The cost of the cuts: the view from service users
in many places during the latter part of the 2000s (Hastings et al, 2009). It was clear from this study however that service users felt that the quality of these services had deteriorated notably under austerity. Furthermore, their evidence illustrates the wider and less obvious consequences of these cuts.
Parks, playgrounds and open spacesResearch participants expressed the greatest degree of concern over this element of neighbourhood environmental quality, especially those living in the more disadvantaged neighbourhoods. In particular, some less formal green spaces around houses – more common in areas of social than private housing – were described as problematic or “filthy dirty” with “rubbish, old carpets, mattresses, all covered in filth, glass smashed, motorbikes…”. And the spaces used by children and young people were a concern for parents in all councils. Whereas they generally considered larger, more central parks to be well maintained, there was concern about smaller parks:
“It used to be good. You could take the kids for picnics. Then they stopped cutting the grass and taking care of it so people couldn’t use it anymore.” Service user, disadvantaged neighbourhood
And while some playgrounds were judged to be “good quality” and “satisfactory” in terms of their cleanliness, significant concerns about others were raised in all councils. One participant indicated:
“You daren’t take your eyes off the kids for a second in the playground, there’s beer cans full of God knows what.” Service user, disadvantaged neighbourhood
The impact on service users of reduced environmental maintenance regimes in parks, playgrounds and open spaces was also noted by research participants from voluntary organisations, particularly those providing play and youth services in neighbourhood parks.
There was also a view that public spaces were becoming less well-managed because of reductions in community wardens. One individual suggested that as a consequence “gangs of kids” were colonising a local park, while another spoke of “feeling intimidated” when she went to the park with her young children because of young people hanging out, and reported that she felt vulnerable without wardens because “there’s no one to tell if you see something going on”.
Finally, participants in a focus group with older people were concerned that maintenance of trees, bushes and hedges had been reduced: “you can’t see round some corners.” Indeed, in this council, housing and home-care staff who worked with the elderly were concerned that overgrown bushes could make it difficult for some to negotiate footpaths, and even affected their homes:
“Homes are becoming dark because there’s this [vegetation] overwhelming the windows, and then when services do go in, say the home carers, they’re at risk because they’re going in through the night, up to 11 o’clock at night with torches, and they can’t even get to the front doors because they’re overgrown…” Home-care services provider

50The cost of the cuts: the impact on local government and poorer communities
Neighbourhood cleanliness Perhaps surprisingly, given the reductions in staffing and frequency in ‘street-scene’ services indicated in Chapter 3, the cleanliness of the streets was not routinely volunteered as a major concern by service users. Some noted that frequencies appeared to have reduced, that there appeared to be less coordination between waste collection and street cleansing and that they saw street sweepers less often. As one service user in a disadvantaged neighbourhood said: “I don’t know the last time I saw them”.
What was more apparent was a more general sense that environmental quality was getting worse:
“[This area] is going downhill. The council know it’s going downhill but can’t be bothered to do anything about it. It makes you want to sell up, to move.” Service user, disadvantaged neighbourhood
Participants had noticed differences emerging between the cleanliness regimes and standards of city centres and residential neighbourhoods. There was also a sense from participants in some disadvantaged neighbourhoods that the latter areas in particular had been “forgotten” or “abandoned” – “some estates are just left to rot” – while the council prioritised more advantaged parts of the city:
“They focus attention on the prettier, newer places to attract people in.” Service user, disadvantaged neighbourhood
In two case studies, domestic waste collection had moved to a fortnightly service. In one focus group there was discussion of how this change was “proving a struggle for some with large families” or for households with little suitable storage space. However, the introduction of charges for the removal of bulky items was much more controversial. Participants from disadvantaged neighbourhoods tended to note an increase in fly-tipping, and in one in particular it appeared a significant concern. One described how people avoided charges by dumping items away from their own ‘patch’:
“In the middle of the night… I’ll see people dragging their rubbish from one part of the street to the other because they’re not paying for anything… It just stays there for weeks on end and it’s really unhealthy.” Service user, disadvantaged neighbourhood
There was some awareness of a shift in the relative responsibilities of service users and council staff, with participants noting that fly-tipped rubbish would not be removed as reliably as previously, with councils aiming to tackle problems using notices, fines and community ‘clear-ups’.
In three councils, service users identified greater problems with vermin. In one where there had been reductions in council-run pest control, a rat problem appeared quite extreme. In a focus group with young parents, three participants talked in detail about their experiences. One suggested that it was not until she complained to the social work department (rather than to environmental health) about “proper nasty rats coming into the kitchen” that someone came to deal with them. Another who reported still having rats in her back garden spoke about the impact that this had on her and her family:

514 The cost of the cuts: the view from service users
“I’ve stopped going into the garden. I won’t let my daughter out there.” Service user, disadvantaged neighbourhood
Maintenance of roads, pavements and lightingIn all the case studies, there was discussion of the fabric of roads, and to a lesser extent pavements. In three of the councils, participants felt that, over the past few years, repairs to roads were not as frequent as they once were, and that “a quick patch” was more common. This was seen as a direct result of financial constraint:
“Five years ago they tarmaced half the road, they ran out of money when they got to the five houses at the bottom and they had a sink hole and after many years of phoning, complaining, emailing, it eventually got fixed last year but that was after about five years, to getting it actually repaired but the council did say that they’d ran out of money.” Service user, less disadvantaged neighbourhood
In parallel with the concern that city-centre cleanliness regimes were being maintained at the expense of those in residential areas, there was also a view that investment in roads was focused on those that were used by visitors and businesses.
Others were more concerned about the condition of pavements, including older service users. One, from a disadvantaged area, reported that: “the streets are absolutely dreadful… it’s like they’ve forgotten [this area]”. However, a focus group with parents in a less disadvantaged neighbourhood also suggested a significant degree of concern about pavements near the local primary school:
“My eight-year-old son is away to school with a sore ankle now because he went over it on the pavement this morning because there’s absolute holes. Even the school have put complaints in.” Service user, less disadvantaged neighbourhood
Participants living in the two councils where street lighting had been reduced routinely volunteered that they considered the reductions to be a problem:
“It’s like being in the middle of the sticks ain’t it? It’s that dark, you know – it’s really eerie.” Service user, less disadvantaged neighbourhood

52The cost of the cuts: the impact on local government and poorer communities
While car drivers suggested that driving in their city had become more challenging as a result of lighting reductions, it was those participants used to walking in their neighbourhood who appeared to be affected to the greatest degree. A number told of how they had adjusted walking routes, taking detours to avoid roads that were now more poorly lit. For others, reduced lighting meant more restricted routines. Participants indicated that they would no longer go out after dark, with one describing how, after she had collected her children from school: “that’s it – I generally stay in and that’s me in until the next day”. Another suggested that her children’s lives were also becoming more circumscribed:
“When the children do activities I pick them up because I won’t let them walk home on their own but if I can avoid having to go out I will.” Service user, less disadvantaged neighbourhood
Part B. Services focused on children and young people
Out-of-school activitiesService users had also begun to notice changes and reductions to services for children and young people, particularly in terms of out-of-school activities and the effects of restructuring of services in children’s centres in the English case studies. There was also some mixed evidence on specialist social work interventions focused on children.
“If you have teenage children, I don’t know how you deal with it. I don’t know where they go.” Service user, disadvantaged neighbourhood
There was a strong sense that research participants were concerned that activities for children such as after-school and holiday clubs, and play centres and youth clubs were reducing, and that information about those that remained was harder to find:
“There’s very little down here [and] only one place that offers youth provision. There’s nowhere else ‘cos the two places have been closed down so particularly for 8 to 11 year-olds there is nothing other than to hang around on the streets.” Service user, disadvantaged neighbourhood
Some suggested that they had witnessed an increase in vandalism as a consequence: “because when they’re hanging around there’s more chance of them getting into trouble”. In one focus group in a disadvantaged neighbourhood, the effects on young people rather than on the neighbourhood were highlighted. The closure of a community centre meant that not only was there was less to do but also, in the view of one participant, such action: “limits their lives”. These parents were reluctant to let their children out “without a focus… they’d get up to all sorts”. The result was clear: “they’re stuck at home playing PlayStation”.

534 The cost of the cuts: the view from service users
The affordability of provision was also a key issue. It was clear that council-run activities were valued as an important alternative to commercial options, which were often too expensive:
“If I was to try and take them to soft play… for two hours you’re talking like £30 for two hours just for two children. So actually [the council service] was… a kind of cheaper option for doing something every day.” Service user, less disadvantaged neighbourhood
In one council area, all of our voluntary-sector participants were strongly of the view that young people were particularly affected by cuts. They noted the scaling back of youth provision as well as play and holiday activities, plus increased charges at leisure centres.
Children’s centresA number of the focus groups convened with service users took place in children’s centres, which were developed initially via the Sure Start initiative to provide targeted, early intervention services focused on parenting and child development before expanding to provide a broader range of universal childcare and other family-orientated services. In all three English case studies, very significant changes were under way or planned for children’s centres. One council had begun redesigning its centres and services in 2012, and at the time of writing was developing plans likely to lead to the existing 18 centres being consolidated into five ‘super hubs’ over the next three years. Another had rationalised services across ‘clusters’ of centres, meaning a more limited set of services was now provided from any one centre. The third had reduced city-wide provision of the Sure Start element of services in 2013/14, and was in the process of developing plans to target centres and services much more substantially in order to generate further savings.
Participants offered rich insights into the value they got from children’s centres, as well as concerns over future changes. The centres were clearly central to the lives of many of the parents who used them. For some, they provided access to affordable childcare, cheap activities and trips, as well as respite from their children. Service users from more disadvantaged or challenged backgrounds and circumstances appeared to find them transformational in a number of cases. Several parents were quite expansive in their description of how their children had benefited. Some emphasised the range of activities which they suggested were “broadening their imaginations and creativity”:
“He’s alive because of this place. The stories he tells me… He is like a sponge. It is all about learning... He would probably be at home all the time otherwise.” Service user, disadvantaged neighbourhood
Others noted how “children’s behaviours improve”, how they are more “independent” and ready to go on to school or nursery. One parent described how her older child, who had not been brought to a children’s centre, has had difficulties at school. However, her younger child attends the centre and has received speech and language support as a consequence:

54The cost of the cuts: the impact on local government and poorer communities
“We wouldn’t have picked it up… He’s really come on and he’s had a head start.” Service user, disadvantaged neighbourhood
For many, centres were a source of friendship, connecting isolated parents to each other. One parent described how if the centre wasn’t there: “I’d be stuck in my flat on my own, wallowing in self-pity”. Another said: “Without this place I’m in 24–7 with them on my own.” This participant also described how she attended a nurturing course and the value she got from it:
“We listen to everyone’s situations and learn about techniques for dealing with behaviour, rather than getting stressed out… I would have gone to pot otherwise.” Service user, disadvantaged neighbourhood
It was evident that some parents received an intensive level of support from the centres. This might be practical help to manage a crisis, from food-bank vouchers to assistance in finding a new washing machine, or purchasing baby clothes. It was the emotional support received that seemed most important however:
“They are always at the end of the phone. The amount of times I’ve rung them up and just gone ‘Waah’ [makes crying sound] down the phone and they never send you away. They’re always there to help you with everything. It doesn’t matter what it is, if they can help you, they’ll help you with it.” Service user, disadvantaged neighbourhood
“If I don’t come for a few weeks they’ll ring me up and make sure everything’s ok.” Service user, disadvantaged neighbourhood
What was striking was that a number of participants recognised that the support they derived from centre was a form of ‘early intervention’:
“And one important thing I’d say is like when it comes to social services this centre provides de-escalation from it. If a family is having problems and we come here with it first and they help us deal with it, it can actually stop a lot of referrals to social services as well.” Service user, disadvantaged neighbourhood
Box 4.1 recounts a conversation in a focus group in a disadvantaged neighbourhood on this theme.

554 The cost of the cuts: the view from service users
Box 4.1: What if there were no children’s centre?
Facilitator: What if you didn’t have the children’s centre? What are the alternatives?Stacy: Lots of social service referrals, I’d say.Jacqui: More parents would be depressed, more parents on anti-depressants.Carol: Well, someone else would have to pick up the pieces that we parents come here for.Fiona: I think health visitors and other resources would be used more. Again that’s the budget isn’t it?Stacy: The amount of times I would have fallen apart if it weren’t for this lot.Facilitator: And the children themselves, what would they do? Carol: Probably most of them would be stuck at home every day, nowhere to go. Fiona: We wouldn’t have a safe place to go with our children.
While some service users had not noticed significant changes to services within centres, others had. As one from a less disadvantaged neighbourhood indicated: “They’re good, but I think their budgets are far too stretched”. Reductions in the childcare element of provision in one centre meant that users were unable to access other services. Cancelled sessions because of staff shortages were also noted, while one participant described how the toddler sessions she attends had become more crowded, with parents competing to arrive early to ensure entry. Staff turnover appeared to be an issue in one centre. Parents highlighted the problems this created:
“For us, we like security and stability when we bring our children here. We make bonds and relationships with the staff but suddenly due to the costs the staff have to either move away or go to different places and we feel like it’s a matter of trust as well. When we come here we trust the people who are here and when they suddenly have to go…” Service user, disadvantaged neighbourhood
Centre users in one council had noticed a scaling back of services over a number of years:
“My second youngest is six now and even when he was growing up there was a few more things than what there is now but nowhere near to what there was previously.” Service user, less disadvantaged neighbourhood
The withdrawal of specialist services from some centres was mentioned by a small number of participants, including the centralisation of speech therapy, as well as the withdrawal of Sure Start workers:
“Are they actually saving money? We used to have Sure Start workers here and they would recognise children’s learning needs early on, but not now. So, there is a lack of early intervention.” Service user, less disadvantaged neighbourhood

56The cost of the cuts: the impact on local government and poorer communities
Participants from voluntary organisations viewed the changes under way with regard to children’s centres with considerable concern and as impacting on the wider community as well as on children. A variety of third-sector organisations have come to use centres to deliver services such as mental health outreach, domestic abuse interventions or money advice. Participants suggested that closures and consolidations would make it difficult to continue delivering such services.
Beyond children’s centres – specialist children’s servicesPerhaps unsurprisingly, there was only limited testimony from service users on services that offer a more intensive intervention in children’s lives. While the evidence is both mixed and illustrative, it does suggest that service users may be beginning to experience such services as increasingly under pressure, a point corroborated by the testimony of service providers which is discussed in Chapter 5.
For example, one participant’s child was on the special needs register and she was very positive about the support provided as well as the educational psychology interventions that her child had received. However, another participant was a foster carer and suggested that this afforded her an overview of this service. She suggested that she had encountered “variability” in the service between schools and in recent years “a dip in the quality of some”.
“The difference between the ways that schools work is amazing. Some schools are not up to date.” Service user, less disadvantaged neighbourhood
Another participant’s child received speech therapy, and she thought she had noticed a reduction in service in recent months:
“They’re very, very busy. Appointments have to be made one month in advance and then you can’t change it.” Service user, disadvantaged neighbourhood
She also described how previously the therapist had come to the nursery: “they were there for an hour, hour and a half playing with him.” But now she had to go to a central office with her son.
Finally and importantly, one participant had a young son with mental health issues. She described difficulties in accessing support for him, giving an example of a recent crisis point:
“Last week he had threatened he was going to harm himself, one person was telling me to go to another person and I’ve still not heard anything from who was going to help him… it was horrible, I just sat there and thought what do I do? Where do I ring? Who can help? But there’s no one that you can directly go to. I know for me I can ring as an adult but for a child there’s nothing.” Service user, less disadvantaged neighbourhood
This example of a participant being passed between services is corroborated by the testimony of council staff in Chapter 5. They expressed these concerns in relation to a range of services including those supporting

574 The cost of the cuts: the view from service users
mental health and suggested that staffing reductions and other financial pressures are fuelling the fragmentation of services.
Part C. Other services
Libraries and leisure Across the councils, libraries were clearly highly valued: for books, internet access and as a source of free entertainment for children. There was both awareness of, and concern about, the closures and consolidations of libraries which have formed part of retrenchment and redesign of services across the case studies. Participants suggested that this would impact most on children who required internet access, with one stating that she took her children to the local library every day to do their homework. In one neighbourhood, the loss of a dedicated children’s area in their library was highlighted by participants – leading, it was said, to tensions between users.
However, changes to library opening hours appeared to have had a bigger impact. The loss of a service on particular evening could affect on a working parent’s capacity to use the service. In one council, where local communities had been encouraged to take over particular libraries, participants reported that their local library had severely curtailed its opening hours since being run by volunteers. In another, it was reported that they felt there were fewer staff working in the library, leading to longer queues:
“You can stand in a long line… There’s always been a long line, but it’s getting longer.” Service user, disadvantaged neighbourhood
One participant was struck by the increasing use of volunteers, suggesting that, as they were generally older, they might be unable to answer queries about the information technology. Another participant had noticed that special sessions – such as toddler storytime – appeared to be funded by a donation box in the library.
While participants clearly valued the internet access afforded to them in libraries, there were a small number of comments which suggested that there was not enough capacity to meet demand in some places. In one case study, there seemed to be agreement that computers in libraries were getting busier, with one participant suggesting that usage quotas had been reduced to cope. In this council, participants noted a reduced timetable of activities aimed at toddlers in the last two years.
There were mixed views across the case studies on the quality and accessibility of leisure facilities. In one case study, participants from the less disadvantaged neighbourhood were generally positive: “sport’s really good around here, there’s quite a lot on offer’. However, participants in the more disadvantaged neighbourhood complained about the lack of a local pool and the cost of travel to the nearest facility.

58The cost of the cuts: the impact on local government and poorer communities
Some participants had experienced deteriorations in the quality of leisure facilities. One felt that cleanliness standards in her pool had declined: “It’s not as clean, more crowded, not as well equipped”. As a result, she now took her children to a facility in a neighbouring area. There was a strong level of awareness of plans to transfer facilities to commercial or third-sector organisations and a commonly expressed view was that facilities were being run down in anticipation of this. Discount schemes for leisure facilities were also strongly valued. In two councils, participants mentioned a tightening up of the criteria around free sessions. In one, free swims for young people aged under 16 had been withdrawn, while in another the number of free sessions had been reduced. There were also examples of where opening hours had changed, which didn’t suit some participants:
“I would happily go swimming every night once my children have gone to bed but it shuts at four so by the time my husband gets home from work I can’t go.” Service user, disadvantaged neighbourhood
Housing, adult social work and social careOnly a minority of research participants had direct experience social work and social care, although there was more extensive experience of housing services. Again the evidence was mixed, although social work and social care tended to be viewed as under less stress and subject to fewer changes than services associated with council-run housing services.
In relation to housing, there was concern from older residents in one focus group about the reductions in residential wardens in sheltered housing: “There is an alarm but it’s not the same.” There were suggestions that the maintenance of council housing had reduced and there were delays with repairs, but service users were generally more exercised by the challenges they experienced in accessing social housing rather than its quality, although significant concerns were expressed about housing quality within the private rented sector.
Only a few participants had contacted staff at housing offices. One spoke in fairly positive terms about her local housing office: “The staff are polite and there’s never really any queues”. However, she had recently had cause to visit a central office to register as homeless and this had been an unhappy experience: “it’s absolutely heaving”. This experience was echoed by participants in another case study, where it appeared that a central office was under severe strain. One told of a frustrating wait to be seen: “you have to allow all day to sit in the council office. There’s not enough staff to cope”. She said that there was no apology for her wait from staff and described the office as unpleasant: “it was busy, horrible smells, they give you a toy and you don’t want to touch it”.
There were only three participants with direct experience of social care. While they made a number of positive comments on the quality of the care, the friendliness of staff and their gratitude for the help received, each also had a more negative story to tell.
One had been discharged from hospital after a fall and received care from the re-ablement service for a period of six weeks. During this time there were periods of both stability and instability: In one period:
“There was a few different carers, no continuity, this carer today, another one the next morning.” Older service user

594 The cost of the cuts: the view from service users
Sometimes there were problems with meals: “One day I waited for my breakfast until 11.30 and then they brought me my dinner at 3.30”. A second – who also encountered the service after a hospital discharge – felt that the only equipment she was offered to aid her mobility at home was items that did not require installation, as this saved staff time. The third discussed her experience of helping someone who was released from hospital in one county and needed home-care in another:
“Getting them to tie up with each other was impossible. You have to go through all of the administrative services yourself, you don’t get much help. To be honest, they expect too much, and there’s not always a partner at home to sort out the problem, it’s hard work.” Older service user
Another participant discussed the experience of elderly relatives of using council-run care. One relative received care from a private contractor and had 15-minute appointments, which she thought to be inadequate. She also talked of another relative who had had a stroke, and was told he was not eligible to receive funding for care at home. “Two or three years ago he might have been”. She told of how the individual’s care needs were largely met by a friend: “My friend has to do everything for him. I know they’ve complained that they can’t cope”.
Finally, in relation to social work, some of the young parents using the children’s centres had support from social workers. They had not noticed any changes to the amount or level of support they received, although there could be some frustrations over the lack of continuity of staff:
“I think [the social workers] are actually ok. It’s just annoying when you have to kind of explain yourself again and again.” Older service user
However, one had experienced reductions in services geared towards mental health, mentioning an art therapy group she had to leave when membership become more tightly rationed.
Part D. Mobility, access and contact
The final part of this chapter discusses issues identified by service users with respect to moving around the city and how changes to council services were impacting on this. It also identifies concerns over accessing council services – physically as well as remotely.
Parking and public transport One of the ways in which councils are attempting to tackle budget gaps is by increasing charges to service users. In one case study in particular, service users were concerned about increases in parking charges as well as new restrictions on free parking. One individual indicated that she no longer used the library in the city centre as a result:
“It used to be free… I just buy my books from charity shops now.” Older service user

60The cost of the cuts: the impact on local government and poorer communities
Whilst some participants suggested that increased parking charges had led them to reduce their use of their car, in two case studies participants also felt that the cost of public transport had become prohibitive – in one this was when the council’s contract with local bus companies had been re-tendered and split, leading to the need to buy separate passes. This was a particular issue for younger parents and had led some to leave their homes less often:
“It’s really expensive… so I’m just gonna sit in my house ‘cos I have a little garden… I go out when I absolutely have to.” Younger service user, disadvantaged neighbourhood
“I only go out once a day now. I’ve stopped taking the baby out.” Younger service user, disadvantaged neighbourhood
One spoke of how she no longer took her daughter swimming as it “costs £4.30 to get there”, while another mentioned missing out on a great bargain for nappies: “I thought about the transportation and I thought nah, I’m not going”. A third participant indicated:
“Going anywhere that’s not walking distance is a treat for me. So if I need to go to [shopping area] I wait until I need to hit a few stores. I’ll get a daily bus pass and I’ll do it all in one day.” Younger service user, disadvantaged neighbourhood
The impacts of the withdrawal of subsidised school travel were felt by participants in one focus group. Children were now walking from the neighbourhood to the city centre in order to get a bus to the school. One participant indicated that it was more practical for her children to use taxis, although this caused her additional problems: “you can’t phone up the school and say ‘my child is not coming to school today because I can’t afford a taxi fare’”.
For older participants, affordability was not the issue as they enjoyed free bus passes, although some concern was expressed that this would be maintained:
“We get free bus passes at the moment, we don’t know how long it will last, things change so quickly.” Older service user, disadvantaged neighbourhood
The location of council servicesCase study councils are managing austerity by reducing the number of facilities and offices they provide. Service users did not tend to distinguish between ‘efficiency’ strategies designed to consolidate several services in the one location and ‘retrenchments’ resulting in closure. The accessibility – indeed localness – of specific services was what mattered. This applied to a range of council services including leisure facilities, housing offices and libraries.
Where service users were aware of plans to close or relocate facilities, they were universally concerned about them. More than one participant said that if their local library was closed they wouldn’t use the service at all: “if it wasn’t there I wouldn’t use another one.” This appeared to be a particular issue in relation to children’s centres which, as indicated earlier, were in

614 The cost of the cuts: the view from service users
the process of being closed, clustered and consolidated. In the light of such changes, in one of the focus groups, the facilitator asked: “What if the centre wasn’t here, if you couldn’t walk to it?” One parent was categorical in her answer:
“I wouldn’t come. You need to be here early in the morning… it’s too stressful to get here for a certain time. Getting the bus with three kids – no thanks.” Service user, disadvantaged neighbourhood
This parent had already described how much she valued the centre for her child’s development and the practical and emotional support she had received there. She used the centre every day – one child attended nursery each morning and she also attended Stay and Play with her baby once a week, as well as a nurturing course one afternoon a week. Other participants were of a similar view. Indeed, even a participant who had access to a car said: “it wouldn’t be worth the hassle of travelling” to access services further away.
Experiences of contacting the council As will already be apparent, some research participants had already begun to experience busier offices and longer waits to see staff. This, alongside access issues over the location of consolidated services, suggests that face-to-face contact with council staff was becoming a less straightforward and, on occasion, less pleasant experience for some service users.
However, one way in which the case study councils aimed to manage austerity was by reducing the need for face-to-face contact. Initiatives designed to increase digital interactions and the development of ‘one-number’ call centres and so on had clearly been accelerated by the need to make savings.
Online, digital forms of accessing information and paying bills were generally considered appropriate by service users, with an awareness that this was inevitably the direction of travel:
“Everything is on the internet. If you don’t use the internet, you don’t know.” Service user, disadvantaged neighbourhood
While younger parents generally considered themselves technologically savvy, older people did express concern over this development, particularly for more complex tasks. One, for example, expressed concern about the difficulties accessing housing staff, suggesting that tenants were “expected to sort out their own affairs now”. She told of a family member who had been subject to reductions in housing benefit as a result of the ‘bedroom tax’ and who wishes to downsize. She had been advised that:
“She has to go online herself and find a family with the right kids with right sex and age to swap with… The council won’t do anything to help.” Older service user, disadvantaged neighbourhood
Considerable frustration was expressed about the automated phone systems introduced to manage service user/provider contact in two councils. Some service users had experienced long queues. Some also reported an impression that the loss of face-to-face contact could increase

62The cost of the cuts: the impact on local government and poorer communities
the propensity for callers to be passed between departments. Moreover, service users who were new migrants found that the systems did not always accommodate their accents. Voluntary-sector participants were also aware of this problem, and were also concerned about the impact of such initiatives on more vulnerable groups:
“We are starting to feel that in two to three years’ time we’re going to be about the only place in the city where someone can walk into a building and talk to someone.” Advice services manager, voluntary sector
There were some services that participants suggested required face-to-face discussion, but that this was not easy to access. One described that she had mental health problems, and had been on medication for four months. She had been contacted that week by the social work mental health team to arrange a consultation. However, this initial consultation was to take place over the phone:
“I just received a letter saying I will receive a phone call consultation and I’m like ‘thanks’. I’d actually like to speak to someone and know who I’m speaking to.” Service user, disadvantaged neighbourhood
Concluding reflections
This evidence of this chapter is that service users are experiencing significant change in council services as a result of funding cuts and the strategies the councils have had to devise to manage these. The service user perspective reveals the various costs to services for children and young people in particular. It also suggests an accumulating set of problems related to the quality of residential neighbourhoods.
With regard to environmental quality, there was a sense that some service users were beginning to feel a sense of injustice: they felt that city centres were still kept clean and that the arterial roads used by visitors seemed well maintained. There was also a view expressed by a small number of participants that newer neighbourhoods designed to attract better-off residents could enjoy better amenities.
Occasionally, service users suggested that part of the reason that services were under pressure was due to the fact that councils “wasted money on big projects”, citing some of the major infrastructure redevelopments that the case studies were investing in to deliver growth and reduce levels of need (discussed in Chapter 3). Councils may be wise to try to secure more ‘buy in’ to such agendas, as not all service users will be in a position to understand the connections between infra-structure investment, reducing levels of demand and improving services. Moreover, a few participants also suggested that they were experiencing changed feelings towards their home city as a result of the changes they saw. One younger parent reported how she used to feel proud to come from her home city, but not now:

634 The cost of the cuts: the view from service users
“You see it’s the future of [the city] that worries me… It used to be so cool and I used to feel so proud and excited to be back. It’s just really different now.” Service user, disadvantaged neighbourhood
What is perhaps most striking is that a significant number of the changes made to council services can result in people feeling trapped or isolated in some way. Reductions in street lighting can trap people at home at night and elderly residents can even become trapped in their homes if reduced maintenance of the public realm makes paths and streets less easy to navigate. Children and young people’s lives can become more limited and constrained – they can be isolated at home by the loss of the children’s centre or youth club or by the dirtiness of the playpark, or by the rats in the garden. Similarly, young parents can retreat to the home when public transport costs feel prohibitive or it becomes too hard to get to the library or swimming pool.
Clearly costs such as these might be experienced differently according to individual and neighbourhood levels of deprivation, and Chapter 7 brings this into sharper focus. The next chapter brings a different ‘front-line’ perspective to bear on the costs of the cuts – the experiences of front-line council staff as they both implement and feel the effects of the strategies devised by the case study councils to manage austerity.
64
5 THE COST OF THE CUTS: THE VIEW FROM FRONT-LINE SERVICE PROVIDERS
Introduction
This chapter explores the views and experiences of front-line operational council staff charged with implementing the savings measures described in Chapter 3. It draws on focus groups with service providers in each case study as well as ‘shadowing’ exercises with staff as they went about their roles. Forty-one front-line staff participated, most of whom were front-line officers and operatives, although seven were operational managers. They represented the range of council services that the evidence of Chapter 4 suggested service users were concerned about. Appendix E in the Technical Report (Hastings et al, 2015) provides a detailed picture of the categories of staff and services, as well as discussion of the conduct of the focus groups and shadowing process.
Whilst the structure of Chapter 4 reflected the service spheres of most interest to service users, the structure of this chapter reflects the key elements of the strategic approaches to austerity devised by the case studies. It aims to capture the ‘front-line’ rather than strategic officer perspective on the measures adopted. The focus of the analysis is on the ‘costs’ or negative impacts of these, although any ‘benefits’ or positive impacts that were identified are also highlighted.
• Part A examines the largely negative impacts on the quality of front-line services of a number of the efficiency savings delivered largely through reductions in back-office functions.
• Part B focuses on the difficulties of pursuing service reforms through greater collaborative working or inter-agency integration at a time of rapid cost reduction.
• Part C looks at the views of front-line staff on the direct impacts of service reductions or retrenchment.
• Part D assesses, from the front-line rather than strategic perspective, the prospects for retrenchment savings which assume that citizens will do more to fill the gaps as services are withdrawn.

655 The cost of the cuts: the view from front-line service providers
Together these parts of the chapter cover almost the full range of strategic approaches devised by the councils. The main exception is investment measures as staff had little to say about these. Additionally, the experience of staff in relation to increased ‘targeting’ of services in relation to need is reserved for Chapter 7.
Part A. The hidden costs of back-office efficiency measures for front-line services and staff
In Chapter 3, it was suggested that the scale and nature of efficiency measures might have costs for front-line services, despite the intention that they should not. The evidence from front-line staff was clear: many of these measures were beginning to have real costs. Increasingly, they were also being reinforced by the impacts of retrenchment measures. Both combined to put increasing pressure on the remaining front-line staff. This seemed to be the result of four factors:
• burgeoning workloads• service ‘thinning’ • loss of expertise and ‘de-professionalisation’• reduced staff morale.
Burgeoning workloads
“It was accepted that by reducing jobs, others would have to take on more responsibilities, mop up redundancies [and have their] job descriptions widened.” Children’s services provider
The workloads of front-line staff had expanded for a range of reasons. Efficiency measures in corporate functions had had an impact. Across
the case studies, participants told of increased workloads as a direct result of reductions in corporate services such as finance and HR. Sometimes this was as a consequence of the introduction ‘self-serve’ systems designed to overview pay, annual leave and so on, some of which were thought to be cumbersome. More importantly, it was also a consequence of ‘management delayering’, which had resulted in quite significant financial management, HR and workforce development tasks being passed to operational managers as central functions were pared back.
Other efficiency measures such as the loss of business support roles within many front-line services such as housing and advice had also led to expanded operational workloads. There were numerous examples in relation to social work. Social workers had lost help, for example, with handling diaries and correspondence and with “organising room bookings, typing… case notes and meeting notes”. We were told of child protection teams now sharing their previously bespoke support officers with one or even two other teams.
Whereas the case study councils had initially focused staff reductions on corporate functions, managers and administrative support staff, by the time the research with front-line staff was under way, reductions had also begun in operational roles. As a result, retrenchment in relation to front-line staff was beginning to become apparent (although to a lesser extent in Renfrewshire). A range of service providers suggested that they were

66The cost of the cuts: the impact on local government and poorer communities
becoming “understaffed” in relation to workloads – from social workers specialising in mental health or child development, to housing officers and street cleaners.
In terms of the impacts of increased workloads on services, a range of these were identified by operational staff. Some participants were of the view that service standards were being impaired:
“When we were completely up to capacity you could deliver things of very high quality, on time.” Children’s services provider
In addition, issues raised by service users in relation to long waiting times in offices and on the phone were borne out by the testimony of those providing services. For example, an advice service provider recalled:
“It doesn’t seem too distant a memory where the phone had to be answered in so many rings.” Advice services provider
While a participant located in a local service hub noted that:
“We’ve always had [service level agreements] of being seen within 10 minutes of entering the centre, and now there’s frequently… an hour and half’s wait to be seen by someone at the reception desk to be transferred to somebody else, which is just ridiculous.” Neighbourhood services provider
It was also suggested that the workload demands created by operational staff absorbing functions previously done centrally had reduced the amount of time that staff spent on the ‘public-facing’ side of their service. This was apparent with respect to libraries in two of the case studies. In one, a librarian told of how she now spent very little time with service users. Indeed, she had also passed some of the administrative tasks she had previously done down the chain to library assistants. One such assistant suggested that this meant that half of their time was now spent away from the counter on administrative tasks.
As well noting impaired service quality, a number of participants were concerned about the impact of increased workloads on strategic thinking. A social worker involved in placing children in foster and other forms of care expressed concern that discussions now turn on the relative costs to the council of alternatives:
“I think we are just looking at the here and now rather than the long-term effect it causes. I think there’s too much budget this and budget that.” Social worker for children and families
There was also the suggestion that the capacity to improve services was being undermined, to be “reflective of our practice… to do things better”, in the words of one children’s services provider. It was common to suggest that strategic interventions had been replaced by “fire-fighting”:

675 The cost of the cuts: the view from front-line service providers
“Thinning out of staff [means] we… always seem to be fire-fighting rather than working in a proactive manner.” Housing services provider
Staff also appeared frustrated that they were unable to perform their jobs as they might wish. Some claimed that while they had previously been happy to “go the extra mile” – for example making a phone call on behalf of an elderly client – this was no longer possible:
“You never get that extra mile any more, in [my service] – they don’t go the extra mile, [and in] support services, [they] don’t go the extra mile.” Neighbourhood services provider
A social worker told of how she had helped a mother with depression register with a GP – essentially going beyond her remit. However, she had been told that she should not provide the further assistance she felt the client needed to make sure she attended appointments because “the case load is too much.”
Of most concern, however, was the view that staff losses and increased workloads were leading to gaps in services that could not be filled:
“[We’re] not filling in the gaps. People going off with long-term stress… that’s then causing a knock-on effect, the fact that you’ve not got the officers in the team to support the demand of the work that’s coming in, the fact that there are fewer officers.” Neighbourhood services provider
A social worker specialising in mental health work suggested that staff losses had taken a significant toll on the staff in the service: “If they get any more stretched, you won’t be able to do your job… someone higher up needs to address this as a matter of urgency”.
Service ‘thinning’Staff reductions as well as other efficiency measures such as reductions in councils’ ‘property footprint’ had led to changes in how services were delivered. There was evidence of a very significant rise in lone working in the case studies, sometimes but not always associated with mobile working or ‘hotdesking’. This development was most apparent in libraries, housing, advice and social work services. There were concerns about the impacts on staff who were becoming “isolated and vulnerable” when, for example, operating a drop-in advice service or working alone in a standalone library building.
There was also evidence of effects on services, particularly those provided to more vulnerable groups. In particular, participants identified the loss of the opportunity to consult more experienced colleagues with regard to complex cases: “these types of discussions are more difficult to come by”. One mental health social worker suggested that previously assessments had been conducted in teams, with discussion taking place about a number of cases over the course of a few days. Now assessments are conducted by a sole member of staff, assessing a number of clients in one day, and often in the client’s home, leaving no opportunity to discuss cases with colleagues.
In one case, there was also a suggestion that staff reductions had led to a less holistic mode of service delivery. One home-care service provider,

68The cost of the cuts: the impact on local government and poorer communities
whose service was said to have lost one quarter of its staff, suggested for example:
“rather than provide a holistic approach to care, like person-centred care, where you gave the care, you did the shopping, you did the domestic tasks as well, which was always looked at as the best form of care… that has all disappeared now… All the domestics and all the shopping for clients were put out to private agencies so that had an impact on clients, because some of them couldn’t afford to do that… So now, rather than having the same faces coming in, they’re having all these different people from different private agencies and from ourselves, it can be very confusing.” Home-care services provider
Deskilling and de-professionalisationIn the four councils, the focus of staff reductions on managers, often achieved through voluntary redundancy programmes, had resulted in the loss of more experienced as well as more senior staff. That this meant a “loss of expertise” was mentioned by a number of participants, although one – and only one – expressed the view that some “dead wood” had also been removed in the process.
As well as the concern noted earlier that efficiency measures were leading to a loss of strategic capacity, there were also concerns that the workforce was being deskilled and de-professionalised and that this could have long-term consequences for services. Deskilling was seen as a consequence of specialist staff being asked to do general support roles such as room bookings, reception roles and so on, and was a particular concern for advice staff and some social workers. It could also be perceived as a psychological consequence of the downgrading of some posts. In one council, a council-wide pay rescaling was under way, implemented alongside job re-evaluation. Whilst this had led to some jobs moving to a higher grade, the view of participants was that job re-evaluation had led to many posts being downgraded. For some, this had led to a pay cut of around 10%:
“We were all handed a redundancy notice, but told we could reapply for the new grades, which were a grade lower.”Neighbourhood services provider
However, it is what appears to be an emerging ‘de-professionalisation’ of some services that has the potential to impact most significantly on the quality of services. Library and housing services appeared to be the worst affected:
“We have very, very few professionally qualified librarians left and they are all based behind the scenes.” Library services provider
In this participant’s council, it was said that none of the remaining qualified librarians are involved in front-line work. The result is that those without professional qualifications are asked to do more and have taken on more responsibilities. In a second council:

695 The cost of the cuts: the view from front-line service providers
“the library assistants now are… doing the work that qualified, chartered librarians were doing in the past and (were) being paid maybe three or four grades more (to do)… stock work, finance, planning, dealing with home loan service, dealing with banking money, choosing stock, buying stock, all the things that they were never allowed to do in the old days because it was a professional job, now it’s their work, you know, it’s what they do.”Library services provider
Staff in housing services suggested that roles previously undertaken by professionally trained housing officers were now being done by housing assistants without the same level of training:
“They follow somebody for a week and then off they go.”Housing services provider
That this could diminish service quality and potentially present a risk to the council was suggested:
“I spoke to a lady the other day, gave her some advice as a housing officer, and she said, ‘well, that’s not the advice I was given when I rang up the other day’. But she [had spoken] to a housing assistant who’d given her completely the wrong advice.”Housing services provider
Finally, there were examples where staff identified a risk to services and service users. A children’s services provider was concerned that some of the vulnerable families that her service worked with could be at risk:
“Will we still be able to reach those standards where the families we’re working with are safe?”Children’s services provider
Another was concerned about risks to road users when he was – as he believed – placed in the wrong job when staff reductions led to a restructuring of roles. Box 5.1 recounts his concerns.

70The cost of the cuts: the impact on local government and poorer communities
Box 5.1: The risks of redeploying staff
I’ve been through three restructures in three years. [In one] they made me responsible for road maintenance. And I knew nothing about this, I hated road maintenance, it’s the worst job you can get. [He then detailed the difficulties of dealing with irate members of the public over the condition of roads.]The problem with the restructure has been that you take a risk and you take a job and you don’t necessarily fit in there. And that’s been [the same] for a lot of people. Like where I was, we had six managers, considering we were dealing with quite technical stuff, I think only one of them knew what we were dealing with... I knew nothing about roads, I would never have got the job if you had interviewed me for it, because I knew nothing about it. And my manager, he knew nothing about it. So where’d you go then? Some numpty like me’s come in, and it’s like, ‘out you go and inspect the roads’, well, I don’t know if it’s unsafe. And I went off with stress in that job because it was just untenable, especially when you felt – well I felt – that someone could die one day because I hadn’t filled a pot hole or something, and that was awful, but not having the right management, instead of opening it up as you would normally and getting the best candidate, sometimes it’s well, you’ll slot in and you sit there for two years.
Reduced staff moraleFinally, efficiency measures have clearly affected staff morale and there is evidence that this is also impacting on services. Morale and stress levels were affected by increasing workloads, job re-evaluations and associated insecurity, and changed terms and conditions. That staff were suffering from increased levels of stress was emphasised in the majority of discussions with operational staff:
“The service has changed so much, there’s so much wanted from each employee that, yeah the stress, the stress is causing people to go off [on sick leave].”Housing services provider
“I for one am not sleeping properly and wake up regularly with thoughts of work churning around. It’s not just my own predicament… having just bought my first house, but also as a manager having to prepare my team for those possibilities too. Having to be part of the process that feeds financial information and restructure options upwards to senior managers weighs heavily on my mind.”Environmental services provider
The effects of job insecurity probably had the severest impact on services, particularly in the English case studies. This was evident in a range of services, including libraries, youth work, leisure and children’s centres. Staff reductions in particular roles appeared to be secured routinely by requiring all staff already filling a role to reapply for a reduced number of posts. In some examples, the process had been conducted repeatedly: in one library service the process had been ongoing for two years, while an

715 The cost of the cuts: the view from front-line service providers
advice service provider indicted that: “we had to re-interview for our jobs a few years running”. This created division between staff and increased stress levels:
“Nobody ever says ‘you look well’. Some people say ‘you’re lucky to have a job’, but it’s like yes, you still have a job but you have to step up, you’re constantly being told you have to step up, do more.”Advice service provider
Staff working in roles dealing with vulnerable people were especially challenged not to let their own difficulties become apparent to service users, as the interchange below between children’s centre staff indicates:
Hannah: “All that stress hanging over you… and then trying to provide a service. And for us working with families with young children where it’s like happy, smiley faces all day long, that’s an added pressure isn’t it, because you don’t want the families to experience what’s going on in the office, so you’re having to try double, so the front-line staff do an amazing job, because they do do that.”
Laura: “And when you’re talking… families going into social care, you’re talking attending conferences, and… supporting families really at the highest end of need and support and still being happy, smiley people.”
Changes to terms and conditions could also impact on service provision. In one council, pay enhancements designed to incentivise weekend working had been consolidated into an annual payment. This had led to difficulties in covering unpopular shifts, particularly in home-care services. In a second council, the introduction of a requirement to work weekends in environmental services had led to staff focusing their annual leave on such shifts, leaving services underprovided. However, the impact of changes on staff themselves was not trivial. One example related to the removal of essential car-users allowance across one authority. This was said by participants to have reduced the income of a range of staff such as housing officers and, especially, home-care service providers:
“When you’re only on… grade 3, and you’re expected to keep a car on the road and now all you’re getting is the petrol paid, it’s had a huge impact. Carers are coming back to me and saying they’re losing up to… a couple of hundred pounds a month… I mean, for carers, you can easily do a thousand miles plus a month.”Home-care services provider
There was a sense from some research participants that operational staff were in danger of being exploited by the need to lose posts. While some enjoyed supportive management, others felt they had little option but to accept the changed environment in which they worked:
“You always somehow feel because there aren’t any jobs out there, they’re thinking that we’ll put up with anything really, whatever we’re asked to do.”Neighbourhood services provider

72The cost of the cuts: the impact on local government and poorer communities
“Yeah, we were told by our head, yeah, if you don’t like it, leave. That’s what we were told.”Neighbourhood services provider
While the impacts of reduced staff morale on services is the final factor to be discussed in this section, this is not to imply that it is the least important: indeed, the converse may well be true. The strength of the testimony of front-line council staff is that they have absorbed burgeoning workloads and yet have continued to try to deliver services to a decent standard. Our view is that they are effectively shielding front-line services from the worst impacts of austerity. Front-line staff can be understood as acting as ‘shock absorbers’ for the wider changes under way in the sector and indeed beyond. The evidence is that this is not sustainable.
Part B. Barriers to service reform through integration and collaboration
As Chapter 1 indicated, the austerity measures put in place by the case study councils are being implemented against the backdrop of ongoing efforts at public service reform. Indeed, all the case study councils are aiming to develop cheaper, more efficient services but also services that deliver better outcomes for the individuals and communities they serve. A key aspect of the reform agenda is the ambition that services will be more joined up, both within councils and across a range of public agencies. Here we consider the views of operational staff on how this is unfolding in the context of budget constraint.
It’s not all doom and gloom: getting on with public service reform It was clear that many front-line staff shared the appetite of senior
strategic officers for designing and delivering more effective and integrated services. There was evidence that collaborative working was a feature of many operational services. For example, in one council, collaboration between staff working in children’s centres and those in other agencies was said to be the norm:
“It’s always been the model [in this area], right back from when it started. The area had a huge number of services, we always tried to work alongside… we often work in the same room as another agency. We have multi-agency partnership board meetings… we rely on those partnership arrangements because we couldn’t do the amount of things we do without them.”Children’s services provider
In three of the case studies, the consolidation of a range of council services – such as libraries, housing offices, customer service centres and community centres – into local hubs was viewed as a means to generate savings while improving services:
“One of the benefits… is that you can give advice to people when the customer service side of the building is closed. We’re open till 8 o’clock two nights and every Saturday now, and we can now offer advice to people who come in.”Library services provider

735 The cost of the cuts: the view from front-line service providers
One council had moved service provision for people with learning disabilities into leisure centres. This was said to have allowed this client group to access health and fitness opportunities more readily, and to feel more integrated with clients of other council services. Participants from some social work services also suggested redesigns of services had resulted in some specialist services working more closely together, such as mental health and psychology. There were also suggestions that data-sharing between quite distinct council services such as social work and advice had begun to improve, sometimes catalysed by data-sharing initiatives across public agencies, another key aspect of public service reform.
There were numerous examples of new ways of working being developed which were designed to improve services while making savings. In environmental services, three councils had developed generic roles across grounds maintenance and street cleansing. There were examples of staff working across roles and sometimes professional boundaries in customer service centres:
“I think once everyone’s generically trained on all three divisions then they’ll be able to pick up staff and drop them in position more easily. There won’t be areas that are so thinly served at the moment.”Neighbourhood services provider
Sometimes new ways of working were the result of staff being empowered to reach out to potentially needy clients to avoid the escalation of problems. In one authority an initiative called ‘make every contact count’ had been developed. All staff have cards with details of services and agencies which can be given to service users to point them to any further services they might need. In another, where children’s centres now provided fewer services, staff were employed: “who’ll go out, find people, hand hold, tell them all the services they can go out and access in the city”. Such initiatives were clearly developed with a keen awareness of limited resources:
“We went out into the communities and used a grassed area, didn’t use a building… so we went back to basics so it didn’t cost us a lot of money.”Children’s services provider
Library services appear to undergoing significant change currently, with initiatives under way to develop the ‘future library’ that will attract new generations of readers. While the core of the service remains the provision of books, their role as central information points and providers of internet access has increased in recent years, but has been accelerated as councils have attempted to manage more of the contact it has with service users digitally. Earlier in the chapter, staff reductions and a sense that the service was in danger of being de-professionalised was noted, and Box 5.2 outlines further aspects of the challenges of the current context.

74The cost of the cuts: the impact on local government and poorer communities
Box 5.2: The challenge to deliver ‘future libraries’
“The core of our work is the library service and that’s what we have got to maintain as well as doing everything else.”
1 Wider welfare reformFor library staff, a key issue was their increased involvement in providing IT training and support to the public which appeared to be driven by welfare reform in particular. Members of staff are often providing intensive help to people who need to provide evidence of extensive job-search activity in order to meet the conditions for benefits.We’ve got a lot of people, customers, coming in who need IT support so a huge amount of times can be spent helping people do CVs, make an email account, just very basic stuff they need to do to apply for jobs or show that they’re applying for jobs.
2 ‘Channel shift’ by the councilAt the same time as changes to the welfare system have meant an influx of users requiring IT support, many councils are channelling their services through their websites and phone lines. The move to web-based contact has meant for libraries an increase in demand for internet access and for vulnerable groups an increase in support from staff to help them to access council services.
3 Increase in users with complex needsThe council’s ‘channel shift’ has resulted in library staff working more routinely in a multi-agency way than before, whether this was signposting older people to service provision or working with the police. A driver of this appeared to be an increase in people with complex needs using libraries. In one council, the library service had appointed a member of staff to a police liaison role, while the police service had reciprocated and a regular ‘tasking meeting’ between the library service and police now took place to discuss service users of the libraries.
Barriers to public service reformThe example of libraries given in Box 5.2 suggests that the context in which public service reform is being delivered is complex. The pace of budget cuts appeared to have impinged on the capacity of some councils to train some staff appropriately for new roles. Indeed, a number commented on the speed with which transitions had been made. For example:
“Parks and street cleansing have come together. I’m now doing street cleansing as well, something I’ve never done in my life before… On Friday I stopped being what I was and on Monday I became another creature and that was it.”Environmental services provider
And it was also clear, notwithstanding the positive examples of partnership working mentioned above, that staff were concerned about whether their networks could withstand the various pressures created by

755 The cost of the cuts: the view from front-line service providers
austerity, not least burgeoning workloads. Thus there were a number of examples where staff indicated that networking activity had become more difficult. In one council, children’s centre staff were clear that collaboration with other agencies had diminished, citing as an example the fact that breakfast meetings with health visitors no longer took place: “there used to be an appetite for networking… but there’s none now”.
Of significant concern was evidence in two case studies in particular of increased demarcation between services and the reconstruction of some of the ‘silos’ that had sometimes been a feature of local government professions in previous periods. This fragmentation seemed to be partly attributable to staff losses and restructuring of services as established lines of communication were broken down by staff ‘churn’. This could make it difficult to know:
“who to go to with what query and who to speak to… it’s bumping through the dark to try and find the right person… you used to know exactly where to go and get things done and meet the customer needs as they came in. But now… it’s a bloody nightmare.”Neighbourhood services provider
In the two councils where these concerns were most strongly in evidence, resource constraints appeared to have fuelled the propensity for some staff to define the responsibility of their service more narrowly. Participants told of a number of situations where, if one service became involved, this gave a second service a reason for not contributing. A housing officer recounted how they had tried to get social work involved in a case:
“I was dealing with a hoarder who has a severe community need and I had my concerns and I got social work involved and the professional said that her manager had told them that if housing are involved, they have to take a step back.”Housing services provider
This interchange in a focus group is also telling:
Louise: “They’re so stretched that I think they will not, unless it’s an absolute must, go out to deal with something. So as soon as I mentioned it was somebody over the age of 55, their immediate thing was no, right, fine, they need to see their doctor first. And if you mention violence, no, that’s the police.”
June: “You’ve got [to have] all the key words to refer [a case] to somebody else.”
Craig: “Yeah, to be honest, that’s what I do now.”
One service provider described how they had been so concerned that their social work department had refused to intervene in a case because their own service was already involved that they had formally referred the department as a safeguarding concern:

76The cost of the cuts: the impact on local government and poorer communities
“I had to do a referral about our own council, about the social care team because they weren’t meeting the needs of the tenant and there was neglect… This is what we do all the time.”Neighbourhood services provider
Even in the councils where there was less evidence of demarcation between services, there remained examples suggesting that austerity was driving disputes over ‘turf’ – such as the ownership of a funding bid or allocation of office space. Our view is that the severity of financial constraints (planned as well as already implemented) must inevitably place the ambition to accelerate collaborative working under strain. That it could indeed lead to an increase in fragmentation is suggested by the evidence of this research.
An indication of what a lack of collaborative working might mean in practice is indicated in Box 5.3. This is an edited interchange in one focus group between home-care workers discussing hypothetical cases in relation to what they perceived as a longstanding, intransigent relationship between local hospitals and social care staff. It should be said that at a strategic level the case study councils were acutely aware of the kinds of challenge detailed here.
Box 5.3: Health and social care integration?
Fiona: They come home, they haven’t got their fridge stocked up... they could be coming home to a very cold house, with no food, with no equipment and without the proper care.
Sam: Sometimes we’ll go out at night to assess someone, and it’s like half nine at night, freezing cold, they’re 90 years old, no one’s at home to meet them, they’ve got no food, no heating, they can’t even get to the toilet by themselves.
Fiona: They’ve been sent home by the hospital in a taxi, in their pyjamas, they’re left in a wheelchair in their flat, they can’t even get into bed.
Sam: I have been out many times and sent them back to hospital, phoned the ward and said this is a failed discharge, this person is not safe to be in their home and you need to take them back… they’re short on beds so they’ll fool us into thinking that whoever they want to discharge into our care, that they have minimal needs.
Fiona: Basically, [the hospitals] lie... They say: “this lady’s medically fit to come home”. And I’ll say: “well, have their care needs changed because they used to get one visit a day?”; “No, no, it’s exactly the same.” And we go out [and] they need four visits a day, they need a hoist, they need equipment.
Sam: They might even be end of life, and they’re referring them to [the] enablement team. And they’ll say: “yeah, she might have pancreatic cancer but she’s got anaemia at the moment, so once the iron tablets kick in, she’ll be fine, she’ll be coping independently”, and a week later she’ll be dead.

775 The cost of the cuts: the view from front-line service providers
Finally, and importantly, it is worth highlighting that not only was there evidence that austerity was a constraint on developing new forms of service improvement, but it also seemed to be undermining some well-established forms of best practice. Thus, in one council, social work services had lost specialist ‘link workers’ whose role was to facilitate connections with GP practices with the aim of tackling health inequalities. While as already indicated, outreach work appeared to be energised in some services, it appeared impaired in others. Thus, in one authority, the “halving” of advice staff had led to the withdrawal of outreach services in the two most disadvantaged quarters of the city. Generic working had been reversed in another and staff were deployed in narrower specialist roles on a lower grade. Housing staff clearly felt that they now offered a lower standard of service:
“Each of us did everything in the housing officer role… so you were able to meet the needs.”Housing services provider
There were also numerous examples of staff such as community wardens or housing officers no longer having designated responsibility for a particular ‘patch’. In all the case studies, redesign of street-scene services had led to the dilution of the responsibility of individuals for a particular neighbourhood. A strongly expressed view was that this diluted service standards:
“Sometimes people just get so disheartened you know, it used to be they were responsible for a place and they would keep it clean because they took pride in what they did I suppose and you don’t get that now.”Environmental services provider
The identification of responsibility for an area or patch is part of the wider decentralisation of service provision to local neighbourhoods, and characteristic of best practice for two decades or more. As noted earlier, the consolidation of a broader range of services into hubs – so that they are provided from a smaller number of neighbourhood locations – is a feature of the strategies of the councils and the fact that some council staff thought that this could lead to improved services was identified. Service users were however concerned about access difficulties, as Chapter 4 indicated. This same concern was also voiced by groups of council staff with close working relationships with service users, such as community workers and children’s centre staff. Indeed some front-line staff were of the view that insufficient attention was paid to access questions when closures and consolidations were planned, with one children’s centre worker stating: “there was no real thought of transport or access issues”.
However, there were also examples where decentralised services had simply been moved to city-centre locations – a reversal rather than a modification of decentralisation. Centralisation is discussed in Part C below.

78The cost of the cuts: the impact on local government and poorer communities
Part C. Impacts of service reduction or retrenchment
Chapter 4 reported that service users were experiencing some damaging impacts from the closure of facilities and offices and from reductions in the frequency of services and opening hours. The testimony of operational council staff provides an additional perspective on the impacts of these most obvious service retrenchments.
Reduced facilities and centralisationWhile there were mixed views on the consolidation of a range of services into neighbourhood hubs, there was unanimous concern about the impacts of centralising services into city-centre locations. Centralisation was viewed as damaging to the relationship between staff and the public:
“Once upon a time we were all out on the estate, in the buildings, we were meeting the residents, we had face-to-face contact with them.”Environmental services provider
In two councils, housing services had become more centralised and staff considered this to be detrimental to the service they provided:
Jerry: “We knew what was going on in the estate, we knew where the anti-social behaviour was, we knew where the pockets were, where the residents were causing the problems, where, you know, where the real issues were…”
Joan: “Yeah, especially with a small office, you knew people coming in, you knew where the trouble was... If you hadn’t heard from somebody… Also people liked their own office… they would tell you what was going on in the street. But now… a lot of them can’t even get to the city centre.”
In the past, decentralisation was said to have facilitated working relationships between staff from different departments and, importantly, to have militated against any tendency towards fragmentation:
“You knew what was going on. It was officers like me, at a central point. I mean, I don’t really deal with housing now because it’s too much hassle to come up to central offices… The silos have got bigger now. We’ve gone backwards since I first started in this council in 2006… It’s not like a team like it used to be.”Environmental services provider
Indeed, when this officer and housing staff joined the focus group, they greeted each other with a round of ‘long time, no see’ exchanges.
Moreover, it was not simply that the closure of local offices had reduced the responsiveness of estates-focused staff. The services provided by a broader range of staff had also been affected. A number spoke of being, for example, “relocated into totally inappropriate spaces” and described how this could be detrimental to the nature and quality of service provision. A social worker told how she had previously worked in a drop-in centre in a

795 The cost of the cuts: the view from front-line service providers
local shopping centre, but had been moved to a central council office where she now provided an almost exclusively phone service. Not only does the location of the building “discourage people from coming in”, but the fact that it is an open-plan office means she feels that this is “not an appropriate place” to be discussing sensitive issues.
Reduced opening hours and frequenciesWhile Chapter 4 highlighted service users’ concerns about reduced opening hours in leisure facilities and libraries, front-line staff were generally not as aware as service users of the impact of these changes. One leisure services provider did however provide an example of where reduced opening hours could fuel tensions between different cultural and ethnic communities. Reductions in the evening opening of a local swimming pool meant it was a challenge to provide both the women-only sessions popular with the local Muslim community and sessions open to both men and women across communities:
“Some residents are complaining about these sessions and assume that it is… a minority group getting preferential treatment.”Leisure services provider
The impact of reductions in the frequency of environmental services on neighbourhood amenities was all too apparent to front-line staff. In two councils, operational managers in these services were clear that the standard of service had got much worse and would continue to deteriorate. One noted that a recent survey of neighbourhood cleanliness undertaken by Keep Britain Tidy “makes depressing reading” and there had been a recommendation that the council increase its frequencies. However, the participant was clear that further savings proposals indicated additional reductions in service frequency. Both managers had noticed more complaints from the public about street cleansing:
“There’s been more complaints about street cleansing in the last six months than I think there has been in the last six years.”Environmental services provider
Housing staff also expressed concern about cuts in grounds maintenance, and in one council, about significant reductions in services such as pest control or animal welfare. In Chapter 4, their anxiety was highlighted over how overgrown and undermaintained bushes and trees could affect groups such as elderly people by making footpaths hard to negotiate. However, they were also concerned that reductions in staffing in their own roles was impacting on environmental quality:
“We used to have time to do the estates, you would go round [and] do the estate inspection, and you would check out what was wrong, what was broken and you would sort that out. We haven’t done that now, our estates now look like ghettos. They are embarrassing.” Housing services provider

80The cost of the cuts: the impact on local government and poorer communities
Part D. Barriers to making citizens more responsible
In the three English case studies, a very significant element of their savings strategies involved retrenchment in the form of sharing or passing responsibility to service users either for services or outcomes from services. This involved two main approaches: using volunteers to deliver services; and attempting to encourage as sense of ‘civic responsibility’ among the public.
Using volunteers to fill gapsOne of the most well-known changes to the provision of local
government services has been the use of volunteers, with libraries being the most prominent service using this strategy. It was evident that a number had been saved from closure as local voluntary groups had come together and taken over their running. In one council, two libraries earmarked for closure were now staffed entirely by volunteers and a further four were operating in partnership with agencies such as local colleges and housing organisations. In another, volunteers had been recruited to minimise the impact of lone working.
In contrast with strategic officers, operational staff were not always supportive of the use of volunteering. One library services provider described how a flagship library had been closed and then reopened using volunteers “to the eternal shame of the city council”. Indeed, there was also an indication that such initiatives could not only create conflict, but could potentially lead to the fragmentation of provision. This participant indicated that paid library staff did not support the volunteer-run facility:
“They’ve got nothing to do with us. We won’t take their books in, because we’ve had good friends who’ve been made compulsorily redundant.”Library services provider
Other services were also using more volunteers. In one council, volunteers had increasingly been deployed to provide services such as play and other activities within children’s centres, and were also an increasingly prominent feature of a range of the services and agencies that the centres commissioned services from or worked with. Youth workers also described how, while young people had always been used as volunteers to deliver youth work services, this was on the increase. In the health and care sphere, the drive to increase volunteering was a clear strategic priority. While research participants had no direct experience of recruiting or working with volunteers in this arena, there was a strong level of awareness that it was part of the council’s broader agenda:
“[Volunteering] comes up in quite a big way, because they’re obviously looking at different models of working that will make savings.”Children’s services provider
Civic responsibility filling the gapsCouncils were also attempting to promote less formal forms of citizen activity to tackle gaps created by service reductions. Chapter 3 noted the fact that councils were turning their attention to how to build capacity within communities to take on new roles. In two councils, the community

815 The cost of the cuts: the view from front-line service providers
development remit of some parks staff had been expanded and was supporting, for example, the development of ‘Friends of the park’ groups as a more central part of their role. In one, a community worker described how they used to directly organise and run activities such as breakfast clubs and fun days, but that now their role was to support communities to do this for themselves. Despite such examples, the discussions with front-line staff did not tend to suggest that capacity-building was a major feature of their work.
There were mixed views among staff on the extent to which civic responsibility could be a means to fill gaps. The issue was discussed most extensively in relation to neighbourhood environmental amenity. Staff in one council had been told that they were “going to have to get used to saying no” to requests to fix problems in between programmed servicing. This instruction went against a cultural norm within environmental services of being responsive to complaints from the public, and was a source of anxiety:
“The demand of the customer hasn’t changed, and they’re still coming through and we have to say: ‘it’s your responsibility’.”Environmental services provider
While staff found saying no challenging, there was also a minority who were in support:
“Yes, people could do more, I mean I get phone calls: ‘there’s a coke can outside my house’… But some people realise that where they live, we’ve all got a part to play.”Environmental services provider
Front-line staff did have examples of citizens increasing their level of maintenance of the environment. A warden suggested that more stringent fines for residents who dropped litter or for fly-tipping was leading to “less litter” while in another area, locals had begun to cut grass verges in response to the council’s reduced cycle. Importantly, however, other participants thought that the drop in the council’s service standards was having the opposite effect: whereas when service standards had been higher some people would pick up the litter near their property: “they now look about the place and think ‘why bother?’”
There were other examples of established practices that had involved ordinary residents in delivering good environmental outcomes which had been challenged by austerity measures. In one, it had been the practice for patrols involving residents and council staff to identify problems taking place, but this had stopped with a new service contract.

82The cost of the cuts: the impact on local government and poorer communities
Box 5.4 A ‘knock on’ impact of service reductions on civic responsibility
A community worker told of the challenges that a group of parents had encountered in trying to secure funding for a new play park in their neighbourhood.
As a result of budget restrictions, the council had stopped maintaining playground equipment and now simply removed items that failed to meet safety standards. However, in order to secure funding for the new play park, the parent group found that they needed to specify how the equipment in their facility would provide would be maintained. They were unable to do this as result of the withdrawal of maintenance. At the time of writing this issue had not been resolved.
Finally, similar challenges were also reported in relation to attempts to transfer assets such as community halls to community bodies. In one council, there were two contrasting examples in a single neighbourhood. Whereas one hall was rapidly transferred from the council to a local management committee in a matter of months, another transfer had been subject to significant delays. In a community worker’s view, the difference could be accounted for in the capacity of each community body. Thus, the rapid transfer was achieved where the management committee comprised largely former council staff, while the delayed transfer was to a group who were struggling to provide evidence that they had the requisite book-keeping and other systems in place.
Concluding reflections
Although this chapter highlights a number of negative impacts on the nature and quality of service provision – some of them quite significant – it was not the case that services had deteriorated across the board. Indeed, many staff showed a considerable degree of resilience in managing to keep providing a good, valued service despite workload and other pressures. The extent to which front-line staff may be ‘cushioning’ some of the impacts of austerity measures is striking. However, the stress that this caused to staff was a constant refrain of the discussions.
The pace of the cuts and the timescales the councils had to work within to devise their responses, particularly in England, seemed to militate against involving front-line staff in the design of savings measures to the extent that strategic officers might have wished. This may have led to an occasional disconnect between strategic intentions to deliver savings via efficiency measures and the impact of these measures on the ground. Thus, while staff were being encouraged to “manage down” the expectations of some service users, or to “do more with less”, there were few examples offered where they had had a strategic input into how savings could be best achieved. Indeed, it was notable that front-line staff shared the concern of more senior staff about the impacts of the cuts on the capacity to think strategically and to monitor and reflect on the impacts of change.
Finally, the evidence from front-line staff highlights the danger that public sector reform could be undermined by the severity of the budget cuts inflicted on councils. There were examples of innovation and evidence of a

836 The cost of the cuts for the voluntary sector
strong appetite for collaboration. It is our sense however that much of the good practice that is in place or being developed occurs in spite rather than because of resource constraint. In addition, the small scale to date of the new activity designed to build capacity among ordinary citizens to fill gaps in services also suggests that if council budgets continue to be squeezed at the levels planned, then the ambition implied in these agendas will be more than difficult to achieve.

84
6 THE COST OF THE CUTS FOR THE VOLUNTARY SECTOR
Introduction
In Chapter 4 the views of voluntary sector staff on the direct impacts of cuts to local authority budgets for service users were outlined. In this chapter the focus is on the impact of these on voluntary organisations and the sector more broadly. The discussion identifies parallels in the experience of voluntary sector and front-line council staff and amplifies our understanding of the various impacts of these cuts.
Twenty-five staff members from voluntary organisations across the case studies were interviewed for the research. The majority were in operational management positions but a small number of front-line workers also took part. They represented a wide range of voluntary sector services and included organisations offering services to the whole community as well to specific groups such as the elderly, young people and children. About a third worked in organisations providing legal, financial or welfare advice.
The cuts have affected voluntary organisations in six main ways:
• direct cuts to the funding of voluntary organisations affecting staffing and services
• funding losses leading to more ‘entrepreneurial’ activity, and concern about ‘mission drift’ and commercialisation
• new contracting arrangements stifling entrepreneurial activity • relationships changing between voluntary organisations and between
voluntary organisations and public agencies • expanding workloads as the result of stepping in to fill the gaps in council
services• a new level of involvement in capacity-building to facilitate active
citizenship.
The fact that these impacts were being experienced alongside a growing intensification of need as a result of both the recession and wider austerity measures was a consistent theme of interviews. Box 6.1 gives a flavour of the views of advice workers.
856 The cost of the cuts for the voluntary sector
Box 6.1: The impacts of wider austerity on voluntary sector advice services
Voluntary sector advice workers were concerned that the coalition government’s welfare reforms had led to an intensification of problems, particularly among vulnerable groups.
Staff felt that they saw many more extreme cases, and that clients were seeking help only when their situation had reached a crisis. Benefits changes were deemed not only to have produced hardship, but to have created what one described as a “climate of fear”:
There’s a fear now, a visceral fear… I do very intensive face-to-face work with clients and… I’ve never heard this from clients in financial inclusion work before but I have over the last year or so... Whether they’ve been affected by the bedroom tax or changes to their [Jobseeker’s Allowance] or conditions of their benefit and that… there’s an absolute terror now.
A number of organisations had identified the need for additional training for staff and volunteers. For example, some participants were concerned about the mental health of clients, with one recounting a suicide that had left them feeling “really, really guilty” and asking “could I have done anything more? Could I have done anything differently?”
A number of managers noted the toll of dealing with people in such severe circumstances could have on the staff and volunteers:
These people are coming to us at the end of their tethers and we’re trying to help them and we’re not used to it. I don’t think we’ve ever had people quite as bad as we have at the moment… this last year in particular has been really, really hard on people, we are inundated with people coming in now.
Cuts to funding and their impact
Voluntary organisations in all case studies had experienced reductions in funding as a result of the pressures on council budgets, although this was more severe in two than in the others. Indeed in one, all of the voluntary sector participants we spoke to said that their organisation had seen a reduction in council funding over the last four years. While a few participants were critical of the funding decisions of their local council, others expressed sympathy with regard to the difficult decisions that councils were having to make in order to manage austerity. For example, participants in one council area acknowledged the challenges their local council must have faced as it sought to protect a funding pot used to support voluntary organisations and activity.
Voluntary organisations experience cuts in funding either when councils seek efficiency savings and ask partner organisations to cut the costs of delivering a particular service, or when they pull out of funding some kinds of service, which can be understood as retrenchment.
In one council area, voluntary sector interviewees suggested that the council’s requirement for efficiency savings meant that contracts have had to be delivered for 8–10% less every year. There was also an example of

86The cost of the cuts: the impact on local government and poorer communities
a council that had sought to generate efficiency savings by reducing the costs of lunch clubs for the elderly run by voluntary sector providers. An interviewee reported pressure to keep costs down: “For the last two to three years they’ve been saying this is too expensive, this is too expensive”. The need to meet the council’s savings targets has led to the national group (of which the local organisation is a part) subsidising the service in order to provide service “at an acceptable level”. Although the service continues, this can be understood as a form of retrenchment as the council’s role has diminished.
However, there were numerous examples of reductions in services as a result of loss of funding. A credit union had to substantially scale back the financial inclusion education it provides in local schools, as well as a service that had allowed private rented tenants to have their rent allowance paid to the credit union and then passed to their landlord. A major advice agency lost two council grants that led to staffing reductions equivalent to 15 FTEs. These grants had funded specialist services such as debt advice for housebound residents. Their loss impacted significantly on the organisation’s capacity to provide advice to vulnerable groups “at a time when it is most needed”, according to a voluntary sector manager. It also meant that remaining staff were expected to take on the more specialist cases and had become stretched as a result.
In Box 6.2, we highlight how a cut in the grant made by a council to a voluntary organisation can have knock-on effects in relation to other sources of income. It illustrates the precariousness of many voluntary organisations, even when their funding is derived from a range of sources. It also illustrates the steps that such organisations need to take in order simply to keep up with changes in the funding climate.
Box 6.2: Cuts in council funding can spark a knock-on impact on funding sources for voluntary organisations
A counselling service was historically funded through three main sources; the council, the health board and a grant from Children in Need for children’s services. In 2010/11 the council withdrew £10,000 in funding, followed quickly by the health board withdrawing match funding. The simultaneous withdrawal of both grants meant that Children in Need felt the organisation was too much of a risk, so it also withdrew the £67,000 grant.
As a result, the service began to charge for its counselling service at a cost of £5 per session. It also began to offer counselling services to other council areas in an attempt to increase its client base.
However, as other councils began to cut costs, these initiatives became less viable. In order to protect the organisation and its services for the long term with a stable source of income, the organisation developed a partnership with an educational institution to launch a diploma in a specialist area of counselling. This initiative has proved popular and lucrative and there are plans for a ‘training pod’, which can be used to provide distance training via Skype. The hope is that this will allow the organisation to enter the international market, thus ensuring an income stream for years to come.

876 The cost of the cuts for the voluntary sector
Entrepreneurialism, ‘mission drift’ and cultural change in the voluntary sector
As highlighted in Box 6.2, council cuts have accelerated the push to make voluntary sector organisations less dependent on grants from public bodies, and to embark upon income-generating activities such as selling and diversifying their services.
There were some positive views expressed about what was seen as a trend to entrepreneurialism and commercialisation. One interviewee talked about the “freedoms” it afforded, while another said it provided a chance to be “more self-determined in terms of our income”. A participant from an arts organisation told of how they see the need to generate income as freeing them from the bureaucratic constraints of the grants system. This had allowed them to build the business side of their organisation which exploited the benefits of a building they had relocated to:
“Once we have the space it can be monetised and that’s a much more potent source than the drudgery of having to constantly make returns and be accountable to a local authority… so it’s a different world we’ve tapped into.” Voluntary sector service provider
More negative views were also expressed however. Of particular concern was that taking on more commercial activity could lead to ‘mission drift’. One organisation whose core purpose had been to deliver play activities to disadvantaged children lost the entirety of its council funding in 2012. It now sells play services more widely to schools and parish councils. More controversially, it has also developed a ‘scrap’ store: a shop where donated commercial waste is recycled. It was also approached by the council to provide services unrelated to its core play remit – smoking cessation advice to parents of children attending its activities, funded through the council’s new public health budget. While this approach was acknowledged by the interviewee as intended to help the organisation to mitigate its loss of funds, they were conscious of “mission creep” and felt this could detract from the service’s core focus on play. The approach had been turned down:
“I don’t particularly want to put any of my workers through a level 2 smoking cessation training course to become an adviser. I’d much rather just be aware of the services and know where we need to signpost people to… Public health are quite clearly looking for people to come forward and say: “yeah I’ll put some staff through that”. Then you get into that whole arena about mission drift.”Children’s services provider
As Box 6.2 indicated, commercialisation could mean introducing charges to service users. It could also mean developing a completely different business plan and way of operating. The arts organisation noted above, for example, had stopped making small grants to community groups and arts outreach projects based in local neighbourhoods. While it still undertook activity designed to build networks between groups and artists, much of its activity now focused on its new city-centre premises where space and facilities for up to 60 artists were on offer. In a parallel with the centralisation of council services noted in Chapter 5, these changes meant that the reach of the project to the wider community had been limited.

88The cost of the cuts: the impact on local government and poorer communities
There was also evidence of an increase in the propensity to chase funding to develop new services regardless of whether the organisation was in a position to provide the service:
“Some people are just going for funding that has really nothing to do with them but they’re going for it because they need to stay alive.” Voluntary sector service provider
This could have knock-on consequences for the nature, quality and appropriateness of service provision:
“One service, they diluted their service so much because they were just jumping at whatever grant was available so they were doing a bit of this and a bit of that.”Counselling services provider
Almost all of the interviewees noted that the ‘entrepreneurial shift’ meant diverting resources into applying for funding and developing new skills. Some staff were devoting more and more of their time applying for funding, which affected the time they had for other aspects of the service. One organisation recounted a positive experience however. Its first application to the Big Lottery “was a steep learning curve”. Indeed, it had felt the necessity of hiring a consultant to assist with the bid. The success of the application, however, increased the confidence of staff, and the organisation is currently applying for a large grant of £1m, this time without external help.
New forms of contracting stifle entrepreneurialism and creativity
In other respects, the shift in funding arrangements was seen as potentially stifling existing entrepreneurialism. A number of the voluntary organisations had experienced a change in their relationship with the local council as a result of the transition from grant funding, via service level agreements (SLAs), to tendering for contracts. Interviewees from two organisations providing advice and children’s services respectively, both in the same area, suggested that at each stage of the process, terms became more prescriptive, leaving less room for innovation and creativity. An interviewee from a children’s organisation suggested that the move from SLAs to contracts had reduced the distinct input of voluntary organisations:
“I think part of the problem was they used to give us a service [level] agreement [SLA] which was ‘this is what we want you to do and this is how much we’re paying you to do it’. We know what’s needed and we started to shape our own SLAs… and we were quite successful with that. But what was very disappointing was they moved from having a service level agreement to having a tendered piece of work and the tendered piece of work didn’t flow out of the SLA.”Children’s services provider
Moving to a more tightly defined contract situation can mean losing the capacity for innovation and this loss can have a long-term impact on a

896 The cost of the cuts for the voluntary sector
service. As voluntary organisations expend more resources on the tendering process and reorient their services to fit the contract brief, there are fewer resources available for formulating novel, service-user-focused approaches to service design and delivery.
The pressure to adapt bids and grant applications to specifications that didn’t fit the core purpose of voluntary organisations was argued to be a feature of the funding climate more generally and not unique to local authorities. Some frustration was expressed that funders increasingly tied the need for the voluntary organisation to make “positive impacts on public services” to their funding. For example, an interviewee from a voluntary umbrella organisation said that both their organisation’s staff and those of the wider membership have found such an outcome is becoming a more regular inclusion in funding applications: there is a “collective groan” every time a grant is tied to this outcome. Their view is that funding for third-sector organisations should be focused on supporting the sector’s distinctive aims and values:
“Money shouldn’t be going to [helping] public sector services; it should be for innovation and adding value.” Voluntary sector service provider
A similar example, although in a contrasting direction, was of funding criteria more focused on outputs rather than outcomes. An interviewee from an advice service suggested that while his organisation was interested in client assessments of how the service had helped them – perhaps with health problems – all the funder was interested in was: “how many did we put through?” The interviewee said he sometimes jokes with colleagues that “for some of these contracts I could stand at the window and wave at people and then count them” and that this would be acceptable. In one case study area, all of the voluntary organisations participating in the research provided examples of tendering for contracts with terms that they believe curtailed their scope for preventative working or limited the scale of the early intervention they could provide. Box 6.3 details two examples from the same organisation.

90The cost of the cuts: the impact on local government and poorer communities
Box 6.3: Compromising to secure contracts
An organisation that provides support to vulnerable adults and young people gave two examples of discrete pieces of work where it had adapted bids in ways it was unhappy with.
The first was a central government grant to help vulnerable young people deal with changes to special educational needs (SEN) provision. In order to secure the money, the organisation had to agree to offer the service to a larger number of people. In doing so, the intensity of the intervention was reduced to an inappropriate level, according to two of the organisation’s employees.
The second example was for match funding from the council to reduce costs around residential care of 14–19 year-olds. The organisation was encouraged by the council to focus on the older 19–25 year-olds as care of this age group would give rapid ‘cashable savings’. Interviewees viewed this as an example of how the “race to make quick savings” impacted on strategic decisions. They suggested it was in conflict with local authorities’ aspiration to achieve meaningful, positive, long-term outcomes:
Although they see the value in working preventatively, actually their day-to-day priority is getting people back into the city and making cashable savings now as opposed to future savings. They’ve got to find the cash [and] that means they’ve got to reduce current expenditure. I think we might get driven more into reconfiguring what we do in a way that will reduce current expenditure and not contain future liabilities [which is] not what we would want to do ideally.
More competitive relationships between agencies
One view of the wider impact of austerity is that it will drive and accelerate collaborative, partnership working between services and agencies. In earlier chapters, we noted the appetite within councils for more inter-agency working, but suggested that austerity can also act as constraint on bringing this to fruition. There is some evidence of collaboration between voluntary sector organisations being incentivised by austerity; however it was said that this was largely driven by the need to generate income. One interviewee said that while partnership working had always been part of what voluntary organisations did, austerity had “lit a fire under it”. However, she also suggested that organisations with quite inappropriate aims or remits have “pestered” her own organisation to form partnerships to bid for funding.
The testimony of the majority of interviewees was that austerity – and indeed the cuts that councils had had to make in particular – appeared to have resulted in more competition in the sector. In one council area, the majority of interviewees suggested that the need for the sector to respond to a more competitive procurement and tendering process had created some division and indeed fragmentation. Organisations had become more territorial and protective of their outputs and outcomes:
“We’ve become competitive with one another. I think that’s the biggest [impact]. I think that has upset a lot of the work that we used

916 The cost of the cuts for the voluntary sector
to do because trust went out the window because suddenly we were all competing with one another for funds whereas before we were all in our own areas and knew what we were doing and how we all worked together.”Voluntary sector service provider
A loss of partnership working was flagged by several interviewees, and its impact on the capacity to “dovetail services”. This was said to be a product not only of the more competitive environment, but also because tendering processes took up more voluntary sector staff time and left less capacity and time for networking activities. As was noted in Chapter 5 in relation to council staff, one casualty of burgeoning workloads can sometimes be the priority given to the less formal networking not linked to producing an immediate outcome.
As well as changed relationships within the sector, there was evidence of some damage to relationships between councils and voluntary organisations. An interviewee told of how cuts to grants and the consequent impact on the service had “soured” the voluntary sector organisation’s relationship with the council; it had taken some time to rebuild trust. Paralleling the views of council staff in Chapter 5, staff reductions in the council had created difficulties in terms of knowing who to consult to resolve a problem, voluntary sector interviewees noted the same issue:
“… a couple of years ago… it seemed like everybody we’d ever talked to in the council left. And then suddenly you have to tell them all about yourselves again and work through all those historical aspects.”Voluntary sector service provider
Increased workloads and filling the gaps
It has historically been the case that voluntary organisations view it as part of their role to fill gaps between public services, or between public services and market provision. The testimony of voluntary sector interviewees suggested that some of the saving measures implemented by councils had led to more gaps opening up.
One organisation saw the gap in what the council was now able to do and what was needed as an opportunity. An organisation that specialises in supporting vulnerable young people had become involved in training the education workforce to develop approaches to developing resilience among young people. It had led to closer engagement with statutory agencies and the interviewee felt that austerity “had opened doors” for the organisation as the council could no longer afford to fund the staff who could deliver the training.
Interviewees also however pointed to gaps opening up as a result of the growing intensity and complexity of needs (highlighted in Box 6.1.) As was the case with local authority staff, many voluntary organisations reported a desire to ‘go the extra mile’ to try to help people in desperate circumstances. Some had also developed additional services. A credit union now offered ‘fast cash loans’ in response to the loss of crisis loans from social work: “which is something that we never used to do... We were always ‘you had to save for a minimum term before you could borrow’ but now we offer a fast cash loan.”

92The cost of the cuts: the impact on local government and poorer communities
More than one interviewee indicated that the strain on council advice, debt and welfare services were evident to them. One organisation had tried to assist the council by hosting council money advice advisers at their service, while another had begun to offer (limited) advice itself. In one area, greater pressure on the council’s benefit advice service, particularly in relation to the application process for community care grants, had led to staff in a voluntary organisation being trained by the council to support clients through the community care grant application process. This was done with the clear aim of relieving pressure on the council. In Chapter 4, the fact that voluntary organisations were also experiencing an increased workload as a result of strategies devised by councils to reduce face-to-face contact was also noted. Interviewees suggested that this manifested as direct help, as well as responding to what they saw as a need to develop services designed to build IT literacy and promote digital inclusion.
The closure of children’s centres in one area has meant that one voluntary organisation now hosts far more contact sessions (where looked-after children meet their natural parents and siblings) than it used to. The charity is not paid to provide this service but it requires considerable administration and staffing resources: “It’s the management which is a huge resource. If the social worker doesn’t turn up, we deal with the parents”. Indeed, in Box 6.4, the view of voluntary sector interviewees that eligibility for council social work services has tightened is highlighted.
Box 6.4: Increase in complex cases and the relationship with social care thresholds
Taking on more responsibilityIn one area, two voluntary organisations specialising in family support have noticed an increase in the number of complex cases. Research participants believed that this was due to a rise in the eligibility threshold for social work services, and corroborates the view of some council staff highlighted in Chapter 5. The voluntary sector interviewees stated that they are now finding themselves the ‘lead professionals’ on cases where families have complex needs. For example, they now support families with children on child protection plans and deal with cases of extreme truancy, citing the example of a teenager with severe mental health needs and problems with self-harm who had not been in school for two years. Their view was that a few years ago, these children would have been on child protection plans and statutory care would have been provided.
Changing the nature of the serviceIn response to heavier case loads and the more complex and sensitive nature of the issues dealt with through their specialist support services, this service has increasingly moved from group to individual sessions, as the kind of problems they see are no longer appropriate for a group setting. “Some families are happy; it feels safer for them to work with a voluntary organisation. However, it’s hard on the staff. It’s not what they came here to do.”
A final way in which workloads in the sector were impacted on organisations was said to be created by an increase in volunteering. New volunteers had

936 The cost of the cuts for the voluntary sector
come forward to take on crisis management such as food banks. They were not involved in the strategic areas of organisations. However, the fact that more volunteers can make more work for voluntary organisations was also noted by one interviewee:
“We’re not badly off for volunteers but what we also know we have to do is maintain some contact with those volunteers and support them in the right way… making sure that they feel part of what’s going on… When people like the council say ‘well they’re free’ – oh God, they’re not, they take a lot of work.”Voluntary sector service provider
In relation to the bigger agenda with respect to whether the voluntary sector is being expected to substitute for council activity, Box 6.5 gives an example from one case study.
Box 6.5: Volunteerism substituting for the council
An umbrella organisation explained how the council has established a project that encourages council employees to volunteer in the area by giving a small amount of additional annual leave to compensate. Senior staff have been using this volunteering time to support community organisations with training for a range of activities. This has meant that community organisations have not had to buy in this expertise and thus saved money on training. It is worth considering that this training should have had public funding but the umbrella organisation did not see it as a concern and took the pragmatic view that training budgets are small - “these are needs that need to be met”. With all of the changes that are going on – welfare reform, human rights, austerity – training needs for small organisations have increased substantially but the training budgets have not. Senior staff are also giving HR, marketing, PR and social media training as part of this voluntary programme. The interviewee conceded that this type of scheme would not have happened pre-austerity.
Capacity-building
A final way the cuts to council budgets are impacting on voluntary services is around the civic responsibility agenda and the role of the sector in enabling communities to do more for themselves. Some interviewees were aware of this agenda and indicated their support of certain aspects. However, there was strong sense from interviewees that the active citizenship agenda was not underpinned by the necessary resourcing for capacity-building. Concerns were also expressed about the lack of contact between council and voluntary sector staff over the design of strategies to take this forward.
An interviewee from an umbrella voluntary organisation recognised that her organisation had a key part to play in increasing capacity among communities. She noted however, that while there was an appetite among some colleagues to get involved in this kind of work, it was quite challenging to undertake. She had observed an increase in the number of groups approaching her organisation for support with small community projects.

94The cost of the cuts: the impact on local government and poorer communities
However, many of these groups seemed “semi-formed”, had “a very low level of skills and experience” and required intensive support. Indeed, the interviewee suggested that the level of structure and organisation among community groups had deteriorated during the period of austerity, and that the lack of support was particularly problematic.
A second interviewee from an organisation that works with vulnerable adults was also concerned about the lack of support to deliver the capacity-building agenda, both from local authorities and from other agencies. While he was developing a good working relationship with the council at an operational level in relation to specific pieces of work, the interviewee suggested that there was a lack of overall strategic direction and that access to senior staff was difficult to come by.
Concluding reflections
This chapter has outlined how austerity measures and in particular changes to council funding are having a profound effect on the voluntary sector. The pace of change in particular is proving a major challenge to both the council and voluntary organisations when attempting to plan future service provision. We have seen that for the voluntary sector itself, the pressure to sustain services and fill the gaps is changing the nature of the services they provide. This change is not entirely negative, and some innovative partnerships are being forged in the process, but there are signs of ‘mission drift’ and services being impeded from providing the interventions they believe will have the most impact. The impact of austerity measures means that voluntary sector services are operating in a changed world where they must deal simultaneously with more specific and demanding relationships with funders and respond to service users with more complex needs. As the council encourages citizens to take a more active role in service provision, voluntary sector services are also at the forefront of activities supporting service users through the period of change while also building capacity among community groups.
These third-sector services, along with council services, are heavily relied upon by disadvantaged communities and the following chapter focuses on the impact changes to these services has on more deprived service users.

95
7 THE COST OF THE CUTS FOR POORER PEOPLE AND PLACES
Introduction
This chapter brings into sharper focus a concern that implicitly underpins the previous chapters and indeed that has guided the whole research project: what are the costs of the cuts to poorer people and places?
It is structured around four questions:
• In Part A, we ask whether the kinds of service that poorer households rely on most (‘pro-poor’ services) are being protected by authorities when they distribute the cuts they need to make to balance their budgets.
• In Part B, we examine whether pro-poor services are in danger of being overwhelmed by levels of demand or need (even though they may have been sheltered to some extent from the worst of the cuts).
• In Part C, we look at whether the impacts of the cuts are greater for low-income groups, regardless of how cuts are distributed between services.
• In Part D, we focus on the use of increased targeting of services on poorer groups and places and ask whether this might have negative consequences in spite of the positive intentions that lie behind it.
Part A. Are pro-poor services being protected?
In our 2013 reports (Hastings et al, 2013a; 2013b), we established that, across the range of council services, there is variation in the use of particular services by different socio-economic groups, and therefore that different levels of benefit are derived from different services by discrete social groups. This means that decisions about which services must face the greatest cuts can have a ‘distributional’ impact: it can impact differentially on distinct income groups.
Evidence of the variation in service use comes from the wider body of research conducted by one of the present authors, Glen Bramley. For this project, we developed a synthesis of findings from household surveys such as the Poverty and Social Exclusion UK Survey and the Scottish Household

96The cost of the cuts: the impact on local government and poorer communities
Survey to determine patterns of usage of council services across socio-economic and income groups. To distinguish between services, we have used the categorisations of service headings employed by CIPFA. These have then been classified into six groups that denote the potential for a distinctive distributional impact:
• Two groups of services are considered ‘pro-poor’ or ‘very pro-poor’ in their pattern of use and benefit. These services include various housing and homelessness services, social work and social care services, advice, crime and community safety services; special education and public transport.
• One group is considered ‘pro-rich’ in the patterns of use. Here services such as adult/community education; arts and culture; planning and parking are in the frame.
• Three groups (labelled ‘neutral’, ‘neutral minus’ and ‘neutral plus’) are used relatively equally across social groups and are therefore neutral to a greater or lesser extent in their distributional impact. ‘Neutral minus’ are used slightly more by more affluent groups and ‘neutral plus’ slightly more by disadvantaged groups. These include libraries; youth and careers services; early years/pre-school; street cleansing, waste collection; play and parks, recreation and sport; as well as road maintenance and street lighting.
Further details on the approach are included in the Technical Report, Appendix G (Hastings et al, 2015.
The 2013 reports demonstrated that councils had largely managed to shield pro-poor services in relative terms from the worst effects of the cuts. In this part of the chapter we re-visit and expand on this evidence.
The national evidenceIn revisiting the national picture for England of how budget cuts have been made in relation to the pro-poor to pro-rich distributional spectrum of services, education services (other than ‘early years’) have been excluded. This is because of the problems associated with the academisation policy. The analysis examines real-terms budget changes over the four years 2010/11 to 2013/14.
Figure 18 looks at budget changes in real percentage terms (i.e., allowing for general inflation). This analysis shows that the percentage cuts have been greatest in the ‘pro-rich’ and ‘neutral-minus’ categories, with relatively small cuts in the ‘very pro-poor’ category, and some increase in the ‘neutral’ category (wholly accounted for by ‘early years’). This appears to suggest that there is a somewhat ‘progressive’ slant to the cuts when the distributional character of services is examined. This pattern is in marked contrast to the regressive picture in relation to socio-economic deprivation at a local authority area level demonstrated in Chapter 2. What is apparent is that local authorities across the spectrum of disadvantage appear to have tried to protect pro-poor services and have sacrificed services used more by the better-off to achieve this.

977 The cost of the cuts for poorer people and places
Figure 18: Real Budget Change by English Local Authorites 2010-14 by Dist ributional Character of Service (percent, excluding education)
Source: Author's analysis of CIPFA budget data
-0.6
-0.4
0.2
Distributional Category
Ver
y pr
o po
or
Neu
tral
-
Pro
-ric
h
0
-0.2
-0.7
Pro
-poo
r
Neu
tral
+
Neu
tral
-0.5
-0.3
0.1
-0.1
Per
cent
Figure 19 examines real-terms changes in terms of absolute £million. The largest absolute cuts are also in ‘neutral-minus’ and ‘pro-poor’ services, although it is the former that are larger here. Figure 19 also highlights that ‘pro-poor’ and ‘very pro-poor’ services have seen substantial savings in absolute terms. The reason for this different picture is that the categories of service along the pro-rich to pro-poor spectrum vary quite a lot in terms of the base scale of expenditure. Pro-poor services account for a much larger share of expenditure in total. We show this clearly in relation to the case studies in the following section.

98The cost of the cuts: the impact on local government and poorer communities
Figure 19: Real Budget change by English Local Authorities by Distributional Character of Service (£million, excluding education)
Source: Author's analysis of CIPFA budget data
-1000
-600
600
Distributional Category
Ver
y pr
o po
or
Neu
tral
-
Pro
-ric
h
200
-200
-1200
Pro
-poo
r
Neu
tral
+
Neu
tral
-800
-400
400
0
£m
Case study evidence
Chapter 3 analysed the budgetary data provided by the case study councils against the three-part framework devised to capture distinctive aspects of councils’ strategies to manage austerity in relation to efficiency, investment and retrenchment, and how the balance between these strategies had changed over time. These same data can also be analysed in relation to the pro-poor to pro-rich spectrum of distributional impact (Figure 20).

997 The cost of the cuts for poorer people and places
Figure 20: Relative savings by distributional character of services, 2010/11–2015/16
Source: Savings from case study budget documents. Baseline spending (denominator) from CIPFA budget data (average for 2010/11 and 2013/14, adjusted to local authority statements of budget totals in 2013/14. Note: Figure 7.3 is an updated version of a similar chart included in Hastings et al (2013a; 2013b). It has been updated to take account of any adjustments made for the financial year 2015/16 by the English case studies, and to include the Renfrewshire case study.
-80
-50
-40
-30
-20
-10
0Sa
ving
s as
% o
f tot
al s
pend
Service
New
cast
le
Cov
entr
y
Milt
on K
eyne
s
Ren
frew
shire
-60
-70
-90
Pro-rich (-2) Neutral-minus (-1) Neutral (0) Neutral-plus (1)
Pro-poor (2) V. pro-poor (3)
Figure 20 was also presented in our 2013 reports (and is updated here). It was suggested then that it provided evidence that case study authorities were protecting pro-poor services from the worst impacts of budget cuts. Figure 20 clearly shows that pro-poor services in all four case studies have been subject to lower percentage decreases in their overall budgets than either neutral or pro-rich services, and that in some cases the differences are considerable.
While this is an important interpretation of these data, we also pointed out that large absolute levels of savings were still being achieved in these services. This is the focus of the analysis below.
Before turning to this, it is important to note just how constrained councils are in their capacity to continue to protect pro-poor services. Figure 21 shows the proportions of the case studies’ overall spend that goes on back-office functions and on front-line services, with these categorised as pro-poor, neutral and pro-rich (that is, the six categories collapsed into three). It shows that approximately 60% of expenditure in the period assessed was in fact on pro-poor services.

100The cost of the cuts: the impact on local government and poorer communities
Figure 21: Proportion of total spend by distributional character of service (2011/12-2014/15)
Source: CIPFA expenditure data for case study areas Note: The total spend used in this calculation is an average of the net expenditure over the period distributed across the spectrum of services.
10
30
40
70
80
90
100P
erce
nt
60
50
20
0
Pro-rich Neutral Pro-poor Back office
Cov
entr
y
Milt
on K
eyne
s
New
cast
le
Ren
frew
shire
Area
Figure 21 also demonstrates that ‘pro-rich’ services form a tiny proportion of the councils’ overall spend, and indeed, that the back-office functions subjected to the greatest part of the efficiency measures are only about one-tenth of council spend. The ‘neutral’, universal services used by a cross-section of the population, such as street cleansing, parks and swimming pools, comprise about a quarter of the spend of the case study councils. Indeed, pro-poor and neutral services together represent towards 90% of council spend. These services provide the basis for decent neighbourhoods and individual wellbeing for a range of social groups, but particularly poorer communities. Given this, cuts to council budgets of the scale documented in this report must result in fundamental change to these services.
Figure 22 shows how ‘savings’ levels in these four categories of service – back office, pro-poor, neutral and pro-rich – have varied as a proportion of overall savings achieved by the case studies over time. To demonstrate this, data have been divided into two time periods ‘early’ austerity in 2011–13, and ‘later’ austerity in 2013–16.

1017 The cost of the cuts for poorer people and places
Figure 22: Proportion of savings by distributional character of service
10
30
40
70
80
90
100P
erce
nt
Area/Year
60
50
20
0
2011
-201
3
2013
-201
6C
oven
try
2011
-201
3
2013
-201
6M
ilton
Key
nes
2011
-201
3
2013
-201
6N
ewca
stle
2011
-201
3
2013
-201
6R
enfr
ewsh
ire
Source: The main source of the savings data has been the council budget reports 2010/11-2015/16. The detailed information for Milton Keynes and Newcastle is given in appendices to the main budget reports. Some further data relating to a number of the proposals were also available through published equality impact assessments.
Pro-rich Neutral Pro-poor Back office
In the case of Newcastle, the scale of savings in pro-poor services across the period is notable. The majority of these have been achieved in adult social care. In the early years of cuts, the emphasis was on achieving savings to council budgets via strategies where resources from the NHS were accessed, as well as re-ablement strategies enhanced. In the later years, savings are the result of the development of new models of integrated commissioning and delivery with the NHS.
In the case of Coventry, what is striking is that as the capacity of the council to close its budget gap via back-office savings has diminished, savings from pro-poor services have come to the fore. The majority of these savings are again in relation to adult social care: for example, short-term home support is no longer provided in-house but commissioned externally. Like Newcastle, Coventry Council are also working to increase the contribution of the NHS to care. Other pro-poor services to be affected include the council’s funding of voluntary sector information and advice services.
For Milton Keynes the council’s ability to make savings from changes to neutral services has diminished between early and late austerity and it is making a greater percentage of their overall savings from pro-poor services. In a similar manner to the other two English case studies, Milton Keynes also aims to increase the NHS contribution to adult social care, and is attempting to extend this approach to mental health services - ensuring that the council only funds the social care aspects of the joint service.
Milton Keynes and Renfrewshire differ from the other two council areas in that they are increasing their savings from back-office functions in later austerity. In Milton Keynes this is being achieved from continued

102The cost of the cuts: the impact on local government and poorer communities
back-office efficiencies derived from transferring functions and staff previously outsourced back to council employment with less generous terms and conditions. The majority of Renfrewshire’s efficiency savings in this later period are a result of further staff losses from business support, and corporate and financial services.
It is clear that, while the councils may share an ambition to protect more disadvantaged groups from the worst effects of budget cuts, their capacity to achieve this over the coming years will be severely constrained by the fact that pro-poor services make up such a large proportion of the total expenditure of councils. Indeed, as Part B of this chapter will demonstrate, there is evidence that some pro-poor services are already showing signs of strain.
Part B. Are pro-poor services becoming overwhelmed even so?
While Part A suggests that pro-poor services have tended to be protected from cuts in relative terms, the analysis demonstrated that many of these services, including social work, social care, and housing and advice services, were experiencing very significant levels of absolute cuts. There is evidence of this in the national data as well as in data from our four case studies. Moreover, this comes at a time of generally rising levels of need resulting from the combination of economic recession, high unemployment, falling living standards and cuts in welfare expenditure. The discussion starts by examining reports of rising levels of need, before considering whether there is evidence that pro-poor services are under strain.
Rising levels of needChapter 6 indicated that voluntary organisations felt that a greater proportion of their service users had more intense and complex needs than before. This view was shared by council staff.
Housing, social work and home care all had examples of increased need and greater caseload complexity since austerity measures were introduced. Social work staff described clients with mental health issues struggling to deal with their parental responsibilities, welfare reform and legal aid cuts. Home-care staff suggested that the intensity of their interventions had increased, reporting the need for more equipment, pressure on staff time and a greater frequency of visits. Housing officers also reported that they saw more clients with severe mental health issues as well as those with a combination of problems in relation to housing and welfare reform. In one case study, a library service provider had also noticed that more of their customers appeared to evidence mental health needs, sometimes quite obvious and severe. Their view was that libraries were becoming “havens for very vulnerable people… who had nowhere else to go”.
As with the voluntary sector, council advice services seemed to have experienced the biggest change in the complexity of their clients’ needs. Staff from these services spoke of clients requiring assistance with changes in the benefits system (e.g. Jobseekers’ Allowance and Employment and Support Allowance) while also needing emergency support through community care grants or food banks. Interviewees from these services suggested that they also experienced increased volumes of people presenting for advice: “People are queuing from the back of eight to be seen”. However, not all had longstanding, complex needs. Indeed, some

1037 The cost of the cuts for poorer people and places
increase in the demand for advice services was said to come from new fractions of the population who might not have previously needed to access advice services. Low wages relative to the costs of living, as well as unemployment and benefit sanctions, were leading to greater demands being placed on these services. Some staff suggested that increased demand meant that they could not provide the same level of service to individual clients as before:
“We would form-fill for people, we would – if we had time – see clients and do it right from the initial claim right through. All of that form-filling has been cut, and for the types of clients that you’re getting in [this is a big problem]. And then we’re saying ‘well you can go to the library’.” Advice services provider
Pro-poor services under strain?The evidence of this research is of growing signs of strain in pro-poor services. It is also that, in some places, some services are in danger of not being able to meet all of the needs that are expressed. The most vulnerable parts of the population with complex needs appear most at risk in this respect. The testimony from the front line – service users, operational council staff and voluntary sector staff – points to this worrying situation, although perhaps less so in Renfrewshire.
Of the three groups participating in this research with a front-line perspective, service users were the least likely to suggest that pro-poor services were under strain. Nonetheless, Chapter 4 did demonstrate some evidence of this: they experienced housing offices as busy, stressed and uncomfortable places; and in relation to social work and social care, some difficulties were becoming evident in relation to staff continuity, waiting times and accessing staff. Participants in one focus group suggested that they were aware of service users who had experienced difficulties in accessing appropriate levels of help for mental health problems, and recounted tales of people they knew being offered an intervention that didn’t work, and then being told that funding would therefore be withdrawn without an alternative being offered. This group were particularly concerned that the most vulnerable would slip through gaps entirely:
“The most vulnerable don’t necessarily know how to ask for what they need and there doesn’t seem to be anyone to help them, pointing out what they need.” Service user, less disadvantaged neighbourhood
In another group, a participant was equally concerned:
“I think that they are going to miss a lot of families that need the help. Without a doubt. You’re going to have a lot more neglect, abuse that will probably go unnoticed because again if they’re not accessing a lot of these services then nobody is noticing. You’ve effectively got closed doors haven’t you?” Service user, less disadvantaged neighbourhood
However, it was the evidence from council and voluntary sector staff that most strongly suggested that some services were under significant pressure.

104The cost of the cuts: the impact on local government and poorer communities
In one council, staff provided a number of examples of services under stress and of where the needs of vulnerable people were going unmet. Reductions in staffing and resources were blamed, but also the increase in the sense of demarcation between services discussed in Chapter 5. Thus, there were examples of where responsibility for difficult problems was passed between services which found themselves over stretched, leading to unmet need.
“I call it slopey shoulders, not my job, nothing to do with me. People know about vulnerable individuals so they’re left, they ignore them, and then you find them six months later or a year later…” Neighbourhood services provider
Examples were provided in Chapter 5 which suggested that social work services were increasingly reluctant to take on cases, particularly where another service was involved and where there was no threat to life. One staff member discussed the difficulties they faced when getting help for individuals prone to severe hoarding:
“I’ve made many referrals to them, and they refuse to be the lead professional and to take that role.” Neighbourhood services provider
This staff member had asked for additional training to undertake the referrals they felt were necessary for clients to access services more directly. There was also an awareness that a reluctance to take on cases was likely to reflect significant pressure on the service:
“There must be a huge gap in the [name] team. I was on duty over the weekend, and I’ve got a client and her Alzheimer’s had progressed so badly, she was having severe paranoid episodes… and what happened? Nothing till Tuesday, and this happened Friday night… and I know they have the [specialist staff] on duty. So they must be very stretched.” Home-care services provider
While it may well be that the dynamic of a particular focus group can lead participants to want to share particularly extreme stories, the fact remains that there were such stories to share. While we should not overgeneralise from such examples – and indeed they were rare in the overall context of the research – there was evidence across the councils of services under pressure and showing stress.
The strain on council services was also noted by voluntary organisations. Interviewees from two services working with children and young people in different areas described the reluctance of social work colleagues to lead on cases or to get involved until the situation had reached a particular threshold: “there is no response until there is a crisis”. This was seen as a result of the mounting pressure on social work services.
Two other voluntary sector interviewees were concerned about the provision of mental health services for adolescents and young people. They suggested that tighter eligibility thresholds were in operation, but also felt that these services were under pressure from the “sheer volume of cases”:

1057 The costs of the cuts for poorer people and places
“I would say that there is a big cut back in one-to-one social work. One of our service users, she was with [mental health service] and they discharged her… I would say that they’ve got too much work on their caseload.” Voluntary sector service provider
Part C. Are the effect of cuts greater for poorer individuals or communities?
In this part of the chapter, we move away from thinking about how cuts are distributed between services to the broader question of how cuts impact on poorer people or places compared with those with more resources: does a given service reduction have the same impact on different groups? As with Part A, it is important to be clear that we report the unintended consequences of strategic action and service change.
The evidence suggested that the consequences are significantly worse for people who are poorer in three main ways:
• small ‘savings’ can make a big difference for poorer people • the impacts of service reductions accumulate more quickly in poorer areas• better-off service users can protect themselves to some extent.
Each is considered in turn.
Small ‘savings’ can make a big difference to poorer individualsFigure 22 showed that universal services used by population groups
across the social spectrum, such as libraries, swimming pools, parks and environmental maintenance, have been subjected to significant savings in the case studies. We might expect that these savings would affect all social groups equally but the evidence suggests the consequences are greater for those on lower incomes.
In Chapter 4, service users described their experiences of seemingly minor changes to the opening hours, location, frequency or cost of services. However, there are a number of ways in which these kinds of change can almost exclude poorer groups from services entirely.
Reductions in opening hours or changing the day on which a particular subsidised service was provided can have quite a significant impact on those with limited resources or work flexibility:
“There’s times I can’t go [to the library] because I’ve got my wee boy all the time so I have to wait until somebody can watch him if I need to go and do something on the computer and there’s been times I went in and it’s been shut and it’s five o’clock.” Service user, disadvantaged neighbourhood
“They’ve cut [free sessions at the pool] back as well – we can go but they’ve changed the day that it’s on. It’s Tuesday now instead of a Thursday. I’ve took my days when I went back to work so I could go swimming and now I can’t go ‘cos they changed the day.” Service user, disadvantaged neighbourhood

106The cost of the cuts: the impact on local government and poorer communities
Increased charges and costs can restrict social and cultural participation. Chapter 4 detailed a range of ways in which increased charges on local public transport impacted on vulnerable, quite isolated young parents to the extent that they left the house less frequently. That this could affect their own and their children’s health was clearly acknowledged. Service users gave examples of how these changes have meant that shopping trips are carefully planned because frequent trips are unaffordable. They have also outlined how higher costs and charges led to them being excluded from participation in ordinary social activities such as a trip to the local swimming pool.
There were also indications that reductions in subsidy to local arts and culture organisations could limit the participation of more disadvantaged groups. Participants spoke of not being able to afford some local shows, including dance and theatre productions, suggesting that increased ticket prices had effectively restricted such productions to better-off residents. Thus, in the past:
“… people could afford to go to things like that now and again… but now because they’re not getting the funding it’s only accessible for people who’ve got the money to pay a lot for tickets.” Service user, disadvantaged neighbourhood
In addition, a voluntary arts organisation had stopped its outreach work with vulnerable groups. It now operated from a centralised site, making it harder to access for those without a car.
The cumulative impact of all of these small changes to recreational services, whether to charges or opening hours, is that they narrow the social realm of children and families. They cut off parents’ and children’s access to wider social networks and possible friendship groups. This, coupled with parents’ concerns about their local neighbourhood, has meant that their children spend increasing amounts of time indoors. This confinement did not go unnoticed by service users, who worried about its possible impact on their children’s development:
“Kids miss out on being in a community. You end up wrapping them up, you can’t let them out. Then it ends up they’re not getting that experience. Now my boy’s about to go to secondary school and I’m really worried. He’s not streetwise.” Service user, disadvantaged neighbourhood
Charges are less affordable for those on low incomes but they may also have fewer alternatives. One resident found newly introduced charges for the collection of large unwanted items such as furniture prohibitive, and felt the effects were likely to be experienced disproportionately by individuals without access to a car:
“They’ve started charging people more for uplifts and they’re saying if you need anything taken to the local dump, do it yourself. But I don’t drive… so that means I have to pay all the time… and I don’t think that’s fair and I don’t understand why they’ve taken that stance.” Service user, disadvantaged neighbourhood
Changes to the location of a particular service could render it inaccessible to those reliant on public transport. Across the case studies, a range

1077 The cost of the cuts for poorer people and places
of research participants expressed concern that the location of some services was critical in determining the extent to which they were used by disadvantaged groups, or by those with challenges to their mobility including elderly groups and parents with young children.
This was most stark in relation to use of children’s centres, with both staff and service users very clear that the families who would benefit the most from the services on offer would only be drawn to use the centre if it was within walking distance. Co-location of centres with primary schools was considered an advantage, as it allowed parents to bring children of different ages to the same facility. No support was expressed for co-locating children’s centres with a broader range of services, or in fewer locations.
Indeed, the difficulties of travelling by public transport with young children was a routine theme in service user focus groups. This participant raised the issue in relation to the need to access a library in a different location, but it would be relevant in relation to all services:
“The nearest library to us… it’s hardly ever open now... To get to the nearest library with kids it’s two buses and it’s just not practical. It’s impossible really.” Service user, disadvantaged neighbourhood
Voluntary organisations were also concerned that people living in deprived areas would be disproportionately affected if local services were closed or merged: “Many people rarely leave [local area]… and bus fares have gone up so that’s further impediment.” Importantly, as Chapter 6 noted, they had also expressed concern that vulnerable groups would need support to access new digital forms of interaction with council services:
“We’ve got people with really low literacy skills and for a large proportion of our clients, English is a second language. We’ve also got people with a lot of mental health issues and these kinds of people can’t engage with telephone advice or web-based things or the complexity of their issue is such that even if they can engage they actually need more support than that.” Advice services manager
Council officers were similarly concerned that their vulnerable clients could become less visible in the cases where services were withdrawn from neighbourhoods and it became harder for these groups to contact the council:
“They have to come to the office, they have to contact us and tell us they’re vulnerable. And the one thing about a vulnerable person is they don’t generally contact you, because they can’t because they’re vulnerable.” Housing services provider
Impacts of service reductions accumulate quicker in poorer areasEarlier chapters identified concerns about the scale of service reductions with respect to the maintenance of streets, parks and playgrounds. In only one case study was there an explicit commitment to continue to afford a degree of priority to the most disadvantaged neighbourhoods in the council area. This was based on the understanding that such areas did not necessarily

108The cost of the cuts: the impact on local government and poorer communities
enjoy a ‘level-playing field’ in terms of how the built environment, or the level of busy-ness, or the structure of the population (e.g. lots of young people) could place some neighbourhoods at more risk of environmental problems than others. Until the current period of austerity, there was evidence of an increasing level of awareness of the need to ‘bend’ additional resource towards higher levels of need (Hastings et al, 2009).
The evidence of this research is that service reductions to poorer areas can quickly lead to a significant deterioration in standards of cleanliness. Almost immediately it becomes very challenging for residents to try to look after their neighbourhood amenity. Such reductions did not necessarily just relate to street-scene services, but reductions in housing staff and in the time they spent out and about on estates, noticing and attempting to resolve problems, was also said to have an impact.
While members of the research team witnessed some disadvantaged neighbourhoods that had not obviously suffered from a very significant deterioration in cleanliness, they also witnessed neighbourhoods where levels of litter, fly-tipped furniture and graffiti were reminiscent of earlier decades (when there was little audit or measurement of local environmental quality). It wasn’t just cleanliness which was the issue – the fabric of some neighbourhoods looked shabby and unmaintained. As one service user said:
“The run-down places, you can list the problems: potholes, loose stones, broken pavements.” Service user, disadvantaged neighbourhood
It was evident that poor levels of environmental maintenance could have knock-on effects on the ability of other service providers to deliver their service. A participant from a third-sector play organisation said that the organisation could no longer deliver their service to children in one area:
“We actually gave up in one area because we couldn’t use the space. You know, it wasn’t clean, it wasn’t fit for the children to use and we had to withdraw like ‘cos you know if there’s nobody going out there cutting the grass, dealing with the dog poo, the broken glass or possibly worse syringes or whatever.” Voluntary sector play service provider
This suggests that there is in effect a ‘double whammy’ to poor neighbourhoods – here the loss of environmental cleanliness also led to a loss of a different kind of service entirely.
Better-off service users are more able to protect themselves from the worst impacts of the cutsThe third way in which poorer people and places seemed to suffer a disproportionate impact of reductions in services rests on the additional capacity evident among some better-off groups to ‘protect’ themselves from austerity. In part, and importantly, this is a result of the fact that they can access commercial alternatives when services are withdrawn, whether this is play activities for their children or membership of a private gym. However, three further factors were demonstrated in the research evidence:
• uneven capacities for collective and individual advocacy• additional levels of personal mobility• evidence of fewer support needs when expected to take on more
responsibility.

1097 The cost of the cuts for poorer people and places
In relation to collective advocacy, there were concerns that residents in better-off areas could be more able to resist reductions in services. In one case study there were examples of where more advantaged groups had managed to stop the closure of libraries either by setting up a campaign or taking over its running. Of course, such campaigns and interventions were not always successful. In one case study a vociferous campaign failed to halt the closure of children’s’ centres in more affluent areas. However, across the case studies, it was clear that dissent from more affluent groups, and the publicity it attracted, could present the councils with significant practical and reputational challenges.
Individual advocacy was also in evidence in the form of complaints from better-off service users. The increase in volumes of complaints experienced by environmental services providers as a result of service cut-backs was highlighted in Chapter 5. In two case studies, these staff were clear that better-off individuals complained more, and would also more readily escalate a complaint by contacting their councillor:
“You’ll probably get less people complaining in [deprived area] than in [better-off area] ‘cos people in [better-off area] tend to ring up and complain that ‘there’s a crisp packet lying outside my house. Will you come and pick it up?’ whereas the group from [deprived] area won’t.” Environmental services provider
There was even an admission that this could skew services towards such areas:
“You find that the well-off areas tend to get a better service ‘cos they’re well off. It’s always: ‘I know such and such, I’ll phone councillor this or I’ll phone councillor that.’” Environmental services provider
Indeed, the view was expressed by a number of participants that the demands and expectations of elected members had not reduced in line with service reductions:
“They still want you to do what you were doing 10 years ago, you can’t do it but they still expect you to do it.” Environmental services provider
In one focus group, however, there was debate over whether better-off neighbourhoods were likely to be afforded a degree of protection when it came to reductions, closures and withdrawals. When a street-scene worker suggested that better-off areas were getting a better service because they complained more, a library service worker had a different view:

110The cost of the cuts: the impact on local government and poorer communities
“I don’t agree at all. I know from my perspective the library [in deprived area] is one of our absolute ‘mustn’t touch’ [ones]. It’s so important to that community we would never reduce our library service [there]. But we took the library away from [two affluent areas] where we felt they had alternatives… it’s more about following the council’s priorities and the council priorities are for resources for deprived areas where unemployment is high so that’s where we put our resources.” Library services provider
While this service provider is adamant about the importance of a clear directive from within council policy to ensure that the costs of the cuts do not fall on the most disadvantaged people and places, there may be some variation in how these issues play out in relation to different services, particularly more ‘low-profile’ services such as street cleansing.
There was also evidence that higher levels of personal mobility among better-off groups could help them overcome the centralisation or consolidation of services. In one area, children’s centre and voluntary sector staff were concerned about the consolidation of centres into clusters which were now responsible for providing the range of services previously provided by a single centre. They felt this could lead to more advantaged parents ‘crowding out’ services that would be of benefit to less advantaged groups. Both groups were aware of families ‘shopping around’ for services:
“There are about 10 families in the cluster who are driving around and getting their name down first.” Children’s services provider
Indeed, one service user indicated to the research team that she did exactly this. She spoke of the benefits this brought in terms of the range of activities her children could enjoy and the opportunities it afforded to mix with different parents:
“There seems to be a lot more services, a lot more variety of services… recently these centres have linked together… so you can actually go to different places which hold different things… so you can kinda rotate it. And it means taking the kids to different groups rather than the same people all the time.” Service user, less disadvantaged neighbourhood
Given this, it is also possible that it is the better-off who will benefit most by the attempts in the case studies to provide more holistic, improved services by joining up a range of services in ‘hubs’ operating at a single location – an unintended consequence clearly.
The tendency of better-off groups to ‘shop around’ was also observed by some voluntary sector interviewees in relation to their own services. They noted an increase in the numbers of less disadvantaged families accessing projects that were intended to meet the needs of more deprived groups, and believed this to be an impact of wider recessionary pressures and austerity. A play organisation reported more demand for children’s parties from less deprived groups seeking affordable alternatives, while another play organisation noted that better-off families were travelling to the activities and events they organised in parks located in disadvantaged parts of the city. The view was expressed that the mobility conferred by car ownership, as well

1117 The cost of the cuts for poorer people and places
as the capacity to pay for public transport, may lead to better-off groups ‘colonising’ some services intended for low-income groups:
“You’ll also get people that have the ability to drive or get public transport. I think we would say we have seen evidence of that and there’s lots of Facebook comments about that saying: ‘it’s great, it provides us with something to do in the holidays’. They like it ‘cos it’s not costing them any money.” Children’s services provider
Finally, there may be an indication of an uneven level of capacity to take on more responsibility between more and less disadvantaged neighbourhoods. The evidence for this was mixed, with a number of council staff in particular keen to play down suggestions of any unevenness. There were descriptions of activity in different kinds of places, although there was a sense that better-off groups tended to do a little more in terms of environmental upkeep in particular, but “not exclusively”. However, as Chapter 3 discussed, the existing capacity within disadvantaged communities is dwindling due to lack of resources and support for capacity-building. There is a sense that local authorities are already ‘living on borrowed time’ when trying to expand and intensify the involvement of these groups in service delivery.
Part D. Does the reliance on greater ‘targeting’ of services cause problems for low-income people and places?
To a greater or lesser extent, all four case studies were using increased targeting or restricting access to services to social groups with higher needs levels as one means of achieving savings (a form of retrenchment). It was generally considered a necessary but unwelcome way of managing budget gaps, which did also help to protect those in most need.
The challenge of targetingA wide range of services were subjected to increased targeting. This could be achieved by using place- or person-based criteria. In relation to place, as has already been highlighted, one case study was affording some protection to the environmental quality of the most disadvantaged neighbourhoods by reducing services in such places less than in other residential neighbourhoods. In another, children’s services and activities were increasingly focused in poorer neighbourhoods. In relation to people-based criteria, there was an example of an authority that had reconfigured free school meals so that the resource was now used to provide meals to very disadvantaged children attending activities arranged for school holiday periods as well as term-time. In at least two councils, while generic youth clubs had been reduced, youth services were still provided for disadvantaged young people.
There was evidence that service users were noticing that some services were now provided to a narrower range of clients. In one council, some service users had noticed a narrowing in eligibility for free ‘mother and baby’ sessions at local swimming pools:

112The cost of the cuts: the impact on local government and poorer communities
“Everyone used to be able to go before, from any area and now it’s only a certain postcode area can go.” Service user, disadvantaged neighbourhood
In the three English case studies, children’s centres were clearly moving to prioritise so-called ‘targeted families’. This was partly driven by the requirements of Ofsted who inspect such establishments:
“There is also a high expectation that there is still a universal offer, even on a reduced budget, for everyone who has a child under five in the area, but also very strict inspection guidelines on the targeted support that’s offered to families.” Children’s services provider
Practically, this could be challenging:
“… so every time a reduction comes into place, you’ve got to think, what are the priorities and can anything be lost, can we nip anything in?... it’s much more targeted [now].” Children’s services provider
In spite of its ‘progressive’ intent, targeting might still have a number of negative consequences. Services planned with general needs in mind may be overwhelmed and put under stress by a focus on a narrower clientele with increasingly complex needs, while increasingly tight screening criteria may exclude many with genuine need for services. Indeed, it can lead to the so-called ‘residualisation’ of services.
‘Mission shift’ and service stressOne immediate impact of targeting is that a broad range of services see a shift in their focus, becoming more ‘pro-poor’ than previously. It can mean services that were not designed to meet only the most complex and difficult of needs are now being expected to do this. The extent to which council and voluntary sector staff were becoming increasingly stressed by growing workloads and demands was highlighted in earlier chapters. It was clear that an additional source of stress can come from only dealing with clients in severe difficulty or challenging circumstances, rather than a mix.
One participant from an advice service described how the increased demand from people with complex issues is changing the nature of the service and making it more of a specialist service:
“One of the things we try to fight against is becoming a specialist debt and benefit advice agency but we kind of are. We want people to be able to access us for lots of other reasons… but because of the demands on the service I don’t think people are going to bother trying to access us if they’ve got, say, a consumer issue. They just can’t be bothered. It’s too much trouble so we’ve kind of ended up because we’re difficult to access and the demand is so high that people who do persevere and wait to be seen are the people with complex money-related issues.” Advice services provider

1137 The cost of the cuts for poorer people and places
Rising thresholds screening out those in real needWhile more disadvantaged groups could derive some benefit from the
development of more targeted approaches, they could also themselves fall victim to the narrowing of eligibility criteria. In one case study, staff who liaised with social work services had a strong sense that the criteria underpinning social work intervention had become higher. One told of how the general response when they tried to refer someone they regarded as having high needs was to be told: “they just don’t fit the criteria”. In one case they had written “a strong email” explaining the circumstances. This had caused the social worker service to carry out an assessment on this individual:
“… and they’ve agreed to take her on… but again, that took for me to write a very strong email to them to say, you know, this is a joke.” Neighbourhood services provider
Others told of their cases not being taken on by the social work service. In one case, the reason given was that:
“…basically, she can do things for herself, although she does she have mental health issues… But the picture I got from the social worker when I met her on site was that she sees her every week because she goes to her sister’s and she deals with her sister. It was a case of ‘she doesn’t meet the needs, she may have, like, minor mental health problems, she can do things herself’ and then sort of pushed her away. And the condition that the lady lives in is absolutely horrendous, you wouldn’t believe the way she lives.” Neighbourhood services provider
The fact that one service provider had referred their social work department for a safeguarding concern was discussed in Chapter 5.
As indicated in Chapter 6, voluntary organisations working with children have noticed that they are taking on more responsibility in the past few years in response to pressure on social services. In one council area this has meant a voluntary organisation working with children is increasingly the lead organisation on complex cases. Families that used to meet the thresholds for statutory involvement no longer qualify. As a consequence, the council is referring families with much higher levels of need than before to these charities.
Residualisation of services Poorer groups can also be affected by the introduction of more targeted service provision if this leads to a more general ‘residualisation’ of the service, i.e. where the service is only used by people with high levels of disadvantage and no other choice. There is quite considerable academic evidence to suggest that services for poor people become poor services (see for example McCormick and Philo, 1995; Forest and Murie, 2014) . A number of ways in which the quality of services can be compromised as a result of residualisation have already been alluded to, especially how the stress placed on staff can increase as the client base becomes dominated by people with complex needs.
Another well-established way in which services deteriorate when they are used almost exclusively by more disadvantaged groups with complex needs is via the impact on recruitment and staffing. Services can find it more difficult

114The cost of the cuts: the impact on local government and poorer communities
to attract or retain suitably qualified staff. According to one interviewee, their voluntary sector advice service was struggling with this issue:
“There is a definite loss of expertise, there is a drain. It’s quite hard to recruit, and lots of lawyers who specialise in social welfare law have decided the climate is too harsh and they’re going to something else.” Advice services provider
The fact that council staff reported a sense that some of their roles were being de-professionalised and deskilled was noted in Chapter 5. This issue appeared to be most apparent in relation to library and housing staff, but there were also indications that it might be a feature of other services such as advice and social work.
In relation to housing, for a number of years there has been very significant investment in education and training designed to ‘professionalise’ key roles. However, disinvestment in council-run housing services, particularly disinvestment associated with cuts to pay, was considered by some participants as likely to undermine the status of the profession:
“Anybody with a housing degree will not come into council housing because the pay is not there. They’re going to go to housing associations.” Housing services provider
There was a sense that both skill and knowledge were being lost and that the service would suffer as a result. Moreover, the public would not understand that some of the people they were interacting with did not have the professional knowledge and status to sort out problems properly:
“The qualifications are not there so we’re losing that, so people are going out ad hoc and giving advice that they’re not qualified to give. But the tenants or the residents still have that expectation that you’ll give them the right advice, but it’s not always the case.” Housing services provider
Concluding reflections
The analysis of the national picture of how pro-poor services have fared when savings decisions have been taken throws some important challenges into sharp relief. It demonstrates a largely shared ambition to afford relative protection to the services used more by poor people and places. The fact that those authorities with the highest concentrations of disadvantage are doubly challenged in this regard should be emphasised. Not only have these councils been subjected to the most significant levels of budget cuts, but the populations they serve will have a greater level of need for such services. The analysis of the absolute level of cuts that pro-poor services have been subjected to evidences the very significant constraints under which the sector operates.
Moreover, the analysis of the case study evidence shows the extent to which the business of local authorities is dominated by the needs of poorer and more vulnerable groups. The fact that around 90% of the expenditure

1157 The cost of the cuts for poorer people and places
of the case study councils is on services relied on by poorer groups, and that nearly two-thirds of spend is on services that these groups use to a disproportionate degree, implies a clear limit to the capacity of local councils to shelter poorer groups from the worst impacts of austerity.
The evidence from front-line council and voluntary sector staff, as well as from service users, is that poor people and poor places are feeling the impact of the cuts to services. Even minor cuts to services can be impactful and can have cumulative effects, as we have seen. However, for some people, social isolation as services retreat or costs go up is a real threat, as are circumstances in which their needs are not being properly addressed. While the ambition to deliver more holistic, person-centred services is clearly widely shared, the evidence of this study is that the efforts under way to actually achieve this in the current climate are operating against the odds. While austerity may have amplified the need for new, innovative ways of delivering services to be found, it is also acting as a constraint on the capacity needed to devise and deliver the most effective solutions.

116
8 KEY FINDINGS AND RECOMMENDATIONS
This report takes stock at what many have argued is likely to be the half-way point in relation to the overall level of cuts that local government will experience in the coming years. It asks where local government has got to and where it is likely to be heading if the cuts continue at the same pace. It focuses in particular on the impacts on poorer households and communities, and seeks to identify some key messages for policymakers that would enable the process to continue in a way that minimises harm and has most chance of delivering savings in a manner that supports more efficient and more effective local government services.
Before coming to these issues, we want to stress two points. First, the report should not be read as a criticism of the approaches that have been adopted by local authorities in general or the case study authorities in particular. Local authorities have suffered disproportionately compared with much of the public sector. They have been put in a position where they have to deliver high levels of savings year-on-year and these cannot be delivered without cutting important services. The case study authorities have been generous and courageous in opening themselves up to scrutiny at an extremely difficult time. Comments made here are not meant to imply any particular criticism of them.
Second, the discussion here assumes that cuts in funding for local government are likely to continue. It does this because there are no significant alternatives being proposed by the major political parties at this time. Regardless of the outcome of the 2015 general election, it seems that local government will need to continue to deliver substantial year-on-year savings. We therefore seek to identify ways of minimising the harms

1178 Key findings and recommendations
that these cuts will cause. It is essential to note, however, that these cuts should not be regarded as inevitable. Alternative strategies for dealing with the deficit could be devised: where deficit reduction proceeded significantly more slowly; where a greater burden was placed on tax rises rather than spending cuts; and where welfare expenditures were sheltered rather than targeted for disproportionate cuts. Such alternatives might be far more preferable to the current strategies of ‘austerity’.
Findings at the ‘half-way’ point in strategy of ‘austerity’
We would summarise the findings under three broad headings. First, the report suggests that we have reached a turning point or a moment of change in the process of local authorities delivering ‘austerity’. Where previous studies of the early years of the cuts suggested that local government was ‘coping’, this study finds that resilience is coming under increasing strain. Where previous studies have suggested that the impacts have been limited by the ability of councils to focus savings on back-office or other efficiency measures, this report finds a marked shift to reductions in front-line services.
Furthermore, it is almost inevitable that the next phase of the cuts process will involve much greater ‘retrenchment’ by local authorities as they withdraw from a range of service areas in which they have traditionally been involved. Sometimes new models of delivery and new partnerships will be devised to manage such withdrawals. Sometimes real reductions will take place. Retrenchment may also mean withdrawing from localised centres to more centralised access points, and greater emphasis on citizens serving themselves through the use of technology-based interfaces. There is the danger that, as councils pull back from some areas, gaps will open up between what they provide and the services supplied by other public or voluntary sector organisations.
There is growing evidence that the local authority sector is under stress and that ‘cracks’ are beginning to appear in many services. In many areas, staff report feeling overwhelmed by the scale and nature of the problems they are having to deal with. At the same time as their organisations are shedding staff, they find needs increasing. At least some of these needs result from the cuts in welfare benefits, which are creating a depth or intensity of problems that organisations have not faced before. These problems do not just affect local authorities but many organisations across the public and voluntary sectors.
Staff within local authorities are working very hard to ‘cushion’ service users from the worst impacts of the cuts, principally by taking on expanded workloads. The level of stress this entails does not appear sustainable in the longer term. There is evidence of voluntary sector organisations stepping in to fill some gaps but they face similar pressures of funding and staffing reductions, and report similar stresses on front-line staff. There is some evidence that community groups can play a role but that it is a very limited one. There is a particular concern that the legacy of previous investments in capacity-building in poor communities is time-limited and, indeed, threatened by the cumulative impacts of austerity measures. Indeed, this legacy may well be masking a potential unevenness in the extent to which civic responsibility and active citizenship can fill the gaps in services. Over the longer term, therefore, this agenda could widen inequalities.
Indeed, the idea that the cuts in local government funding are contributing to rising levels of inequality is the third key finding of this

118The cost of the cuts: the impact on local government and poorer communities
research. This is happening in spite of the efforts of local authorities to shelter the poorest people and places from the worst effects. There has been uneven treatment of authorities by central government, with authorities with more deprived populations suffering disproportionately higher levels of cuts. In England, there is a striking, growing convergence in the levels of funding between more and less deprived authorities, in effect an undoing of a long history of compensating for higher levels of need.
Many of the cuts in front-line services have been relatively modest to date, yet even these can have a substantial impact on the lives of poorer households. Poorer households are more reliant on a range of public services and so feel the cumulative impacts of multiple small cuts. Small increases in charges or in travel times or costs can represent an absolute barrier to access for those on low incomes. An increasing proportion of households report finding services inadequate or unaffordable.
Policy implications
1. From a focus on cuts to effective public service reformThere is a longstanding aim of transforming public services to achieve greater efficiency and effectiveness through activities such as better partnership working and investment in prevention. This agenda is being challenged or even undermined by the pace of the cuts. The speed of adjustment makes it very difficult for authority staff always to respond as strategically as they would like. While new approaches are being developed, this is often against the odds and it is clear that there will be uneven capacities in this respect. It is inevitable that, in some councils, the need to find short-term solutions to deliver balanced budgets will get in the way of developing new approaches, building new partnerships and investing in prevention. The loss of organisational capacity across the public and voluntary sectors is a further source of constraint.
There are warning signs that acute budget and service pressures can encourage a retreat to silos or ‘passing the buck’, particularly at the operational level. Ambitions to work in partnership to develop ‘joined-up’ solutions are being undermined. This includes the loss of good practice in some areas such as the loss of ‘link workers’ who had previously supported service integration and more joined-up delivery.
Further policy changes and the sheer complexity of change across the whole system of public and welfare services are a further burden.
Recommendation: It is necessary to slow the pace of the cuts if local government and its partners are to have sufficient time or ‘headroom’ to devise appropriate, strategic responses with the best chance of being effective over the long term.
Furthermore, it is necessary to avoid over-burdening the more deprived authorities by continued erosion of the needs elements within resource allocation systems. The policy of broadly equalising resources between authorities so that they are able to provide similar levels of service is one that has had very long-term support. There should be a national conversation about whether this principle should remain. This becomes all the more urgent as local authority resources become increasingly focused on poorer groups. Councils with high levels of disadvantage have even less room for manoeuvre in terms of protecting the poor than other councils.

1198 Key findings and recommendations
2. Enabling preventative servicesThe most worrying aspect of the cuts process is the reported threats to basic services that play a preventative or developmental function. Examples would include many services for children and young people such as play or education-related services, and many adult care services. These not only harm individual wellbeing or constrain opportunities; they are likely to be storing up problems for the future – problems that may well require expensive public service responses at a later date. They are a false economy.
Many local authority staff recognise the need for greater focus on prevention but argue that a combination of factors hinders this. Part of the problem is again the pace of cuts, as well as the loss of organisational capacity. An investment in preventative approaches may take some time to provide a payback. Furthermore, the fiscal benefits may flow to other organisations: local authority youth services may pay dividends elsewhere in terms of reduced crime or in better labour market outcomes; or local authority care may reduce demand for health services, for example. The authority that had done most in relation to prevention (Renfrewshire) is the one that had the lowest funding pressures. It is clear that the circumstances in which English local authorities find themselves make it very challenging for them to develop substantial programmes of preventative revenue investment capable of reducing long-term the level of need for their services.
Prevention activities are also a source of increased risk for an authority. Not all efforts will work or deliver the intended level of benefit. Leaving the risk entirely with the local authority is likely to lead to further inequalities between places.
Recommendation: The previous recommendation about easing the pace of cuts would apply here as well. In addition, there is a need for a major change in the nature and level of support from central government for investment or preventative activities.
It is essential that the means are found to ensure that the likely benefits of prevention fall on the organisation that has borne the costs, at least to some extent. New forms of accountability might also help to spread the risks associated with preventative work.
3. Supporting devolution (with conditions)Efforts to devolve greater powers to local authorities and to provide them with more autonomy were broadly welcomed across the four case studies. This included efforts to provide incentives or rewards for economic growth. In this respect, there appears to have been something of a cultural change, with an acceptance (at least in principle) of the risks this implies. Some councils are quite critical of current policy as lacking sufficiently strong incentives. However, our own analysis of the variation in the growth of business-rate income across local authorities – and indeed of a decline in income for some of the strongest proponents of devolution – suggests the need for caution in relation to this agenda.
It should be stressed that our finding with respect to cultural change comes from a small number of case study authorities so it is difficult to see how widely shared it might be. These authorities were, to some extent, self-selecting, and so are possibly more self-confident than the average.
Many participants recognised the challenges of linking growth to efforts to promote social inclusion or to ensuring that the benefits of economic growth were widely distributed. While initiatives were in place or under development, it was not clear that these were able to attain the

120The cost of the cuts: the impact on local government and poorer communities
scale required to make a very significant difference to the distribution of opportunities and benefits.
Recommendation: Some authorities would favour greater autonomy and sharper incentives for growth, particularly for the inclusive growth that needs to take place if we are to avoid poor places and people getting left behind. Investment strategies need to focus on how all citizens can benefit from economic growth and job creation in their areas if the level of demand on local services is to be reduced by this means. The drive to generate financial savings should not be allowed to undermine the development of local economic strategies which also support people into employment and improve job retention and progression from low-paid work. There is a considerable body of research evidence on how to connect poor people to better jobs (see Green, A, et al. Linking Jobs and Poverty in Cities; University of Warwick and Coventry University, York: Joseph Rowntree Foundation) but local authorities need both the time and resources to make sure that their approaches to growth are as inclusive as they can be.
4. Recognising the limits of localismThe coalition government has placed great emphasis on the potential for the withdrawal of local authority services to be met by a positive response from the voluntary sector and from civic society or community groups stepping in to take over or to fill gaps. The evidence was that there was not, however, capacity in the voluntary and community sectors to fill all of the gaps. While there were good examples of both voluntary and community sector activity in this regard, there was an absence of detailed strategies for developing activity in a coherent and comprehensive manner. Finally, the extent to which rising levels of need in poorer communities would compromise the ability to generate community-based solutions was also a concern.
Recommendation: There may be some complacency on the part of central government over the current capacity of disadvantaged communities to engage with the civic responsibility agenda. The legacy of previous investments in capacity-building may still be in play, and renewed efforts to provide such support are therefore required. Further, there is a need to find ways of sharing learning about precisely which services and roles provide scope for citizens to fill gaps – and which do not.
5. Monitoring and evaluationLocal authorities are keen to understand what impact their savings measures are having, and to understand any unintended and unexpected consequences of these. The impact on poorer people and places is of paramount concern to many of them. However, many research and evaluation roles have been deleted as part of savings measures focused on corporate functions. It is essential that the impacts of the second half of the planned programme of cuts are subject to close scrutiny.
Recommendation: There is a need to devise appropriate monitoring and intelligence systems that get beyond crude surveys measuring aggregate levels of public satisfaction. These need to capture not just the diversity of experiences between places, but also the views from within organisations of the levels of stress they are under. The exploitation of various kinds of administrative data may play an important role here, provided they can be drawn together effectively.
A key outcome of this research project will be the development of a practical tool-kit designed to help local authorities evaluate the nature and impact of their approaches to managing their budget gaps over time. This guide – to be published in early summer – will set out a range of steps that

1218 Key findings and recommendations
councils can take in order to monitor the impact of savings strategies on, for example, services used more by poorer groups. Although this research has evidenced the extent of the constraints placed on councils by austerity, effective systems of monitoring and evaluation can nonetheless identify if and where efforts to mitigate unintended or the worst effects of austerity might be possible.

122The cost of the cuts: the impact on local government and poorer communities
NOTES1 So far as practical, these estimates are adjusted to ensure comparability over time. They
exclude school funding (including the shift from local authority (LA) to academy schools) and the newly acquired public health responsibility/funding, and to allow for the localisation of council tax support. For further details, see Technical Report.
2 The NAO estimates differ from ours in using 2010/11 outturn as the base, so missing the ‘mid-year cuts’ of that year, and in excluding transferred spending responsibilities in the field of community care.
3 In a Press Association Newswire dated 28 November 2012, the Minister for Local Government in England Brandon Lewis responded to our previous report Coping with the Cuts (Hastings et al, 2013) and a parallel Audit Commission (2013) report by pointing to a House of Commons Library Report which stated that funding per household remains higher in deprived areas than in other parts of the country.
4 See for example Boyle (1966), Oates (1972), Musgrave & Musgrave (1980), Foster, Jackman & Perlman (1980), King (1984), Bramley (1990), Audit Commission (1993), Rattso (1998), Nam (2000), Smith, Rice & Carr-Hill (2001) and Bramley, Karley & Watkins (2011).
5 This appears to be the result of a policy decision by the Scottish Government, linked to the Concordat, not to cut local government more than other devolved spend. Moreover the Scottish devolved budget has not been decreasing as fast as might have been expected, because of interaction of Barnett Formula with other factors.
6 This covers children’s play facilities, school meals, after-school clubs, youth clubs, school transport and nurseries.
7 In addition, the English case studies were also originally selected on the basis of their early approaches to managing the cuts but, since these approaches have evolved considerably, they are not reported here. See Hastings et al (2012) for details.
8 The figure is an updated version of Figure 4.7 in Hastings et al (2013b). It has been updated with the latest information from the English case studies on their plans for 2015/16 and also includes the Renfrewshire case study.

123
REFERENCESAudit Commission (1993). Passing the Bucks: Impact on Standard Spending Assessments on Economy,
Efficiency and Effectiveness. Norwich: HMSO.
Audit Commission (2013). Tough Times: Councils’ responses to financial challenges from 2010/11 to 2013/14. London: TSO.
Boyle, L. (1966). Equalization and the Future of Local Government. Edinburgh: Oliver & Boyd.
Bramley, G. (1990). Equalization Grants and Local Expenditure Needs: the price of equality. Aldershot: Avebury.
Bramley, G., Karley, N. K. & Watkins, D. (2011). An outcome-based resource allocation model for local education services in Wales. Environment and Planning C: Government and Policy 29(5): 848–871.
Coventry City Council (2014). Pre-Budget Report 2015/16. Appendix 2: Savings Strategies. Coventry: Coventry City Council. At http://democraticservices.coventry.gov.uk/ieIssueDetails.aspx?IId=20735&PlanId=0&Opt=3#AI12159 [accessed 10 Feb 2015].
Coventry City Council (2014) Coventry open for business: our vision and priorities for the next 10 years. Coventry: Coventry City Council. At http://www.coventry.gov.uk/downloads/download/3018/council_plan__coventry_open_for_business_our_vision_and_priorities_for_the_next_10_year [accessed 23 Feb 2015]
Emerson, C. & Johnson, P. (2014) ‘How far through the consolidation are we?’ IFS Observations 30 October 2014 http://www.ifs.org.uk/publications/7422 [Accessed 22 Feb 2015]
Fitzgerald, A., Lupton, R. & Brady, A. M. (2013). Hard Times, New Directions? The impact of local government spending cuts in three deprived neighbourhoods in London. London: London School of Economics.
IFS (2014). IFS Green Budget 2014. London: Institute of Fiscal Studies. At www.ifs.org.uk/publications/7072 [accessed 10 Feb 2015].
Forrest, R and Murie, A (2014) Selling the Welfare State: The Privatisation of Public Housing London: Routledge
Foster, C., Jackman, R. & Perlman, M. (1980). Local Government Finance in a Unitary State. London: Allen & Unwin.
Hastings, A., Bailey, N., Bramley, G., Croudace, R., and Watkins, D. (2009) Street Cleanliness in Deprived and Better-Off Neighbourhoods: a Clean Sweep? Project Report. Joseph Rowntree Foundation, York, UK. http://www.jrf.org.uk/sites/files/jrf/neighbourhood-street-cleanliness-full.pdf [accessed 21 Feb 2015]
Hastings, A., Bramley, G., Bailey, N. & Watkins, D. (2012). Serving deprived communities in a recession. York: JRF. At www.jrf.org.uk/publications/serving-deprived-communitiesrecession [accessed 10 Feb 2015].
Hastings, A., Bailey, N., Besemer, K., Bramley, G., Gannon, M. & Watkins, D. (2013a). Coping with the cuts? Local government and poorer communities. York: JRF. At: www.jrf.org.uk/publications/coping-with-cuts [accessed 10 Feb 2015].

124The cost of the cuts: the impact on local government and poorer communities
Hastings, A., Bailey, N., Besemer, K., Bramley, G., Gannon, M., & Watkins, D. (2013b) Coping with the cuts? Local government and poorer communities. Project Report. University of Glasgow, Glasgow At: www.gla.ac.uk/media/media_296671_en.pdf [accessed 17 Feb 2015]
Hastings, A., Bailey, N., Bramley, G., Gannon, M. & Watkins, D. (2015) The cost of the cuts: The impact on local government and poorer communities. Technical report. At http://www.gla.ac.uk/schools/socialpolitical/research/urbanstudies/projects/servingdeprivedcommunitiesinarecession/technicalreport/
King, D. (1984). Fiscal Tiers: The economics of multi-level government. London: Allen & Unwin.
Ladd, H. F. (1999). The Challenge of Fiscal Disparities for State and Local Governments. Cheltenham: Edward Elgar.
McCormick, J. & Philo, C. (1995). Where is poverty? The hidden geography of poverty in the United Kingdom. In C. Philo (ed.) Off the map: The social geography of poverty in the UK. London: Child Poverty Action Group. Pp 1-22
Musgrave, R. & Musgrave, P. (1980). Public Finance in Theory and Practice (3rd edn). New York: McGraw-Hill.
Nam, C. W. (2000). Major disputes on the methods of calculating local expenditure needs: a case study for large German cities. Geographia Polonica 73(1): 77–93.
NAO (2014). The Impact of Funding Reductions on Local Authorities. London: NAO.
Newcastle City Council (2014) Vision, values and priorities. Newcastle: Newcastle City Council. At http://www.newcastle.gov.uk/your-council-and-democracy/policies-plans-and-performance/our-policies-and-plans/council-plan/vision-values-and-priorities [accessed 23 Feb 2015]
Oates, W. (1972). Fiscal Federalism. New York: Harcourt Brace.
Rattso, J. (ed.) (1998). Fiscal Federalism and State–Local Finance: the Scandinavian perspective. Cheltenham: Edward Elgar.
Renfrewshire Council (2014). A better council, a better future – statement from Leader of the Council, Mark Macmillan. At www.renfrewshire.gov.uk/webcontent/home/services/council+and+government/council+information%2C+performance+and+statistics/council+policies+and+plans/ce-abettercouncil [accessed 10 Feb 2015].
Renfrewshire Council (2014). Renfrewshire Council Plan 2014-2017 ‘A better future, a better council’ Renfrewshire: Renfrewshire Council. At http://www.renfrewshire.gov.uk/webcontent/home/services/council+and+government/council+information,+performance+and+statistics/council+policies+and+plans/ce-jl-council-plan
Service Transformation Challenge Panel (2014) Bolder, Braver and Better: why we need local deals to save public services. Public Service Transformation Network. At http://publicservicetransformation.org/images/2902929_ChallengePanelReport_acc3.pdf [accessed 23 Feb 2015]
Smith, P. C., Rice, N. & Carr-Hill, R. (2001). Capitation funding in the public sector. Journal of the Royal Statistical Society Series A 164(2): 217–241.

125
ACKNOWLEDGEMENTSWe are extremely grateful for the participation of a number of people in the research.
Senior staff in the four case study local authorities provided access to budgetary data, to a wide range of their colleagues as research participants and important feedback on our research. The project could not have been executed without their involvement, and we are extremely grateful given the multitude of other demands on their time.
We would also like to thank the frontline council staff who participated in focus groups and shadowing exercises. Their unique perspective has contributed greatly to the research. A number of representatives of voluntary organisations took part in the research and also assisted us in recruiting for and hosting council service user focus groups. We thank them for their generosity and support. And of course we would also like to thank the service users who willingly shared their views with us in interviews and focus groups.
The Project Advisory Group established for the project provided lively and insightful feedback on the research as it progressed. Its members were: Jonathan Carr-West (LGIU), Ed Cox (IPPR North), Joanne Fearn (Office for Civil Society), Carol Hayden (Shared Intelligence), Professor Ruth Lupton (LSE then University of Manchester), Adam Stewart (COSLA), Dame Mavis McDonald (JRF), Claire Richmond (Nottingham City Council then Richmond Baxter Ltd), Rob Tinlin (Southend-on-Sea Borough Council), Graham Kinshott (DCLG), Katherine Trebeck (Oxfam Scotland then Oxfam GB), Paul Tyrer (Scottish Government). David Hurst from the Scottish Government also provided valuable advice.
John Low acted as the Joseph Rowntree Foundation’s Project Manager throughout the various phases of the project until his retirement in December 2014. Josh Stott took on this role in the final months. We are grateful to them both for insight, encouragement and support.
We also thank Breannon Babbel, Kirsten Besemer, Claire Bynner, Roseanne Lynch, Steve Rolfe and Beth Watts for their assistance in carrying out some of the focus group sessions.

126
ABOUT THE AUTHORSAnnette Hastings is Professor of Urban Studies within the School of Social and Political Sciences at the University of Glasgow. Her recent research focuses on the nature and causes of urban inequality, with a particular focus on how local services can contribute to maintaining as well as tackling inequality. She also has a long standing interest in urban neighbourhoods, the dynamics between poor and better off neighbourhoods and policy and practice solutions to neighbourhood problems. She is currently a member of the Joseph Rowntree Foundation Task Group which is developing An Anti-poverty Strategy for the UK where she leads on a bespoke strategy for Scotland.
Nick Bailey is Professor of Urban Studies at the University of Glasgow. He has a long-standing interest in the analysis of poverty and inequality, and a particular interest in the equality of access for different groups and communities to public services. He has advised national and local government on individual and area measures of poverty and deprivation. He is currently involved in two major research centres: the Urban Big Data Centre at Glasgow and the Administrative Data Research Centre for Scotland. Both Centres aim to enhance the use of administrative data for research purposes.
Glen Bramley is Professor of Urban Studies based in the Institute for Social Policy, Housing, Environment and Real Estate in the School of Energy, Geosciences, Infrastructure and Society at Heriot-Watt University in Edinburgh. Recent research has focused particularly on planning for new housing, modelling the impact of planning on the housing market, housing need and affordability, low cost home ownership, poverty, deprivation and the funding and outcomes local services. From 2006 to 2010 he was on the Board of the National Housing and Planning Advice.
Maria Gannon is a Research Associate in Urban Studies in Social and Political Sciences at the University of Glasgow. She has over ten years of experience in applying quantitative methods in social research. She has a particular interest in the estimation of hidden or hard to reach populations and has applied various modelling techniques to provide estimates of problem drug use for Scotland, England and Northern Ireland. Lately her research interest have expanded to include measures of poverty and inequality and she has recently been involved in the Poverty and Social Exclusion in the UK Survey 2012, comparing the nature and extent of poverty and social exclusion in Scotland with the rest of the UK.

127About the authors
David Watkins is a Research Associate with the School of the Built Environment at Heriot Watt University. He has worked previously as a Town Planner for various Local Authorities and National Information Co-ordinator for Scottish Homes / Communities Scotland and specialises in data management, analysis and presentation, including the application of GIS to major datasets.

The Joseph Rowntree Foundation has supported this project as part of its programme of research and innovative development projects, which it hopes will be of value to policy makers, practitioners and service users. The facts presented and views expressed in this report are, however, those of the author[s] and not necessarily those of JRF.
A pdf version of this publication is available from the JRF website (www.jrf.org.uk). Further copies of this report, or any other JRF publication, can be obtained from the JRF website (www.jrf.org.uk/publications) or by emailing [email protected]
A CIP catalogue record for this report is available from the British Library.
All rights reserved. Reproduction of this report by photocopying or electronic means for non-commercial purposes is permitted. Otherwise, no part of this report may be reproduced, adapted, stored in a retrieval system or transmitted by any means, electronic, mechanical, photocopying, or otherwise without the prior written permission of the Joseph Rowntree Foundation.
Joseph Rowntree FoundationThe Homestead40 Water EndYork YO30 6WPwww.jrf.org.uk
First published 2015 by the Joseph Rowntree FoundationISBN: 978 1 90958 677 2 (pdf)Managed and typeset by Smith Creative