Embed Size (px)
Citation preview

El-Geneidy, Levinson, Diab, Boisjoly, Verbich & Loong
1
The cost of equity: Assessing transit accessibility and social disparity using
total travel cost
Ahmed El-Geneidy* E-mail: [email protected] David Levinson** E-mail: [email protected] Ehab Diab*** E-mail: [email protected] Genevieve Boisjoly* E-mail: [email protected] David Verbich* E-mail: [email protected] Charis Loong * E-mail: [email protected]
*McGill University: School of Urban Planning Suite 400, 815 Sherbrooke St. W. Montréal, Québec, H3A 0C2 Canada Tel.: 514-398-4058 ** University of Minnesota: Department of Civil, Environmental, and Geo- Engineering 138 Civil Engineering Minneapolis, Minnesota. United States Tel.: 612-625-6354 *** University of Toronto: Department of Civil Engineering - Transportation Engineering 35 St. George Street, Room: SF3001M Toronto, Ontario, M5S1A4, Canada Tel.: 416- 946-8299
For citation please use: El‐Geneidy, A., Levinson, D., Diab, E, Boisjoly, G., Verbich, D. & Loong, C. (2016). The cost of equity: Assessing accessibility by transit and social disparity using total travel cost. Transportation Research Part A: Policy and Practice, 91, 302‐316.

El-Geneidy, Levinson, Diab, Boisjoly, Verbich & Loong
2
ABSTRACT
Social equity is increasingly incorporated as a long-term objective into urban transportation
plans. Researchers use accessibility measures to assess equity issues, such as determining the
amount of jobs reachable by marginalized groups within a defined travel time threshold and
compare these measures across socioeconomic categories. However, allocating public transit
resources in an equitable manner is not only related to travel time, but also related to the out-of-
pocket cost of transit, which can represent a major barrier to accessibility for many disadvantaged
groups. Therefore, this research proposes a set of new accessibility measures that incorporates
both travel time and transit fares. It then applies those measures to determine whether people
residing in socially disadvantaged neighborhoods in Montreal, Canada experience the same levels
of transit accessibility as those living in other neighborhoods. Results are presented in terms of
regional accessibility and trends by social indicator decile. Travel time accessibility measures
estimate a higher number of jobs that can be reached compared to combined travel time and cost
measures. However, the degree and impact of these measures varies across the social deciles.
Compared to other groups in the region, residents of socially disadvantaged areas have more
equitable accessibility to jobs using transit; this is reflected in smaller decreases in accessibility
when fare costs are included. Generating new measures of accessibility combining travel time
and transit fares provides more accurate measures that can be easily communicated by
transportation planners and engineers to policy makers and the public since it translates
accessibility measures to a dollar value.
Keywords: Equity, Job accessibility, Transit fare, Travel time. Cost

El-Geneidy, Levinson, Diab, Boisjoly, Verbich & Loong
3
INTRODUCTION
Increasingly, social equity is incorporated as a long-term objective into urban transportation plans,
although what is meant by ‘equity’ varies widely (Manaugh, Badami, & El-Geneidy, 2015). Access
to opportunities such as jobs and services is one of the main benefits of a transportation service
such as public transit (Grengs, 2010; Jones & Lucas, 2012). Due to the central and peripheral nature
of cities, not all residents benefit from similar levels of accessibility (Martens, 2012). Nevertheless,
a fair distribution of transportation resources should provide commuters with various travel options
to increase their access to opportunities, particularly to jobs; this is often not the case despite stated
transport goals. Low-income and socially disadvantaged individuals are the most likely to be
transit-dependent (Denmark, 1998; Dodson, Gleeson, Evans, & Sipe, 2007), and often face greater
barriers to access their desired destinations (Lucas, 2012). To determine the level of opportunities
residents in a region can reach, as well as to assess the spatial distribution of public transit service,
typical research employs accessibility measures, which are measures of land use and transportation
interaction (El-Geneidy et al., 2015; Foth, Manaugh, & El-Geneidy, 2013). The simplest measure
of accessibility and most commonly used is known as cumulative opportunities, where within a
given time thresholds (usually 45 or 60 minutes) the number of opportunities that can be accessed
using a specified mode is counted. By revealing the level of accessibility of socially disadvantaged
neighborhoods, transport planners can evaluate the vertical or horizontal equity of transport
benefits spatially.
To date, transportation equity studies have focused on travel time as a constraint on
accessibility. However, financial access to transit is also crucial. For low-income populations,
transit fares present a barrier to accessibility, since fares can consume a large share of individuals’
budget (Carruthers, Dick, & Saurkar, 2005). Job accessibility research that ignores transit fares

El-Geneidy, Levinson, Diab, Boisjoly, Verbich & Loong
4
may overestimate job accessibility, particularly for low-income riders. It is accordingly important
to take the monetary aspect of commuting into account when examining accessibility.
The present study assesses the level of accessibility to jobs using public transit for people
residing in socially disadvantaged neighborhoods in Montreal region compared to those living in
other neighborhoods. In particular, we account for hourly wages and transit fares as important
constraints on accessibility, in the context of a complex fare structure involving 14 different
schemes. This methodology can benefit transportation planning agencies aiming to promote transit
equity based on transit service supply and fare structure. Also the generated measure can be
communicated easily to policy makers and the public as it will be either in a dollar value or travel
time.
This paper is organized in five sections. The first section provides an overview of the literature
on accessibility and equity issues in transportation. Next, the Montreal study context is presented,
followed by a description of the data and methodology used to generate and assess the accessibility
measures in relation to social equity. Results are analyzed spatially for the different accessibility
measures. Finally, the results are discussed and the recommendations and conclusions of the study
are presented.
LITERATURE REVIEW
What is Accessibility?
Accessibility is a measure of potential opportunities (Hansen, 1959). A simple measure of
accessibility is the cumulative opportunity measure, which counts the number of opportunities that
are reachable from a given location within a specified travel duration or travel distance when using
a particular travel mode (Geurs & van Wee, 2004; Vickerman, 1974). While this measure is simple
to calculate and understand, it evaluates all destinations equally, does not differentiate travel times
El-Geneidy, Levinson, Diab, Boisjoly, Verbich & Loong
5
except that they are above or below a threshold, and does not account for travelers’ perceptions of
time (Ben-Akiva & Lerman, 1979). The gravity-based measure of accessibility, on the other hand,
discounts the attractiveness of the destinations by the cost of travelling. Typically, these costs are
defined by the time or distance a person has to travel (Geurs & van Wee, 2004; Handy, 1994;
Hansen, 1959; Owen & Levinson, 2014; Vickerman, 1974). The main disadvantage of the gravity-
based measure, however is that its results are harder to communicate and interpret (Geurs & van
Wee, 2004; Owen & Levinson, 2014). Importantly, gravity and cumulative accessibility measures
are highly correlated, allowing their interchangeable use as necessary (El-Geneidy, Cerdá, Fischler,
& Luka, 2011; El-Geneidy & Levinson, 2006). Hence, cumulative opportunity is used in this study.
Accessibility and Equity
Measuring accessibility by public transportation is important to evaluate the distribution of services
in a region based on equity (Foth et al., 2013). However, what constitutes an equitable distribution
is difficult to define due to varying social norms and moral judgments (van Wee & Geurs, 2011).
Two main types of equity are generally evaluated in transportation planning: horizontal equity and
vertical equity. Horizontal equity refers to the uniform distribution of benefits and costs among
individuals within a group. Based on egalitarian theories, it avoids favoring one individual or group
over another. Most studies of horizontal equity look into spatial distribution of transportation
impacts. However, with regard to public transit, some groups are more likely require such service,
namely low-income populations that are transit-dependent (Pucher & Renne, 2003; Sanchez, Shen,
& Peng, 2004) as they cannot afford owning a car. According to Krumholz and Forester (1990), a
fair distribution of resources provides a greater variety of options to those with the least. This relates
to vertical equity, which considers the distribution of benefits between groups, and compares the
benefits across socio-economic groups, e.g. the well-off with marginalized and vulnerable

El-Geneidy, Levinson, Diab, Boisjoly, Verbich & Loong
6
populations. In the case of transportation, potentially disadvantaged populations include low-
income and unemployed people as well as minorities (Denmark, 1998; Dodson et al., 2007).
One way to investigate vertical equity issues in transportation is to assess the effectiveness
of the service provided by transit agencies among different stratified socioeconomic groups by
using accessibility as an indicator of the benefits provided by the land use and transportation system
in a region. Recently, Riccardi, Xia, and Currie (2015) studied transit accessibility in Perth,
Australia, and found that socially disadvantaged groups comprising of elderly people, low-income
households and no-car households suffered from inequitable distribution of accessibility using
transit services. In contrast the transit distribution in Toronto is such that residents living in areas
of lower socioeconomic status benefit from higher accessibility to jobs and have shorter travel
times than those living in areas of higher socioeconomic status (Foth et al., 2013). Yet, the level of
equity of accessibility varied throughout the day (El-Geneidy et al., 2015). As such, measuring
accessibility to important destinations, like employment, provides a useful tool to evaluate equity
issues in a region.
Accessibility by Cost
In the studies discussed above, accessibility is typically measured based on travel duration and/or
distance (Geurs & van Wee, 2004; Handy, 1994; Hansen, 1959; Owen & Levinson, 2014;
Vickerman, 1974). However, travel duration and/or distance is only one of the limiting components
of accessibility. As indicated by Lucas (2012), the cost of transit also constrains individuals in
reaching their desired destinations. Using three American case studies, Nadeau (2015) shows a
practical example of budgetary constraints, where low-wage employees working at airports cannot
afford transit services developed by the municipalities to connect employees to airports. In another
study, the Utah Transit Authority partnered with Farber, Bartholomew, Li, Páez, and Habib (2014)

El-Geneidy, Levinson, Diab, Boisjoly, Verbich & Loong
7
to assess the effects that distance-based fares would have on vulnerable populations. In general,
they found that riders with lower socioeconomic statuses traveled shorter distances than average.
Subsequently, they concluded that changing their fare structure from flat fares to distance-based
fares would reduce travel costs of low-income households and the elderly. However, their results
also indicated that distance-based fares would increase the travel costs for certain minority
populations living far away from the city center. In these studies, affordability is understood as the
fare of travel.
While there is an extensive literature on the impacts of unaffordable public transit, few
studies have incorporated transit fares into accessibility measures. Using travel-demand models,
logsum accessibility measures have been generated, which account for generalized travel costs.
(Geurs, Zondag, de Jong, & de Bok, 2010; Niemeier, 1997). While logsum measures have the
benefit of including a wide range of travel costs, these measures are hard to communicate and have
no physical interpretation.
Using an Origin-Destination travel survey, Bocarejo and Oviedo (2012) developed a
methodology to measures changes in accessibility by transit based on generalized travel costs,
which include the travel time cost (expressed in time), and an affordability component. The
affordability component represents the proportion of income spent on commuting, and is derived
from the average transport expenditures and income for each zone. Using the travel time and
affordability for each pair of origin-destination zones, the authors derive a zone-specific impedance
function, which is then used to measure accessibility based on standard parameters of time and
affordability, and on desired parameters. Developing a zone-specific impedance function allows
assessing the changes in accessibility resulting from time and cost savings, as done by the authors
for selected zones of Bogotà. Yet, expanding the methodology to all zones of a large metropolitan
area is challenging and requires a lot of resources that might not be available to planners.

El-Geneidy, Levinson, Diab, Boisjoly, Verbich & Loong
8
Additionally, the approach, based on reported affordability and travel times, does not measure
accessibility using specific transportation modes, e.g., using transit.
Few studies have incorporated travel time and transit travel fares into accessibility-by-
transit measures based on the actual network characteristics. The UK Department for Transport
developed a software to measure accessibility based on the travel time, the monetary travel cost, or
both. Yet, due to the lack of data, national indicators have been developed based solely on travel
times (Department for Transport, 2004). Nevertheless, the Department for Transport recommends
that local agencies include the travel time. In this regard, Currie (2004) measured accessibility by
transit in Hobart, a small Australian town, based on estimated generalized travel costs, including
travel time and travel fare. Travel times were converted into monetary values based on a wage of
$Aust 8.69/hour, and travel fares were estimated through an analysis of boarding and revenue data.
Currie (2010) conducted a similar “need-gaps” analysis in Melbourne, Australia, but simplification
was required due to the scale of the study area. As a result, travel fares were not included in the
cost of travel. Working with large metropolitan regions that include multiple transit agencies is a
significant challenge for including travel fares in generalized travel costs. Ford, Barr, Dawson, and
James (2015) developed accessibility measures based on generalized costs including time and fares
of travel for London. The fare of travel was based on a flat rate for a bus trip, and on an average
price/km for heavy and light rail services. This approach allows calculating fares based on readily
available data, but is not applicable to all large metropolitan areas. In many North-American cities,
fare structures, involving multiple agencies, are more complex and cannot be approximated with
simple indicators.
In sum, although travel fares are central for accessibility, and such factors have appeared
together in accessibility measures derived from regional travel-demand models or travel surveys,
few studies thus far have measured accessibility by including the observed cost of travel time

El-Geneidy, Levinson, Diab, Boisjoly, Verbich & Loong
9
together with the actual transit fare in large metropolitan areas. Such measures, developed in the
present study, allow measuring the performance of the transit and land use system, independently
from the characteristics of the users, and can then be used to conduct socio-spatial equity analyses.
Additionally, as few studies have used generalized travel costs, this study compares various
accessibility measures, including travel time and/or travel fare, and discusses the implications of
integrating different travel fares into the cost of travel. To our knowledge, no study has assessed
the loss in accessibility resulting from including transit fares or the difference in accessibility by
accounting for monthly or single fares.
STUDY CONTEXT
The Greater Montreal Area, also known and hereafter referred to as the Communauté
Métropolitaine de Montréal (CMM), is the second largest metropolitan region in Canada, with a
current population of nearly 4 million residents. While almost half of the residents reside on the
Island of Montreal, the population of off-island suburbs (yellow, green and orange regions in Figure
1) is increasing. Montreal’s major employment centers remain in the central business district and
other on-island centers that are accessible by transit (El-Geneidy et al., 2011; Shearmur, Coffey,
Dube, & Barbonne, 2007).
Transit in the CMM is coordinated by the Agence Métropolitaine de Transport (AMT), with
local agencies operating local bus service with separate fare schemes. The Société de Transport de
Montréal (STM), the transit agency of the City of Montreal and the largest transit agency in the
region (red in Figure 1), operates the metro and bus services on the Island of Montréal with more
than 759 metro cars and 200 bus routes, allowing for over a million trips per weekday. The AMT
is responsible for the commuter rail with the goal of transporting commuters from various suburbs
to downtown Montreal. As such, commuter train frequency is highest during weekday morning
and afternoon peaks, with little service off-peak weekdays, and weekends. The two other major

El-Geneidy, Levinson, Diab, Boisjoly, Verbich & Loong
10
transport agencies in the region are the Réseau de Transport de Longueuil (RTL) and the Société
de Transport de Laval (STL), with a total ridership of 200,000 per day. Several other small inter-
municipal transit agencies operate the in peripheral areas of the region (Figure 1).
With 14 separate fare schemes, transport within the Montreal region represents an
interesting case study. It is not unusual for transit users to have to purchase more than one transit
fare to travel within the region. For example, a single trip will cost $3.25 (CAD), regardless of
mode (bus or metro), transferring, time of day, or distance for travelling on the Island of Montreal
(red in Figure 1). However, travelling to Laval, the island north of Montreal, will cost $3.25 to
arrive there from Montreal, plus another fare of $3.25 to travel on the Laval transit agency’s
network. Moreover, residents living in one of the municipalities on the South Shore wishing to
travel to Laval, depending on proximity to commuter rail or the metro station in Longueuil, may
need to buy one fare for their local bus ($3, for instance) which travels to Montreal, then a fare to
use the Montreal metro ($3.25), and then another fare to use the local transit network in Laval
($3.25). All previous examples do not include travelling using the commuter rail system. This
system has different zones and fares than the explained above, which adds more complexity to the
context. Our calculations include all these complexities to capture zonal and fare network
differences in the CMM.

El-Geneidy, Levinson, Diab, Boisjoly, Verbich & Loong
11
Figure 1: Transport Agency Zones in the Montreal Metropolitan Region
DATA AND METHODOLOGY
To determine how equitable job accessibility is among socially disadvantaged groups compared to
the rest of the population in the CMM, we studied accessibility at 7 am during a weekday, either
based solely on travel time, solely on travel fare or on a combination of travel time and fare. When
combining travel time and fare, measures are reported both as a monetary value (converting travel
time to cost) and in time (converting cost to time).
Four main data sources are used in the analysis at the census tract (CT)-level, with a total
of 921 CTs in the CMM. The first is the demographic census tract information and comes from the
Statistics Canada National Household Survey (NHS) collected in 2011 (Statistics Canada, 2011).
This data includes household median income, unemployment rates, percentage of immigrants, and
educational achievement and is used to determine social and economic deprivation. The second
dataset provides data regarding the total number of jobs by CT in the CMM and is also obtained

El-Geneidy, Levinson, Diab, Boisjoly, Verbich & Loong
12
from the 2011 NHS (Statistics Canada, 2011). The third dataset is a cost matrix of daily and
monthly fare costs obtained from the AMT website for travel between all 14 transit agencies in the
region at 7 am and 12 pm. The final dataset is a transit travel time matrix based on May-June 2014
General Transit Feed Specification (GTFS) data for all 14 transit agencies. This dataset is used to
determine the travel times between CT origin and destination centroids using the OpenTripPlanner
Analyst developed by Conveyal (OpenTripPlanner, 2014).
Accessibility Measures
In this study, we used a cumulative accessibility measure to determine how residents throughout
the region have access to jobs (Geurs & van Wee, 2004). Specifically, we calculated cumulative
accessibility to jobs with transit at 7 am. In other words, we determined the number of jobs
reachable with transit (within a defined travel time and/or cost threshold) from every CT, to all
jobs in all CTs (including the CT of interest). Cumulative accessibility was calculated using the
formulas below:
Σ (1)
1if0if (2)
where Ai is the accessibility from zone i to all jobs in zone j, Oj is the number of jobs in zone j and
f(Cij) is the weighting function with Cij being the time or cost of travel from i to j, and t is the travel

El-Geneidy, Levinson, Diab, Boisjoly, Verbich & Loong
13
time or cost threshold. For cumulative accessibility, if travel time or cost is greater than a specified
threshold, jobs reachable beyond those thresholds are not counted (Equation 2).
Accessibility based on time
Initially, cumulative accessibility based solely on travel duration was generated. In this case, one-
way travel cost is expressed in minutes (Equation 3) with the following thresholds: 30, 45, 60, 75
and 90 minutes. The average commuting time by transit in the Montreal metropolitan region is 43.1
minutes, with 27% of the commuting trips by transit lasting more than 60 minutes, and 22% lasting
between 45 minutes and 60 minutes (Statistics Canada, 2011). Similar patterns are found
throughout Canada, with an average commuting time by transit of 42.9 minutes, and 28% of the
commuting trips lasting more than 60 minutes (19% between 45 and 60 minutes) (Statistics
Canada, 2011).
(3)
Accessibility based on fare cost
Second, accessibility based solely on fare cost was generated. The one-way travel cost is equal to
the cost of the fare (Equation 4) and thresholds are expressed in terms of minimum hourly wage in
Quebec ($10.35) as follows: 1 hourly wage, 1.5 hourly wages, 2 hourly wages, 2.5 hourly wages,
3 hourly wages and 4 hourly wages. Equation 1 is used as above, but substituting the following:
(4)

El-Geneidy, Levinson, Diab, Boisjoly, Verbich & Loong
14
where Fij is the cost of transit fare to travel from zone i to zone j.
Accessibility based on travel time and fare cost, expressed in monetary term
Third, we calculated accessibility based on both travel time and fare cost. Travel cost was
determined by multiplying minimum hourly wage in Quebec ($10.35) by the travel time, so one
hour of travel costs $10.35. In this way, we were able to determine the number of jobs accessible
by transit based on hourly wage (1, 1.5, 2, 2.5, 3 and 4 wages) and the transit fare used (discussed
further in the proceeding section). Equation 1 is used as above, but substituting cost with the
following formula:
(5)
where Cij is the time cost of travel, tij is the travel time in hours, w is the minimum wage per hour
($10.35), and Fij is the transit fare (either for a single trip or a monthly pass) to travel from zone i
to zone j.
Accessibility based on travel time and fare cost, expressed in time
Finally, cumulative accessibility was calculated including travel time and fare cost, but this time
expressed in terms of time. Cost was calculated with the following formula:
(6)
El-Geneidy, Levinson, Diab, Boisjoly, Verbich & Loong
15
where Cij is the time cost of travel, tij is the travel time in hours, w is the minimum wage per hour
($10.35), and Fij is the transit fare (either for a single trip or a monthly pass) to travel from zone i
to zone j.
Finally, to simplify comparisons throughout the region among social deciles and by
different fares, accessibility values are converted to normalized z-scores (El-Geneidy et al., 2015;
Foth et al., 2013).
Travel Time and Transit Fares
To determine travel times between census tracts, we generated a transit travel time matrix based
on GTFS database for all Montreal regional transit agencies. The used data was for the period from
May to June 2014. The region includes three major transit agencies as well as 11 inter-municipal
transit agencies that provide transit service for certain municipalities and connects them to various
regional destinations. The travel time from each CT centroid to every other CT centroid is measured
for a departure time of 7 am, and are organized to produce an OD travel time matrix. The commute
times include access and egress time, waiting time, time-in-vehicle, and transfer time. These
calculations were done using the OpenTripPlanner Analyst provided by Conveyal
(OpenTripPlanner, 2014). OpenTripPlanner provides the fastest transit route for a defined
departure time, and we matched this travel time to the transit fare described below.
While OpenTripPlanner provides an accurate transit itinerary many regions do not include
the fare costs in their GTFS data and just include a link to their websites. This was the case for the
CMM. Therefore, we used the fare calculator tool on the website of the regional public transport
coordinator in the CMM, AMT, to calculate the transit fare (AMT, 2015a). This was done manually
through querying origin and destination centroid coordinates of every CT that yielded different trip

El-Geneidy, Levinson, Diab, Boisjoly, Verbich & Loong
16
and fare options, using trips leaving closest to 7 am and 12 pm regardless of mode were selected,
and with the earliest arrival times (consistent with OpenTripPlanner routes). The prices for a single
fare and a monthly pass for that trip were recorded. Single fares varied more than monthly fares
because of the zonal nature of the territory (AMT, 2015b). Then, based on the monthly fare, we
calculated a single trip fare by dividing the total monthly cost by 44, which corresponds to returns
trips to and from a destination a total of 22 working days per month. Note that purchasing monthly
fares is the most cost-effective manner to access transit, but involves larger up-front costs than
single fares (Carruthers et al., 2005).
Social Vulnerability Indicator
To ascertain the social vulnerability of neighborhoods in the Montreal region, we used census tract-
level data from Statistics Canada’s 2011 NHS and Census (Statistics Canada, 2011). With the
assumption that socially disadvantaged groups are spatially concentrated (Ades, Apparicio, &
Séguin, 2012), we derived an indicator from four equally-weighted variables to identify socially
vulnerable neighborhoods at the CT-level. In addition to median household income, we also used
percentage of recent immigrants (since 2006), the percentage of the workforce that is unemployed,
and percentage of residents with education at the level of only a high school diploma (25–64 years
old). The current social indicator is a modification of previous work sensitive to the Canadian
context (Foth et al., 2013; Manaugh & El-Geneidy, 2012), but more specific to Montreal. Briefly,
immigrant status is relevant to the Canadian context because recent immigrants tend to be well
educated due to the Canadian immigration laws, yet they work for lower-wages and be employed
in lower skill trades, and have a greater likelihood to be unemployed compared to Canadian-born
workers (Canada, 2004). Nevertheless, we also included education levels to account for non-
immigrants with low educational achievement. Although previous work in Toronto included
El-Geneidy, Levinson, Diab, Boisjoly, Verbich & Loong
17
households that spend more than 30% of their income on rent (El-Geneidy et al., 2015), in the
Montreal area, this value was not significantly correlated with the other variables. All variables in
the indicator were correlated with a Pearson correlation coefficient above 0.5, in order to make sure
that they are explaining the same population. The indicator is in line with previous studies,
identifying low-income and unemployed people as well as ethnic minorities as potentially
disadvantaged groups (Dodson, 2005).
Each variable was then normalized as a z-score to determine how each tract compares to
the regional average, and all variables were then summed to give an overall score of social
disadvantage (for details of this measure see Foth et al. (Foth et al., 2013)). By grouping census
tracts into deciles based on the social deprivation indicator score, we identify the least
disadvantaged census tracts (top 10%, or 10th decile) ranging to the most disadvantaged census
tracts (bottom 10%, or 1st decile). It is important to note the statistical analyses presented in this
study compare the most socially disadvantaged census tracts (the first decile) to the other deciles.
Figure 2 shows the spatial distribution social deciles. As seen in the figure, the redder colors
demonstrate the more socially deprived areas. Most of the socially disadvantaged CTs (the first
three deciles) are located on the Island of Montreal (85%), while only about 15% are located off
the island. Also, generally speaking, socially disadvantaged CTs are mainly located around metro
lines, with the exception of one zone in the north of the Island. This area is known as a district
concentrating many socio-economic issues.

El-Geneidy, Levinson, Diab, Boisjoly, Verbich & Loong
18
Figure 2: Census tracts of the Montreal metropolitan region based on social vulnerability RESULTS AND ANALYSIS
REGIONAL ACCESSIBILITY TRENDS
First, we measured the cumulative opportunities job accessibility by transit using travel duration
throughout the region. This corresponds to the literature that normally calculates accessibility
based only on travel time (van Wee & Geurs, 2011). As seen in Figure 3, most of central
Montreal, with some off-Island locations near metro stations have medium accessibility to jobs
by transit within 45 minutes of travel time (Figure 3- A). Within 60 minutes of travel time, a
large proportion of CTs on most of the island, particularly around the metro lines and on the

El-Geneidy, Levinson, Diab, Boisjoly, Verbich & Loong
19
northeastern side of the Island, saw an increase in accessibility to jobs. A similar surge in
accessibility can be observed off the Island, especially on the South Shore and Longueuil, as well
as in Laval (Figure 3- B). This is attributable to the greater amount of available transit in terms of
suburban commuter rail and suburban buses at these locations and their usefulness for linking
South Shore and Laval residents with job centers on the Island of Montreal.

El-Geneidy, Levinson, Diab, Boisjoly, Verbich & Loong
20
Figure 3: Number of jobs accessible by transit based solely on travel time and solely on fare
El-Geneidy, Levinson, Diab, Boisjoly, Verbich & Loong
21
Next, we asked how job accessibility throughout the region would depend on the out-of-
pocket cost of a transit fare based on hourly wage. Put another way, how many jobs can a
resident reach for a given wage with a single or monthly fare? Interestingly, one hour’s wage will
buy access to most jobs on the Island of Montreal and the shores surrounding it (Figure 3- C), and
one-and-a-half hour’s wage will buy access to all the jobs throughout the CMM, based on the
cost a single fare to the appropriate census tracts (Figure 3- D). These results seem to indicate
that the entire region is highly accessible with transit given the current hourly minimum wage in
Quebec. Nevertheless, travelling is based not only on out-of-pocket costs, like transit fares, but
also on travel time cost. So using transit fare as the only cost in an accessibility measure is likely
misleading. It should be noted that for all of the previous four maps, the same scales were used
allowing us to compare across maps.
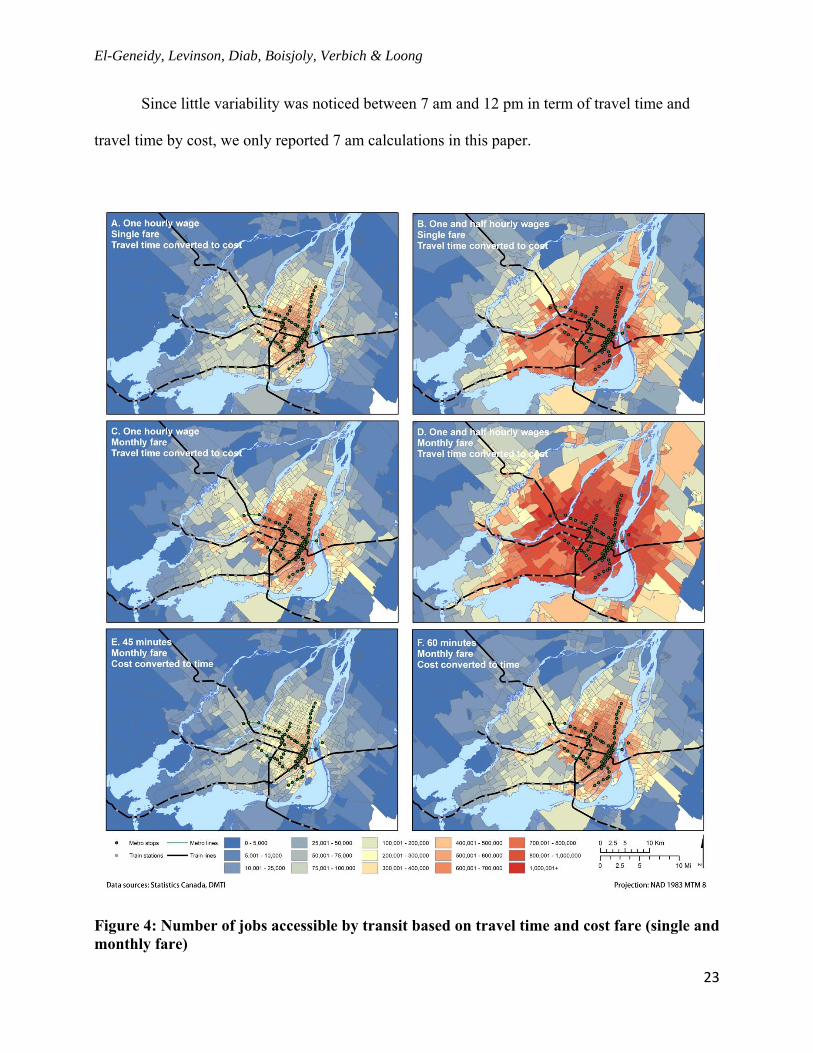
To gain a more realistic picture of accessibility based on fare cost and travel time, we used
two methods illustrated on Figure 4. The first is based on using the travel cost as a combination
of transit fares and travel time converted to monetary value (based on hourly wage), and then
calculating the number of jobs reachable within given thresholds of defined wages (the threshold
values are discussed in the previous section). As an example of the results, Figure 4 – A to D
shows the total number of jobs that are accessible by transit within one minimum wage and one-
and-a-half minimum wages. While Figure 4 E-F is based on calculating travel time as
combination of both transit fares converted to travel time (based on hourly wage) and travel time.
Then, cumulative accessibility is measured based on travel time thresholds as normally done in
the literature.
For the time value of an hourly wage and the cost of a single transit fare, at a departure
time of 7 am, the CTs nearest to metro stations and some off-Island areas near commuter stations
have high job accessibility (Fig. 4- A). The picture changes dramatically, as an outward spread

El-Geneidy, Levinson, Diab, Boisjoly, Verbich & Loong
22
from the center of accessibility for a larger travel cost of one-and-a-half hour’s wage and a single
fare. Most of the CTs on the Island and on the North and South Shore suburbs have excellent job
accessibility. In addition, more areas have greater accessibility in the western portion of the
Island near the commuter rail (Fig. 4- B). This is likely due to the number of offered train trips
during the morning peak hours.
While analyzing cost based on a single fare is a good approximation for accessibility by
cost, commuters travelling on a daily basis likely purchase monthly fares, since these are cost-
effective and usually cheapest per ride (Carruthers et al., 2005). Therefore, we also mapped job
accessibility based on monthly fares calculated per ride. Importantly, we found that more CTs in
the CMM had greater accessibility for both an hour and one hour-and-a-half’s wages’ time cost
based on a monthly fare (Fig. 4 - C and D) compared to job accessibility with a single fare. This
result indicates that buying a monthly pass enables greater job accessibility for larger share of
residents than the price of a single ticket for the same travel cost. These findings reveal that
including both the cost of a fare and the cost of travel time is an important consideration when
studying accessibility.
Figures 4 – E and F show the other accessibility measure results that are based on
converting monthly fare cost to time. Very similar trends can be found across these two maps and
the previously discussed maps that are based on the monthly fares. In fact, Figure 4 - C and F
are almost identical. This is expected since in both figures, the accessibility measures were
calculated based on an hour threshold: 60 minutes (Figure 4 – C) and one hour of minimum wage
(Figure 4 - C). Thus, both accessibility measures can be used interchangeably while evaluating
the regional accessibility, while keeping in mind which one could be easier to interpret and to
communicate to the public according to the context. It should be noted that for all of the previous
maps, the same scale was used allowing us to compare across maps.
El-Geneidy, Levinson, Diab, Boisjoly, Verbich & Loong
23
Since little variability was noticed between 7 am and 12 pm in term of travel time and
travel time by cost, we only reported 7 am calculations in this paper.
Figure 4: Number of jobs accessible by transit based on travel time and cost fare (single and monthly fare)

El-Geneidy, Levinson, Diab, Boisjoly, Verbich & Loong
24
Correlations between measures
Several correlation matrices are used to understand the relationship between accessibility
measures. Table 1 shows the correlation between the total number of jobs that can be reached
within different travel time and cost thresholds by transit. Generally, the table shows that for the
number of jobs that can be reached within a cost of one hour of minimum wage (using a single
transit fare), there is very high correlation at 95% with 45 minutes travel time. This indicates that
the two variables tend to increase (or decrease) together. This correlation value increases to 99%
by using accessibility based on monthly fares. This indicates that the number of jobs that can be
reached within one hour of minimum wage and based on monthly fare is almost connected to the
number of jobs that can be reached within 45 minutes, with an almost perfect linear relationship.
Using monthly fare causes less variation compared to using single fare while accounting for the
changes in accessibility based on time versus cost. A very similar tends can be found in the table
between accessibility measures using monthly fares and travel time. One-and-a-half hour’s wage
accessibility using a single transit fare is highly correlated at 94% with using 60 minutes
accessibility threshold. However, when we consider a monthly fare, the one-and-a-half hour’s wage
accessibility correlation increases to 96%. While these correlations do not imply the difference
between the measures, they rather show the extent to that they are changing together. The following
section investigates the differences between accessibility measures that are based on the monthly
fare and travel time.
El-Geneidy, Levinson, Diab, Boisjoly, Verbich & Loong
25
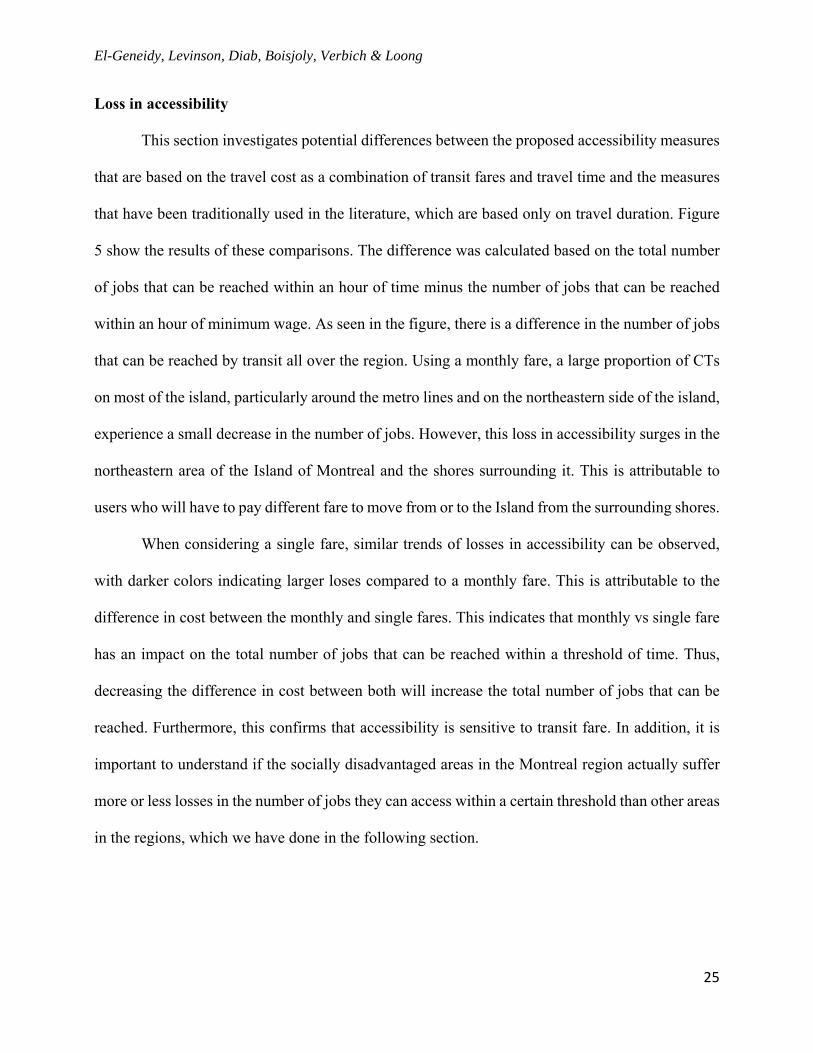
Loss in accessibility
This section investigates potential differences between the proposed accessibility measures
that are based on the travel cost as a combination of transit fares and travel time and the measures
that have been traditionally used in the literature, which are based only on travel duration. Figure
5 show the results of these comparisons. The difference was calculated based on the total number
of jobs that can be reached within an hour of time minus the number of jobs that can be reached
within an hour of minimum wage. As seen in the figure, there is a difference in the number of jobs
that can be reached by transit all over the region. Using a monthly fare, a large proportion of CTs
on most of the island, particularly around the metro lines and on the northeastern side of the island,
experience a small decrease in the number of jobs. However, this loss in accessibility surges in the
northeastern area of the Island of Montreal and the shores surrounding it. This is attributable to
users who will have to pay different fare to move from or to the Island from the surrounding shores.
When considering a single fare, similar trends of losses in accessibility can be observed,
with darker colors indicating larger loses compared to a monthly fare. This is attributable to the
difference in cost between the monthly and single fares. This indicates that monthly vs single fare
has an impact on the total number of jobs that can be reached within a threshold of time. Thus,
decreasing the difference in cost between both will increase the total number of jobs that can be
reached. Furthermore, this confirms that accessibility is sensitive to transit fare. In addition, it is
important to understand if the socially disadvantaged areas in the Montreal region actually suffer
more or less losses in the number of jobs they can access within a certain threshold than other areas
in the regions, which we have done in the following section.

El-Geneidy, Levinson, Diab, Boisjoly, Verbich & Loong
26
Table 1: Correlation matrix between accessibility measures Travel time Monthly fare with travel cost Single fare with travel cost
Wit
hin
30 m
inut
es
Wit
hin
45 m
inut
es
Wit
hin
60 m
inut
es
Wit
hin
75 m
inut
es
Wit
hin
90 m
inut
es
One
hou
rly
wag
e
One
and
hal
f ho
urly
w
ages
Tw
o ho
urly
wag
es
Tw
o an
d ha
lf h
ourl
y w
ages
Thr
ee h
ourl
y w
ages
One
hou
rly
wag
e
One
and
hal
f ho
urly
w
ages
Tw
o ho
urly
wag
es
Tw
o an
d ha
lf h
ourl
y w
ages
Thr
ee h
ourl
y w
ages
Tra
vel t
ime
Within 30 minutes 1.00
Within 45 minutes 0.82 1.00 Within 60 minutes 0.71 0.92 1.00 Within 75 minutes 0.64 0.85 0.95 1.00 Within 90 minutes 0.57 0.77 0.89 0.96 1.00
Mon
thly
pas
s w
ith
tra
vel
cost
One hourly wage 0.80 0.99 0.93 0.85 0.77 1.00 One and half hourly wages 0.64 0.86 0.96 0.98 0.94 0.87 1.00 Two hourly wages 0.51 0.70 0.83 0.93 0.98 0.71 0.91 1.00 Two and half hourly wages 0.37 0.54 0.67 0.78 0.88 0.55 0.75 0.92 1.00 Three hourly wages 0.26 0.38 0.49 0.60 0.72 0.39 0.57 0.76 0.93 1.00
Sin
gle
fare
p
urc
has
e w
ith
tr
avel
cos
t One hourly wage 0.86 0.95 0.84 0.76 0.69 0.95 0.78 0.62 0.47 0.33 1.00 One and half hourly wages 0.69 0.90 0.94 0.90 0.83 0.93 0.93 0.79 0.62 0.46 0.85 1.00 Two hourly wages 0.57 0.79 0.90 0.93 0.91 0.81 0.96 0.91 0.76 0.59 0.72 0.91 1.00 Two and half hourly wages 0.48 0.68 0.81 0.90 0.94 0.70 0.90 0.97 0.88 0.73 0.61 0.80 0.94 1.00 Three hourly wages 0.39 0.57 0.70 0.81 0.89 0.58 0.79 0.93 0.95 0.87 0.49 0.67 0.83 0.94 1.00
Number of jobs within different travel time and cost thresholds by transit at 7 am ***Using Pearson correlation test: All correlations are significant at the 0.01 level.

El-Geneidy, Levinson, Diab, Boisjoly, Verbich & Loong
27
Figure 5: Difference in accessibility to jobs including fare cost (single fare and monthly fare) compared to accessibility based on travel time only

El-Geneidy, Levinson, Diab, Boisjoly, Verbich & Loong
28
TRENDS BY SOCIAL DECILE
This section assesses the distribution of transit benefits across all CTs based on the social
disadvantage decile. It compares the transit benefits, in terms of accessibility, of the most socially
disadvantaged CTs to the rest of the CTs in the CMM. Table 2 presents summary statistics of
accessibility by cost for each decile. Note that the results are consistent with the accessibility by
time. Table 2 uses ANOVA tests to compare each decile’s accessibility by cost and travel time to
the first decile.
Generally speaking, socially vulnerable CTs enjoy higher levels of accessibility, both in
terms of travel cost and travel time, while socially advantaged tracts enjoy lower levels. Deciles 5
to 10 (in bold in Table 2) show significantly lower accessibility than decile 1. These findings
suggest that public transit supply and fares provide equitable benefits in terms of vertical equity.
The provision of public transit generally favors vulnerable populations in Montreal. This is also
consistent with the social indicator map (Figure 2) showing that low-income and immigrant
populations generally reside in central Montreal, relatively near metro stations. Inversely, high-
income, non-immigrant populations are concentrated in suburban areas. Socially vulnerable
populations may decide to locate near major transit lines, as they are more likely to be transit-
dependent.

El-Geneidy, Levinson, Diab, Boisjoly, Verbich & Loong
29
Table 2: Standardized accessibility measures by CT decile on the social deprivation scale
Deciles Mean* Min. Max. Range Std. Dev.
Mean* Min. Max. Range Std. Dev.
Monthly pass with travel cost
within one hourly wage Monthly pass with travel cost
within one and half hourly wages Decile one 0.94 -0.89 1.76 2.65 0.57 0.81 -0.01 1.18 1.19 0.26 Decile two 0.96 -0.89 1.79 2.68 0.55 0.82 -0.11 1.20 1.31 0.26 Decile three 0.77 -0.86 1.75 2.62 0.66 0.74 -0.56 1.22 1.78 0.31 Decile four 0.70 -1.09 1.84 2.94 0.70 0.65 -1.75 1.20 2.95 0.47 Decile five 0.28 -1.13 1.58 2.72 0.88 0.43 -1.78 1.18 2.96 0.62 Decile six -0.28 -1.18 1.21 2.39 0.70 0.05 -1.84 0.93 2.77 0.71 Decile seven -0.74 -1.18 1.18 2.36 0.55 -0.62 -1.90 0.86 2.76 0.87 Decile eight -0.91 -1.18 1.01 2.19 0.47 -0.96 -1.90 0.74 2.64 0.83 Decile nine -1.03 -1.18 0.62 1.80 0.25 -1.13 -1.90 0.62 2.52 0.72 Decile ten -1.00 -1.18 0.76 1.94 0.42 -1.14 -1.90 0.84 2.74 0.76
Single fare with travel cost within one hourly
wage Single fare with travel cost within one and half
hourly wages Decile one 0.88 -0.79 1.94 2.73 0.81 0.93 0.14 1.35 1.21 0.27 Decile two 0.94 -0.73 1.98 2.71 0.76 0.88 -0.94 1.37 2.31 0.32 Decile three 0.70 -0.88 1.93 2.81 0.88 0.77 -0.87 1.38 2.25 0.40 Decile four 0.61 -0.90 2.00 2.90 0.89 0.68 -1.37 1.40 2.77 0.53 Decile five 0.19 -0.96 1.74 2.70 0.96 0.42 -1.37 1.33 2.70 0.71 Decile six -0.38 -0.97 1.38 2.35 0.65 -0.03 -1.46 1.10 2.56 0.75 Decile seven -0.71 -0.97 1.48 2.45 0.46 -0.72 -1.46 0.96 2.42 0.71 Decile eight -0.80 -0.97 1.15 2.12 0.38 -0.98 -1.46 0.95 2.41 0.63 Decile nine -0.88 -0.97 -0.18 0.79 0.14 -1.16 -1.46 0.82 2.28 0.45 Decile ten -0.83 -0.97 0.82 1.79 0.37 -1.14 -1.46 0.90 2.35 0.61 * Bold indicates that the mean difference is significant at the 0.05 level compared to decile one.
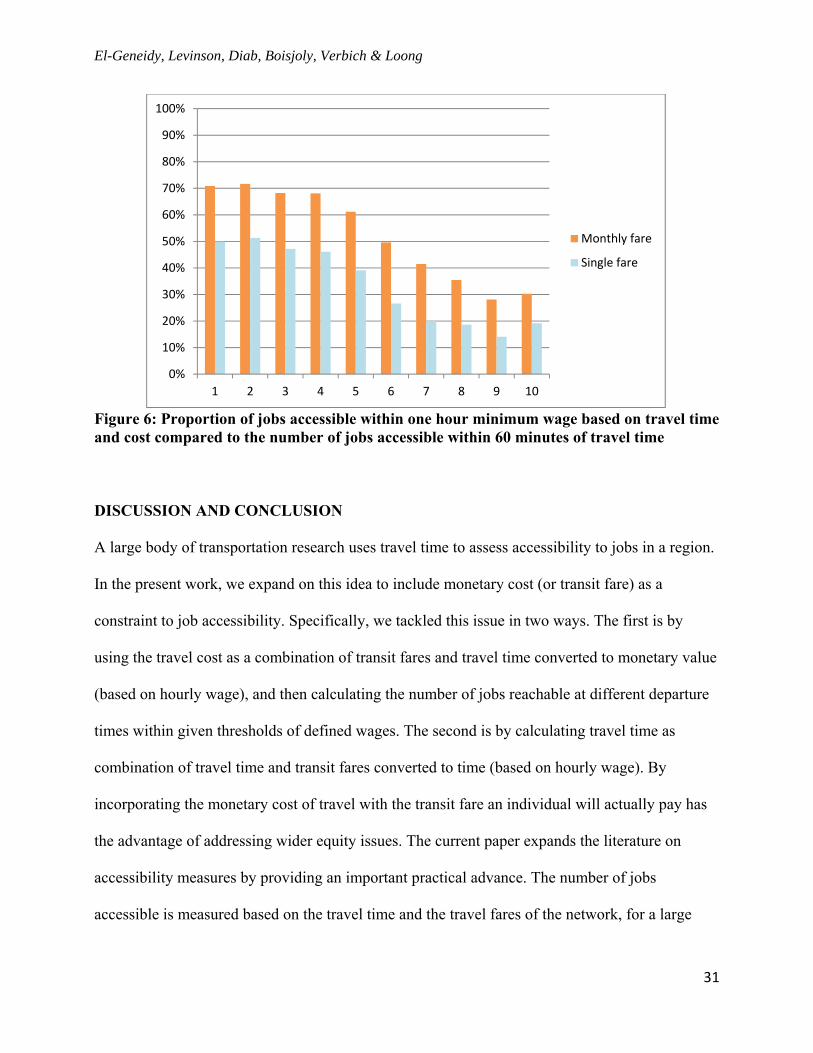
Figure 6 presents the proportion of jobs that are accessible within one hour’s wage
(including travel time and cost fare expressed in monetary terms) compared to the number of jobs
calculated with the traditional measure of accessibility based on travel duration (within 60
minutes). Results show for decile 1, based on a monthly pass, only 70% of the jobs (measured with
travel time duration) are accessible when including fare cost. Accordingly, 30% of the jobs
calculated with the measure based on travel time duration are not accessible when including fare
cost. The decrease is more pronounced when looking at a single fare (50% for decile 1). This
confirms that accessibility is sensitive to transit fare. Nevertheless, results show that socially
advantaged deciles experience bigger decreases in accessibility, when including fare cost. This is
likely due to the fact that they are mainly located in suburban areas, where travel fares are
significantly more expensive (up to $21 of cost).
El-Geneidy, Levinson, Diab, Boisjoly, Verbich & Loong
30
While the results suggest that socially disadvantaged decile have higher accessibility to jobs
by transit, they do not account for the individual characteristics that might affect their ease of
reaching their desired work destination. Firstly, the analysis does not account for the types of jobs
that can be reached (as has been done by, for example, El-Geneidy et al. (2015)). As low-income
jobs are increasingly located in the suburbs in many North-American cities, accounting for low-
income jobs only could yield different results. Namely, our results suggests that residents living in
suburban areas will experience greater loss in accessibility when including the travel costs. Similar
results are to be expected for workers commuting to suburban areas. Using this paper methodology,
the results from this social decile analysis could be augmented by investigating differentiated travel
needs of low-income households with respect to their desired destinations. Atypical working hour
could also be further investigated, as low-income households are likely to travel outside the peak-
hour, which might require higher or shorter travel times.
Secondly, low-income households are expected to have higher budget constraints, which
can limit their accessibility to jobs, more than for higher income households. Also, as suggested in
the literature, low-income individuals may be willing to travel more time to save travel costs
(Bocarejo & Oviedo, 2012) or to purchase more expensive fares (single tickets and weekly passes
rather than monthly passes) (Hickey, Lu, & Reddy, 2010; Verbich & El-Geneidy, 2016). Thus,
using fixed time or monetary thresholds does not account for the differences in wages, and available
time budget and cost constrain. Nevertheless, by using different time and cost thresholds, it is
possible to account for some levels of variations. Building on this methodology, further studies
could measure the accessibility of different socio-economic groups in terms of the percentage of
the household budgets spent on transportation, whenever data is available. Additionally, different
values of time could be used to account for different travel preferences.
El-Geneidy, Levinson, Diab, Boisjoly, Verbich & Loong
31
Figure 6: Proportion of jobs accessible within one hour minimum wage based on travel time and cost compared to the number of jobs accessible within 60 minutes of travel time
DISCUSSION AND CONCLUSION
A large body of transportation research uses travel time to assess accessibility to jobs in a region.
In the present work, we expand on this idea to include monetary cost (or transit fare) as a
constraint to job accessibility. Specifically, we tackled this issue in two ways. The first is by
using the travel cost as a combination of transit fares and travel time converted to monetary value
(based on hourly wage), and then calculating the number of jobs reachable at different departure
times within given thresholds of defined wages. The second is by calculating travel time as
combination of travel time and transit fares converted to time (based on hourly wage). By
incorporating the monetary cost of travel with the transit fare an individual will actually pay has
the advantage of addressing wider equity issues. The current paper expands the literature on
accessibility measures by providing an important practical advance. The number of jobs
accessible is measured based on the travel time and the travel fares of the network, for a large
0%
10%
20%
30%
40%
50%
60%
70%
80%
90%
100%
1 2 3 4 5 6 7 8 9 10
Monthly fare
Single fare
El-Geneidy, Levinson, Diab, Boisjoly, Verbich & Loong
32
metropolitan area including multiple transit agencies. The suggested method provides a simple,
replicable accessibility measure that can be used to assess the performance of the land use and
transportation system. If planners can explain to policy makers the number of jobs a resident can
reach for a given cost, then fare structures and hourly wages can be judged against the cost of
commuting. Additionally, this research shows that excluding transit fares from accessibility
assessments overestimates accessibility, and this is even more significant when comparing to
single fares.
Beyond presenting new ways of measuring the spatial distribution of accessibility
specifically, or transit benefits more generally, our study also reveals that job accessibility in the
Montreal region is equitable from a vertical standpoint. Indeed, residents in the most
disadvantaged neighborhoods in Montreal have the best job accessibility, regardless of whether it
was examined by travel time or cost. This finding corroborates previous work in Toronto (Foth et
al., 2013). Future work could refine these findings by studying if low-income earners can
efficiently reach low-income jobs with transit, as this may not be a given (El-Geneidy et al.,
2015), using a similar methodology that is based on combining both transit fare and actual
departure times. The results suggest that including transit fares has greater impacts for residents
in suburban areas, which could also mean greater impacts for accessing low-income jobs.
Regardless, our methodology shows how these accessibility measures can identify neighborhoods
combining low levels of accessibility and high levels of social deprivation, which according to
vertical equity requirements, need transportation benefits the most. Other future research can
investigate the travel habit of residents of socially disadvantaged areas and other areas that are
not considered socially disadvantaged. Results may show differences in movement patterns
between different areas.

El-Geneidy, Levinson, Diab, Boisjoly, Verbich & Loong
33
Considering both the cost of travel and the cost of transit fares, we gain a more accurate
view of jobs available to residents. For the most socially disadvantaged residents, travel time only
was found to estimate job accessibility as 30% higher when a monthly pass is factored in, and
50% higher when a single fare is added. For the least socially disadvantaged residents, this
overestimation is even greater, likely because of their suburban locations and higher cost of
travel.
This finding has important social implications regarding transit fare structures.
Exploratory work in New York City has shown that entries into subway stations in low-income
and minority neighborhoods are mostly from weekly and single fares, while in high-income
neighborhoods, most entries are from monthly fares; weekly and single fares cost more per ride
compared to monthly fares (Hickey et al., 2010). A similar situation occurs in Montreal (Verbich
& El-Geneidy, 2016), which is together with our findings showing that single fare use decreases
job accessibility more than monthly fare use, our results strongly suggest that socially vulnerable
residents bear a large burden when buying transit fares. Thus, job accessibility is sensitive to
transit fares, and policies should consider ways of enabling socially disadvantaged individuals to
acquire passes rather than paying by the trip. Finally, findings of this research can be of interest
to transportation planners, engineers and policy makers in diverse regions as they highlight issues
related to current practice and provide insight into how combined measures of accessibility can
be used to better understand the impact of transport planning decisions. More specifically, policy-
makers can use these measures to assess the impacts of various fare structures on accessibility to
jobs by transit for different areas in the city, based on their level of socio-deprivation. The socio-
spatial implications of proposed fare structures can thus be accounted for, through a comparative
accessibility analysis of different fare schemes (such as distance-based fares, constant fares,
zone-based fares, mode-specific fares). In this specific paper, we have demonstrated how to

El-Geneidy, Levinson, Diab, Boisjoly, Verbich & Loong
34
conduct such comparative assessment, by comparing monthly and single fares. Further studies
could investigate the impact of an integrated fare system in the Greater Montreal Area.
Other future research includes segmentation by job type and income to better capture the
level of accessibility experienced by various socio-economic groups. In addition, further
accessibility assessment based on generalized costs as done in this study should take into account
the affordability of transit, rather than the cost. This can be included by looking at the average daily
expenditure on commuting by transit, or at the proportion of a household’s budget spent on
commuting by transit.
ACKNOWLEDGEMENTS
This research was funded in by Natural Sciences and Engineering Research Council of Canada
(NSERC) program. We would like to thank Guillaume Barreau for modeling the transit trips
between home and work locations.
El-Geneidy, Levinson, Diab, Boisjoly, Verbich & Loong
35
References
Ades, J., Apparicio, P., & Séguin, A. (2012). Are new patterns of low‐income distribution emerging in Canadian metropolitan areas? The Canadian Geographer/Le Géographe canadien, 56(3), 339-361.
AMT. (2015a). Trouver le bon titre. Retrieved 28 July 2015, 2015, from https://www.amt.qc.ca/fr/titres-tarifs/recherche
AMT. (2015b). Zones tarifaires. Retrieved 28 July 2015, 2015, from https://www.amt.qc.ca/fr/titres-tarifs/titres-metropolitains/zones-tarifaires
Ben-Akiva, M., & Lerman, S. (1979). Disaggregate travel and mobility choice models and measures of accessibility. In D. Hensher & P. Stopher (Eds.), Behavioural travel modelling (pp. 654-679). London: Croom-Helm.
Bocarejo, J., & Oviedo, D. (2012). Transport accessibility and social inequities: A tool for identification of mobility needs and evaluation of transport investments. Journal of Transport Geography, 24, 142-154. doi: http://dx.doi.org/10.1016/j.jtrangeo.2011.12.004
Canada, Statistics. (2004). Study: Immigrants in Canada's urban centres, The Daily. Retrieved 9 June, 2009, from http://www.statcan.gc.ca/daily-quotidien/040818/dq040818b-eng.htm
Carruthers, R., Dick, M., & Saurkar, A. (2005). Affordability of Public Transport in Developing Countries Transport Papers. Washington, D.C.: The World Bank Group.
Currie, G. (2004). Gap analysis of public transport needs - Measuring spatial distribution of public transport needs and identifying gaps in the quality of public transport provision. Transportation Research Record(1895), 137-146.
Currie, G. (2010). Quantifying spatial gaps in public transport supply based on social needs. Journal of Transport Geography, 18(1), 31-41.
Denmark, David. (1998). The outsiders: Planning and transport disadvantage. Journal of Planning Education and Research, 17(3), 231-245. doi: 10.1177/0739456x9801700304
Department for Transport. (2004). Guidance on accessibility in local transport plans. UK, London.
Dodson, J. (2005). Mismatch between housing affordability and employment opportunity in Melbourne? Brisbane: Australian Housing and Urban Research Institute
Urban Policy Program, Griffith University. Dodson, J., Gleeson, B., Evans, R., & Sipe, N. (2007). Investigating the social dimensions of
transport disadvantage II: From concepts to methods through an empirical case study. Urban Policy and Research, 25(1), 63-89. doi: 10.1080/08111140701225511
El-Geneidy, A., Buliung, R., Diab, E., van Lierop, D., Langlois, M., & Legrain, A. (2015). Non-stop equity: Assessing daily intersections between transit accessibility and social disparity across the Greater Toronto and Hamilton Area (GTHA). Environment and Planning B: Planning and Design. doi: 10.1177/0265813515617659
El-Geneidy, A., Cerdá, A., Fischler, R., & Luka, N. (2011). The use of accessibility measures to evaluate the impacts of transportation plans: An application in Montréal, Québec. Canadian Journal of Urban Research: Canadian Planning and Policy (supplement), 20(1), 81-104.
El-Geneidy, A., & Levinson, D. (2006). Access to destinations: Development of accessibility measures Access to destinations. Minneapolis, MN: University of Minnesota.
Farber, S., Bartholomew, K., Li, X., Páez, A., & Habib, K. (2014). Assessing social equity in distance based transit fares using a model of travel behavior. Transportation Research Part A: Policy and Practice, 67, 291-303.
El-Geneidy, Levinson, Diab, Boisjoly, Verbich & Loong
36
Ford, Alistair C, Barr, Stuart L, Dawson, Richard J, & James, Philip. (2015). Transport Accessibility Analysis Using GIS: Assessing Sustainable Transport in London. ISPRS International Journal of Geo-Information, 4(1), 124-149.
Foth, N., Manaugh, K., & El-Geneidy, A. (2013). Towards equitable transit: Examining transit accessibility and social need in Toronto, Canada, 1996-2006. Journal of Transport Geography, 29, 1-10.
Geurs, K., & van Wee, B. (2004). Accessibility evaluation of land-use and transport strategies: Review and research directions. Journal of Transport Geography, 12, 127-140.
Geurs, K., Zondag, B., de Jong, G., & de Bok, M. (2010). Accessibility appraisal of land-use/transport policy strategies: More than just adding up travel-time savings. Transportation Research Part D: Transport and Environment, 15(7), 382-393. doi: http://dx.doi.org/10.1016/j.trd.2010.04.006
Grengs, J. (2010). Job accessibility and the modal mismatch in Detroit. Journal of Transport Geography, 18(1), 42-54.
Handy, S. (1994). regional versus local accessibility: Implications for non-work travel. Transportation Research Record(1400), 58-66.
Hansen, W. (1959). How accessibility shapes land use. Journal of the American Institute of Planners, 25(2), 73-76.
Hickey, R., Lu, A., & Reddy, A. (2010). Using quantitative methods in equity and demographic analysis to inform transit fare restructuring decisions. Transportation Research Record: Journal of the Transportation Research Board(2144), 80-92. doi: 10.3141/2144-10
Jones, P., & Lucas, K. (2012). The social consequences of transport decision-making: Clarifying concepts, synthesising knowledge and assessing implications. Journal of transport geography, 21, 4-16.
Krumholz, N., & Forester, J. (1990). Making Equity Planning Work: Leadership in the Public Sector. Philadelphia: Temple University Press.
Lucas, Karen. (2012). Transport and social exclusion: Where are we now? Transport Policy, 20, 105-113. doi: 10.1016/j.tranpol.2012.01.013
Manaugh, K., Badami, M., & El-Geneidy, A. (2015). Integrating social equity into urban transportation planning: A critical evaluation of equity objectives and measures in transportation plans in North America. Transport Policy(37), 167-176.
Manaugh, K., & El-Geneidy, A. (2012). Who benefits from new transportation infrastructure? Using accessibility measures to evaluate social equity in public transport provision. In K. Geurs, K. Krizek & A. Reggiani (Eds.), Accessibility and Transport Planning: Challenges for Europe and North America (pp. 211-227). London, UK: Edward Elgar.
Martens, K. (2012). Justice in transport as justice in accessibility: Applying Walzer's 'Spheres of Justice' to the transport sector. Transportation, 39(6), 1035-1053.
Nadeau, C. (2015). Unaffordable fare: The cost of public transportation for low-income commuters working at three airports. (Master in City Planning Master's Thesis), Massachusetts Institute of Technology, Cambridge, MA.
Niemeier, D. (1997). Accessibility: An evaluation using consumer welfare. Transportation, 24, 377-396.
OpenTripPlanner. (2014). from http://www.opentripplanner.org Owen, A., & Levinson, D. (2014) Access across America: Transit 2014 methodology.
Minneapolis, MN: University of Minnesota. Pucher, John, & Renne, John L. (2003). Socioeconomics of urban travel: Evidence from the 2001
NHTS. Transportation Quarterly, 57(3), 49-77.

El-Geneidy, Levinson, Diab, Boisjoly, Verbich & Loong
37
Riccardi, A., Xia, J., & Currie, G. (2015). Exploringpublic transport equity between separate disadvantage cohorts: A case study in Perth, Australia. Journal of Transport Geography, 43, 111-122.
Sanchez, Thomas W., Shen, Qing, & Peng, Zhong-Ren. (2004). Transit mobility, jobs access and low-income labour participation in US metropolitan areas. Urban Studies, 41(7), 1313-1331. doi: 10.1080/0042098042000214815
Shearmur, Richard, Coffey, William, Dube, Christian, & Barbonne, Rémy. (2007). Intrametropolitan employment structure: Polycentricity, scatteration, dispersal and chaos in Toronto, Montreal and Vancouver, 1996-2001. Urban Studies, 44(9), 1713-1738. doi: 10.1080/00420980701426640
Statistics Canada. (2011). 2011 National Household Survey from https://www12.statcan.gc.ca/nhs-enm/2011/dp-pd/dt-td/index-eng.cfm
van Wee, B., & Geurs, K. (2011). Discussing equity and social exclusion in accessibility evaluations. European Journal of Transport and Infrastructure Research, 11(4), 350-367.
Verbich, D., & El-Geneidy, A. (2016). Are the transit fares fair? Public transit fare structures and social vulnerability in Montreal, Canada. Paper presented at the The 95th Annual Meeting of the Transportation Research Board, Washington D.C., USA.
Vickerman, R. (1974). Accessibility, attraction, and potential: A review of some concepts and their use in determining mobility. Environment and Planning A, 6, 675-691.