Embed Size (px)
Citation preview

The cost components of MYPD3
Primary
Energy
(incl imports &
DMP)
IPPs Operating
costs IDM Depn
Return on
assets Revenue
1
Return on assets = % cost of capital allowed X depreciated replacement asset value
R355bn (R328bn +
R27bn)
8,6% average
increase
R270bn
8% average
increase
R185bn
10% average
increase
16% average
increase
R187bn moves from
0.9 % to
7,8% ROA
Eskom applies for revenues to cover its expected costs NERSA’s rules set out which costs are allowed
R78bn 42% average
increase
R13bn
5,0% average
increase
Price levels 2012/13 2013/14 2014/15 2015/16 2016/17 2017/18
Nominal c/kWh (13% X 5) 61c/kWh 69c/kWh 78c/kWh 88c/kWh 99c/kWh 112c/kWh
Real (2012/13 terms) (13% X5)
Real as indicated by NERSA for
MYPD 2 (2010 real terms)
61c/KWh 65c/KWh 69c/KWh 74c/KWh 79c/KWh 84c/KWh
Nominal c/kWh (16% X 5) 61c/kWh 71c/kWh 82c/kWh 95c/kWh 110c/kWh 128c/kWh
Real (2012/13 terms) (16% X5) 61c/KWh 67c/KWh 73c/kWh 80c/kWh 88c/kWh 96c/kWh
59c/kWh 70c/kWh 82c/kWh

2
Increases per customer category

Financial sustainability once stand-alone investment grade is achieved in 2018
• Both ratios must meet criteria to qualify for stand-alone investment grade
• Eskom currently relies on government support for investment grade rating
• Majority of funding for approved new build secured (almost 80%)
• Investment grade status necessary to secure the balance of funding, and critical for long-term expansion post Kusile
4

Review of Eskom
Holdings Limited’s
adequate
profitability test:
Discount rate
summary
21 November 2012

Page 6 of 5
Executive summary
Summary presentation
This presentation contains a summary of certain of our findings
with regard to conclusions that we reached regarding the KPMG
audit review of the adequate profitability testing on Eskom
Holdings Limited’s (“Eskom”) assets as performed by Ernst &
Young Advisory Services Limited (“E&Y”) for the year ended 31
March 2012.
The procedures KPMG performed were performed as part of our
audit for the year ended 31 March 2012 in accordance with the
terms of reference set out in our letter of engagement. Eskom
subsequently requested KPMG to prepare a summary of our
findings and as a result of the request from Eskom, we have
prepared this summary presentation (“Summary Presentation”)
with a specific focus on the discount rate utilised.
Conclusion
Based on our procedures performed during this audit review, the
discount rate used by Eskom (8.16%) is reasonable compared to
the real pre-tax discount rate calculated by KPMG of 8.31% at 30
March 2012.
We have recalculated this return based on the future cash flows
of Eskom (excluding tax outflows) and calculated the pre-tax rate
by iteration. We have then adjusted the pre-tax rate by inflation in
order to calculate a real discount rate of 8.31%.

Page 7 of 5
Explanation of three step process
■ Step 1
Calculate the WACC using CAPM to
arrive at a post-tax nominal rate
■ Step 2
Calculate the pre-tax, nominal rate
using iteration
It is important to note that the pre-tax discount rate is not
simply the post-tax discount rate grossed up for tax, but can
only be calculated using iteration.
■ Step 3
Calculate the pre-tax, real rate using
the Fischer formula
WACC – The Weighted Average Cost of Capital i.e.
WACC = Ke * ( E/(D + E)) + Kd * (1-T) * ( D/(D + E))
Where: Ke = cost of equity
E = market value of equity
Kd = cost of debt
D = market value of debt
T = corporate taxation rate
CAPM – The Capital Asset Pricing Model i.e.
Ke = Rf + ß * (Rm - Rf) + Rs +
Where: Rf = the current return on risk-free assets
Rm = the expected average return of the market
(Rm - Rf) = the average risk premium above the risk-free
rate that a “market” portfolio of assets is earning
ß = the beta factor, being the measure of the
systematic risk of a particular asset relative to
the risk of a portfolio of all risky assets
Rs = small size premium
= company specific risk factor (alpha premium)
Fischer formula
Real rate = (WACC +1)/(Inflation + 1) - 1

Page 8 of 5
Weighted average cost of capital
Weighted average cost of capital calculation
KPMG
30 March 2012
Cost of equity
Risk free rate (30 March 2012) R186 8.37%
Beta 0.93
(MR-Rf) 6.00%
CAPM 13.95%
Small stock premium 0.00%
Company specif ic risk premium 0.00%
Cost of equity 13.95%
Cost of debt
Pre-tax cost of debt Rfr 8.37%
Spread Spread 2.50%
Cost of debt 10.87%
Tax rate 28.00%
After-tax cost of debt 7.82%
Weighted average cost of capital
Market participant debt to equity Cost Weight Weighted Cost
Equity 13.95% 53.76% 7.50%
Debt 7.82% 46.24% 3.62%
Weighted average cost of capital (after tax, nominal) 100.00% 11.11%
KPMG iteration (pre-tax, real) 8.31%
Page 9 of 5
Explanation of individual WACC components
Rf (Risk free rate) The risk-free rate is derived by reference to the bond yield on the South African Government R186 bond, which on 30 March 2012
was 8.37% (Source: Bond Exchange of South Africa on 30 March 2012). The Multi-year Price Determination (“MYPD”) requires the
use of a SA government bond with at least 10 years time to maturity.
Beta In order to determine the appropriate beta factor for Eskom, consideration has been given to the betas of comparable listed utility
companies (market participants). A beta of 0.93 has been used in our cost of equity calculation. Our estimated beta is in line with
Eskom’s in-house view. In 2009, Eskom performed a detailed beta analysis looking at numerous comparators (including 75 US utility
companies) and arrived at a beta range of 0.9 to 1.1.
Market risk premium The applied market risk premium represents the premium over and above the risk free rate appropriate for investing in an average
company listed in South Africa. This premium is based on empirical studies, which compare the return on the All Share Index to the
yield on long-term Government bonds. A market premium (Rm-Rf) of 6.0% is regarded as appropriate by KPMG Corporate Finance in
the South African investment climate.
Alpha factor (company
specific risk premium)
In determining the appropriate Alpha factor we have considered both Eskom’s specific risk factors and its positive factors from our
understanding of the business and its operating environment. Some of the company specific risk factors that we considered include:
■ Ageing infrastructure
■ Long-term sustainability requires a higher tariff structure
■ Funding concerns to support the significant capex rollout requirements
Positive factors include:
■ Dominant (monopolistic) market position
■ Support from the regulator - NERSA
■ Guaranteed revenue streams
■ Off-take supply agreements with credible, power intense consumers (Anglo, BHP)
■ Favorable rating by credit rating agencies
Based on the factors above, we believe that on a net basis, no additional alpha is required.
Pre tax cost of debt In calculating the cost of debt, we have used the risk free rate as at valuation date plus 250 basis points as the long-term pre-tax cost
of debt for Eskom. This was based on Eskom’s credit rating (S&P and Moody’s Eskom credit rating of BBB+ and Baa2 respectively).
Capital structure In considering the appropriate capital structure for purposes of determining the WACC, we performed a review of reasonably
comparable utility companies (market participants). We have considered a debt:equity structure of 46% debt and 54% equity
applicable for Eskom.

Page 10 of 5
Limitations
KPMG Inc (“KPMG”) Summary presentation
This presentation contains a summary of certain of our findings with regard to conclusions that we reached regarding the KPMG audit review of the adequate profitability testing on Eskom Holdings Limited’s (“Eskom”) assets as performed by Ernst & Young Advisory Services Limited (“E&Y”) for the year ended 31 March 2012. The procedures KPMG performed were performed as part of our audit for the year ended 31 March 2012 in accordance with the terms of reference set out in our letter of engagement. Eskom subsequently requested KPMG to prepare a summary of our findings and as a result of the request from Eskom, we have prepared this summary presentation.
This Summary Presentation has been prepared on the basis of information presented to us on or before 9 May 2012. We have not undertaken to update our report or to revise the information contained therein for events or circumstances arising after that date.
Accuracy of forecasts
Where applicable, we have assumed that forecasts were prepared appropriately and accurately based on the information available to management at the time and within the practical constraints and limitations of such estimates. We have assumed that these forecasts do not reflect any material bias, either positive or negative. The preparation of financial forecasts involves the making of certain assumptions regarding future events, which may not occur.
Further, certain events and financial forecasts, by their nature, are not susceptible to independent substantiation. They are predictions by management of future events that cannot be assured and are necessarily based on assumptions, many of which are beyond the control of the company or its management. Actual results may be significantly more or less favourable. Accordingly, we express no opinion on whether the management forecasts utilised as an input to the review process are achievable.
Limitations on scope
We have relied upon the sources of information referred to in our internal memo dated 9 May 2012 and the representations provided in undertaking the valuation and discount rate review. Except where specifically stated, we have not sought to establish the reliability of those sources. We have however reviewed the information and have sought explanations for key trends and salient features identified by us. We have also satisfied ourselves, as far as possible, that the information presented is consistent with other information obtained by us in the course of the work undertaken to prepare this Summary Presentation.
Limitations on scope (continued)
We draw your attention to the fact that the review was performed solely
for audit purposes. The review procedures were not designed, conducted
or prepared in contemplation of any other purpose. As a result items of
importance for other purposes may well not have been specifically
addressed for the purposes of KPMG’s review.
Valuations and discount rates are a function of the assumptions
incorporated within the valuation methodology. In particular, the valuation
or discount rate assumes that the historical performance as indicated by
management is sustainable or, as a minimum, understood by a potential
investor who has a similar outlook of the projected level of cash flow.
The true value or discount rate negotiated between parties on a willing
buyer willing seller basis may differ from this value or discount rate as it is
dependent upon considerations, including but not limited to, relative
positions of strength, emotive issues, differing views of trading
projections, growth potential, different assessments of risk, human
resource issues, warranty conditions, etc., all of which can only be
determined through a process of negotiation.
Confidentiality
This Summary Presentation is provided to Eskom Limited. It may not
(except for your own internal purposes) be copied, referred to or
disclosed to any third party, wholly or partially, without our prior written
consent and then only on terms acceptable to us. You may disclose this
Summary Presentation to your bankers and legal and other professional
advisors for seeking advice about the Summary Presentation. However,
you must inform them that:
■ They may not (except for their own internal purposes) disclose the
Summary Presentation to any third party without our prior written
consent and then only on terms acceptable to us; and
■ We accept no liability to your bankers or legal or other professional
advisors in connection with the services (refer to our letter of
engagement for definition); and
■ We do not have a duty of care or any legal obligation to your bankers
and legal and other professional advisors in connection with the
services.

Overnight and LCOE Definition
11
LCOE Calculator
LCOE = ((CC+ Σ t n=1 (FOM + VOM + FC))/(1+DR)^n)/((c* CF*8760)/ (1+DR)^n))
Where, CC is capital cost FOM is fixed operational and maintenance cost VOM is variable operational and maintenance cost FC is fuel cost DR is discount rate in percentage C is capacity of the plant CF if capacity factor of the plant t is lifespan of the plant n is the annuity rate
Definition of Overnight and Levelised Cost
• The most widely used method to compare
capital costs of different power stations is
the “overnight cost” method and is evaluated
in terms of the United States dollar cost per
kilowatt (USD/kW) for installed capacity.
• The overnight cost methodology commonly
includes the engineering, procurement and
construction (EPC) portion – commonly
referred to as the capital cost
• LCOE can be defined as the ratio of the
present value of the sum of all the costs
incurred over the lifespan of the power plant
to the total power generated over the life
span of the power plant.
• The major costs incurred during the lifespan
of the power plant are capital cost, fixed
operation and maintenance (O&M) cost,
variable O&M cost and fuel cost.
• If a plant receives any subsidies or
incentives, the values will be deducted from
the cost.
For Eskom, the LCOE methodology is preferred as it
calculates the present value cost in United States
dollars per megawatt-hour (USD/MWh) of energy
production. Financial factors such as interest rates,
inflation, discount rate and taxation are taken into
account and include the capital cost, as well as fuel
and all fixed and variable operating and maintenance
costs.

Comparison of Overnight costs between EPRI, Lazard, IEA and Eskom for the New Build Programme
12
While Medupi and Kusile are similar super-critical coal-fired power stations, the difference in their costs
is due to Medupi costs not including flue-gas desulphurisation. The capital expenditure phasing is also
different, resulting in Kusile attracting higher escalation and financing charges
0
500
1000
1500
2000
2500
3000
3500
Medupi Kusile Ingula
Overnight cost (USD/kW)
EPRI
Lazard
IEA
Eskom
2210
2786
2048 2300 2399
3269
2325 2500
1641
2045
1540 1700

Comparison of LCOE between EPRI, Lazard, IEA and Eskom for the New Build Programme – in ZAR
13

Comparison of LCOE between EPRI, Lazard, IEA and Eskom for the New Build Programme - in US $
14
The comparison of overnight and LCOE costs with international benchmarks shows that
Eskom’s plants are well within or below the international benchmark.
0
20
40
60
80
100
120
Medupi Kusile Ingula
LCOE (USD/MWh)
EPRI
Lazard
IEA
Eskom
56
53 51
54
79
72 71
73
110
103 99
110

Eskom units load factors in comparison to VGB member performance
15
Eskom’s units continue to operate at higher load factors than
VGB’s coal-fired units.
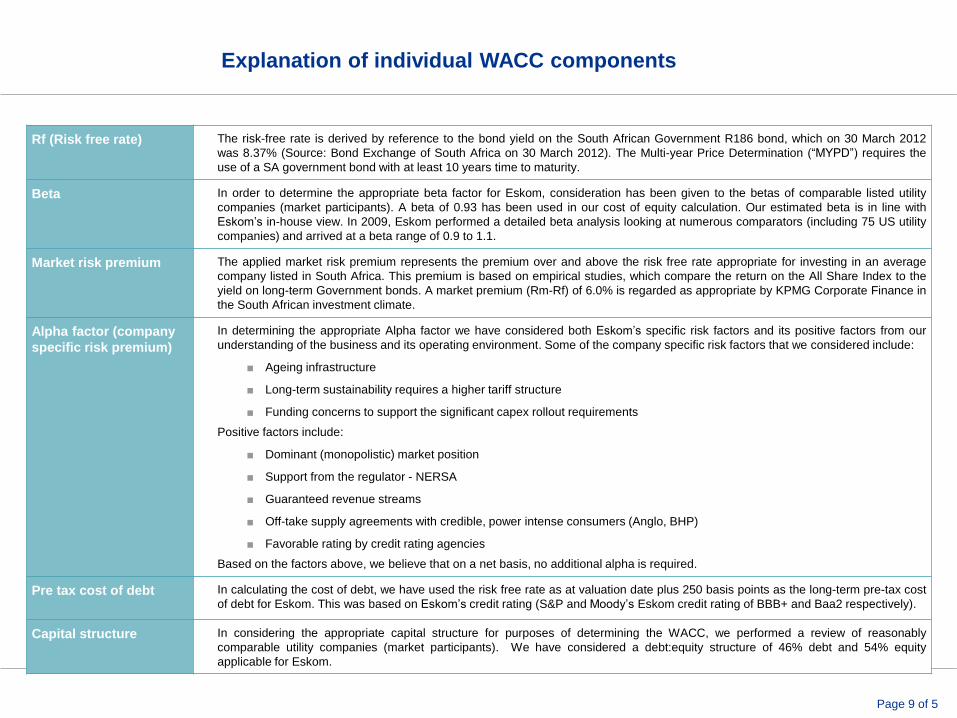
EAF performance of Eskom coal stations in comparison to VGB member performance
16

• The UCLF is steadily increasing in an environment
of PCLF deferments and increasing demand
• The median for the Eskom UCLF for coal stations has
deteriorated such that it has closed the gap to the VGB
median
0
2
4
6
8
10
12
14
1999 2000 2001 2002 2003 2004 2005 2006 2007 2008 2009 2010
UC
LF
%
Years
VGB Best Quantile VGB Median VGB Worst QuantileEskom Best Quantile Eskom Median Eskom Worst Quantile
Benchmarking UCLF All Coal Sizes 1999 - 2009
120 VGB Units (excl. Eskom Units)
Benchmarking UCLF performance
17

NERSA-commissioned benchmarking study - Generation (2008)
18
NERSA-commissioned study into Generation Cost Drivers within the Eskom Price Review Process, conducted by CORE Consulting (USA), stated the following:
“Eskom Generation has managed to become a world leader in power plant operations. Its non-fuel O&M cost per kWh and plant availability factors place Eskom in the upper ten percent of large integrated electric utilities worldwide”
• Source CORE International: Development of Independent NERSA Views on Generation Cost Drivers within the Eskom Price Review Process Volume I: Final Report (Main Report), 2008, p. 9

20110325-Customer satisfaction measurement.pptx 19
SAIDI / SAIFI Calculations
Average Mean Top Preformance
SAIDI
Polish Utilities 10.6 3.4 - 4.9
South American Utilities 15.3 10
North American Utilities 6.3 0.9 - 1.8
Europe 1.3
Average 8.4 5.2
SAIFI
Polish Utilities 5.7 1.9 - 3.2
South American Utilities 5.2 7.8
North American Utilities 3.1 0.6 - 1.0
Europe
Average 4.7 3.7
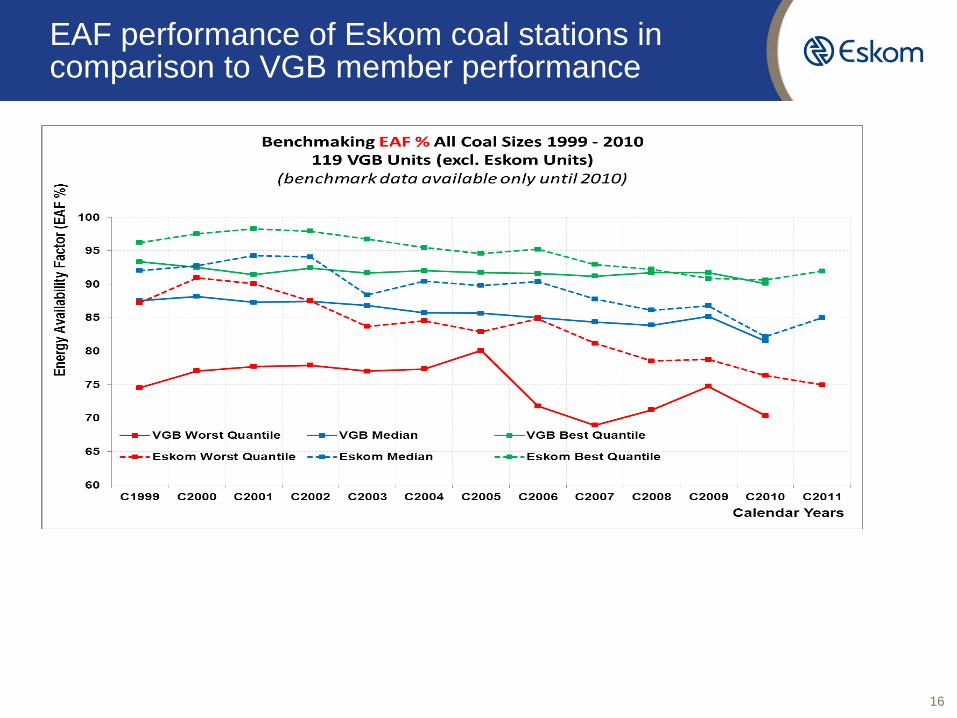
Tx operating cost: Eskom with low costs in comparison to other utilities
1. All numbers for 2009, except for Mavir (2008), EirGrid (2009/2010), and Eskom (2009/2010) Source: TSO annual reports; TSO corporate website; BCG analysis
REN
Tennet
Terna Mavir
Réseau de transport d’électricité
Red Eléctrica de España
Energinet
1,000 EUR/GWh
APG
Consumption (GWh)
600000 400000
CEPS, a.s.
200000 0
0
Eskom
Transpower
AEP
Statnett
Fingrid
Kraftnät
Swissgrid
EirGrid
2
4
12
10
14
EirGrid
Réseau de transport d’électricité
Red Eléctrica de España
Energinet
CEPS, a.s.
0
0
Network length (km)
100000 50000
APG
1,000 EUR/km
Eskom
Transpower
AEP
Statnett Fingrid
Kraftnät
Swissgrid
REN
Tennet
Terna
Mavir
20
40
140
120
100
Power trend line
Average total cost per network length1 Average total cost per consumption1
Legend One can expect similar results in terms of current information, as costs for all companies would have increased. In terms
of the normalisers we have increased km of network, consumption though has not increased substantially.
Source: Eskom Transmission, information also provided
to and used by BCG