Embed Size (px)
Citation preview

i
THESIS FOR THE DEGREE OF DOCTOR OF PHILOSOPHY
The Corrosive Effect of Chlorine Containing
Species on Waterwalls and Superheater
Materials in Waste and Biomass-Fired Power
Plants
Erik Larsson
Department of Chemistry and Chemical Engineering
CHALMERS UNIVERSITY OF TECHNOLOGY
Gothenburg, Sweden 2016
ii
The Corrosive Effect of Chlorine Containing Species on Waterwalls and Superheater
Materials in Waste and Biomass-Fired Power Plants
Erik Larsson
ISBN: 978-91-7597-428-6
© Erik Larsson, 2016
Doktorsavhandlingar vid Chalmers tekniska högskola
Ny serie nr: 4109
ISSN: 0346-718X
Department of Chemistry and Chemical Engineering
Chalmers University of Technology
SE-412 96 Gothenburg
Sweden
Telephone + 46 (0)31-772 1000
Cover: TG mass gain curves of T22 at 400 °C and an image of a cross section of T22 in the
presence of KCl + HCl(g) after 1 hour of exposure at 400 °C.
Chalmers Reproservice
Gothenburg, Sweden 2016

iii
The Corrosive Effect of Chlorine Containing Species on Waterwalls and Superheater
Materials in Waste and Biomass-Fired Power Plants
ERIK LARSSON
Department of Chemistry and Chemical Engineering
Chalmers University of Technology
Abstract
To increase power generation from waste- and biomass-fired boilers, it is necessary to
increase the temperature and pressure of the steam generated. This implies an increase in the
temperature both of the waterwalls and of the steam superheaters in the boiler. Low-alloyed
steels are preferred in the waterwalls due to low cost and excellent mechanical properties and
weldability. The recent shift from fossil fuels (oil, coal and natural gas) to biofuels and waste
for the generation of heat and power has introduced several challenges to the boilers. One is
the rapid corrosion of superheaters and waterwalls. Many observations imply that the
corrosivity of the fireside environment in boilers fired by biomass and waste is connected to
the relatively high chlorine/sulphur - ratio in the flue gas. Hence, this thesis investigates the
role of chlorine compounds on fireside corrosion of both water walls and superheaters.
The waterwall part of this thesis investigates the corrosive effect of alkali chlorides (KCl and
NaCl), PbCl2 and ZnCl2, including the effect of KCl+ZnCl2 and NaCl+ZnCl2 mixtures. This
work shows that all four salts accelerates the corrosion of waterwall steels in the temperature
range of interest. A new mechanism describing alkali chloride-induced corrosion of low-
alloyed steels is presented. The other part of the thesis investigates the influence of SO2 on the
corrosion of superheater steels in the presence of alkali chlorides in a laboratory setting. Also,
complementary corrosion experiments were performed in a commercial waste-fired power
plant. The results show that the corrosivity of chlorides in superheater deposits is mitigated
by SO2 in the flue gas. The effect is attributed to the conversion of KCl and NaCl into K2SO4
and Na2SO4, the two sulfates being relatively harmless from a corrosion point of view at the
temperatures studied (525 °C and 600 °C). However, the laboratory study indicated that the
simultaneous presence of KCl and SO2 can cause steel grain boundary attack beneath the
original KCl particle.
Keywords: Biomass, Waste, Combustion, Alkali-induced corrosion, Heavy metal chlorides,
Sulfur recirculation, Waterwalls, Superheater corrosion.
iv
List of publications This thesis is based on the following appended papers.
Paper I
E. Larsson, T. Jonsson and J. Liske
The influence of small amounts of KCl(s), NaCl(s), ZnCl2(s) and salt mixtures on the high
temperature oxidation of a Fe-2.25Cr-1Mo steel at 400ºC
Submitted to oxidation of metals
Paper II
E. Larsson, T. Jonsson, J. Liske and L-G. Johansson
The influence of KCl and HCl on the high temperature oxidation of a Fe-2.25Cr-1Mo steel at
400ºC
Submitted to oxidation of metals
Paper III
E. Larsson, H. Gruber, K. Hellström, T. Jonsson, J. Liske, J-E. Svensson.
A comparative study of the initial corrosion of KCl and PbCl2 on a low alloyed steel
Accepted to Oxidation of Metals
Paper IV
S. Karlsson, E. Larsson, T. Jonsson, J-E. Svensson and J. Liske.
A Laboratory Study of the In-situ Sulphation of Alkali Chloride-Rich Deposits
Corrosion perspective
Energy Fuels, 2016, 30 (9), pp 7256–7267
Paper V
S. Andersson, E. W. Blomqvist, L. Bäfver, F. Jones, K. Davidsson, J. Froitzheim,
M. Karlsson, E. Larsson, J. Liske.
Sulfur recirculation for increased electricity production in Waste-to-Energy plants
Waste Management Volume 34, Issue 1, January 2014, Pages 67–78
Paper VI
E. Larsson, S. Andersson, J. Liske
The influence of sulfur recirculation on superheater corrosion rates, evaluated by a novel
image analysis method combined with SEM
Manuscript

v
Statement of contribution
Paper I
I was the main author and carried out all exposures and all analysis.
Paper II
I was the main author and carried out all exposures and all analysis.
Paper III
I was the main author and carried out the KCl exposures and analysis, H. Gruber carried out
the PbCl2 exposures and analysis.
Paper IV
Performed BIB cross sections and participated in the writing.
Paper V
I assisted with the exposures in the boiler and carried out the SEM analysis and material loss
measurement. I wrote the corrosion part of the paper together with Jesper Liske.
Paper VI
I was the main author. I assisted with the exposures in the boiler and carried out the SEM,
XRD and IC analysis as well as material loss measurement.

vi
Related papers and technical reports not included in the thesis
Froitzheim, J, Ravash, H, Larsson, E, et al.
Investigation of Chromium Volatilization from FeCr Interconnects by a Denuder Technique
JOURNAL OF THE ELECTROCHEMICAL SOCIETY Volume: 157 Issue: 9 Pages:
B1295-B1300 Published: 2010
J. Pettersson, J.-E Svensson, E. Skog, L.-G. Johansson, N. Folkeson, J. Froitzheim, S. Karlsson,
E. Larsson, N. Israelsson, S. Enestam, J. Tuiremo, A. Jonasson, B. Arnesson, B.-Å. Andersson
and B. Heikne,
“Evaluation of different fuel additives´ ability to master corrosion and deposition on steam
superheaters in a waste fired CFB-boiler”
KME report, 2010
S. Herstad Svärd, B.-M. Steenari., L.-E. Åmand, J. Bowalli, J. Öhlin, J. Pettersson, S. Karlsson,
E. Larsson, J.-E. Svensson, L.-G. Johansson, K. Davidsson, L. Bäfver and M. Almark
”Measures for simultaneous minimization of alkali related operating problems, Phase 3”
Värmeforsk report, 2010
M. Gyllenhammar, S. Herstad Svärd, K. Davidsson, J. Liske, E. Larsson, T. Jonsson, D.
Zhao
”Additiv för att minska driftproblem vid rostförbränning”
Waste refinery 2013
T. Svärd, H. Larsson and E-K. Lindman, S.Herstad Svärd, A. Olivas, E. Larsson,
D.Zhao, T. Jonsson and J. Liske
“Increased electrical efficiency and service life assessment of super heaters from
combustion of difficult fuels”
KME report 2014

vii
Preface This thesis summarizes the research that was performed within the Swedish competence
center for High Temperature Corrosion (HTC), from 2010 to 2016. The work has been carried
out Environmental Inorganic Chemistry at the Department of Chemistry and Chemical
Engineering, Chalmers University of Technology, Göteborg, Sweden, under the supervision
of Professor Jan-Erik Svensson. The work was funded by the High Temperature Corrosion
Centre (HTC), Konsortiet för Materialteknik för termiska Energiprocesser (KME),
Värmeforsk (VF), Waste Refinery (WR), Proenviro and the Swedish Energy Agency.

viii
List of acronyms
BF Bright field
BIB Broad ion beam
BSE Backscattered electron
EDX Energy dispersive x-ray
FEG Field emission gun
FIB Focused ion beam
HAADF High angle annular dark field
IC Ion chromatography
SE Secondary electron
SEM Scanning electron microscope
TEM Transmission electron microscope
XRD X-ray diffraction

ix
Table of Contents
1 Introduction ........................................................................................................................ 1
2 Steels .................................................................................................................................. 3
3 Oxidation of metals ............................................................................................................ 5
3.1 Oxide formation ........................................................................................................... 5
3.2 Diffusion processes ...................................................................................................... 6
Lattice diffusion ................................................................................................... 7
Short-circuit diffusion .......................................................................................... 8
3.3 Kinetics of oxidation ................................................................................................... 8
Linear rate law ...................................................................................................... 8
Parabolic rate law ................................................................................................. 9
Combined rate laws ............................................................................................ 10
3.4 Mechanical properties of oxide scales ....................................................................... 10
3.5 Corrosion products .................................................................................................... 11
4 Fireside corrosion in waste and biomass fired boilers ..................................................... 15
4.1 Fuel types ................................................................................................................... 15
Municipal solid Waste (MSW) .......................................................................... 16
Recovered waste wood (RWW) ......................................................................... 16
4.2 Combustion systems .................................................................................................. 17
Grate ................................................................................................................... 17
Bubbling fluidized bed (BFB) ............................................................................ 18
Circulating fluidized bed (CFB) ......................................................................... 19
4.3 Superheater corrosion ................................................................................................ 20
4.4 Boiler water wall corrosion ....................................................................................... 22

x
4.5 Corrosion mechanism ................................................................................................ 23
Chromate-forming corrosion .............................................................................. 26
4.6 Waterwall corrosion mechanisms .............................................................................. 28
Corrosion mitigating techniques ........................................................................ 33
5 Experimental techniques .................................................................................................. 34
5.1 Laboratory exposures ................................................................................................ 34
Sample preparation ............................................................................................. 34
Experimental set-up ............................................................................................ 34
5.2 Field exposures .......................................................................................................... 35
6 Analytical techniques ....................................................................................................... 37
6.1 Imaging techniques and elemental analysis ............................................................... 37
Electron microscopy ........................................................................................... 37
Scanning electron microscopy, SEM ................................................................. 40
Broad ion beam, BIB .......................................................................................... 40
Focused Ion Beam, FIB/SEM workstation ........................................................ 41
Transmission Electron Microscopy (TEM) ........................................................ 42
6.2 Phase detection techniques ........................................................................................ 43
X-Ray diffraction, XRD ..................................................................................... 43
6.3 Elemental analyzing of water soluble ions ................................................................ 44
Ion chromatography, IC ..................................................................................... 44
6.4 Material loss measurement ........................................................................................ 45
7 Results and Discussion ..................................................................................................... 47
7.1 Laboratory waterwall simulating exposures .............................................................. 47
Exposures in presence of pure chlorides ............................................................ 47
Exposure in the presence of mixed chlorides ..................................................... 57

xi
Exposures in the presence of HCl(g) and KCl-HCl(g) ...................................... 61
TEM microstructure analysis of T22 ................................................................. 68
Conclusions of laboratory exposures ................................................................. 70
7.2 Superheater exposures ............................................................................................... 72
In-situ sulfation of KCl in a laboratory setting .................................................. 73
Summary of in-situ sulfation .............................................................................. 76
The effect of sulfur recirculation (field study) ................................................... 76
Conclusions of superheater corrosion (laboratory and field) ............................. 84
8 Acknowledgements .......................................................................................................... 85
9 References ........................................................................................................................ 86

1
1 Introduction
Since oil and coal (fossil fuels) result in a net contribution of CO2 to the atmosphere when
combusted, it is believed to be problematic due to its contribution to the global warming effect.
The projections are that the trend in increasing global temperatures will continue if drastic
counter measures are not undertaken [1]. As a consequence there is a political driving force to
reduce the dependence of fossil fuels for energy conversion. The Swedish government has
decided to reduce the emissions of greenhouse gases by the year 2020 by 40 % from 1990
emission levels and, additionally, the government has set the target for an increase in efficiency
of energy use by 20 %. In addition it has been decided that at least 50 % of overall energy
consumption should come from renewable sources [2]. In order to reach these goals more or
less all power conversion sectors of society are effected. This thesis deals with the material
challenges that occurs when shifting from fossil fuels to renewables such as biomass and waste
in heat and power plants.
There are inherent problems that must be solved when shifting from fossil fuels to waste and
biomass. One important issue is the high corrosion rates that occurs on heat exchange materials
in the boilers, where heat is transferred from the combustion reaction to the steam system
(superheaters) that powers a turbine, and to boil the water within the waterwall tubes. Biomass,
and waste, upon combustion releases high levels of compounds such as hydrogen chloride
(HCl(g)), alkali chlorides (NaCl, KCl) and heavy metal chlorides (ZnCl2, PbCl2) [3-11]. This
makes the flue gas and deposits considerably more corrosive compared to when coal or oil are
used as fuels. In order to limit the corrosion issues, plant operators can lower the steam
temperature in the superheaters which decrease not only the material temperature but also the
electrical efficiency of the process. It is also possible to use expensive heat exchange materials
with high corrosion resistances. As both strategies result in a less cost effective process,
understanding and mitigation of material degradation is of great importance.
Knowledge about superheater corrosion is relatively well established and is usually attributed
to the presence of alkali chlorides. Therefore, research is at a stage where different mitigating
techniques are being tested and elaborated upon. Research directed into waterwalls is at a stage
where the main contributors regarding corrosion is being researched. To mitigate the corrosion
in this region of the boiler, expensive materials are often welded onto existing tubes.

2
Chlorine-containing compounds are generally considered to account for the more corrosive
environment when these alternative fuels are used [4, 5]. However the underlying mechanisms
for this are not completely understood.
Certain species or mixtures can be present in the tube deposit during combustion of waste and
biomass, with melting points below the local temperature of the waterwalls. Because of the
lower material temperatures compared to at the superheaters, more corrosive species (i.e. heavy
metal chlorides) can condense out on the heat exchanger surfaces. Substantially elevated
corrosion rates in the presence of melts have been reported in the literature [12-14]. The low
melting point has been attributed to the presence of heavy metal chlorides in flue gas deposits.
The aim of this thesis is to investigate the effect of chlorine containing compounds in different
parts of a boiler i.e. at the waterwalls and on the superheater tubes. The waterwall research was
carried out in well controlled laboratory exposures, in which T22 sample coupons were coated
with KCl, NaCl and ZnCl2 or with mixtures of ZnCl2/(KCl or NaCl). Oxidation in the presence
of PbCl2 was also investigated. The combined effect of KCl and a gaseous chlorine containing
specie HCl(g), which are normally present simultaneously during combustion were also
assessed. The superheater research was conducted in a commercial waste fired boiler with the
aim of evaluating the effectiveness of a novel corrosion mitigating technique, in which sulfur
is recirculated back into the combustion area. The effect of in-situ sulfation of relatively large
amounts of KCl towards a 304L steel was also investigated in a laboratory setting.

3
2 Steels
Steel is a generic name that covers many different alloys, however in its most basic form a steel
is an interstitial solid solution of carbon in an iron matrix. The carbon concentration is typically
within the range of ~ 0.01 – 1 wt. %. The addition of carbon increases the strength and toughness
of the material drastically compared to pure iron [15].
Pure iron exists in two allotropes at atmospheric pressure, ferrite (α) and austenite (γ). At room
temperature ferrite is the thermodynamically favored form in which the atoms are arranged in
a body-centered cubic structure (bcc). If pure iron is heated, a phase transformation from ferrite
to austenite occurs at 910 °C. In austenite the atoms have a face-centered cubic arrangement
(fcc), see Figure 2.1 [16].
Figure 2.1: Cubic unit cells. a) Body-centered cubic (bcc), b) face-centered cubic (fcc).
Steels are polycrystalline materials consisting of grains with an approximate size range from 5
– 100 µm depending on the type of steel. Carbide particles are generally dispersed in the
material. Both the grain size and distribution of carbides are important parameters to consider
since these greatly influence the strength and toughness of the steel. This is done by carefully
controlled heat treatments and cold working, which makes it possible to customize the desired
properties [17].
The most important alloying element for corrosion resistance in steels is chromium. With a
chromium content of approximately 10 wt. % a stainless steel is formed [15]. The corrosion
resistance of stainless steels can be attributed to their ability to form a chromium rich oxide
a) b)
4
scale (Fe1-xCrx)2O3 that protects the material from further oxidation. Stainless steels can be in
both ferritic and austenitic form, however austenitic stainless steels have superior corrosion
resistance. Austenitic steels are more ductile but not as strong as ferritic steels [17]. To attain
the austenite phase at room temperature, substantial amounts of austenite stabilizing elements
such as nickel or manganese are required. This results in a considerably higher price compared
to ferritic steels.
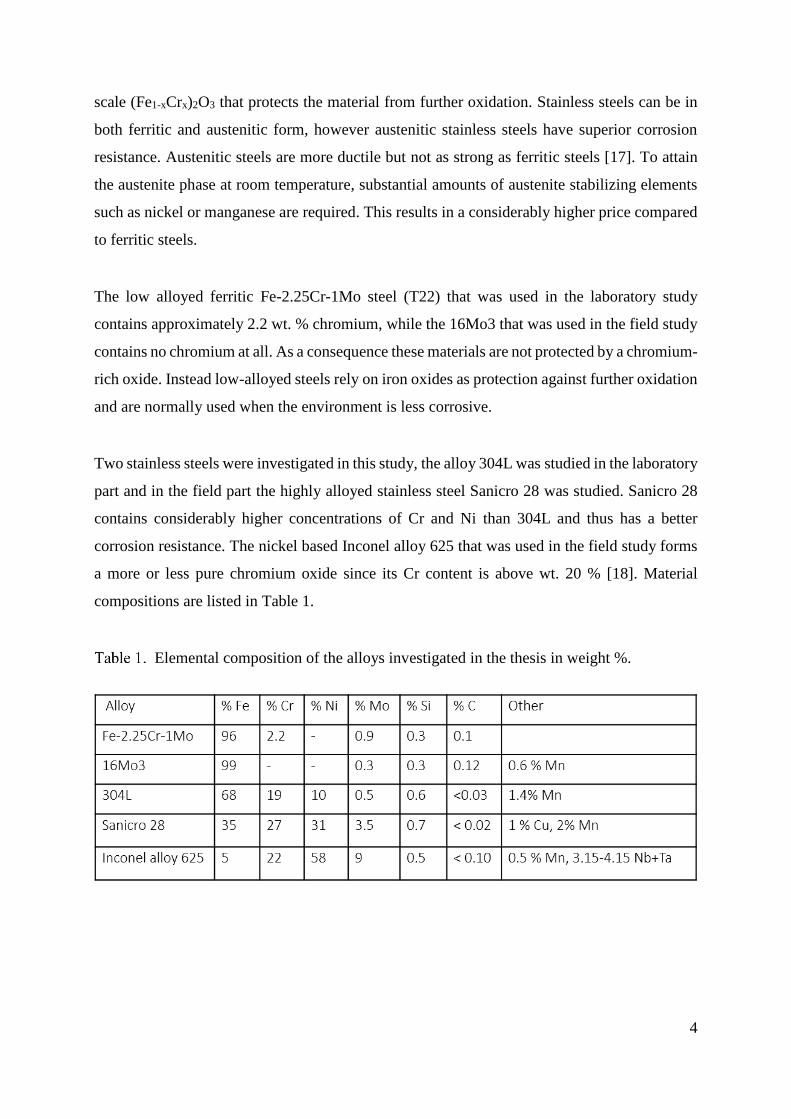
The low alloyed ferritic Fe-2.25Cr-1Mo steel (T22) that was used in the laboratory study
contains approximately 2.2 wt. % chromium, while the 16Mo3 that was used in the field study
contains no chromium at all. As a consequence these materials are not protected by a chromium-
rich oxide. Instead low-alloyed steels rely on iron oxides as protection against further oxidation
and are normally used when the environment is less corrosive.
Two stainless steels were investigated in this study, the alloy 304L was studied in the laboratory
part and in the field part the highly alloyed stainless steel Sanicro 28 was studied. Sanicro 28
contains considerably higher concentrations of Cr and Ni than 304L and thus has a better
corrosion resistance. The nickel based Inconel alloy 625 that was used in the field study forms
a more or less pure chromium oxide since its Cr content is above wt. 20 % [18]. Material
compositions are listed in Table 1.
Elemental composition of the alloys investigated in the thesis in weight %.

5
3 Oxidation of metals
3.1 Oxide formation
A metals resistance to corrosion depends on the properties of the oxide scale that is formed on
the surface. For ultimate resistance the scale should act as a barrier to the surrounding
environment, in other words, the scale ideally should be well adherent to the metal and have
low diffusion coefficients for ions and atoms.
Almost all metals are thermodynamically unstable when exposed to oxygen, which means that
an oxide layer rapidly forms on the metal surface. When a clean metal surface is exposed to
oxygen, the oxygen is adsorbed to the surface and reduced by the metal to form a metal oxide
(MexOy) see reaction 3.1.
xMe + 0.5yO2(g) → MexOy (3.1)
The oxidation process initiates with the adsorption of oxygen molecules on the metal surface,
followed by a charge transfer and the formation of O2- (see Figure 3.1 a). The next step is the
formation of individual oxide nuclei that grow laterally and eventually coalesce to cover the
entire metal surface (b). These first two steps are very fast and normally not observable at room
temperature. At this point, further oxide growth is controlled by the diffusion of reactants across
the continuous oxide film. The diffusion rate through the oxide at room temperature is close to
zero and the oxide growth is negligible. However, with increasing temperature, diffusion rates
normally also tend to increase [18]. Thus, the high temperature performance of a metal is, to a
great extent, determined by the diffusion properties and defect structure of its formed oxide.

6
Figure 3.1: Initiation of oxide growth. a) Adsorption of oxygen. b) Formation and lateral
growth of oxide nuclei and c) Further oxide growth requires ion and electron diffusion through
the scale.
3.2 Diffusion processes
For the growth of oxide scales, metal or oxygen ions must diffuse through the oxide layer.
Transport of these ions depends on the presence of defects and imperfections in the structure of
the oxide. Transport through metal oxides at high temperature, are either bulk diffusion or short-
circuit diffusion [19].
Metal oxides are seldom stoichiometric. The non-stoichiometry of oxides affects the properties
of the oxides, e.g. the electronic conductivity in the oxide that is very important in high
temperature oxidation. Non-stoichiometric oxides have either an excess or a deficit in metal
content, which leads to interstitial or vacant sites in the lattice. In an oxide with metal excess,
interstitial ions dominate the defect structure. Metal excess can also be achieved by means of
oxygen ion deficiency. In both of these instances, the defects have positive charges, and these
are compensated by the formation of equivalent concentrations of negative electrons [18]. The
charge is, thus, transferred by negative carriers and the semiconductor is classified as n-type,
(see Figure 3.2). Positive (p-type) semiconductors have a metal deficit, either by the removal
of metal ions or by the addition of oxygen ions. These defects will have negative effective
charges that are compensated through the formation of positive electron holes [18].

7
Figure 3.2: Classification of metal oxides by their defect structure and conducting properties.
Lattice diffusion
Lattice diffusion occurs through the movement of point defects, e.g. vacancies and interstitial
ions. The most common diffusion mechanisms are vacancy diffusion, interstitial diffusion and
the interstitialcy mechanism, (see Figure 3.3). Vacancy diffusion occurs when an ion in a
normal lattice site jumps to an adjacent unoccupied site in the lattice, (a) in Figure 3.3.
Interstitial diffusion refers to the movement of an ion situated in an interstitial site to a
neighboring interstitial site, (b) in Figure 3.3. This mechanism is probable only when the
interstitial ion is smaller than the ions in the normal lattice. The interstitialcy mechanism occurs
when an interstitial ion moves to a normal lattice site, forcing the ion in that position to move
to the next interstitial position, (c) in Figure 3.3. Vacancy diffusion is possible in crystals with
Schottky defects, while interstitial movements of ions occur in crystals with Frenkel defects.
Figure 3.3: Diffusion mechanisms in a lattice: (a) vacancy mechanism; (b) interstitial
mechanism; and (c) interstitialcy mechanism [19].
Non-stoichiometric oxides
Metal def icitMetal excess
MO1-x
Anion
vacancy
M1+xO
Cation
interstitial
M1-xO
Cation
vacancy
MO1+x
Anion
interstitial
n-type
semiconductor
p-type
semiconductor
a
c
b

8
Short-circuit diffusion
Ion diffusion can also occur through short-circuit diffusion paths. Short-circuit diffusion take
place in three-dimensional dislocations, e.g. along grain boundaries or cracks, which provide
fast transport paths through the oxide. In steels the bulk consists of small grains that give rise
to many of these dislocations. At low temperatures this is the most dominant diffusion process.
With increasing temperature bulk diffusion becomes increasingly significant. The activation
energies for short-circuit diffusion are lower than those for lattice diffusion (typically 50–70
%), which makes short-circuit diffusion dominant except at very high temperatures [18].
3.3 Kinetics of oxidation
The kinetics of oxygen uptake during high temperature oxidation, as illustrated by the mass
gain curves in Figure 3.4, can follow several different growth models. The three most common
rate laws are the linear, parabolic and logarithmic. All these models are idealized, and in
practice, they often only describe part of the oxidation process [18].
Figure 3.4: Mass gain curves for three common oxidation rate laws; linear oxidation, parabolic
oxidation and logarithmic oxidation.
Linear rate law
The linear rate law applies to situations in which the oxidation of a metal proceeds at a constant
rate. Typically, the oxidation rate is determined by a phase boundary reaction, but there are also
other processes that can exhibit linear kinetics. Oxide growth by the linear rate law is common

9
in the early stages of oxidation before the oxide is thick enough to effectively separate the
reactants. Linear oxidation can also occur if there is no protective oxide. The transport of ions
and electrons will then be fast regardless of oxide thickness, and the oxidation rate will remain
linear. In some cases, linear kinetics can occur after a period of parabolic behavior. This is
termed breakaway corrosion or catastrophic corrosion and indicates that the oxide has lost its
protective properties. Mathematically, the linear rate law is described as
x = klint (3.2)
where x is the oxide thickness, klin is the linear rate constant, and t is the exposure time [20].
Parabolic rate law
Most alloys and metals used at high temperatures follow the parabolic rate law. The rate of
oxidation is determined by the transport of ions and electrons through the oxide scale.
Consequently, the mass gain curve levels off as the oxide thickness increases. The transport is
driven by chemical potential gradients between the oxide/gas interface and the metal/oxide
interface.
The mathematical expression for parabolic growth was derived by Wagner in 1933 [21] . It can
be represented as equation (3.3):
x2 = kpt + C (3.3)
In this expression x is the oxide thickness, kp is the parabolic rate constant, t is the exposure
time and C is the integration constant. Wagner’s derivation of parabolic oxidation kinetics is
highly idealized and based on the following assumptions [18, 20, 21]:
The oxide layer is compact and perfectly adherent.
Migration of ions or electrons is the rate determining process.
Thermodynamic equilibrium is established at both the metal/oxide and oxide/gas
interfaces.

10
The oxide shows only small deviations from stoichiometry.
Thermodynamic equilibrium is established locally throughout the oxide scale.
Oxygen solubility in the metal can be neglected.
Combined rate laws
As mentioned in the linear rate law section, it is not uncommon that an oxidation process can
follow different rate laws during different stages of oxidation when abrupt changes in the
oxidation behavior occur as illustrated in Figure 3.5. This may occur when an initially protective
slow growing oxide abruptly loses its protectiveness, an occurrence known as breakaway
oxidation. The reason for such behavior may be, changes in the chemical composition of the
scale with a dramatic increase of the diffusion rate and/or mechanical failure of the scale.
Figure 3.5: Example of oxidation according to a combined rate law, with breakaway oxidation
after tb (time for breakaway).
3.4 Mechanical properties of oxide scales
During the growth of oxide scales, stresses may arise, which can lead to mechanical failure of
the scale. This exposes the underlying metal, and fast oxidation can occur. There are several
reasons for stress build up, including the oxide growth mechanism, differences in volume
between oxide and metal, thermal cycling, differences in thermal expansion coefficient. Upon
relaxing the system is often deformed in some way. Stress relief can be divided into four
categories: plastic deformation of the scale, detachment of the scale, cracking of the scale, and
deformation of the metal substrate [18].

11
3.5 Corrosion products
The chemical reactions that occur when a metal is exposed to a corrosive environment at high
temperatures usually result in the formation of various corrosion products. The most common
products are oxides, as all metals used at high temperatures are thermodynamically unstable in
the presence of oxygen. As mentioned earlier, the properties of the oxide determine the extent
of corrosion. Other elements present in the system may form other compounds with the metal.
The properties of these compounds and their interactions with the oxide may also influence
further corrosion. The compounds most commonly encountered in bio-mass and waste
combustion environments are, e.g. chlorides, sulfides, nitrides and carbides.
Wüstite, Fe1-xO
Wüstite forms on pure iron above 570 °C (on iron alloys, higher temperatures are required).
The oxide exhibit the rock salt crystal structure (see Figure 3.7), and, since iron can have more
than one oxidation state, deviations from stoichiometry are common. The oxide is a metal
deficit p-type semiconductor correctly described as Fe1-xO, with x from 0.05 to 0.15. It has a
high cation vacancy concentration and, consequently, has high ion diffusion rates and is poorly-
protective [18].
Magnetite, Fe3O4
Magnetite is less protective than hematite but not as poor as wüstite. The oxide contains both
divalent and trivalent iron ions and has the inverse spinel crystal structure (Btetr[A,B]octO4). This
structure consists of a face-centred cubic array of oxygen anions. One eighth of the tetrahedral
holes are occupied by half of the Fe3+ ions, and all of the octahedral holes are occupied by the
other half of the Fe3+ ions and all the Fe2+ ions, (see Figure 3.7) [18].
Hematite, α-Fe2O3
Hematite is the most protective of the iron oxides. In dry atmospheres, it remains protective up
to 500 °C. It has the corundum structure, which consists of a hexagonal array of oxygen anions,
with trivalent metal ions in two thirds of the octahedral holes, (see Figure 3.7). Hematite has n-
type conductivity at 650 – 800 °C and p-type conductivity at higher temperatures, but at the

12
lower temperatures, that are studied in this thesis, both cations and anions are assumed to be
transported [18].
Eskolaite, Cr2O3
Eskolaite, or Cr2O3, is the most protective oxide of those formed on stainless steels and is the
major reason for their high corrosion resistance. Its protectiveness can be attributed to a low
level of non-stoichiometry and low diffusion rates of ions. Eskolaite is the only solid chromium
oxide that is stable at high temperatures. It has the corundum structure and grows by transport
of chromium cations [18].
Corundum type solid solution (Fe,Cr)2O3
Eskolaite, Cr2O3 is completely soluble in Fe2O3, which on stainless steels usually results in an
oxide with a solid solution of both, i.e. (Fe1-xCrx)2O3. The protectiveness of this type of oxide
relies on its chromium content, and corrosion is caused by reactions that remove chromium
from it, e.g. the formation of chromic acid [22-27] or chromates [28-33]
Spinel type solid solution (Fe,Cr,Ni)3O4
Oxides based on Fe, Cr and Ni may form solid solutions with a spinel-type structure, i.e.
(Fe,Cr,Ni)3O4. Compared to magnetite, some of the Fe3+ ions may be replaced with Cr3+ ions,
whereas some of the Fe2+ ions may be replaced with Ni2+ ions. The actual composition depends
on the quantity of Fe, Cr and Ni, as well as the oxygen activity at the oxide/metal interface [18].
Spinel type oxides with other compositions may also form e.g. (Fe,Cr)3O4, which is formed in
the inward growing part of the scale on T22 during oxidation. Because of the slow diffusion of
Cr in spinel oxides (see Figure 3.6), Cr can act as a marker for the interface between
inward/outward growing parts of the scale. This interface also marks the initial alloy surface.

13
Figure 3.6. Cation diffusion coefficients in magnetite at 1200 C [34].
Figure 3.7: Crystal structures of metal oxides.
Transition metal chloride
When compounds such as KCl, NaCl, HCl, PbCl2 are present in the flue gas, transition metal
chlorides have been reported to form on metallic heat exchange surfaces. Depending on the
alloying elements in the steel, various chlorides, such as FeCl2, FeCl3, CrCl3 and NiCl2 may
form. The presence of transition metal chlorides is normally accompanied by severe corrosion
attacks. Iron chlorides are commonly detected on low-alloyed steels in the presence of alkali or
O2-
M3+
O2-
O2-
M2+
M3+
or M2+
M2+
or M3+
(a) Rock-Salt Structure (b) Spinel Structures
(c) Corundum Structure
O2-
O2-
M2+
M3+
or M2+
M2+
or M3+
O2-
O2-
M2+
M3+
or M2+
M2+
or M3+
(a) Rock-Salt Structure (b) Spinel Structures
(c) Corundum Structure
O2-
M3+
O2-
M3+
O2-
M3+
O2-
O2-
M2+
M3+
or M2+
M2+
or M3+
(a) Rock-Salt Structure (b) Spinel Structures
(c) Corundum Structure
O2-
O2-
M2+
M3+
or M2+
M2+
or M3+
O2-
O2-
M2+
M3+
or M2+
M2+
or M3+
(a) Rock-Salt Structure (b) Spinel Structures
(c) Corundum Structure

14
heavy metal chlorides. The diffusion rates of ions in FeCl2 are quite high. Consequently, iron
chloride does not protect the metal. FeCl2 is a good ion conductor but a poor electron conductor,
which may block the electron transport to the surface of the oxide scale, thus disturbing the O2
reduction on the surface. Iron chloride is volatile at high temperatures and, consequently, may
remove material through evaporation. An example of this can be seen in Figure 3.8, which
shows that chlorides have evaporated from the sample with subsequent condensation on the
sample holder. Iron chlorides are also hygroscopic and may cause severe atmospheric corrosion
when the metal is at room temperature in humid air after exposure.
Figure 3.8: Sample holder with condensed iron chloride from evaporation, which has reacted
into iron oxide.

15
4 Fireside corrosion in waste and biomass fired boilers
Examples of biomass used in heat and power production are wood chips, straw, grass and bark.
Municipal waste and industrial waste are also used for heat and power production. When
combusted, these fuels release higher levels of corrosive compounds, than fossil fuels, such as
oil and coal. Most important among the corrosive compounds are alkali salts (e.g. KCl and
NaCl) and hydrogen chloride, HCl(g). The lower sulfur to chlorine ratios of waste and biomass
are also suggested to make them more corrosive [35, 36]. Compounds that contain chlorine are
generally considered to be the most corrosive constituents of the environment in the boiler [37].
Waste normally releases higher levels of chlorine-containing compounds than biomass, as e. g.
plastics are common in waste. However, some biofuels, such as straw and grasses, release high
amounts of alkali chlorides when combusted. The concentrations of HCl(g) in the flue gas are
commonly in the range from 300 ppm to 1000 ppm in waste fired boilers and from 5 ppm to
100 ppm in biomass fired boilers. The KCl + NaCl concentrations in the flue gas in biomass
combustion range from ~ 5 to 50 ppm and < 120 ppm for waste combustion (see Table 2 for
comparisons).
Approximate flue gas composition in coal, biomass and waste [38]
4.1 Fuel types
Several varieties of biomass categories are used for heat and power production. This section
focuses on the fuels with the highest concentrations of heavy metal chlorides, which have been
identified as a contributor to elevated corrosion rates of boiler waterwalls [39, 40].

16
Municipal solid Waste (MSW)
Waste is characterized as a biofuel and usually contains higher levels of chlorine and alkali than
ordinary biomass such as peat and forest residues. The main contributor of chlorine in MSW
has been found to be PVC plastics [41]. There are two main reasons why MSW is used as a
fuel. The first one is that it is a simple way to reduce the amount of waste that is deposited in
landfills. The motivation for minimizing the amount of waste that end up in landfills has grown
due to increased deposition fees in Sweden and the western world. The second reason is that by
combusting waste, the intrinsic heat content is recovered and can be transformed into electricity
and district heating. When waste was introduced as a fuel source for energy conversion, it was
discovered that the resulting flue gas was far more corrosive than in conventional biomass
combustion. This caused severe material degradation, with very high corrosion rates, where
tube failures occurred after only a few months of operation [42]. Because of the increase in
corrosion rates, boilers were forced to operate at lower steam temperatures, with low electrical
efficiency as a result.
Recovered waste wood (RWW)
Recovered waste wood is considered to be a renewable a CO2 neutral fuel. Apart from
renewability it is fairly inexpensive compared to virgin wood. RWW is highly heterogeneous,
originating from a variety of sources. The main sources comes from construction and
demolition, MSW and industrial waste. Typical constituents are demolition wood, packaging
material and used wood from industrial and residential activities. Since the wood has been used,
it is likely to contain non-wood contaminants, such as plastics, paint, glue and chemicals for
wood treatment. Paints are the primary source of zinc and lead contaminants (as pigments),
which are expected to increase the corrosion rate of boiler water walls. For an elemental
composition see Table 3.
Average fuel composition of 13 RWW samples [39].
17
4.2 Combustion systems
The often high levels of alkali, chlorine and water content has forced boiler operators to develop
the combustion techniques in aspect of temperature, steam pressure and boiler design. The most
frequently used combustion techniques are grate firing, bubbling fluidized bed and circulating
fluidized bed. To mitigate the corrosion attack, boilers are constructed with the aim of placing
the heat exchanger with the lowest metal temperature in contact with the warmest flue gas.
Consequently, the material temperature of the waterwalls is lower than that of the superheaters,
since the gas temperature is higher in the furnace where the waterwalls are located. In the event
of highly corrosive fuels, boilers are usually designed to have a radiation section without heat
exchange tubes, in order to lower the flue gas temperature before it interacts with the
superheaters.
Grate
In the group of grate fired boilers, some types can be distinguished based on if the grate is
stationary sloping, travelling or vibrating see Figure 4.1. Depending on size, the grate is either
air- or water-cooled. Grate firing is mainly used for solid fuels in small- to medium-sized units.
The main fuels are bark, straw and municipal solid waste. Grate firing cannot combust fuels
where the humidity exceeds 60 %, since the fuel is dried, devolatilized and the remaining carbon
is burned as it is transported over the grate. If the fuel humidity is too high, incomplete
combustion can occur [43].

18
Figure 4.1: Illustration of a grate boiler [43].
Bubbling fluidized bed (BFB)
A bubbling fluidized bed is filled with sand particles whit diameters ranging from 0.5 to 1.2
mm. Air is introduced through nozzles at the bottom of the bed (see Figure 4.2). When the
velocity of the air is sufficient, the bed becomes fluidized, and the combustion takes place in
the bed. The bed temperature is typically between 750-900 °C. A general feature of fluidized
bed systems is that they are flexible in relation to the homogeneity of the fuel to be fired which
makes them suitable for co-firing. A drawback of this combustion technique, is that the fuel
must be processed before combustion since the fuel particles must be relatively small in order
to enable fluidization [44].
19
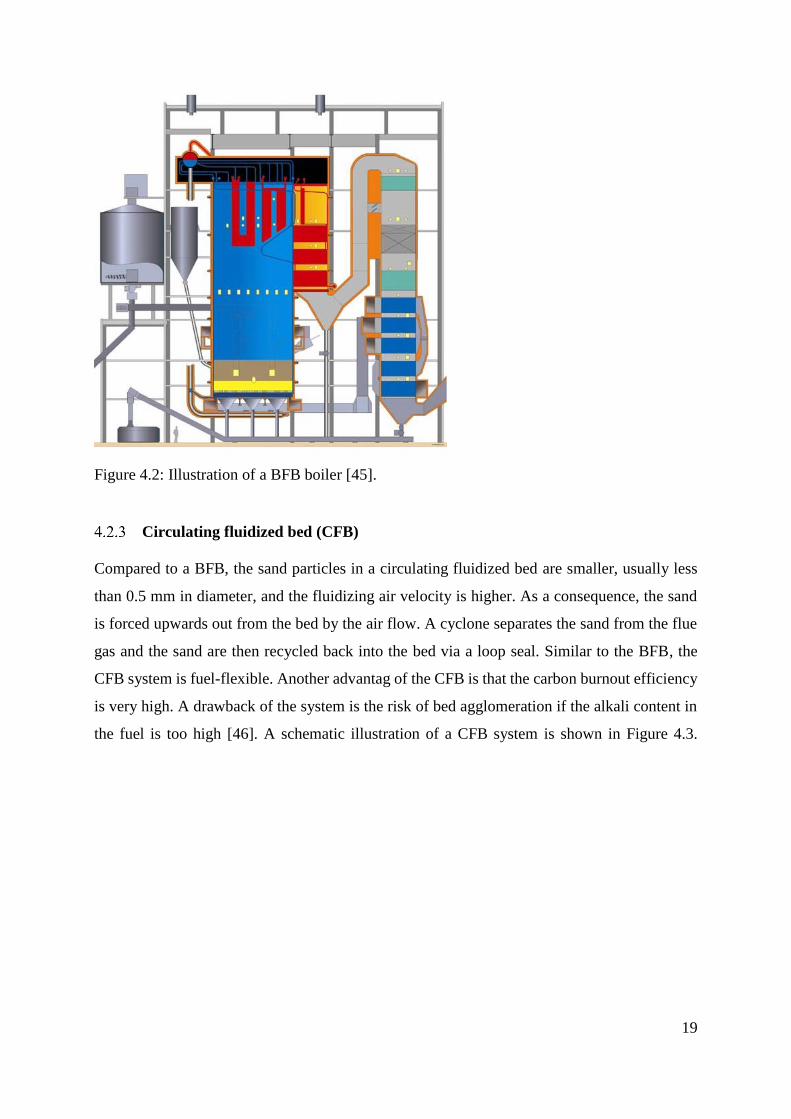
Figure 4.2: Illustration of a BFB boiler [45].
Circulating fluidized bed (CFB)
Compared to a BFB, the sand particles in a circulating fluidized bed are smaller, usually less
than 0.5 mm in diameter, and the fluidizing air velocity is higher. As a consequence, the sand
is forced upwards out from the bed by the air flow. A cyclone separates the sand from the flue
gas and the sand are then recycled back into the bed via a loop seal. Similar to the BFB, the
CFB system is fuel-flexible. Another advantag of the CFB is that the carbon burnout efficiency
is very high. A drawback of the system is the risk of bed agglomeration if the alkali content in
the fuel is too high [46]. A schematic illustration of a CFB system is shown in Figure 4.3.

20
Figure 4.3: Illustration of a CFB boiler: a) the waterwall region and b) the superheater region.
4.3 Superheater corrosion
The use of cheaper fuels for energy production has resulted in significant material degradation
of heat exchanger surfaces. The two foremost areas in boilers where high corrosion rates have
been identified are on furnace water walls (discussed in the next section) and on superheater
tubes. Estimating tube lifetimes is not an easy task since the chemistry involved is quite
complex and several corrosion mechanisms are probably at play simultaneously. The complex
chemistry depends on the type of fuel that is combusted. As mentioned earlier, MSW and RWW
are highly heterogeneous compared to fossil fuels, with high levels of elements that are known
to play a role in the degradation of superheater materials see Figure 4.4.

21
Figure 4.4: Schematic illustration of the environment on the superheater.
The tube material is usually steels or alloys with varying levels of chromium. For simplicity the
alloys can be divided into categories according to the formed oxide (see Table 4). The first
category is low-alloyed steels, with a chromium content that is not sufficiently high to form a
Cr-rich oxide, instead these alloys rely on iron oxides as protection. Since the formed oxides
Fe2O3 and Fe3O4 contains a high defect density, these oxides are insufficient as protection
against rapid oxidation in corrosive environments or at higher temperatures and as a
consequence, the temperature limit for these steels is 500 °C. In highly corrosive environments,
this temperature has to be kept considerably lower. In more corrosive environments or at higher
temperatures, iron/chromium oxide (Fe,Cr)2O3 or Cr2O3 formers are used instead. These can be
divided into the classifications in Table 4. The Cr/Fe ratio in the alloy indicates the degree of
protectiveness of the oxide. A higher ratio means that if the oxide is depleted in Cr, there is a
reservoir left in the steel that can diffuse into the oxide, thus retaining the protective properties
of the solid solution of Fe2O3/Cr2O3, as mentioned earlier. In very aggressive environments, a
high Cr/Fe ratio in the alloy is required to withstand fast degradation. Therefore, all reactions
that consumes Cr from the oxide are considered to be detrimental for the oxide´s protectiveness.
During combustion ashes in the flue gas are deposited on top of the oxide (see Figure 4.4). The
amount and composition of the deposits vary greatly with the fuel type. Fuels that have high
concentrations of alkali and chlorine results in a corrosive deposit in contact with the oxide. As
mentioned earlier, there are countermeasures available, including co-combustion and the
introduction of additives.

22
Steel classifications with compositions in weight %.
4.4 Boiler water wall corrosion
Compared to the corrosion issues of the superheater region, far less research has been conducted
on waterwalls, however, researchers at Åbo Academy [39, 47] and KTH [40] are active in the
field. Even though waterwalls consist of steel tubes similar to superheaters, there are
differences. Instead of heating steam, waterwalls separate the pressurized water inside the tubes
from the hot flue gases in the furnace. The temperature gradient between the flue gas and the
water brings the water to a boil and the produced steam is collected in the vapor dome. With a
water temperature of about 350 °C, the flue gas temperature is typically 750- 1000 °C. A rule
of thumb is that the water wall material temperature is up to 50 °C higher than the water
temperature, i.e. up to 400 °C [40] (see Figure 4.5).

23
Figure 4.5: Schematic illustration of the temperature gradient through the waterwalls.
As a result of the lower material temperature at waterwalls than in superheaters, different alloys
(low-alloyed steels) are normally used which in combination with the lower temperature, results
in the altered corrosion mechanism that will be discussed in the following section.
4.5 Corrosion mechanism
The effect of HCl(g) or Cl2(g) on the high temperature corrosion of pure metals [48-53] and
alloys [48, 54-65] has been studied. Usually, the corrosive effect of chlorine-containing species,
such as HCl(g), Cl2(g), and alkali chlorides is explained by the proposed “active oxidation”
mechanism [51, 52, 54, 56]. In this mechanism, Cl2 (formed from HCl through the Deacon
process, reaction 4.1) is suggested to be transported through the protective oxide in gaseous
form. When Cl2 reaches the metal/oxide interface, the oxygen partial pressure is low and the
formation of transition metal chlorides, e.g. FeCl2 is hence thermodynamically favored. The
transition metal chlorides formed are volatile at high temperatures and are thought to diffuse
outward through the scale as gas molecules.
2HCl(g) + 0.5O2(g) → Cl2(g) + H2O(g) (4.1)
0.5xCl2(g) + Me(s) → MeClx(s) (4.2)
MeClx(s) → MeClx(g) (4.3)
24
The following three reactions are an example of relevant chlorides that can be encountered in
the corrosion process of steels. The equilibrium pressures gives an indication of the compound´s
propensity to evaporate. At higher temperatures the evaporation increase.
FeCl2(s) → FeCl2(g), peq = 5.13*10-7 bar at 400 °C [66] calculated with data from Barin.
NiCl2(s) → NiCl2(g), peq = 1.32*10-8 bar at 400 °C [66] calculated with data from Landolt.
CrCl2(s) → CrCl2(g), peq = 4.32*10-12 bar at 400 °C [66] calculated with data from Landolt.
The outward diffusion of metal chloride molecules has been suggested to be the rate-limiting
step in the reaction mechanism [51, 56]. When the metal chloride molecules reach the oxide/gas
interface, they decompose into non-protective porous metal oxide and Cl2 through reaction with
O2.
yMeClx(g) + 0.5zO2(g) → MeyOz(s) + (x*y)/2Cl2(g) (4.4)
The released chlorine gas may then penetrate the oxide again. This process is proposed to
account for the porous and poorly adherent scale that is often formed in the presence of chlorine-
containing species [51, 52].
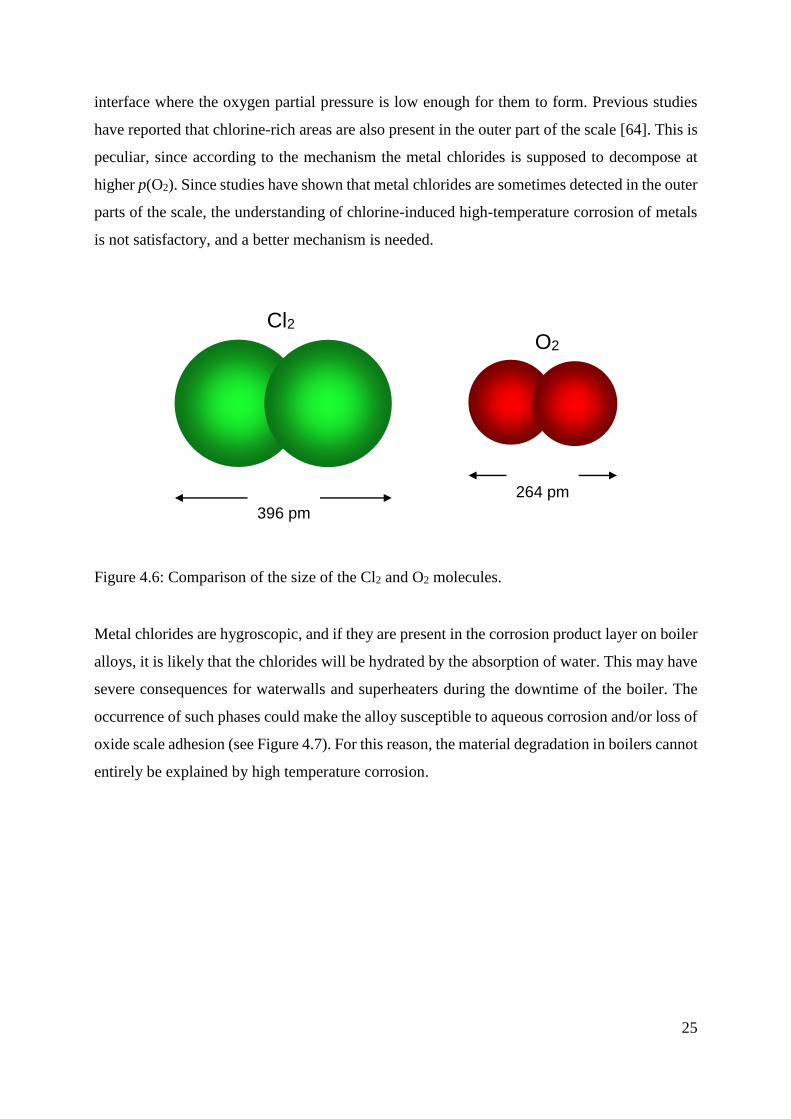
An apparent difficulty [67] with the active oxidation mechanism is the transportation of Cl2(g)
through the oxide. At the metal/oxide interface, where oxygen activity is low, chlorine is
assumed to react with the metal to form transition metal chlorides. This implies that the oxide
is impermeable to the O2 molecule while, at the same time, the Cl2 molecule is transported
through it. As illustrated in Figure 4.6, the Cl2 molecule (396 pm across) is substantially larger
than the O2 molecule (264 pm across). It has not been explained why the oxide would be
impermeable to the O2 molecule but permeable to the larger Cl2 molecule. Grabke [56] has
suggested that chlorine creates fast diffusion paths in the oxide. However, regardless of how
the pathways for Cl2 molecular diffusion are created, they must also be fast diffusion paths for
oxygen molecules. If oxygen is able to use these fast diffusion paths, the thermodynamic
conditions for metal chloride formation are no longer fulfilled. The outward diffusion of
gaseous metal chlorides has similar difficulties. Metal chloride molecules are much larger than
Cl2 and cannot penetrate an oxide that prevents the diffusion of gaseous O2. Another problem
with the active oxidation model is its prediction that chlorides are confined to the metal/oxide
25
interface where the oxygen partial pressure is low enough for them to form. Previous studies
have reported that chlorine-rich areas are also present in the outer part of the scale [64]. This is
peculiar, since according to the mechanism the metal chlorides is supposed to decompose at
higher p(O2). Since studies have shown that metal chlorides are sometimes detected in the outer
parts of the scale, the understanding of chlorine-induced high-temperature corrosion of metals
is not satisfactory, and a better mechanism is needed.
Figure 4.6: Comparison of the size of the Cl2 and O2 molecules.
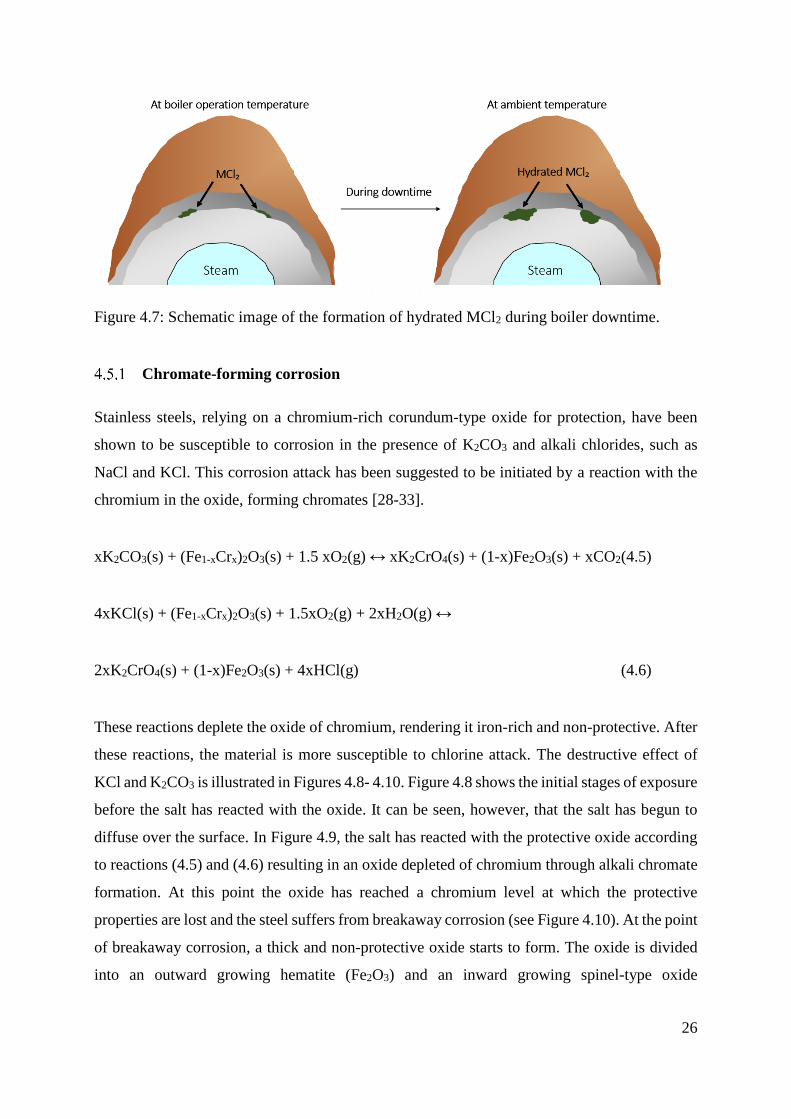
Metal chlorides are hygroscopic, and if they are present in the corrosion product layer on boiler
alloys, it is likely that the chlorides will be hydrated by the absorption of water. This may have
severe consequences for waterwalls and superheaters during the downtime of the boiler. The
occurrence of such phases could make the alloy susceptible to aqueous corrosion and/or loss of
oxide scale adhesion (see Figure 4.7). For this reason, the material degradation in boilers cannot
entirely be explained by high temperature corrosion.
Cl2
O2
264 pm
396 pm
26
Figure 4.7: Schematic image of the formation of hydrated MCl2 during boiler downtime.
Chromate-forming corrosion
Stainless steels, relying on a chromium-rich corundum-type oxide for protection, have been
shown to be susceptible to corrosion in the presence of K2CO3 and alkali chlorides, such as
NaCl and KCl. This corrosion attack has been suggested to be initiated by a reaction with the
chromium in the oxide, forming chromates [28-33].
xK2CO3(s) + (Fe1-xCrx)2O3(s) + 1.5 xO2(g) ↔ xK2CrO4(s) + (1-x)Fe2O3(s) + xCO2 (4.5)
4xKCl(s) + (Fe1-xCrx)2O3(s) + 1.5xO2(g) + 2xH2O(g) ↔
2xK2CrO4(s) + (1-x)Fe2O3(s) + 4xHCl(g) (4.6)
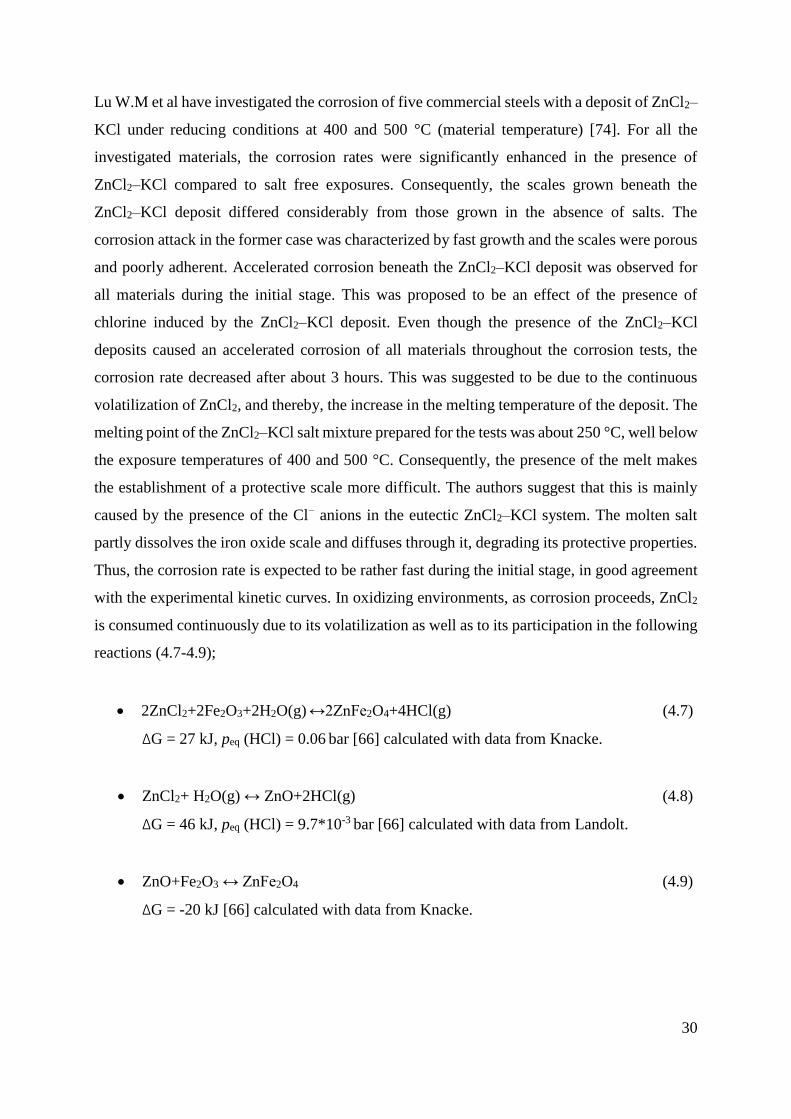
These reactions deplete the oxide of chromium, rendering it iron-rich and non-protective. After
these reactions, the material is more susceptible to chlorine attack. The destructive effect of
KCl and K2CO3 is illustrated in Figures 4.8- 4.10. Figure 4.8 shows the initial stages of exposure
before the salt has reacted with the oxide. It can be seen, however, that the salt has begun to
diffuse over the surface. In Figure 4.9, the salt has reacted with the protective oxide according
to reactions (4.5) and (4.6) resulting in an oxide depleted of chromium through alkali chromate
formation. At this point the oxide has reached a chromium level at which the protective
properties are lost and the steel suffers from breakaway corrosion (see Figure 4.10). At the point
of breakaway corrosion, a thick and non-protective oxide starts to form. The oxide is divided
into an outward growing hematite (Fe2O3) and an inward growing spinel-type oxide
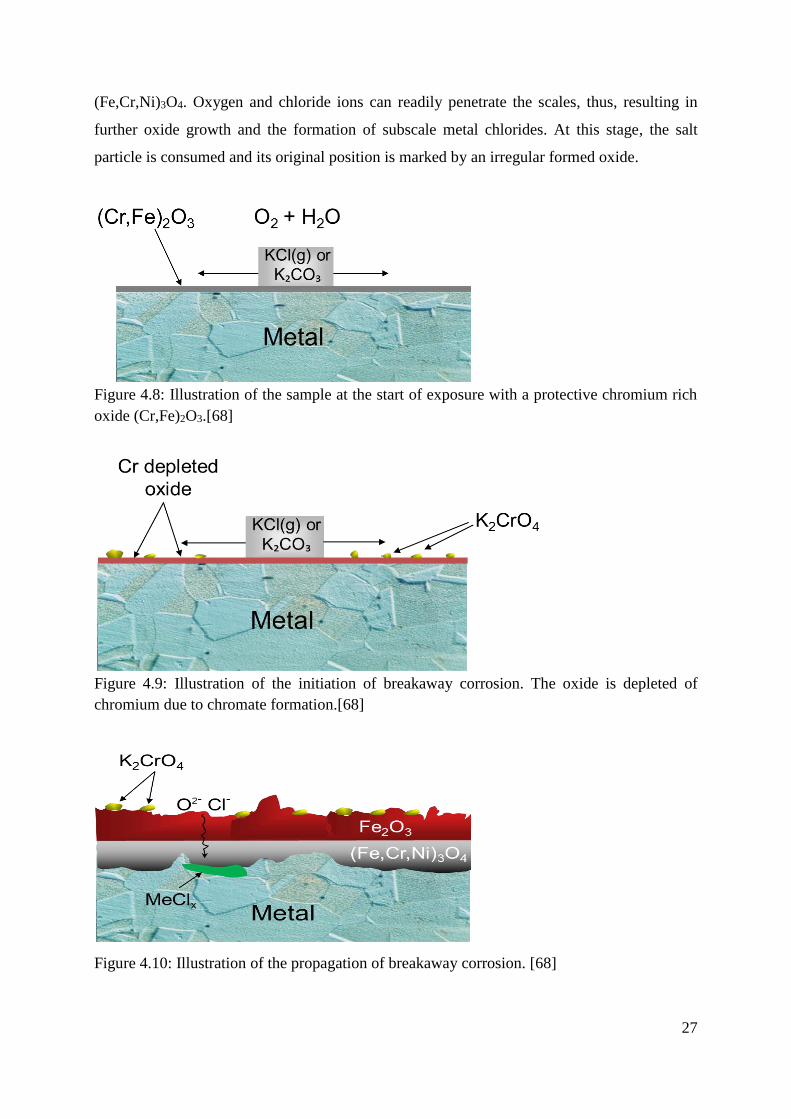
27
(Fe,Cr,Ni)3O4. Oxygen and chloride ions can readily penetrate the scales, thus, resulting in
further oxide growth and the formation of subscale metal chlorides. At this stage, the salt
particle is consumed and its original position is marked by an irregular formed oxide.
Figure 4.8: Illustration of the sample at the start of exposure with a protective chromium rich
oxide (Cr,Fe)2O3.[68]
Figure 4.9: Illustration of the initiation of breakaway corrosion. The oxide is depleted of
chromium due to chromate formation.[68]
Figure 4.10: Illustration of the propagation of breakaway corrosion. [68]

28
4.6 Waterwall corrosion mechanisms
Molten species in the deposits of waste and biomass-fired boilers have been suggested to cause
accelerated corrosion [13, 18, 37, 69-71]. Kofstad [18] has suggested two main reasons for the
corrosiveness of liquid phases. First, the liquid itself provides fast transport of ions. Second, a
liquid phase provides an electrolyte that can act as a pathway for an ionic charge transfer for an
electrochemical attack. The melt can dissolve the otherwise protective oxide, which exposes
the metal to the surrounding environment. Both potassium and sodium chloride form eutectic
compositions with iron chloride, with melting points between 200 – 600 °C see Table 4 [37].
These melts have been suggested to cause severe corrosion of steels exposed above the melting
temperature. In waste-fired boilers the presence of zinc and lead compounds has also been
suggested to account for severe corrosion by lowering the melting point of the deposits [70].
Melting points of pure salts and mixtures.
Ruh, et al have shown with thermodynamic calculations that FeCl2 is soluble in molten KCl–
ZnCl2 near the eutectic compositions, while the solubility of CrCl3 and NiCl2 are very limited
[67]. In this manner, the outward diffusion of FeCl2 is favored and diffuses easily to outer part
of the salt melt layer. As FeCl2 reaches the outer part of salt melt, FeCl2 will be oxidized due to
the high p(O2). The authors have concluded that the solubility of metal chlorides in molten
KCl–ZnCl2 leads to a higher diffusion rate that results in a higher oxidation rate. Therefore, the
solubility of metal chlorides in the molten salts influences the extent of corrosion of each metal.
A proposed mechanism for the chloride melt-induced dissolution of the steel can be seen in
Figure 4.11 [67].

29
Figure 4.11: Model of chloride melt induced high temperature corrosion, displaying the
transport of gas species and reactions that results in iron oxide and iron chloride [67].
Bankiewicz et.al have in several papers studied the corrosive effect of ZnCl2 and PbCl2. The
results indicate that PbCl2 is comparativelly more corrosive compared to ZnCl2, with formation
of an uneven oxide and signs of internal attack, already below the melting point of the lead
chloride [47]. This observation is in agreement with the findings in this thesis, (even though the
amount of PbCl2 was far less) in which a localized attack with an uneven oxide was observed
on T22 in the presence of PbCl2 at 400 °C. Furthermore, the findings in this study is in line with
[47], in which PbCl2 seems to be more corrosive than ZnCl2. Studies with salt mixtures
containing ZnCl2 and PbCl2 have also been conducted by Bankiewicz et.al. Those authors found
a correlation between increased amounts of ZnCl2 in the mixture and accelerated corrosion
when T22 was exposed to a mixture of ZnCl2 – K2SO4 [72]. When T22 was exposed in the
presence of PbCl2 containing salt mixtures (PbCl2 with KCl or K2SO4), a severe corrosion attack
was observed already below the melting point of the mixture [73]. This indicates that a melt is
not a prerequisite for elevated corrosion rates. In comparison in the presence of a PbCl2 - K2SO4
mixture at 400 °C, the formed corrosion layer was twice as thick as the one formed in the
presence of a ZnCl2 - K2SO4 mixture [73].
Schaal et.al [12] have studied the influence of ZnCl2 and PbCl2 at 450 °C on the syntethic ashes
that are representative for waste combustion. The tested materials were 16Mo3 and Inconel
625. Contrary to Bankiewicz et.al, they detected a higher mass loss in the presence of ZnCl2
than in the presence of PbCl2. This was explained by a higher percentage of molten phase in
the ZnCl2 containing ashes. However, both studies, detected the highest corrosion rates in ashes
in which ZnCl2 and PbCl2 were present simultaneously.
30
Lu W.M et al have investigated the corrosion of five commercial steels with a deposit of ZnCl2–
KCl under reducing conditions at 400 and 500 °C (material temperature) [74]. For all the
investigated materials, the corrosion rates were significantly enhanced in the presence of
ZnCl2–KCl compared to salt free exposures. Consequently, the scales grown beneath the
ZnCl2–KCl deposit differed considerably from those grown in the absence of salts. The
corrosion attack in the former case was characterized by fast growth and the scales were porous
and poorly adherent. Accelerated corrosion beneath the ZnCl2–KCl deposit was observed for
all materials during the initial stage. This was proposed to be an effect of the presence of
chlorine induced by the ZnCl2–KCl deposit. Even though the presence of the ZnCl2–KCl
deposits caused an accelerated corrosion of all materials throughout the corrosion tests, the
corrosion rate decreased after about 3 hours. This was suggested to be due to the continuous
volatilization of ZnCl2, and thereby, the increase in the melting temperature of the deposit. The
melting point of the ZnCl2–KCl salt mixture prepared for the tests was about 250 °C, well below
the exposure temperatures of 400 and 500 °C. Consequently, the presence of the melt makes
the establishment of a protective scale more difficult. The authors suggest that this is mainly
caused by the presence of the Cl− anions in the eutectic ZnCl2–KCl system. The molten salt
partly dissolves the iron oxide scale and diffuses through it, degrading its protective properties.
Thus, the corrosion rate is expected to be rather fast during the initial stage, in good agreement
with the experimental kinetic curves. In oxidizing environments, as corrosion proceeds, ZnCl2
is consumed continuously due to its volatilization as well as to its participation in the following
reactions (4.7-4.9);
2ZnCl2+2Fe2O3+2H2O(g) ↔2ZnFe2O4+4HCl(g) (4.7)
∆G = 27 kJ, peq (HCl) = 0.06 bar [66] calculated with data from Knacke.
ZnCl2+ H2O(g) ↔ ZnO+2HCl(g) (4.8)
∆G = 46 kJ, peq (HCl) = 9.7*10-3 bar [66] calculated with data from Landolt.
ZnO+Fe2O3 ↔ ZnFe2O4 (4.9)
∆G = -20 kJ [66] calculated with data from Knacke.

31
According to these reactions, KCl is enriched in the molten salt mixture, producing a rise in the
melting point of the KCl–ZnCl2 mixture, according to the phase-stability diagram of the KCl–
ZnCl2 system (see Figure 4.12). Within the work of this thesis, ZnCl2 was exposed on gold. It
was noted that after 15 min of exposure, all ZnCl2 had either evaporated or reacted into ZnO,
which under oxidizing conditions will deplete the mixture in ZnCl2 and shift the composition
towards KCl. This fast evaporation of ZnCl2 has also been reported by Lehmusto et.al [75], in
which 30 % of the salt had evaporated after 3 hours at 400 °C. Bankiewicz et.al [47] have
performed thermodynamic calculations regarding saturation pressure of ZnCl2 over a range of
temperatures. It was noted that, above 350 °C a rapid increase in the saturation pressure
commence, which theoretically can explain the fast evaporation.
Figure 4.12 Phase diagram of the KCl-ZnCl2 system calculated with Factsage [76].
Under this condition, the salt mixture will gradually become solid, unless it is supplied with
new ZnCl2 and the corrosion rates decrease during the later stages.
Folkeson et al have reported that the acceleration of the corrosion of Fe-2.25Cr-1Mo steel
caused by KCl is very strong at 400 °C [77]. The resulting thick scale consists of several oxide
layers, with iron chloride accumulating at the scale/metal interface. The bottom oxide layer in

32
that study was formed by the inward diffusion of oxygen and consisted of iron chromium spinel
oxide. The upper part of the scale was chromium free and made up of a magnetite layer in the
middle and a hematite layer on top.
In contradiction to the active oxidation model, a new mechanism is proposed to explain the
effect of KCl. Jonsson et al have shown with ESEM in-situ oxidation that the initial corrosion
of a Fe-2.25Cr-1Mo steel deposited with KCl starts at approximately 355 °C [78], which is the
eutectic temperature for the KCl-FeCl2 system (see Figure 4.13). At this temperature, it is
argued that a continuous liquid surface film is formed, which causes the KCl from the large
particles to spread over the surface due to a concentration gradient. Simultaneously, FeCl2
diffuses towards the KCl particles. It is proposed that KCl reacts with O2 and water on the scale
surface forming potassium hydroxide. The chloride ions released in this way diffuse towards
the metal via the oxide grain boundaries, forming iron chloride. The increase in oxidation rate
caused by KCl is attributed to the presence of iron chloride at the oxide grain boundaries, the
iron chloride facilitating the grain boundary transport of both iron ions and oxygen ions through
the scale. (Compare this finding with the active oxidation mechanism, in which gas is assumed
to diffuse through the scale.) Additionally, the buckling of the scale and the poor scale adhesion
are also attributed to the presence of iron chloride.
Figure 4.13 Phase diagram of the KCl-FeCl2 system calculated with Factsage [76].
33
Corrosion mitigating techniques
Since the shift from fossil fuels has resulted in very high corrosion rates, there have been
attempts to find means to mitigate this material wastage. The more successful techniques have
been the methods, which in different ways, raise the levels of SO2 and/or SO3 in the flue gas.
The sulfur oxides can then react with chlorides in the flue gas and consequently, convert these
into less corrosive sulfates. This can be achieved with various methods. The first method is to
co-combust fuels with a high chlorine content with a different fuel stream that is known to
contain relatively high amounts of sulfur. Examples of such fuels are sewage sludge or peat,
both of which have been shown to lower the levels of alkali chlorides in the flue gas with lower
corrosion rates as a result [79, 80]. A different method that has shown promising results, has
been developed by Vattenfall, the so called ChlorOut® technique. With this method ammonium
sulfate ((NH4)2SO4) is sprayed into the flue gas, thereby converting the chlorides into sulfates
[81, 82]. The method that is included in this thesis is a technique in which the sulfur in the fuel,
which is released during combustion, is extracted from the flue gas in a wet scrubber. The
scrubber contains hydrogen peroxide (H2O2) which reacts with the SO2, resulting in sulfuric
acid (H2SO4) which is recirculated back into the furnace. In the furnace, the sulfuric acid
decomposes into SO2, thus, closing the loop. The advantage of this technique is that no
externally source of sulfur is needed, instead, the method utilizes existing sulfur in the fuel.
This method is further explained in paper V.
The most commonly used method to mitigate corrosion at the waterwalls is to weld or coat the
original wall tubes with a nickel based alloy. These materials are, however, very expensive
compared to ferritic steels, which is why new less expensive preventative techniques are
needed.
34
5 Experimental techniques
5.1 Laboratory exposures
Sample preparation
The alloy studied was the Fe-2.25Cr-1Mo steel T22 (see Table 2.1 for composition). The sample
dimensions were 1.5*1.5*0.2 cm. A hole (1.5 mm in diameter) was drilled for handling. The
surface area was 5.56 cm2. The corresponding surface area of the TG-exposed samples were
2.27 cm2. Prior to exposure, the samples were ground to a 320 mesh in water and polished with
9, 3 and 1µm diamond solutions to a mirror-like appearance. The samples were degreased in
acetone and ethanol using ultrasonic agitation. Gravimetric measurements were made using a
Sartorius balance with microgram resolution.
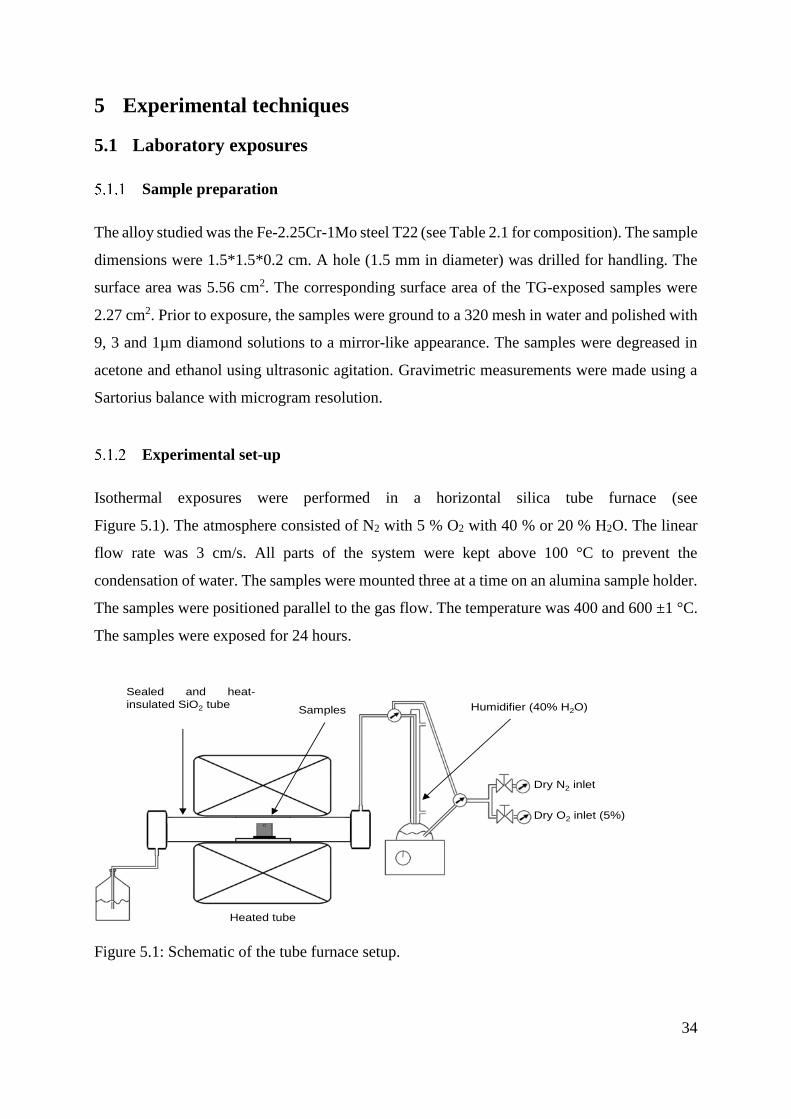
Experimental set-up
Isothermal exposures were performed in a horizontal silica tube furnace (see
Figure 5.1). The atmosphere consisted of N2 with 5 % O2 with 40 % or 20 % H2O. The linear
flow rate was 3 cm/s. All parts of the system were kept above 100 °C to prevent the
condensation of water. The samples were mounted three at a time on an alumina sample holder.
The samples were positioned parallel to the gas flow. The temperature was 400 and 600 ±1 °C.
The samples were exposed for 24 hours.
Figure 5.1: Schematic of the tube furnace setup.
Sealed and heat-
insulated SiO2 tube Humidifier (40% H2O)
Dry N2 inlet
Dry O2 inlet (5%)
Samples
Heated tube

35
Isothermal exposures were also performed in-situ in a Setaram Setsys Evolution® system. The
sample was suspended vertically from the scale as shown in Figure 5.2. This arrangement makes
it possible to record the mass change of the sample in real time. A counter flow of inert N₂ was
introduced from above the sample to protect the scale from corrosive gases. At the bottom of
the system, the gases that came in contact with the sample were introduced. This setup allows
the system to be run with varying levels of H2O(g), HCl(g), as well as SO2(g). In order to check
that the desired concentration of HCl(g) was present during exposure, the outlet from the
furnace was bubbled in 1 L of water for 1 hour. The water was then analyzed with Ion
chromatography (IC) and the resulting amount of Cl- matched the calculated theoretical value
that is expected in 1 L after 1 hour.
Figure 5.2: Schematic of the in-situ thermo gravimetric setup.
5.2 Field exposures
Field exposures were carried out in Renovas waste-fired grate boiler in Sävenäs Gothenburg,
Sweden, a schematic of the plant is shown in Figure 5.4. Corrosion probes were exposed to the
flue gas in the superheater region. Three different materials were studied, the low-alloyed
16Mo3, the high-alloyed Sanicro 28 and the nickel based Inconel 625 that was welded onto a
16Mo3 tube (for compositions see Table 1). The material temperature was regulated with

36
compressed air. The material temperature was logged for each sample. One of the sample
temperatures was chosen to control the cooling. The thermocouples were directed towards the
gas stream, referred to as windward (see Figure 5.3). The samples were exposed for 24 hours
and 1000 hours. Before exposure, the samples were cleaned and degreased in ethanol and
acetone using ultrasonic agitation. After exposure, the samples were stored in desiccators over
P2O5. The samples exposed for 1000 hours were analyzed to determine material loss (as a
measurement of corrosion).
Figure 5.3: Corrosion probe used in the Sulfur recirculation exposures.
Figure 5.4: Schematic overview of the Sulfur recirculation system and boiler.
37
6 Analytical techniques
A wide range of analytical techniques can be used to evaluate the exposed samples. All
available techniques have advantages and drawbacks and a single technique is rarely able to
provide the complete story of a corrosion attack. Therefore it is important to couple the results
from different analytical tools in order to obtain a more complete picture. The analytical
techniques used for high temperature corrosion can be divided into three categories: imaging,
elemental analyzing and phase detection techniques. Imaging techniques includes different
types of microscopes such as Scanning Electron Microscopes (SEM), Transmission Electron
Microscopy (TEM) and Optical Microscopy (OM). Both SEM and TEM are often used together
with a technique from the second type namely Energy Dispersive X-rays (EDX), which is used
to determine the elemental composition on the sample. Another technique is IC (Ion
Chromatography), used to quantify the amount of water soluble ions on a sample. These
techniques gives information about the elemental distribution, however knowing only the
distribution is not sufficient to explain a corrosion attack. The aim is to describe oxide growth,
which requires knowledge about the crystalline phases. These are detected with diffraction
techniques, such as X-ray Diffraction (XRD) and electron diffraction in the TEM.
6.1 Imaging techniques and elemental analysis
Electron microscopy
Electron microscopy was used to investigate the microstructure of a corrosion attack in detail.
This method offers high magnification imaging at high resolution by scanning a focused
electron beam over the sample surface. It also offers information about the chemical
composition of the imaged area. Thus, electron microscopy is an essential tool for the study of
high-temperature corrosion.

38
Figure 6.1: Some of the different processes that occur when atoms are bombarded with electrons
[83] .
As the atoms in the sample are hit by the electrons, several different interactions take place that
generates various types of signals (see Figure 6.1). All these processes occur throughout the
entire volume of interaction but, because the specific energy of the emitted electrons or photons
differs, the depth from which they can escape also differs. This is illustrated in Figure 6.2.
Figure 6.2: Illustration of the interaction volume (the size corresponds to an acceleration
voltage of 20 kV). A signal with more energy can escape from larger depths [83].

39
Secondary electrons are generated when the primary electron beam causes ionization of inner
core electrons in the surface atoms. Because of their low energy, secondary electrons may only
escape from a small volume, 5-10 nm from the surface [83]. They are, therefore, well suited for
high resolution imaging.
Backscatter electrons are generated by the scattering of the primary electron beam by the sample
atoms. Consequently, the yield of backscatter signal depends on the atomic number of the
scattering atoms, heavy elements appearing brighter. Backscatter electrons offer both a
topographical and a compositional contrast. However, because of their higher energy (>50 eV)
[83], they escape from a larger volume than secondary electrons, and as a result, the resolution
is worse (compare images a) and b) in Figure 6.3).
Figure 6.3: An example of the difference between a) back scattered electron image and b)
secondary electron image of the same area
Chemical information about the surface atoms is provided by characteristic X-rays and Auger
electrons. These types of signals are generated in similar ways, starting with the ionization of
an inner core electron. The resulting ion is, thus, left in an excited state. An electron in a higher
orbital can relax to the vacancy left by the ionization. The energy of the system can be lowered
by the emission of either an X-ray photon or a loosely bound outer shell Auger electron. The
specific energies of both X-ray photons and Auger electrons are highly dependent on the
electronic structure of the element from which they are emitted and thus, offer chemical
40
information. However, characteristic X-rays have higher energy and escape from the entire
volume of interaction (as illustrated in Figure 6.2).
Scanning electron microscopy, SEM
The instrument used in this study was a FEI Quanta ESEM 200. It was equipped with a Field
Emission Gun, providing excellent spatial resolution. The instrument was also equipped with
an Oxford Inca EDX (Energy Dispersive X-ray) system. The EDX system enables chemical
analysis through the detection and quantification of the characteristic X-rays emitted by a
sample. The accuracy of the EDX analysis was tested by performing a point analysis in the steel
below the oxide scale. By comparing the result with the theoretical composition of the steel the
precision of the analysis is confirmed. The instrument was operated at high vacuum, with an
acceleration voltage between 10 and 25 kV.
Broad ion beam, BIB
When a sample is covered with thick porous corrosion products, manually polished cross
sections generally are challenging to perform. This is due to the fact that polishing may pull out
parts of the corrosion layer and redeposit it somewhere else, or if water sensitive corrosion
products are present (like metal chlorides). Instead, ion-etched cross sections can be used, which
is considerably less destructive. To obtain wide ion etched cross sections Broad ion beam (BIB)
milling can be used. The BIB uses a broad argon ion beam for milling, which makes cross
sections in the range 500-1000µm possible. The BIB cross sections in this study were produced
using a LeicaTIC3X BIB instrument. The three ion guns were operated at 6.5 kV for a duration
of 7 hours. Prior to milling, a 0.5mm silicon wafer was glued on top of the sample with Loctite®
415. After hardening, the sample was cut using a low-speed saw and a consumable protective
screen was positioned on the sample with silver glue to render a smooth cross section (see
Figure 6.4).

41
Figure 6.4: SEM image overview of a BIB cross section with high magnification to the right.
Focused Ion Beam, FIB/SEM workstation
The BIB is a very coarse milling technique in the sense that it generates wide cross sections,
but there is limited possibilities to pinpoint features. When a certain area on a sample is
interesting, a technique called Focused Ion Beam (FIB) is used instead. A 10-50µm wide cross
section is then prepared by sputtering Ga ions through the oxide scale (see Figure 6.5).
A FEI Versa was used to study cross sections of selected features. The cross sections in the
study were prepared with a geometry that enabled SEM/EDX analysis. Since the ion beam has
an incidence angle of 52° relative to the sample surface, the samples were tilted 7° in order to
achieve a 45° cross section relative to the sample surface. The sample was then transferred to
the FEI Quanta ESEM 200 where a 45° pre-tilted sample holder was used to achieve a 90° angle
between the electron beam and the cross section (see the right image in Figure 6.5).

42
Figure 6.5: Schematic images of the FIB cross section preparation.
Transmission Electron Microscopy (TEM)
The transmission electron microscopy technique enables the investigation of microstructural
features through high resolution imaging. Contrary to an SEM in which the electrons are
scattered back by the sample, in a TEM, most of the electrons pass the sample that must be very
thin (20-200 nm) and the accelerating voltage high, typically 200-300 kV. Lift-out samples
(from exposed samples) for TEM analysis has been performed in the FIB/SEM workstation.
All sample preparation and TEM analysis has been performed by Dr M. Sattari and A.
Persdotter.
In this study the TEM was operated in Scanning Transmission Electron Microscope (STEM)
mode, which was used for High Annular Dark Field (HAADF) and Bright Field (BF) imaging.
In the HAADF mode, it is possible to detect the variation in atomic number over a sample cross
section (the Z- contrast), where heavier elements appear brighter and comparatively lighter
elements attain a darker contrast. In the BF mode the weakening of the transmitted beam (by
its interaction with the sample) is imaged. Thick areas and areas with heavier elements appear
with a darker contrast. On the contrary, voids, due to less interaction with the beam, appear
bright.
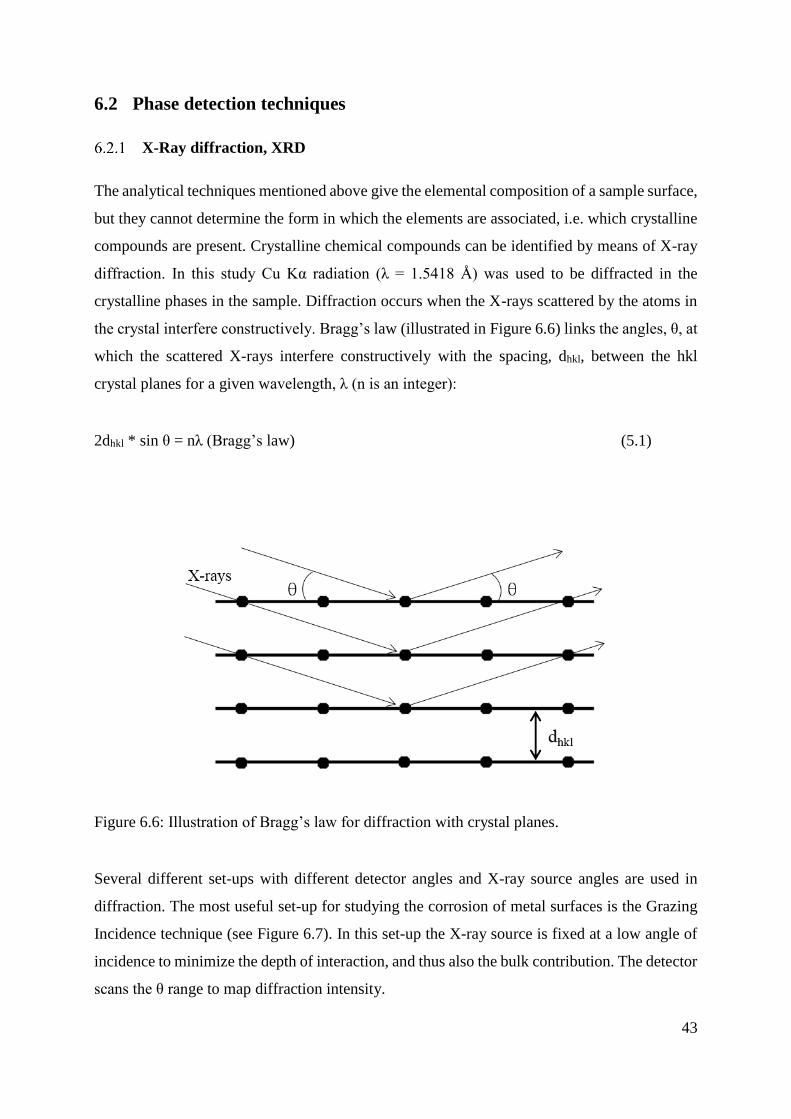
43
6.2 Phase detection techniques
X-Ray diffraction, XRD
The analytical techniques mentioned above give the elemental composition of a sample surface,
but they cannot determine the form in which the elements are associated, i.e. which crystalline
compounds are present. Crystalline chemical compounds can be identified by means of X-ray
diffraction. In this study Cu Kα radiation (λ = 1.5418 Å) was used to be diffracted in the
crystalline phases in the sample. Diffraction occurs when the X-rays scattered by the atoms in
the crystal interfere constructively. Bragg’s law (illustrated in Figure 6.6) links the angles, θ, at
which the scattered X-rays interfere constructively with the spacing, dhkl, between the hkl
crystal planes for a given wavelength, λ (n is an integer):
2dhkl * sin θ = nλ (Bragg’s law) (5.1)
Figure 6.6: Illustration of Bragg’s law for diffraction with crystal planes.
Several different set-ups with different detector angles and X-ray source angles are used in
diffraction. The most useful set-up for studying the corrosion of metal surfaces is the Grazing
Incidence technique (see Figure 6.7). In this set-up the X-ray source is fixed at a low angle of
incidence to minimize the depth of interaction, and thus also the bulk contribution. The detector
scans the θ range to map diffraction intensity.

44
Figure 6.7: Set-up for grazing incidence X-ray diffraction.
The diffraction data from the samples were compared to a database of known crystalline phases
to identify the compounds present on the sample. The requirements of the sample for
identification are that the corrosion products are crystalline and that they are included in the
database. As the data for one compound may overlap the data of another, it is crucial to know
which elements are present in the corrosion products. In this manner, the different analytical
techniques complement each other.
In this study a Siemens D5000 powder diffractometer, equipped with a Göbel mirror was used.
Analyses were performed in grazing incidence mode, with an angle of incidence of 0.3 – 1 °
for sample coupons from the lab exposures and 5 – 10 ° for samples from field exposures. The
measuring range was 10 ° < θ < 70 °.
6.3 Elemental analyzing of water soluble ions
Ion chromatography, IC
Ion chromatography is a technique that is used to determine the concentration of water soluble
ions in a solution. The solution is separated in an analytical column in which ions are separated
according to size and charge. The concentration of each ion is determined after the column
where conductivity measurements are made and compared with standards of known ion
concentrations (see Figure 6.8). To determine the amount of water soluble chlorides and sulfates
after exposure the samples were analyzed with a Dionex ICS-90 with an IonPac AS4A-SC
analytic column. The samples were leached in MilliQ water under ultrasonic agitation for 10 +
10 minutes. The flowrate was 2 mL/min and 1.8 mM Na2CO3/ 1.7 mM NaHCO3 was used as
eluent fluid.

45
Figure 6.8: Left schematic image of the column and right signal of detected ions [38].
6.4 Material loss measurement
Samples exposed for 1000 hours in the field study were analyzed to determine material loss.
Material loss is a measure of the thickness of the sample prior to and after exposure, i.e. it is a
quantification of the corrosion rate. The thickness of the sample rings were measured prior to
exposure at 8 evenly distributed positions around the ring with a micrometer screw. After
exposure, the samples were cut in two with a precision saw to obtain a cross section of each
sample ring. With a high resolution camera each sample ring was photographed. The images
were then digitalized using the Engauge™ software. The thickness of the sample rings were
measured prior to exposure on 8 evenly distributed positions around the ring with a micrometer
screw. After exposure, the samples were cut in two with a precision saw to obtain a cross section
of each sample ring. In order to measure the material losses, each sample ring was photographed
with a high-resolution camera. The images were then digitalized using the Engauge™ software.
The sample thickness was measured at approximately 400 individual positions (see Figure 6.9).
Thus, enabling a more realistic evaluation of the material loss with superior accuracy compared
to the previously used method in which 8 positions around the sample ring was measured with
a micrometer screw.

46
Figure 6.9: A section of the digitized photo of the exposed corrosion probe sample ring cross
section.

47
7 Results and Discussion
7.1 Laboratory exposures simulating waterwall conditions
In this part of the thesis, the laboratory results will be discussed with the aim of increasing the
understanding of waterwall corrosion. The first section will discuss the corrosive effect of pure
chloride salts on Fe-2.25Cr-1Mo (T22) (composition is given in Table 1) as well as compare
the effect of alkali chlorides with the effect of heavy metal chlorides. This is of importance
since both varieties are commonly detected in waterwall deposits, and it is not completely
understood which of these species that are the main contributor to the corrosion.
Exposures in presence of pure chlorides
In order to determine the corrosive effect of chloride-containing salts towards T22 at 400 °C, it
is first important to investigate the T22 alloy in the absence of salt. As reference, samples
exposed without salt were used for comparison. The mass gain of the reference can be seen in
Figure 7.1.
Figure 7.1: Mass change of Fe-2.25Cr-1Mo in the presence of chlorides at 400 °C with 20 %
H2O.

48
The plan view and cross section are displayed in Figure 7.2. The surface morphology is
homogeneous where an even smooth oxide with whiskers covers the surface. The XRD analysis
of the surface in Table 6 detected M3O4, Fe3O4 and Fe. The detection of the substrate (as Fe),
indicates that the oxide is relatively thin.
Crystalline phases detected with XRD analysis of Fe-2.25Cr-1Mo exposed 24 hours
with chloride salts with 20 % H2O at 400 °C.
The cross section in Figure 7.2 and the TEM analysis in Figure 7.19 shows that the scale is thin
(approximately 1 µm), well adherent to the steel and can be divided into three parts as follows:
from the bottom up (Fe,Cr)3O4, Fe3O4 with an outer Fe2O3. Additional growth of the oxide
occurs by the formation of Fe2+ at the steel/oxide interface see reaction (7.1), simultaneously
oxygen is reduced at the oxide/gas interface see reaction (7.2). The outward growing part of the
oxide is formed by the outwards diffusion of Fe2+ and the inward part by the diffusion of O2-.
Fe(s) → Fe2+ + 2e- (7.1)
½O2(g) + 2e- → O2- (7.2)
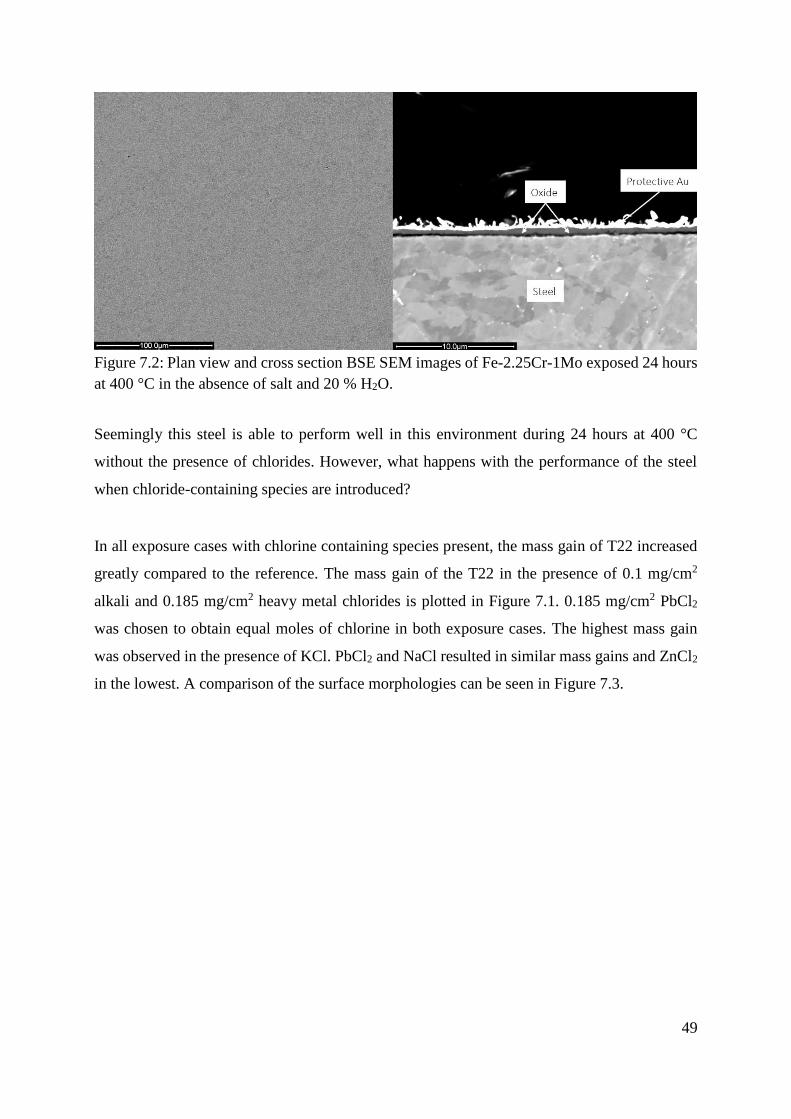
49
Figure 7.2: Plan view and cross section BSE SEM images of Fe-2.25Cr-1Mo exposed 24 hours
at 400 °C in the absence of salt and 20 % H2O.
Seemingly this steel is able to perform well in this environment during 24 hours at 400 °C
without the presence of chlorides. However, what happens with the performance of the steel
when chloride-containing species are introduced?
In all exposure cases with chlorine containing species present, the mass gain of T22 increased
greatly compared to the reference. The mass gain of the T22 in the presence of 0.1 mg/cm2
alkali and 0.185 mg/cm2 heavy metal chlorides is plotted in Figure 7.1. 0.185 mg/cm2 PbCl2
was chosen to obtain equal moles of chlorine in both exposure cases. The highest mass gain
was observed in the presence of KCl. PbCl2 and NaCl resulted in similar mass gains and ZnCl2
in the lowest. A comparison of the surface morphologies can be seen in Figure 7.3.

50
Figure 7.3: Plan view BSE SEM image of Fe-2.25Cr-1Mo exposed 24 hours at 400 °C and 20
% H2O in the presence of a) KCl, b) NaCl, c) ZnCl2 and d) PbCl2.
Compared to the reference sample the morphology is considerably rougher in the presence of
KCl with some sporadically spread areas of smooth oxide (see Figure 7.3 a)). KCl particles
overgrown with oxide are visible in the image (an image of an unexposed sample with applied
KCl can be seen in Figure 4 in paper II). The reason for the high oxidation rate of the KCl
coated T22 has been reported by Folkeson et al. [78] to be due to the formation of a liquid thin
film of the system KCl/FeCl2 at 355°C, (see Figure 4.13), which increases the diffusion of ions
over the surface. It has also been proposed that FeCl2 is located at oxide grain boundaries
thereby facilitating the transport of ions through the scale suggested by Jonsson et al. [77]. The
reaction path where FeCl2 is formed is suggested to be the following. KCl is assumed to
decompose according to reaction (7.3).

51
2KCl(s) + H2O(g) + ½O2(g) + 2e- → 2KOH(ads) + 2Cl-(ads) (7.3)
Simultaneously, iron is oxidized at the oxide/steel interface according to reaction (7.4).
Fe(s) → Fe2+ + 2e- (7.4)
The sum reaction thus becomes:
2KCl(s) + H2O(g) + ½O2(g) + Fe(s) → 2KOH(ads) + FeCl2(s) (7.5)
Since FeCl2 is thermodynamically unstable at the oxide scale/atmosphere interface it readily
decomposes according to reaction (7.6). This can result in the formation of porous poorly
protective Fe2O3 on the surface.
2FeCl2(s) + ½O2(g) + 2H2O(g) → Fe2O3(s) + 4HCl(g) (7.6)
ΔG= -209 kJ at 400 °C [66] calculated with data from Landolt.
It could be argued that reaction (7.7) competes with reaction (7.6) in the formation of Fe2O3(s),
however, Cl- has a lower charge than O2- which is suggested to increase the mobility of Cl-
inwards along the oxide grain boundaries.
2Fe(s) + 3
2O2(g) → Fe2O3(s) (7.7)
ΔG= -641.4 kJ at 400 °C [66] calculated with data from Barin.
The severe corrosion attack which was observed in the presence of KCl, may be attributed to
the presence of iron chloride. Either at the steel/oxide interface, where the scale adhesion can
be affected in a detrimental way, or in the oxide grain boundaries, where the presence of
chlorine is expected to increase the diffusion rate of ions. Consequently, resulting in a thick
scale and material wastage.
The attack in the presence of NaCl is similar to the presence of KCl on Fe-2.25Cr-1Mo, which
results in rough oxides and chloride particles partially overgrown with oxide, as is illustrated in

52
Figure 7.3. There is also a eutectic composition in the NaCl/FeCl2 system with the formation
of a liquid film at 375 °C. This causes NaCl to spread away from the chloride particles and
induces a widespread attack all over the surface. Compared to KCl, more unreacted salt particles
remain on the surface in the case of NaCl, which can be seen as dark grey structures in Figure
7.3. The comparatively greater stability of NaCl is also indicated by the IC analysis in Figure
7.4. As shown, more Cl- remains on the surface in the case of NaCl compared to KCl (vapor
pressures of KCl(s) and NaCl(s) has been calculated in paper I). Furthermore, the HCl
equilibrium vapor pressure is higher in reaction (7.8) than in reaction (7.9), which is part of the
reason why the NaCl particles is relatively unaffected after exposure compared to the KCl
particles. Another factor that may explain the higher stability of NaCl than KCl, is the difference
in eutectic temperature for the systems KCl/FeCl2 and NaCl/FeCl2 which is 355 °C and 375 °C
respectively. Both of these factors may explain the comparatively higher stability of NaCl.
KCl(s) + H2O(g) ↔ KOH(l) + HCl(g) (7.8)
ΔG= +118 kJ, p(HCl) = 2.8*10-10 bar at 400°C [66] calculated with data from Barin.
NaCl(s) + H2O(g) ↔ NaOH(l) + HCl(g) (7.9)
ΔG= +138 kJ ,p(HCl) = 8.6*10-12 bar at 400°C [66] calculated with data from Barin.
Figure 7.4: IC results of remaining Cl- on Fe-2.25Cr-1Mo after 24 hours in the presence of KCl,
NaCl or ZnCl2 at 400 °C (PbCl2 not analyzed).

53
The corrosion attack in the presence of ZnCl2 and PbCl2 is similar in the sense that no
widespread attack all over the surface is detected as in the presence of KCl and NaCl. Instead,
the thickest part of the oxide scale is located underneath or in the vicinity of the original position
of the chlorides prior to exposure. This is clearly seen in Figure 7.3 c) where an interface
between the bright Zn-rich area and the darker Zn deficient is visible. The reason for the local
corrosion can be attributed to the fast reaction of ZnCl2 into ZnO and ZnFe2O4 according to
reaction 7.10 and 7.11.
ZnCl2(s) + H2O(g) ↔ ZnO(s) + 2HCl(g) (7.10)
ΔG= +47 kJ, p(HCl) = 9.7*10-3 bar at 400 °C [66] calculated with data from Landolt.
ZnO(s) + Fe2O3(s) ↔ ZnFe2O4(s) (7.11)
ΔG= -20 kJ, at 400°C[66] calculated with data from Landolt.
In addition to the reactions above, the ZnCl2 has a high vapor pressure at 400 °C (see reaction
7.12). Because of these reactions, the time of duration on the steel surface for ZnCl2 compared
to the alkali chlorides is substantially shorter. Accordingly, ZnCl2 is not detected in the XRD
analysis in Table 6 and low amounts of Cl- are detected with IC in Figure 7.4. This might be
the reason that the lowest mass gain is detected in the presence of ZnCl2. Large amounts of
chlorine leaves the sample during the early stages of exposure and thus do not influence the
corrosion rate. Furthermore, ZnCl2 is the only chloride that has a melting temperature below
the exposure temperature. However, no signs of molten phases were detected after exposure,
possibly due to the fast transformation of ZnCl2 into ZnO. With larger amounts of salt, melt
formation might be more prevalent, as reported by [47].
ZnCl2(s) → ZnCl2(g) (7.12)
peq(ZnCl2) = 9.78*10-2 bar , at 400 °C [76]
Similarly the PbCl2 in Figure 7.3 d) has reacted into PbO, which is seen as the bright structures
in the image. No diffraction peaks from PbCl2 can be detected with XRD in Table 6. The
decomposition and evaporation occurs according to reactions 7.13 and 7.14. The vapor pressure
is lower compared to ZnCl2 which means that more chlorine is present for a longer duration.

54
PbCl2(s) → PbCl2(g) (7.13)
p(PbCl2) = 5.7*10-6 bar [76]
The ΔG values of the decomposition reactions of KCl, NaCl and PbCl2 are in the same range,
however, the partial pressure of HCl is orders of magnitude higher in reaction 7.14. This means
that the reaction into PbO is more likely, especially in a system with gas flow. The formed HCl
is transported away from the sample, thus the reaction is shifted to the right, which could be the
reason that KCl and NaCl are detected with XRD after exposure and PbCl2 is not.
PbCl2(s) + H2O(g) ↔ PbO(s) + 2HCl(g) (7.14)
ΔG= +120 kJ [66] calculated with data from Barin,
peq(HCl) = 1.5*10-5 bar at 400 °C [76]
As mentioned earlier, there exists an eutectic composition in the KCl/FeCl2 and NaCl/FeCl2
system with melting points below the exposure temperature. In the PbCl2/FeCl2 system, the
eutectic composition has a melting point above 400 °C, which could explain why widespread
attacks are detected in the presence of alkali chlorides, while the PbCl2 remains in its original
position, where it induces local corrosion. This is clearly seen in Figure 7.5, where large
amounts of FeCl2 is located at the steel/scale interface.
By comparing the surface morphology of a sample, it is possible to get an indication of the
corrosion attack. However, by observing cross sections of the exposed samples, not only can
the oxide scale thickness be measured, but also the porosity and scale adhesion is seen.
The widespread nature of the attack in the presence of KCl is clearly shown in Figure 7.5 a). In
the figure, a thick layered oxide with poor adhesion has formed throughout the KCl exposed
sample. In contrast to the widespread attack in the presence of KCl, the localized attack of PbCl2
can be seen in image c) where a layered oxide structure is located in correlation with the original
position of the PbCl2. The dark spots, visible at the interface between the steel and the oxide,
are metal chlorides. EDX analysis of this area is shown in Figure 7.6, where it is evident that
the presence of metal chloride has caused poor adhesion, which may have resulted in the thick
layered oxide structure.

55
Figure 7.5: Cross sections of Fe-2.25Cr-1Mo exposed for 24 hours with 20 % H2O at 400 °C a)
KCl, b) NaCl, c) PbCl2 and d) ZnCl2.

56
Figure 7.6: Cross section SEM/EDX maps of Fe-2.25Cr-1Mo exposed for 24 hours at 400 °C,
20 % H2O(g) in the presence of PbCl2.
In the presence of ZnCl2, the lowest mass gain was detected, which is in agreement with the
cross section in Figure 7.5 d), where the thinnest scale is observed. As mentioned above, this
can be attributed to the fast decomposition and evaporation of the chloride, which might be the
reason for the relative mild attack.
To summarize, it can be concluded that the most severe corrosion attack was observed in the
presence of KCl and not in the presence of ZnCl2, which is supposed to be molten. This indicates
that the presence of a bulk melt is not a requirement for high corrosion rates. However ZnCl2
readily reacts into ZnO, which means that a molten state may perhaps only be present during
the initial stages of exposure. The next section will investigate the influence on corrosion in the
presence of a low melting mixture of NaCl/ZnCl2 or KCl/ZnCl2 with melt temperatures far
below the exposure temperature. Will these mixtures induce a more severe attack than KCl? It
should be noted that all the exposures presented below were performed in 40 % H2O(g).

57
Exposure in the presence of mixed chlorides
Figure 7.7: Mass change of Fe-2.25Cr-1Mo in the presence of pure chlorides and mixtures at
400 °C with 40 % H2O.
A mixture of the salts (KCl/ZnCl2 and NaCl/ZnCl2) substantially lowers the melting
temperature of the salt mixture compared to the melting point of each individual salts (250 °C
and 260 °C respectively). If the melting temperature is directly related to the corrosion rate, the
samples coated with the salt mixtures should exhibit the highest corrosion rates. However, this
is not the case. The sample exposed in the presence of NaCl/ZnCl2 resulted in a mass gain,
which is similar to pure ZnCl2 (see Figure 7.7). The mass gain with KCl/ZnCl2 is slightly higher,
almost equal to NaCl and the greatest increase was again observed in the exposure with pure
KCl. The exposure temperature is above the melt temperature for both KCl/ZnCl2 and
NaCl/ZnCl2 as well as ZnCl2. Despite this fact there is no profound difference between the
mixtures and the individual salts regarding mass gain. The melt temperature of the
salts/mixtures seems to be less detrimental to the oxidation rate than the characteristics of the
individual alkali chlorides.
The T22 in the presence of NaCl/ZnCl2 and KCl/ZnCl2 behaves similar, in that the morphology
is altered compared to the samples coated with pure salts. With pure NaCl, the crystals remain
relatively intact on the surface of the sample, whereas, when mixed with ZnCl2 no intact NaCl
crystals are left intact after exposure, instead, Zn, Na, O and Cl containing nodules have formed
on the surface (see Figure 7.8 a)). The plan view in the presence of KCl/ZnCl2 is visible in
Figure 7.8 b). Similar to the NaCl/ZnCl2 case, nodules are scattered over the surface. The bright
regions are Zn- rich with K and Cl in the range of 7-10 atomic %, which could indicate the
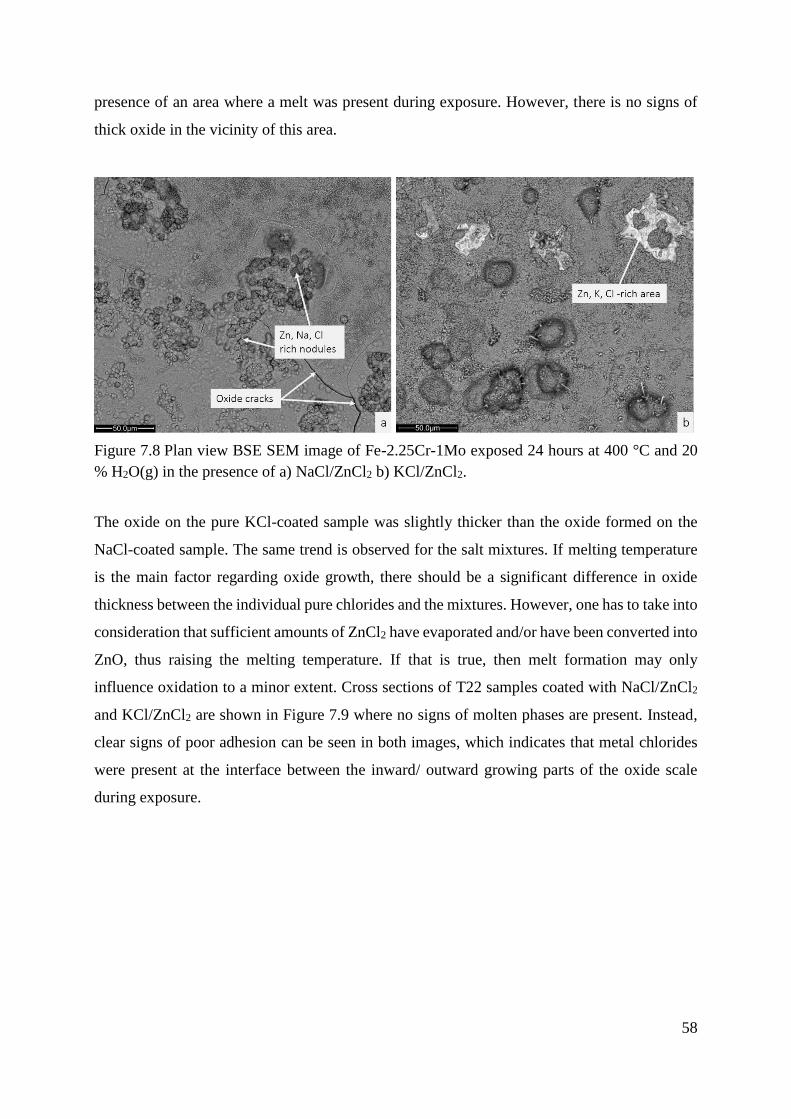
58
presence of an area where a melt was present during exposure. However, there is no signs of
thick oxide in the vicinity of this area.
Figure 7.8 Plan view BSE SEM image of Fe-2.25Cr-1Mo exposed 24 hours at 400 °C and 20
% H2O(g) in the presence of a) NaCl/ZnCl2 b) KCl/ZnCl2.
The oxide on the pure KCl-coated sample was slightly thicker than the oxide formed on the
NaCl-coated sample. The same trend is observed for the salt mixtures. If melting temperature
is the main factor regarding oxide growth, there should be a significant difference in oxide
thickness between the individual pure chlorides and the mixtures. However, one has to take into
consideration that sufficient amounts of ZnCl2 have evaporated and/or have been converted into
ZnO, thus raising the melting temperature. If that is true, then melt formation may only
influence oxidation to a minor extent. Cross sections of T22 samples coated with NaCl/ZnCl2
and KCl/ZnCl2 are shown in Figure 7.9 where no signs of molten phases are present. Instead,
clear signs of poor adhesion can be seen in both images, which indicates that metal chlorides
were present at the interface between the inward/ outward growing parts of the oxide scale
during exposure.

59
Figure 7.9: Cross section SEM/EDX maps of T22 exposed for 24 hours at 400 °C and 40 %
H2O(g) in the presence of a) NaCl/ZnCl2 and b) KCl/ZnCl2.

60
Figure 7.10: Cross section SEM of T22 exposed for 24 hours at 400 °C and 40 % H2O(g) in
the presence of a) NaCl/ZnCl2 and b) KCl/ZnCl2.
Both salt mixtures investigated severe spallation (more clearly seen in Figure 7.10), which
explains why less Cl- is detected in the IC analysis than pure alkali chlorides (see Table 7). Cl
is also lost due to the decomposition and evaporation of ZnCl2 see reactions 7.10 and 7.12.

61
Remaining Cl- on T22 after 24 hours in the presence of the different salts at 400 °C
and 40 % H2O(g) analyzed with IC.
Exposures in the presence of HCl(g) and KCl-HCl(g)
In order to more closely investigate the role of chlorine in the corrosion attack, the simultaneous
presence of KCl and HCl(g) were investigated.
The T22 was exposed to KCl, HCl(g) and KCl-HCl(g), both in a tube furnace and in a TG. As
can be seen in the gravimetric analysis in Figure 7.11, the introduction of HCl(g) resulted in a
doubling of the mass gain compared to the reference.
Figure 7.11: Mass change of T22 in the presence of 500vppm HCl and KCl at 400⁰C with 20
% H2O.
In comparison with the exposed reference samples, there is no profound difference in surface
morphology (compare Figure 7.2 and the left-hand image in Figure 7.12). In images with higher

62
magnification of both the reference sample and in the presence of HCl(g), oxide
blades/whiskers appear all across the surface. This would indicate a top layer in the oxide scale
consisting of Fe2O3, since this oxide is known to form these structures. On some samples in the
presence of HCl(g) however, two different areas can be distinguished. Where one area has a
similar oxide thickness as the reference sample. Whereas the other area is roughly 3 times
thicker, which may indicate the presence of an incubation time.
Figure 7.12 Plan view and cross section BSE SEM images of Fe-2.25Cr-1Mo exposed 24 hours
at 400 °C in the presence of 500 vppm HCl(g) and 20 % H2O(g) .
With the addition of HCl(g), the oxide is similar to the reference sample consisting of an
outward and inward growing part, however the thicker areas, are thicker by a factor of 3.
Interestingly, the scale is more or less devoid of chlorine, which can be seen in the Cl map in
the lower right-hand corner in Figure 7.12. Although no Cl was detected with EDX in the
marked area, it might be present at some other position. Moreover, the minor amounts that were
present during exposure may have either evaporated or may have been under the detection limit
of the EDX. Since the introduction of HCl(g) resulted in a doubling of the mass gain, Cl has
influenced the oxidation kinetics in some way. If the entire sample is leached and analyzed,
minor Cl concentrations can be detected with IC (see Figure 7.13).

63
Figure 7.13: IC results of remaining Cl- on T22 after 24 hours in the presence of HCl, KCl and
KCl-HCl at 400 °C with 20 % H2O.
In order to obtain more information about the oxidation kinetics, exposures in a thermo
gravimetric in-situ system were performed. Mass gain recorded in-situ provides more detailed
information about the reaction kinetics during exposure and not just one data point as is the
case with samples exposed in a tube furnace. As can be seen in Figure 7.14, both the reference
and the HCl(g) exposures exhibit low mass gains with parabolic behavior. Oxidation behavior
in the presence of KCl is rather different from the reference and HCl(g) exposures. The mass
gain curve exhibits several bumps during the exposure. This indicates cracking of the oxide,
thus revealing the underlying steel which would result in a short period of fast oxidation until
a diffusion-controlled regime is once again established. Resulting once again in an outward and
inward growing part of the scale.

64
When KCl and HCl(g) are present simultaneously, the oxidation is altered dramatically as is
shown in Figure 7.14. During the first 2 hours, the mass gain was extremely rapid, but after this
point it levelled off.
Figure 7.14: Mass change of T22 for the different exposure cases (as denoted in the image) at
400 °C with 20 % H2O.
The difference between the KCl and KCl-HCl(g) exposed samples in the early stages of
exposure is shown in Figure 7.15, where the exposures were terminated after 1 hour. In the KCl
exposure, oxidation is initiated between the KCl particles and around the edges of the particles
(see Figure 7.15 a)). On the contrary, in the case of KCl-HCl(g) exposure, (see Figure 7.15 b))
the oxidation was much more localized around KCl particles. The plan view comparison does
not explain the difference in mass gain during the early stages, however, by comparing the cross
sections in Figure 7.15 it becomes more evident. Figure 7.15 c) shows the KCl cross section
with a relatively thin uniform oxide. Figure 7.15 d) shows the cross section of KCl-HCl(g),
where the square highlights a region in which a thick oxide has formed around a KCl particle.
In the Cl EDX map, Cl is observed as a continuous layer underneath the oxide scale.
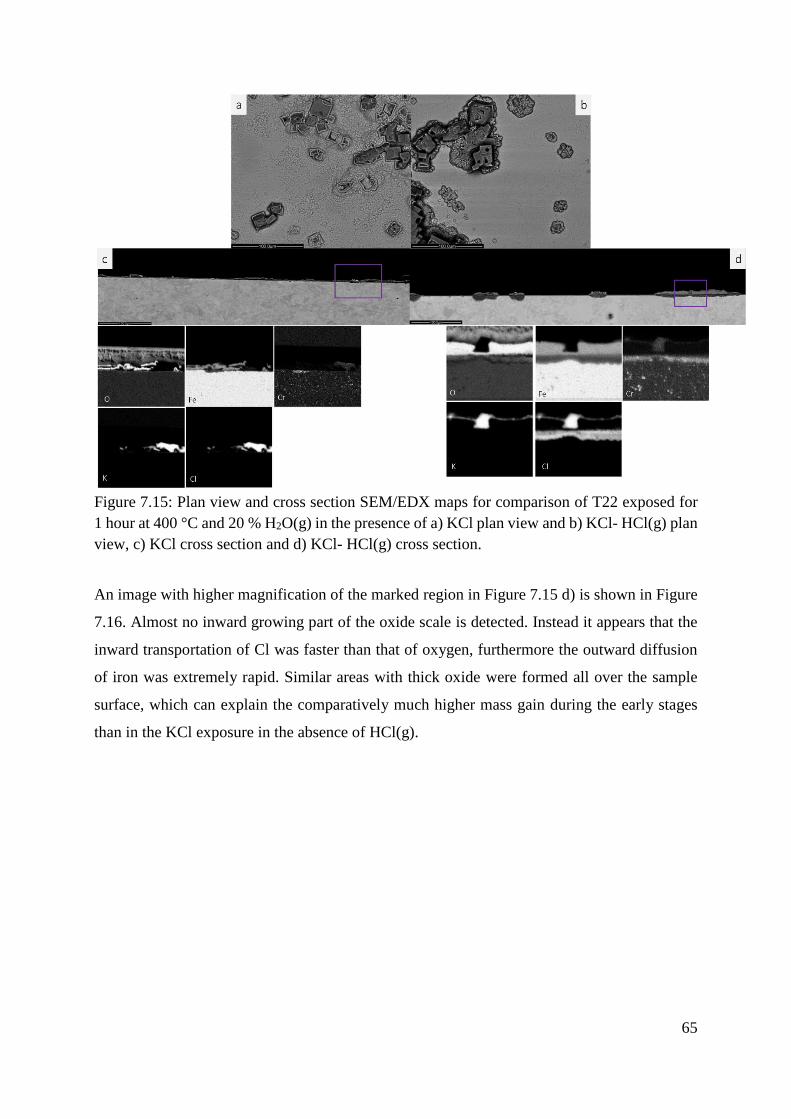
65
Figure 7.15: Plan view and cross section SEM/EDX maps for comparison of T22 exposed for
1 hour at 400 °C and 20 % H2O(g) in the presence of a) KCl plan view and b) KCl- HCl(g) plan
view, c) KCl cross section and d) KCl- HCl(g) cross section.
An image with higher magnification of the marked region in Figure 7.15 d) is shown in Figure
7.16. Almost no inward growing part of the oxide scale is detected. Instead it appears that the
inward transportation of Cl was faster than that of oxygen, furthermore the outward diffusion
of iron was extremely rapid. Similar areas with thick oxide were formed all over the sample
surface, which can explain the comparatively much higher mass gain during the early stages
than in the KCl exposure in the absence of HCl(g).

66
Figure 7.16: High magnification cross section SEM image of the marked region in Figure 7.14
d).
After 24 hours of exposure, a notable difference between KCl samples and KCl- HCl(g)
samples can be seen in Figure 7.17 a) and b). It appears that the corrosion attack is widespread
all over the surface in the presence of KCl. The attack on the KCl- HCl(g) sample is much more
localized to the vicinity of the KCl particles. Another difference is that the KCl particles in the
presence of HCl(g) appear to be less consumed after exposure than KCl in the absence of
HCl(g).

67
Figure 7.17: Plan view BSE SEM image of Fe-2.25Cr-1Mo exposed 24 hours at 400 °C and 20
% H2O(g) in the presence of a) KCl and b) KCl- HCl(g).
A BIB cross section of the KCl- HCl(g) exposed sample with EDX maps is shown in Figure
7.18. It can be clearly seen that the thickest scale is located close to the KCl particles. Cl is
detected in high concentrations at the steel/scale interface underneath the KCl and accordingly,
higher amounts of Cl- are detected with IC (see Figure 7.13). Between the KCl particles, the
oxide scale is much thinner and Cl is almost absent at the interface. However, the scale is thicker
than in the case with only HCl(g) see Figure 7.19. As shown in Figure 7.14 the rate of mass
gain is extremely rapid during the initial stages of exposure. The cross section analysis indicates
that most of the oxide growth takes place in the vicinity of the KCl, where fast oxidation kinetics
reign during the early phases of exposure. After some time, the oxide has reached a point where
the transport of ions is greatly reduced and slow oxidation kinetics reign during the remaining
period of exposure.

68
Figure 7.18: Cross section SEM/EDX maps of Fe-2.25Cr-1Mo exposed for 24 hours at 400°C
in the presence of KCl - HCl(g) and 20% H2O(g).
TEM microstructure analysis of T22
To further examine the microstructure of the formed oxides, TEM analysis has been performed
in collaboration with Dr M. Sattari and A Persdotter. In order to enable comparison between
samples with and without KCl, the area selected for analysis is located at a distance from KCl
particles. In this way it is possible to compare the influence of Cl regarding the microstructure
of the base oxide, denoted by region 2 in paper II. Both the reference and the HCl(g) samples
in Figure 7.19 a) and b) has formed a considerably thicker outward growing part of the scale
compared to the inward growing, which indicates that the outward diffusion of iron is faster
than the inward diffusion of oxygen. There is a large void density in the Fe3O4 layer on both
samples, however somewhat higher in the case with HCl(g). This might be the reason for the
higher oxidation rate, where the voids is an indicator of fast outward diffusion of Fe. In Figure
7.19 c) the poor scale adhesion and layered structure is seen on the sample in the presence of
KCl. Together with the gravimetric analysis in the TG, this is strong evidence of crack
formation and subsequent rehealing with a new scale. The TEM analysis showed that the
“rehealed” layers similarly consist of a three layered structure with hematite whiskers on top as
is marked in the image. The case with KCl – HCl(g) in Figure 7.19 d) shows that the ratio
between the outward/inward growing part is decreased. Thus, the simultaneous presence of KCl
and HCl(g) has resulted in a faster inward diffusion of oxygen compared to the reference and
the HCl(g) exposures. Similar to the HCl(g) case there are numerous voids in the Fe3O4 layer.

69
To further investigate the role of chlorine in the corrosion process it is important to perform
more time resolved exposures and detailed microstructural analysis. TEM can be useful in order
to map out where chlorine is present during the initiation of the corrosion process where rapid
mass gains are initiated. Also if chlorine induces a change of the oxide microstructure (thereby
increasing the grain boundary diffusion), but without clear signs of chlorine in the scale. As
was seen in the presence of HCl(g).
Figure 7.19: Cross section TEM images of Fe-2.25Cr-1Mo exposed for 24 hours at 400°C and
20% H2O(g) in the presence of a) Reference, b) HCl(g), c) KCl, d) KCl – HCl(g).

70
Concluding discussion of laboratory exposures
In all studied exposures in which chlorine-containing compounds were present, compared to
the reference, accelerated corrosion rates were observed. The increased corrosion rates may be
attributed to the formation of transition metal chlorides. These metal chlorides are located at
the steel/oxide scale interface. This will lead to a decrease in scale adhesion. Combined with
the fact that the oxide is growing, stresses are introduced which can explain the buckling and
cracking of the oxide that was observed in the presence of NaCl/ZnCl2 and KCl/ZnCl2 for
example. Transition metal chlorides can also increase the diffusion of ions along oxide grain
boundaries.
In the presence of KCl, a widespread corrosion attack was observed all over the sample surface.
This is attributed to the presence of a very thin liquid film of KCl/FeCl2, were KCl diffuses out
from the particles, which can explain the widespread nature of the attack [78]. The cross section
analysis indicated the presence of FeCl2 during exposure. It is believed that the reaction between
FeCl2 and adsorbed KOH in the outer parts of the scale have caused the poor scale adhesion
and the occurrence of large voids. A similar mechanism is thought to be at play in the presence
of NaCl.
In the presence of PbCl2, a more localized attack was observed. A thick and layered scale was
observed below the area where a PbCl2 particle was positioned prior to exposure. The localized
attack can be explained by the absence of a liquid film of PbCl2/FeCl2. Since the eutectic
temperature was above the exposure temperature, less diffusion of corrosive species occurred.
After 24 hours of exposure no PbCl2 was detected due to the conversion into PbO, which may
explain the high amounts of Cl that were present at the steel/oxide interface. In the reaction in
which PbO is formed, Cl is released. This Cl can (as the results indicate) diffuse through the
oxide to form metal chlorides. Since the nature of the attack was localized, increased amounts
of PbCl2 would probably result in a much more severe attack, than was observed under the
studied conditions.
The ZnCl2 should be in a molten state under the studied conditions, which is expected to initiate
accelerated corrosion. However, no signs of corrosion induced by a melt were observed. This
was probably due to the fact that large amounts of ZnCl2 were lost by evaporation and by
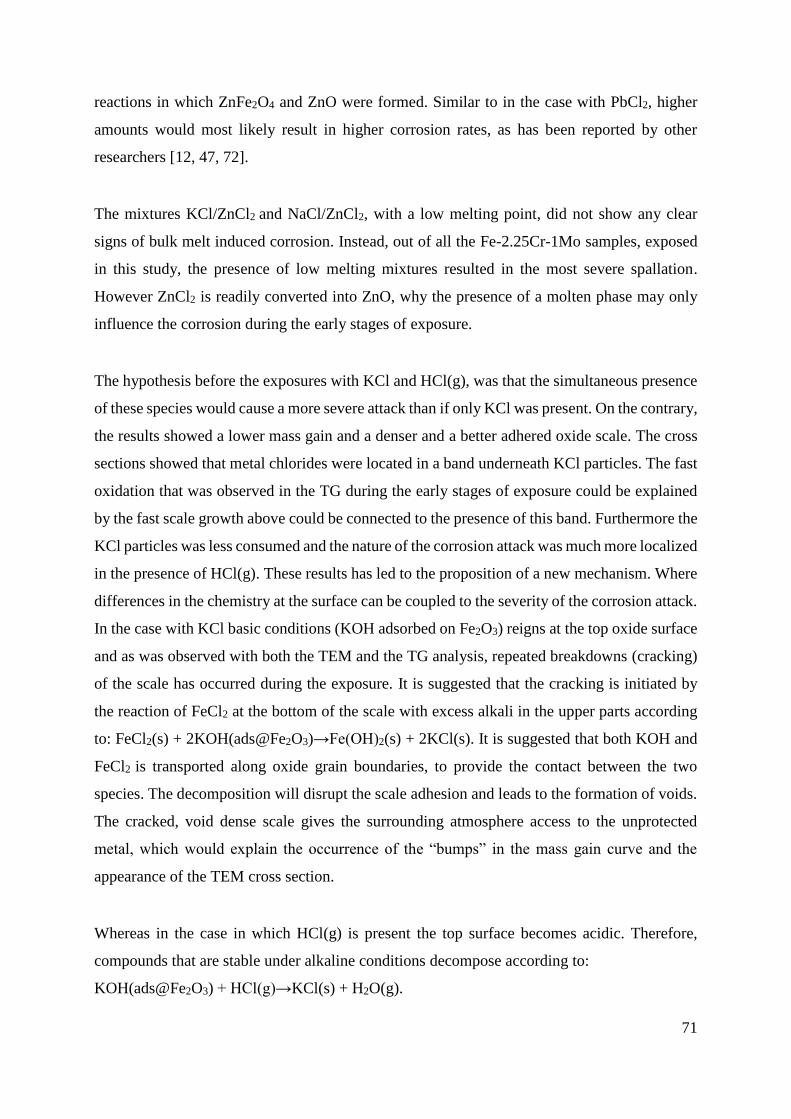
71
reactions in which ZnFe2O4 and ZnO were formed. Similar to in the case with PbCl2, higher
amounts would most likely result in higher corrosion rates, as has been reported by other
researchers [12, 47, 72].
The mixtures KCl/ZnCl2 and NaCl/ZnCl2, with a low melting point, did not show any clear
signs of bulk melt induced corrosion. Instead, out of all the Fe-2.25Cr-1Mo samples, exposed
in this study, the presence of low melting mixtures resulted in the most severe spallation.
However ZnCl2 is readily converted into ZnO, why the presence of a molten phase may only
influence the corrosion during the early stages of exposure.
The hypothesis before the exposures with KCl and HCl(g), was that the simultaneous presence
of these species would cause a more severe attack than if only KCl was present. On the contrary,
the results showed a lower mass gain and a denser and a better adhered oxide scale. The cross
sections showed that metal chlorides were located in a band underneath KCl particles. The fast
oxidation that was observed in the TG during the early stages of exposure could be explained
by the fast scale growth above could be connected to the presence of this band. Furthermore the
KCl particles was less consumed and the nature of the corrosion attack was much more localized
in the presence of HCl(g). These results has led to the proposition of a new mechanism. Where
differences in the chemistry at the surface can be coupled to the severity of the corrosion attack.
In the case with KCl basic conditions (KOH adsorbed on Fe2O3) reigns at the top oxide surface
and as was observed with both the TEM and the TG analysis, repeated breakdowns (cracking)
of the scale has occurred during the exposure. It is suggested that the cracking is initiated by
the reaction of FeCl2 at the bottom of the scale with excess alkali in the upper parts according
to: FeCl2(s) + 2KOH(ads@Fe2O3)→Fe(OH)2(s) + 2KCl(s). It is suggested that both KOH and
FeCl2 is transported along oxide grain boundaries, to provide the contact between the two
species. The decomposition will disrupt the scale adhesion and leads to the formation of voids.
The cracked, void dense scale gives the surrounding atmosphere access to the unprotected
metal, which would explain the occurrence of the “bumps” in the mass gain curve and the
appearance of the TEM cross section.
Whereas in the case in which HCl(g) is present the top surface becomes acidic. Therefore,
compounds that are stable under alkaline conditions decompose according to:
KOH(ads@Fe2O3) + HCl(g)→KCl(s) + H2O(g).

72
The large accumulation of FeCl2 beneath the scale in the KCl-HCl(g) case compared to the
KCl(only) exposure, is attributed to the HCl(g) which eliminates the alkaline chemistry at the
scale surface. Thus, the formation of cracks does not initiate fast decomposition of the sub-
scale FeCl2 as in the KCl(only) exposure.
The rapid deceleration of the mass gain in the KCl-HCl(g) exposure is attributed to the
electronically insulating properties of the FeCl2 layer. Thus, disturbing the O2 reduction at the
surface, which results in slower oxidation kinetics.
7.2 Superheater exposures
This section of the thesis investigates the corrosiveness of alkali chlorides towards superheater
materials, which operate at a higher material temperature and lower flue gas temperatures than
the waterwalls.
By switching the fuel from coal to biomass and waste, the result is a considerably more
corrosive environment inside the boiler. The flue gas from these fuels is relatively rich in
reactive alkali chlorides and typically, the sulfur dioxide concentration is low. As a
consequence, the deposit formed on superheater tubes tends to have substantial amounts of
corrosive alkali chlorides. Numerous studies have shown the corrosiveness of KCl and NaCl
towards super heater materials (mainly stainless steels) predominantly due to alkali chromate
formation. One way to mitigate this is by raising the SO2(g) concentration in the flue gas. SO2(g)
reacts with the alkali chlorides, which are converted into the corresponding and at the reigning
temperature range less corrosive, alkali sulfates. The availability of sulfur in the boiler can be
increased in several ways, for example by adding sewage sludge which contains sulfur in the
form of sulfates. Other ways can be to add sulfur in the form of granules, or by spraying
ammonium sulfate into the flue gas [81]. In the field study of the thesis, a novel technique was
used in which existing sulfur in the fuel was recirculated back into the furnace. The laboratory
part of this section investigates the corrosive effect of 304L in the presence of relatively large
amounts of KCl (1mg/cm2) and if the presence of SO2(g) can mitigate the corrosiveness of large
amounts of KCl.

73
In-situ sulfation of KCl in laboratory exposures
Previous studies on 304L with 1.35 µmol/cm2 KCl (referred to as small amounts of KCl) have
shown that the corrosion attack is initiated by chromate formation according to reaction 7.15.
Cr2O3(s) + 4KCl(s) + 2H2O(g) + 3 2⁄ O2(g) ⇄ 2 K2CrO4(s) + 4HCl(g) (7.15)
G = 147 kJ/mol, peq(HCl) = 1303×10-6 bar at 600°C [66] calculated with data from Barin.
The chromate formation leads to a chromium depletion that results in a breakdown of the Cr-
rich protective oxide that initially forms on stainless steel. As a result, a fast growing, iron-rich
oxide scale forms, (see Figure 7.19 a)).
Figure 7.19: BSE image of samples exposed 24 hours at 600 °C in 5 % O2(g) + 40 % H2O(g) +
1.35 μmol/cm2 KCl for a) without SO2(g) and b) with SO2(g).
The small amount of KCl applied onto the sample was consumed very fast, after 1 hour almost
40 % of the KCl had reacted and was more or less consumed after 24 hours of exposures.
Chromate formation releases chlorine as HCl(g), which is believed to cause accelerated
corrosion. However, there were no signs of chlorine in the cross-section, which indicates that
HCl(g) leaves the surface after formation in the chromate reaction.
Using sulfur-rich additives or co-combustion with sulfur-rich fuels are strategies to decrease
the corrosion rate in biomass and waste-fired boilers. The aim is to transform corrosive alkali

74
chlorides to less corrosive alkali sulfates. In contrast to KCl, potassium sulfate does not induce
an accelerated corrosion attack on 304L at 600 °C. Consequently, the reaction of K2SO4 with
the protective scale to form K2CrO4 is not thermodynamically favored under the present
experimental conditions. The corrosion rate of 304L in the presence KCl+SO2(g) is
considerably lower than the corresponding exposure in the absence of SO2, which is illustrated
in Figure 7.19 (compare images a) and b)),
By increasing the amount of KCl to 13.5 µmol/cm2 in the absence of SO2(g), the corrosion
morphology of the surface did not change significantly compared to samples exposed with
small amounts of salt. In both cases the general corrosion attack can be explained by the
formation of chromate, which destroyed the protective properties of the Cr-rich oxide.
However, samples exposed to large amounts KCl showed more than twice the amount of
chromate formation than samples exposed to small amounts. Consequently, the general
corrosion attack was more severe on samples with large amounts of KCl.
The presence of large amounts of KCl also accelerates the corrosion attack along steel grain
boundaries (see Figure 7.20 a)). This attack may be the result of increased chromate formation,
leading to more Cr-depleted steel grain boundaries. Another explanation could be that chlorine,
released as HCl(g) during the formation of chromate, induces the attack.

75
Figure 7.20: BSE image of samples exposed 24 hours at 600°C in 5 % O2 + 40 % H2O + 13.5
μmol/cm2 KCl for a) without SO2 and b) with SO2.
When 304L was exposed to large amounts of KCl + SO2(g), the general corrosion attack was
similar to the corresponding attack in the presence of small amounts of KCl + SO2(g). However,
the attack along the steel grain boundaries became much more severe (see Figure 7.20 b)). The
steel grain boundary attack could clearly be related to the presence of sulfides and chlorides.
Chlorination is expected to be the result of the formation of both K2CrO4 and K2SO4, resulting
in (locally) high levels of HCl(g). Since the gas flow is expected to be low beneath the porous
KCl particles, the HCl(g) concentrations should reach higher levels in these areas. This implies
that the steel grain boundary attack should be more severe in these areas, as indicated by the
results. Furthermore, since a large number of the attacked steel grain boundaries contain
sulfides, it is suggested that sulfidation of steel grain boundaries facilitates the steel grain
boundary attack. For this reason, both the chlorination and sulfidation of steel grain boundaries
are expected to accelerate this attack.

76
Concluding discussion of in-situ sulfation
The corrosiveness of different amounts of KCl on 304L in both the absence and presence of
SO2(g) at 600 °C was investigated. With small amounts of KCl (1.35 µm/cm2) the general
corrosion attack was initiated by the formation of chromate. This resulted in chromium
depletion of the protective oxide that initially forms on this stainless steel, and a fast growing
iron-rich oxide was formed. No steel grain boundary attack was observed.
With larger amounts of salt (13.5 µm/cm2 KCl), the formation of chromate increased and an
attack along the steel boundary was introduced. It is suggested that this attack is accelerated by
the increased presence of chlorine, released from the chromate formation.
The presence of 13.5 µm/cm2 KCl on 304L in a SO2(g) atmosphere resulted in the simultaneous
formation of K2SO4 and K2CrO4. However, the resulting general attack was considerably
slower. In contrast to the general corrosion attack, the presence of SO2 accelerated the steel
grain boundary attack.
Larger amounts of KCl in the presence of SO2(g) did not increase the general corrosion attack.
However, the corrosion attack along the steel grain boundaries was greatly increased. This
attack is suggested to be due to the formation of metal chlorides and metal sulfides in the steel
grain boundaries.
The effect of sulfur recirculation (field study)
To investigate the effect of sulfur recirculation, both 24 hour and 1000 hour exposures were
performed in order to study both the initial and the long-term corrosion. Reference exposures
without recirculation were also performed and the material temperature for both exposures was
set to 525°C. In the reference exposures (denoted REF), municipal and industrial waste was
used as fuel. The flue gas concentration of HCl and SO2 were 300 ppm and 90 ppm,
respectively. In the exposures in which sulfur recirculation (denoted S REC) was deployed,
both the HCl(g) and SO2(g) concentrations increased to 400 ppm and 270 ppm, respectively. In
both exposure conditions (REF and S REC), the three materials Sanicro 28, Inconel 625 (over-
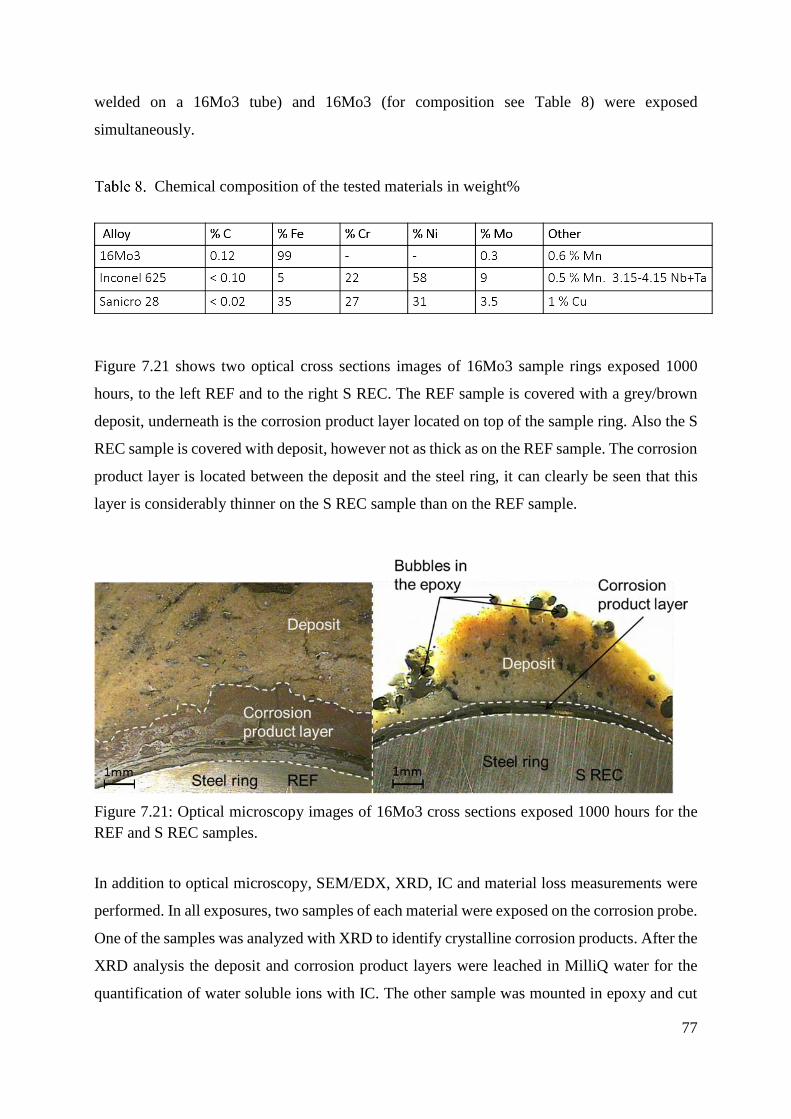
77
welded on a 16Mo3 tube) and 16Mo3 (for composition see Table 8) were exposed
simultaneously.
Chemical composition of the tested materials in weight%
Figure 7.21 shows two optical cross sections images of 16Mo3 sample rings exposed 1000
hours, to the left REF and to the right S REC. The REF sample is covered with a grey/brown
deposit, underneath is the corrosion product layer located on top of the sample ring. Also the S
REC sample is covered with deposit, however not as thick as on the REF sample. The corrosion
product layer is located between the deposit and the steel ring, it can clearly be seen that this
layer is considerably thinner on the S REC sample than on the REF sample.
Figure 7.21: Optical microscopy images of 16Mo3 cross sections exposed 1000 hours for the
REF and S REC samples.
In addition to optical microscopy, SEM/EDX, XRD, IC and material loss measurements were
performed. In all exposures, two samples of each material were exposed on the corrosion probe.
One of the samples was analyzed with XRD to identify crystalline corrosion products. After the
XRD analysis the deposit and corrosion product layers were leached in MilliQ water for the
quantification of water soluble ions with IC. The other sample was mounted in epoxy and cut

78
in two in order to obtain cross sections. One of the sample cross sections was used to analyze
the deposit, corrosion product layer and metal with SEM/EDX. The other cross section was
used to determine material loss.
7.2.3.1 24 hours exposure at 525 °C
The IC analysis showed that the deposit was dominated by sulfates on both the REF and the S
REC samples. However, a larger fraction of Cl- was detected on the REF samples than on the S
REC. It is, thus, evident that sulfur recirculation results in deposits with less Cl- (see Figure
7.22). Low concentrations of Fluoride (F-) were also detected, but did not seem to be involved
in the corrosion attack.
Figure 7.22: Ion chromatography analysis of deposit on 24 hour samples, presented as mole %.
On the 24 hour samples the XRD results coincides fairly well with the IC analysis above. For
the samples exposed with S REC no alkali chlorides were detected with XRD, whereas alkali
chlorides showed weak to medium intensity peaks in the REF exposure (see Table 9).
Consequently, the results clearly indicate that sulfur recirculation suppresses the amount of
alkali chlorides in the deposit.

79
Crystalline phases detected by XRD analysis of samples exposed 24 hours.
Figure 7.23 shows a BSE image of the REF 24 hour Sanicro 28 ring together with EDX maps
of that area. The figure shows that the deposit mainly consists of Na, K, Ca, O and S, most
likely as sulfates in various compositions, which is in agreement with the IC and XRD analyses.
The marked area in the Cl map marks where the highest concentration is located, this location
corresponds to an outward migration of Cr in the Cr map. Fe, Cr and Ni can be seen in scattered
locations above the steel surface and not as a coherent scale, which indicates the inability to
form a protective oxide scale during the exposure.
Figure 7.23: BSE image and EDX maps of the REF 24 hours Sanicro 28 cross section.
Figure 7.24 displays a BSE image of the S REC 24 hour Sanicro 28 ring together with EDX
maps of that area. With recirculated sulfur, it can be seen that the deposit has shifted from mixed
Na, K, and Ca sulfates, which were detected on the REF sample, towards relatively pure CaSO4.

80
Whereas the REF sample did not form a coherent protective oxide scale, the Cr map in Figure
7.24 indicates that Cr is located in a thin continuous scale together with Fe, Ni and O. This
behavior and appearance of an oxide scale is what usually constitutes protective properties
against corrosion. These findings support the theory which states that alkali chlorides can be
transformed into less corrosive alkali sulfates. IC, XRD and SEM/EDX analyses shows that
sulfur recirculation results in a less corrosive environment. The initial property of an oxide is
vital to the long term protection of an alloy. If a thick and porous oxide forms during the initial
stages of exposure, the oxide will fail to provide protection during later stages. If, instead, a
thin oxide with protective properties forms initially, its protective properties seems to last for
longer durations of exposure.
Figure 7.24: BSE image and EDX maps of the S REC 24 hours Sanicro 28 cross section.
7.2.3.2 1000 hours exposure at 525°C
The XRD results for the 1000 hour samples do not coincide well with the IC results (see Figure
7.25 and Table 10). The IC results indicate that the amount of Cl- decreases by roughly 50 %
with sulfur recirculation. However, the XRD analysis detected medium intensity peaks for
alkali chlorides in both the REF and S REC samples. Unfortunately, the Sanicro 28 REF sample
was damaged during sample preparation and no IC analysis was performed. It is, however,
relatively safe to assume that the deposit on the Sanicro 28 REF sample is similar in
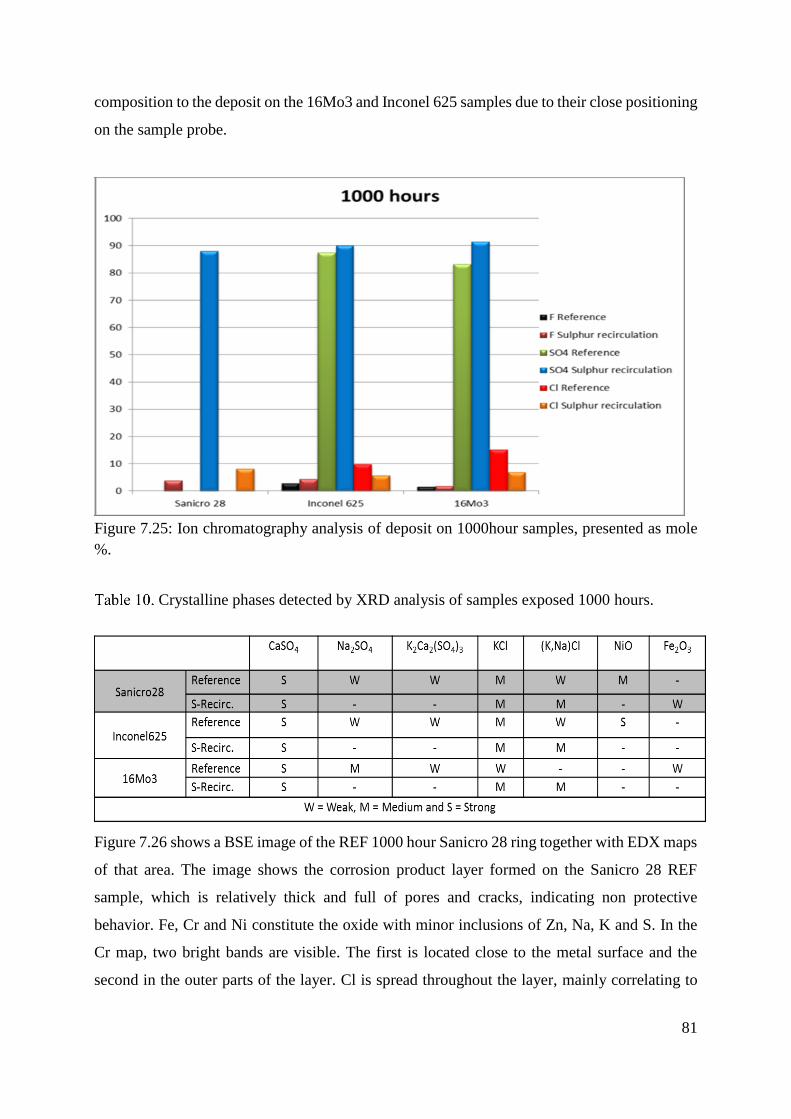
81
composition to the deposit on the 16Mo3 and Inconel 625 samples due to their close positioning
on the sample probe.
Figure 7.25: Ion chromatography analysis of deposit on 1000hour samples, presented as mole
%.
Crystalline phases detected by XRD analysis of samples exposed 1000 hours.
Figure 7.26 shows a BSE image of the REF 1000 hour Sanicro 28 ring together with EDX maps
of that area. The image shows the corrosion product layer formed on the Sanicro 28 REF
sample, which is relatively thick and full of pores and cracks, indicating non protective
behavior. Fe, Cr and Ni constitute the oxide with minor inclusions of Zn, Na, K and S. In the
Cr map, two bright bands are visible. The first is located close to the metal surface and the
second in the outer parts of the layer. Cl is spread throughout the layer, mainly correlating to

82
the Na map, indicating NaCl. Closer to the metal surface, the Cl map overlaps with the metals
originating from the steel, indicating the presence of metal chlorides, which could explain the
porous morphology and the thick corrosion product layer.
Figure 7.26: BSE image and EDX maps of the 525 °C REF 1000 hours Sanicro 28 cross section.
In Figure 7.27 a BSE image of the S REC 1000 hour Sanicro 28 ring together with EDX maps
of that area is shown. In the image, it is evident that the oxide thickness has decreased
dramatically with S REC from ~600 µm with REF to ~30 µm with S REC. In the EDX maps,
it is clear that the deposit consists of sulfates, mainly potassium sulfate. The Cl map is totally
dark, which indicates that most alkali chlorides have been transformed into alkali sulfates,
which is in agreement with the IC analysis in Figure 7.25, in that figure the amount of Cl-
decreased by approximately 50 % on the S REC sample. In the Cr map, a bright band is visible
above the steel surface, indicating that a Cr rich oxide has formed. This can again be coupled
to the initial properties of the Sanicro 28 S REC sample exposed for 24 hours, on which a thin
continuous oxide scale was present. The protective property of the oxide scale seems to be
sufficient as protection also after 1000 hours of exposure. The arrows mark a correlation
between S and Ni, indicating the occurrence of Ni2S3 on top of the oxide scale. The formation
of sulfide instead of an oxide or sulfide incorporated into an oxide on top of the steel surface
decreases the oxide´s ability to protect the steel from further oxidation. Sulfide formation can
also cause poor adhesion of the oxide scale to the steel. In other words, the presence of sulfides
is an indication that the SO2(g) levels were too high during the exposure.

83
Figure 7.27: BSE image and EDX maps of the S REC 525 °C 1000 hour Sanicro 28 cross
section.
The material loss measurement in Figure 7.28 shows the beneficial effect of sulphur
recirculation on corrosion. The Sanicro 28 sample exposed in the S REC exposure exhibited a
material loss approximately 85 % lower than the sample in the REF exposure.
Figure 7.28: Material loss measurements of 1000 hour sample.

84
Concluding discussion of superheater corrosion (laboratory and field)
The laboratory study showed that the corrosion attack on the 304L alloy at 600 °C is similar in
the presence of 0.1 mg/cm2 and 1 mg/cm2 KCl. By introducing SO2(g), it was possible to
satisfactorily mitigate the corrosion attack of 0.1 mg/cm2 KCl by the formation of less corrosive
K2SO4. The introduction of SO2(g) in the presence of 1 mg/cm2 KCl resulted in a reduction of
the general corrosion, but instead chlorination and sulfidation of the steel grain boundaries were
observed.
When the waste fired boiler in the study was operated with sulfur recirculation, the Sanicro28,
Inconel 625 and 16Mo3 all formed relatively thin and dense oxides after 24 and 1000 hours
compared with Ref samples. This was in agreement with both SEM and material loss
measurements. The Ref samples were covered with a thick deposit rich in corrosive alkali
chlorides. Sulfur recirculation substantially decreased the amount of alkali chlorides in the
deposit, which was seen with IC. A novel imaging technique was developed and used for
evaluating material loss on the samples exposed for 1000 hours. It proved to be a fast technique
that resulted in a more accurate estimation of the material wastage compared to the previously
used method, in which a micrometer screw was used.

85
8 Acknowledgements
First of all I would like to thank my supervisors Professor Lars-Gunnar Johansson, Professor
Jan-Erik Svensson, Jesper Liske Ph.D. and Torbjörn Jonsson Ph.D., for all their support and
interesting conversations.
Further, I would like to thank the High Temperature Corrosion Centre (HTC), the Consortium
for Material Technology regarding Thermal Energy processes (KME), Waste Refinery (WR),
Värmeforsk (VF), and the Swedish Energy Agency (STEM), as well as member companies, for
support and funding.
I also want to express my gratitude to my other colleagues, both those who have moved on and
present ones. In the corrosion group: Kristina Hellström, Josefin Hall, Niklas Israelsson, Jan
Grolig, Rakshith Sachitanand, Patrik Alnegren, Hannes Falk Windisch, Maria Nikumaa, Loli
Paz, Andrea Olivas, Christine Geers, Hamed Hooshyar, Niklas Folkeson, Sead Canovic, Mats
Halvarsson, Mohsen Esmaily, Mehrdad Shahabi, Carolina Pettersson, Linda Ingemarsson,
Johan Eklund, Julien Phother, Vedad Babic, Claudia Göbel, Nico Torino, Sebastian Sundkvist,
Valentina Cantatore. I also want to thank Sven Andersson at Götaverken Miljö for great
collaboration.
In addition, I also would like to thank Mohammad Sattari and Anders Kvist for Microscopy
support. Vratislav Langer is thanked for XRD support, Roger Sagdahl, Esa Väänänen and Erik
Brunius are thanked for technical support.
Finally, I would like to thank my family, my two children Stella and Thea, as well as my partner
Sofia for support with everything.

86
9 References
1. http://www.ipcc.ch/. 2016.
2. http://www.regeringen.se/regeringens-politik/energi/mal-och-visioner-for-energi/.
2016.
3. Jenkins, B.M., L.L. Baxter, and T.R. Miles, Combustion properties of biomass. Fuel
Processing Technology, 1998. 54(1-3): p. 17-46.
4. Miles, T.R., Baxter, L. L., Bryers, R. W., Jenkins, B. M. and Oden, L. L., Boiler deposits
from firing biomass fuels. Biomass & Bioenergy, 1996. 10(2-3): p. 125-138.
5. Nielsen, H.P., Frandsen, F. J., Dam-Johansen, K. and Baxter, L. L., The implications of
chlorine-associated corrosion on the operation of biomass-fired boilers. Progress in
Energy and Combustion Science, 2000. 26(3): p. 283-298.
6. Nielsen, H.P., et al., Deposition of potassium salts on heat transfer surfaces in straw-
fired boilers: a pilot-scale study. Fuel, 2000. 79(2): p. 131-139.
7. Jones, F., et al., The presence of zinc in Swedish waste fuels. Waste Management, 2013.
33(12): p. 2675-2679.
8. Bankiewicz, D., et al., Role of ZnCl2 in High-Temperature Corrosion in a Bench-Scale
Fluidized Bed Firing Simulated Waste Wood Pellets. Energy & Fuels, 2011. 25(8): p.
3476-3483.
9. Enestam, S., et al., Occurrence of Zinc and Lead in Aerosols and Deposits in the
Fluidized-Bed Combustion of Recovered Waste Wood. Part 1: Samples from Boilers.
Energy & Fuels, 2011. 25(4): p. 1396-1404.
10. Enestam, S., et al., Occurrence of Zinc and Lead in Aerosols and Deposits in the
Fluidized-Bed Combustion of Recovered Waste Wood. Part 2: Thermodynamic
Considerations. Energy & Fuels, 2011. 25(5): p. 1970-1977.
11. Vainikka, P., et al., High temperature corrosion of boiler waterwalls induced by
chlorides and bromides. Part 1: Occurrence of the corrosive ash forming elements in a
fluidised bed boiler co-firing solid recovered fuel. Fuel, 2011. 90(5): p. 2055-2063.
12. Schaal, E., et al., Effect of Zinc Chloride in Ash in Oxidation Kinetics of Ni-Based and
Fe-Based Alloys. Oxidation of Metals, 2016. 85(5): p. 547-563.
13. Nielsen, H.P., F.J. Frandsen, and K. Dam-Johansen, Lab-Scale Investigations of High-
Temperature Corrosion Phenomena in Straw-Fired Boilers. Energy & Fuels, 1999.
13(6): p. 1114-1121.
14. Spiegel, M., Salt melt induced corrosion of metallic materials in waste incineration
plants. Materials and Corrosion 1999. 50: p. 373-393.

87
15. Callister, W.D.J., Materials Science and Engineering - An Introduction. Fifth edition
ed. 2000, Salt Lake City: John Wiley & Sons, Inc.
16. Bhadeshia, H.K.D.H. and R.W.K. Honeycombe, Steels - Microstructure and Properties.
Third edition ed. 2006, Cambridge: Butterworth-Heinemann.
17. Honeycombe, R.W.K. and H.D.K.H. Bhadeshia, Steels: Microstructure and properties.
second ed, ed. E.S. Technology. 1995.
18. Kofstad, P., High Temperature Corrosion. 1988, London: Elsevier Applied Science.
19. Khanna, A.S., Introduction to High Temperature Oxidation and Corrosion. 2002, Ohio,
USA: ASM International. 325.
20. Birks, N. and H. Meier, Introduction to High Temperature Oxidation of Metals. 1983,
London: Edward Arnold (Publishers) Ltd.
21. Wagner, C., Beitrag zur Theorie des Anlaufvorgangs. Z. Physicalishe chemie, 1933.
B21: p. 25-41.
22. Asteman, H., Water Vapour Induced Active Oxidation of Stainless Steel, in Water
Vapour Induced Active Oxidation of Stainless Steel. 2002, Göteborg University:
Göteborg.
23. Asteman, H., et al., The Influence of Water Vapor on the Corrosion of Chromia-
Forming Steels. Materials Science Forum, 2001. 369-372: p. 277-286.
24. Asteman, H., et al., Indication of Cromium Oxide Hydroxide Evaporation During
Oxidation of 304L at 873K in the Presence of 10% Water Vapor. Oxidation of Metals,
1999. 52: p. 95-111.
25. Asteman, H., et al., Influence of Water Vapor and Flow Rate on the High-Temperature
Oxidation of 304L; Effect of Chromium Oxide Hydroxide Evaporation. Oxidation of
Metals, 2000. 54: p. 11 - 26.
26. Segerdahl, K., The Breakdown of the Protective Oxide on 11% Chromium Steel, in
Department of Environmental Inorganic Chemistry. 2003, Chalmers University of
Technology: Göteborg.
27. Segerdahl, K., J.-E. Svensson, and L.-G. Johansson, The high temperture oxidation of
11% chromium steel: Part I - Influence of pH2O. Materials and Corrosion, 2002. 53: p.
247-255.
28. Pettersson, C., The High Temperature Corrosion of Alloy Sanicro 28, in Department of
Chemical and Biological Engineering. 2006, Chalmers University of Technology:
Gothenburg.
29. Pettersson, C., L.G. Johansson, and J.-E. Svensson, The Influence of Small Amounts of
KCl(s) on Initial Stages of the Corrosion of Alloy Sanicro 28 at 600°C. Submitted to
Oxidation of Metals.
88
30. Pettersson, C., L.G. Johansson, and J.-E. Svensson, Corrosivity of KCl(g) at
Temperatures Above its Dew Point - Initial Stages of the High Temperature Corrosion
of Alloy Sanicro 28 at 600°C. Materials Science Forum, 2006. 522-523: p. 539-546.
31. Pettersson, C., et al., KCl-induced high temperature corrosion of the austenitic Fe-Cr-
Ni alloys 304L and Sanicro 28 at 600 degrees C. Corrosion Science, 2006. 48(6): p.
1368-1378.
32. Pettersson, J., Alkali Induced Corrosion of 304L, in Department of Chemical and
Biological Engineering. 2005, Chalmers University of Technology: Gothenburg.
33. Pettersson, J., et al., KCl induced corrosion of a 304-type austenitic stainless steel at
600 degrees C; The role of potassium. Oxidation of Metals, 2005. 64(1-2): p. 23-41.
34. Van Orman, J.A.a.K.L.C., Diffusion in Oxides, in Diffusion in Minerals and Melts.
Mineralogical Soc Amer: Chantilly.: p. p. 757-825.
35. Henderson, P.J., et al., In-situ Fireside Corrosion Testing of Advanced Boiler Materials
with Divers Fuels. Schriften des Forschungszentrums Juelich, Reihe
Energietechnik/Energy Technology, 2002. 21(Part 2, Materials for Advanced Powder
Engineering): p. 785-799.
36. Salmenoja, K., Field and Laboratory Studies on Chlorine-induced Superheater
Corrosion in Boilers Fired with Biofuels, in Faculty of Chemical Engineering. 2000,
Åbo Akademi: Turku.
37. Nielsen, H.P., The Implications of Chlorine-associted Corrosion on the Operation of
Biomass-fired Boilers. Progress in Energy and Combustion Science, 2000. 26: p. 283 -
298.
38. Karlsson, S., Reducing Alkali Chloride-Induced High Temperature Corrosion by
Sulphur Containing Additives. 2015, Chalmers university of technology.
39. Enestam, S., Corrosivity of hot flue gases in the fluidized bed combustion of recovered
waste wood. 2011, Åbo Akademi.
40. Alipour, Y., Furnace Wall Corrosion in a Wood-fired Boiler. 2015, KTH Royal Institute
Of Technology
41. Sorell, G., The role of chlorine in high temperature corrosion in waste-to- energy plants.
Materials at High Temperatures, 1997. 14(3): p. 207-220.
42. Krause, H.H., Fireside corrosion problems in refuse-fired boilers, in CORROSION/93.
1993, NACE International: Houston.
43. Yin, C., L.A. Rosendahl, and S.K. Kaer, Grate-firing of biomass for heat and power
production. Progress in Energy and Combustion Science, 2008. 34(6): p. 725-754.
44. Peña, J.A.P., Bubbling Fluidized Bed (BFB), When to use this technology? Industrial
Fluidization South Africa (IFSA) Foster Wheeler, Johannesburg, South Africa, 2011.

89
45. http://www.power-technology.com/projects/eskilstuna/images/img4.jpg. 2016.
46. Cheremisinoff, N.P., Handbook of solid waste management and waste minimization
technologies. 2003: Butterworth-Heinemann.
47. Bankiewicz, D., et al., Experimental studies of Zn and Pb induced high temperature
corrosion of two commercial boiler steels. Fuel Processing Technology, 2013. 105: p.
89-97.
48. Asteman, H. and M. Spiegel, Investigation of the HCl (g) attack on pre-oxidized pure
Fe, Cr, Ni and commercial 304 steel at 400 degrees C. Corrosion Science, 2007. 49(9):
p. 3626-3637.
49. Lee, S.Y. and M.J. McNallan, Inhibition of Oxidation of Iron in Environments
Containing Chlorine at 1100-K and 1200-K. Journal of the Electrochemical Society,
1990. 137(2): p. 472-479.
50. Lee, S.Y. and M.J. McNallan, Formation of Condensed Chlorides During Mixed
Oxidation Chlorination of Iron at 1000-K. Corrosion, 1991. 47(11): p. 868-874.
51. Lee, Y.Y. and M.J. McNallan, Ignition of Nickel in Environments Containing Oxygen
and Chlorine. Metallurgical Transactions a-Physical Metallurgy and Materials Science,
1987. 18(6): p. 1099-1107.
52. McNallan, M.J., et al., Accelleration of the High Temperature Oxidation of Metals by
Chlorine. High Temperature Corrosion, NACE, 1983: p. 316-321.
53. Stott, F.H. and C.Y. Shih, The influence of HCl on the oxidation of iron at elevated
temperatures. Materials and Corrosion-Werkstoffe Und Korrosion, 2000. 51(5): p. 277-
286.
54. Abels, J.-M. and H.-H. Strehblow, A Surface Analytical Approach to the High
Temperature Chlorination Behaviour of Inconel 600 at 700°C. Corrosion Science,
1997. 39(1): p. 115 - 132.
55. Bender, R. and M. Schutze, The role of alloying elements in commercial alloys for
corrosion resistance in oxidizing-chloridizing atmospheres Part II: Experimental
investigations. Materials and Corrosion-Werkstoffe Und Korrosion, 2003. 54(9): p.
652-686.
56. Grabke, H.J., E. Reese, and M. Spiegel, The Effects of Chlorides, Hydrogen-Chloride,
and Sulfur-Dioxide in the Oxidation of Steels Below Deposits. Corrosion Science, 1995.
37(7): p. 1023-1043.
57. Haanappel, V.A.C., et al., Corrosion Kinetics of Low-Alloy and High-Alloy Steels in
Chlorine-Containing Gas Atmospheres. Corrosion, 1992. 48(10): p. 812-821.
58. Kim, A.S. and M.J. McNallan, Mixed Oxidation of Iron Chromium-Alloys in Gases
Containing Oxygen and Chlorine at 900 to 1200-Degrees-K. Corrosion, 1990. 46(9): p.
746-755.

90
59. Liu, J.C. and M.J. McNallan, Effects of temperature variations on oxidation of iron-
20% chromium alloys at 1200 K in Ar-20% O-2-Cl-2 gas mixtures. Materials and
Corrosion-Werkstoffe Und Korrosion, 1999. 50(5): p. 253-260.
60. Sroda, S., et al., High temperature oxidation behaviour of boiler steels under simulated
combustion gases, in High Temperature Corrosion and Protection of Materials 6, Prt 1
and 2, Proceedings. 2004. p. 981-988.
61. Stott, F.H. and C.Y. Shih, High-temperature corrosion of iron-chromium alloys in
oxidizing-chloridizing conditions. Oxidation of Metals, 2000. 54(5-6): p. 425-443.
62. Sämann, N., M. Spiegel, and H.J. Grabke, Influence of surface preparation on the
corrosion of steels in simulated waste incineration environments, in High Temperature
Corrosion and Protection of Materials 5, Pts 1 and 2. 2001. p. 963-970.
63. Zahs, A., M. Spiegel, and H.J. Grabke, The influence of alloying elements on the
chlorine-induced high temperature corrosion of Fe-Cr alloys in oxidizing atmospheres.
Materials and Corrosion-Werkstoffe Und Korrosion, 1999. 50(10): p. 561-578.
64. Zahs, A., M. Spiegel, and H.J. Grabke, Chloridation and oxidation of iron, chromium,
nickel and their alloys in chloridizing and oxidizing atmospheres at 400-700 degrees C.
Corrosion Science, 2000. 42(6): p. 1093-1122.
65. Zheng, X.J. and R.A. Rapp, Chloridation-oxidation of nine commercial high-
temperature alloys at 800 degrees C. Oxidation of Metals, 1997. 48(5-6): p. 553-596.
66. Roine, A., HSC Chemistry 7. Outotec.
67. Ruh A, S.M., Thermodynamic and kinetic consideration on the corrosion of Fe, Ni and
Cr beneath a molten KCl-ZnCl2 mixture. Corrosion Science, 2006. 48(3): p. 679-695.
68. Pettersson, J., Alkali Induced High Temperature Corrosion of Stainless Steel -
Experiences from Laboratory and Field, in Department of Chemical and Biological
Engineering. 2008, Chalmers University of Technology: Gothenburg. p. 84.
69. Shinata, Y., Accelerated Oxidation Rate of Chromium Induced by Sodium Chloride.
Oxidation of Metals, 1987. 27: p. 315-332.
70. Spiegel, M., Salt melt induced corrosion of metallic materials in waste incineration
plants. Materials and Corrosion-Werkstoffe Und Korrosion, 1999. 50(7): p. 373-393.
71. Pasten, M.S. and M. Spiegel, High temperature corrosion of metallic materials in
simulated waste incineration environments at 300 degrees C 600 degrees C. Materials
and Corrosion-Werkstoffe Und Korrosion, 2006. 57(2): p. 192-195.
72. Bankiewicz, D., P. Yrjas, and M. Hupa, High-Temperature Corrosion of Superheater
Tube Materials Exposed to Zinc Salts. Energy & Fuels, 2009. 23(7): p. 3469-3474.
73. Bankiewicz, D., et al., Determination of the corrosivity of Pb-containing salt mixtures.
Corrosion Science, 2013. 66: p. 225-232.

91
74. Lu, W.M., et al., Accelerated corrosion of five commercial steels under a ZnCl2-KCl
deposit in a reducing environment typical of waste gasification at 673-773 K. Corrosion
Science, 2008. 50(7): p. 1900-1906.
75. Lehmusto, J., et al., High temperature oxidation of metallic chromium exposed to eight
different metal chlorides. Corrosion Science, 2011. 53(10): p. 3315-3323.
76. Factsage. www.gtt-technologies.de.
77. Folkeson, N., Jonsson, T., Halvarsson, M., Johansson, L-G., Svensson, J-E., The
influence of small amounts of KCl(s) on the high temperature corrosion of a Fe-2.25Cr-
1Mo steel at 400 and 500°C. Materials and Corrosion, 2011. 62(7).
78. Jonsson, T., Folkeson, T., Svensson, J. -E., Johansson, L. -G., An ESEM in-situ
investigation of initial stages of the KCl induced high temperature corrosion of a Fe-
2.25Cr-1Mo steel at 400 °C. corrosion science, 2011. 53(6): p. 2233-2246.
79. Karlsson, S., L.E. Åmand, and J. Liske, Reducing high-temperature corrosion on high-
alloyed stainless steel superheaters by co-combustion of municipal sewage sludge in a
fluidised bed boiler. Fuel, 2015. 139: p. 482-493.
80. Kassman, H., et al., Two strategies to reduce gaseous KCl and chlorine in deposits
during biomass combustion - injection of ammonium sulphate and co-combustion with
peat. Fuel Processing Technology, 2013. 105: p. 170-180.
81. Brostrom, M., et al., Sulfation of corrosive alkali chlorides by ammonium sulfate in a
biomass fired CFB boiler. Fuel Processing Technology, 2007. 88(11-12): p. 1171-1177.
82. Viklund, P., et al., Effect of sulphur containing additive on initial corrosion of
superheater tubes in waste fired boiler. Corrosion Engineering Science and
Technology, 2009. 44(3): p. 234-240.
83. Goldstein, J., I., et al., Scanning Electron Microscopy and X-Ray Microanalysis. 1992:
Plenum Press.