Embed Size (px)
Citation preview

1
THE CORROSION RESISTANCE OF CAST AND WROUGHT HASTELLOY C IS 70% ENHANCED WHEN REMOVING THE UNWANTED COMPLEX CARBIDES FROM THEIR MICROSTRUCTURE.
George A. Calboreanu, Ph.D.
A.R.Wilfley & Sons Inc. Denver – CO.
Abstract. The gamma matrix of all Hastelloy C materials contains non-coherent complex carbides which are mainly located at the austenite grain boundaries. These complex carbides have a large variety of sizes and shapes and they diminish the mechanical properties and the corrosion resistance. When carbides are removed through an optimized dissolution reaction the mechanical properties of Hastelloy CW-2M increase significantly. Tensile strength, yield strength and elongation are 25%, 17% and 95% higher then minimum requirement of ASTM A494. The paper calls this material Improved Hastelloy CW-2M. The yield strength of wrought HC276 manufactured wi th the additional carbide dissolution process is 22% higher than the yield strength of Std. HC276. The pulling test was carried out on two specimens machined from a 4- inch diameter dissected bar-stock. One half was additionally processed. The material is called Improved HC276. The comparative corrosion performance of Improved and Std. Hastelloy CW-2M were tested in the following applications: 1. Sulfuric acid - o ften Chemical Plants employ directly or indirectly pumps to dilute
concentrated sulfuric acid. A comparative corrosion test between Improved and Std. Hastelloy CW-2M was accomplished in 95% sulfuric acid at 2500F. The corrosion resistance of Improved Hastelloy CW-2M was 83% better than Std. Hastelloy CW-2M. In 75-90% sulfuric acid at 1500F the corrosion rate of Improved Hastelloy CW-2M is 0.95 MPY which is multifold lower than the published corrosion rate of wrought Hastelloy C4.
2. Phosphoric acid - after 600 hours of service testing in a pumping fluid containing 91-97% phosphoric acid, around 1% hydrochloric acid and traces of hydrofluoric acid at 2570F the number of corroded pits on 0.75 mm2 surface of Improved Hastelloy CW-2M was two, the number of corroded pits of Std. Hastelloy CW-2M was 38 while A20 (CN7M) austenitic stainless steel had 72 pits.
3. Hydrochloric acid - in 6% hydrochloric acid at 1400F the corrosion rate of Improved Hastelloy CW-2M was nil. This is an excellent achievement because the NACE

2
published compounded Iso-corrosion chart of hydrochloric acid doesn’t recommend Hastelloy C, a less expensive material, for such operation.
4. Sodium Hypochlorite - t he corrosion rate of Improved Hastelloy CW-2M in 6% sodium hypochlorite at 2000F is 0.14 MPY which is a multifold lower corrosion rate than 46 MPY the NACE published corrosion rate of Std. Hastelloy C in 1.5-6% sodium hypochlorite at 150-2000F. Under the circumstances in 6% sodium hypochlorite applications Improved Hastelloy CW-2M may successfully replace expensive titanium alloys.
5. Fluosilisic acid - is an important by-product in Phosphate Fertilizer Systems. Usually plastic pumps are used in such applications nonetheless the pump seal is metallic. Fluosilisic acid is extremely corrosive and the pump seal shouldn’t leak at any time. In 20% fluosilisic acid at 1400F the corrosion rate of Improved HC276 was 6 MPY versus 45 MPY the corrosion rate of Std. HC276 and 7 MPY the corrosion rate of Hastelloy C2000. Improved HC276 has significantly smaller, isolated and fewer pits than Std. HC276. This result is remarkable because the weight losses through pitting attack are generally low. Since then the seal components with Improved HC276 were successfully introduced in service.
All the corrosion rates presented in this paper were calculated according to ASTM G1. The carbide dissolution process is applicable for any shape or size of as-cast, wrought and final machined Hastelloy C parts. INTRODUCTION: The Hastelloy C families of alloys are nickel-chromium-molybdenum based and they have large application ranges due to their ability of successfully withstanding oxidizing and some reducing corrosive attack. The chemical composition of the five Hastelloy C alloys produced by the Metal Casting Industry is specified by ASTM A494 and is shown in Table 1. Table 1.
Element % # Alloy
C Max.
Mn Max.
Si Max.
P Max.
S Max.
Mo Fe Cr W V Cb (Nb)
Ni
1 CW-12MW
0.12 1.00 1.00 0.040 0.030 16.0 18.0
4.5 7.5
15.5 17.5
3.75 5.25
0.20 0.40
Rem.
2 CW-6M 0.07 1.00 1.00 0.040 0.030 17.0 20.0
Max 3.0
17.0 20.0
Rem.
3 CW-2M 0.02 1.00 0.80 0.030 0.030 15.0 17.5
Max 2.0
15.0 17.5
Max 1.0
Rem.
4 CW-6MC
0.06 1.00 1.00 0.015 0.015 8.0 10.0
Max 5.0
20.0 23.0
3.15 4.50
Rem.
5 CX 2MW
0.02 1.00 0.80 0.025 0.025 12.5 14.5
2.0 6.0
20.0 22.5
2.5 3.5
Max 0.35
Rem.
In the USA Hastelloy CW-2M and Hastelloy CW-6M are more frequently poured than the other three Hastelloys. Both Hastelloys, CW-2M and CW-6M have excellent castability, physical and mechanical properties a n d they a r e regularly used in manufacturing “wetted end” pump components.
3
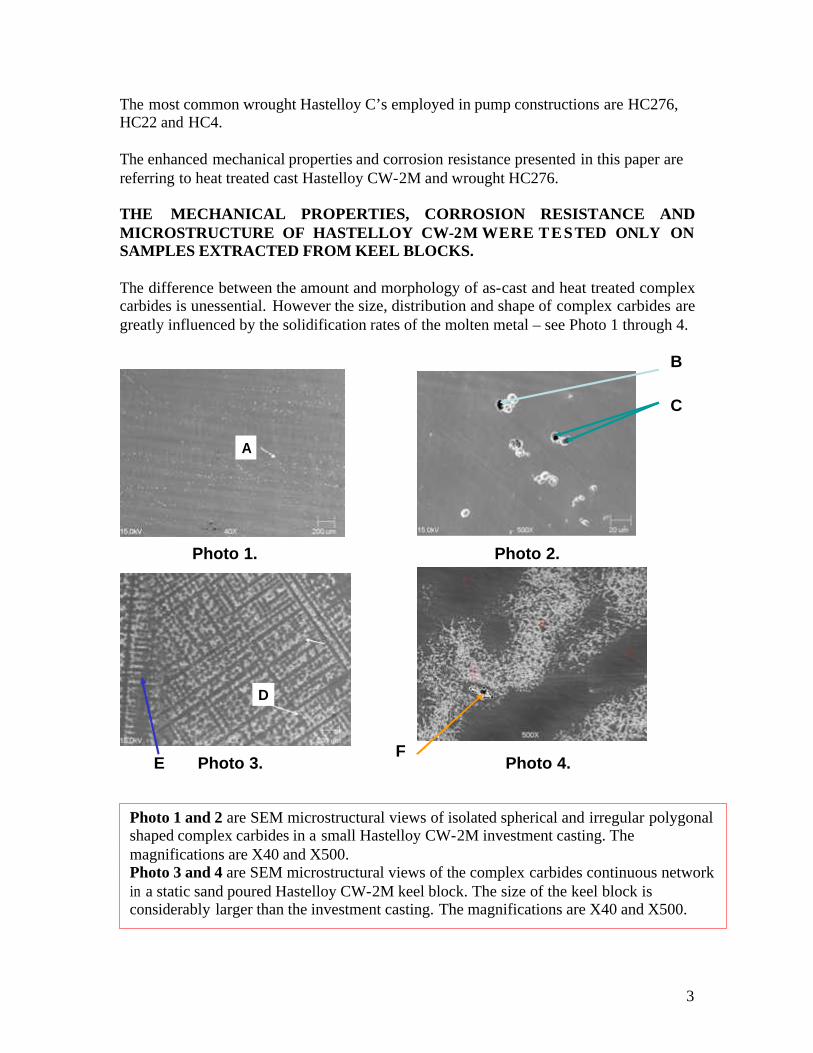
The most common wrought Hastelloy C’s employed in pump constructions are HC276, HC22 and HC4. The enhanced mechanical properties and corrosion resistance presented in this paper are referring to heat treated cast Hastelloy CW-2M and wrought HC276. THE MECHANICAL PROPERTIES, CORROSION RESISTANCE AND MICROSTRUCTURE OF HASTELLOY CW-2M WERE TESTED ONLY ON SAMPLES EXTRACTED FROM KEEL BLOCKS. The difference between the amount and morphology of as-cast and heat treated complex carbides is unessential. However the size, distribution and shape of complex carbides are greatly influenced by the solidification rates of the molten metal – see Photo 1 through 4. Arrow “A” in Photo 1 shows the location which was magnified from X40 to X500 in Photo 2. The complex carbides in the Hastelloy CW-2M investment casting are either isolated
Photo 1 and 2 are SEM microstructural views of isolated spherical and irregular polygonal shaped complex carbides in a small Hastelloy CW-2M investment casting. The magnifications are X40 and X500. Photo 3 and 4 are SEM microstructural views of the complex carbides continuous network in a static sand poured Hastelloy CW-2M keel block. The size of the keel block is considerably larger than the investment casting. The magnifications are X40 and X500.
A
Photo 1.
Photo 4.Photo 3.
Photo 2.
A
B
C
EF
D
4
The complex carbides of the Hastelloy CW-2M investment casting are either isolated spherical dots or irregular polygonal shaped with a length range of 5 – 20 mm. Arrow “A” in Photo 1 shows the area which was magnified to X500 in Photo 2. Arrow “B” is pointing to a three complex carbide formation. Due to the complex carbides brittleness one out of the three carbides broke away during the metallographic sample preparation. The “C” Arrows show the empty location of other two complex carbides which were removed through sample grinding and etching. Arrow “D” in Photo 3 indicates the Hastelloy CW-2M keel block location which was magnified from X40 to X500 in Photo 4. The main heat flow line in Photo 3 is shown with Arrow “E” and it directly influenced the complex carbide solidification pattern. The complex carbide configuration seen in Photo 4 is a continuous dot network and one large irregular polygonal shaped complex carbide. Arrow “F” is pointing to the irregular polygonal shaped complex carbide which was partially dislodged from the austenitic matrix at some point in sample preparation. The amount, shape and distribution of the complex carbides between the investment casting and the static sand poured keel block are significantly different and they directly influence the physical and mechanical properties of Hastelloy CW-2M. Because the testing samples were extracted only from keel blocks all results discussed in the paper are repeatable.
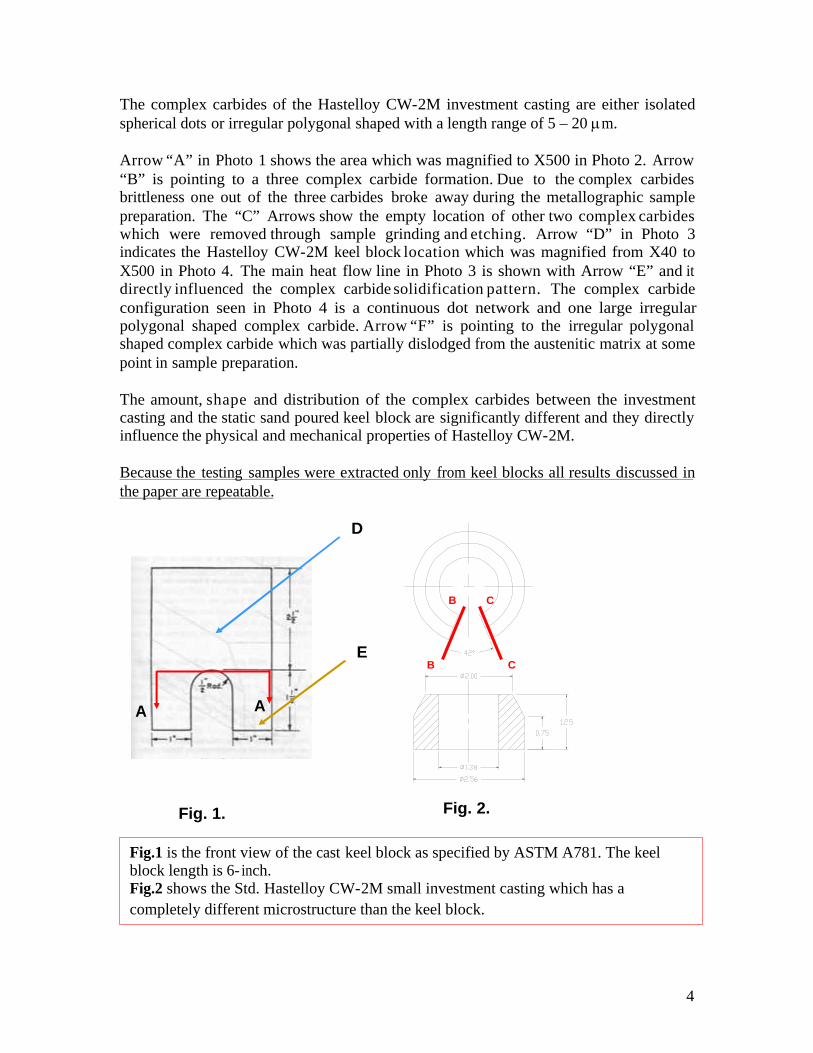
Fig.1 is the front view of the cast keel block as specified by ASTM A781. The keel block length is 6- inch. Fig.2 shows the Std. Hastelloy CW-2M small investment casting which has a
completely different microstructure than the keel block.
B
C
C
B
A A
Fig. 1. Fig. 2.
D
E

5
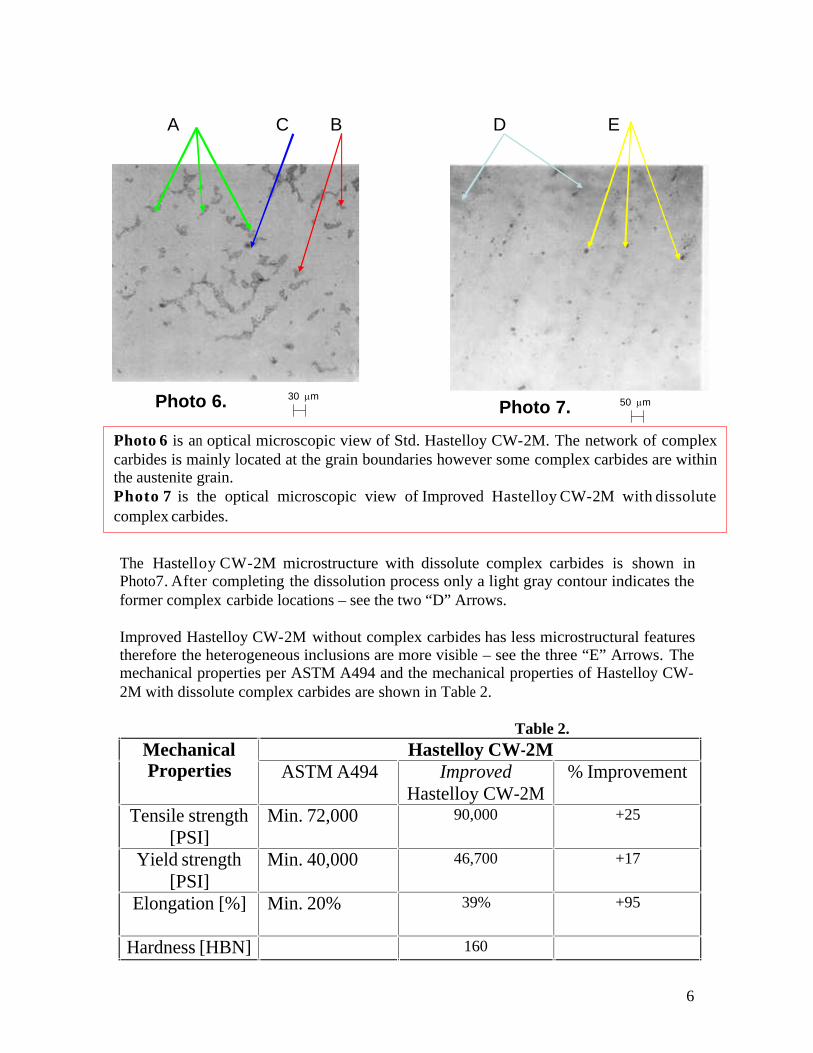
The testing legs of the keel block seen in Fig.1 are detached along the A-A plan. Arrow D shows the keel block riser whilst Arrow “E” points to one keel block leg. Both keel block legs are detached from the riser and heat treated with the pertaining Hastelloy CW-2M casting batch. In this way the microstructure, corrosion resistance and mechanical properties are intrinsic related to identical chemical compositions and heat treatment. Sections B-B and C-C show the dissection surfaces of the small investment casting from which the metallographic sample was extracted. THE MECHANICAL PROPERTIES OF HASTELLOY CW-2M ARE MAXIMIZED THROUGH COMPLEX CARBIDE DISSOLUTION. Photo 6 and 7 are optical microstructure views of Std. and Improved Hastelloy CW-2M. The complex carbides are the product reaction of carbon with the refractory molybdenum element and the major matrix elements of nickel, chromium, iron and silicon. The solidification direction path is determined by the partition coefficients KMo and KCr that govern solute redistribution during solidification. [1] The three “A” Arrows in Photo 6 point to some complex carbides located at the grain boundaries while the two “B” Arrows indicate that a few complex carbides are contained in the austenite grain. Arrow “C” identifies one of the few heterogeneous inclusions always present in static sand poured castings.
Photo 5 – shows the laboratory and service corrosion resistance testing sample extracted from the keel block leg or a wrought product. The sample dimensions are 1x1x0.25 – inch with a 0.25-inch diameter center hole.
Photo 5.
6
The Hastelloy CW-2M microstructure with dissolute complex carbides is shown in Photo7. After completing the dissolution process only a light gray contour indicates the former complex carbide locations – see the two “D” Arrows. Improved Hastelloy CW-2M without complex carbides has less microstructural features therefore the heterogeneous inclusions are more visible – see the three “E” Arrows. The mechanical properties per ASTM A494 and the mechanical properties of Hastelloy CW-2M with dissolute complex carbides are shown in Table 2. Table 2.
Hastelloy CW-2M Mechanical Properties
ASTM A494 Improved
Hastelloy CW-2M % Improvement
Tensile strength [PSI]
Min. 72,000 90,000 +25
Yield strength [PSI]
Min. 40,000 46,700 +17
Elongation [%]
Min. 20% 39% +95
Hardness [HBN] 160
Photo 6 is an optical microscopic view of Std. Hastelloy CW-2M. The network of complex carbides is mainly located at the grain boundaries however some complex carbides are within the austenite grain. Photo 7 is the optical microscopic view of Improved Hastelloy CW-2M with dissolute complex carbides.
30 mm50 mmPhoto 6. Photo 7.
D EA C B
7
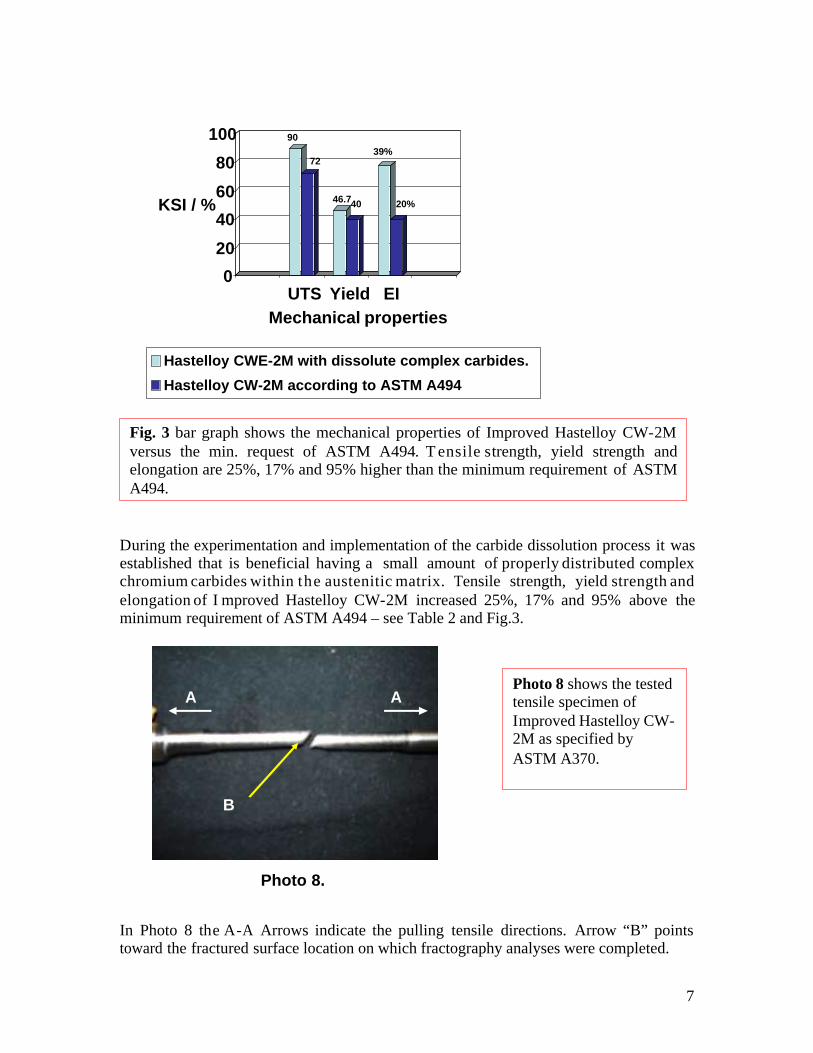
During the experimentation and implementation of the carbide dissolution process it was established that is beneficial having a small amount of properly distributed complex chromium carbides within the austenitic matrix. Tensile strength, yield strength and elongation of I mproved Hastelloy CW-2M increased 25%, 17% and 95% above the minimum requirement of ASTM A494 – see Table 2 and Fig.3. In Photo 8 the A-A Arrows indicate the pulling tensile directions. Arrow “B” points toward the fractured surface location on which fractography analyses were completed.
Fig. 3 bar graph shows the mechanical properties of Improved Hastelloy CW-2M versus the min. request of ASTM A494. T ensile strength, yield strength and elongation are 25%, 17% and 95% higher than the minimum requirement of ASTM A494.
Photo 8.
A A
B
Photo 8 shows the tested tensile specimen of Improved Hastelloy CW-2M as specified by ASTM A370.
0
20
40
60
80
100
KSI / %
UTS Yield EI
Mechanical properties
Hastelloy CWE-2M with dissolute complex carbides.
Hastelloy CW-2M according to ASTM A494
90
72
46.7
39%
40 20%
8
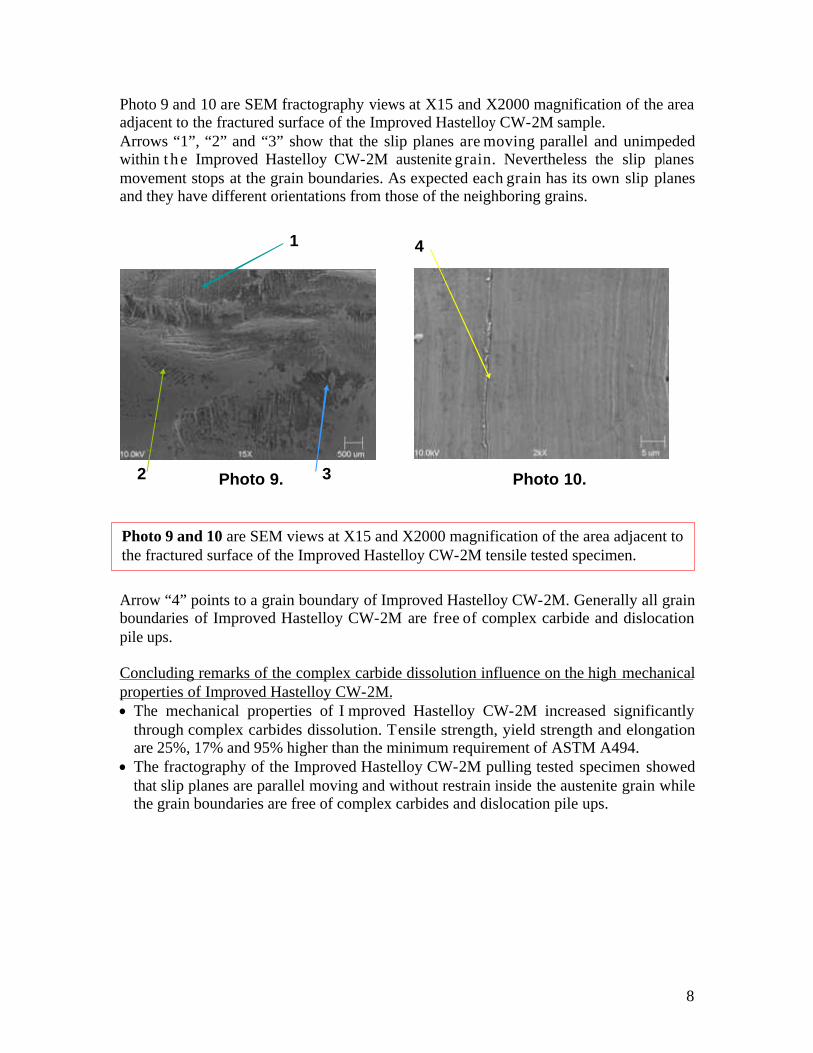
Photo 9 and 10 are SEM fractography views at X15 and X2000 magnification of the area adjacent to the fractured surface of the Improved Hastelloy CW-2M sample. Arrows “1”, “2” and “3” show that the slip planes are moving parallel and unimpeded within t h e Improved Hastelloy CW-2M austenite grain. Nevertheless the slip planes movement stops at the grain boundaries. As expected each grain has its own slip planes and they have different orientations from those of the neighboring grains. Arrow “4” points to a grain boundary of Improved Hastelloy CW-2M. Generally all grain boundaries of Improved Hastelloy CW-2M are free of complex carbide and dislocation pile ups. Concluding remarks of the complex carbide dissolution influence on the high mechanical properties of Improved Hastelloy CW-2M. · The mechanical properties of I mproved Hastelloy CW-2M increased significantly
through complex carbides dissolution. Tensile strength, yield strength and elongation are 25%, 17% and 95% higher than the minimum requirement of ASTM A494.
· The fractography of the Improved Hastelloy CW-2M pulling tested specimen showed that slip planes are parallel moving and without restrain inside the austenite grain while the grain boundaries are free of complex carbides and dislocation pile ups.
Photo 9 and 10 are SEM views at X15 and X2000 magnification of the area adjacent to the fractured surface of the Improved Hastelloy CW-2M tensile tested specimen.
Photo 9. Photo 10.
1
2 3
4
9
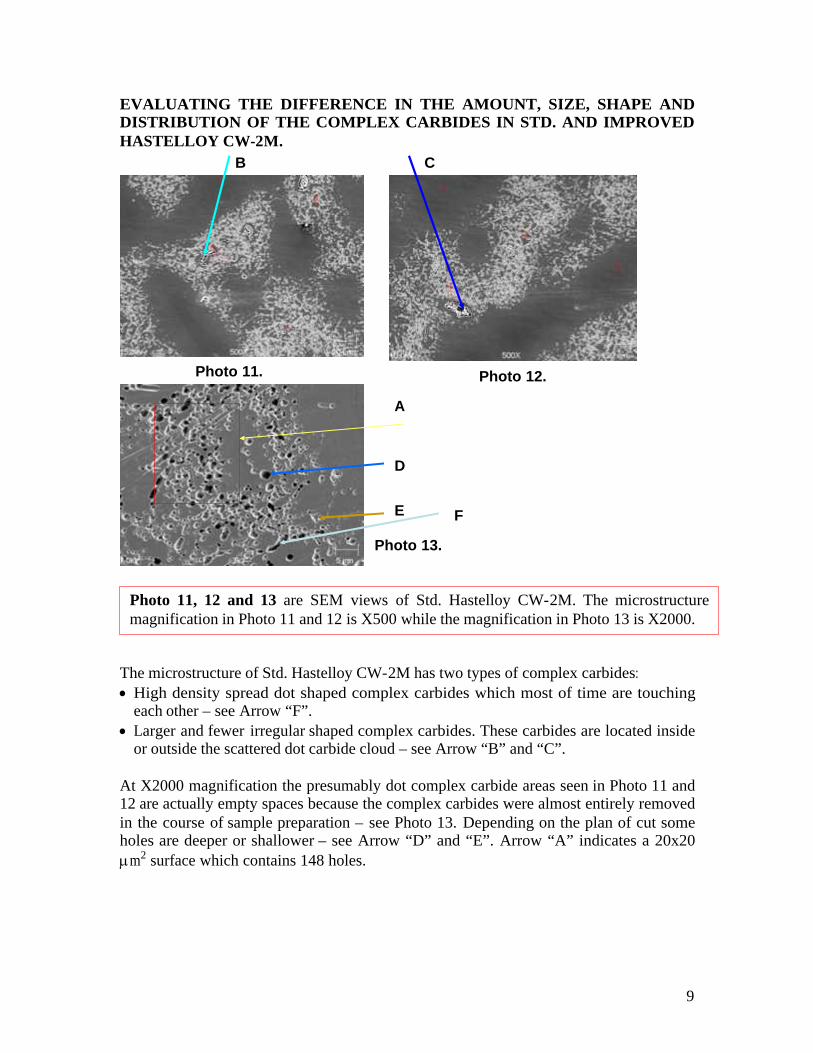
EVALUATING THE DIFFERENCE IN THE AMOUNT, SIZE, SHAPE AND DISTRIBUTION OF THE COMPLEX CARBIDES IN STD. AND IMPROVED HASTELLOY CW-2M. The microstructure of Std. Hastelloy CW-2M has two types of complex carbides: · High density spread dot shaped complex carbides which most of time are touching
each other – see Arrow “F”. · Larger and fewer irregular shaped complex carbides. These carbides are located inside
or outside the scattered dot carbide cloud – see Arrow “B” and “C”. At X2000 magnification the presumably dot complex carbide areas seen in Photo 11 and 12 are actually empty spaces because the complex carbides were almost entirely removed in the course of sample preparation – see Photo 13. Depending on the plan of cut some holes are deeper or shallower – see Arrow “D” and “E”. Arrow “A” indicates a 20x20 mm2 surface which contains 148 holes.
Photo 11, 12 and 13 are SEM views of Std. Hastelloy CW-2M. The microstructure magnification in Photo 11 and 12 is X500 while the magnification in Photo 13 is X2000.
Photo 11. Photo 12.
Photo 13.
A
D
E
B C
F
10
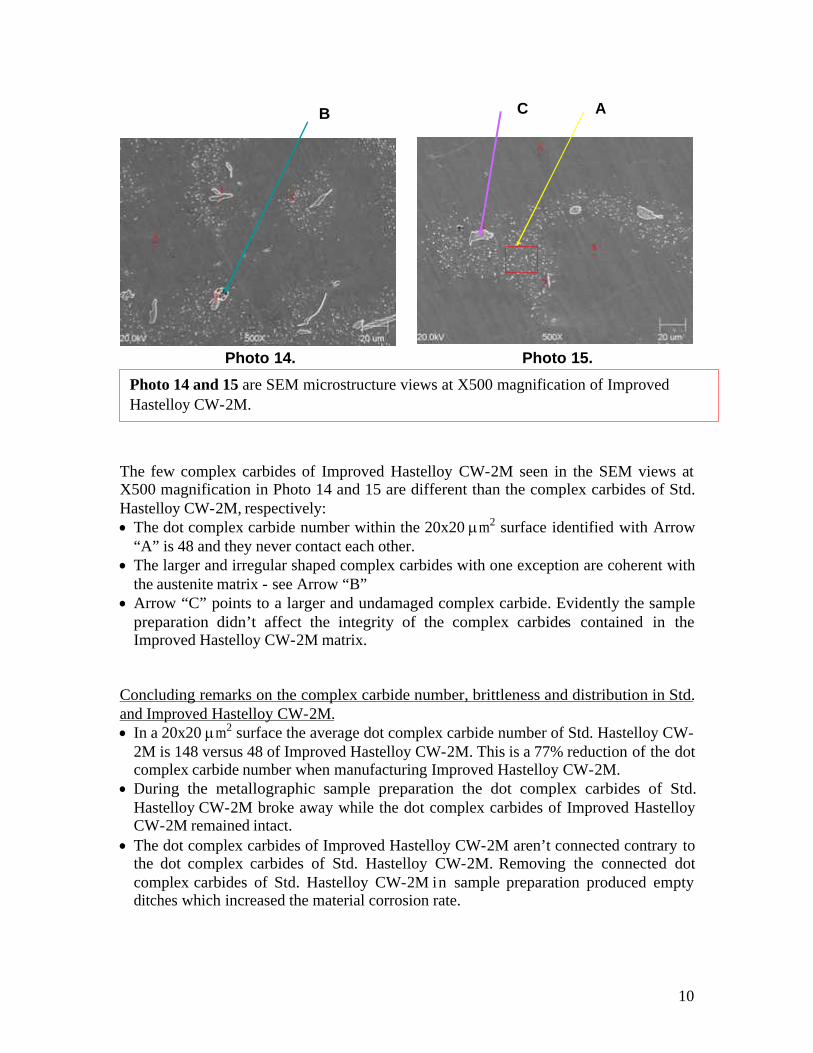
The few complex carbides of Improved Hastelloy CW-2M seen in the SEM views at X500 magnification in Photo 14 and 15 are different than the complex carbides of Std. Hastelloy CW-2M, respectively: · The dot complex carbide number within the 20x20 mm2 surface identified with Arrow
“A” is 48 and they never contact each other. · The larger and irregular shaped complex carbides with one exception are coherent with
the austenite matrix - see Arrow “B” · Arrow “C” points to a larger and undamaged complex carbide. Evidently the sample
preparation didn’t affect the integrity of the complex carbides contained in the Improved Hastelloy CW-2M matrix.
Concluding remarks on the complex carbide number, brittleness and distribution in Std. and Improved Hastelloy CW-2M. · In a 20x20 mm2 surface the average dot complex carbide number of Std. Hastelloy CW-
2M is 148 versus 48 of Improved Hastelloy CW-2M. This is a 77% reduction of the dot complex carbide number when manufacturing Improved Hastelloy CW-2M.
· During the metallographic sample preparation the dot complex carbides of Std. Hastelloy CW-2M broke away while the dot complex carbides of Improved Hastelloy CW-2M remained intact.
· The dot complex carbides of Improved Hastelloy CW-2M aren’t connected contrary to the dot complex carbides of Std. Hastelloy CW-2M. Removing the connected dot complex carbides of Std. Hastelloy CW-2M in sample preparation produced empty ditches which increased the material corrosion rate.
Photo 14 and 15 are SEM microstructure views at X500 magnification of Improved Hastelloy CW-2M.
Photo 14. Photo 15.
AB C

11
· All the larger and irregular shaped complex carbides of Std. Hastelloy CW-2M are dislodged from the matrix whilst the majority of the complex carbides are unaltered in Improved Hastelloy CW-2M.
· The higher brittleness and number of complex carbides in Std. Hastelloy CW-2M inflict holes or ditches which become corrosion initiation sites and diminish the corrosion resistance.
QUANTIFYING THE HARMFUL INFLUENCE OF THE COMPLEX CARBIDES ON THE CORROSION RATE OF STD. AND IMPROVED HASTELLOY CW-2M IN HOT CONCENTRATED SULFURIC ACID. Generally Hastelloy C alloys have a modest corrosion resistance in hot concentrated sulfuric acid compared to other Ni-base materials. However every pump manufacturer is interested in increasing the performance of Hastelloy C alloys in such operations because chemical plants are often using directly or indirectly pumps to dilute concentrated sulfuric acid. The comparative corrosion performance test between I mproved and Std. Hastelloy CW-2M was accomplished in 95% sulfuric acid at 2500F. The testing point is shown with Arrow “A” on the sulfuric acid Iso-corrosion of wrought Hastelloy C4 – see Fig.4. At the end of 72 hours laboratory test the corrosion rates of Std. and Improved Hastelloy CW-2M were 130 MPY versus 71 MPY – see Arrow “B” and “C” in Fig. 4. The Improved Hastelloy CW-2M renders 83% lower corrosion rate than Std. processed Hastelloy CW-2M. The bar graph in Fig. 5 illustrates the comparative corrosion rate in 95% sulfuric acid at 2500F of wrought Hastelloy C4, Std. and Improved Hastelloy CW-2M. Service results showed similar outcome.
Fig. 4 shows the Iso-corrosion chart of Hastelloy C4 in sulfuric acid. The two red lines identify the laboratory testing conditions.
A B
C
Fig. 4.
12
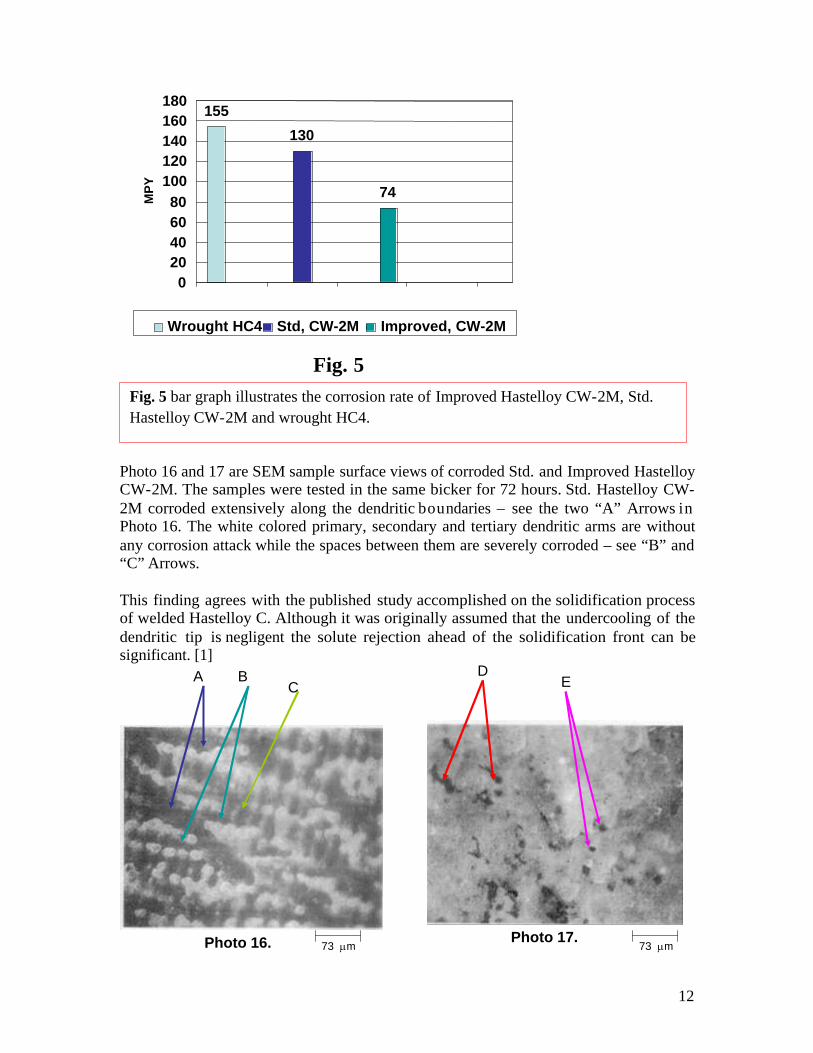
Photo 16 and 17 are SEM sample surface views of corroded Std. and Improved Hastelloy CW-2M. The samples were tested in the same bicker for 72 hours. Std. Hastelloy CW-2M corroded extensively along the dendritic boundaries – see the two “A” Arrows in Photo 16. The white colored primary, secondary and tertiary dendritic arms are without any corrosion attack while the spaces between them are severely corroded – see “B” and “C” Arrows. This finding agrees with the published study accomplished on the solidification process of welded Hastelloy C. Although it was originally assumed that the undercooling of the dendritic tip is negligent the solute rejection ahead of the solidification front can be significant. [1]
Fig. 5 bar graph illustrates the corrosion rate of Improved Hastelloy CW-2M, Std.
Hastelloy CW-2M and wrought HC4.
155
130
74
0
20
40
60
80
100
120
140
160
180
MP
Y
Wrought HC4 Std, CW-2M Improved, CW-2M
Fig. 5
Photo 16. Photo 17.
A B ECD
73 mm 73 mm
13
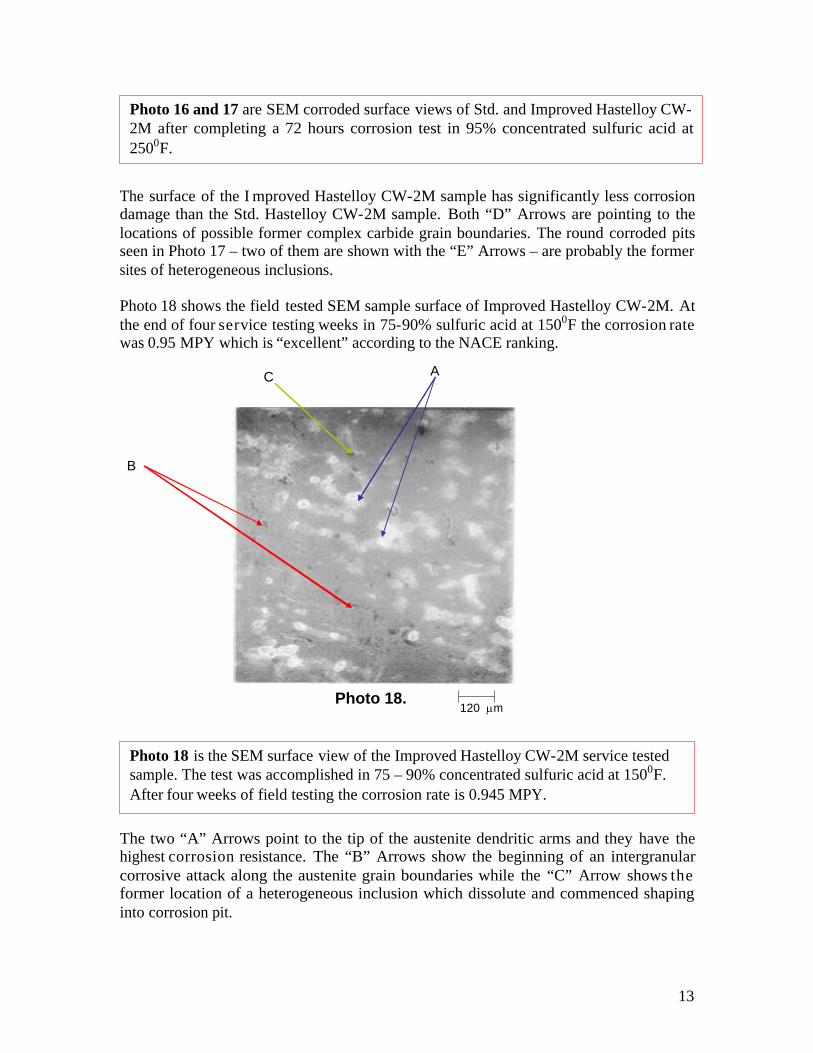
The surface of the I mproved Hastelloy CW-2M sample has significantly less corrosion damage than the Std. Hastelloy CW-2M sample. Both “D” Arrows are pointing to the locations of possible former complex carbide grain boundaries. The round corroded pits seen in Photo 17 – two of them are shown with the “E” Arrows – are probably the former sites of heterogeneous inclusions. Photo 18 shows the field tested SEM sample surface of Improved Hastelloy CW-2M. At the end of four service testing weeks in 75-90% sulfuric acid at 1500F the corrosion rate was 0.95 MPY which is “excellent” according to the NACE ranking. The two “A” Arrows point to the tip of the austenite dendritic arms and they have the highest corrosion resistance. The “B” Arrows show the beginning of an intergranular corrosive attack along the austenite grain boundaries while the “C” Arrow shows the former location of a heterogeneous inclusion which dissolute and commenced shaping into corrosion pit.
Photo 16 and 17 are SEM corroded surface views of Std. and Improved Hastelloy CW-2M after completing a 72 hours corrosion test in 95% concentrated sulfuric acid at 2500F.
Photo 18 is the SEM surface view of the Improved Hastelloy CW-2M service tested sample. The test was accomplished in 75 – 90% concentrated sulfuric acid at 1500F. After four weeks of field testing the corrosion rate is 0.945 MPY.
120 mm
B
AC
Photo 18.
14
Concluding remarks established on the comparative corrosion resistance test of Improved and Std. Hastelloy CW-2M in hot concentrated sulfuric acid. · The corrosion attack of Std. Hastelloy CW-2M in 95% sulfuric acid at 2500F starts in
two locations, the grain boundaries and around the dendritic tips of the austenite grains. · After 72 hours of testing under laboratory conditions the corrosion rate of Std. and
Improved Hastelloy C are 130 MPY and 74 MPY. This represents 83% better corrosion resistance of Improved Hastelloy CW-2M versus Std. Hastelloy CW-2M.
· During a four week field corrosion test in 75-90% sulfuric acid at 1500F the corrosion rate of I mproved Hastelloy CW-2M was 0.95 MPY. This is a multifold enhanced corrosion resistance over the published corrosion rate of wrought Hastelloy C4.
· Based on the superior corrosion resistance of I mproved Hastelloy CW-2M when requested pumps are supplied with the new material.
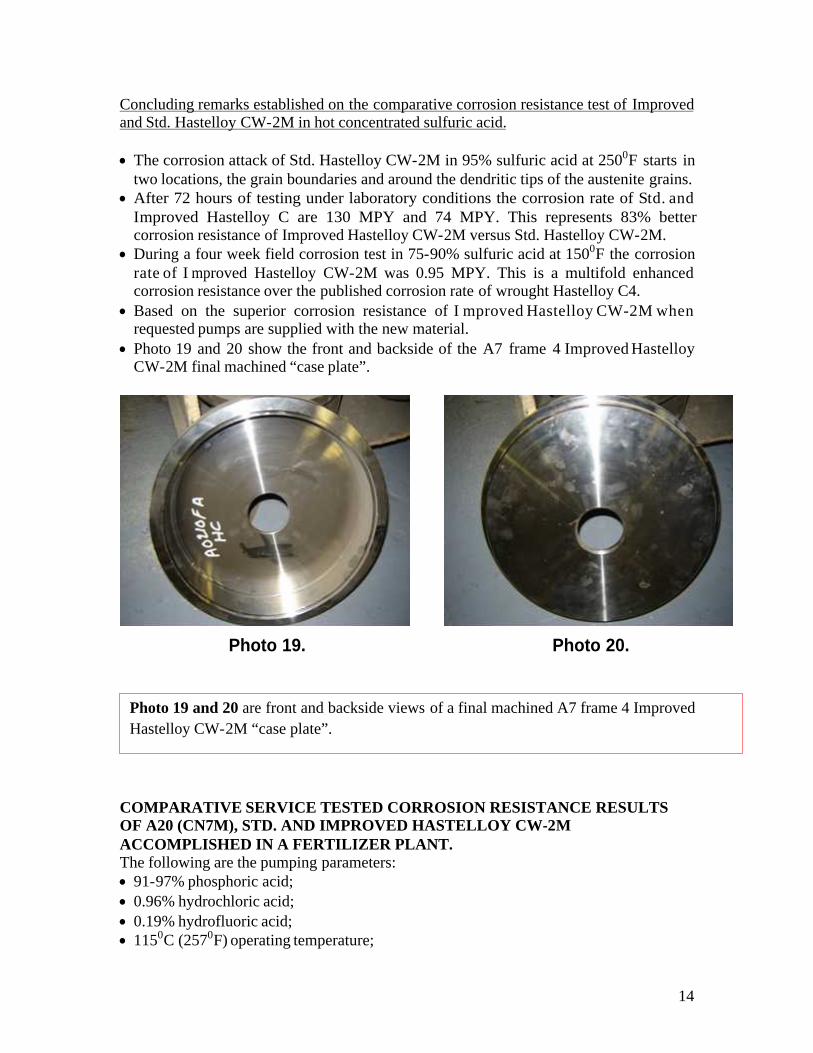
· Photo 19 and 20 show the front and backside of the A7 frame 4 Improved Hastelloy CW-2M final machined “case plate”.
COMPARATIVE SERVICE TESTED CORROSION RESISTANCE RESULTS OF A20 (CN7M), STD. AND IMPROVED HASTELLOY CW-2M ACCOMPLISHED IN A FERTILIZER PLANT. The following are the pumping parameters: · 91-97% phosphoric acid; · 0.96% hydrochloric acid; · 0.19% hydrofluoric acid; · 1150C (2570F) operating temperature;
Photo 19 and 20 are front and backside views of a final machined A7 frame 4 Improved
Hastelloy CW-2M “case plate”.
Photo 19. Photo 20.
15
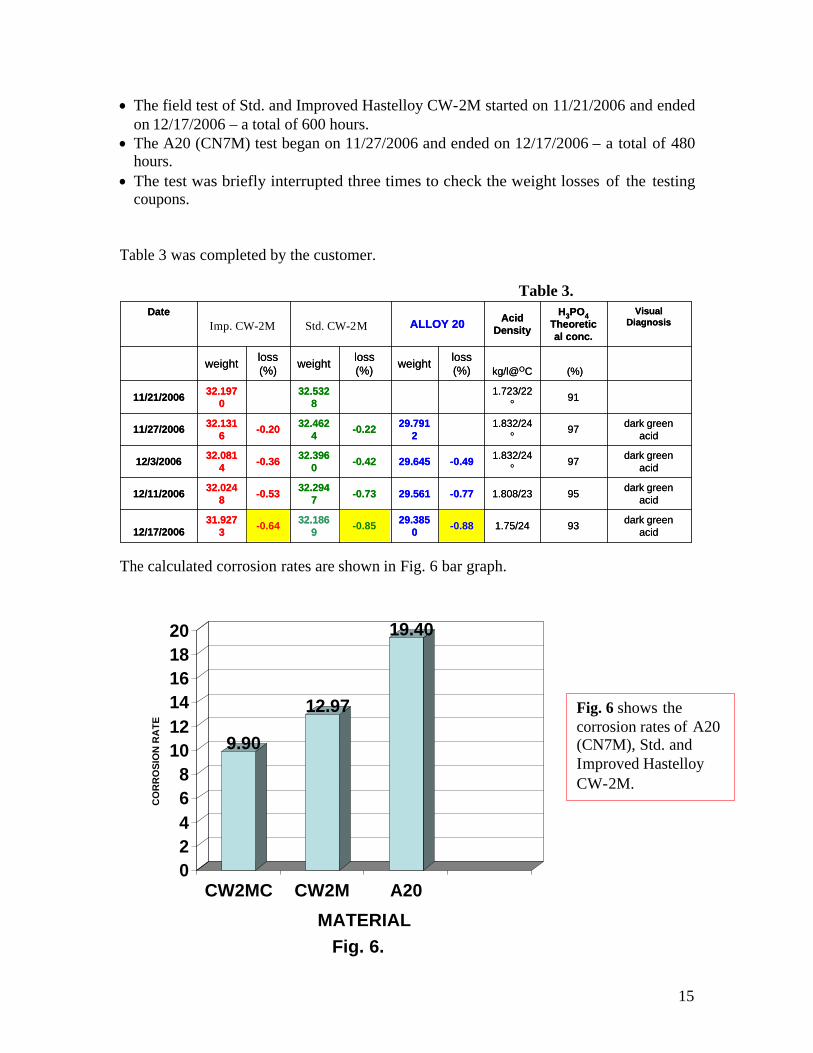
· The field test of Std. and Improved Hastelloy CW-2M started on 11/21/2006 and ended on 12/17/2006 – a total of 600 hours.
· The A20 (CN7M) test began on 11/27/2006 and ended on 12/17/2006 – a total of 480 hours.
· The test was briefly interrupted three times to check the weight losses of the testing coupons.
Table 3 was completed by the customer. Table 3. The calculated corrosion rates are shown in Fig. 6 bar graph.
dark green acid
931.75/24-0.8829.385
0-0.85
32.1869
-0.6431.927
312/17/2006
dark green acid
951.808/23-0.7729.561-0.7332.294
7-0.53
32.0248
12/11/2006
dark green acid
971.832/24
°-0.4929.645-0.42
32.3960
-0.3632.081
412/3/2006
dark green acid
971.832/24
°29.791
2-0.22
32.4624
-0.2032.131
611/27/2006
911.723/22
°32.532
832.197
011/21/2006
(%)kg/l@OC
loss (%)
weightloss (%)
weightloss (%)
weight
Visual Diagnosis
H3PO4
Theoretical conc.
Acid Density
ALLOY 20HAST CCW2M CDate
dark green acid
931.75/24-0.8829.385
0-0.85
32.1869
-0.6431.927
312/17/2006
dark green acid
951.808/23-0.7729.561-0.7332.294
7-0.53
32.0248
12/11/2006
dark green acid
971.832/24
°-0.4929.645-0.42
32.3960
-0.3632.081
412/3/2006
dark green acid
971.832/24
°29.791
2-0.22
32.4624
-0.2032.131
611/27/2006
911.723/22
°32.532
832.197
011/21/2006
(%)kg/l@OC
loss (%)
weightloss (%)
weightloss (%)
weight
Visual Diagnosis
H3PO4
Theoretical conc.
Acid Density
ALLOY 20HAST CCW2M CDate
Fig. 6 shows the corrosion rates of A20 (CN7M), Std. and Improved Hastelloy CW-2M.
9.90
12.97
19.40
0
2
4
6
8
10
12
14
16
18
20
CO
RR
OS
ION
RA
TE
CW2MC CW2M A20
MATERIAL
Fig. 6.
Imp. CW-2M Std. CW-2M
16
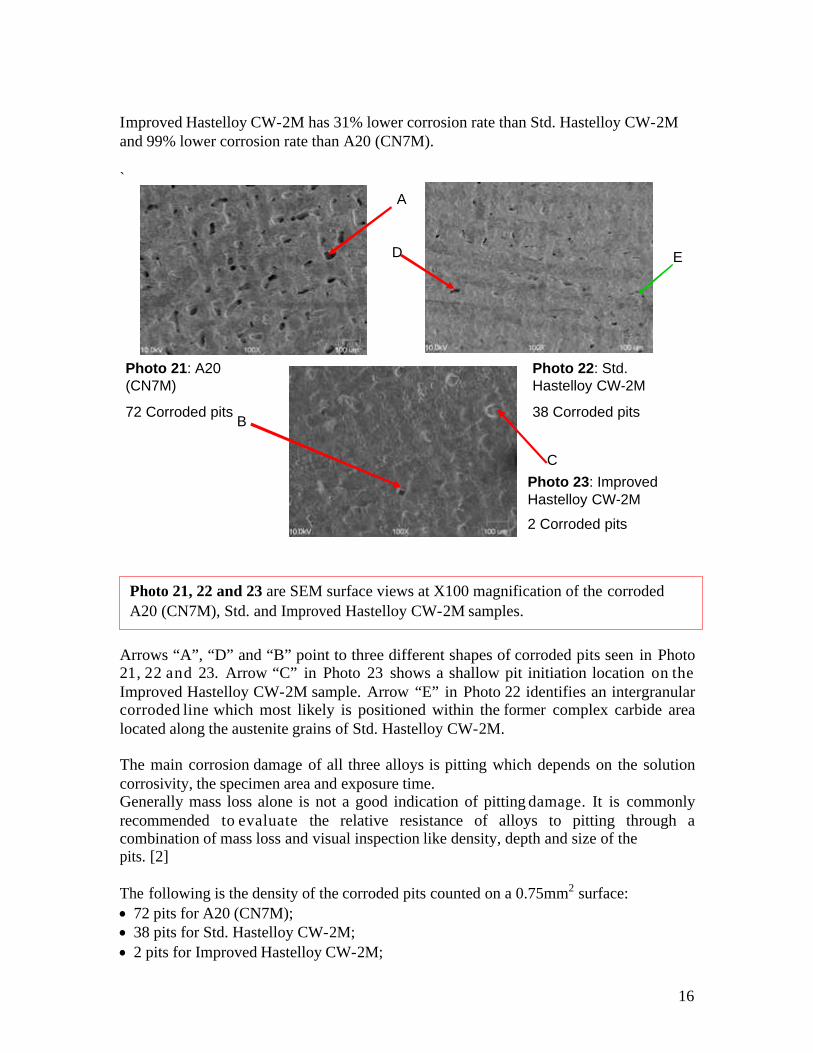
Improved Hastelloy CW-2M has 31% lower corrosion rate than Std. Hastelloy CW-2M and 99% lower corrosion rate than A20 (CN7M). ` Arrows “A”, “D” and “B” point to three different shapes of corroded pits seen in Photo 21, 22 and 23. Arrow “C” in Photo 23 shows a shallow pit initiation location on the Improved Hastelloy CW-2M sample. Arrow “E” in Photo 22 identifies an intergranular corroded line which most likely is positioned within the former complex carbide area located along the austenite grains of Std. Hastelloy CW-2M. The main corrosion damage of all three alloys is pitting which depends on the solution corrosivity, the specimen area and exposure time. Generally mass loss alone is not a good indication of pitting damage. It is commonly recommended to evaluate the relative resistance of alloys to pitting through a combination of mass loss and visual inspection like density, depth and size of the pits. [2] The following is the density of the corroded pits counted on a 0.75mm2 surface: · 72 pits for A20 (CN7M); · 38 pits for Std. Hastelloy CW-2M; · 2 pits for Improved Hastelloy CW-2M;
Photo 21, 22 and 23 are SEM surface views at X100 magnification of the corroded A20 (CN7M), Std. and Improved Hastelloy CW-2M samples.
Photo 21: A20 (CN7M)
72 Corroded pits
Photo 22: Std. Hastelloy CW-2M
38 Corroded pits
Photo 23: ImprovedHastelloy CW-2M
2 Corroded pits
A
B
C
D E
17
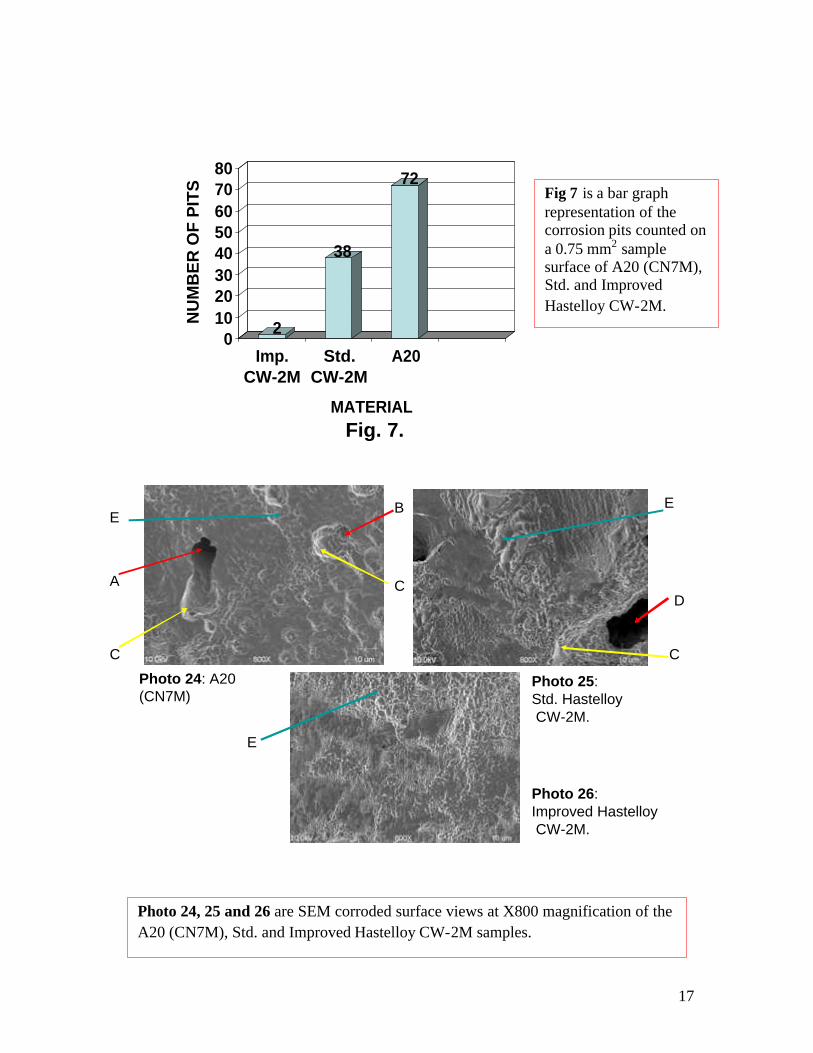
Photo 24, 25 and 26 are SEM corroded surface views at X800 magnification of the
A20 (CN7M), Std. and Improved Hastelloy CW-2M samples.
Fig 7 is a bar graph representation of the corrosion pits counted on a 0.75 mm2 sample surface of A20 (CN7M), Std. and Improved
Hastelloy CW-2M.
2
38
72
010
2030
405060
7080
NU
MB
ER
OF
PIT
S
Imp.CW-2M
Std.CW-2M
A20
MATERIAL
Fig. 7.
Photo 24: A20 (CN7M)
Photo 25: Std. HastelloyCW-2M.
Photo 26: Improved HastelloyCW-2M.
A
B
D
C C
C
EE
E
18
Arrows “A”, “B” and “D” in Photo 24 and 25 show corroded pits on the A20 (CN7M) and Std. Hastelloy CW-2M samples. The pit identified with Arrow “B” isn’t fully developed. The three “E” Arrows seen in Photo 24, 25 and 26 show local corrosion attack on the three alloys in sites where corrosive pits aren’t developed yet. The corrosion pits grow gravitationally however if during testing the coupon is tilted the corrosive product from inside the pit rolls downwards and produces a damaging corrosive path like shown with the three “C” Arrows in Photo 24 and 25. Concluding remarks on the corrosion resistance of A20 (CN7M), Std. and Improved Hastelloy CW-2M in a service application containing 91-97% phosphoric acid, 0.96% hydrochloric acid and 0.19% hydrofluoric acid at 1150 (2570F).
· The field duration test was 600 hours for Std. and Improved Hastelloy CW-2M and 480 hours for A20 (CN7M).
· The intensity of the corrosive pitting attack was established through mass loss and pit density.
· The corrosion rate of Improved Hastelloy CW-2M was 31% lower than the Std. Hastelloy CW-2M and 96% lower than A20 (CN7M).
· The following pit density was counted on a 0.75 mm2 sample surface: Improved Hastelloy CW-2M = 2 pits, Std. Hastelloy CW-2M = 38 pits and A20 (CN7M) = 72 pits.
· Contrary to Std. Hastelloy CW-2M, the Improved Hastelloy CW-2M is without any corrosive attack along the austenite grain boundaries.
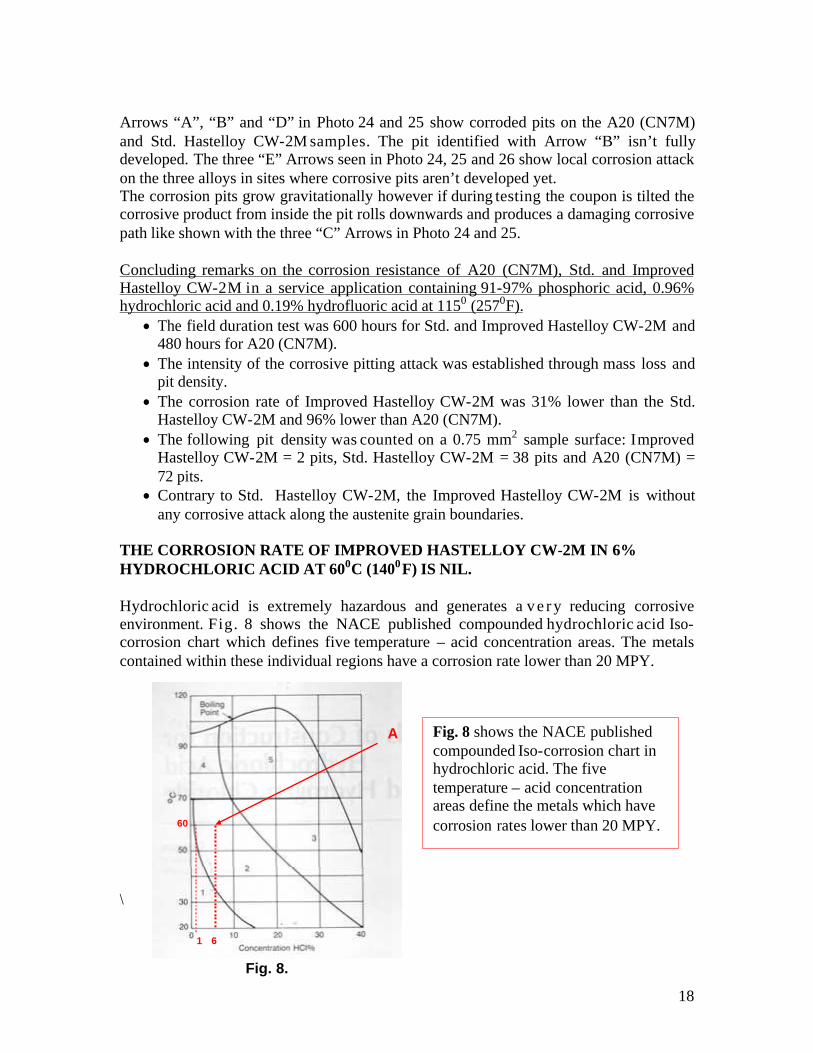
THE CORROSION RATE OF IMPROVED HASTELLOY CW-2M IN 6% HYDROCHLORIC ACID AT 600C (1400F) IS NIL.
Hydrochloric acid is extremely hazardous and generates a v e r y reducing corrosive environment. Fig. 8 shows the NACE published compounded hydrochloric acid Iso-corrosion chart which defines five temperature – acid concentration areas. The metals contained within these individual regions have a corrosion rate lower than 20 MPY. \
Fig. 8 shows the NACE published compounded Iso-corrosion chart in hydrochloric acid. The five temperature – acid concentration areas define the metals which have corrosion rates lower than 20 MPY. 60
A
1 6
Fig. 8.

19
Hastelloy C is part of #1 area. At higher temperatures the corrosion resistance of such materials decreases consequently the recommended hydrochloric acid concentration decreases and vice versa. According to the Iso-corrosion chart at 600C (1400F) Hastelloy C withstands only 1% concentrated hydrochloric acid. After 72 hours of testing in 6% hydrochloric acid at 600C (1400F) the corrosion rate of Improved Hastelloy CW-2M was nil. The pumps manufactured with I mproved Hastelloy CW-2M for this application were shipped in service and performed well. The machined marks seen in Photo 27 through Photo 30 are sharp, unaltered and free of corrosion attack. In 6% concentrated hydrochloric acid at 600C (1400F) the corrosion resistance of Improved Hastelloy CW-2M is multifold higher than the NACE published data for Std. Hastelloy C.
Photo 27, 28, 29 and 30 are sample surface views at X100, X500, X1000 and X5000 magnification of the Improved Hastelloy CW-2M tested coupon in 6% hydrochloric acid at 600C (1400). The corrosion rate was nil.
Photo 27. Photo 28.
Photo 29. Photo 30.
20
Concluding remarks on the “excellent” corrosion resistance provided by I mproved Hastelloy CW-2M in 6% concentrated hydrochloric acid at 600C (1400F).
· Generally Hastelloy C materials have some corrosion resistance in reducing corrosive environments. Nonetheless the corrosion rate of Improved Hastelloy CW-2M in 6% concentrated hydrochloric acid at 600C was nil.
· Based on this “excellent” corrosion rate established during a laboratory test the service pumps build with I mproved Hastelloy CW-2M were shipped to the customer and they performed well.
· Improved Hastelloy CW-2M has multifold higher corrosion resistance than the NACE published data of the compounded hydrochloric acid Iso-corrosion chart.
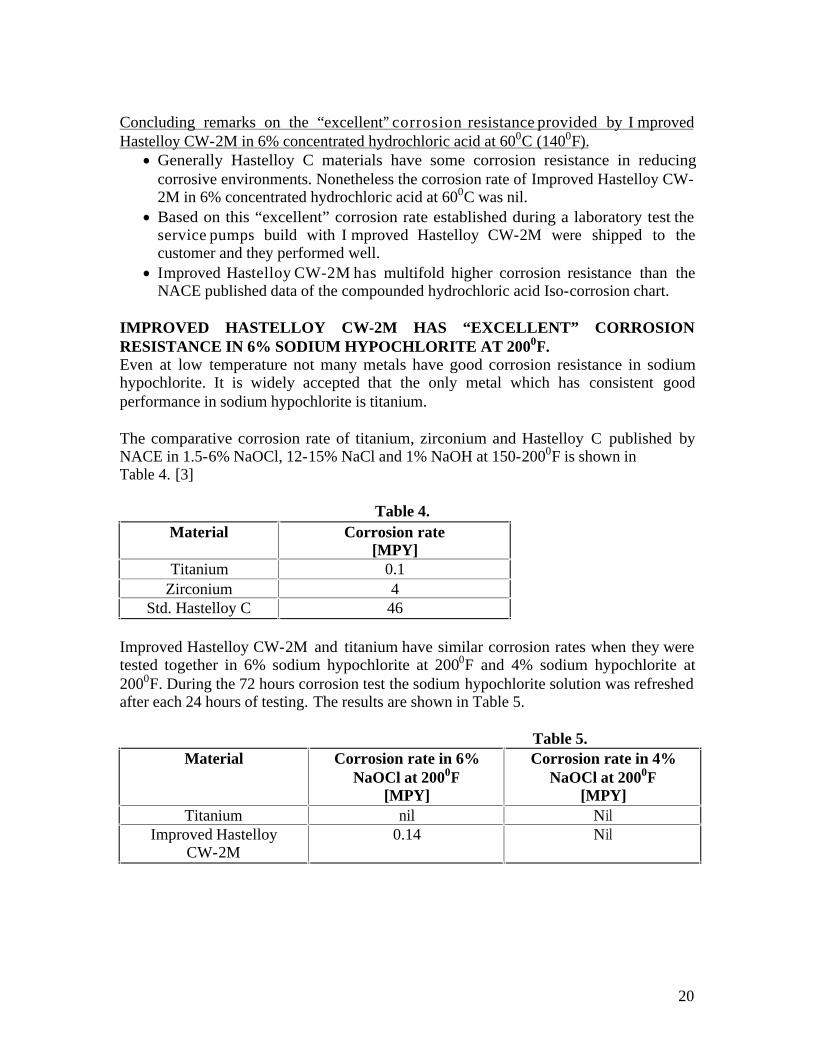
IMPROVED HASTELLOY CW-2M HAS “EXCELLENT” CORROSION RESISTANCE IN 6% SODIUM HYPOCHLORITE AT 2000F. Even at low temperature not many metals have good corrosion resistance in sodium hypochlorite. It is widely accepted that the only metal which has consistent good performance in sodium hypochlorite is titanium. The comparative corrosion rate of titanium, zirconium and Hastelloy C published by NACE in 1.5-6% NaOCl, 12-15% NaCl and 1% NaOH at 150-2000F is shown in Table 4. [3] Table 4.
Material Corrosion rate [MPY]
Titanium 0.1 Zirconium 4
Std. Hastelloy C 46
Improved Hastelloy CW-2M and titanium have similar corrosion rates when they were tested together in 6% sodium hypochlorite at 2000F and 4% sodium hypochlorite at 2000F. During the 72 hours corrosion test the sodium hypochlorite solution was refreshed after each 24 hours of testing. The results are shown in Table 5.
Table 5. Material Corrosion rate in 6%
NaOCl at 2000F [MPY]
Corrosion rate in 4% NaOCl at 2000F
[MPY] Titanium nil Nil
Improved Hastelloy CW-2M
0.14 Nil
21
When Std. Hastelloy CW-2M pumps are used the sodium hypochlorite solution colors slightly yellow. Such coloration is unwanted by customers. During the laboratory tests of Improved Hastelloy CW-2M in sodium hypochlorite at the very beginning the solution became slightly yellowish nevertheless it quickly changed and remained pure white. Concluding remarks established on the “excellent” ranked corrosion performance of Improved Hastelloy CW-2M in 6% sodium hypochlorite at 2000F.
· The NACE published corrosion rate of Hastelloy C in 1.5 – 6% sodium hypochlorite at 150 – 2000F is 46 MPY.
· Improved Hastelloy CW-2M and titanium have 0.14 MPY and nil corrosion rates in 6% sodium hypochlorite at 2000F.
· Under the circumstances Improved Hastelloy CW-2M can replace titanium in some sodium hypochlorite pumping applications. Such a material change provides important savings.
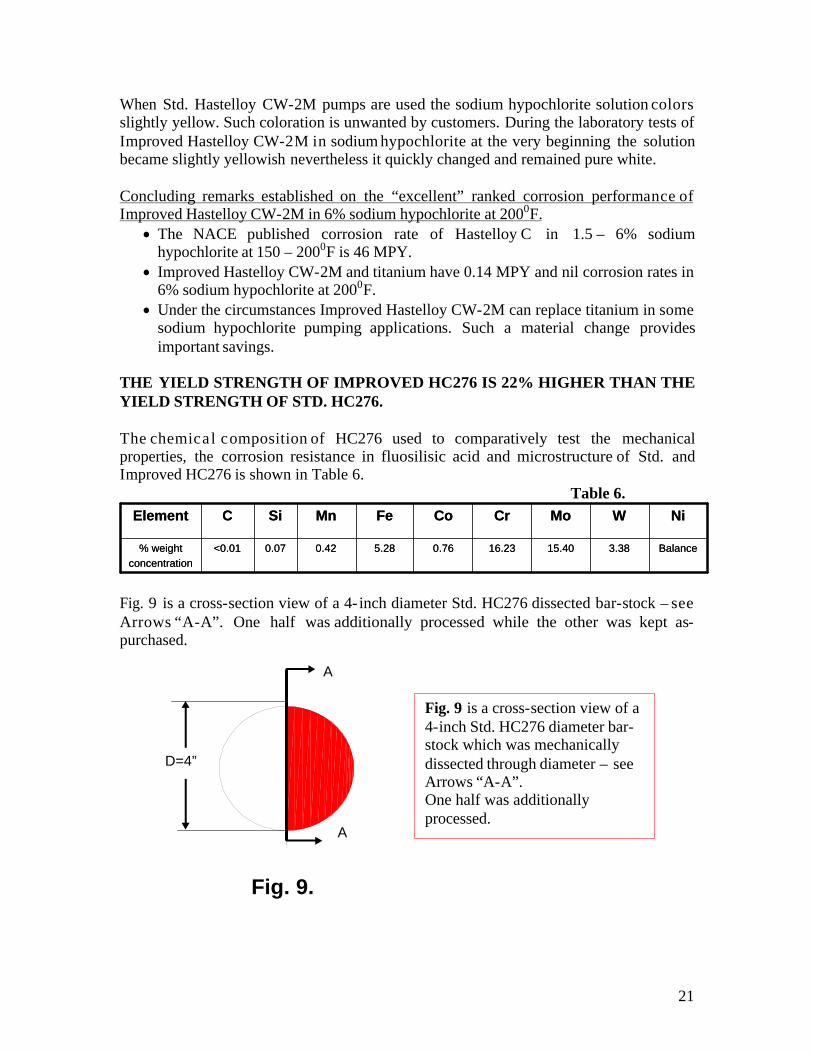
THE YIELD STRENGTH OF IMPROVED HC276 IS 22% HIGHER THAN THE YIELD STRENGTH OF STD. HC276. The chemical composition of HC276 used to comparatively test the mechanical properties, the corrosion resistance in fluosilisic acid and microstructure of Std. and Improved HC276 is shown in Table 6. Table 6. Fig. 9 is a cross-section view of a 4- inch diameter Std. HC276 dissected bar-stock – see Arrows “A-A”. One half was additionally processed while the other was kept as-purchased.
Balance3.3815.4016.230.765.280.420.07<0.01% weight
concentration
NiWMoCrCoFeMnSiCElement
Balance3.3815.4016.230.765.280.420.07<0.01% weight
concentration
NiWMoCrCoFeMnSiCElement
Fig. 9.
A
A
D=4”
Fig. 9 is a cross-section view of a 4-inch Std. HC276 diameter bar-stock which was mechanically dissected through diameter – see Arrows “A-A”. One half was additionally processed.
22
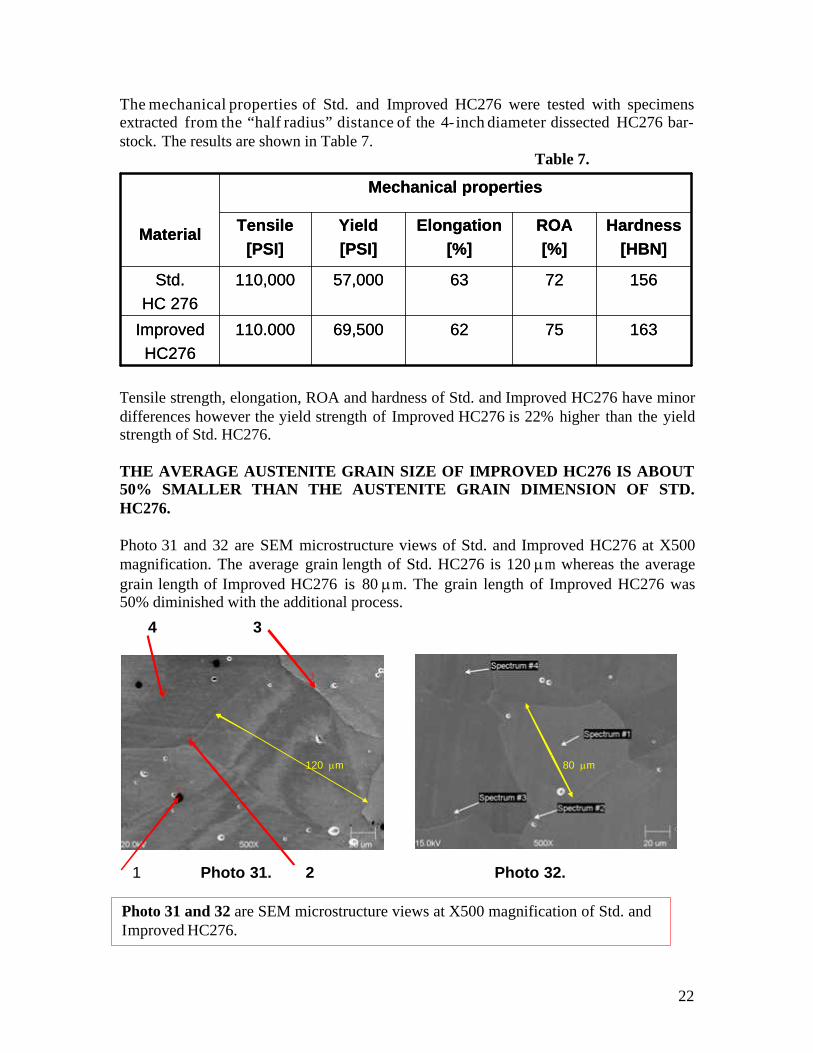
The mechanical properties of Std. and Improved HC276 were tested with specimens extracted from the “half radius” distance of the 4- inch diameter dissected HC276 bar-stock. The results are shown in Table 7. Table 7. Tensile strength, elongation, ROA and hardness of Std. and Improved HC276 have minor differences however the yield strength of Improved HC276 is 22% higher than the yield strength of Std. HC276. THE AVERAGE AUSTENITE GRAIN SIZE OF IMPROVED HC276 IS ABOUT 50% SMALLER THAN THE AUSTENITE GRAIN DIMENSION OF STD. HC276. Photo 31 and 32 are SEM microstructure views of Std. and Improved HC276 at X500 magnification. The average grain length of Std. HC276 is 120 mm whereas the average grain length of Improved HC276 is 80 mm. The grain length of Improved HC276 was 50% diminished with the additional process.
Photo 31 and 32 are SEM microstructure views at X500 magnification of Std. and Improved HC276.
163756269,500110.000Improved
HC276
156726357,000110,000Std.
HC 276
Hardness
[HBN]
ROA
[%]
Elongation
[%]
Yield
[PSI]
Tensile
[PSI]
Mechanical properties
Material
163756269,500110.000Improved
HC276
156726357,000110,000Std.
HC 276
Hardness
[HBN]
ROA
[%]
Elongation
[%]
Yield
[PSI]
Tensile
[PSI]
Mechanical properties
Material
Photo 31. Photo 32.1 2
4 3
120 mm 80 mm
23
Arrows “1” through “4” in Photo 31 and Arrows “Spectrum #1” through “Spectrum #4” in Photo 32 indicate the locations in which EDS – Energy Dispersive Spectroscopy – were performed. The selected points are located in the middle of the austenite grain, closed to the grain boundaries and at the grain boundaries. A total of eight chemical compositions were collected. The chemical composition ranges of molybdenum, chromium, nickel, iron and silicon of Std. and Improved HC276 are presented in Table 8. Table 8. The molybdenum, chromium, iron and silicon composition ranges of Std. and Improved HC276 are nearly identical however the nickel content range of Improved HC276 is significantly smaller. The difference between the upper and lower nickel content spread of Std. HC276 is 5.696%. This difference was diminished to 1.502% in Improved HC276 which indicates that Improved HC276 is a more homogenous alloy. Concluding remarks found on the higher yield strength, smaller grain size and chemical homogeneity conferred by Improved HC276.
· The comparative investigation of mechanical properties, grain size and chemical composition ranges between Std. and Improved HC276 were conducted on two half samples taken from a 4- inch diameter dissected bar-stock. One half had the additional process.
· The yield strength of Improved HC276 was 22% higher than the yield strength of Std. HC276. Tensile strength, elongation, ROA and hardness of the two materials have close values.
· The average austenite grain length of I mproved HC276 is 50% smaller than the average grain length of Std. HC276.
· Eight EDS analyses of Improved and Std. HC276 showed that the nickel content variation range was reduced from 5.696% to 1.502%. Since nickel the major element of every Hastelloy is homogenously distributed Improved HC276 is a better material than Std. HC276.
0.439
0.697
4.975
5.040
76.121
77.623
9.777
10.664
7.077
8.524
Improved HC276
Dif.=
0.203
Dif.=
0.426
Dif.=
5.696
Dif.=
0.555
Dif.= 0.695
Dif.=
0.258
Dif.=
0.065
Dif.=
1.502
Dif.=
0.887
Dif.=
1.447
0.488
0.691
4.603
5.029
70.570
76.266
10.241
10.796
7.754
8.449
Std. HC276
SiFeNiCrMo
Element ranges of eight EDS readings
[% weight]MATERIAL
24
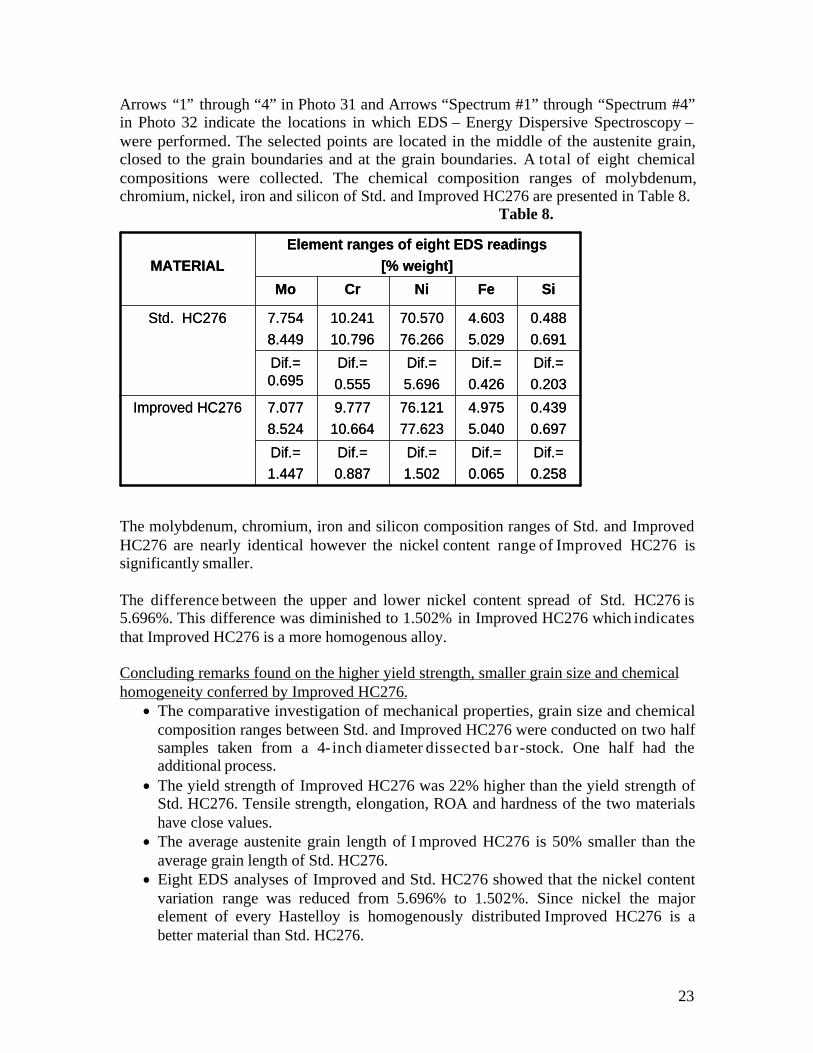
THE CORROSION RESISTANCE OF IMPROVED HC276 IS MULTIFOLD HIGHER UNDER LABORATORY AND SERVICE CONDITIONS THAN STD. HC276 AND HG30. Photo 33 shows a HG30 “rotary seal housing” which failed in service after 13 weeks. The pumping application was 20% fluosilisic acid at 1400F. According to the NACE published corrosion resistance t ables for this application the corrosion rate of HG30 is between 2 – 20 MPY which is ranked “very good”. However the service corrosion rate was much higher than 20 MPY. Arrow “A” shows a transgranular corrosion attack while Arrow “B” indicates an intergranular corroded line. Arrow “C” points to a corrosion roughened area produced through general corrosion. This “must solve problem” was approached by running a corrosion test of Improved and Std. HC276 in 20% fluosilisic acid at 1400F. After 72 hours of testing the corrosion rate of Improved HC276 was 6 MPY versus 45 MPY corrosion rate of Std. HC276. This renders a 7.5 lower corrosion rate of Improved HC276 over Std. HC276. Based on these results all the HG 30 parts were replaced with I mproved HC276. After 18 months of service the Improved HC276 pump parts continue to run successfully.
Photo 33 shows a returned HG30 “rotary seal housing” which miserable failed after 13
weeks in service.
AB C
Photo 33.
25
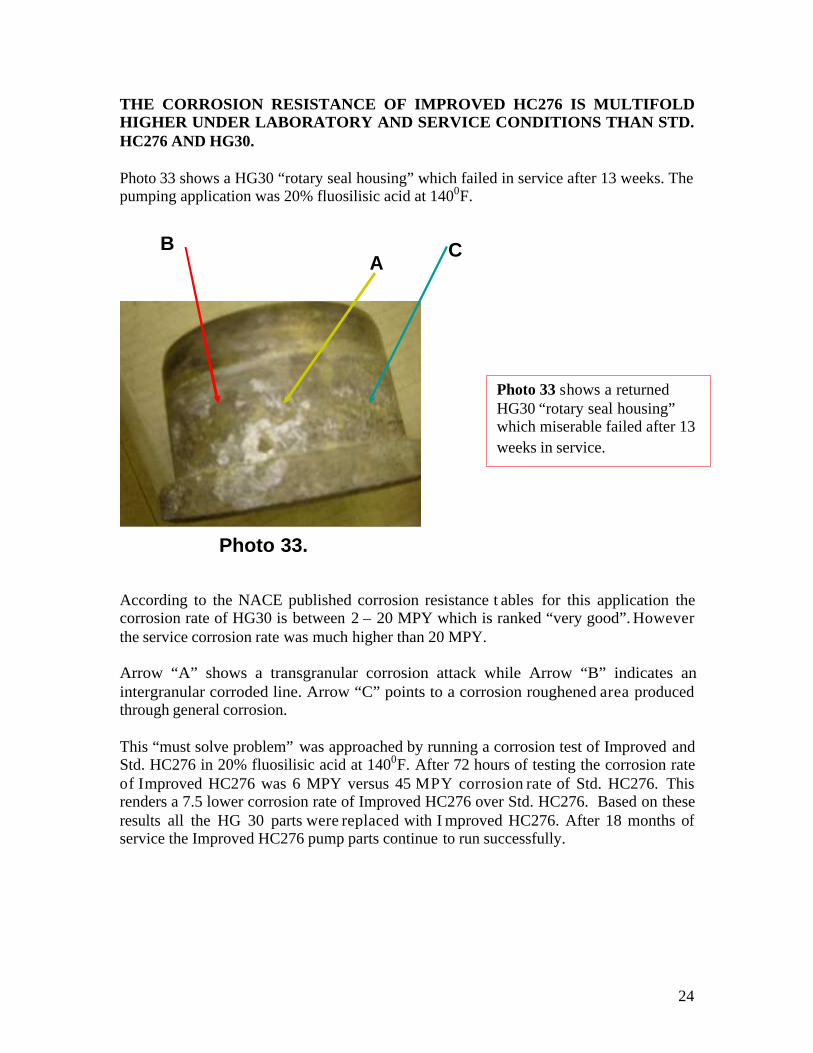
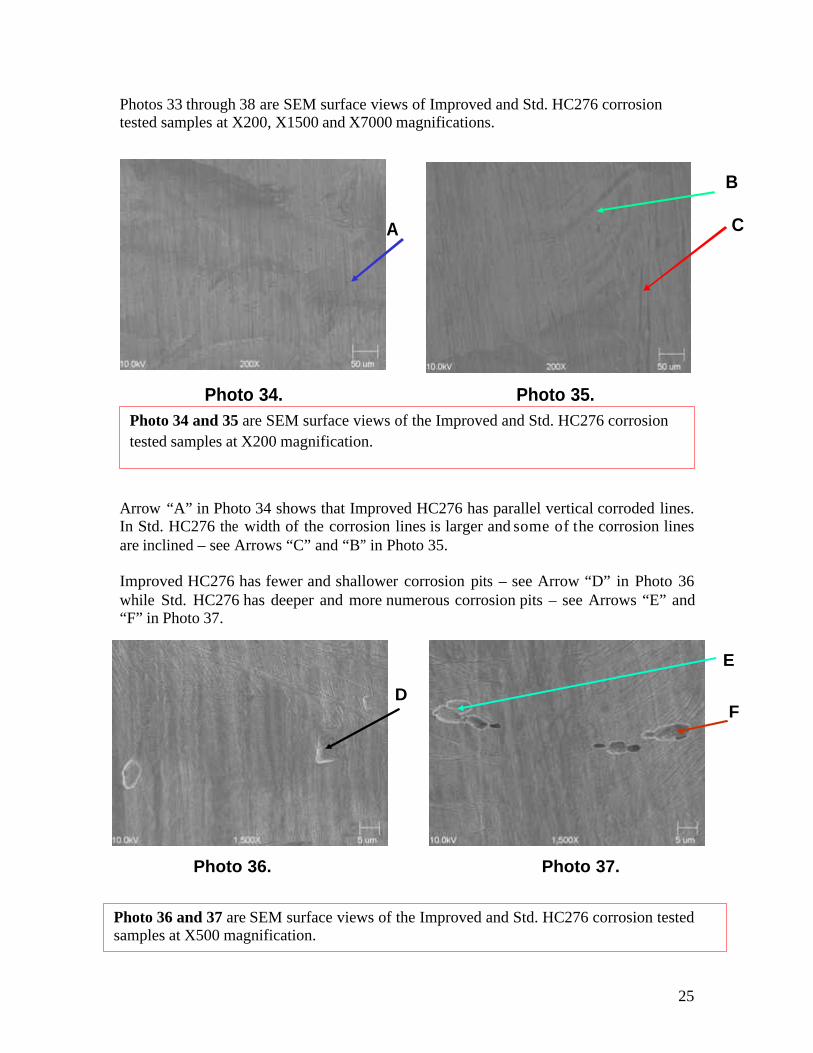
Photos 33 through 38 are SEM surface views of Improved and Std. HC276 corrosion tested samples at X200, X1500 and X7000 magnifications. Arrow “A” in Photo 34 shows that Improved HC276 has parallel vertical corroded lines. In Std. HC276 the width of the corrosion lines is larger and some of the corrosion lines are inclined – see Arrows “C” and “B” in Photo 35. Improved HC276 has fewer and shallower corrosion pits – see Arrow “D” in Photo 36 while Std. HC276 has deeper and more numerous corrosion pits – see Arrows “E” and “F” in Photo 37.
Photo 34 and 35 are SEM surface views of the Improved and Std. HC276 corrosion
tested samples at X200 magnification.
Photo 36 and 37 are SEM surface views of the Improved and Std. HC276 corrosion tested samples at X500 magnification.
Photo 35.Photo 34.
CA
B
Photo 37.Photo 36.
F
E
D
26
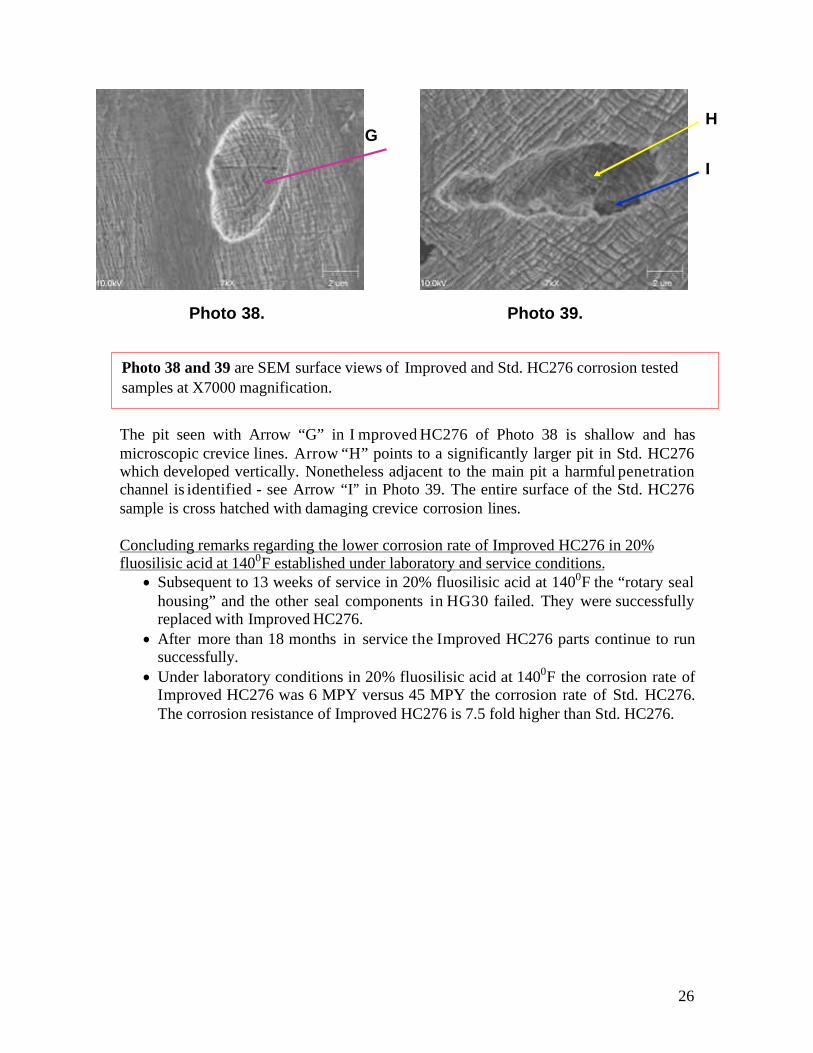
The pit seen with Arrow “G” in I mproved HC276 of Photo 38 is shallow and has microscopic crevice lines. Arrow “H” points to a significantly larger pit in Std. HC276 which developed vertically. Nonetheless adjacent to the main pit a harmful penetration channel is identified - see Arrow “I” in Photo 39. The entire surface of the Std. HC276 sample is cross hatched with damaging crevice corrosion lines. Concluding remarks regarding the lower corrosion rate of Improved HC276 in 20% fluosilisic acid at 1400F established under laboratory and service conditions.
· Subsequent to 13 weeks of service in 20% fluosilisic acid at 1400F the “rotary seal housing” and the other seal components in HG30 failed. They were successfully replaced with Improved HC276.
· After more than 18 months in service the Improved HC276 parts continue to run successfully.
· Under laboratory conditions in 20% fluosilisic acid at 1400F the corrosion rate of Improved HC276 was 6 MPY versus 45 MPY the corrosion rate of Std. HC276. The corrosion resistance of Improved HC276 is 7.5 fold higher than Std. HC276.
Photo 38 and 39 are SEM surface views of Improved and Std. HC276 corrosion tested samples at X7000 magnification.
Photo 38.
H
I
G
Photo 39.
27
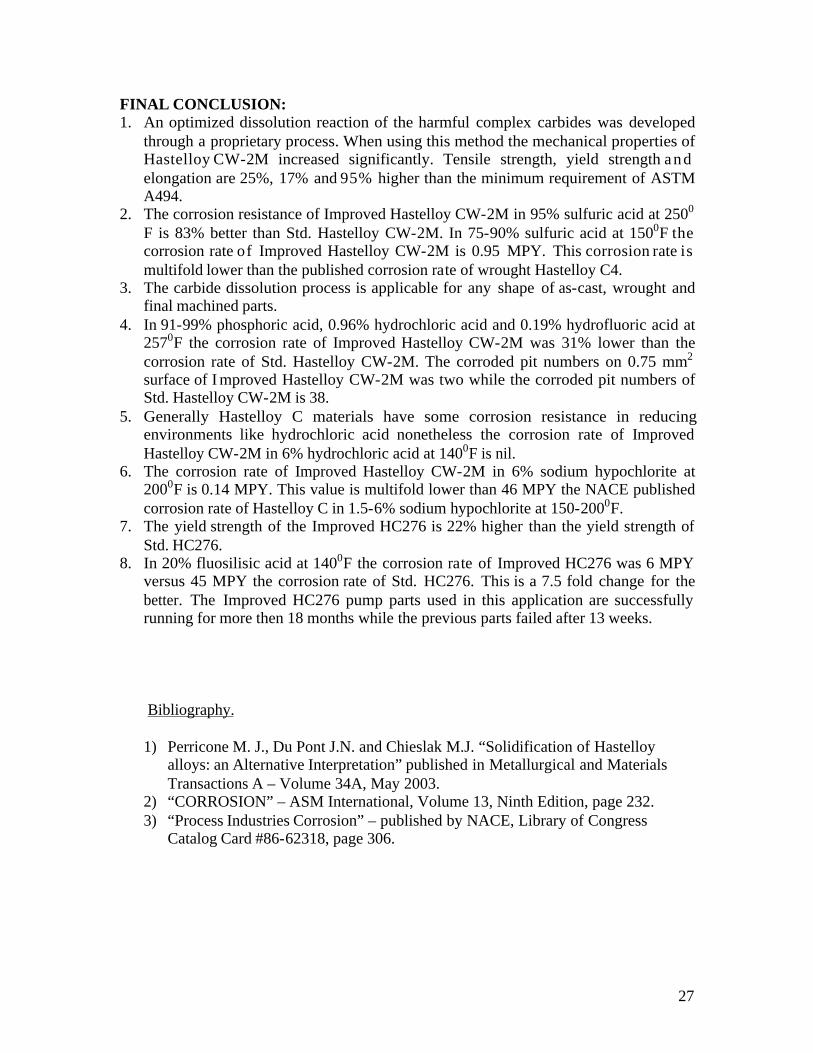
FINAL CONCLUSION: 1. An optimized dissolution reaction of the harmful complex carbides was developed
through a proprietary process. When using this method the mechanical properties of Hastelloy CW-2M increased significantly. Tensile strength, yield strength and elongation are 25%, 17% and 95% higher than the minimum requirement of ASTM A494.
2. The corrosion resistance of Improved Hastelloy CW-2M in 95% sulfuric acid at 2500 F is 83% better than Std. Hastelloy CW-2M. In 75-90% sulfuric acid at 1500F the corrosion rate of Improved Hastelloy CW-2M is 0.95 MPY. This corrosion rate is multifold lower than the published corrosion rate of wrought Hastelloy C4.
3. The carbide dissolution process is applicable for any shape of as-cast, wrought and final machined parts.
4. In 91-99% phosphoric acid, 0.96% hydrochloric acid and 0.19% hydrofluoric acid at 2570F the corrosion rate of Improved Hastelloy CW-2M was 31% lower than the corrosion rate of Std. Hastelloy CW-2M. The corroded pit numbers on 0.75 mm2
surface of I mproved Hastelloy CW-2M was two while the corroded pit numbers of Std. Hastelloy CW-2M is 38.
5. Generally Hastelloy C materials have some corrosion resistance in reducing environments like hydrochloric acid nonetheless the corrosion rate of Improved Hastelloy CW-2M in 6% hydrochloric acid at 1400F is nil.
6. The corrosion rate of Improved Hastelloy CW-2M in 6% sodium hypochlorite at 2000F is 0.14 MPY. This value is multifold lower than 46 MPY the NACE published corrosion rate of Hastelloy C in 1.5-6% sodium hypochlorite at 150-2000F.
7. The yield strength of the Improved HC276 is 22% higher than the yield strength of Std. HC276.
8. In 20% fluosilisic acid at 1400F the corrosion rate of Improved HC276 was 6 MPY versus 45 MPY the corrosion rate of Std. HC276. This is a 7.5 fold change for the better. The Improved HC276 pump parts used in this application are successfully running for more then 18 months while the previous parts failed after 13 weeks. Bibliography. 1) Perricone M. J., Du Pont J.N. and Chieslak M.J. “Solidification of Hastelloy
alloys: an Alternative Interpretation” published in Metallurgical and Materials Transactions A – Volume 34A, May 2003.
2) “CORROSION” – ASM International, Volume 13, Ninth Edition, page 232. 3) “Process Industries Corrosion” – published by NACE, Library of Congress
Catalog Card #86-62318, page 306.