Embed Size (px)
Citation preview

THE CORRELATION BETWEEN THE THREE READING FLUENCY SUBSKILLS
AND READING COMPREHENSION IN AT-RISK ADOLESCENT READERS
by
Craig Courbron
A Dissertation Presented in Partial Fulfillment
Of the Requirements for the Degree
Doctor of Education
Liberty University
April 28, 2012

THE CORRELATION BETWEEN THE THREE READING FLUENCY SUBSKILLS
AND READING COMPREHENSION IN AT-RISK ADOLESCENT READERS
by Craig Courbron
A Dissertation Presented in Partial Fulfillment Of the Requirements for the Degree
Doctor of Education
Liberty University, Lynchburg, VA April 28, 2012
APPROVED BY:
Lucinda S. Spaulding, Ph.D., Committee Chair
Melissa Lannom, Ed.D., Committee Member
Sharon Crawley, Ed.D., Committee Member
Scott B. Watson, Associate Dean Advanced Programs

ABSTRACT
The purpose of this study was to determine which of the three reading fluency subskills
were most strongly correlated with reading comprehension in adolescent at-risk readers.
The participants were 82 adolescent males (ages 13-19) who had been committed to a
juvenile detention facility. Archival data from a two-year period was collected from a
maximum security juvenile detention facility in a rural section of the Northeastern United
States. The Measures of Academic Progress test was used to collect reading
comprehension data; the Qualitative Reading Inventory-4 test was used to collect reading
speed and reading accuracy data; the Multidimensional Fluency Scale was used to collect
reading prosody data. The data was analyzed using a bivariate correlation analysis in
order to measure the strength of the correlations. The research revealed that the
relationship between reading speed and reading comprehension had an identical
correlation coefficient as the relationship between reading prosody and reading
comprehension; both correlations were significant and strong. The research also revealed
that reading accuracy and reading comprehension were only weakly correlated.
Keywords: reading, reading fluency, reading prosody, reading speed, reading accuracy,
reading comprehension, at-risk readers, adolescent readers, struggling readers,
incarcerated adolescents.

iv
Dedication
Colleen Courbron, my beautiful wife, has endured over four years of living with
me through this very frustrating process. She has supported me unconditionally. Never
once did she say, “put down the computer and spend time with me” or “is this really
worth all of this frustration and trouble?” She has selflessly sacrificed time together for
the sole purpose of seeing me succeed in this endeavor. For that, and for her, I am
eternally grateful.
Russell, Ryan, and Reagan, my three sons, have watched me stare at a computer
screen or the inside of a book for four years when I know they have wanted to have fun,
participate in father/son activities, and have my undivided attention. I will never be able
to make up for the time that was lost during these crucial developmental years, but I fully
intend to make it up to them for the remainder of my life. I love them all more than I can
say and more than I could, or ever have, shown. Part of the reason that I have pursued a
doctoral degree has been so that I could provide a better life for them than I had as a kid.
I have wanted to pave their way to success. My hope is that I have been a model of
persistence, hard work, finishing strong, and a commitment to excellence in all that you
do.
Phyllis Hawkes, my mother, is the reason that I am who I am. George
Washington said, “All I am I owe to my mother. I attribute all my success in life to the
moral, intellectual, and physical education I received from her.” My mother has endured
an unimaginably difficult life and has never complained. She gave up her own chance at
success; her considerable intelligence and talents were not used for personal gain, but to
ensure that her children had a chance to succeed. She held our family together when it
v
should have fallen apart. She never judged me, always loved me, and taught me the
values that I needed to internalize in order to overcome my obstacles. She modeled
spiritual richness and personal integrity in her daily life. Through oppressive poverty and
family illness, she made sure that we did not become socioeconomic statistics, but
functioning and successful members of society.

vi
Acknowledgement
Dr. Lucinda Spaulding, my dissertation chairperson, has displayed the patience of
a saint in her guidance of my dissertation process. I know that I get easily frustrated and
angry, and occasionally have a negative attitude. She was able to look past those things
and keep me focused on the task at hand. Her feedback was always speedy, thoughtful,
and insightful. Her willingness to take over as my chairperson after the death of Dr.
Jones was a Godsend for me. For her guidance, I am very thankful. Without it, I surely
would have not finished.
Dr. Jill Jones, my original dissertation chairperson, saw in me what I could not
even see in myself. After her death, I heard several stories about how she bragged about
me and how she told others about how successful I was going to be. Much of my drive to
finish this process came from wanting to meet those expectations. The day that Dr.
Watson sent me the email that she had passed away was one of the most horrible days of
my life. It’s hard for me to love, but I love her for what she did for me in terms of self-
confidence and motivation to succeed.
Dr. Melissa Lannom and Dr. Sharon Crawley, my dissertation committee
members, have provided excellent feedback regarding the content of my topic through
the many changes that have occurred along the way. Their support and encouragement
has been greatly appreciated.
Donna V., Kelly, Tracy, Todd, Donna P., Kristi, Leigh Ann, Phillip, Debra,
Rodney, and Lorene, my friends throughout this process. Each of you means the world to
me. We promised to get each other through this process despite the obstacles we have

vii
had placed in our paths, and we are almost there. Thank you from the bottom of my heart
for looking past my plethora of faults and making me feel like I was part of such an
amazing group of people. I will love you guys forever.

viii
Table of Contents
Dedication .................................................................................................................................................. iv
Acknowledgement ................................................................................................................................... vi
Table of Contents.................................................................................................................................. viii
List of Tables ............................................................................................................................................ xi
List of Figures .......................................................................................................................................... xii
Abbreviations ......................................................................................................................................... xiii
CHAPTER ONE: INTRODUCTION................................................................................................. 1
Overview of the Study ...................................................................................................................................... 1
Background to the Study ............................................................................................................................ 1
Rationale for Research ................................................................................................................................ 3
Trends ................................................................................................................................................................ 5
Developments ................................................................................................................................................. 6
Problems ................................................................................................................................................................ 8
Societal Developments ................................................................................................................................... 11
Problem Statement .......................................................................................................................................... 12
Purpose Statement ........................................................................................................................................... 14
Significance of the Study ................................................................................................................................ 15
Research Questions and Hypotheses ....................................................................................................... 15
Research Hypotheses in Null Form ........................................................................................................... 16
Explanation of Research Hypotheses ....................................................................................................... 17
Identification of Variables ............................................................................................................................. 18
Definition of Terms .......................................................................................................................................... 19
CHAPTER TWO: REVIEW OF LITERATURE ....................................................................... 21
Introduction ........................................................................................................................................................ 21
Theoretical Framework ................................................................................................................................. 22
Research Process .............................................................................................................................................. 25
Adolescents and Reading .............................................................................................................................. 26
Incarcerated Adolescents and Reading ................................................................................................... 29
Five Elements of Reading .............................................................................................................................. 32
Fluency: Exploring One Specific Reading Variable ............................................................................. 33
History ............................................................................................................................................................. 33
Definition of Reading Fluency ................................................................................................................ 34
The Fluency Number ....................................................................................................................................... 43
Fluency Problems: Intervention and Prevention ................................................................................ 46
How Fluency’s Three Subskills Impact Reading Comprehension ................................................ 52
Speed ................................................................................................................................................................ 53
Accuracy .......................................................................................................................................................... 53
Prosody ............................................................................................................................................................ 54
Reading Comprehension: .............................................................................................................................. 54
An Examination of the Act of Understanding What is Read............................................................ 54

ix
History ............................................................................................................................................................. 55
Definition of Reading Comprehension ............................................................................................... 56
Overarching Components of Reading Comprehension ............................................................... 56
Problems With Reading Comprehension .......................................................................................... 58
Reading Comprehension: Prevention and Intervention ............................................................. 60
Other Factors That Influence Reading Comprehension .............................................................. 62
Conclusion ........................................................................................................................................................... 77
CHAPTER THREE: METHODOLOGY ....................................................................................... 79
Introduction to the Study .............................................................................................................................. 79
Research Design ................................................................................................................................................ 79
Participants ......................................................................................................................................................... 82
How the Number of Archival Data Sets Was Chosen ......................................................................... 88
Setting .............................................................................................................................................................. 89
Instrumentation ................................................................................................................................................ 90
Reading Rate Instrument ......................................................................................................................... 90
Reading Accuracy Instrument ................................................................................................................ 93
Text Difficulty ............................................................................................................................................... 94
Reading Prosody Instrument ................................................................................................................. 96
Reading Comprehension Instrument .................................................................................................. 97
Procedures .......................................................................................................................................................... 98
Permissions ................................................................................................................................................... 98
Gathering QRI-4 Reading Rate and Reading Accuracy Scores .................................................. 99
Gathering MFS Scores ............................................................................................................................. 100
Gathering MAP, Reading Comprehension Subtest Scores ....................................................... 101
Archival Data Collection Procedures ..................................................................................................... 102
Data Organization .......................................................................................................................................... 103
Data Analysis ................................................................................................................................................... 104
Rationale for Type of Data Analysis.................................................................................................. 104
Analysis of Hypothesis 1 ....................................................................................................................... 105
Analysis of Hypothesis 2 ....................................................................................................................... 106
Analysis of Hypothesis 3 ....................................................................................................................... 107
Analysis of Hypothesis 4 ....................................................................................................................... 108
Issues with Data Analysis ........................................................................................................................... 109
Outliers ......................................................................................................................................................... 110
Normality ..................................................................................................................................................... 110
Linearity ....................................................................................................................................................... 111
Homoscedasticity ..................................................................................................................................... 111
Summary ........................................................................................................................................................... 112
CHAPTER FOUR: FINDINGS ...................................................................................................... 113
Results ................................................................................................................................................................ 113
Descriptive Data........................................................................................................................................ 113
Assumption Testing ................................................................................................................................ 114
Data Analysis for Research Hypothesis 1 ............................................................................................ 123
Research Hypothesis 1 ........................................................................................................................... 123
Null Hypothesis 1 ..................................................................................................................................... 123
Results........................................................................................................................................................... 123

x
Data Analysis for Research Hypothesis 2 ............................................................................................ 123
Research Hypothesis 2 ........................................................................................................................... 124
Null Hypothesis 2 ..................................................................................................................................... 124
Results........................................................................................................................................................... 124
Data Analysis for Research Hypothesis 3 ............................................................................................ 124
Research Hypothesis 3 ........................................................................................................................... 124
Null Hypothesis 3 ..................................................................................................................................... 125
Results........................................................................................................................................................... 125
Data Analysis for Research Hypothesis 4 ............................................................................................ 125
Research Hypothesis 4 ........................................................................................................................... 125
Null Hypothesis 4 ..................................................................................................................................... 125
Results........................................................................................................................................................... 126
Summary ........................................................................................................................................................... 127
CHAPTER FIVE: DISCUSSION ................................................................................................... 129
Summary of the Findings ........................................................................................................................... 129
Research Hypothesis 1 ........................................................................................................................... 129
Research Hypothesis 2 ........................................................................................................................... 130
Research Hypothesis 3 ........................................................................................................................... 130
Research Hypothesis 4 ........................................................................................................................... 130
Discussion and Implications ..................................................................................................................... 130
Recommendations ........................................................................................................................................ 134
Recommendations for Practical Applications .............................................................................. 135
Recommendations for Future Research ......................................................................................... 136
Delimitations, Limitations, and Assumptions .................................................................................... 139
Delimitations .............................................................................................................................................. 139
Limitations .................................................................................................................................................. 141
Assumptions ............................................................................................................................................... 147
Conclusion ........................................................................................................................................................ 148
References.............................................................................................................................................. 149
Appendix A ........................................................................................................................................... 178
Appendix B............................................................................................................................................ 179
Appendix C............................................................................................................................................ 183
Appendix D ........................................................................................................................................... 185
Appendix F ............................................................................................................................................ 194

xi
List of Tables
Table 1…………………………………………………………………………………...85
Table 2………………………………………………………………………………...…89
Table 3………………………………………………………………………...………..103
Table 4………………………………………………………………………………….115
Table 5………………………………………………………………………………….128

xii
List of Figures
Figure 1……………………………………………………………..................................44
Figure 2…………………………………………………………………………………116
Figure 3…………………………………………………………………………………117
Figure 4…………………………………………………………………………………118
Figure 5…………………………………………………………………………………119
Figure 6…………………………………………………………………………………121
Figure 7…………………………………………………………………………………122
Figure 8…………………………………………………………………………………123

xiii
Abbreviations
NCLB: No Child Left Behind
QRI-4: Qualitative Reading Inventory-4
MFS: Multidimensional Fluency Scale
MAP: Measures of Academic Progress
AYP: Adequate Yearly Progress
WCPM: Words Correct Per Minute
NRP: National Reading Panel
NRPR: National Reading Panel Report
RD: Reading Disability
RIT: Rausch Unit

1
CHAPTER ONE: INTRODUCTION
Overview of the Study
Background to the Study
The importance of fluent reading to overall reading success is unquestioned
(Schwanenflugel, Meisinger & Wisenbaker, 2006). Additionally, the detrimental effects
of disfluency are also well accepted. Whithear (2011) stated, “Correlational evidence
suggests that a lack of fluency contributes to poor comprehension and this has
ramifications for a struggling reader in the secondary setting” (p. 1). Yet, the strength of
the relationship between the three fluency subskills and the development of reading
comprehension is not known. The purpose of this study was to determine the relationship
between the three fluency subskills and reading comprehension in at-risk adolescent
readers. This determination was made by calculating the correlation coefficients between
reading speed and reading comprehension, reading accuracy and reading comprehension,
and reading prosody (the pace, smoothness, expression, attention to textual clues, and
suprasegmental ability with which one reads) and reading comprehension. This study
was a first step towards linking individual subskills of fluency with reading
comprehension ability. It was only a first step because a significant degree of correlation
is necessary to assume causation, but not sufficient to do so by itself (Ary, Jacobs,
Razavieh, & Sorensen, 2006). Now that the correlation coefficients have been
determined, further studies can be conducted to analyze the likelihood of actual
causation.

2
The archival data being analyzed was created during the educational testing of at-
risk adolescents (ages 13-19) who are current and former residents of a maximum
security juvenile prison in a rural area of the Northeastern United States. Not all of the
participants had identified reading disabilities or were classified as special education, but
all were classified as at-risk. The target participants were identified as “at-risk” by
enrollment in the prison’s education program, which by definition serves only at-risk
adolescent readers. Full sets of archival data were available for 82 residents; this is an
adequate number of participants to conduct a thorough and statistically significant
correlation study (Ary et al., 2006; Tabchnick & Fidell, 2001). The sample pool
consisted almost entirely (95.1%) of Caucasian, English-speaking males. However, the
sample was consistent with the racial composition of the fourteen counties that the target
facility serves, which was 94.9%, according to United States Census Bureau (2010)
estimates. Even with these demographical limitations, the research was able to provide
valuable insights into ways reading teachers can more effectively and efficiently address
adolescent reading difficulties. Further research can now be conducted to expand the
scope of the participants being studied, examine causation, and either confirm or reject
the initial findings of this study.
At-risk adolescent males, the participants in this study, are particularly difficult to
remediate for a number of reasons. They have often experienced reading failure
consistently over the course of their entire academic experience, they are generally
resistant to any type of direct instruction or intervention, and they often do not see the
value in learning to improve (or do not have the motivation to improve) their reading
skills (Bintz, 1993; Gutherie & Humenick, 2004). In addition to the problems faced by

3
the average adolescent reader, the participants in this study have typically experienced
problems that are endemic to adolescent at-risk students, including reading disabilities,
socioeconomic obstacles, and psychiatric disorders.
The overview sets the stage for the research by providing background on the
societal and educational framework for the study, expressing the significance of the
research, and stating the research questions and hypotheses. Chapter Two examines the
literature surrounding the subject of at-risk adolescent reading. The review of literature
discusses the study’s theoretical framework and investigates many primary and secondary
sources in order to build a foundation upon which the current research can rest. Chapter
Three describes the study’s methodology. It examines the design, instrumentation, and
statistical methods that will be utilized during the course of the study. Chapter Four
displays the results of the statistical analyses. Chapter Five discusses those results and
their implications in light of the relevant literature.
Rationale for Research
With the publication of the National Reading Panel Report (NRPR, 2000),
reading teachers, reading specialists, and reading researchers switched their focus from
failed whole language approaches to the five elements identified in the study as
fundamental reading components: phonemic awareness, phonics, fluency, vocabulary,
and comprehension. The meta-analysis (comprised of the five reading component
subgroups) results found that successful reading instruction and intervention should be
systematic, structured, and involve direct instruction at every level (National Institute for
Child Health and Human Development [NICHHD], National Institute for Literacy,
2000). Over the course of the following decade, the least studied of these five reading

4
components has been fluency, especially as it relates to adolescent literacy. Because the
relationship between fluent reading and adequate comprehension has been found by
multiple authors (Fuchs, L., Fuchs, D., Hamlett, Walz, & Germann, 1993; Fuchs, L.,
Fuchs, D., Hosp, & Jenkins, 2001; Jenkins, Fuchs, Espin, van den Broek, & Deno, 2000;
Paige, 2011; Pinnell, Pikulski, Wixson, Campbell, Gough, & Beatty, 1995; Reutzel &
Hollingsworth, 1993; Yovanoff, Duesbery, Alonzo, & Tindal, 2005) to be a significant
link that distinguishes proficient readers from poor readers, identifying methods of
remediating reading fluency difficulties has become an important issue, and one that
incites a great deal of debate amongst reading experts. It seems logical to look for
answers to remediation by exploring reading speed, reading accuracy, and reading
prosody, the three subskills that comprise fluent reading. Just as logical is to investigate
which of those fluency subskills have some influence on reading comprehension. This is
the approach that was taken in this study in order to ascertain which fluency subskills
most strongly correlate with reading comprehension-the ultimate goal of all reading
instruction and intervention.
Once the elements of reading fluency most strongly associated with reading
comprehension were identified, adolescent reading instruction and remediation could be
more focused on those specific factors and skills so teachers do not waste time addressing
fluency skills that do not actually influence reading comprehension, or only impact it
marginally. Understanding how certain aspects of fluency interact with reading
comprehension also gives teachers a better understanding of how variables that seem to
be only peripherally related to reading success can actually impact reading more directly.

5
An interesting aspect of this research was the ability to focus on reading-related,
rather than life-related, variables. Past studies have looked at various combinations of
life variables (Klauda & Guthrie, 2008; McCollin, O’Shea & McQuiston, 2010; Rupley,
Willson, & Nichols, 1998; Wu & Hu, 2007) in order to ascertain their relationship to
comprehension. However, after an extensive literature search that included the search
terms mentioned in chapter one, no studies were found that have deconstructed fluency to
determine which parts of fluency are most correlated with reading comprehension, as this
research did. Since reading teachers have the ability to positively influence a student’s
fluency skills (and all of fluency’s subskills) if given the knowledge and tools to do so,
this research is potentially more practical than research that has investigated variables
over which teachers of reading have no control.
Trends
Reading and literacy contribute to academic success (Burns, Griffin, & Snow,
1999; NRPR, 2000), and strong reading comprehension predicts performance on
achievement tests (Allington, 2002). Despite these findings, the efforts of No Child Left
Behind (NCLB, 2001), and the implementation of recommendations made by the NRPR
(2000), the ability of adolescents to read is still in a precipitous decline. According to
Rasinski (2003b), the decline is evident in the standardized reading test score results, the
growth of remedial reading classes in colleges, and the anecdotal evidence of teachers
and parents across the country. The high school graduation rate in the United States has
dropped steadily to a mere 70%, and approximately 5-10% of high school juniors read
below the fourth grade level (Wise, 2009). Compounding the problem is the lack of
funding for high school reading instruction, instructors, and remediation. Little money is

6
available for hiring secondary-level literacy specialists or reading teachers because Title I
and state funds marked for school improvement go mostly (65%) to elementary schools
(United States Department of Education, 2011).
The resultant gap in services between elementary and secondary at-risk readers
creates a Matthew Effect (Ary et al., 2006; Stanovich, 1986), whereby students who are
behind in reading in the early school years fall further behind as their school careers
progress. Such inequities naturally lead to adolescents graduating without necessary
reading skills, and subsequently remaining deficient in reading throughout life. This
trend can be reversed, but is not being dealt with properly on a number of important
levels, such as funding, staffing, programming, and remediation.
These general problems have answers; difficult ones, but answers nonetheless.
The general problems in reading acquisition provide a backdrop for the difficulties in the
even more specialized field of reading fluency. The subfield of reading fluency presents
many unique and complex challenges for the school personnel who deal with adolescent
readers and their complicated reading struggles (Hudson, Pullen, Lane, & Torgesen,
2009). The overall reading failures experienced by adolescents are currently shaping
research and development in the field of adolescent reading (Fisher, 2008; Fisher & Ivey,
2006; Hock et al., 2009; NRPR, 2000; Rasinski et al., 2005; Schifini, 2002).
Developments
Malmgren and Trezek (2009) said, “Professional literature and discourse . . . has
long overlooked the importance of literacy instruction at the secondary level, particularly
for adolescents who struggle with reading” (p.1). Those who have a stake in advancing
knowledge about adolescent reading (college professors, researchers, governmental
7
agencies, school districts, administrators, and teachers) have increased research efforts in
an attempt to hurdle the obstacles they face in regards to struggling adolescent readers.
This increase in research efforts has resulted in many new theories, practices, and
programming models that have served as the foundation for contemporary intervention
developments and programs that will benefit adolescent readers and teachers of
adolescent reading. For example, some secondary-level schools are now employing at
least one reading specialist. The employment of reading specialists is a logical
development, considering that approximately 25% of high school students in the United
States cannot read at a basic level (Phillips, 2005). Until recently, reading specialists and
reading coaches served almost exclusively in elementary schools. However, with the
increasingly difficult standards faced by adolescent students, it is now imperative that
they have access not only to adequate reading instruction in the content areas, but
remediation of basic reading skills when it is deemed necessary. Again, funding has been
a problem, especially in a time when schools everywhere face draconian budget cutbacks.
Despite this inadequate funding, schools are being forced to address the reading issues of
struggling adolescent students in substantial ways, including adding reading intervention
staff to high school faculties.
Another rather recent development in reading research that holds the potential to
fundamentally alter what reading instructors teach, how they teach it, and to whom it is
taught, is brain research. Brain research is showing more and more conclusively that
even readers with disabilities can be remediated with intensive fluency interventions
given at the right time, using appropriate materials, and with the correct amount of
intensity (Fisher, 2006; Wexler, Vaughn, Edmonds, & Reutebuch, 2007; Wilson, 2004;

8
Wilson, 2006). This new knowledge is permeating the concept of Response to
Intervention (RTI). RTI (United States Department of Education, 2004) seeks to
remediate reading difficulties as soon as they are discovered with research-based and
intensive intervention, thus eliminating the need for special education referrals, which
inevitably result when remediation is not early enough or intense enough (Mokhtari,
Porter, & Edwards, 2010). No longer can administrators or teachers disregard the needs
of the student who appears unable to learn to read. They are now forced to deal with
reading-deficient students because brain research shows that reading improvement is a
definite possibility for the at-risk population. Even the dyslexic adolescent struggling
reader can be taught to learn to read more effectively if the correct parts of the brain are
being stimulated (Shaywitz, 2003). Brain research holds especially exciting promise for
reading fluency.
Problems
The paucity of funding for literacy materials and literacy specialists in secondary
schools is not the only barrier to increasing the reading ability of adolescent struggling
readers. The reluctance of secondary-level content area teachers to deal with reading
issues is an enormous problem for secondary administrators who desire to implement
reading improvement programs in their schools. Secondary teachers often openly rebel
against the implementation of reading improvement programs because they feel their
students should arrive at the secondary level as proficient readers; even if they do not
rebel, they do not feel qualified or responsible to meet reading needs (Ness, 2009). The
fallacy of this type of thinking is summarized by Phillips (2005) in the following
statement:

9
If students two to three grade levels behind their peers do not receive
intensive literacy instruction, the results can be devastating because the
struggling reader will not experience success within the content areas.
Therefore, it becomes even more critical that secondary content area
teachers better understand and teach specific literacy strategies to help
students read and extract meaning from the written material used to teach
the course content. (p. 2)
Often, teachers’ job performance evaluations, and in some districts even salary,
are tied to how well their students perform on the standardized tests in the content area
that they teach. The uninformed content area teacher must begin to realize that if a
student cannot read the textbook with appropriate fluency and comprehension, the chance
of passing a timed standardized test on that content area’s material is significantly
diminished.
The tension between content area teachers and administrators in regards to
addressing reading in the content area is often a function of a separate problem-lack of
teacher training. Karlin (1969) contended that secondary content area teachers often feel
that they are not responsible for teaching reading because of the lack of qualified reading
teachers and directors of reading at that level. Many high school teachers do not even
realize that secondary students can benefit from instruction in reading, therefore they
obviously do not see themselves as reading teachers (Jackson, 1979). High school
teachers rarely take classes or participate in trainings on how to teach reading in the
content area or how to recognize specific reading problems that need to be referred for
intervention. The National Council on Teacher Quality (2006) found that “only 14

10
percent of education schools require courses that teach the basic components of good
reading instruction” (p. 31). Thus, the graduates of those programs feel unqualified to
address reading in the secondary classroom setting, even when they recognize a potential
problem (Ness, 2009). Preparation of content area teachers for reading instruction and
intervention is an issue that must be dealt with by college departments of education and
state teacher certification boards. Those two entities must demand that teacher
candidates be qualified to recognize and remediate reading deficiencies, whether they are
reading teachers or not.
Another problem is that students who cannot read fast enough (or with enough
accuracy and prosody) to follow along with the increasingly rapid pace of secondary
classroom reading quickly become frustrated and disinterested. Subsequently, their
grades suffer because they have not had the same access to, or understanding of, the
material (stories/expository text) that the other students have had. They are effectively
excluded from classroom instruction because of their reading fluency deficiencies.
Conversely, students who can keep up with the speed of the classroom reading can make
connections to the text and relate the text to prior background experiences as they read.
When combined with the problem of secondary teachers who do not, or cannot, teach
reading, the results of inadequate reading fluency are devastating to secondary struggling
readers. That is why the three fluency subskills (reading speed, reading accuracy, and
reading prosody) are the focus of this study.
The overwhelming response to the pervasiveness of adolescent struggling readers
has not been a call for an increase in reading intervention or reading classes, but rather a
decrease in the difficulty of texts so that the students can access the material. This

11
demand began as early as 1940 and continues in the present day (Chall, 2006). Scaling
back content is currently considered an acceptable alternative to teaching adequate
reading skills. According to Chall, textbooks designed for 12th grade students are most
often written at a 9th grade reading level. Unfortunately, the natural consequence of
reducing the semantic difficulty and syntactic complexity of texts is the inability to
perform proficiently on standardized tests, which are written at grade level. Another
consequence is the perpetuation of reading difficulties in later grades or in college
because the root problems did not receive appropriate attention and effective remediation.
Reading standards are once again on the rise due to the influence of NCLB (2001) and
the Common Core Standards (National Governor’s Association, 2011), but the rebound is
slow because of the aforementioned obstacles.
Societal Developments
Accountability is a buzzword that has permeated American society, influencing
everything from politics, to business, to education. In the education world, accountability
is the accepted euphemism for making sure local schools and entire school districts pass
the adequate yearly progress (AYP) guidelines set by NCLB (2001). The focus on
accountability especially influences reading because the ability to read proficiently has a
direct impact on how well a student can perform on tests in all subject areas, not just the
reading portions. Reading is the essential skill that allows access to test content in the
other academic areas. Therefore, reading instruction, remediation, materials, theories,
and research has been scrutinized like never before. Education stakeholders acknowledge
that when reading problems begin to decline, scores will increase proportionally (NCLB,
2001).

12
However, the push for accountability overlooks the reality that many poor
readers, especially adolescent at-risk readers, arrive at school each day with oppressive
problems ranging from hunger to abuse. These problems are in addition to the normal
stress that comes with being an adolescent, a fact that was first recognized in Hall’s
(1904) foundational work Adolescence. No amount of accountability and no number of
new laws are going to convince a child in these circumstances to worry about their
reading behavior. Maslow (1943) made it clear that unless basic needs are met, learning
will not occur. The increasing prevalence of students who arrive at school each day with
unmet basic needs is a societal development that makes teaching reading a much more
difficult task. That is why the literature review section includes a discussion of how
socioeconomic factors (environmental factors) may significantly impact reading
comprehension.
Humans develop by learning (Piaget, 1969). American society as a whole now
recognizes, and even verbalizes, that development in life, regardless of the endeavor, is
largely dependent upon the ability to read fluently and comprehend (Reis & Fogarty,
2006; Swick, 2009). Thus, it is not just NCLB (2001) that forces schools to make
reading a priority; it is society as a whole that now points to reading as a key factor in a
successful, fulfilling life.
Problem Statement
Struggling readers are most easily identified by their reading disfluency (Hudson,
Lane, & Pullen, 2005). Profiles of secondary level struggling readers frequently identify
fluency, as opposed to decoding, comprehension, or any other reading component, as
their weakest skill (Hock et al., 2009). It is not uncommon for students to enter high

13
school on grade level and see their reading fluency remain stagnant, or even decrease,
over their final four years of school (Lenters, 2006). While the ability to read fluently
generally increases exponentially in elementary school, its growth is sluggish in middle
school, and stagnates or declines in high school, often resulting in reading apathy and
disengagement from the reading process (Strommen & Mates, 2004).
Even students who enter high school reading at grade level often fall away from
the standard due to their inability to read fluently enough to keep up in class or
comprehend what they read outside of class. Seventh, eighth, and ninth grade struggling
readers become slightly frustrated, but by grades ten and eleven, the frustration has often
developed into hopelessness. Lack of fluency is the major reason why this occurs. High
school students that “require significantly more time to accomplish any reading
assignment than do students who read at a normal reading rate . . . will be frustrated,
avoid reading, and, ultimately, fail in school” (Rasinski et al., 2005, p. 22).
The knowledge that reading fluency is a progressively worsening problem for
adolescent readers is not enough. It is more important for educators to know which of the
three fluency subskills (reading speed, reading accuracy, and reading prosody) most
influence reading comprehension, because reading comprehension is the ultimate goal of
all reading skill instruction. Once it is known which of the three fluency subskills most
impact reading comprehension, more informed and focused instruction and intervention
can be developed and implemented.
Reading proficiency is much more of a recent topic of discussion than it has been
in the past. The average parent now understands the importance of the ability to read
well. Adequate reading skill is especially important for students who are identified as at-

14
risk. Students who are identified as at-risk are often poor readers, and poor readers are
disproportionately represented in juvenile detention facilities in this country (Christle &
Yell, 2008). Reading success for adolescent at-risk readers is an important topic that
every parent, teacher, and political entity must endeavor to fully understand. This study
seeks to improve that understanding through examination of how the three fluency
subskills relate to reading comprehension.
Purpose Statement
The purpose of this correlational study was to use archival data to examine the
relationship between reading speed and reading comprehension, reading accuracy and
reading comprehension, and reading prosody (the pace, smoothness, expression, attention
to textual clues, and suprasegmental ability with which one reads) and reading
comprehension in at-risk adolescents (ages 13-19) at a maximum security juvenile prison
in the Northeastern United States. The fluency variables of interest are (a) reading speed,
generally defined as how many words are read correctly in one minute, (b) reading
accuracy, generally defined as how many words are read correctly as a percentage of the
number of total words read, and (c) reading prosody, generally defined as how smoothly
one reads. Bivariate correlational analyses were conducted to examine the relationship
between each of these fluency subskills and reading comprehension, generally defined as
how well one understands what is being read. Understanding the relationship between
these variables enables reading specialists to make reading intervention for at-risk
adolescents more focused, efficient, and effective. This more focused, efficient, and
effective approach to reading intervention will be possible because the results of the

15
quantitative analyses have indicated which of the three fluency subskills most highly
correlates with reading comprehension.
Significance of the Study
The significance of the study is twofold: First, classroom teachers, who have
limited time for intervention, will be able to direct that time toward the fluency variable
that had the largest impact on comprehension. Thus, it decreases wasted class time,
which is imperative when trying to prepare students for yearly exams. For example, if a
reading intervention specialist discerns that a student is struggling with comprehension
because of inadequate reading speed, he or she will know how to intervene in the most
effective and efficient manner, given the amount of time and resources available.
Secondly, it also added another piece of information to the growing, but still inadequate,
body of knowledge on adolescent reading instruction and intervention. Reading is a very
complex and multifaceted operation that has tentacles reaching back into early childhood,
and covers every dimension of the student’s life from that point onward.
Research Questions and Hypotheses
This study examined the following research questions:
1. Is there a statistically significant relationship between reading prosody (as
measured by the Multidimensional Fluency Scale [MFS]) and reading
comprehension (as measured by the Measures of Academic Progress
[MAP]) in at-risk adolescent readers?
2. Is there a statistically significant relationship between reading speed (as
measured by the Qualitative Reading Inventory-4 [QRI-4]) and reading
comprehension (as measured by the MAP) in at-risk adolescent readers?

16
3. Is there a statistically significant relationship between reading accuracy (as
measured by the QRI-4) and reading comprehension (as measured by the
MAP) in at-risk adolescent readers?
4. Which of the three fluency variables (as measured by the MFS and QRI-4)
is most strongly related to reading comprehension (as measured by the
MAP) in at-risk adolescent readers?
The associated research hypotheses are as follows:
1. There is a statistically significant relationship between reading prosody (as
measured by the MFS) and reading comprehension (as measured by the
Measures of Academic Progress [MAP]) in at-risk adolescent readers.
2. There is a statistically significant relationship between reading speed (as
measured by the Qualitative Reading Inventory-4 [QRI-4]) and reading
comprehension (as measured by the MAP) in at-risk adolescent readers.
3. There is a statistically significant relationship between reading accuracy
(as measured by the QRI-4) and reading comprehension (as measured by
the MAP) in at-risk adolescent readers.
4. The fluency variable that is most strongly related to reading
comprehension in at-risk adolescent readers (as measured by the MAP) is
reading prosody (as measured by the MFS).
Research Hypotheses in Null Form
The associated null hypotheses are as follows:

17
1. There will not be a statistically significant relationship between reading
speed (as measured by the QRI-4) and reading comprehension (as measure
by MAP) in at-risk adolescent readers.
2. There will not be a statistically significant relationship between reading
accuracy (as measured by the QRI-4) and reading comprehension (as
measure by MAP) in at-risk adolescent readers.
3. There will not be a statistically significant relationship between reading
prosody (as measured by the MFS) and reading comprehension (as
measure by MAP) in at-risk adolescent readers.
4. There will not be a statistically significant difference between how
strongly reading prosody (as measured by the MFS) is related to reading
comprehension (as measured by MAP) and how strongly reading speed
and reading accuracy (as measured by the QRI-4) are related to reading
comprehension (as measured by MAP) in at-risk adolescent readers.
Explanation of Research Hypotheses
The research hypothesis that reading prosody correlates more highly with reading
comprehension than any of the other variables of interest is based on the belief that
prosody, while still a subpart of fluency, provides a bridge that connects fluent reading to
comprehension of text (Kulich, 2009). Research suggests that students who read with
appropriate pace, expression, intonation, and attention to textual features have a much
better chance of understanding what the text means (Dorit & Mashraki, 2007). It is
possible to read with speed and not comprehend, and it is possible to read with accuracy
and not comprehend because speed and accuracy can be achieved with strong decoding

18
skills, even if those decoding skills are not accompanied by any understanding of the text.
However, it is unlikely that students whose reading does not exhibit attention to prosody
truly comprehend what they are reading (Petscher & Kim, 2011). Therefore, it is
hypothesized that students who read with appropriate prosody will test higher on
comprehension assessments than students who only read with the appropriate speed
and/or accuracy.
Prosodic input, or how well one picks up on the cues within spoken language, can
differ greatly from prosodic output, or how well one can look at print and recognize the
speech cues that are necessary and transfer those cues to spoken language. This
difference is due to the prosodic cues that can be readily heard in speech, but not in print
(a concept the researcher refers to as prosodic deficit). This study was only concerned
with prosodic output; can an adolescent struggling reader look at the printed word and
overlay the proper prosody onto the text and then relate the meaning accurately? Other
reading fluency factors may prepare adolescents for becoming efficient comprehenders of
what they read (or prevent them from becoming efficient comprehenders of what they
read), but problems in that realm can be overcome far more easily than problems with
prosodic output when it comes to learning to comprehend literature.
Identification of Variables
There were four variables of interest in this study. Each is operationally defined
below:
1. Reading speed: Reading speed was operationally defined as the results on
the QRI-4 reading assessment. The number of words read correctly per
minute provided that number. There are no published guidelines for how

19
quickly a high school student should read, so defining appropriate speed is
impossible.
2. Reading accuracy: Reading accuracy was operationally defined as the
results on the QRI-4 reading assessment. A percentage of words read
correctly, as a function of the total number of words read, provided that
number. Scores could have ranged from 0-100%. Participants who scored
above 95% were considered to be accurate readers.
3. Reading prosody: Reading prosody was operationally defined as the
results on the MFS prosody assessment. Scores ranged from 4-16.
Generally, scores below eight indicated that fluency may be a concern.
Scores of eight or above indicated that the student was making adequate
progress in fluency (Zutell & Rasinski, 1991).
4. Reading comprehension: Reading comprehension is operationally defined
as the results on the MAP Reading Comprehension subtest. The RIT
(Rausch unit) score on the reading comprehension subtest provided that
number. Scores could have ranged from 170-270. The score for adequate
comprehension depended on the participant’s grade level at the time of the
test.
Definition of Terms
In order to ensure that the communication in this study is received as intended,
following is a list of words that are likely unknown or have ambiguous meanings, and
their corresponding definitions:

20
1. disfluency: Disfluent reading is characterized by lack of speed, accuracy,
and prosody.
2. suprasegmental: The smooth transition from letter to letter, word part to
word part, word to word, or sentence to sentence shows suprasegmental
ability.
3. validity: Validity is the extent to which a test measures what it is supposed
to measure.
4. reliability: Reliability is the extent to which a test is repeatable and yields
consistent scores.
5. automaticity: The ability to recognize a word in print without having to
decode its constituent parts is called automaticity.
6. at-risk: For the purposes of this study, at-risk status will be determined by
enrollment in the target facility’s education program. At-risk students are
students whose life circumstances, behavior, and/or intellectual ability
make them likely candidates for school (and, therefore, reading) failure.
7. prosody: Intonation, pitch, tone, phrasing, smoothness, expression, and use
of print cues characterizes prosodic reading.
8. metacognition: Metacognition is awareness of how one is thinking and
processing the text as he/she reads.

21
CHAPTER TWO: REVIEW OF LITERATURE
Introduction
This review of the literature provides an overview of the reading process,
discusses the uniqueness of adolescent reading difficulties, focuses on the place of
fluency in that discussion, and explains fluency and its three subskills. The literature
review continues by examining comprehension and how readers understand what they
read, analyzing how fluency and comprehension are related, hypothesizing and answering
the question of which fluency subskills most impact reading comprehension, and
mentioning other potential factors that will not be included in the study as variables, but
may have an impact on reading comprehension. While all these factors are being
scrutinized, it is the three fluency subskills that are of the most interest in this literature
review because they are the ones involved in the statistical correlation analyses.
The scholarly books and articles that are discussed in this literature review are
varied. The majority of them are quantitative studies that give some transferable
information to consumers of the research. Some of the articles and books are from
respected names in the field of reading research. These authors are respected because
their ideas have been shown to be consistently valuable over the course of many years,
despite the constant examination and criticism of their findings. Because the subject of
at-risk adolescent readers is currently such a sparsely researched topic, many articles are
included that may not seem to be exactly on issue, but provide insight from the broader
field of reading research, and are applicable to this research in some relevant way.

22
This research also recognizes that while fluency and comprehension are not part
of a completely linear process, fluency is a precursor, as opposed to a by-product, of
reading comprehension (LaBerge & Samuels, 1974; Pikulski & Chard, 2005). Some
reading theorists surmise that true fluency is an indication that active comprehension has
already occurred (Fuchs, L., Fuchs, D., Hosp, & Jenkins, 2008). However, logically
speaking, the goal (i.e., reading comprehension) cannot precede the steps to reach that
goal. The prevailing view of the vast majority of past and present adolescent reading
fluency experts (see Allington, 2002; LaBerge & Samuels, 1974; Rasinsksi, 2003b;
Shanahan, 2003; Torgesen, 1975) is that fluency must precede comprehension in reading
acquisition.
Theoretical Framework
This research on adolescent reading struggles has a few major underlying
principles. First, every student has the potential to learn to read if their primary needs are
met and they are given the correct social conditions (Maslow, 1943). Second, the
problems that have prevented adolescents from acquiring reading comprehension
proficiency are preventable if attacked in the correct manner and at the correct
developmental stages (Chall, 1983; Erikson, 1950; Piaget, 1969). Third, reading fluency
is a highly technical skill with numerous interactions between print, the eyes, speech
organs, and the brain (Biemiller, 1978; Hudson et al., 2009; Kame’enui & Simmons,
2001; LaBerge & Samuels, 1974). Each of these principles is either an original social or
educational theory, or can be traced to an existing social or educational theory.
Maslow (1943) theorized that when a child’s major needs (e.g., food, shelter,
safety) are met, they will be more prepared to attack school-related tasks, such as reading.

23
When a child’s major needs are not met, they will be unable and unwilling to put energy
into tasks that are inconsequential given their more pressing physical and emotional
needs. Struggling readers very often come from homes that do not provide the student
with the foundation needed to be successful readers (Brooks & Vetter, 1997; Brownell,
2000; Slavin & Madden, 1989). This is especially true of the students whose data will be
analyzed for this study.
Teachers generally support Erikson’s (1950) theory that humans develop in
stages, and Piaget’s (1969) theory that humans develop cognitively in stages, but
generally fail to recognize that these theories are applicable to reading development. Jean
Chall (1983) said that children also develop reading ability in predicable stages that
mirror the intellectual and emotional development discussed by Erikson (1950) and
Piaget (1969). Chall (1983) surmised that if reading instruction is appropriate to the
developmental stage of the student, the skills necessary to proceed through that stage will
more readily be attained. When the reading instruction is incorrect for the stage or the
child has developmental delays due to intellectual, physical, or emotional shortcomings,
the necessary skills will not likely be learned. This failure, in turn, adversely influences
the ability to perform adequately at the next stage of reading (Chall, 1983). At that point,
remediation is the only option to fill in the gaps that have opened up in reading ability.
Human development does not occur at a constant rate, and is not dependent on age.
Teachers disregard, to the detriment of students, the fact that some high school students
do not arrive with the skills to comprehend what they read. Ignoring differences or gaps
in development is especially unfortunate because reading fluency and comprehension are

24
the most accurate indicators of not just future reading achievement, but future
achievement in school as a whole (Hasbrouck & Tindal, 1992).
Reading researchers have long understood that reading fluency is a complicated,
multifaceted process (Hudson et al., 2009; Kame’enui & Simmons, 2001). For example,
LaBerge and Samuels (1974) proposed the theory of automaticity, a specific reading
fluency theory that underlies this research. This theory states that readers have a limited
amount of mental energy available for reading. If too much of that energy is utilized to
decode words, then less mental energy will be available for understanding what is being
read. This theory was an early indication of the importance of explicit phonics
instruction, demonstrating that decoding needs to be automatic in order for
comprehension to occur. Biemiller (1978) expounded upon the LaBerge and Samuels’
idea by demonstrating through highly technical testing that the speed of reading has an
enormous influence on how much of the text is understood, and how well it is
understood.
The three aforementioned theories provide an excellent foundation for this study.
When a student’s needs are met (Maslow, 1943), they are provided the correct reading
instruction at the appropriate developmental stage (Chall, 1983), and the ability to read
with fluency is established early in life (LaBerge & Samuels, 1974; Rasinski, 2003b),
reading problems are unlikely to exist. This study looks at students who have one or
more of those foundational pieces missing. The absence of one piece of the framework is
troublesome, but when a student arrives in the adolescent years without any of those
pieces in place, reading success is very unlikely. The intent of this research is to find
which of the fluency subskills is the most strongly correlated with reading comprehension

25
so that effective and efficient means of remediating the fluency skills of these students
might be developed.
Research Process
For this review of the empirical literature on the topic of study, information was
gathered in two different ways. First, a computer search was conducted. No date
parameters were set for the search due to the fact that much of what constitutes
foundational reading research was published many decades ago; the researcher did not
want to exclude important articles that may have been written prior to the 21st century.
Using ERIC and PsycINFO, various combinations of the following search terms were
used in order to obtain the most possible pertinent articles: reading comprehension,
comprehension, reading fluency, fluency, struggling reader, disabled reader, reading
disability, adolescent reader, adolescent reading fluency, adolescent reading
comprehension, correlation research design, juvenile delinquent students, prison schools,
reading speed, reading accuracy, reading prosody, automaticity, special education,
dyslexia, reading and socioeconomic status, adolescent brain research, brain chemistry,
reading and the brain, speech difficulties, reading and speech difficulties, hearing
difficulties, reading and hearing difficulties, factors impacting reading comprehension,
incarcerated adolescents, and factors impacting reading.
The second search was done on the International Reading Association (IRA)
website of archived editions (membership required) to ensure that no relevant articles
were overlooked. This was simply a process of reading the titles of all published articles
in IRA journals over the previous ten years and downloading the ones that were relevant
to this research. No restrictions were initially put on research type or design so as not to
26
exclude articles that may have been of some use, even if the research was limited in terms
of methodology or design.
After the search, the articles were placed into three categories: meta-analysis
articles, research articles, and nonresearch articles. To further divide the articles, the
researcher separated them according to whether they were articles of theory or empirical
studies. The last step was to code the articles that discussed the same general topic, such
as prosody or brain research. Each article was then read, highlighted, annotated, and filed
for use when writing the review of literature. The written format of this literature review
is conceptual. It begins with a broad view of the research on reading, then narrows the
discussion down to the five parts of reading (i.e., phonemic awareness, phonics, fluency,
comprehension, and vocabulary; NRPR, 2000), discusses fluency and comprehension at
length (due to their place of importance in the research hypotheses), examines the
connection between reading fluency skills and overall reading comprehension, and finally
discusses a wide array of variables that may have an impact on reading comprehension.
Adolescents and Reading
Over one hundred years ago, Hall (1904) wrote a two volume work on how
stormy and stressful the stage of adolescence can be in human development. Adding
mandatory education to the storm and stress that Hall described seems to be a nearly
impossible pedagogical task at times. This is especially true today when secondary
students are typically asked to read more often and understand more deeply, even as the
length and difficulty of the reading rapidly increases. Statistics show that whether a
student comes into high school reading above grade level, on grade level, or below grade
level, his/her reading comprehension is likely to decrease over the course of those four

27
years (Rasinski et al., 2005). Although statistics regarding illiteracy amongst adolescents
are often intentionally distorted or unintentionally unreliable due to funding and political
battles, it is believed that functional illiteracy rates for adolescents range from
approximately 20% in Maine to nearly 60% in Louisiana (Educational Cyberplayground,
2011). Even more concerning for the students whose archival data was analyzed for this
study is the fact that over 80% of juvenile inmates nationwide are functionally illiterate
(Educational Cyberplayground).
The major contributing factor to this increase in reading failure is lack of fluency
(NRPR, 2000). Poor fluency has been shown to be the biggest contributor to high school
reading failure (NICHHD, 2007). Reading failure results from poor reading fluency
because of the direct connection between reading fluency and reading comprehension
(Rasinski, Rikli, & Johnston, 2009). In response, colleges must offer more remedial
reading courses to compensate for these academic deficiencies. Approximately 43% of
students at two year colleges, and 30% of students at four year colleges are enrolled in
remedial courses (Schachter, 2008).
Attention to fluency usually begins with explicit fluency instruction (i.e.,
decoding) following the early stages of reading development and ends at the onset of the
comprehension stage, typically in late elementary school. Therefore, an absence of
reading fluency instruction coincides with the decrease in comprehension in middle and
high school. The researcher does not believe that this is a coincidence. The skill of
learning to recognize words with automaticity should be mastered as soon as possible in
the course of reading development so that comprehension can flourish. If, however, it is

28
not mastered, the results are clear: “The lack of reading fluency appears to be the greatest
impairment in reading” (Rasinski et al., 2005, p. 22).
One researcher described the problem that struggling adolescent readers face by
writing that “the demands of academically rigorous subject matter combined with greater
dependence on informational text make it imperative for [secondary] students to attain
age-appropriate reading skills" (Burns, 1998, p. 223). High school students encounter
concept dense, difficult texts, and will not have the time or perseverance to get through
them if they read too slowly. Writing in the School Administrator, Linda Blackford
(2002) stated, “Textbooks got thicker and students have to comprehend much more
sophisticated information than they ever have” (para. 13).
Secondary texts have become richer, deeper, and contain longer words and
sentences. However, that does not mean that students should read that text more slowly,
less accurately, or with decreased prosody. One researcher addressed this situation by
saying, "The demands of academically rigorous subject matter combined with greater
dependence on informational text make it imperative for students to attain age-
appropriate reading skills" (Schifini, 2002, p. 1). Difficult texts must be read just as
fluently as lower level texts in order to maintain comprehension (LaBerge & Samuels,
1974; Wolf, Bowers, & Biddle, 2000). To achieve this level of fluency, however,
secondary readers must exhibit more proficiency in prosodic ability because an increase
in prosody leads to an increase in reading rate, which ultimately leads to an increase in
comprehension, just as it does for K-8 students (Rasinski, 2003a). Conversely, if the
difficult text causes a slowdown in reading rate, a decrease in comprehension will result.

29
Past reading experiences, and the negative attitudes toward reading, are difficult
to alter once the student has arrived in high school. However it is not completely useless
to try to affect the reading attitudes and behaviors of at-risk high school readers. If
students’ attitudes and reading skills can decrease once in high school (which they
certainly can according to the International Reading Association Summary of the NRPR
[2000]), it stands to reason that the opposite can occur as well. If there are factors (e.g.,
lack of instruction, negative attitudes, apathy, negative biological factors, harmful brain
and body chemistry changes) that can work to the detriment of the reader, the opposite of
those same factors (e.g., effective instruction, positive outlooks, caring about reading,
positive biological factors, helpful brain and body chemistry changes) could work in
favor of the reader as well.
In addition, students’ reading self-image is deeply engrained by grade nine
(Strommen & Mates, 2004). At-risk readers have either been successful or have failed
miserably in regards to learning the reading skills necessary to succeed in school. There
is very little middle ground. The importance of prior success in reading cannot be
overstated. It is important that adolescents "see themselves as participant readers in a
community that pursues reading as a significant and enjoyable . . . activity" (Strommen &
Mates, 2004, p. 18). Motivation to read and reading perception are two factors that can
heavily impact adolescent reading. The participants in this study have all of the
aforementioned problems that are endemic in at-risk adolescents, but have the additional
burden of being incarcerated as well.
Incarcerated Adolescents and Reading
30
Incarcerated adolescents arrive at juvenile detention facilities having just been
through a number of traumatic experiences in both their academic and personal lives.
Reading improvement is not high on their list of priorities. Compound that with the fact
that the majority of them (74% in this study, according to school records) of the students
are receiving special education services and the vast majority have identified or
unidentified (but very obvious) reading disabilities, and the reason for poor reading
performance amongst incarcerated adolescents becomes clear. However, it may not be
the case that the students in juvenile facilities perform poorly as readers because they are
in prison, it may be that they are in prison because they have performed poorly as readers.
Christle and Yell (2008) stated, “The fact that youths who have deficits in reading are
disproportionately represented in correctional institutions suggests that the juvenile
justice system has become the default system for many youths who have reading
problems” (p. 148). In other words, the inability to read is a large part of the cause for
the aberrant behavior and disillusionment that leads to incarceration to begin with.
Many of the factors that lead to incarceration are the same factors discussed in
this research as having an influence on reading comprehension. Christle and Yell (2008)
broke those factors into two groups: external factors and internal factors. These factors
account for the reading deficiencies of the incarcerated youth. Maguin and Loeber
(1996) conducted a meta-analysis of the studies that had investigated the relationship
between academic deficits and youth delinquency and found that low school achievement
predicts delinquency. Maguin and Loeber’s research suggested that academic problems
often foster behavior problems, which can lead to subsequent delinquency. Poor
academic skills, particularly in reading, do not directly cause delinquency and

31
incarceration; yet youths with poor academic skills are disproportionately found in the
criminal justice system. Since incarcerated adolescents usually began getting in trouble
at a time when reading teachers focus heavily on reading comprehension (late elementary
and early middle school) they are often in need of very intensive reading comprehension
intervention upon arrival at a detention facility.
While prevention of incarceration is not the primary goal of this study, it is
important to note that identifying and understanding risk and protective factors can lead
to the development of more effective intervention and prevention strategies. To be
effective, however, programs and strategies must address the dynamic interaction
between individuals and their social contexts, specifically the collaboration among
families, schools, and community agencies. Because a majority of incarcerated youths
experience serious reading problems, schools can play an important role in helping to
prevent incarceration through systematic and effective reading remediation programs.
Indeed, all of the key social agents in the youth’s life must be directly involved in the
intervention in order to divert him or her from the path to incarceration (Walker &
Sprague, 1999). Thus, an important secondary purpose of this research was to locate the
key to prevent adolescent crime through improvement of reading skills, which can only
be done through careful examination and mitigation of the factors that lead to the
preponderance of juvenile offenders being poor readers.
One positive aspect of conducting reading intervention exercises with
incarcerated adolescents was reported by Christle and Yell (2008):
Students with very low reading skills can make significant and meaningful
gains in reading skills in a relatively short period of time. This is

32
important because youth in correctional facilities read, on average, at the
fourth grade level (Brunner,1993) and the average length of stay for
adjudicated youth is eight to 11 months (Drakeford, 2002), a relatively
short time for remedial education (p. 26).
Similarly, Allen-DeBoer, Malmgren, and Glass (2006) found that systematic reading
intervention improves academic outcomes for adolescents confined to juvenile
correctional facilities who are also struggling readers.
Five Elements of Reading
The previous information clearly demonstrates that there is a need for English and
reading teachers to focus on explicit literacy instruction in high school (NICHHD, 2007).
According to the NRPR (2000), secondary literacy instruction should include fluency and
comprehension skill building and practice, but it should flow naturally from previously-
learned phonemic awareness and phonics skills. As part of this literature review, it is
worth briefly outlining the five components of reading as described by the NRPR (2000).
Those components are: phonemic awareness, phonics, fluency, vocabulary, and
comprehension. The three most often dealt with in secondary remedial reading settings
are fluency, vocabulary, and comprehension.
Fluency, vocabulary, and comprehension are inextricably intertwined and very
difficult to separate, especially at the secondary level (Hudson et al., 2009). However,
reading teachers must do just that in order to determine the specific causes of reading
disabilities when they manifest themselves in adolescent readers. Then, in circumstances
when disfluency is found to be the main obstacle for a struggling adolescent reader,
teachers must be able to further investigate the student’s skills in regard to the three

33
elements that comprise fluent reading in order to diagnose and remediate the deficiencies
that exist. It is hoped that this research supplies teachers with the information needed to
make that investigation more efficient and more accurate.
Fluency: Exploring One Specific Reading Variable
History
Fluency strategies and interventions over the past 200 years have been as varied
as the eras from which they came. In the nineteenth century, when textbooks began to be
utilized to teach reading, oral reading dominated reading instruction in the United States
(Rasinski, 2003b). Both the McGuffey Reader and the Newell Reader focused on oral
reading instruction and intervention. The aim was eloquent reading (Smith, 1965). The
students would recite or read a short story, fable, or Bible verse, and be graded on how
fluently the passage was verbalized.
Near the beginning of the twentieth century, oral reading “was largely and
vociferously shunned by most reading scholars, and its popularity began to wane”
(Rasinski, 2003b, p. 24). Many of the new texts were beginning to focus on phonics
instruction and practice. Thomas Mann complained at this time that reading had become
the “action of the organs of speech rather than an exercise of the mind in thinking and
feeling” (Rasinski, 2003b, p. 25). The goal at that time was to move all readers towards
silent or independent reading that was focused on comprehension and meaning.
Instruction in reading now took place within the confines of the study of literature.
Interventions focused on getting students to read more by themselves, without
interference from teachers. Independent reading was more feasible due to the fact that
the availability of text (newspapers, magazines, books, etc.) in the early twentieth century

34
was increasing exponentially. Horace Mann’s Common School movement was
influential in focusing the mind of students on silent reading and gleaning thoughts from
the printed page. Silent reading became such a focus, in fact, that even the internal
sounding out of words was discouraged (Hoffman, 1987).
As reading problems inevitably began to arise due to the “nonoral” methods of
reading in schools, the pendulum swung and oral reading became more popular as a way
for the teacher to assess and intervene when there were obvious reading deficiencies.
However, even today, oral reading intervention techniques are varied and often
ineffective. In an attempt to adopt “research-based and up-to-date” (Thomas & Wexler,
2007, p. 22) fluency strategies, secondary-level administrators and teachers have begun to
latch on to any new method that arises from research and claim it as the holy grail of
fluency intervention.
Unfortunately, little is known about the effectiveness of high school fluency
intervention programs because of their newness and the dearth of published articles
synthesizing the foundational ideas of current intervention programs (Wexler et al.,
2007). One influence the author hopes this research has is to focus the direction of
fluency interventions towards improving the fluency subskills that will directly influence
reading fluency, and subsequently, reading comprehension.
Definition of Reading Fluency
The definition of reading fluency is not commonly agreed upon. Many reading
educators have defined fluency as the number of words read correctly in one minute, but
that is not an appropriate definition of reading fluency given what researchers now know
about the topic of reading fluency and its component subskills (Valencia, Smith, Reese,

35
Li, Wixson, & Newman, 2011). To truly understand how fluency subskills impact
reading comprehension, it is obviously necessary to understand fluency in depth. Dudley
and Mather (2006) stated, “Although it is easy for teachers to recognize a fluent reader
when they hear one, considerable debate still surrounds the definition of oral reading
fluency (ORF)” (p. 17). Essentially, fluency comes down to “effective word recognition
skills that permit a reader to construct the meaning of text. Fluency is manifested in
accurate, rapid, expressive oral reading and is applied during, and makes possible, silent
reading comprehension" (Harris & Hodges, 1995, p. 85).
Wolf and Katzir-Cohen (2001) stated that “the unsettling conclusion is that
reading fluency involves every process and subskill involved in reading” (p. 220). Upon
close examination, most of the definitions found in the literature can be synthesized into
three components: (a) speed, (b) accuracy, and (c) prosody. While these three work
together to comprise fluency, they can also be further deconstructed into their constituent
parts. Doing so provides insight into how each of fluency’s three skills work.
Reading speed. Adams (1990) said, “The most salient characteristic of skillful
reading is the speed with which text is reproduced into spoken language” (p. 21). The
most common measurement of reading speed is number of words read correctly per
minute. Samuels (2007) stated that it is appropriate to use reading speed as a means to
measure student reading progress, but only if the focus on speed does not interfere with
comprehending text. An essential component in establishing fluency goals for high
school students is not only analyzing what reading speed is necessary to succeed in the
classroom, but analyzing standardized tests to see what speed is necessary for there to be
time to read, comprehend, and answer the questions presented to them (Sibley, Biwer, &

36
Hesch, 2001). Calculating the number of words per minute needed to achieve success
(fast enough, but also with adequate comprehension) in standardized testing situations
should be an important goal of fluency instruction. A reader who reads with adequate
speed for a particular reading task demonstrates a functional working memory,
demonstrates a grasp on phonics, has the ability to fixate on chunks of words rather than
single words or word parts, and can understand nearly all of the words that are read.
Working memory. Working memory and comprehension have an undeniable
correlation (Berniger, Abbott, Swanson, & Lee, 2010; Swanson & O’Connor, 2009).
However, reading speed and working memory must also be closely related because
without the ability to hold items in working memory, students are not able to quickly
recall word parts or whole words that they have already read as they continue through the
text. One study (Ashby & Rayner, 2004) of 27 college-age participants demonstrated this
phenomenon by showing in two separate eye movement experiments that short term
memory is important to preserving letter and syllable information across saccades. The
maturation of a student’s long term memory is also important to reading speed because it
holds the schema that allows them to access information and details regarding previously-
learned topics in a timely manner (Recht & Leslie, 1988).
Phonics skills. Phonics ability is important to accuracy, but is just as important to
reading speed. If the reader is not able to put together word sounds in a reasonably
efficient manner, reading speed will decrease. A recent study by Eldredge (2005)
showed a causal relationship between word recognition (the ability to recognize words by
their spellings) and reading speed. Many teachers of reading, seeking to improve reading
speed, have focused on reading speed drills or automaticity exercises. However, it

37
appears that reading speed is most influenced by phonics ability, meaning that word
recognition exercises should be the focus of instruction when increased reading speed is
the goal.
Eye fixations. While reading, the human eye fixates either on every letter, every
word part, every word, every sentence, or even bigger chunks of text. The fewer eye
fixations that are required while reading, the faster the subject can read (Ashby & Clifton,
2005). The United States Department of Defense, among other organizations interested
in improving reading speed, has used the tachioscope to aid subjects in reducing their
number of eye fixations. Fewer eye fixations translates to higher reading speed.
Vocabulary skills. The availability of, and ability to, acquire vocabulary words is
just as relevant to reading speed as reading accuracy. Having a large vocabulary at their
disposal reduces the number of times a student has to stop and struggle to pronounce an
unknown word, but it also aids in comprehension. If a student automatically recognizes
and effortlessly pronounces the words that are being read, he will read faster and more
fluently than if he does not (Biemiller, 1978; LaBerge & Samuels, 1974). Studies show
that as the number of unknown words decreases through teaching activities such as
preteaching of key words, it not only increases reading speed, but reading comprehension
as well (Alessi & Dwyer, 2008; Burns, Dean, & Foley, 2004).
Reading accuracy. The most common measurement of reading accuracy is the
percentage of words read correctly during a fluency test. Reading words quickly with the
correct pronunciation is a skill that relies heavily on phonics. Edwards (2008) conducted
an action research project in a classroom consisting of sixteen ninth grade students and
found that a high school level, structured phonics program is the most effective way to

38
impact the reading fluency of adolescent at-risk readers. Without accuracy, fluency is
impossible; without a solid phonetical foundation, accuracy is impossible. The phonics-
accuracy-fluency-comprehension relationship is at the heart of the emphasis on phonics
in early childhood education. Thus, it should be at the heart of any attempt to remediate
reading difficulties in adolescent readers as well. A reader who reads accurately exhibits
automaticity, has an excellent grasp of phonics skills for sounding out new words, and
does not substitute or omit words while reading.
Automaticity. Schwanenflugel et al. (2006) found that word reading accuracy is
highly correlated with automatic reading. Automatic reading is the core of fluency in
general (LaBerge & Samuels, 1974), but also the heart of accurate reading because it
shows an ability to decode quickly and sound out correctly, which leads to increased
comprehension (Schwanenflugel et al.).
According to LaBerge and Samuels (1974), automaticity is a result of word
understanding (i.e., phonetical awareness) and the ability to limit mistakes as the reading
occurs (i.e., accuracy). The technical aspects that surround the issue of automaticity are
beyond the scope of this review, but a plethora of technical fluency research supports the
idea that automatic reading is a key component to both reading accuracy and reading
speed. The research on automaticity most likely began as early as 1899 with Bryan and
Harter. They stated that “automatism is not genius, but it is the hands and feet of genius”
(Bryan & Harter, 1899, p. 375).
Phonics skills. Phonics skills are important to reading accuracy because without
the ability to break down multisyllabic words using orthographic knowledge, accurate
and fluent reading is unlikely (Archer, Gleason, & Vachon, 2003). Even more relevant to
39
secondary teachers is the premise that “it is not too late for struggling secondary readers
to learn to read multisyllabic words and improve their overall reading ability” (Archer et
al., 2003, p. 91). If accurate and automatic reading is a function of practice, as Allington
(1977) found, then practicing the basic phonics skills that allow automatic reading to
occur is mandatory.
Vocabulary skills. Weak vocabulary skills produce contextual reading difficulties
for students with reading disabilities (Jenkins, Fuchs, van den Broek, Espin, & Deno,
2003). If students have limited lexical access, they will not be able to read many words
accurately, which negatively impacts their ability to accurately comprehend the larger
context. Though there are some detractors (Ricketts, Nation, & Bishop, 2007), most
reading researchers have found that vocabulary ability influences reading accuracy, and
those vocabulary skills are best built through repeated and assisted reading techniques as
opposed to conventional vocabulary instruction methods or incidental vocabulary
acquisition (Dowhower, 1987; Gorsuch & Tagushi, 2008; NICHHD, 2000; ZhaoHong &
Cheng-ling, 2010).
Reading prosody. Prosodic skill has been hypothesized to predict word reading
accuracy and comprehension (Allington, 1983; Dowhower, 1991). The importance of
reading prosody to overall reading is becoming more and more obvious as reading
research examines it more closely. Prosody encompasses many oral reading skills, such
as expression, intonation, suprasegmental ability, and voice pitch (Miller &
Schwanenflugel, 2008).
Prosody is a difficult construct to measure (Hudson et al., 2009). The reasons it is so
difficult are (a) there are as many definitions of prosody as there are reading experts to

40
define it, (b) the subskills of prosody are not agreed upon by reading experts, (c) each
subskill has to be measured with a separate rubric (for an example of a fluency rubric, see
Appendix A), (d) the rubrics themselves are not universally normed, so any resultant
measurement using those rubrics would not be universally considered valid, and (e) what
each rater considers to fall within the proficient range of each skill is very subjective.
Rather than define prosody, it is sometimes more helpful to look at its purpose. Whalley
and Hansen (2006) stated that “prosodic cues help segment the speech stream into
phrases, words and syllables, inform syntactic structure and emphasise salient
information to facilitate understanding” (p.289). Schreiber (1991) also discussed how
prosodic cues segment speech into word chunks to aid reading comprehension.
Prosodic reading is as easy to identify as it is difficult to define. It is often said that it is
easy to hear when a student is reading with adequate prosody, even though the term
“adequate prosody” is not consistently defined in reading literature. Schreiber (1991)
stated:
There are certain phonological cues that provide relatively consistent indication of
certain aspects of phrasal organization, especially the ‘higher order’ units of phrasal
structure, such as the subject noun phrase and the predictive verb phrase. These cues are
the so-called prosodic features. These features are, of course, overtly present in the
speech signal and are hence available as primary and observable cues to structure.
(p.159)
Conversely, poor prosody can lead to confusion because phrasal structure is
poorly organized or completely misunderstood (Yildrim, Yildiz, Ates, & Ctinkaya,

41
2009). Dowhower’s (1991) foundational work on reading prosody listed his six
indicators of prosodic reading:
1. There is a presence or lack of pausal intrusions with valid duration.
2. There is a minimum of seven words per phrase.
3. There is an appropriateness to phrasing (suprasegmental ability).
4. There is a lengthening of final words in phrases.
5. There are terminal intonation contours (pitch changes at punctuation).
6. There is a maximum of one stressed word for every five words read.
Effective prosodic reading can be most simply and accurately defined by breaking down
prosodic reading into the specific skills (the major ones) that are needed to produce it,
according to reading research. Those skills are absence of pausal intrusions,
suprasegmental ability, and appropriate attention to textual features.
Pausal intrusions. How often a student pauses while reading, and the duration of
those pauses, was found to be an accurate predictor of adolescent reading comprehension
(Miller & Schwanenflugel, 2008). In terms of suprasegmental ability, increased duration
of eye fixations causes a slowdown in overall reading speed and adversely influences
reading prosody. There is a logical progression beginning with eye fixations, which
cause pausal intrusions, which in turn decreases reading speed. There are numerous
interesting and research-proven psychological explanations for lengthened duration, and
while they have implications for reading, they are beyond the scope of this study.
Suprasegmental ability. Suprasegmental ability can be broken down into
numerous subskills, and those subskills are not always agreed upon by reading experts.
However, at its core, it is simply the ability to move smoothly across syllables, words,

42
phrases, and sentences without the unnecessary and disruptive pausal intrusions that can
be caused by reading with inappropriate stress, intonation, or expression.
Suprasegmental ability is important because “Once learners have established this level of
comfort with print, it becomes far easier for them to construct meaning from a given text
than when they are still struggling with word identification” (Kuhn & Stahl, 2000, p. 6).
Chall (1996) stated that fluent readers make use of emphasis and intonation. It is when
they are using proper stress, inflection, and intonation that they demonstrate
understanding of the text. Without an understanding of the text, stress, inflection, and
intonation could not be appropriate. The problem with this line of thinking is that while
lack of fluency does impact on pitch, stress, and expressiveness (Cowie, Douglas-Cowie,
& Wichmann, 2002), it is unclear whether the student is unable to read using those
particular suprasegmental abilities, or does not recognize the opportunities to use them as
they arise in the text. The former indicates a fluency problem, the latter indicates a
comprehension problem.
Some resarchers have said that the rhythm of perfectly fluent reading should
approximate the expressions of spoken language (Allington, 1983), while others have
found fault with this statement (Crystal & Davy, 1969; Johns-Lewis, 1986). While most
modern reading researchers agree with Allington, I find his argument faulty in two
important ways. First, in order for the rhythm of spoken reading to be the same as the
rhythm of spoken language, the receptive and expressive prosody that occurs during
reading would have to occur at the same rate as the expressive prosody of speech alone,
which is clearly an illogicality. Secondly, it would also assume complete control over the
mechanics of speech, (such as breath control), a uniformity in the manner of chosen

43
expression amongst different ages, races, and sexes, as well as an equality of confidence
in reading ability and spoken language.
Attention to textual features. One often overlooked element of reading prosody
is how well a student attends to the features of text that indicate when to stop, pause, or
use expression. The ability to use those skills will not result in properly prosodic reading
if the reader does not recognize when to use them. This is why punctuation,
paragraphing, and capital letters are so important to prosodic reading. Chafe (1987)
made this point by stating:
Some readers may object that the signaling of prosody is only one of the functions
of punctuation, and perhaps not the primary one. Although that is a common belief, and
although there are certainly instances of punctuation that do not serve prosodic ends, I
will defend the position here that those instances are departures from its main function,
which is to tell us something about a writer’s intentions with regard to the prosody of that
inner voice. (p. 5)
This inner voice guides the punctuation of text. Authors hear what they will write
in their own heads before it gets put down on paper. Thus, it is auditory imagery, not
grammatically imposed rules, that tells an author how to punctuate. This is why students
must be made to read aloud in order for the teacher to capture their understanding of the
text and the textual features therein. It is also interesting to note, from the Chafe (1987)
study, that the length of intonation units decrease with age, suggesting that older readers
naturally pay more attention to textual features and prosodic boundaries and subsequently
adjust their reading to approximate natural speech more closely.
The Fluency Number

44
Never before have reading specialists attempted to quantify these three separate
fluency subskills (i.e., reading speed, reading accuracy, reading prosody) with one
number. To have a formula that would produce such a number would be an enormously
beneficial tool for teachers of adolescent readers. Currently, teachers in secondary
schools (if they measure fluency at all) count words correctly per minute to measure
speed, count errors per word read to measure accuracy, and then use a rubric to measure
prosody. An example of a typical prosody rubric is provided in Figure 1 below.
Figure 1: Typical Prosody Rubric
4. Reads primarily in larger, meaningful phrase groups. Although some
regressions, repetitions, and deviations from the text may be present, these do
not appear to detract from the overall structure of the story. Preservation of
the author’s syntax is consistent. Some or most of the story is read with
expressive interpretation. Reads at an appropriate rate.
3. Reads primarily in three- and four-word phrase groups. Some smaller
groupings may be present. However, the majority of phrasing seems appropriate
and preserves the syntax of the author. Little or no expressive interpretation is
present. Reader attempts to read expressively and some of the story is read with
expression. Generally reads at an appropriate rate.
2. Reads primarily in two-word phrase groups with some three- and four-word
groupings. Some word-by-word reading may be present. Word groupings
may seem awkward and unrelated to the larger context of the sentence or
passage. A small portion of the text is read with expressive interpretation.
Reads significant sections of the text excessively slowly or fast.

45
1. Reads primarily word-by-word. Occasional two- or three-word phrases may
occur – but these are infrequent and/or they do not preserve meaningful
syntax. Lacks expressive interpretation. Reads text excessively slowly. A
score of 1 should also be given to a student who reads with excessive speed,
ignoring punctuation and other phrase boundaries, and reads with little or no
expression.
Pinnell, J., Pikulski, K., Wixson, J., Campbell, P., Gough, A., & Beatty, A. (1995). Listening to children read aloud: Oral fluency. Washington, DC: U.S. Department of Education, National Center for Education Statistics.
To pare down the cumbersome process of measuring reading fluency ability by
providing one fluency number would certainly make measuring reading fluency more
efficient, and make it more likely that time-strapped high school teachers would consider
measuring fluency, comparing the results to a norms chart (recognized high school word-
per-minute norms do not currently exist for many reasons, one being that the
preponderance of reading in high school is done silently), and implementing some type of
fluency instruction or intervention in their classes.
More specifically, a fluency number would provide an accurate representation of
the fluency skills of struggling adolescent readers by combining the three subskills that
comprise fluent reading. In addition, while giving an overview of the student’s reading
fluency, the three numbers that make up the fluency number could also be examined
individually to identify the weaknesses more specifically. The combination of the results
of this research, which revealed which of the three fluency skills are most strongly
correlated with reading comprehension, and the information that could be gleaned from

46
the fluency number statistic, would make reading intervention much easier and much
more focused on the specific problem that the struggling reader is experiencing.
Without the fluency number, there is much wasted time in reading remediation,
especially among adolescent at-risk readers who read disfluently. Much of that is due to
secondary teachers who are untrained in reading instruction and remediation, but some of
it is due to a lack of information that prevents identification of the specific fluency issue.
Appropriate programs of reading fluency intervention and prevention are of paramount
importance if struggling adolescent readers are to attain a level of fluency that allows
them to succeed. Scammacca et al. (2007) found that the fluency interventions examined
for older students had a very small effect on students’ reading rate and accuracy, and
virtually no effect on standardized measures of reading comprehension. The
development of a fluency number may play a role in changing the focus and subsequently
increasing the effectiveness of fluency interventions.
The fluency number, the theory of prosodic deficit, and reading speed norms for
high school students could provide the information needed to develop those programs.
However, they are all be subjects for further research and development beyond this study.
Fluency Problems: Intervention and Prevention
One method that has shown promise in the field of fluency intervention is
computer-assisted instruction (Mastropieri, Leinart, & Scruggs, 1999). This has been
especially effective for resistant readers and seriously deficient readers (more than two
years behind grade level). The commonsense, logical approach to fluency intervention is
to try to provide the disfluent student with the skills that caused the maldevelopment of
fluency to begin with, and then build from there. Often those missing skills are code-

47
based skills that are lacking due to the school’s (and teacher’s) insistence on using whole
language and other “student-centered” reading strategies that have been repeatedly and
quantifiably proven as failures (Hempenstall, 2008; Mac Iver & Kemper, 2002; NRPR,
2000). The author of one article on older readers who struggle with fluency stated,
“Reading intervention that is grounded in research imparts to older readers the skills they
missed in primary grades and can bring them to grade level in one to two years” (Moats,
2001, p. 37). Computer-assisted instruction is especially effective for the instruction and
practice of code-based skills because a teacher of adolescent readers may not have the
time to teach those skills individually to the at-risk students in her classroom. Computer-
assisted instruction of code-based skills would also allow the student to avoid the
embarrassment of practicing out loud (i.e. sounding out words) by teaching them the
necessary skills covertly and quietly.
The most logical interventions to adopt are the ones that have been demonstrated
to work the best. However, the most popular and the most utilized interventions are not
always the ones that have been found to be the most effective. Most intervention
programs are backed by research, but not all of these programs have been successful. For
example, Reading Recovery was supported by a plethora of research, but was such a
failure in practice that the program publishers had to start altering testing numbers and
changing/redefining terms in order to make it appear successful. Even then, the program
was an obvious failure (Center, Wheldall, Freeman, Outhred, & McNaught, 1995).
Perhaps the failure of some reading intervention programs is due to the poor quality of
research that undergirds them; perhaps it is due to the lack of proper implementation, or
inadequate teacher training before using the intervention program. Virtually every

48
successful fluency intervention has the following characteristics: The assessment for
original placement is multi-faceted (not just based on standardized tests), the length of
intervention is determined by the level of need, the interventions are research-based, the
teacher is knowledgeable, and progress is monitored as movement within the program is
accelerated (Feldman, 2004).
Referrals to the reading specialist for placement in a reading intervention program
such as those listed above should be made before the reading fluency problem has
become unmanageable for the teacher and student in terms of time spent on classroom
level remediation (Tier Two intervention if RTI is in use; Coyne, Kame’enui, &
Simmons, 2001; Vaughn et al., 2009). If the school is focused on literacy achievement
and the students have had access to a variety of reading materials and reading fluency is
still an issue “it is likely that an intervention program or initiative is necessary” (Fisher &
Ivey, 2006, p. 181). If a new intervention is implemented and seems to be working, gains
in comprehension should accompany the gains in fluency. Current research emphasizes
the importance of intervention that is early, intensive, and persistent (Coyne et al., 2001;
Harn, Linan-Thomson & Roberts, 2008; Jitendra et al., 2004; NRPR, 2000; Vaughn et al.,
2009).
While fluency interventions can be effective, prevention is usually the wisest
course of action. Fluency interventions have come and gone, but several fluency
preventions have withstood the test of time and become accepted by reading experts as
best practice. To prevent the initial occurrence of fluency problems, teaching techniques
must be examined and labeled as either ineffective or successful.

49
Like fluency interventions, prevention techniques for fluency are often adopted
based on current trends or shoddy qualitative research results rather than what has
actually proven to increase reading speed, accuracy, and prosody. For example, in the
1990s, before the NRPR (2000) was published, most classroom teachers had students in
high school read in round robin style. In round robin reading, each student takes a turn
and reads aloud until the entire text is completed. It sounds logical; students practice
reading, other students follow along until it is their turn. Unfortunately, there is no
evidence that the round robin technique does anything to increase fluency or
comprehension. In fact, it has been found to be a detriment to both fluency and
comprehension (Rasinski, 2003a). This is a clear example of a commonly-utilized
reading strategy that does nothing to increase fluency or improve comprehension.
All teachers need to be aware of reading research and be up to date on the most recent
pedagogical techniques and reading strategies in order to be able to teach their students
correctly; instruction makes a huge impact (Assaf, 2006; Blackford, 2002; Fischer &
Ivey, 2006). This requires them to be wise consumers of reading research so they can
differentiate between research-supported techniques and ones that are based on biased or
poorly-conducted research. What is fun, student-centered, or well-loved by students and
teachers is not necessarily what will work to increase reading fluency in at-risk secondary
struggling readers.
There are definite hallmarks of secondary reading programs that influence reading
fluency positively. The common characteristics of these programs are that they take
place in schools that have a specific required reading class or elective on a school-wide
basis, are implemented using a team approach amongst all of the content area teachers,

50
have incorporated fluency testing at regular intervals throughout the school year, provide
reading instruction at the academic level each student needs (Hempenstall, n.d.), and
utilize a research-based intervention program that teachers have been trained to use
correctly.
Some examples of classroom reading fluency strategies that have valid research to
back up their effectiveness are supported reading, code-based intervention, repeated
reading, performance reading, choral reading, and teacher read-alouds (Neumann, Ross,
& Slobach, 2008; Samuels, 1997). The NRPR (2000) said that guided oral reading with
feedback has a significant positive impact on reading fluency, as does repeated reading
exercises. Students clearly benefit from following along with their eyes as a fluent reader
(presumably the teacher) reads aloud. By following the guided reading with a repeated
reading technique, the teacher can utilize the two most effective fluency improvement
strategies with every text that the class encounters (O’Connor, White, & Swanson, 2007).
One research study found that "repeated readings . . . produced increased reading fluency
levels for three high school students who were identified with disabilities in the area of
basic reading skills" (Devault & Joseph, 2004, p. 25).
In his book The Fluent Reader, Rasinski (2003b) listed the benefits of repeated
readings as:
1. It helps good and poor readers recall facts and improves comprehension, which
then extends to other, unpracticed passages.
2. It is a better study strategy than note taking or outlining.
3. It helps students remember important information, such as main ideas and key
vocabulary.

51
4. It results in improved comprehension and more sophisticated insights.
5. It promotes faster reading with greater word recognition.
6. It helps struggling readers break out of word-by-word reading into more
meaningful phrasing.
Scaffolding, using a temporary support system until further learning is possible
(Vygotsky, 1962), is a teaching technique that is effective on many levels, in many
subjects, and with a variety of students. Reading fluency is certainly no exception. A
teacher should present a reading fluency technique and give a maximum amount of
support to the students until the technique has been learned thoroughly. As students
experience success, the teacher can release students to do more and more of the task on
their own until they can accomplish it independently (Fountas & Pinnell, 1996). Many of
the code-based reading programs, such as Wilson (Wilson, 2004), use this scaffolding
technique.
Scaffolding can be done as a series of classroom reading fluency exercises. In
fact, it is the method that most reading fluency strategies currently utilize. This method is
commonly referred to as supported reading, and is based on Vygotsky’s (1962) Zone of
Proximinal Development theory. Assessing reading fluency at regular intervals with
some type of curriculum-based measurement is another important aspect of fluency
teaching and intervention (Fuchs, Deno, & Mirkin, 1984; Fuchs, L. & Fuchs, D., 1986;
Hasbrouck & Tindal, 1992). Unfortunately, assessment of secondary students’ fluency is
a somewhat futile task until the assessor of fluency skill has national fluency norms for
comparison. Prevention of fluency problems and intervention in fluency problems are

52
very different matters and require very different pedagogical approaches, as the previous
paragraphs demonstrate.
Both Pikulski and Chard (2005) and the NRPR (2000) made it clear that the most
effective method for prevention of reading fluency difficulties is reading practice. When
a student reads, he naturally develops many of the skills that are necessary to prevent
problems with reading fluency, such as strengthening graphophonic foundations, building
vocabulary, and learning to recognize word parts and spelling patterns (Pikulski & Chard,
2005). Unfortunately, at-risk readers are much less likely to practice reading, further
widening the skill gap between them and their grade-level peers.
How Fluency’s Three Subskills Impact Reading Comprehension
The previous section defined fluency, its subparts, and common fluency
instructional and prevention techniques. However, the ultimate goal is not fluency itself,
but the increased comprehension that results from it. It is now known that “at the very
least, it is evident that overly slow and disfluent reading is a detriment to reading . . .
comprehension” (Rasinski et al., 2005, p. 79) and “improvements in fluency could
account for significant and substantial gains in students’ reading comprehension” (p. 79).
This hypothesized connection (Biemiller, 1978; Fuchs et al., 2001; Rasinski et al., 2005)
between fluency and reading success should make obvious the need to learn which of the
fluency subskills most influence comprehension.
The nature of the influence that each of these subparts of fluency has on reading
comprehension has not been thoroughly investigated by reading researchers. More
importantly, how much influence each of the fluency subskills has on reading
comprehension has not been determined. The “how much” is the correlational question

53
that drives this research because the answer to that question is directly related to the
ability to comprehend during the reading process. Following is a simplified explanation
of how each of the three fluency subskills impacts overall reading comprehension.
Speed
Reading speed and reading comprehension have repeatedly been shown to have a
strong connection. This is true for both grade-level and struggling readers (Biemiller,
1978; Wolf et al., 2000). When a reader can recognize and pronounce the words being
read quickly, he or she has to spend less mental energy on decoding, leaving more mental
energy to comprehend (Biemiller, 1978; LaBerge & Samuels, 1974). Often, a lack of
comprehension is not due to deficiency in vocabulary or a lack of understanding sentence
structure, but rather is the result of having spent all of the available brain power on
decoding individual words or word parts. This connection was first found by LaBerge
and Samuels (1974), but has been reinforced and expanded upon in more recent studies
(Biemiller, 1978; Hudson et al., 2009; Samuels, Miller, & Eisenberg, 1979; Wolf et al.,
2000).
Accuracy
The connection between reading accuracy and reading comprehension is more
obvious, even to casual observers. When a reader omits words, reads words incorrectly,
adds words, or repeats words, the meaning of the passage gets lost. The more words that
are read incorrectly, the more meaning is lost (LaBerge & Samuels 1974; Samuels et al.
1979; Wolf et al., 2000). The relationship between reading accuracy and reading
comprehension appears to be highly correlative. As more words are read incorrectly,

54
comprehension decreases because even the ability to figure out meaning in context is
reduced when there are so many unknown words, phrases, or ideas.
Prosody
Like fluency, reading prosody is difficult to define. What constitutes reading
prosody varies depending upon who is giving the definition. However, the elements that
most can agree upon are proper expression/intonation, suprasegmental ability, and
attention to textual clues. Prosody is sometimes seen as more of an indicator that
comprehension is occurring rather than a precursor to its occurrence, like reading speed
and reading accuracy (Jitendra et al., 2004; Kame’enui & Simmons, 2001). This author,
however, feels that reading prosody has a very direct impact on reading comprehension.
In fact, one of the hypotheses of this study is that reading prosody is the fluency subskill
that is most strongly correlated with reading comprehension. This hypothesis was made
because of the researcher’s belief that reading prosody is the strongest in students who
comprehend well, and the weakest in those who struggle with reading comprehension.
Dowhower (1991) and Schreiber (1987) found that infants use prosodic features as a
primary cue to the syntactic structure of their language. Children’s sensitivity to prosody
makes it reasonable to assume an equal dependence on prosodic features when
determining the meaning of text later in life (Kuhn & Stahl, 2000). Before looking at
other factors that may impact reading comprehension, it is necessary first to explain
reading comprehension in more depth.
Reading Comprehension:
An Examination of the Act of Understanding What is Read

55
History
Tracing the history of reading comprehension is not as simple of a task as it is for
reading fluency. Reading fluency is a much more technical topic, so along with
developments in technology and understanding of the human mind came new innovations
and theories. Reading comprehension has had few, if any technical improvements over
time. The goal of reading throughout history has always been to understand what is
being read. The purposes for wanting to understand written text may have changed, but
not the goal. Comprehension has always been the goal of reading (Allen, 2005; Chall,
1983; Goff, Pratt, & Ong, 2005; National Reading Panel, 2000). Whether the teacher
was concerned with the students’ ability to read and comprehend some holy book, classic
piece of literature, technical manual, or story read for pleasure, the concern has always
been comprehension of the literature. Strategies for teaching comprehension to students
have evolved as new research has taken place, but that is quite different than
technological innovation.
A distinction must be made here between testing comprehension and teaching
comprehension. It has only been relatively recently that teachers of adolescent readers
have begun to differentiate between the two, and teach accordingly. In the past, teachers
have read a passage with students or had them read it themselves, assumed
comprehension, and then asked questions about the text either verbally or in print. This
is testing comprehension. Now informed and educated secondary teachers model
comprehension strategies that ensure comprehension of text and then release the students
to use those strategies on their own. This is teaching comprehension.

56
Definition of Reading Comprehension
Simply put, to comprehend what is read is to be able to make meaning from the
text. Goff et al. (2005) stated that “reading comprehension involves the extraction of
meaning from written language and it would generally be agreed that comprehension is
the ultimate goal of teaching children to read independently” (p. 583). The debate
between author’s intent and the interaction of the reader with the text is beyond the scope
of this study, but it seems to this researcher that it requires more reading proficiency for a
reader to be able to look past his or her own experiences and biases and see the literature
in the way that it was intended than to simply view a text in light of life experiences.
Overarching Components of Reading Comprehension
There are many component skills that comprise reading comprehension. It is an
especially complex process for adolescent struggling readers because it involves many
facets of previously-learned reading skills that interact with newly-developing skills.
Cain, Oakhill, and Bryant (2004) stated that “text comprehension is a complex task that
draws on many different cognitive skills and processes” (p. 31). They also concluded
that reading researchers have very little knowledge of how the different component
comprehension skills work in unison because most research focuses on only one of those
components (Cain et al., 2004). However those individual component skills do give
reading experts some insight into how people comprehend. Whether readers use only one
of these comprehension component skills at a time or many in unison, as the Landscape
Model (van den Broek, Rapp, & Kendeou, 2005) suggests, is currently an unsettled
debate amongst reading researchers. Following is a list of the overarching skills that
comprise reading comprehension.

57
Vocabulary. There is a strong and nearly unquestioned positive relationship
between knowledge of word meanings and comprehension (Nagy, 1988; Zang, 2008). It
has been demonstrated through research that “proficient readers bring a wealth of word
knowledge that enables them to construct meaning across a variety of texts” (Keehn,
Harmon, & Shoho, 2008, p. 338). Some common vocabulary exercises include learning
word parts or word families, using context to figure out meaning, and using outside
resources such as dictionaries or thesauri.
Speed of cognitive processing. According to the Rauding theory (Carver, 1997),
comprehension does not depend on text difficulty or having a purpose for reading; it
depends only on the speed at which the reader can cognitively process the words. While
word recognition and other component skills are influential and significant early in life,
cognitive power takes over as the dominant component at approximately grade six.
Discussing the Rauding theory, Carver (1997) stated, “there is . . . an increase with grade
of the influence of cognitive power on reading comprehension” (p. 144). The view that
cognitive processing ability is a major component of reading comprehension is not held
by all. Much new research has been devoted to how to teach comprehension skills to
students whose cognitive abilities are impaired in some way. However, the very fact that
teachers need to spend an inordinate amount of time and effort teaching comprehension
skills to the cognitively weak only reinforces the Rauding Theory’s tenants. Which
approach is more correct pedagogically is irrelevant to the fact that cognitive processing
does play an enormous role in reading comprehension.

58
Word identification. The ability to rapidly identify words is an essential
precursor to reading comprehension. McCollin et al. (2010) described the need to
identify words this way:
Many struggling secondary readers . . . continue to struggle with word
identification (e.g., syllabication, identification of affixes to help break
words into parts). Research has found that students who expend great
energy on decoding typically do not read extensively and, consequently,
they do not acquire the background knowledge essential for
comprehending secondary-level content-area subject material (p. 133).
This is an especially prevalent problem amongst students of low socioeconomic status.
Attention to textual structures and features. The most commonly-utilized text
features are “illustrations, headings, captions, boldface words, graphs, diagrams, and
glossaries” (Fisher, Frey, & Lapp, 2008, p. 554). Text structures are often broken down
into the following types: compare/contrast, problem/solution, cause/effect, chronological,
or descriptive. Each of these text types require the reader to bring a different set of skills
to the text in order to comprehend adequately.
Problems With Reading Comprehension
The complex process of reading and understanding often (and quickly) breaks down
with adolescent at-risk readers. The reasons for this can be found by examining the
specific subskills that are needed to comprehend, but that are generally lacking in
adolescent struggling readers. Those skills are numerous and varied, but according to
McDonald, Thornley, Staley, and Moore (2009), they can be combined into five distinct
categories:

59
1. previewing text, then applying knowledge about text forms and the ways to use
this knowledge to prepare for reading or writing
2. using the surface and language features of a text to build content knowledge prior
to reading
3. enhancing comprehension by using more complex skills such as inference and
synthesis while continually cross-checking new understandings with what was
learned from the preview
4. solving vocabulary problems as they arise during the reading processes
5. reading for a range of purposes and audiences
Wu and Hu (2007) mentioned the need for these additional comprehension skills:
6. textual schema
7. vocabulary knowledge and ability to guess at unknown vocabulary meanings
8. motivation to succeed in life
Recently, reading comprehension best practice has been for teachers to utilize a
set of strategies-based skills designed to be used with any text type of any difficulty.
Teaching the strategies-based approach emphasizes previewing the passage, noticing
textual features, metacognition, postreading exercises, summarizing while reading,
paraphrasing, and attention to new vocabulary (Rogevich & Perin, 2008). This approach
has been successful with most adolescent at-risk readers (McKeown, Beck, & Blake,
2009).
Catts, Adlof, and Weismer (2006) disagreed that reading comprehension
difficulties are as complex as many modern researchers claim them to be. They asserted
that deficits in reading comprehension are simply the direct result of deficits in

60
comprehension of verbal language. Poor adolescent readers can translate words into
language (word identification), but cannot make sense of the linguistic information. This
is a view that has ample support in literature (Cain, Oakhill, Barnes, & Bryant, 2001;
Gough & Tunmer, 1986; Hoover & Gough, 1990) and cannot be disregarded when
discussing problems that lead to comprehension deficiencies.
Reading Comprehension: Prevention and Intervention
While prevention of comprehension difficulties begins very early in elementary
school (because some of the skills needed to comprehend begin to develop then),
intervention in reading comprehension difficulties rarely occurs until upper elementary or
middle school, and then by high school the opportunity to remediate is greatly
diminished. This occurs because the material that is read increases in difficulty every
year, so the student who appears to have the appropriate level of comprehension skills
early on due to the easier reading assignments often have not actually developed the
requisite skills needed, and that becomes evident when reading becomes more rigorous in
middle and high school. Meanwhile, years of potential remediation opportunities have
been lost. This phenomenon is a huge problem in terms of recognizing and addressing
comprehension deficiencies.
The other obvious problem years of lost remediation time creates is that most
schools do not employ reading teachers beyond elementary or middle school, and most
secondary-level content area teachers are not trained to intervene to remediate
comprehension deficits. Therefore, the student has lost the chance at remediation and
begins a cycle in which he becomes frustrated with difficult text, tries for a little while,

61
then gives up and remains stagnant for the remainder of his years in school. Thus, it is
too late for prevention, and intervention is often either unavailable or ineffective.
Effective intervention most often involves instruction in strategies that, when internalized
and consistently utilized, aid in comprehension of difficult text. Comprehension
strategies are too numerous and varied to cover them all in this literature review.
However, some are worth mentioning here. A strategy that has been proven to be very
successful when properly implemented and frequently practiced is paraphrasing. In a
case study of at-risk middle school students (N = 3), Hagaman and Reid (2008) found
that paraphrasing activities increased overall reading comprehension.
Another strategy, called a “framework for reading comprehension instruction”
(Faggella-Luby & Deshler, 2008, p. 71), recommends including (a) knowledge of text
structures (both narrative and expository), (b) vocabulary/depth of word meaning, (c)
domain/prior knowledge, (d) cognitive strategies, and (e) increased
motivation/engagement in all reading comprehension instructional situations.
Among the three strategies (i.e., context-based, strategies-based, and basal-based)
most commonly utilized by content area teachers in secondary school settings to teach
comprehension skills, the approach based on the explicit teaching of comprehension
strategies (such as making inferences, finding detail, summarizing, visualizing,
synthesizing, evaluating, connecting, predicting, generating questions) was found to be
superior to the context-based approach and the basal-based approach (McKeown et al.,
2009). Allen (2005) also found these strategies to be optimal for reading skill
development.

62
Other Factors That Influence Reading Comprehension
The three predictor variables (reading speed, reading accuracy, reading prosody)
that will be examined in this research were explained in the fluency section above.
Certainly there are other factors that influence reading comprehension. Children acquire
the ability to read and write as a result of all of the cumulative circumstances and
experiences in their lives (Morrow, 2005). These cumulative circumstances can be
classified into two distinct categories: factors that are innate and factors that are
environmental in nature. The factors within each of these two categories are each well-
supported by rigorous studies. They are discussed here so that as many influential factors
as possible are investigated in regards to their impact on reading comprehension.
However, these factors will not be included in the correlation analysis as most are either
not quantifiable, a tool to measure them does not exist, or the time to measure them
would be prohibitive. They were chosen because literature from the fields of education,
reading, psychology, medicine, and sociology support their inclusion as factors that can
potentially impact reading comprehension. Each of these factors may contribute to some
degree of reading comprehension. Whether or not causation can be determined is a
matter for future studies. It is worth noting that the majority of the risk factors that are
associated with school failure are similar and can be changed with the correct
intervention.
Innate factors. At-risk adolescents routinely read below the average for their
peer age group (Christle & Yell, 2008; Harris, Baltodano, Bal, Jolivette, & Malcahy,
2009). This only compounds the problems that already exist among adolescent who are
classified as at-risk. There are researchers who believe reading disability to be traceable

63
to a specific gene or group of genes (Bisgaard, Eibery, Moller, Niebuhr, & Mohr, 1987;
Fisher, Stein, & Monaco, 1999). While that is yet to be determined, there are innate traits
that research has connected to reading disability empirically. The number of aggravating
innate factors that exist in poor readers are too numerous to investigate each of them
thoroughly. An attempt is made in this study to choose the ones that are the most
consistently mentioned in the reading research literature. Along with the three fluency
independent variables that were part of this research, following are other innate factors
that may be influential in regards to how quickly, or how successfully, at-risk adolescents
attain adequate reading comprehension.
Reading disability (RD). It seems on the surface that all identified reading
disabilities should have a very negative impact on reading comprehension. That is
certainly not true. Some reading disabilities, such as dyslexia, cause problems with
phonemic abilities, but do not lead to adolescent comprehension shortcomings if the
disability has been dealt with at an earlier age using a program specifically designed to
help correct the disability (Hazoury, Oweini, & Bahous, 2009).
Many of the participants in this study had reading disabilities that may influence
reading comprehension more dramatically. A majority of the participants suffer from
attention deficit hyperactivity disorder (ADHD) and/or have a RD. Such students face
difficulties in reading comprehension that are more troublesome to overcome (Ghelani,
Sidhu, Jain, & Tannock, 2004; Willcut et al., 2007). When a student has a RD, the
success of intervention depends on the nature of the specific RD, the intervention used,
when the intervention began, the intensity and frequency of the intervention, the
motivation of the student, and the persistence of the instructor.

64
Motivation to comprehend what is read. Motivation to succeed in school is an
extremely complicated matter. No teacher, literacy specialist, or researcher holds the key
to motivating all students in all situations. Motivation to succeed is a largely
individualized characteristic. The undeniable truth, however, is that motivation is
essential to reading success at all reading levels, and for all ages (Zweirs, 2004). The
motivational techniques that work with some students often do not work with others, or
work to a lesser degree.
Motivation to read is even more elusive than motivation as a whole. A student
could easily be motivated to do well in school or life and have no motivation to read
anything other than what is absolutely necessary to get good grades and perform daily
functions. High interest reading materials sometimes work, as do some other common
motivational techniques (Frager, 2010; Guthrie, Coddington, & Wigfield, 2009).
Eventually, however, the motivation to read has to begin to come from within, and not be
placed there by external forces such as parents or teachers. The students whose archival
data was analyzed for this study are largely unmotivated students in general, and
unmotivated readers specifically. It is likely that the few students who are motivated to
read comprehended what they read reasonably well.
Perception of the importance of reading. Another factor in reading success is
how important students perceive reading to be in their own lives. Like so many other
things, if adolescents do not see the value in an activity, they simply will not pursue it
(Lapp & Fisher, 2009; Pitcher, Martinez, Dicembre, Fewster, & McCormick, 2010).
Many teachers spend time trying to instill the value of reading in at-risk readers instead
of motivating them in more tangible ways-some successfully, some not so successfully.

65
At-risk youth, who are often fighting a number of other life issues, are unlikely to see
how reading well could positively impact their future. They are more interested in day-
to-day survival. Unfortunately, even if adolescents do begin to see the importance of
reading, they are often so far behind their grade-level peers that the reading they do in the
classroom is frustrating to them. The most effective approach, once student see the value
of reading well, appears to be catching them up to grade level with high-interest/low-
level reading materials while still delivering grade-level content.
Stress. Stress plays havoc on the human mind and body. The chemical changes
that stress causes in the brain can lead to depression and anxiety. Brinley (2006) said, the
brain is where the effects of stress can become “neuro-chemically stamped to grow into
full-fledged anxiety disorders, mental illness, phobias, sleep problems and/or depression”
(p. 1). During adolescence, stressors are everywhere. Teenagers, especially at-risk
teenagers, are constantly bombarded with information and demands from parents,
teachers, counselors, and social workers. Of course, stress is compounded exponentially
for the participants in this study, since they are incarcerated adolescents. It is likely that
high levels of stress in the lives of students negatively impacts reading comprehension
due to the depression of the serotonin and dopamine that decreases during adolescence
due to a natural process called synaptic pruning (Huttenlocher, 1979). Resilience is
necessary for them to overcome the stress and succeed.
Time spent reading per day. Adolescents today simply do not read as much as
they did a generation ago (participants in this study are atypical due to the amount of time
they spend alone, reading is often their only option other than sleep), which is regrettable
because time spent reading is directly related to overall academic performance (Manzo,

66
2007). Unfortunately, struggling adolescent readers actually read less in school than on-
level readers due to time spent on targeted intervention (Fisher et al., 2008). Clark (2006)
found that reading just 20 minutes per day increased reading ability in adolescents who
were at-risk readers. Many adolescents will report that they read (text messages, instant
messages, emails, etc.), but they read very little text that exposes them to narrative or
expository structure.
Some theorists surmise that educators should adjust their literacy instruction to
match the technology that adolescents are using (Prensky, 2001; Williams, 2008).
However, the way the brain processes language, visually and auditorally, has not
changed. Reading the specialized text language and misspelled emails do more harm
than good in terms of improving reading skills because it hardly resembles the reading
skills that will be necessary to survive in high school (Manzo, 2007). Proper reading
instruction and real reading opportunities increase neural connections (Wesson, 2003)
and help the student to become a more culturally literate member of society (Hirsch,
1988).
Phonics ability. It is well known that ability in the area of phonics allows for
better comprehension of material because of the increased speed with which text can be
read (Biemiller, 1978; LaBerge & Samuels, 1974). However, while it is possible to have
solid phonics skills and still have other issues that prevent adequate comprehension, it is
not possible to comprehend well without a strong base in phonics. Phonetical ability is
essential to all areas of reading; comprehension is no exception. Reading disabilities of
all types are developmental in nature and “usually result from impaired phonological
processing” (Willcut & Pennington, 2000, p. 1039). Students who have a RD are very
67
likely to suffer from deficiencies in orthographic coding (Warnke, 1999), making
automatic reading nearly impossible, which in turn makes comprehension very unlikely.
Conversely, intensive instruction in phonics and phonemic awareness has a profound
impact on the brain, altering its very structure. Keller and Adams (2009) found that 100
hours of intensive remedial instruction affected the cerebral white matter of poor readers.
The instruction resulted in significantly increased activity in the white matter (white
matter is the tissue that allows for quick transportation of messages between areas of gray
matter), which correlated with improvement in phonological decoding ability.
Presence of Attention Deficit Hyperactivity Disorder (ADHD). It is very
difficult for students who have been diagnosed with ADHD to focus on any task, but
especially an attention-intensive activity like reading. Willcut et al. (2007) found that
ADHD has a “significant impact” on academic development (p. 190). They also noted
that teachers should, and usually do not, receive instruction on how to conduct
intervention for students with ADHD.
ADHD impacts reading comprehension in a variety of ways, but most obviously,
students who cannot concentrate on their reading task will not be able to recall what they
read. Comprehension certainly suffers when this happens. Paloyelis, Rijsdijk, Wood,
Asherson, and Kuntsi (2010) stated that “the co-occurrence between ADHD. . . and
reading disability. . . is well-documented” (p. 1083). They also found that the
relationship is driven by genetic factors, which means that the student with ADHD has an
innate disadvantage in regards to reading acquisition. Therefore, ADHD most certainly
impacts reading comprehension when present.

68
Listening comprehension. It stands to reason that if a person can listen and
comprehend what is being said, he or she would be very likely to be able to read and
comprehend as well. Both listening comprehension and reading comprehension require
the ability to take in information and process it correctly; therefore, both should correlate
highly with reading comprehension. Unfortunately, this is not always the case, especially
with the target population in this study, so the correlation between listening
comprehension and reading comprehension may not be as high with at-risk readers as
reason would dictate. This is especially true considering the high incidence of ADHD
among poor readers (Ghelani et al., 2004; Willcut et al., 2007). Additionally, Stothard,
Snowling, Bishop, Chipchase, and Kaplan (1998), in a follow-up study of 71 adolescents
with a history of speech-language impairments, found that early listening comprehension
deficiencies caused reading problems that persisted into adulthood.
Intelligence. One of the age-old questions in the field of reading is: Do
intelligent people read more because they are intelligent, or are they intelligent because
they read more? Of course there are truly intelligent people who are not great readers,
and therefore are not efficient comprehenders of text. Conversely, many intelligent
people say they owe their academic aptitude and intelligence to years of vigilant wide
reading of texts. Tiu, Thompson, and Lewis (2003) and Vellutino (2001) found that IQ is
a significant predictor of reading comprehension ability in adolescent readers. It is also
true that IQ predicts the success of reading intervention attempts (Stage, Abbott, Jenkins
& Berninger, 2003). In addition, Johnson, Bouchard, Segal, and Samuels (2005) found
that reading comprehension is related more with general intelligence than reading
aptitude. Some studies have found contradictory results (Kortteinen, Narhi, Ahonen,

69
2009; Siegel, 1989), but the majority of reading experts believe that IQ and reading
ability are strongly correlated. Admittedly, implicit in the comparison between IQ and
reading comprehension is the assumption that intelligence can be measured by a
standardized IQ test.
Brain-related factors. The adolescent brain is in a state of transition during
adolescence (Casey, Jones, & Somerville, 2011.). Huttenlocher (1979) stated that
adolescents are encountering a reconfiguration of the prefrontal cortex (responsible for
thought and behavior) that is “meant to improve organization of thoughts, language
mastery, and other higher order executive functions” (Huttenlocker, as cited by Schwartz,
2007, p. 89). Also, as the thickening of the frontal lobe occurs, “their emotional and
behavioural responses are essentially unmediated by judgment and reasoning” (Schwartz,
2007, p. 88).
The good news concerning this reconfiguration of brain function, according to
Yakolev and LaCours (1967), is that “their thinking is more efficient, their ability to
process information is faster, and their decision-making is more automatic” (p. 86). Even
when damage has occurred, it is possible to “bring about significant and durable changes
in brain organization so that brain activation patterns resemble those of typical readers
using an intensive evidence-based reading intervention” (Shaywitz, 2006, p. 627). As
these brain changes occur, the adolescent is also charged with improving reading and
language skills.
Problems with the mechanisms of hearing and speech. When a child cannot
hear perfectly early in life, they have trouble hearing and/or reproducing the sounds of
the English language. When a child with profound hearing loss graduates from high

70
school, they do so reading at an average of third-grade level (Holt, 1994). Since English
is a phonics-based language (letter-sound correspondence is important), reading
comprehension difficulty is a logical outcome of hearing loss. This was confirmed by
Connor and Zwolon’s (2004) study (N = 91) of students with hearing loss and speech
problems who received cochlear implants are varying ages. Speech difficulties do not
have as significant of an impact on reading comprehension as does a combination of
speech difficulty and hearing loss.
Physical fatigue. One medical journal article stated that more than one-third of
adolescents have fatigue four or more times per week (Viner & Christie, 2005). Teachers
of adolescents often cite fatigue as a reason that concentration during school is difficult
for their students. Fatigue that is chronic or frequent is even more impactful. Public
school secondary teachers are aware that a large majority of students arrive at school each
day sleep deprived; they also know how strongly that influences thinking, processing, and
motivation. Maslow (1943) would place sleep in the “basic needs” category. Without
sleep, no other need along the hierarchy will be able to be met.
Working memory. The ability to comprehend is diminished when the cognitive
load on working memory exceeds the capacity of working memory to put forth anymore
mental energy (LaBerge & Samuels, 1974; Wooley, 2010). Working memory is “a
system for temporarily storing and managing information required to carry out complex
cognitive tasks such as learning, reasoning, and comprehension” (Medterms.com).
Working memory is limited (the average person can hold seven items in working
memory), and when its capacity is exceeded, information is lost (Sung et al., 2009).
Working memory is essential to reading comprehension. It actively holds information

71
that is needed for complex reading tasks and recalls it to meet task demands (Numminen,
2002). Another important facet of working memory, as found in Baddeley and Hitch’s
(1974) seminal study, is how it is influenced when the subject has a RD that impacts the
central executive system that controls the flow of information to and from the visual and
hearing centers in the brain.
Environmental factors. Environmental conditions are significantly more
disruptive in poor readers than in students who read at or near grade level (Samuelsson &
Lundberg, 1996). More troubling is their finding that these environmental influences are
larger when considering more global, rather than more specific reading skills. Therefore,
environmental influences play a bigger role in the development of reading
comprehension than in the development of other reading subskills (Samuelsson &
Lundberg, 1996). Following is a sampling of these environmental factors:
Prior remediation attempts. Prior attempts at remediation often have a great
influence on a student’s ability to read because they affect not only his or her motivation,
but also influences his or her personal belief in the success of future remediation
attempts. In addition, those prior attempts might have been largely ineffective (especially
in this study’s target participants), or even harmful due to untrained instructors or poor
curriculum (Christle & Yell, 2008; Fisher et al., 2008). Therefore, future attempts to
remediate comprehension difficulties have to actually undue prior harm before proper
training can be actuated. If prior attempts had been effective, the student would likely
not be encountering comprehension problems at the secondary level.
The biggest failure in this regard is the Individual Education Program (IEP) process,
which regularly fails at addressing early reading deficiencies, very often causing them to

72
persist into high school (Catone & Brady, 2005). It is likely that as prior remediation
attempts increase, adolescent comprehension problems increase proportionally. A
student’s response to intervention, if it were to occur at all, would likely come during an
early remediation attempt; logically speaking, multiple attempts indicate a resistance to
intervention.
Presence of a school literacy specialist. Targeted reading instruction for
secondary struggling readers is becoming more common as the field of adolescent
literacy grows. NCLB (2001) leaves little choice for school districts. Many secondary
schools must employ literacy specialists in order to meet the needs of the growing
number of students that arrive in middle and high school with deficient literacy skills.
However, there are still far more secondary schools that do not employ literacy specialists
than those that do (Blackford, 2002). The presence of a school, or even district, literacy
expert in previous school settings is a variable that should correlate positively with
reading comprehension for the at-risk students in this study.
Average amount of sleep per night. The amount of sleep that students get on
average each night almost certainly influences the ability to comprehend text (Viner &
Christie, 2005). Each night, the brain’s short-term memory “downloads” all of the day’s
learning to the hippocampus, the brain’s long-term memory storage center (Zhang, 2004).
This transfer can only be made completely and effectively during times of deep sleep.
Zhang (2004) said, “The function of sleep is to process, encode, and transfer the data
from the temporary memory to the long-term memory” (p. 1). Obviously, if deep sleep is
not occurring, only a very small percentage of what is in short-term memory is retained.

73
If the hippocampus does not have the schema, or files, that are created and updated
during sleep time, accessing old information is not possible.
The student who does not sleep well and then picks up a book about World War
II, for example, does not have a file for World War II information readily available
because of the inability to download the previously-learned information. Since accessing
prior information and vocabulary is such a large component of reading comprehension,
the students will not be able to understand the World War II book as well as they
otherwise might have if they had slept well. In addition, lack of sleep causes
concentration and brain chemistry difficulties, which both influence the ability to
comprehend well. Complicating the matter further is when the presence of a RD, such as
dyslexia, makes retrieval of items stored in the long-term memory difficult (Warnke,
1999).
History of drug and alcohol use. Extended drug and alcohol use adversely
impacts the brain by making the retention of information that has been read much more
difficult (Zhang, 2004). Unfortunately, some of the damage done to the brain by drug use
is irreversible, especially in some of the participants in this study because their drug use
has typically been heavy and prolonged. With the prevalence of drug use among
incarcerated adolescents, it is likely that nearly all of the students whose reading data will
be analyzed for this study will have a history of drug and/or alcohol abuse. According to
the Summary of Findings from the 2009 National Household Survey on Drug Abuse
(2010), 10 million adolescents (ages 12-17) had used illicit drugs within the past month.
Given these statistics, it is possible that drug and alcohol use plays a significant role in
the reading ability of adolescents.

74
Socioeconomic status. Poverty has always been thought to be a strong predictor
of student reading success (Bhattacharya, 2010; Crowe, Coyne, McDonald, & Petscher,
2009; Hecht & Greenfield, 2002). Studies like the one done by Saripinar and Erden
(2010) bear this out. They found that “there were significant differences between reading
comprehension scores at different socioeconomic levels” (p. 68). However, it is unlikely
that reading comprehension is impacted very strongly by the socioeconomic status of
students. Certainly poor students are likely to miss school, receive less support at home,
and read less. Those things are the actual causes of poor reading comprehension, not
poverty itself.
Parent level of education. Parent education is very similar to socioeconomic
status in that it is seen as a predictor of student success, but the underlying variables are
often ignored. Parents who are uneducated or who barely finished high school are less
likely to provide the early childhood literacy experiences needed for their children to
develop normally as readers (Senechal & Lefevre, 2002). Those things lead to poor
performance in reading in general, and reading comprehension in particular, not the
parents’ level of education. If a child is not being read to, he will not be as aware of story
structure, words, and language patterns. The link between parental level of education and
their children’s literacy skills has been made many times (Senechal, 2006; Sticht &
McDonald , 1990), but has also been refuted in similar studies many times. One such
study, done by Teale (1986), reported that the research on the issue is at fault because
“children are tested . . . and their achievement levels are then correlated with particular
home background characteristics. Such research provides no direct evidence for cause-
effect relations. Yet . . . these studies suggest implications for instruction” (p. 14).

75
Modern home literacy programs are now the norm in elementary schools. Literacy
experts spend time in the homes of incoming Kindergarten students to support literacy in
homes where parents are either not literate or not aware of the importance of an early
start in reading.
Level of parental involvement. Practically axiomatic is the concept that family
involvement is important to adolescent development and educational attainment
(Catsambis, 2001; Gregory & Rimm-Kaufman, 2008). The number of parents in the
home and the involvement of those parents in the lives of their children create either
feelings of security or feelings of insecurity. How a child feels when he or she goes to
school in the morning plays a huge role in the amount of attention and effort that is put
into reading during the day. Maslow’s (1943) hierarchy is relevant to the student’s
preparation to tackle the academic challenges of the school day. If a child does not have
parents who are involved and caring and does not feel secure when at home, reading
comprehension will be very far from his or her mind during the school day.
History of abuse and neglect. The prevalence of a history of abuse and neglect
amongst adolescents in the United States is astounding. Many abused and neglected
children end up incarcerated as adolescents. One study conducted by the Massachusetts
General Hospital for Children (2010) found that between 25-31% of adolescent offenders
were abused and/or neglected before imprisonment. Serious abuse and neglect often
leads to depression, or other psychoses that result in altered brain chemistry or altered
personality. Other untreated health problems are also common amongst the at-risk
population (Massachusetts General Hospital for Children). That is why it is easy to see

76
why reading deficiencies are so common in this group, and why reading comprehension
is almost certainly affected by abuse and neglect.
Stability of housing. Students come to secondary schools with a number of
different housing backgrounds. Some are homeless, some live with one or both parents,
some with friends or relatives, and some in state-run foster care or long-term care
facilities. Appropriate housing is an essential need that undergirds the security that is
needed to achieve success as a reader (Maslow, 1943). A separate aspect of constantly
changing or inappropriate housing is that the student misses reading instruction that is
essential. If a student stays at one school for the duration of the school experience and
only lives with only one guardian, the chance of receiving sequential, structured reading
instruction is much more likely than if the student attends many different schools and has
multiple guardians. One of the effects of housing stability is better reading ability in
general, and better reading comprehension in particular.
Incarceration. Incarcerated adolescents often arrive at correctional facilities
having not attended school for long periods of time due to suspensions, expulsions, or
refusal to attend. Very often they have been identified as having emotional or behavioral
disabilities. In fact, 47.7% of students in correctional facilities are diagnosed with an
emotional or behavioral disability. That number is only 8.1% in public schools (Allen-
DeBoer et al., 2006). Because of these disabilities, incarcerated adolescents are often
unable to read proficiently; they are often several years below grade level. While large
reading gains are common in correctional settings, it is unlikely that they will maintain
that progress after release. Systematic reading instruction holds the most promise for

77
helping incarcerated youth (especially those with behavioral disabilities) succeed
academically.
Conclusion
Adolescent at-risk readers perform more poorly (i.e., academically, socially,
behaviorally) in the classroom than their peers who are not classified as at-risk (Klecker
& Pollock, 2004). This fact cannot be ignored; it is not a coincidence. The innate and
environmental obstacles faced by at-risk readers are overwhelming. The burden of work
becomes overwhelming in the high school classroom if the student cannot process the
information presented with a reasonable degree of fluency and comprehension, in
addition to the other previously-mentioned factors constantly interfering with their ability
to read effectively and efficiently. The same is true of the standardized tests that students
face in high school. The amount and level of reading is often too much for a struggling
adolescent reader to comprehend in the time allotted. Failure is frequently the result.
Unfortunately, reading deficiencies and disabilities are often ignored in high
school settings. Secondary school teachers and administrators should take a stand against
the exclusion of reading instruction because “adolescents are being shortchanged. No
one is giving adolescent literacy much press . . . In the United States, most Title I budgets
are allocated for early intervention. . . many people don’t recognize reading development
as a continuum” (Moore, Bean, Birdyshaw, & Rycik, 1999, p. 2). Of course, it is
imperative that early reading intervention remain a focus of funding, resources, and
manpower because early reading ability strongly predicts reading ability at the time of
high school graduation (Cunningham & Stanovich, 1997).

78
However, attention must be given to those who have either slipped through the
cracks, arrived in this country during later school years, or regressed as readers over time.
Even attention alone is not adequate; attention must be focused on the most effective,
research-based instructional and intervention programs available. Despite the obvious
need, the most valuable information to help make those types of programming
determinations has not yet been the subject of adequate research. It is imperative to know
which of the three fluency subskills are most highly correlated with reading
comprehension if reading teachers are to maximize their instructional and intervention
efforts.

79
CHAPTER THREE: METHODOLOGY
Introduction to the Study
The purpose of this correlational study was to utilize archival data to examine the
relationship between reading speed and reading comprehension, reading accuracy and
reading comprehension, and reading prosody (the pace, smoothness, expression, attention
to textual clues, and suprasegmental ability with which one reads) and reading
comprehension in at risk adolescents (ages 13-19) at a maximum security juvenile prison
in the Northeastern United States. The fluency variables of interest were (a) reading
speed, generally defined as how many words are read correctly in one minute, (b) reading
accuracy, generally defined as how many words are read correctly as a percentage of the
number of total words read, and (c) reading prosody, generally defined as how smoothly
one reads. Bivariate correlational analyses were conducted to examine the relationship
between each of these fluency subskills and reading comprehension, generally defined as
how well one understands what is being read. Understanding the relationships between
these variables will enable reading specialists to make reading intervention for at-risk
adolescents more focused, efficient, and effective. This more focused, efficient, and
effective approach to reading intervention will be possible because the results of the
quantitative analyses shows which of the three fluency skills most highly correlate with
reading comprehension, which is the most basic goal of all reading activity.
Research Design
The NRPR (2000) identified fluency as one of the five essential skills for reading
success. The present study helped determine the effect size and order of importance of

80
each of these fluency subskills in relation to the reading comprehension variable of
interest. According to Ary et al. (2006), a correlational research design seeks to
“determine the strength and direction of relationships” (p. 29). A correlational design
was chosen because it was a useful way to analyze the archival data and explore the
relationship between the three fluency variables of interest and reading comprehension.
Reading rate, reading accuracy, and reading prosody were chosen as the fluency variables
for this study because they were identified by the NRPR (2000) as the three major skills
that comprise reading fluency. Understanding the relationship between these variables
enables classroom teachers and reading specialists to make reading intervention for at-
risk adolescents more focused, efficient, and effective (Pikulski & Chard, 2005). Once
the researcher quantified the relationships among the reading variables, the correlation
coefficients were examined in order to answer the final research question, which asked
which of the three fluency subskills were most strongly correlated with reading
comprehension in at-risk adolescents. Visual representations of the data were produced
to aid in interpretation.
The research questions examined are as follows:
1. Is there a statistically significant relationship between reading speed (as
measured by the QRI-4) and reading comprehension (as measured by the
MAP) in at-risk adolescent readers?
2. Is there a statistically significant relationship between reading accuracy (as
measured by the QRI-4) and reading comprehension (as measured by the
MAP) in at-risk adolescent readers?

81
3. Is there a statistically significant relationship between reading prosody (as
measured by the MFS) and reading comprehension (as measured by the
MAP) in at-risk adolescent readers?
4. Which of the three fluency variables (as measured by the MFS and QRI-4)
is most strongly related to reading comprehension (as measured by the
MAP) in at-risk adolescent readers?
The associated research hypotheses are as follows:
1. There is a statistically significant relationship between reading speed (as
measured by the QRI-4) and reading comprehension (as measured by the
MAP) in at-risk adolescent readers.
2. There is a statistically significant relationship between reading accuracy
(as measured by the QRI-4) and reading comprehension (as measured by
the MAP) in at-risk adolescent readers.
3. There is a statistically significant relationship between reading prosody (as
measured by the MFS) and reading comprehension (as measured by the
MAP) in at-risk adolescent readers.
4. The fluency variable (as measured by the MFS and QRI-4) that is most
strongly related to reading comprehension in at-risk adolescent readers (as
measured by the MAP) is reading prosody.
The null hypotheses are as follows:
1. There will be no statistically significant relationship between reading
speed (as measured by the QRI-4) and reading comprehension (as measure
by MAP) in at-risk adolescent readers.

82
2. There will be no statistically significant relationship between reading
accuracy (as measured by the QRI-4) and reading comprehension (as
measure by MAP) in at-risk adolescent readers.
3. There will be no statistically significant relationship between reading
prosody (as measured by the MFS) and reading comprehension (as
measure by MAP) in at-risk adolescent readers.
4. There will be no statistically significant difference between how strongly
reading prosody (as measured by the MFS) is related to reading
comprehension (as measured by MAP) and how strongly reading speed
and reading accuracy (as measured by the QRI-4) are related to reading
comprehension (as measured by MAP) in at-risk adolescent readers.
Participants
The focus of this study was a convenience sample of incarcerated at-risk adolescent
readers from a school inside a maximum security juvenile prison in a rural section of the
Northeastern United States. Even though a convenience sample was utilized, all of the
participants met the “at-risk” criteria set for study participants. Archival reading data
from 82 current and former students was gathered and analyzed. The smaller data pool
helped the researcher retain practical utility in the results while still finding significant
correlations (Ary et al., 2006). Incarcerated adolescents were the ideal group from which
to gather archival data for a study on the reading ability of at-risk adolescents; they are
the quintessential at-risk population. As a group, they have experienced nearly every
obstacle to reading success that a person can experience. The pervasiveness of risk
factors that are present in this population certainly helps the generalizability of the
83
results, although the uniqueness of the circumstances that the students face every day
limits the study’s generalizability, as discussed in Chapter 5. The criteria for a student’s
data to be used in the study was as follows:
• Age: 13-19 at the time assessments were administered
• Availability: Full data sets were available for analysis
• Gender: Male
• Ethnicity: Any could participate
• Identification: Participants must be considered at-risk (defined in this study as
commitment to the target facility).
The participant qualification criteria were chosen because the purpose of the study was to
determine the relationship between fluency subskills and reading comprehension in at-
risk male adolescents. Incarcerated adolescents are considered at-risk because the
majority of incarcerated youth have low literacy skills, although most have an abundance
of other risk factors as well (Baltodano, Harris, & Rutherford, 2005; Cheesman & De
Pry, 2010; Christle & Yell, 2010; Hodges, Giuliotti, & Porpotage II, 1994; Krezmien &
Mulcahy, 2008). The only students who were excluded from this study were middle
school students who had not yet reached their thirteenth birthday, high school students
who had already reached their twentieth birthday, or students for whom no complete data
set could be located. Women were excluded from this study because reading problems
are more persistent and widespread in adolescent males than in adolescent females, and
therefore males were the focus of this preliminary study examining the relationship
between reading fluency subskills and reading comprehension.

84
Additional school and participant information, including population
demographics, can be seen in Table 1.
Table 1
Demographics of the Study Participants ________________________________________________________________________
Demographic Category n % Total Participants 82 100 Males 82 100 Caucasian 78 95.1 African-American 3 3.6 Native American 1 1.2 Limited English Proficiency 0 0 Students Performing Within One 56 68.2 Standard Deviation of the Norm On MAP Reading Comprehension Students Identified as Special Education 60 73.1 _______________________________________________________________________
Every student for whom a complete data set was available comprised the sampling frame.
The only exclusions made were students for who no standardized test data could be
gathered. For example, some students were nonreaders or lacked the mental stability to
participate in testing, so no data exists on them to analyze. Most of the participants were
identified as special education students or were enrolled in Title One. Title One is a
federal program that provides funds for outside-the-classroom remediation of reading and
math skills based on a complicated formula that takes into consideration the economics of
the school district and the needs of the individual students (House Resolution 1, 2009).

85
According to Maine Special Education guidelines (Title 20-A: Education, Part 4:
Specific Programs, Subpart 1: Special Education, Chapter 301: General Provisions), a
child can be identified with a disability if he or she has been diagnosed as having one or
more of the following conditions (source: Maine Unified Special Education Regulation
Birth to Age Twenty, 05-071, Chapter 101):
(a) Mental Retardation: Mental retardation means significantly subaverage general
intellectual functioning existing concurrently with deficits in adaptive behaviors and
manifested during the developmental period that adversely affect the child’s educational
performance.
(b) Hearing Impairment, Including Deafness: Deafness means a hearing impairment that
is so severe that the child is impaired in processing linguistic information through
hearing, with or without amplification, that adversely affects the child’s educational
performance.
(c) Speech or Language Impairment: Speech or language impairment means a
communication disorder such as stuttering, impaired articulation, a language impairment,
or a voice impairment, that adversely affects the child’s educational performance.
(d) Visual Impairment, Including Blindness: Visual impairment including blindness
means an impairment in vision that, even with correction, adversely affects the child’s
educational performance. The term includes both partial sight and blindness.
(e) Serious Emotional Disturbance: Emotional Disturbance means a condition which
exhibits one or more of the following characteristics over a long period of time and to a
marked degree that adversely affects the child’s educational performance: an inability to
learn that cannot be explained by intellectual, sensory, or health factors; an inability to
86
build or maintain satisfactory interpersonal relationships with peers and teachers;
inappropriate types of behaviors or feelings under normal circumstances; a general
pervasive mood of unhappiness or depression; a tendency to develop physical symptoms
or fears associated with personal or school problems. The term includes schizophrenia.
The term does not apply to students who are socially maladjusted, unless it is determined
that they have an emotional disability.
(f) Orthopedic Impairment: Orthopedic impairment means a severe orthopedic
impairment that adversely affects a child’s educational performance. The term includes
impairments caused by a congenital anomaly, impairments caused by disease (e.g.,
poliomyelitis, bone tuberculosis) and impairments from other causes (e.g., cerebral palsy,
amputations, and fractures or burns that cause contractures).
(g) Autism: Autism means a developmental disability significantly affecting verbal and
non-verbal communication and social interaction, generally evident before age three that
adversely affects educational performance.
(h) Traumatic Brain Injury: Traumatic brain injury means an acquired injury to the brain
caused by an external physical force resulting in total or partial functional disability or
psychosocial impairment or both that adversely affects a child’s educational performance.
The term applies to open or closed head injuries resulting in impairments in one or more
areas, such as cognition, language, memory, attention, reasoning, abstract thinking,
judgment, problem-solving, sensory, perceptual and motor abilities, psychosocial
behavior, physical functions, information processing and speech. The term does not
apply to brain injuries that are congenital or degenerative, or brain injuries induced by
birth trauma.

87
(i) Other Health Impairment: Other health impairment means having limited strength,
vitality or alertness, including a heightened alertness to environmental stimuli, that results
in limited alertness with respect to the educational environment, that is due to chronic or
acute health problems, such as asthma, attention deficit disorder, attention deficit
hyperactivity disorder, diabetes, epilepsy, a heart condition, hemophilia, lead poisoning,
leukemia, nephritis, rheumatic fever, or sickle cell anemia, Tourette Syndrome and
adversely affects the child’s educational performance.
(j) Specific Learning Disabilities: Specific learning disability means a disorder in one or
more of the basic psychological processes involved in understanding or in using
language, spoken or written, that may manifest itself in an imperfect ability to listen,
think, speak, read, write, spell, or to do mathematical calculations, including
conditions such as perceptual disabilities, brain injury, minimal brain dysfunction,
dyslexia, and developmental aphasia. Specific learning disabilities does not include
learning problems that are primarily the result of visual, hearing, or motor disabilities, of
mental retardation, of emotional disturbance, or environmental, cultural or economical
disadvantage.
(k) Deafness and Blindness: Deaf-blindness means concomitant visual and hearing
impairments, the combination of which causes such severe communication, and other
developmental and educational needs that he cannot be accommodated in special
education programs solely for children with deafness or children with blindness.
(l) Multiple Disabilities: Multiple disabilities means concomitant impairments the
combination of which causes such severe educational needs that the child cannot be
accommodated in special educational programs solely for one of the impairments.

88
Among the participants in this study, 73.1% were identified as special education students.
The breakdown of their specific disabilities is given in the Table 2.
Table 2
Breakdown of Participants By Special Education Classification
Disability Category N % of SPED Participants
% of Total Participants
Mental Retardationa
0
0%
0%
Hearing Impairment 2 3.2% 2.4% Speech or Language Impairment 4 6.4% 4.8% Visual Impairment 1 1.6% 1.2% Emotional Disturbance 26 42.6% 31.7% Orthopedic Impairment 1 1.6% 1.2% Autism 0 0% 0% Traumatic Brain Injury 5 8.1% 6.0% Other Health Impairmentb 10 16.3% 12.1% Specific Learning Disability 28 45.1% 34.1% Deafness and Blindness 0 0% 0% Multiple Disabilities 6 9.8% 7.3% _______________________________________________________________________ Note: The individual disabilities within the multiple disabilities category are not included in the other totals. a.The state of Maine does not allow commitment of mentally retarded individuals to this facility. b. All “Other Health Impairments” have been ADHD.
How the Number of Archival Data Sets Was Chosen
The number of archival data sets for this study was chosen by examining all of the
available data and compiling complete data sets. The total number of complete data sets
available was 82. Ary et al. (2006) state that “if a relationship exists, it will be evident in
a sample of moderate size” (p. 380). Considering the relatively small population of
students at this school, 82 complete data sets could be considered both moderate and
adequate to conduct a proper statistical analysis (Ary et al., 2006).

89
Setting
The target school is one of two maximum security juvenile correctional facilities
in a state in the Northeastern United States. The target facility has over 200 full-time
staff, with approximately 30 of those working in the education department. The
researcher is the only reading specialist on staff. The physical plant has the ability to
house 133 juvenile offenders. Those offenders participate in programming that includes
education, mental health services, individual therapy, drug therapy, family therapy,
vocational rehabilitation, religious services, and volunteer opportunities. The education
class size averages 4.5 students, sometimes with a security guard in the room along with
the teacher.
Reading instruction takes place in the Title I classroom, where the researcher is
the only teacher. The format of the reading intervention at this school is dependent upon
the needs of the students. They have unique needs because of absenteeism, expulsion,
and lack of effort. They often have skill gaps that need to be filled in, but have strengths
in areas that one would not expect. For that reason, the researcher designed each
student’s reading and writing program upon their arrival in the classroom, and it often
changes over the course of their stay. Even the methods and curriculum used to instruct
are often quite different from a traditional school’s Title I program.
The setting for the three reading fluency tests was the reading specialist’s (also
the researcher for this study) classroom. Usually, the testing occurred during class time
in a separate section of the room from where the other students were working. The
classes never had more than six students, so excessive noise and distraction were not a
problem. The reading comprehension tests were also administered by the researcher.

90
However, they took place in a separate period put aside especially for testing new
students, or retesting students every six months to measure academic progress. The
environment was quiet, and the testing all took place on classroom computers. All testing
occurred during first period (8:00 A.M.-9:15 A.M.) and took the place of the student’s
first period class for the days they were assigned to test.
Instrumentation
Three separate instruments were administered over a two-year period prior to
collection of the archival data sets. The instruments are all designed to measure different
aspects of reading performance. The QRI-4 measures both reading speed and accuracy,
the MFS measures reading prosody, and the MAP measures reading comprehension.
Reading Rate Instrument
The instrument that was used to measure the reading rate of the students was the QRI-
4 (Leslie & Caldwell, 2006). The QRI-4 is a reading assessment that has been widely
adopted by school districts for the purpose of informal measurement of reading skills. It
measures reading speed and accuracy using the following steps:
1. The participant read word lists aloud while the assessor marked whether
they read the word automatically, correctly after time, or not at all. The
assessor then marked whether that word list was at the participant’s
independent reading level (90% or better), instructional reading level (80-
89%), or frustration reading level (below 80%).
2. The word lists were read until the participant reached the frustration level.
The assessor then reverted to the last list that the participant read at an
independent reading level.

91
3. The teacher chose a reading passage from the QRI-4 book at the level that
the participant could read independently. He then asked a series of
questions to determine if the subject of the text was familiar or unfamiliar
to the participant. Independent level text was used for the QRI-4
assessments so that the results were a reflection of their actual reading
speed and accuracy, not their comprehension. If the text was so difficult
(instructional or frustration level) that the participant could not
comprehend, their speed and accuracy would naturally suffer. In that case,
the researcher would not get an accurate measure of speed and accuracy
ability because of the confounding impact of comprehension.
4. The participant read the text aloud while the teacher took a running record,
which later served as the foundation of the miscue analysis. The
participant’s speed and accuracy was measured at this time. Silent reading
was not used, despite it being the most common method of reading among
adolescents, because it is nearly impossible to measure reading speed and
accuracy accurately when the reading is done silently.
5. The participant was asked to do a retelling of the story and comprehension
questions were asked to determine if comprehension fell within the
acceptable range for the passage. Look-backs were allowed so that a true
measure of comprehension could be ascertained; if look-backs were not
allowed, the measurement would have been of comprehension and
memory, not just comprehension. If the comprehension did fall within the
acceptable range for the passage, the speed and accuracy calculations were

92
deemed legitimate for that passage and could then be used in the
correlation analysis.
Reading inventories, such as the QRI-4, are considered a valid and reliable
measure of student progress (Fuchs, L., Fuchs, D., & Maxwell, 1988; Fuchs, L., Fuchs,
D., & Zumeta, 2008), and are an accurate indicator of general reading competence
(Kame’enui & Simmons, 2001). One reason this particular book of instruments was
chosen is that it contains reading passages at secondary levels, whereas most reading
inventory books do not have any passages above either the sixth grade or eighth grade
levels. The Flesch-Kincaid readability formula was used to determine text
appropriateness for this study. An explanation of the Flesch-Kincaid readability
formulas, as well as the readability scores and reading ease scores for each passage in the
QRI-4 manual, are included in Appendix B. To obtain the Flesch-Kincaid readability and
reading ease scores for each reading selection, the researcher cut and pasted the passages
into a Flesch-Kincaid calculator. The purpose of measuring each passage was to ensure
that passages were not utilized for assessment that were determined by the QRI-4 authors
to be appropriate for a certain grade level, but in reality had readability that deviated
significantly from that grade level. That would have skewed the results of the testing.
The QRI-4 book (Leslie & Caldwell, 2006) includes the retelling and comprehension
assessments that accompany each passage. The purpose of these assessments is to ensure
that students are actually reading and not just word-calling. Analyzing the level of
comprehension is an important facet of measuring reading rate. For the purposes of this
study, a comprehension rate of 90% was considered an adequate level of comprehension
for the subject reading rate to be considered viable (Leslie & Caldwell, 2006).

93
The QRI-4 was piloted with over 1,000 participants (Leslie & Caldwell, 1989).
Administration was consistent across all subjects. Like all reading assessments that
measure a specific skill, the rating has the potential to be very subjective. However, the
QRI-4 has an inter-rater reliability of 98% when raters are testing prior knowledge, 99%
when they are testing miscue identification, and 98% when they are testing
comprehension. Students’ instructional levels were consistent among raters as well.
When determining instructional levels, the inter-rater reliability was always over .80, and
over .90 seventy-five percent of the time, meaning that regardless of the passage chosen,
the same instructional level would have been chosen by the rater most of the time. As for
concurrent validity, the QRI-4 scores correlated with norm-referenced achievement tests
positively, and were always statistically significant. Scores for this instrument are
reported in words read correctly per minute at the independent reading level (reading
speed) and percentage of words read correctly at the independent reading level (reading
accuracy). The range of scores for reading speed are not specified, but usually fall
between 100-200 words correct per minute (WCPM) for high school students. Reading
rate norms do not currently exist beyond ninth grade (see Recommendations for Future
Research in Chapter Five), so no judgments about an adequate reading speed measure
could be made. The reading speed score was higher when more words were read per
minute.
Reading Accuracy Instrument
While the QRI-4 (Leslie & Caldwell, 2006) measures reading rate, it also
measures reading accuracy by a commonly used method of subtracting errors from words
per minute to arrive at a statistic known as WCPM. The correct words per minute

94
calculation is often used in elementary and middle schools to determine placement within
a particular reading program, or as a tool that can help determine the need for remediation
when compared to grade level norms. For purposes of this study, even self-corrected
errors were counted as errors in the calculation of reading accuracy because they inhibit
the reader’s prosody and adversely impact fluency. Reading accuracy scores could range
from 0-100%, with scores over 90% representing adequate reading accuracy for
independent text. The reading accuracy score was higher when more words were read
correctly per minute. See the Reading Speed Instrument section for QRI-4 reliability,
validity, and scoring information.
Text Difficulty
Text difficulty is an important aspect of measurement in this study. All of the
fluency assessments were given to the students at their independent reading level. It was
important to test at the students’ independent reading level because neither elements of
fluency nor comprehension would have been present (and therefore measurable) if the
testing was done using grade level text with students who were reading four or five years
below their grade level peers. This approach may be somewhat controversial because the
outcome assessment (MAP) is written with grade level text, and scores are given by
identifying equivalent grade levels. However, fluency assessments are almost always
given using independent text; to do otherwise would give an inaccurate representation of
reading skill. In addition, the fluency testing aspect of this research was seeking to
discern what level of text the subject could read fluently, not whether or not they can read
grade level text with fluency. Ary et al. (2006) said that instruments utilized in a

95
correlation study that are too hard or too easy do not descriminate between subjects,
leading to smaller correlation coefficients.
The reading speed variable is reported in WCPM, as opposed to WPM. The
reason for this choice was that simply reporting words read per minute may have given a
false impression of how fast, or how fluently, the subject was really reading. If reading is
fast, but is full of errors, at some point it ceases becoming reading at all because, by
definiton, reading requires an understanding of what is being read. Correctness and flow
are two important elements of reading success. Even errors that were self-corrected were
counted as errors in the calculation of WCPM because the flow of the reading was
interrupted, even if the error was corrected.
The possible confounding variable of the difference in difficulty between
narrative and expository text is beyond the scope of this study. Simply because of
consistency and availability of reading passages, all participants were assessed with
expository text, even though research has shown narrative text to be easier to read and
recall for students at all grade levels (Graesser, Golding & Long, 1991). Additionally,
middle and high school students are most often required to read unfamiliar expository
text in subject area classes, such as the text found in the passages in the QRI-4.
Therefore, expository oral reading is a better indicator of practical reading
comprehension ability. Oral reading was preferred over silent reading for this study
because without hearing the reader’s voice, it would be impossible to discern whether or
not he has understood the prosodic intent of the author (Chafe, 1987).

96
Reading Prosody Instrument
Prosody is a difficult construct to measure (Hudson et al., 2009). The reasons it is
so difficult to measure are that (a) there are as many definitions of prosody as there are
reading experts to define it, (b) the subskills of prosody are not agreed upon by reading
experts, (c) each component skill has to be measured with a separate rubric, (d) the
rubrics themselves are not universally normed, so any resultant measurement using those
rubrics would not be universally considered valid, and (e) what each rater considers to
fall within the proficient range of each prosodic skill is very subjective.
For those reasons, the correct course of action is to ensure that when a rubric is
utilized for research purposes that it is standardized, valid and reliable, administered
under similar conditions for each student, and administered by a literacy expert. Each of
those standards was met for the archival data set with the use of a rubric authored by
Zuttell and Rasinski (1991) and administered by the school’s reading specialist. That
rubric measures reading prosody by giving a composite grade for (a) expression and
volume, (b) phrasing, (c) smoothness, and (d) pace (note that these four elements are not
exactly the same as the elements of prosody presented earlier in the literature review.
This difference emphasizes the dissention among reading experts regarding the definition
of reading prosody. However, the elements are not a significant departure from the
earlier definition. The range of possible MFS scores is 4-16. The higher the number, the
more prosodic the reading. Scores above eight usually represent adequately prosodic
reading. The MFS is considered valid and reliable (Rasinski, 1985), and rater judgments
can be applied accurately and consistently (intetrater reliability coefficient was .99) with
training (Zutell, 1988).

97
Other validity issues in prosody research, such as the difference between oral
reading and silent reading, or to what degree the participants’ physical make-up (speech
impediments, trouble forming words, hearing loss) influences oral reading prosody, were
not dealt with because of the narrow scope of this study. There are problems that
accompany the use of the MFS, and those are discussed in the limitations section.
Reading Comprehension Instrument
The instrument that was used to measure the reading comprehension of the
participants was the MAP, Reading Comprehension Subtest (Northwest Evaluation
Association, 2005a). This computerized, adaptive test is used with individual students
and was developed by the Northwest Evaluation Association to measure the general level
of student achievement using a number of subtests. One of those subtests is the Reading
Comprehension Subtest. The Reading Comprehension Subtest is adaptive, but usually
has between 40-50 items, and can be administered to students of any grade, kindergarten
through twelfth (Cizek, 2010).
The reason this test was chosen over other tests was that the MAP is the only
standardized reading assessment in use at the target facility that measures reading
comprehension. Also, the MAP was chosen because the students’ reading
comprehension scores are already reported within the framework of the MAP testing
results report; no additional calculations are necessary.
The numerous options for results reporting provide a wealth of available
information. The results can be reported in RITs (Rausch Units; Appendix C), scaled
scores, percent scores, standard scores, percentile ranks, and vertical scales. For this
study, the RIT scores will be utilized. A RIT score for reading comprehension can range

98
from 170-270. The higher then RIT, the better the reading comprehension. Another
quality that makes the MAP more viable than other reading comprehension tests is its
excellent reliability and validity data. Cizek (2010) found the reliability coefficient to be
between .92 and .96, and the validity coefficient to be between .77 and .84. Internal
consistency levels, high test coefficient values, and strong validity indicators are all
strengths of this test (Northeast Evaluation Association, 2005a). Clearly, the MAP “can
be used with confidence . . . to gauge student learning” (Cizek, 2010, para. 6). The norm
group assessments included over 2.3 million students from across the United States.
Procedures
This study utilized archival reading assessment data. This section begins by
detailing the permissions that were obtained in order to proceed with the study, then it
describes how the data was collected by the researcher over a period of two years in his
capacities as the school’s literacy specialist and tester. Finally, it tells how the data was
later gathered for analysis and organized by the researcher in the role of primary
researcher.
Permissions
The first step in the data collection process was to ensure that the proposed
research complied with the target district’s policy on research within the school system
(see Appendix D). That determination was made by submission of the research proposal
to the state department of corrections for approval. Institutional Review Board (IRB)
approval was also gained from the university where the researcher is enrolled. Once the
IRB approval and permission from the state department of corrections were obtained (see
Appendix E), the data collection process commenced.

99
Gathering QRI-4 Reading Rate and Reading Accuracy Scores
Reading rate and reading accuracy were measured simultaneously using the QRI-
4, in the manner mentioned in the Instrumentation section. The QRI-4 testing took
approximately 45 minutes per participant. The same passage was used to assess each
student at their specific independent reading level. In other words, each student who
reads independently at the sixth grade level received the same passage. Using the same
passage for students who are reading at the same independent reading level was done to
avoid validity problems between passages by reducing the variability that different texts
could potentially create. The students were tested during school hours within the target
school. A sample completed assessment (a sample student score sheet and a sample
miscue analysis sheet) can be seen in Appendix F.
The school’s reading specialist administered the assessment and conducted a
timed running record. The many different forms of running records that exist and their
differing procedures could be a threat to reliability. For example, the Developmental
Literacy Guide used by some school districts in this particular section of the Northeastern
United States directs the raters to count self-corrections as errors and allows the students
to preview the book, and some do not. Some running records, such as the ones found in
the Wright Group’s literacy assessment materials, direct the raters to count repeated
words as errors, while others do not. Naturally, running records can be a very subjective
endeavor. If multiple forms or formats are utilized in the assessment process, variability
in scores could result because these different forms of running records exist, each with
their own rules and markings. For this reason, all of the assessments were conducted by

100
one rater, using one instrument, in an attempt to limit variability in reading accuracy
scores. The accuracy results will be reported in correct words read per minute (WCPM).
The measurement of reading rate is much more straightforward. Reading rate will be
reported in words read per minute (WPM). The researcher listened as the participant read
the entire passage and counted the number of words read, then divided the number of
words read by the number of minutes it took to read them. As long as the minimum
requirement for comprehension was met (90%), the number of WPM calculated in this
way stood as the student’s reading rate number. The 90% requirement is a time-honored
(Betts, 1946), well-supported benchmark (Leslie & Caldwell, 2006). If the
comprehension threshold was not met, the student went through the process again with a
lower level of text until their comprehension was adequate. These scores, combined with
the reading accuracy scores gleaned from the QRI-4, will be the scores utilized to
determine the correlation between reading rate and reading comprehension, as well as
reading accuracy and reading comprehension.
Gathering MFS Scores
The MFS assessment (Zutell & Rasinski, 1991) data was collected separately
from the other QRI-4 data. The researcher administered this assessment to each student
individually, but on a separate day from the QRI-4 data. It took each student
approximately five minutes to complete the MFS assessment. This separation of tests
was done so that the researcher could avoid error by not having to listen for both
accuracy and prosody simultaneously. However, the assessments were administered as
close together in time as is possible given the researcher’s availability and the availability
of the students.

101
Gathering MAP, Reading Comprehension Subtest Scores
The most recent MAP assessment (Northwest Evaluation Association, 2005a)
data for each student was used (the students take the MAP test every six months) to
ensure that the correlations were as accurate as possible. The reading comprehension
section of the test took each participant approximately 40 minutes to complete. Each
student was pulled out of class during school hours to be administered the test. The
measurement this study was concerned with was how the fluency subskills involved in
the research related to the reading comprehension subtest of MAP. The validity of that
correlation weakens as more time passes between the MAP assessment and the fluency
assessment because reading skills may deteriorate or improve over time. Therefore, the
assessments and data were collected as closely together as possible. The goal was to
administer the tests within one month of each other.
The Northwest Evaluation Association website’s manual shows the RIT norm
scores (see Table 3) for each grade level (grades K-11). These scores are included here
because they were important when reviewing how the students’ performance on the
MAP, Reading Comprehension Subtest correlated with the reading fluency variables.
For example, if there was a strong correlation between a participant’s reading prosody
and RIT score, it became crucial to determine if the two scores fell within the normal
range for the two tests. If they did not, a number of valuable conclusions could be made
from that information.
Table 3 RIT Norms By Grade Level ________________________________________________________________________ Grade Beginning of Year Middle of Year End of Year

102
K 147.6 152.4 156.3 1 160.2 166.5 171.9 2 179.7 186.0 189.6 3 191.6 196.3 199.0 4 200.1 203.7 205.8 5 206.7 209.6 211.1 6 211.6 213.8 214.8 7 215.4 217.3 217.9 8 219.0 220.6 221.2 9 220.9 221.9 222.6 10 223.9 224.9 225.4 11 225.2 225.2 225.6 Source: Northwest Evaluation Association website (2008).
Archival Data Collection Procedures
The archival data obtained for this study was student reading assessment data
gathered from January 2010 – August 2011 from the following three assessments: MFS,
QRI-4, and MAP. The MFS and QRI-4 assessment data had been collected for
instructional purposes and was stored in a locked filing cabinet in the reading specialist’s
classroom, known as the multimedia classroom. The MAP data had been collected for
academic tracking purposes and was kept on a digital Educational Assessment form on a
computer hard drive in the education office. In addition to assessment data, the following
demographic information was gathered: age at time of testing, ethnicity, reading
disability status, ESL status, special education status, and special education category. All

103
of the demographic data needed for the study was available in the students’ education
files. These files are located on the Y Drive on the computers in the education office and
are maintained by the computer technician, who is responsible for archiving data.
The archival reading assessment MFS and QRI-4 data was gathered by the school
secretary from the student reading files in the reading specialist’s classroom where they
are housed. The secretary recorded the assessment data on an Excel spreadsheet and
forwarded the spreadsheet to the computer technician. Next, the school’s computer
technician, who is responsible for archiving student data, gathered the demographic data
for students from their student records on the Y Drive in the education office. After the
MAP scores and demographic data for each student had been gathered and recorded on
the spreadsheet, the computer technician deleted the column with the names of the
subjects from the spreadsheet and randomly assigned each participant an identifying case
number. The spreadsheet was left with a participant number, MAP scores, MFS scores,
QRI-4 scores, and demographic information. Next the computer technician emailed the
spreadsheet (with all identifying information removed) to the researcher. The researcher
saved it on his personal computer under password protection and began the data analysis
procedures.
Data Organization
Once the data was gathered, it was entered into an Excel spreadsheet for purposes of
organization and manipulation. The Excel spreadsheet was organized by participant,
each being represented by the number assigned to them by the school’s computer
technician. Each participant had his own row that displayed:
1. reading rate score, in WPM, from the QRI-4.

104
2. reading accuracy score, in WCPM, from the QRI-4.
3. prosody score, from the MFS
4. comprehension score, from the MAP, Reading Comprehension Subtest.
The data was then imported into Statistical Package for the Social Sciences (SPSS) for
analysis. SPSS 19 was used to produce visual representations of the outcomes, including
scatterplots, matrices, and tables (Field, 2009; Salkind & Green, 2011).
Data Analysis
Rationale for Type of Data Analysis
This research was nonexperimental and utilized nonparametric methods because
the mean and standard deviations were known. The form that the data took was
measurement, as opposed to frequency data.
A multivariate correlation would have been the most appropriate analysis to use
for this study because it would have limited the probability of committing Type I errors
(Tabachnik & Fidell, 2007). Type I errors occur when the same variables (in this case,
reading comprehension) in a data set are used for too many statistical tests (Tabachnik &
Fidell, 2007). However, due to the specific population examined in the study, a large
enough sample size to ensure sufficient power for such an analysis was not possible.
Thus, bivariate correlations were chosen as the most appropriate analysis. Pearson’s r
was chosen as the most appropriate analysis tool, as long as the statistical assumptions
necessary to use the test were met. However, some assumptions were not found to be
tenable, so a nonparametric analysis, Spearman’s rho, was used instead (Howell, 2010).
While the number of full data sets available for analysis was 82, only 79 were included in
the statistical tests because of elimination of three cases due to extreme outliers.

105
Analysis of Hypothesis 1
Hypothesis 1 stated that there is a statistically significant relationship between
reading speed (as measured by the QRI-4) and reading comprehension (as measured by
the MAP). A correlation analysis was used to analyze how reading speed related to
reading comprehension. Preliminary analyses were used to examine the assumptions of
no extreme outliers, normality, linearity, and homoscedasticity. The assumption of no
extreme outliers was assessed using the guideline of three standard deviations above or
below the norm. There are many methods for setting criteria for eliminating outliers
from a data set, and this decision is one made by each individual researcher. The
benchmark of 3.29 standard deviations was chosen for this study because a data point has
only a 0.27% chance of falling more than three standard deviations from the mean
(Tabachnik & Fidell, 2007), meaning that very little data will ever be eliminated using
this method. Removing as little data as possible was important to the researcher; the
natural variability in ability and performance amongst the target population was an
important aspect of this analysis and had to be reflected as much as possible so that a full
and accurate representation of their reading ability could be retained. The assumption of
normality was assessed using a normality histogram and by examination of the skewness
and kurtosis numbers. Linearity and homoscedasticity were assessed by visual
examination of a scatterplot. A Spearman’s rho was deemed the most appropriate
analysis to determine the strength of the relationship between the two continuous
variables since the assumptions of no extreme outliers and homoscedasticity in the data
set were violated (Tabachnik & Fidell, 2007).

106
A p < .05 level of significance was used for the analysis of Hypothesis 1 to
determine if the null hypothesis could be rejected. The practical significance (effect size)
of this bivariate correlation was calculated using the Spearman’s rho statistic and was
interpreted by Cohen’s d (1988). Cohen’s d (the difference between two means divided
by the standard deviation for the data) categorizes effect sizes this way:
Small effect: .20
Medium effect: .50
Large effect: .80
The size of effects that lie between the Cohen points are left up to interpretation. For
example, .40 may be considered a medium effect because it is closer to the medium effect
number than the small effect number. However, it could be considered a small effect if
the effects are viewed as ranges (.20-.49, .50-.79, .80-1.00). Assumption testing,
specifics of the statistical procedures, and the findings are explained in Chapter 4.
Analysis of Hypothesis 2
Hypothesis 2 statedthat there is a statistically significant relationship between
reading accuracy (as measured by the QRI-4) and reading comprehension (as measured
by the MAP). A correlation analysis was used to analyze how reading accuracy related to
reading comprehension. Preliminary analyses were used to examine the assumptions of
no extreme outliers, normality, linearity, and homoscedasticity. The assumption of no
extreme outliers was assessed using the guideline of three standard deviations above or
below the norm. The benchmark of three standard deviations was chosen for this study
because a data point has only a 0.27% chance of falling more than three standard
deviations from the mean (Tabachnik & Fidell, 2007), meaning that very little data will

107
ever be eliminated using this method. Removing as little data as possible was important
to the researcher; the natural variability in ability and performance amongst the target
population was an important aspect of this analysis and had to be reflected as much as
possible so that a full and accurate representation of their reading ability could be
retained. The assumption of normality was assessed using a normality histogram and by
examination of the skewness and kurtosis numbers. Linearity and homoscedasticity were
assessed by visual examination of a scatterplot. A Spearman’s rho was deemed the most
appropriate analysis to examine the relationship between the two continuous variables
since the assumptions of no extreme outliers, normality, and homoscedasticity in the data
set were all violated (Tabachnik & Fidell, 2007).
A p < .05 level of significance was used for the analysis of Hypothesis 2 to
determine if the null hypothesis could be rejected. The practical significance (effect size)
of this bivariate correlation was calculated using the Spearman’s rho statistic and was
interpreted by Cohen’s d (1988) in the same manner as Hypothesis 1.
Analysis of Hypothesis 3
Hypothesis 3 stated that there is a statistically significant relationship between
reading prosody (as measured by the MFS) and reading comprehension (as measured by
the MAP). A correlation analysis was used to analyze how reading prosody related to
reading comprehension. Preliminary analyses were used to examine the assumptions of
no extreme outliers, normality, linearity, and homoscedasticity. The assumption of no
extreme outliers was assessed using the guideline of three standard deviations above or
below the norm. The benchmark of three standard deviations was chosen for this study
because a data point has only a 0.27% chance of falling more than three standard

108
deviations from the mean (Tabachnik & Fidell, 2007), meaning that very little data will
ever be eliminated using this method. Removing as little data as possible was important
to the researcher; the natural variability in ability and performance amongst the target
population was an important aspect of this analysis and had to be reflected as much as
possible so that a full and accurate representation of their reading ability could be
retained. The assumption of normality was assessed using a normality histogram and by
examination of the skewness and kurtosis numbers. Linearity and homoscedasticity were
assessed by visual examination of a scatterplot. A Spearman’s rho was deemed the most
appropriate analysis to examine the relationship between the two continuous variables
since the assumption of no extreme outliers in the data set was violated (Tabachnik &
Fidell, 2007).
A p < .05 level of significance was used for the analysis of Hypothesis 3 to
determine if the null hypothesis could be rejected. The practical significance (effect size)
of this bivariate correlation was calculated using the Spearman’s rho statistic and was
interpreted by Cohen’s d (1988) in the same manner as Hypothesis 1.
Analysis of Hypothesis 4
Hypothesis 4 stated that reading prosody (as measured by the MFS) is the reading
fluency variable that is most strongly correlated with reading comprehension (as
measured by MAP). Correlation analyses were used to analyze which of the three
fluency variables (reading speed, reading accuracy, and reading prosody) related most
strongly to reading comprehension. Preliminary analyses were used to examine the
assumptions of no extreme outliers, normality, linearity, and homoscedasticity. The
assumption of no extreme outliers was assessed using the guideline of 3.29 standard

109
deviations above or below the norm. The benchmark of three standard deviations was
chosen for this study because a data point has only a 0.27% chance of falling more than
three standard deviations from the mean (Tabachnik & Fidell, 2007), meaning that very
little data will ever be eliminated using this method. Removing as little data as possible
was important to the researcher; the natural variability in ability and performance
amongst the target population was an important aspect of this analysis and had to be
reflected as much as possible so that a full and accurate representation of their reading
ability could be retained. The assumption of normality was assessed using normality
histograms and by examination of the skewness and kurtosis numbers. Linearity and
homoscedasticity were assessed by visual examination of a scatterplot. A Spearman’s
rho was deemed the most appropriate analysis to examine the relationships between the
three reading fluency variables and reading comprehension since the assumptions of no
extreme outliers, normality, and homoscedasticity in the data set were all violated
(Tabachnik & Fidell, 2007).
A p < .05 level of significance was used for the analysis of Hypothesis 4 to
determine if the null hypothesis could be rejected. The practical significance (effect size)
of this bivariate correlation was calculated using the Spearman’s rho statistic and was
interpreted by Cohen’s d (1988) in the same manner as Hypothesis 1.
Issues with Data Analysis
There are many potential problems that can arise after the collection of archival
data occurs. However, appropriate adjustments can be made prior to final analyses.
Below, four of these problems are listed along with how the researcher controlled for
each problem when it occurred.

110
Outliers
Extreme outliers (+/- 3.29 standard deviations from the norm; Tabachnik &
Fidell, 2007) can have dramatic effects on correlations. There were extreme outliers in
this study, which is not surprising considering that the study’s participants’ educational
experiences are diverse and sporadic. Participants may have gained some skills while
missing others due to school absence or lack of effort. Needless to say, one should never
base important conclusions on the value of the correlation coefficient alone (Rodgers &
Nicewander, 1988); examining the respective scatterplot is always necessary when an
outlier is present. The easiest, and most commonly used method of dealing with outliers,
is to eliminate any cases that are determined by the researcher to contain outliers (Barret
& Lewis, 1994; Tabachnik & Fidell, 2001). That is the method that was used in this
study in keeping with the researcher’s desire to retain as much data as possible for
analysis. Three cases were eliminated using this method. An extreme outlier (174 RIT)
caused an elimination of case #17; an extreme outlier (88% comprehension) caused an
elimination of case #21; an extreme outlier (175 RIT) caused an elimination of case #52.
Trimming or replacing data, or other methods that may have eliminated too large of a
percentage of the available cases, were unacceptable options to the researcher.
Normality
While many simple statistical tests are robust (sample data might deviate quite a
bit from normality, but the test will still lead to the right conclusion about the null
hypothesis) to the normality assumption (Salkind & Green, 2011), and normality does not
necessarily have to be met for data to be analyzed with a parametric measure such as
Pearson’s r (Hettmansperger & McKean, 1998), it is preferable to use parametric

111
measures to decrease the likelihood of Type I errors (Tabachnik & Fidell, 2001). Since
the assumption of normality was not met for one of the variables in this study, there were
two reasonable options. A nonparametric test (such as Spearman’s rho) could change the
measurement data into rank data, or a data transformation method (such as logarithmic
transformation) could be used to stabilize the variance of the sample (Bland, 2000).
Nonparametric testing was chosen for this study when the assumption of normality was
not met.
Linearity
When there is not a straight line relationship between two variables, the
assumption of linearity is not met (Salkind & Green, 2011). It was possible, because of
the small number of variables (four), to individually screen all of the possible pairs (three
relationships) for linearity (Tabachnick & Fidell, 2001). SPSS scatterplot was used to
produce the bivariate scatterplots from which linearity was visually determined. It was
determined that the linearity assumption was met for all of the variables because none of
the scatterplots displayed a curvilinear relationship (Tabachnik & Fidell, 2007).
Homoscedasticity
When the dependent variable (reading comprehension for this study), does not
exhibit similar amounts of variance across the range of values for an independent variable
the assumption of homoscedasticity is not met (Hamisci & Martinez, 2007). It was
possible, because of the small number of variables (four), to screen all of the possible
pairs (three relationships) for homoscedasticity. SPSS scatterplot was used to produce
the bivariate scatterplots from which homoscedasticity was visually determined. When it
was determined that the assumption was not met for two of the variables, the researcher

112
determined that a nonparametric test of correlation would be used in order to normalize
the data for analysis.
Summary
Determining which of the three fluency subskills is most strongly related to
reading comprehension in adolescent at-risk readers is a beneficial discovery for
secondary level teachers and reading interventionists. Much time and many resources
could be saved by being able to pinpoint the specific issue(s) that most influence overall
reading comprehension performance. With this information at their fingertips, literacy
specialists could more quickly and easily remediate comprehension problems instead of
wasting valuable time searching for the root problem that is causing the comprehension
deficit. Of course, other individual factors that might be outside the scope of this study
could also influence overall reading comprehension. Yet, discovering a definite common
starting point grounded in research would be an important finding, and could serve as the
basis for future studies seeking to examine causality. The methodology presented here
presents a logical and sequential plan for statistically identifying this starting point.

113
CHAPTER FOUR: FINDINGS
The primary purpose of this study was to determine the strength of the
relationship between three reading fluency variables (reading speed, reading accuracy,
and reading prosody) and reading comprehension. Three separate reading tests were
administered over a 20 month period (December 2009 - August 2011) to students at a
maximum security juvenile prison in a rural area of the Northeastern United States.
Those scores were used to measure the strength of the relationships between the three
reading fluency variables and reading comprehension. Complete archival data sets were
available for 82 students who attended during this time frame. The four research
questions in the study addressed the reading ability of those students in four separate
areas: reading comprehension, reading speed, reading accuracy, and reading prosody.
This chapter is organized into four sections. First, the descriptive data for the four
variables of interest is displayed. In the next section, the assumptions tests for each
research hypothesis is given. The third section describes the data analysis for the four
hypotheses. The final section provides a summary of the results.
Results
Descriptive Data
The descriptive data for the four research variables can be seen in Table 4.

114
Table 4 Descriptive Statistics for the Individual Variables ________________________________________________________________________
Variable
N
Minimum
Maximum
Mean Std
SD
Variance
Statistic Statistic Statistic Statistic Error Statistic Statistic
Reading Comp.
79
189.00
241.00
216.54
1.19
10.57
111.64
Reading Speed
79 71.00 208.00 129.16 3.10 27.58 760.73
Reading Acc.
79 89.00 100.00 95.90 .27 2.36 5.58
Reading Prosody
79 5.00 16.00 10.76 .25 2.20 4.86
Assumption Testing
Preliminary assumption testing for a correlation analysis was conducted. The
assumptions tested were normality, linearity, and homoscedasticity (Tabachnik & Fidell,
2001). The assumption that data was normally distributed was determined by visual
examination of a normality histogram (approximately one-third of the cases should be
one standard deviation from the mean). The normality histograms for the four variables
in this study can be seen in Figure 2, Figure 3, Figure 4, and Figure 5.

115
Figure 2. Normality Histogram for Reading Comprehension With Normal Curve Displayed

116
Figure 3. Normality Histogram for Reading Speed With Normal Curve Displayed
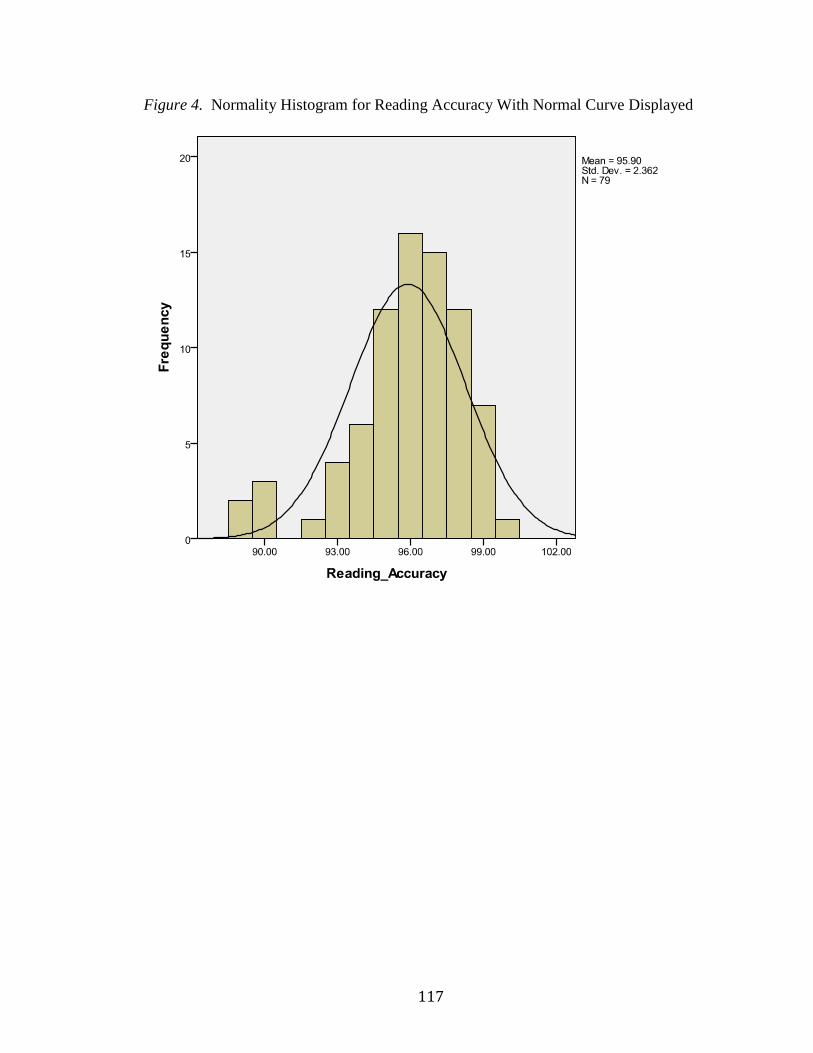
117
Figure 4. Normality Histogram for Reading Accuracy With Normal Curve Displayed

118
Figure 5. Normality Histogram for Reading Prosody With Normal Curve Displayed
Another way of determining normality is by employing statistical methods, such
as using the skewness and kurtosis numbers given in SPSS. Skewness measures the
symmetry of the distribution and kurtosis defines the shape of the distribution. If the
skewness and kurtosis fall within a range that is +/- twice the standard error for skewness
and kurtosis, then the distribution presents no problematic deviations from normality (De
Carlo, 1997; Kendall, Stuart, Ord, & O’Hagan, 1999). For Reading Comprehension,
skewness was -.08 and kurtosis was .02, both within the acceptable range to be
considered normal. For Reading Speed, skewness was .56 and kurtosis was .50, both
within the acceptable range to be considered normal. For Reading Prosody, skewness

119
was -.32 and kurtosis was .15, both within the acceptable range to be considered normal.
Because the skewness and kurtosis numbers for Reading Accuracy (skewness was -1.09
and kurtosis was 1.41) were elevated above the threshold of +/- twice the standard error
for skewness and kurtosis, the data could not be considered normal. Therefore, it was
determined that the data was nonnormal and Spearman’s rho (a nonparametric test of
correlation) would be utilized to measure the correlation between the three fluency
subskills and reading comprehension, rather than Pearson’s r as originally planned
(Salkind & Green, 2011).
The assumption that the data was linear was determined by examination of
scatterplots that represent the relationship between the two variables in question. Those
scatterplots can be seen in Figure 6, Figure 7, and Figure 8. None of the scatterplots
show a curvilinear relationship, so the data was assumed to be linear (Tabachnik &
Fidell, 2007). Even though all data was found to be linear, a nonparametric test was still
deemed most appropriate for this analysis because neither the assumption of normality
nor the assumption of homoscedasticity was tenable.

120
Figure 6. Linear Relationship Between Reading Comprehension and Reading Speed.

121
Figure 7. Linear Relationship Between Reading Comprehension and Reading Accuracy.

122
Figure 8. Linear Relationship Between Reading Comprehension and Reading Prosody.
The assumption that the data is homoscedastic means that a similar variability in
scores exists at all values of the dependent variable (Tabachnik & Fidell, 2001).
Homoscedasticity can be easily determined by visual examination of the same
scatterplots that were used to determine linearity. If the cluster of points is nearly the
same width throughout the scatter, then the data is homoscedastic. Only Figure 8 clearly
shows a homoscedastic pattern, while Figure 6 and Figure 7 display a heteroscedastic
relationship. The inability to assume homoscedasticity further necessitated the use of
Spearman’s rho to measure the correlations in this study. Pearson’s r is not a good
summary of association if the data is heteroscedastic.

123
Data Analysis for Research Hypothesis 1
Research Hypothesis 1
There is a statistically significant relationship between reading speed (as
measured by the QRI-4) and reading comprehension (as measured by the Measures of
Academic Progress [MAP]).
Null Hypothesis 1
There will be no statistically significant relationship between reading speed (as
measured by the QRI-4) and reading comprehension (as measure by MAP) in at-risk
adolescent readers.
Results
Hypothesis 1 was tested by conducting a Spearman’s rho correlation, using SPSS
19, between the reading speed variable and the reading comprehension variable. Using
Spearman’s rho instead of Pearson’s r increased the likelihood of committing Type I
errors. Therefore, the Bonferroni approach was used to control for Type I errors across
the 3 correlations; a p value of less than .017 (.05/3 = .017) was required for significance
(Salkind & Green, 2011). The correlation was statistically significant and positive, rs(77)
= .835, p < .05, thus allowing for rejection of Null Hypothesis 1. Because Null
Hypothesis 1 could be rejected and the correlation coefficient was above .80, it could be
concluded that reading speed was strongly correlated with reading comprehension
because the effect size was large (Cohen, 1988).
Data Analysis for Research Hypothesis 2

124
Research Hypothesis 2
There is a statistically significant relationship between reading accuracy (as
measured by the QRI-4) and reading comprehension (as measured by the MAP).
Null Hypothesis 2
There will be no statistically significant relationship between reading accuracy (as
measured by the QRI-4) and reading comprehension (as measure by MAP) in at-risk
adolescent readers.
Results
Hypothesis 2 was tested by conducting a Spearman’s rho correlation, using SPSS
19, between the reading accuracy variable and the reading comprehension variable.
Using Spearman’s rho instead of Pearson’s r increased the likelihood of committing Type
I errors. Therefore, the Bonferroni approach was used to control for Type I errors across
the 3 correlations; a p value of less than .017 (.05/3 = .017) was required for significance
(Salkind & Green, 2011). The correlation was statistically significant and positive, rs(77)
= .347, p < .05, thus allowing for rejection of Null Hypothesis 2. Because Null
Hypothesis 2 could be rejected and the correlation coefficient was above .20, it could be
concluded that reading speed was weakly correlated with reading comprehension because
the effect size was small (Cohen, 1988).
Data Analysis for Research Hypothesis 3
Research Hypothesis 3
There is a statistically significant relationship between reading prosody (as
measured by the MFS) and reading comprehension (as measured by the MAP).

125
Null Hypothesis 3
There will be no statistically significant relationship between reading prosody (as
measured by the MFS) and reading comprehension (as measure by MAP) in at-risk
adolescent readers.
Results
Hypothesis 3 was tested by conducting a Spearman’s rho correlation, using SPSS
19, between the reading prosody variable and the reading comprehension variable. Using
Spearman’s rho instead of Pearson’s r increased the likelihood of committing Type I
errors. Therefore, the Bonferroni approach was used to control for Type I errors across
the 3 correlations; a p value of less than .017 (.05/3 = .017) was required for significance
(Salkind & Green, 2011). The correlation was statistically significant and positive, rs(77)
= .835, p < .05, thus allowing for rejection of Null Hypothesis 3. Because Null
Hypothesis 3 could be rejected and the correlation coefficient was above .80, it could be
concluded that reading prosody was strongly correlated with reading comprehension
because the effect size was large (Cohen, 1988).
Data Analysis for Research Hypothesis 4
Research Hypothesis 4
The fluency variable (as measured by the MFS) that is most strongly related to
reading comprehension (as measured by the MAP) is reading prosody.
Null Hypothesis 4
There will be no statistically significant difference between how strongly reading
prosody (as measured by the MFS) is related to reading comprehension (as measured by
MAP) and how strongly reading speed and reading accuracy (as measured by the QRI-4)

126
are related to reading comprehension (as measured by MAP) in at-risk adolescent
readers.
Results
The results of Research Hypothesis 4 were determined by comparing the
individual Spearman’s rho correlations that were ascertained during the testing of
Hypotheses 1, 2, and 3 with each other. These results can be seen in a correlation matrix,
which is presented in Table 5. The correlation between reading prosody and reading
comprehension was tied for the strongest with the correlation between reading speed and
reading comprehension (both were .835). Although this means that no correlations were
stronger among the relationships being studied than the prosody-comprehension
relationship, Null Hypothesis 4 could not be rejected because the prosody-comprehension
relationship did not technically have the largest effect size. The correlation matrix also
shows that reading speed and reading prosody are very strongly correlated, but that
reading accuracy is not strongly correlated to any of the other variables. These are results
that are discussed further in Chapter 5.

127
Table 5 Spearman’s rho Correlation Matrix
Variable
Statistic
Reading Comp.
Reading Speed
Reading Accuracy
Reading Prosody
Reading Comp.
Correlation Coefficient
--
.835* (N = 79)
.347*
(N = 79)
.835* (N = 79)
Sig. -- .000 .002 .000
Reading Speed
Correlation Coefficient
.835*
(N = 79)
--
.337
(N = 79)
.800
(N = 79) Sig. .000 -- .002 .000
Reading Accuracy
Correlation Coefficient
.347*
(N = 79)
.337
(N = 79)
--
.320
(N = 79) Sig. .002 .002 -- .004
Reading Prosody
Correlation Coefficient
.835*
(N = 79)
.800
(N = 79)
.320
(N = 79)
--
Sig. .000 .000 .004 --
*p < .05
Summary
This chapter presented the descriptive statistics, assumptions testing, and tests of
hypotheses for this study. The data analysis revealed that some of the assumptions could
be met for some of the variables, but that assumptions for the absence of extreme outliers,
normality, and homoscedasticity could not be assumed for all of the variables. This led
the researcher to reject use of Pearson’s r because the data was not part of a normally
distributed data set. Spearman’s rho, a nonparametric measurement of correlation, was
used instead.

128
The study addressed four research questions. Research Hypothesis 1 addressed
the correlation between reading speed and reading comprehension. Reading speed and
reading comprehension were found to be strongly correlated (ES = .835). Research
Hypothesis 2 addressed the correlation between reading accuracy and reading
comprehension. Reading accuracy and reading comprehension were found to be weakly
correlated (ES = .347). Research Hypothesis 3 addressed the correlation between reading
prosody and reading comprehension. Reading prosody and reading comprehension were
found to be strongly correlated (ES = .835). Research Hypothesis 4 addressed whether or
not reading prosody was the research variable most strongly correlated with reading
comprehension. It was found that reading prosody and reading speed had an identical
strength of correlation with reading comprehension (ES = .835). A correlational matrix
was also presented in order to display the relationships between all of the variables that
were measured in this study. The significance of these results is discussed in Chapter
Five.

129
CHAPTER FIVE: DISCUSSION
The previous chapter presented data analysis which utilized Spearman’s rho to
measure the relationship between the three reading fluency subskills (reading speed,
reading accuracy, and reading prosody) and reading comprehension in at-risk adolescent
readers. The chapter presented descriptive statistics for each reading variable,
assumption testing that showed the viability of utilizing parametric testing, and data
analysis to test each of the research hypotheses.
The purpose of this chapter is to review the findings of the previous chapter and
discuss them in light of related literature and the theoretical framework that guided this
study. This chapter is divided into the following sections: summary of the findings,
discussion and implications, delimitations/limitations/assumptions, recommendations,
and conclusion.
Summary of the Findings
Research Hypothesis 1
Research Question 1 asked if there was a statistically significant relationship
between reading speed and reading comprehension in at-risk adolescent readers. The
researcher hypothesized that the correlation between the two variables would be
significant. The Spearman’s rho correlation statistic showed that this hypothesis was
correct because the relationship was statistically significant, and the effect size was large
(ES = .835).

130
Research Hypothesis 2
Research Question 2 asked if there was a statistically significant relationship
between reading accuracy and reading comprehension in at-risk adolescent readers. The
researcher hypothesized that the correlation between the two variables would be
significant. The Spearman’s rho correlation statistic showed that this hypothesis was
correct because the relationship was statistically significant, but the effect size was small
(ES = .347)
Research Hypothesis 3
Research Question 3 asked if there was a statistically significant relationship
between reading prosody and reading comprehension in at-risk adolescent readers. The
researcher hypothesized that the correlation between the two variables would be
significant. The Spearman’s rho correlation statistic showed that this hypothesis was
correct because the relationship was statistically significant, and the effect size was large
(ES = .835).
Research Hypothesis 4
Research Question 4 asked which of the three fluency subskills would be most
highly correlated with reading comprehension in at-risk adolescent readers. The
researcher hypothesized that reading prosody would be most strongly correlated with
reading comprehension. The Spearman’s rho correlation statistic revealed that this
hypothesis was partially correct because reading speed and reading prosody were found
to have equally strong relationships (ES = .835) with reading comprehension.
Discussion and Implications

131
As indicated by the correlation matrix in Table 5, reading speed and reading
prosody are strongly correlated (.819). This was an expected result because speed and
the specific component skills of prosody (pace, smoothness, suprasegmental ability,
attention to textual features, and pitch) go hand in hand (Biemiller, 1978; LeBerge &
Samuels, 1974). LaBerge and Samuels’ (1974) theory of automaticity predicted that
reading speed would increase as the prosodic elements of reading fluency increased,
resulting in increased reading comprehension. This result indicates that implicit
instruction of prosodic elements should help increase reading speed if the two are taught
simultaneously, and vice-versa.
As indicated by the results of Research Hypothesis 2 testing, accuracy and
comprehension are only weakly correlated. This was not an expected result because a lot
of time is spent on teaching and remediating reading accuracy in elementary schools and
middle schools. Perhaps the weak relationship between reading accuracy and reading
comprehension is because at-risk struggling readers who read too slowly to maintain
accuracy do not have enough thought units enter short term memory to fully comprehend
text. Yet, today there are many programs (Wilson, Orton-Gillingham) that focus on
improvement of phonics skills, spelling, pronunciation, and other subskills of reading
accuracy in high schools. The Spearman’s rho results indicate that focusing on reading
accuracy is likely not an appropriate pedagogical approach when the goal is increased
reading comprehension for at-risk adolescent readers. Chall’s (1983) stages of reading
suggest that adolescence is not the correct stage of development to work on phonics and
spelling and other aspects of reading accuracy. The participants in this study have had
severe disruptions to their natural development (Erickson, 1950; Piaget, 1969). If an at-
132
risk adolescent reader has not gained accuracy skills during the elementary school years
because of those disruptions, it may be ineffective for secondary teachers to attempt to
teach them as a means of improving overall reading comprehension. At-risk adolescents
who did not acquire the accuracy skills at the correct time in their reading development
have most likely already learned to compensate for their deficiency in accuracy in other
ways (Shaywitz, 2003). This is clear when they are reading aloud and mispronounce or
skip words that are unknown, yet are still able to comprehend. They have learned to rely
on context to determine meaning when their accuracy skills fail.
The results of this study also indicate that reading accuracy and reading prosody
are only weakly correlated and reading accuracy and reading speed are only weakly
correlated. This suggests that reading fluency subskills may be more individual than
previously thought; perhaps they do not develop together, but individually. Since reading
fluency is such a complex task (Hudson et al., 2009; Kame’enui & Simmons, 2001), it
may be necessary to focus on the fluency subskills individually rather than
simultaneously through reading of real text or other “authentic” tasks. Reading teachers
may need to focus their teaching for at-risk adolescent readers on explicit instruction that
aims at developing specific fluency skills rather than activities that attempt to develop
them together since the connection between the individual subskills of reading fluency is
not strong for two out of the three relationships.
Reading prosody and reading speed are strongly correlated with reading
comprehension. Research Hypothesis 4 stated that reading prosody would be the most
strongly correlated with reading comprehension, but it was only tied for strongest with
reading speed. If teachers of at-risk adolescent readers endeavor to improve the reading

133
comprehension skills of their students, these two fluency subskills should be the focus of
much of the reading intervention time. As stated earlier, reading speed and reading
prosody are also strongly correlated amongst themselves, increasing the likelihood that
teaching the two skills simultaneously will indeed have the desired effect of improving
reading comprehension. There are specific pedagogical approaches that secondary
reading teachers can learn that will highlight reading prosody and reading speed during
reading intervention sessions (Rasinski, 2003b).
One of the tenets of the theoretical framework developed for this study stated that
every student has the potential to learn if their basic needs are met (Maslow, 1943).
Using Maslow’s theory, it is easy to predict that an adolescent whose basic needs are not
met would not be interested in the nuances of reading acquisition. While teachers and
researchers debate the appropriateness of teaching certain fluency subskills at certain
times, the at-risk adolescent who is hungry, cold, tired, and unloved would not care about
those things at all. Thus, it makes sense to ensure that the student has received the full
benefit of the social services that the school offers before any attempts are made at
reading remediation. Educators know that education is only slightly less necessary than
the basic needs outlined in Maslow’s (1943) hierarchy, but education is irrelevant to a
teenager who is not being cared for, sheltered, fed, or made to feel safe.
The second tenet of the theoretical framework developed for this study stated that
the problems that have prevented adolescents from acquiring reading comprehension
proficiency are preventable if attacked in the correct manner and at the correct
developmental stages (Chall, 1983; Erikson, 1950; Piaget, 1969). It is clear from the
results of Research Hypothesis 2 that adolescence is not the correct time to attempt to

134
remediate reading accuracy deficits. Since reading accuracy is only weakly correlated
with reading comprehension (ES = .347), the payoff for the amount of hard work put into
reading accuracy instruction would be small. Reading accuracy instruction involves
extensive and tedious attention to such skills as phonology and orthography. Accuracy
remediation takes time and does not seem to translate into improved reading
comprehension.
The third tenet of the theoretical framework developed for this study stated that
reading fluency is a highly technical skill with numerous interactions between print, the
eyes, speech organs, and the brain (Biemiller, 1978; Hudson et al., 2009; Kame’enui &
Simmons, 2001; LaBerge & Samuels, 1974). The complicated nature of reading
acquisition and remediation is clear from the results of this study. There are so many
facets of reading development that it can be overwhelming to pinpoint how best to
approach reading instruction with any student, but it is especially difficult when the
variables inherent in an at-risk adolescent confound the process. For example, even with
the clear results from this study, there are still many unknown factors that could have an
influence on the reading comprehension of the participants. For example, reading
prosody has at least five subskills (Rasinski, 1985; 2003b; Zutell & Rasinski, 1991), so
finding that reading prosody is strongly correlated with reading comprehension creates
further questions about which specific parts of reading prosody caused the correlation to
be strong.
Recommendations

135
Recommendations for Practical Applications
Several implications may be drawn from the results of this research. These
implications lead naturally to several practical applications of the findings that can be
implemented during the instruction of reading:
• Accuracy should be developed and perfected during the elementary years
because it is unlikely that it will be developed in the secondary schooling
years, especially for at-risk adolescent readers. Reading accuracy can be
improved through such pedagogical foci as explicit phonics instruction,
the study of orthography, and the study of morphology.
• Reading teachers should spend less time on accuracy-related exercises in
secondary reading classes. Accuracy that is not learned during the
elementary school years is unlikely to be learned in later years. By this
time, struggling readers have learned to compensate for their reading
accuracy deficiencies by various means (Shaywitz, 2003). Even if reading
accuracy is improved slightly during the secondary years, it does not have
the potential to impact reading comprehension in any significant way like
improvement in reading speed and reading prosody do, according to the
results of this research.
• Reading teachers should spend more time on developing the ability to
glean meaning from context. Since it is clear from this study that at-risk
adolescents do not (or cannot) rely heavily on accuracy skills to
comprehend text, then teachers should spend some time developing the
skills that they do use-one of those is using context to determine meaning.

136
While the failure of the whole language philosophy has taught us that this
skill cannot stand alone in terms of comprehension instruction (Eldredge
& Baird, 1996; NRP, 2000), when coupled with prosody and speed
exercises, it could have some value.
• Reading teachers should spend more time on prosody and speed related
exercises in secondary reading classes. Examples of these exercises
include timed readings, tape-assisted readings, adult/student reading,
reading poetry aloud or reader’s theatre, focusing on sentences that require
attention to textual cues, choral reading in which pitch and tone are
repeated after the teacher’s annunciation, and activities that focus on the
transition between letters, words, phrases, and sentences. Very little time
is given to these types of activities at the secondary level.
• Secondary reading remediation activities should tie reading speed and
reading prosody together. These types of activities are not currently in
use, if they exist at all. More time needs to be devoted to the development
of prosody and speed during remediation time. It seems that some type of
prosody-focused timed reading might provide this type of dual focus
during reading instruction.
Recommendations for Future Research
This research sheds light on the relationship between the three fluency subskills
and reading comprehension. However, it also illuminates some research needs related to
the issues that have been discussed. Recommendations for future research include ways
to extend the current study as well as ideas for entirely separate investigations that are

137
now necessary because of gaps, weaknesses, or interesting revelations identified during
this study.
The study should be repeated with both at risk males and females. It is equally
important for teachers to know how strongly the three reading subskills correlate with
reading comprehension in at-risk adolescent females as it is to know that information for
at-risk adolescent males. A researcher could also repeat this study with just females and
use that information for comparison purposes.
This study could be repeated with a more ethnically diverse group; Caucasian
students comprised most of the participants (95.1%). At-risk students exist in all regions
of the United States, so a researcher could find a location that is more ethnically diverse
to conduct a similar research study. That research could include both male and female
participants or just females, as mentioned previously.
Future research could include a norming study that includes students in grades 10-
12. That study could develop reading fluency norms for grades 10-12 (which currently
do not exist) so that proper reading speed can be determined and/or recognized when it is
tested in secondary schools. Classroom teachers in grades 10-12 who are interested in
remediating reading speed difficulties need a standard so that they can compare their
students’ WPM with a norm for their students’ age group.
Future studies could expand this study by adding life variables (such as the ones
identified in Chapter Two) to the reading variables to determine what influence life
variables have on reading comprehension. This would require use of a multiple
regression analysis procedure because of the number of variables and the possible
interactions between those variables. It is very likely that life variables would be found

138
to be more influential on reading comprehension that the reading variables in this study.
A larger sample size (minimum N = 125) would be needed to conduct this type of
analysis.
Both reading prosody and reading accuracy have several subskills of their own.
Finding that reading prosody or reading accuracy are correlated with reading
comprehension is not enough information. It would be invaluable to know which of the
subskills of prosody and accuracy are most responsible for the correlation with
comprehension, and which have only a small part in the relationship. Future research
should investigate those questions.
True experimental research should be undertaken that has the ability to produce a
new reading remediation technique that combines attention to reading speed with
attention to the several elements of reading prosody. A researcher could develop and test
this type of program using at-risk adolescent struggling readers as the participants. One-
half of the participants could be taught using the new dual focus technique and the other
half could be instructed in the traditional manner with reading speed skills and reading
prosody skills being taught separately.
This study should be repeated with students who are at-risk, but more emotionally
stable. The participants in this study were diagnosed with mental illnesses, head trauma,
emotional disturbances, and a myriad of stressful life situations. The reading
comprehension test used in this study is administered when they first arrive at the facility.
Obviously, this is a time of great upheaval in their lives. Couple that with the fact that
they are often in the detoxification stage from years of drug use, and the result is that they
are left emotionally and mentally fatigued. Future research could repeat this study with

139
students who are at-risk adolescents, but not quite as emotionally unstable. It could also
be repeated at the same facility using tests that are administered further into the
participants’ commitment when their emotions and chemical balances have evened out.
A longitudinal study that tracks elementary school at-risk students through the end of
high school, based on the type of elementary school reading intervention they received
and when they received it, would provide invaluable insight into what types of
interventions are effective for at-risk youth. The factors that identify a student as at-risk
are already well known. If the appropriate reading intervention (depending on their stage
of development) can occur, perhaps some of those who are at risk could be guided in a
more positive direction (Christle & Yell, 2008).
Delimitations, Limitations, and Assumptions
Delimitations
The content of this study was selected because of an identified gap in the research
on adolescent at-risk readers in terms of which fluency subskills most highly correlate
with reading comprehension. The research on struggling adolescent readers is growing
exponentially, yet is still largely ignoring the individual factors that impact reading
comprehension, as well the ways in which they influence reading comprehension.
The original study design was a simple correlational study which sought to examine
which of three independent variables (reading speed, reading accuracy, and reading
prosody) correlated most highly with reading comprehension. To make the study more
significant, the study was changed to a multivariate analysis which would determine
which of the three predictor variables best predicted reading comprehension in at-risk
adolescent readers. Later, in an attempt to identify all of the factors that combine to

140
impact reading comprehension, many other predictor variables were added. A review of
the current literature supported inclusion of these new predictor variables, especially in
regards to the lives of the target population of at-risk adolescents. However, after further
consideration, research, and sample size analysis, the study was delimited to include only
those variables that had valid and reliable instruments to measure them. The decision to
use archival data was a result of the attempt to protect a vulnerable group of participants
from possible harm.
Another consideration in the decision to limit the number of variables was the
usability of the results. The choice of only three variables (rather than over 20
environmental and innate variables that were considered, and are mentioned in the review
of literature) was made because if variables that are not under the control of teacher and
reading specialists were found to be highly correlated with reading comprehension, what
contribution would that really make to practitioners in the field? Those life variables
would also have been very difficult to operationalize and quantify. Thus, the study
intentionally excluded from the statistical analyses many factors that could largely
influence a student’s ability to comprehend what they read, specifically the
environmental and innate variables mentioned in Chapter Two.
The study also intentionally excluded otherwise pertinent reading issues, such as
evaluating specific classroom reading programs, some of the more technical aspects of
reading that can lead to reading difficulties, the important question of setting standards
for adequate reading speed in high school, and the developmental reading continuum.
While these are all important issues, they were peripheral to the interests of this study. In
order to obtain research results that were statistically stronger, the scope of the study was

141
delimited to include only the elements that would precisely answer this study’s research
questions. According to Pearl (2009), correlational interpretations can be made with
more certainty when there are fewer confounding variables. Spending time on topics that
were not directly relevant would have only hindered this goal.
Limitations
There are limitations in this study because of certain weaknesses that exist in the
research methodology, design, analysis, and sample. There are three limitations that
apply to every correlational study. There are also limitations that apply specifically to
this study, and those are explained in this section as well.
Limitations due to study design. The sample for this study was not random.
The participants were chosen based on the availability of complete data sets within a
certain time frame. This may have inadvertently caused bias in the research design.
While no particular control was put in place to limit the effects of a lack of randomization
bias, the sample did include a representative demographic cross-section of students that
have attended the school at the target facility (see Table 1).
Correlational studies are valuable in that they show that one variable is either
related, or not related, to another variable. Correlation analyses also provide the strength
of relationship between two variables. However, correlation is not an indicator of
causation (Ary et al., 2006; Tabachnik & Fidell, 2001). One cannot say that one variable
causes another variable just because they are correlated. For example, it was found in
this study that reading speed and reading comprehension are strongly correlated, but that
does not indicate that proficiency in reading speed causes proficiency in reading

142
comprehension. No control was needed to rectify this situation because causation was
not stated or implied in the study, only correlation.
Another limitation of correlational studies is the directional limitation. It is
impossible to determine if one variable is responsible for another variable, or if the
relationship is the exact opposite (Hill & Lewicki, 2007). For example, it was found in
this study that reading prosody and reading comprehension are strongly correlated, but it
may be that reading comprehension ability impacts reading prosody, and not vice-versa.
This is another reason that correlation cannot determine causation. No control was
needed for directional limitation because the direction of the relationship was irrelevant
to the results. Only the existence of statistically significant relationship was important,
not the relationship’s direction.
A final limitation of correlational studies is the possibility that a third variable
simultaneously influences both of the variables that are being examined, resulting in a
skewed correlation coefficient (Hill & Lewicki, 2007). For example, it was found in this
study that reading speed was strongly correlated with reading comprehension, but it may
be the case that reading prosody is a moderator variable because it impacts both of the
variables being examined. Again, no control was needed for this limitation because it
was already an established fact that reading is a recursive process in which the various
skills interact with each other as the reader learns and develops reading ability; this is
especially true of secondary students (Mateos, Martín, Villalón, & Luna, 2008).
Consumers of reading research need to be aware of this and take it into consideration
when viewing the results of the study.

143
Limitations due to study sample. There are a number of demographic
limitations that were present in this study. The participants were all male, were spread
out in age between 13-19 (mean age = 17.16 years), were nearly all Caucasian, and nearly
all from rural areas. These limitations definitely influence the generalizability of the
results to both sexes, all ages, all races, and all geographical areas. The researcher
believes, however, that the results are applicable to all at-risk adolescent readers because
the participants in this study are excellent representations of the category of at-risk
adolescent reader.
This study was conducted at a maximum security juvenile prison where the
researcher works as a literacy specialist. In that location, all of the students clearly fit the
at-risk classification. However, the unique context of the study may produce more
unreliable and less generalizable results. The MAP test is given to students for the first
time within one week of arrival at the facility. Naturally, this is a tumultuous time in the
lives of the students; they have just been committed to prison, they are often in the
detoxification stage because they were previously addicted to illegal drugs and alcohol,
and they are in an unfamiliar environment. Thus, the results of the MAP test (this study’s
measure of reading comprehension) given at the end of that first week may not be as
reliable as the researcher would like. However, this is not very different than the
uncertainty testers would face in a public school situation where there may still be
apathy, challenging home environments, and the students may even still be addicted to
drugs and alcohol.
In addition to the testing accuracy limitations, the site forced a correlational study
due to the limited amount of archival data available for analysis. A multivariate

144
technique would have been a preferable research design because of its ability to identify
which of the variables of interest actually predict reading comprehension; however, a
minimum sample size of 125 was necessary (Tabachnik & Fidell, 2007) but not available.
Limitations due to study instrumentation and analysis. The use of Spearman’s
rho instead of Pearson’s r increases the likelihood of a Type I error (the null hypothesis is
true, but it is rejected). The research controlled for the Type I error by using a corrected
significance level called the Bonferroni approach. Because three correlations were
computed, the researcher was able to minimize the chances of making a Type I error with
this approach. It required dividing the .05 significance level used in this study by the
number of computed correlations (three). The three computed correlation coefficients
were not considered significant unless their p values were less than the corrected
significance level (.017). Using the Bonferroni approach, all three correlations were
found to be significant, thus eliminating the concerns about Type I errors caused by the
use of Spearman’s rho (Salkind & Green, 2011).
Another limitation is the reading prosody rubric instrument. By their nature,
rubrics are subjective and largely dependent on the knowledge, skill, and judgment of the
rubric administrator. Even though this rubric has been validated through use in published
studies, and even though the prosody testing was done by a trained reading specialist who
had experience with the instrument, the possibility of error due to bias or subjectivity was
still present.
With the elimination of outliers, there is a danger of obtaining results that do not
accurately reflect the reality of the variability of the participants’ reading ability, given
the natural unreliability of the target population. Indiscriminant deletion of outliers is not

145
ever appropriate (Orr, Sackett, & DuBois, 1991). In fact, only 8% of researchers even
screen their data for outliers (Osborne, Christiansen, & Gunter, 2001). However,
Zimmerman (1994) noted that retention of outliers in the data set increases the error
variance and reduces the power of statistical tests. Researchers must use their training
and thoughtful consideration in making decisions concerning outliers. Therefore, the
decision was made for this study to delete the cases that contained only extreme outliers
because the main concern was that the findings about the majority of the population were
accurate (Tabachnik & Fidell, 2007).
Limitations due to reliability and validity concerns. There were no large
external threats to validity in this study. Generalizability was a minor external threat
because of the large percentage of Caucasian participants. However, the area of the
Northeastern United States where this study was conducted is overwhelmingly Caucasian
(> 94%). Therefore, the sample (95.1% Caucasian) was representative of the general
population. The results of a study that focuses on adolescent at-risk readers should be
generalizable to any school that has a population that includes at-risk adolescent readers,
regardless of the racial makeup of the sample. Ecological validity was similarly a minor
problem in this study. The testing took place in the same classroom and with the same
teacher for all participants. In addition, there was no activity or other people present at
those times. Population validity was not a major problem in this study because the
research examined a very specifically defined group (at-risk adolescent readers), thus the
results are only generalizable to that group. A small threat existed because the
participants are incarcerated, and their behaviors and problems are extreme, perhaps

146
meaning that their scores are less generalizable to nonincarcerated students who exhibit
less extreme behaviors.
There were some potential internal threats to validity. The history threat was one
such possible problem. The researcher designed the study so that as little time as possible
passed between the collection of fluency assessment scores and the collection of MAP
assessments, but a small amount of time did go by. However, as no treatment was
administered in this study, the history effect, while present, was minimal.
Another threat that could have had a small influence on this study was
compensatory rivalry. This is what is referred to as the “John Henry Effect” (Ary et al.,
2006, p. 301). Students tend to try to read faster when they know that their fluency is
being tested. This not only positively influences their reading rate, but negatively
influences their accuracy, prosody, and recall as well.
A final group of threats to the validity of the study was related to the use of
Spearman’s rho.
• Homogenous group: The students in this group were similar on at least
one of the variables being studied, so the value of correlation coefficient
may have been affected.
• Unreliable measurement: The measurements in this study were all
published instruments found to be reliable and valid. However, there was
a possibility of skewed results due to inconsistent administration.
• Clumped scores due to ceilings or floors: Because one of the fluency
variables (reading prosody) had an upper ceiling and lower limit while the

147
reading comprehension variable did not, the scores were clumped together
and an inaccurate correlation could have resulted.
Assumptions
The following assumptions apply to this research:
• There are definite skills that comprise every aspect of reading competence,
and those skills can be developed given the correct instruction and internal
motivation (Zweirs, 2004).
• The foundational ideas of LaBerge and Samuels (1974) show that
automatic reading is the key to reading fluency, and correctly identifies
how automatic reading occurs.
• The NRP (2000) report identified five essential reading skills that are
necessary to teach and learn for optimal reading success to occur:
phonemic awareness, phonics skill, fluency, vocabulary, and
comprehension. The way in which they shed light on the problems of
adolescent reading failure is especially important to this research.
• An understanding of Chall’s (1983) stages of reading is essential to
instructional success for teachers of reading. Chall (1983) demonstrated
how teachers can optimize their teaching by knowing the stages of
reading, what instruction is needed at each stage, and then providing it.
Herber (1987) and Ehri (1995) also found that instruction in stages is
beneficial to student learning.
• NCLB ( 2001), which mandates reading success for all students by grade
three, and continued reading success through grade twelve, is an essential

148
document to parents, teachers, literacy specialists, and researchers who
desire to remediate literacy problems at the secondary level. NCLB policy
has made adolescent literacy a topic of immediate concern, which it has
not been in the past.
Conclusion
Overall, the findings from this study demonstrated that both reading speed and
reading prosody are strongly correlated with reading comprehension in at-risk adolescent
readers. The study also revealed that the relationship between reading accuracy and
reading comprehension is statistically significant, but the effect size is small (ES = .347)..
Findings from this study suggest that the development of reading speed and
reading prosody skills in at-risk adolescent readers may be the most essential factors in
the development of their reading comprehension. This is pertinent information for
secondary reading interventionists and secondary classroom teachers who often feel like
their attempts at reading remediation with at-risk adolescents are futile. As more
secondary reading specialists are introduced into the nation’s middle and high schools in
order to battle the growing problem of adolescent illiteracy, it is important for them to
know the most effective and quickest route to success with the increasing population of
at-risk adolescent struggling reader.

149
References
Adams, M. (l990). Beginning to read: Thinking and learning about print. Cambridge,
MA: MIT Press.
Alessi, S., & Dwyer, A. (2008). Vocabulary assistance before and during reading.
Reading in a Foreign Language, 20(2), 246-263.
Allen, S. (2005). The proposal of Stage One reading-groups timetable that integrates
major comprehension components. Australian Journal of Language and Literacy,
28(2), 138-149.
Allen-DeBoer, R., Malmgren, K., & Glass, M. (2006). Behavioral disorders for youth
with emotional and behavioral disorders in a juvenile correctional facility.
Behavioral Disorders, 32(1), 18–28.
Allington, R. (1977). If they don’t read much, how they ever gonna get good? Journal
of Reading, 21, 57-61.
Allington, R. (1983). Fluency: The neglected reading goal. The Reading Teacher, 37,
556–561.
Allington, R. (2002). You can’t learn much from books you can’t read. Educational
Leadership, 60(3), 16-19.
Archer, A., Gleason, M., & Vachon, V. (2003). Decoding and fluency: Foundation skills
for struggling older readers. Learning Disability Quarterly, 26, 89-101.
Ary, D., Jacobs, L., Razavieh, A., & Sorensen, C. (2006). Introduction to research in
education. Belmont, CA: Thomson Wadsworth.
Ashby, J. & Clifton, C. (2005). The prosodic property of lexical stress effects eye
150
movements during silent reading. Cognition, 96(3), B89-B100.
Ashby, J. & Rayner, K. (2004). Representing syllable information during silent reading:
Evidence from eye movements. Language and Cognitive Processing, 19(3), 391-
426.
Assaf, L. (2006). One reading specialist's response to high-stakes testing pressures.
Journal of Adolescent and Adult Literacy, 60(2), 158-167.
Baddeley, A. & Hitch, G. (1974). Working memory. In G.H. Bower (Ed.), The
psychology of learning and motivation: Advances in research and theory (pp. 47-
89). New York: Academic Press.
Baltodano, H., Harris, P., & Rutherford, R. (2005). Academic achievement in
juvenile corrections: Examining the impact of age, ethnicity, and disability.
Education and Treatment of Children, 28(4), 361-379.
Barret, V. & Lewis, T. (1994). Outliers in statistical data. Hoboken, NJ: John Wiley and
Sons.
Berninger, V., Abbott, R., & Swanson, H. (2010). Relationship of word- and sentence-
level working memory to reading and writing in second, fourth, and sixth grade.
Language, Speech, and Hearing Services in Schools, 41(2), 179-193.
Betts, E. (1946). What are the reading levels of your pupils? School, 34, 21-24, 92-96,
194-197.
Bhattacharya, A. (2010). Children and adolescents from poverty and reading
development: A research review. Reading and Writing Quarterly, 26(2), 115-
139.
Biemiller, A. (1978). Relationships between oral reading rates for letters, words, and

151
simple text in the development of reading achievement. Reading Research
Quarterly, 13(2), 223-253.
Bintz, W. (1993). Resistant readers in secondary education: Some insights and
implications. Journal of Reading, 36(8), 604-615.
Bisgaard, M., Eiberg,H., Moller, N., Niebuhr, E., & Mohr, J. (1987). Dyslexia and
chromosome 15 heteromorphism: negative load score in a Danish sample.
ClinGenet 32, 118–119.
Blackford, L. (2002). Secondary School Reading. Retrieved from
http://www.aasa.org/publication/saarticledetail.cfm?ItemNumber=2720
Bland, J. (2000). An introduction to medical statistics. Oxford: Oxford University Press.
Brinley, M. (2006). Does stress change the brain? UMDNJ Magazine, 3, 2.
Brooks, M., Hamann, L., & Vetter, M. (1997). Improving reading comprehension and
vocabulary development in at-risk students. Masters Action Research Project,
Saint Xavier University, Cincinnati, OH.
Brownell, M. (2000). Dr. Michael Pressley. Intervention in School and Clinic,105-107.
Brunner, M. (1993). Reduced recidivism and increased employment opportunity through
research-based reading instruction. NCJ Publication No. 141324. Washington,
DC: Office of Juvenile Justice and Delinquency Prevention.
Bryan, W. & Harter, N. (1899). Studies on the telegraphic language. The acquisition of a
hierarchy of habits. The Psychological Review, 6(4), 345-375.
Burns, M., Dean, V., & Foley, S. (2004). Preteaching unknown key words with
152
incremental rehearsal to improve reading fluency and comprehension with
children identified as reading disabled. Journal of School Psychology, 42(4), 303-
314.
Burns, S., Griffin, P., & Snow, C. (1999). Starting out right: A guide to promoting
children’s reading success. Washington, D.C.: National Academy Press.
Cain, K., Oakhill, J., Barnes, M., & Bryant, P. (2001). Comprehension skill, inference
making ability, and their relation to knowledge. Memory & Cognition, 29, 850–
859.
Cain, K., Oakhill, J., & Bryant, P. (2004). Children’s reading comprehension ability:
Concurrent prediction by working memory, verbal ability, and component, skills.
Journal of Educational Psychology, 96, 31-42.
Carver, R. (1997). Reading for one second, one minute, or one year from the perspective
of Rauding Theory. Scientific Studies of Reading, 1(1), 3-43.
Casey, B., Jones, R., & Somerville, L. (2011). Braking and accelerating of the adolescent
brain. Journal of Research on Adolescence, 21(1), 21-33.
Catone, W. & Brady, S. (2005). The inadequacy of individualized education programs
(IEP) goals for high school students with word-level reading difficulties. Annals
of Dyslexia, 55(1), 53-78.
Catsambis, S. (2001). Expanding knowledge of parental involvement in children's
secondary education: Connections with high school seniors' academic success.
School Psychology of Education, 5(2), 149-177.
Catts, H., Adlof, S., & Weismer, S. (2006). Language deficits in poor comprehenders: A

153
case for the simple view of reading. Journal of Speech, Language, and Hearing
Research, 49, 278-293.
Center, Y., Wheldall, K., Freeman, L., Outhred, L., & McNaught, M. (1995). An
evaluation of Reading Recovery. Reading Research Quarterly, 30(2), 240-263.
Chafe, W. (1987). Punctuation and the prosody of written language. Office of
Educational Research and Improvement (Ed.), Washington, D.C.: California
University, Berkeley Center for the Study of Writing.
Chall, J. (1983). Stages of reading development. Columbus, OH: McGraw-Hill.
Chall, J. (1996). Stages of reading development. Fort Worth, TX: Harcourt-Brace.
Chall, J. (2006). The academic achievement challenge: What really works in the
classroom? New York: Guilford Publishing Company.
Cheesman, E. & De Pry, R. (2010). A critical review of culturally responsive literacy
instruction. Journal of Praxis in Multicultural Education, 5(1), 82-99.
Christle, C. & Yell, M. (2008). Preventing youth incarceration through reading
remediation: Issues and solutions. Reading and Writing Quarterly, 24, 148-176.
Cizek, G. (2010). Review of Measures of Academic Progress. Retrieved from
http://www.unl.edu/buros/.
Clark, B. (2006). Breaking through to reluctant readers. Educational Leadership, 63(5),
66-69.
Cohen, J. (1988). Statistical power analysis for the behavioral sciences. Hillsdale, New
Jersey: Lawrence Erlbaum Associates.
Connor, C. & Zwolon, T. (2004). Examining multiple sources of influence on the

154
reading comprehension skills of children who use cochlear implants. Journal of
Speech, Language, and Hearing Research, 47, 509-526.
Cowie, R., Douglas-Cowie, E., & Wichmann, A. (2002). Prosodic characteristics
of skilled reading: Fluency and expressiveness in 8–10-year-old readers.
Language and Speech, 45(1), 47–82
Coyne, M., Kame’enui, E., & Simmons, D. (2001). Prevention and intervention in
beginning reading: Two complex systems. Learning Disabilities Research &
Practice, 16(2), 62-73.
Crowe, E., Coyne, C., McDonald, C., & Petscher, Y. (2009). Examining the core:
Relations among reading curricula, poverty, and first through third grade reading
achievement. Journal of School Psychology, 47(3), 187-214.
Crystal, D. & Davy, D. (1969). Investigating English style. London: Longman.
Cunningham, A. & Stanovich, E. (1997). Early reading acquisition and its relation to
reading ability and experience 10 years later. Developmental Psychology, 33(6),
934-944.
De Carlo, L. (1997). On the meaning and use of kurtosis. Psychological Methods, 3(2),
292-307.
Devault, R. & Joseph, L. (2004). Repeated readings combined with word boxes phonics
technique increases fluency levels of high school students with severe reading
delays. Preventing school failure, 49(1), 22-27.
Dorit, R. & Mashraki, Y. (2007). Prosodic reading, reading comprehension, and
morphological skills in Hebrew-speaking fourth graders. Journal of Research in
Reading, 30(2), 212-219.

155
Dowhower, S. (1987). Effects of repeated reading on second-grade transitional readers'
fluency and comprehension. Reading Research Quarterly, 22, 389-406
Dowhower, S. (1991). Speaking of prosody: Fluency’s unattended bedfellow. Theory in
Practice, 30 (3), 158–164.
Drakeford, W. (2002). The impact of an intensive program to increase the literacy skills
of youth confined to juvenile corrections. Journal of Correctional Education, 53,
139–144.
Dudley, A. & Mather, N. (2006). Getting up to speed on reading fluency. New England
Reading Association Journal, 41(1), 17-22.
Educational Cyberplayground. (2004). Retrieved from http://www.edu-cyberpg.com/.
Edwards, K. (2008). Examining the impact of phonics intervention on secondary
students’ reading improvement. Educational Action Research, 16(4), 545-555.
Ehri, L. (1995). Stages of development in learning to read words by sight. Journal of
Research in Reading 18, 116-125.
Eldredge, J. (2005). Foundations of fluency: An exploration. Reading Psychology, 26,
161-181.
Eldredge, L. & Baird, J. (1996). Phonemic awareness training works better than whole
language instruction for teaching first graders how to write. Reading Research
and Instruction 35(1), 193-208.
Erikson, E. (1950). Childhood and Society. New York: W.W. Norton & Co., Inc.
Faggella-Luby, M. & Deshler, D. (2008). Reading comprehension in adolescents with
LD: What we know; what we need to learn. Learning Disabilities Research &
Practice, 23(2), 70-78.

156
Feldman, K. (2004). Secondary school literacy: A framework for school-wide
intervention. The Special Edge Insert, Autumn, 1-4.
Field, A. (2009). Discovering statistics using S.P.S.S.. Thousand Oaks, CA: Sage
Publications.
Fisher, D. (2008). Struggling adolescent readers. Teacher Librarian, 35(3), 1-5.
Fisher, D., Frey, N., & Lapp, D. (2008). Shared meanings: Modeling comprehension,
vocabulary, text structures, and text features for older readers. Reading Teacher,
61(7), 548-556.
Fisher, D. & Ivey, G. (2006). Evaluating the interventions for struggling adolescent
readers. Journal of Adolescent and Adult Literacy, 50(3), 180-189.
Fisher, S., Stein, J., & Monaco, A. (1999). A genome-wide search strategy for
identifying quantitative trait loci involved in reading and spelling disability
(developmental dyslexia). European Child and Adolescent Psychiatry, 8, III/47-
III/51.
Fountas, I. & Pinnell, G. (1996). Guided reading: Good first teaching for all children.
Portsmouth, NH: Heinemann.
Frager, A. (2010). Enter the villain: Against oral reading in secondary schools.
American Secondary Education, 38(3), 28-39.
Fuchs, L., Deno, S., & Mirkin, P. (1984). Effects of frequent curriculum-based
measurement and evaluation on pedagogy, student achievement, and student
awareness of learning. Educational Research Journal, 21, 449–460.
Fuchs, L. & Fuchs, D. (1986). Curriculum-based assessment of progress toward
long- and short-term goals. Journal of Special Education, 20, 69–82.

157
Fuchs, L., Fuchs, D., Hosp, M., & Jenkins, J. (2001). Oral reading fluency as an
indicator of reading competence: A theoretical, empirical, and historical analysis.
Scientific Studies of Reading, 5(3), 239-256.
Fuchs, L., Fuchs, D., Hamlett, C., Walz, L., & Germann, G. (1993). Formative
evaluation of academic progress: How much growth can we expect? School
Psychology Review, 22, 27-48.
Fuchs, L., Fuchs, D., & Maxwell, L. (1988). The validity of informal measures of
reading comprehension. Remedial and Special Education, 9(2), 20-28.
Fuchs, L., Fuchs, D., & Zumeta, R. (2008). A curricular-sampling approach to progress
monitoring. Assessment for Effective Intervention, 33(4), 225-233.
Ghelani, K., Sidhu, R., Jain, U., & Tannock, R. (2004). Reading comprehension and
reading related abilities in adolescents with reading disabilities and attention
deficit/hyperactivity disorder. Dyslexia, 10, 364-384.
Goff, D., Pratt, C., & Ong, B. (2005). The relations between children’s reading
comprehension, working memory, language skills and components of reading
decoding in a normal sample. Reading and Writing, 18, 583-616.
Gorsuch, G. & Taguchi, E. (2008). Repeated reading for developing reading fluency and
reading comprehension: The case of EFL learners in Vietnam. System, 36, 253–
278.
Gough, P. & Tunmer, W. (1986). Decoding, reading, and reading disability. Remedial
and Special Education, 7, 6–10.
Graesser, A., Golding, J., & Long, D. (1991). Narrative representation and

158
comprehension. In Barr, R., Kami, M., Mosenthal, P., & Pearson, D. (Eds.),
Handbook of reading research (pp. 171-205). Hillsdale, NJ: Erlbaum.
Gregory, A. & Rimm-Kaufman, S. (2008). Positive mother-child interactions in
Kindergarten: Predictors of school success in high school. School Psychology,
37(4), 499-515.
Guthrie, J., Coddington, C., & Wigfield, A. (2009). Profiles of reading motivation
among African-American and Caucasian students. Journal of Literacy Research,
41(3), 317-353.
Guthrie, J. & Humenick, N. (2004). Motivating students to read: Evidence for classroom
practices that increase reading motivation and achievement. In P. McCardle & L.
Chhabra (Eds.), The voice of evidence in reading research (pp. 329–354).
Baltimore: Brookes.
Hagaman, J. & Reid, R. (2008). The effects of the paraphrasing strategy on the reading
comprehension of middle school students at risk for reading failure. Remedial
and Special Education, 29(4), 222-234.
Hall, G. (1904). Adolescence. New York: Appleton-Century-Crofts.
Hamsici, O. & Martinez, A. (2007). Spherical-homoscedastic distributions: The
equivalency of spherical and normal distributions in classification. Journal"of
Machine Learning Research, 8, 1583-1623.
Harn, B., Linan-Thomson, S., & Roberts, G. (2008). Intensifying instruction. Journal of
Learning Disabilities, 41(2), 115-125.
Harris, P., Baltodano, H., Bal, A., Jolivette, K., & Malcahy, C. (2009). Reading

159
achievement of incarcerated youth in three regions. The Journal of Correctional
Education, 60(2), 120-145.
Harris, T. & Hodges, R. (1995). The literacy dictionary: The vocabulary of reading and
writing. Newark, DE: International Reading Association.
Hasbrouck, J. & Tindal, G. (1992). Curriculum-based oral reading fluency norms for
students in grades 2 through 5. Teaching Exceptional Children, 24(3), 41–44.
Hazoury, K., Oweini, A., & Bahous, R. (2009). A multisensory approach to teach Arabic
decoding to students with dyslexia. Learning Disabilities: A Contemporary
Journal, 7(1), 1-20.
Hecht, S., & Greenfield, D. (2002). Explaining the predictive accuracy of teacher
judgments of their students’ reading achievement: The role of gender, classroom
behavior, and emergent literacy skills in a longitudinal sample of children
exposed to poverty. Reading and Writing, 15(7/8), 789-809.
Hempenstall, K. (n.d.). Stages of reading development. Retrieved from
http://lbsd.k12.ca.us/Pages/Instruction/Reading_ Stages.htm
Hempenstall, K. (2008). Corrective reading: An evidence-based remedial reading
intervention. Australian Journal of Special Education, 32(1), 23-54.
Herber, H. (1987). Helping students become independent learners. Education Digest,
53(4), 12-15.
Hettmansperger, T. & McKean, J. (1998). Robust nonparametric statistical methods.
Kendall's Library of Statistics 5. London: Edward Arnold.
Hill, T. & Lewicki, P. (2007). Statistics Methods and Applications. StatSoft, Tulsa, OK.
Hirsch, E. (1988). Cultural Literacy: What Every American Needs to Know. New York:

160
Random House, Inc.
Hock, M., Brasseur, I., Deshler, D., Catts, H., Marquis, J., Mark, C., & Stribling, J.
(2009). What is the reading component skill profile of adolescent struggling
readers in urban schools? Learning Disability Quarterly, 32(1), 21-38.
Hodges, J., Guiliotti, N., & Purpotage II, F. (1994). Improving literacy skills of juvenile
detainees. Juvenile Justice Bulletin. U.S. Department of Justice, Office of
Juvenile Justice and Delinquency Prevention.
Hoffman, J. (1987). Rethinking the role of oral reading in basal instruction. Elementary
School Journal, 87, 367-37.
Holt, J. (1994). Classroom attributes and achievement test scores for deaf and hard of
hearing students. American Annals of the Deaf, 139, 430-437.
Hoover, W. & Gough, P. (1990). The simple view of reading. Reading and Writing, 2,
127–160.
House Resolution 1, 111th Congress, (2009) (enacted).
Howell, (2010). Fundamental statistics for the behavioral sciences. Belmont, CA:
Wadsworth, Cengage Learning, Inc.
Hudson, R., Lane, P., & Pullen, P. (2005). Reading fluency assessment and instruction.
What, why, and how? The Reading Teacher, 58(8), 702-714.
Hudson, R., Pullen, P., Lane, P., & Torgesen, J. (2009). The complex nature of reading
fluency: A multidimensional view. Reading & Writing Quarterly, 25(1), 4-32.
Huttenlocher, P. (1979). Synaptic density in human frontal cortex: Developmental
changes and effects of aging. Brain Research, 163, 195-205.
Jackson, J. (1979). Reading in the secondary schools: A survey of teachers. Journal of

161
Reading, 23(3), 229-232.
Jenkins, J., Fuchs, L., Espin, C., van den Broek, P., & Deno, S. (2000). Effects of task
format and performance dimension on word reading measures: Criterion validity,
sensitivity to impairment, and context facilitation. Paper presented at Pacific
Coast Research Conference, San Diego, CA.
Jenkins, J., Fuchs, L., van den Broek, P., Espin, C., & Deno, S. (2003). Accuracy and
fluency in list and context reading of skilled and RD groups: Absolute and
relative performance levels. Learning Disabilities Research & Practice, 18(4),
237-246.
Jitendra, A., Edwards, L., Starostra, K., Stacks, G., Jacobson, L., & Choutka, C. (2004).
Early reading intervention for children with reading difficulties. Journal of
Learning Disabilities, 37(5), 421-439.
Johns-Lewis, C. (1986). Prosodic differentiation of discourse modes. In C. Johns-Lewis
(Ed.), Intonation in discourse (pp. 199 – 219). London: Croom Helm.
Johnson, W., Bouchard, T., Segal, N., & Samuels, J. (2005). General intelligence and
reading performance in adults: Is the genetic factor structure the same as for
children? Personality and Individual Differences, 38(6), 1413-1428.
Kame’enui, E., & Simmons, D. (2001). The DNA of reading fluency. Scientific Studies
of Reading, 5(3), 203-210.
Karlin, (1969). What does research in reading reveal about reading and the high school
student? In Agnella Gunn (Ed.), What we know about high school reading (pp.
123-136). Urbana, IL: National Council of Teachers of English.
Keehn, S., Harmon, J., & Shoho, A. (2008). A study of readers theatre in eighth grade:

162
Issues of fluency, comprehension, and vocabulary. Reading and Writing
Quarterly, 24, 335-362.
Keller, T. & Adams, M. (2009). Altering cortical connectivity: Remediation-induced
changes in the white matter of poor readers. Neuron, 64, 624-631.
Kendall, M., Stuart, A., Ord, J., & O’Hagan, A. (1999). Kendall’s advanced theory of
statistics, (Volume 1, distribution theory, 6th ed.). University of Michigan:
Edward Arnold Publishing.
Klauda, S. & Guthrie, J. (2008). Relationship of three components of reading fluency to
reading comprehension. Journal of Educational Psychology, 100(3), 31-321.
Klecker, B. & Pollock, M. (June, 2004). Differences in reading teaching strategies in
high and low performing secondary schools. Paper presented at the Annual
Meeting of the Mid-South Educational Research Association, Gatlinburg, TN.
Kortteinen, H., Narhi, V., & Ahonen, T. (2009). Does IQ matter in adolescent reading
ability? Learning and Individual Differences, 19(2), 257-261.
Krezmien, M. & Mulcahy, C. (2008). Literacy and delinquency: Current status of
reading interventions with detained and incarcerated youth. Reading & Writing
Quarterly: Overcoming Learning Difficulties, 24(2), 219-238.
Kuhn, M. & Stahl, S. (2000). Fluency: A review of developmental and remedial
practices. Center for the Improvement of Early Reading Achievement. University
of Michigan School of Education.
Kulich, S. (2009). Making the batter better: Using the fluency development lesson as a
recipe for success. Illinois Reading Council Journal, 37(4), 26-36.
LaBerge, D. & Samuels, S. (1974). Toward a theory of automatic information processing

163
in reading. Cognitive Psychology, 6, 293–323.
Lapp, D., & Fisher, D. (2009). It’s all about the book: Motivating students to read.
Journal of Adolescent and Adult Literacy, 52(7), 556-561.
Lenters, K. (2006). Resistance, struggle, and the adolescent reader. Journal of
Adolescent and Adult Literacy, 50(2), 138-146.
Leslie, L. & Caldwell, J. (1989). The Qualitative Reading Inventory: Issues in the
development of a diagnostic reading test. In S. McCormick and J. Zutell (Eds.),
Cognitive and social perspectives in literacy: Research and instruction (pp. 413-
419). Chicago, IL: National Reading Conference.
Leslie, L. & Caldwell, J. (2006). Qualitative reading inventory-4. Boston: Pearson.
Mac Iver, M. & Kemper, E. (2002). Guest editor’s introduction: Research on direct
instruction in reading. Journal of Education for Students Placed At-risk, 7(2), 7-
16.
Maine Unified Special Education Regulation Birth to Age Twenty, 05-071, Chapter 101.
Retrieved from http://specialchildren.about.com/gi/o.htm?zi=1/XJ&zTi=1&
sdn=specialchildren&cdn=parenting&tm=10&gps=299_302_1362_522&f=00&s
u=p284.13.342.ip_p504.6.342.ip_&tt=29&bt=1&bts=1&st=11&zu=http%3A//w
ww.maine.gov/education/speced/documents/071c101-2010final2010.pdf.
Maguin, E. & Loeber, R. (1996). Academic performance and delinquency. In M. Tonry
(Ed.), Crime and Justice: A Review of Research (p. 20). Chicago: University of
Chicago Press.
Malmgren, K. & Trezek, B. (2009). Literacy instruction for secondary students with
disabilities. Exceptional Children, 41(6), 1-13.

164
Manzo, K. (2007). To read or not to read: A question of national consequence (2007).
Education Week, 27(13), 1-5.c
Maslow, A. (1943). A theory of human motivation. Psychological Review, 50(4), 370-
396.
Massachusetts General Hospital for Children. Correctional Institutions. (2010).
Retrieved from http://www.mgh.harvard.edu/children/adolescenthealth/
articles/aa_correctional_institutions.aspx.
Mastropieri, M., Leinart, A., & Scruggs, T. (1999). Strategies to increase reading
fluency. Intervention and School Clinic, 34(5), 278-292.
Mateos, M., Martín, E., Villalón, R., & Luna, M. (2008). Reading and writing to learn in
secondary education: Online processing activity and written products in
summarizing and synthesizing tasks. Reading & Writing, 21(7), 21-34..
McCollin, M., O’Shea, D., & McQuiston, K. (2010). I mproving vocabulary and
comprehension skills of secondary-level students from diverse backgrounds.
Preventing School Failure, 54(2), 133-136.
McDonald, T., Thornley, C., Staley, R., & Moore, D. (2009). The San Diego Striving
Readers’ project: Building academic success for adolescent readers. Journal of
Adolescent and Adult Literacy, 52(8), 720-722.
McKeown, M., Beck, I., & Blake, R. (2009). Rethinking reading comprehension
instruction: A comparison of instruction for strategies and content approaches.
Reading Research Quarterly, 44(3), 218-253.
Medterms.com. (2010). Working memory. Retrieved from
http://www.medterms.com/script/main/art.asp?articlekey=7138.

165
Miller, J., & Schwanenflugel, P. (2008). A Longitudinal study of the development of
reading prosody as a dimension of oral reading fluency in early elementary school
children. Reading Research Quarterly, 43(4), 336-354.
Moats, L. (2001). When older students can’t read. Educational Leadership, 58(6), 36-
40.
Mokhtari, K., Porter, L., & Edwards, P. (2010). Responding to reading instruction in a
primary grade classroom. Reading Teacher, 63(8), 692-697.
Moore, D., Bean, T., Birdyshaw, D., & Rycik, J. (1999). Adolescent Literacy: A position
statement. Journal of Adolescent and Adult Literacy, 38(1), 1-14.
Morrow, L. (2005). Literacy development in the early years: Helping children read and
write. Columbus, OH: Pearson.
Nagy, W. (1988). Teaching vocabulary to improve comprehension. Urbana, IL:
National Council of Teachers of English; Newark, DE: International Reading
Association.
National Council on Teacher Quality. (2006). What education schools aren’t teaching.
Retrieved from http://www.nctq.org/nctq/images/nctq_reading_study_app.pdf.
National Governor’s Association (2011). Common core state standards initiative.
Retrieved from http://www.corestandards.org.
National Institute for Child Health and Human Development, National Institute for
Literacy. (2007). What content-area teachers should know about adolescent
literacy. Retrieved from http://www.nifl.gov/nifl/publications/adolescent.
National Institute for Child Health and Human Development, National Institute for

166
Literacy (2000). Summary of the National Reading Panel Report. Retrieved from
http://www.nifl.gov/nifl/publications.
National Reading Panel (2000). Report of the national reading panel: Teaching children
to read. An evidence-based assessment of the scientific research literature on
reading and its implications for reading instruction. Washington, DC: U.S.
Department of Health and Human Services, National Institutes of Health.
National Research Council. (1998). Preventing reading difficulties in young children.
Washington, D.C.: National Academy Press.
Ness, M. (2009). Reading comprehension strategies in secondary content area
classrooms: Teacher us of and attitudes towards reading comprehension
instruction. Reading Horizons, 49(2), 143-166.
Neumann, D., Ross, A., & Slobach, A. (2008). Increasing reading comprehension of
elementary students through fluency-based interventions (Unpublished doctoral
dissertation). Saint Xavier University, Cincinnati, OH.
No Child Left Behind (2001). No Child Left Behind Act of 2001. Washington, DC: U.S.
Department of Education.
Northwest Evaluation Association. (2005a). Technical manual for use with measures of
academic progress and achievement level tests. Lake Oswego, OR: Northwest
Evaluation Association.
Northwest Evaluation Association. (2005b). RIT scale norms for use with measures of
academic progress and achievement level tests. Lake Oswego, OR: Northwest
Evaluation Association.
Northwest Evaluation Association (2008). RIT normative data. Retrieved from

167
http://www.nwea.org/sites/www.nwea.org/files/support_articles/Normative%20D
ata%20Sheet_v2.pdfnsion.
Numminen, H. (2002). Working memory in adults with intellectual disability. Famr,
Research Publications 85/2002. Helsinki: Kehitysvammaliitto.
O'Connor, R., White, A., & Swanson, H. (2007). Repeated reading versus continuous
reading. Exceptional Children, 74, 31-46.
Orr, J., Sackett, P., & DuBois, C. (1991). Outlier detection and treatment in I/O
Psychology: A survey of researcher beliefs and an empirical illustration.
Personnel Psychology, 44, 473-486.
Osborne, J., Christiansen, W., & Gunter, J. (2001). Educational psychology from a
statistician's perspective: A review of the quantitative quality of our field. Paper
presented at the Annual Meeting of the American Educational Research
Association, Seattle, WA.
Paige, D. (2011). Testing the acceleration hypothesis: Fluency outcomes utilizing still-
versus-accelerated texts in sixth grade students with reading disabilities. Literacy
Research and Instruction, 50(1), 294-312.
Paloyelis, Y., Rijsdijk, F., Wood, A., Asherson, P.,& Kuntsi, J. (2010). The genetic
association between ADHD symptoms and reading difficulties: The role of
inattentiveness and IQ. Journal of Abnormal Child Psychology, 38, 1083-1095.
Pearl, J. (2009). Causal inference in statistics: An overview. Statistics Survey, 3, 96-146.
Petscher, Y. & Kim, Y. (2011). The utility and accuracy of oral reading fluency score
types in predicting reading comprehension. Journal of School Psychology, 49(1),
107-129.

168
Phillips, M. (2005). Creating a culture of literacy: A guide for middle and high school
principals. Executive Summary by the National Association of Secondary School
Principals. Reston, VA. Retrieved from www.principals.org
Piaget, J. (1969). Science of Education and the Psychology of the Child. Essex, England:
Harlow: Longman.
Pikulski, J. & Chard, D. (2005). Fluency: Bridge between decoding and reading
comprehension. The Reading Teacher, 58(6), 510-519.
Pinnell, J., Pikulski, K., Wixson, J., Campbell, P., Gough, A., & Beatty, A. (1995).
Listening to children read aloud: Oral fluency. Washington, DC: U.S.
Department of Education, National Center for Education Statistics.
Pitcher, M., Martinez, G., Dicembre, E., Fewster, D., & McCormick, M. (2010). The
literacy needs of adolescents in their own words. Journal of Adolescent and Adult
Literacy, 53(8), 636-645.
Prensky, M. (2001). Digital natives, digital immigrants. NCB University Press, 9(5), 1-6.
Rasinski, T. (1985). A study of factors involved in reader-text interactions that
contribute to fluency in reading (Unpublished doctoral dissertation). Ohio State
University, Columbus, OH.
Rasinski, T. (2003a). Assessing reading fluency (ES0414). Honolulu, HI: Pacific
Resources for Education and Learning.
Rasinski, T. (2003b). The fluent reader. New York: Scholastic.
Rasinski, T., Padak, N., McKeon, C., Wilfong, L., Friedauer, J., & Heim, P. (2005). Is
reading fluency a key for successful high school reading? Journal of Adolescent
and Adult Literacy, 48(1), 22-27.

169
Rasinski, T., Rikli, A., & Johnston, S. (2009). Reading fluency: More than automaticity?
More than a concern for the primary grades? Literacy Research and Instruction,
48, 350-361.
Recht, D. & Leslie, L. (1988). Effect of prior knowledge on good and poor readers’
memory of text. Journal of Educational Psychology, 80, 16–20.
Reis, S., & Fogarty, E. (2006). Savoring reading. Educational Leadership, 64(2), 32-36.
Research, Evaluation, and Performance Measurement. State of Maine, Department of
Corrections Policy 1.24 (October 10, 2008).
Reutzel, D. & Hollingsworth, P. (1993). Effects of fluency training on second graders’
reading comprehension. Journal of Educational Research, 86(6), 325-331.
Ricketts, J., Nation, K., & Bishop, D. (2007). Vocabulary is important for some, but not
all reading skills. Scientific Studies of Reading, 11(3), 235-257.
Rodgers, J. & Nicewander, W. (1988). Thirteen ways to look at the correlation
coefficient. The American Statistician, 42, 59-66.
Rogevich, M. & Perin, D. (2008). Effects on science summarization of a reading
comprehension intervention for adolescents with behavior and attention disorders.
Exceptional Children, 74(2), 135-154.
Rupley, W., Willson, V., & Nichols, W. (1998). Exploration of the developmental
components contributing to elementary school children’s reading comprehension.
Scientific Studies of Reading, 2(2), 143-158.
Salkind, N. & Green, S. (2011). Using SPSS for Windows and Macintosh: Analyzing and
Understanding Data. Retrieved from Amazon.com.
Samuels, J. (1997). The method of repeated readings. The Reading Teacher, 50(5), 376–

170
381.
Samuels, J. (2007). The DIBELS test: Is speed of barking at print what we mean by
reading fluency? Reading Research Quarterly, 42(4) 563-566.
Samuels, J., Miller, N., & Eisenberg, P. (1979). Practice effects on the unit of word
recognition. Journal of Educational Psychology, 71(4), 514-520.
Samuelsson, S. & Lundberg, I. (1996). The impact of environmental factors on
components of reading and dyslexia. Annals of Dyslexia, 46, 201-217.
Saripinar, E. & Erden, G. (2010). Usability of tests measuring academic skills and
sensory-motor functions in reading disability. Turkish Journal of Psychology
25(65), 67-68.
Scammacca, N., Roberts, G., Vaughn, S., Edmonds, M., Wexler, J., & Reutebuch, C.
(2007). Reading interventions for adolescent struggling readers: A meta-analysis
with implications for practice. Portsmouth, NH: RMC Research Corporation,
Center on Instruction.
Schachter, R. (2008). Remedial nation. Retrieved from universitybusiness.com
Schifini, A. (2002). Reading Instruction for Older Struggling Readers. Honolulu, HI:
Pacific Resources for Education and Learning.
Schreiber, P. (1987). Prosody and structure in children’s syntactic processing. In R.
Horowitz & S. J. Samuels (Eds.), Comprehending oral and written language (pp.
243-270). New York: Academic Press.
Schreiber, P. (1991). Understanding prosody’s role in reading acquisition. Theory into
Practice, 30, 158–164.
Schwanenflugel, P., Meisinger, E., & Wisenbaker, J. (2006). Becoming a fluent and

171
automatic reader in the early elementary school years. Reading Research
Quarterly, 41(4), 496-522.
Schwartz, K. (2007). Adolescent brain development: An oxymoron no longer. Institute
of Marriage and Family Canada Review, Fall, 85-93.
Senechal, M. (2006). Testing the home literacy model: Parent involvement in
Kindergarten is differentially related to grade 4 reading comprehension, fluency,
spelling, and reading for pleasure. Scientific Studies of Reading, 10(1), 59-87.
Senechal, M. & Lefevre, J. (2002). Parental involvement in the development of
children’s reading skill: A five-year longitudinal study. Child Development,
73(2), 445-460.
Shanahan, T. (2003). Research-based reading instruction: Myths about the National
Reading Panel report. Reading Teacher, 56(7), 621-632.
Shaywitz, B. (2006). The role of functional magnetic resonance imaging in
understanding reading and dyslexia. Developmental Neuropsychology, 30(1),
613-632.
Shaywitz, S. (2003). Overcoming dyslexia: A new and complete science-based program
for reading problems at any level. New York: Alfred A. Knopf.
Sibley, D., Biwer, D., & Hesch, A. (2001). Establishing curriculum-based measurement
oral reading fluency performance standards to predict success on local and state
tests of reading achievement-unpublished data. Arlington Heights, IL: AHSD 25.
Siegel, L. (1989). IQ is irrelevant to the definition of learning disabilities. Journal of
Learning Disabilities, 22,469-478.
Slavin, R. & Madden, N. (1989). What works for students at risk: A research synthesis.
172
Educational Leadership, March, 4-13.
Smith, N. (1965). American reading instruction. Newark, DE: International Reading
Association.
Stage, S., Abbott, R., Jenkins, J., & Berninger, V. (2003). Predicting response to early
reading intervention from verbal IQ, reading-related language abilities, attention
ratings, and verbal IQ word-reading discrepancy: Failure to validate discrepancy
method. Journal of Learning Disabilities, 36(1), 24-33.
Sticht, T. & McDonald, B. (1990). Teach the mother and reach the child: Literacy
across generations. Literacy Lessons. Geneva: International Bureau of
Education.
Stanovich, K. (1986). Matthew effects in reading: Some consequences of individual
differences in the acquisition of literacy. Reading Research Quarterly, 21, 360-
407.
Stothard, S., Snowling, M., Bishop, D., Chipchase, B., & Kaplan, C. (1998). Language-
impaired preschoolers: A follow-up into adolescence. Journal of Speech,
Language, and Hearing Research, 41, 407–418.
Strommen, L. & Mates, B. (2004). Learning to love reading: Interviews with older
children and teens. Journal of Adolescent and Adult Literacy, 48(4), 1-19.
Summary of findings from the 2009 national household survey on drug abuse. (2010).
DHHS Publication No. (SMA) 10-4586. Rockville, MD: Office of Applied
Studies, Substance Abuse and Mental Health Services Administration.
Sung, J., McNeil, M., Pratt, S., Dickey, M., Hula, W., Szuminsky, N., & Doyle, L.

173
(2009). Verbal working memory and its relationship to sentence-level reading
and listening comprehension in persons with aphasia. Aphasiology, 23(7-8),
1040-1052.
Swanson, H. & O’Connor, R. (2009). The role of working memory and fluency practice
on the reading comprehension of students who are dysfluent readers. Journal of
Learning Disabilities, 42(6), 548-575.
Swick, K. (2009). Promoting school and life success through early childhood family
literacy. Early Childhood Education Journal, 36(5), 403-406.
Tabachnick, B. & Fidell, L. (2001). Using Mulitvariate Statistics. Needham Heights,
MA: Allyn & Bacon.
Tabachnik, B. & Fidell, L. (2007). Using multivariate statistics. Boston: Allyn &
Bacon.
Teale, W. (1986). Home background and young children’s literacy development. In
Teale, W. & Sulzby, E., Eds. Emergent Literacy: Reading and Writing.
Norwood, New Jersey: Ablex Publishing Corporation.
Thomas, C. & Wexler, J. (2007). Ten ways to teach and support struggling adolescent
readers. Kappa Delta Pi Record, Fall, 22-27.
Tiu, R., Thompson, L., & Lewis, B. (2003). T he role of IQ in a component model of
reading. Journal of Learning Disabilities, 36(5), 424-436.
Torgesen, J. (1975). Problems and prospects in the study of learning disabilities. In M.
Hetherington & J. Hagen (Eds.), Review of Research in Child Development, 5, 1-
54. Chicago: University of Chicago Press.
United States Census Bureau (2010). State and country quick facts. Retrieved from

174
http://quickfacts.census.gov/qfd/states/23/23019.html.
United States Department of Education (2004). Individuals with disabilities education
improvement act, 20 United States Congress §1400 et seq.
United States Department of Education (2011). Improving basic programs operated by
local educational agencies. Retrieved from
http://www2.ed.gov/programs/titleiparta/awards.html.
Valencia, S., Smith, A., Reese, A., Li, M., Wixson, K., & Newman, H. (2011). Oral
reading fluency assessment: Issues of construct, criterion, and consequential
validity. Reading Research Quarterly, 45(3), 270-291.
van den Broek, P., Rapp, D., & Kendeou, P. (2005). Integrating memory-based and
constructionist processes in accounts of reading comprehension. Discourse
Processes, 39(2/3), 299-316.
Vaughn, S., Wanzek, J., Murray, C., Scammaca, N., Linan-Thomson, S., & Woodruff, A.
(2009). Response to reading intervention: High and low responders. Council for
Exceptional Children, 75(2), 165-183.
Vellutino, F. (2001). Further analysis of the relationship between reading achievement
and intelligence: A response to Naglieri. Journal of Learning Disabilities, 34,
306–310.
Viner, R. & Christie, D. (2005). Fatigue and somatic symptoms. BMJ, 330(74980),
1012-1015.
Vygotsky, L. (1962). Thought and Language. Cambridge, MA: M.I.T. Press.
Walker, H., & Sprague, J. (1999). The path to school failure, delinquency and violence:

175
Causal factors and some potential solutions. Intervention in School and Clinic.
35(2), 67-73.
Warnke, A. (1999). Reading and spelling disorders: Clinical features and causes.
European Child and Adolescent Psychiatry, 8, Supp. 3, III/2-III/12.
Wesson, K. (2003). Early brain development and learning. Retrieved from
http://www.sciencemaster.com/columns/wesson/wesson_early_01.php.
Wexler, J., Vaughn, S., Edmonds, M., & Reutebuch, C. (2007). Springer Science and
Business Media Publication.
Whalley, K. & Hansen, J. (2006). The role of prosodic sensitivity in children’s reading.
Journal of Research in Reading, 29, 288–303.
Whithear, J. (2011). A review of fluency research and practices for struggling readers in
secondary schools. Literacy learning: The middle years, 19(1), 18-28.
Willcut, E. & Pennington, B. (2000). Psychiatric comorbidity in children and adolescents
with reading disability. Journal of Psychology and Psychiatry, 41(8), 1039-1048.
Willcut, E., Betjemann, R., Pennington, B., Olson, K., DeFries, J., & Wadsworth, S.
(2007). Longitudinal study of reading disability and attention deficit
hyperactivity disorder: Implications for education. Mind, Brain, and Education,
1(4), 181-192.
Williams, B. (2008). Tomorrow will not be like today: Literacy and identity in a world
of multiliteracies. Journal of Adolescent and Adult Literacy, 51(8), 682-686.
Wilson, B. (2004). Wilson assessment of decoding and encoding. Oxford, MA: Wilson
Language Training.
Wilson, S. (2006). Adolescents talk about reading: Exploring resistance to and

176
engagement with text. New England Reading Association Journal, 42(1), 52-53.
Wise, B. (2009). Adolescent literacy: The cornerstone of student success. Journal of
Adolescent and Adult Literacy, 52(5), 369-375.
Wolf, M., Bowers, P., & Biddle, K. (2000). Naming-speed processes, timing, and
reading: A conceptual review. Journal of Learning Disabilities, 33(4), 387-407.
Wolf, M. & Katzir-Cohen, T. (2001). Reading fluency and its intervention. Scientific
Studies of Reading, 5(3), 211-239.
Wooley, G. (2010). Developing reading comprehension: Combining visual and verbal
cognitive processes. Australian Journal of Language and Literacy, 33(2), 108-
125.
Wu, H. & Hu, P. (2007). Major factors influencing reading comprehension: A factor
analysis approach. Sino-US English Teaching, 4(9), p. 14-19.
Yakolev, P. & Lecours, I. (1967). The myelogenetic cycles of regional maturation of the
brain. In A. Minkowski (Ed.), Regional development of the brain in early life (pp.
3-70). Oxford, UK: Blackwell.
Yildrim, K., Yildiz, M., Ates, S., & Cetinkaya, C. (2009). Effect of prosodic reading on
listening comprehension. World Applied Sciences Journal, 7(6), 744-747.
Yovanoff P., Duesbery L., Alonzo J., & Tindal G. (2005). Grade-level invariance of a
theoretical causal structure predicting reading comprehension with vocabulary
and oral reading fluency. Educational Measurement: Issues and Practice, 24(3),
4–12.
Zang, L. (2008). The role of vocabulary in reading comprehension. RELC Journal,
39(1), 51-76.

177
Zhang, J. (2004). Memory process and the function of sleep. Journal of Theoretics, 6(6),
1-7.
ZhaoHong, H. & Cheng-ling, A. (2010). Repeated-reading-based instructional strategy
and vocabulary acquisition: A case study of a heritage speaker of Chinese.
Reading in a Foreign Language, 22(2), 242-262.
Zimmerman, D. (1994). A note on the influence of outliers on parametric and
nonparametric tests. Journal of General Psychology, 121(4), 391-401.
Zutell, J. (1988). Developing a procedure for developing oral reading fluency: Validity
and reliability. Paper presented at the 33rd convention of the International Reading
Association, Toronto.
Zutell, J. & Rasinski, T. (1991). Training teachers to attend to their students’ oral reading
fluency. Theory Into Practice, 30, 211-217.
Zweirs, J. (2004). Building Reading Comprehension Habits in Grades 6-12. In J.
Mallow, B. Marinak, & L. Gambrell (Eds.), Essential Readings on Motivation.
Newark, DE: International Reading Association Publication.

178
Appendix A
Multidimensional Fluency Scale
Dimension 1 2 3 4
A. Expression
and Volume
Reads with little
expression or enthusiasm
in voice. Reads words as
if simply to get them out.
Little sense of trying to
make text sound like
natural language. Tends
to read in a quiet voice.
Some expression. Begins
to use voice to make text
sound like natural
language in some areas of
the text, but not others.
Focus remains largely on
saying the words. Still
reads in a quiet voice.
Sounds like natural language
throughout the better part of
the passage. Occasionally slips
into expressionless reading.
Voice volume is generally
appropriate throughout the
text.
Reads with good expression
and enthusiasm throughout
the text. Sounds like natural
language. The reader is able
to vary expression and
volume to match his/her
interpretation of the passage.
B. Phrasing Monotonic with little
sense of phrase
boundaries, frequent
word-by-word reading.
Frequent two- and three-
word phrases giving the
impression of choppy
reading; improper stress
and intonation that fail to
mark ends of sentences
and clauses.
Mixture of run-ons, mid-
sentence pauses for breath,
and possibly some
choppiness; reasonable
stress/intonation.
Generally well phrased,
mostly in clause and
sentence units, with
adequate attention to
expression.
C.
Smoothness
Frequent extended
pauses, hesitations, false
starts, sound-outs,
repetitions, and/or
multiple attempts.
Several “rough spots” in
text where extended
pauses, hesitations, etc.,
are more frequent and
disruptive.
Occasional breaks in
smoothness caused by
difficulties with specific words
and/or structures.
Generally smooth reading
with some breaks, but word
and structure difficulties are
resolved quickly, usually
through self-correction.
D. Pace
(during
sections of
minimal
disruption)
Slow and
laborious.
Moderately
slow.
Uneven mixture of
fast and slow reading.
Consistently
conversational.
Zutell, J., & Rasinski, T. (1991). Training teachers to attend to their students’ oral reading fluency. Theory Into Practice, 30, 211-217.

179
Appendix B
Explanation of Flesch-Kincaid Readability and Reading Ease Formulas
and Readability Scores and Reading Ease Scores for Each QRI-4
Passage Used in the Study
The Flesch-Kincaid indicates how difficult documents will be to comprehend by
calculating a document’s Flesch-Kincaid Grade Level and Flesch Reading Ease Score.
Like all readability indices, the Flesch-Kincaid Grade Level and the Flesch Reading Ease
score only provide estimations and are only meant to be used as such.
The Flesch-Kincaid Grade Level is an index that gives the years of education required to
comprehend a document. For example, a document with a Flesch-Kincaid Grade Level
score of 10 would require that a reader have about 10 years (or a 10th grade level) of
education to comprehend the document. It can be calculated using the following
equation:
(0.39 × Average Sentence Length) + (11.8 × Average Syllables per Word) - 15.59
The Flesch Reading Ease Score indicates on a scale of 0 to 100 the difficulty of
comprehending a document. A score of 100 indicates an extremely simple document,
while a score of 0 would describe a very complex document. A Flesch Reading Ease
Score in the range of 40–50 would correspond to a relatively complex document that
might score a 12 as its Flesch-Kincaid Grade Level. The Flesch Reading Ease Score can
be calculated by using the following equation:
206.835 - (1.015 × Average Sentence Length) - 84.6 × Average Syllables per Word

180
Readability Scores and Reading Ease Scores for Each QRI-4
Passage Used in the Study
Passage Name QRI-4 Level Readability Reading Ease
Lost and Found Pre-Primer 1.12 94.97
Spring and Fall Pre-Primer 0.69 111.07
Who Do I See? Pre-Primer 1.41 113.82
Just Like Mom Pre-Primer 1.98 116.41
People at Work Pre-Primer 0.40 107.20
A Trip Primer 2.01 92.00
Fox and Mouse Primer 0.94 99.84
The Pig Who Learner to Read Primer 1.84 94.93
Who Lives Near Lakes Primer 2.66 86.66
Living and Not Living Primer 2.07 89.56
Mouse in a House Grade 1 1.55 98.65
Marva Finds a Friend Grade 1 2.64 92.77
The Bear and the Rabbit Grade 1 2.04 95.15
Air Grade 1 0.46 107.93
The Brain and the Five Senses Grade 1 0.99 101.26
The Lucky Cricket Grade 2 2.95 91.46
Father’s New Game Grade 2 3.69 84.69
Whales and Fish Grade 2 3.36 88.95
Seasons Grade 2 3.47 84.4
Trip to the Zoo Grade 3 4.27 84.59

181
A Special Birthday for Rosa Grade 3 6.46 72.07
The Friend Grade 3 4.74 81.87
Cats, Lions, and Tigers Grade 3 4.28 85.15
in Your House
Where Do People Live? Grade 3 3.20 87.91
Wool: From Sheep to You Grade 3 4.27 83.61
Johnny Appleseed Grade 4 4.64 79.68
Amelia Earhart Grade 4 5.01 74.41
Tomie dePaola Grade 4 7.27 69.39
Early Railroads Grade 4 4.85 82.36
The Busy Beaver Grade 4 3.16 90.68
Plant Structures for Survival Grade 4 6.20 74.33
Martin Luther King, Jr. Grade 5 5.25 76.94
Margaret Mead Grade 5 6.81 66.22
Patricia McKissack Grade 5 8.98 57.89
Farming on the Great Plains Grade 5 5.58 76.43
The Octopus Grade 5 5.08 75.12
How Does Your Body Take
Oxygen? Grade 5 6.24 72.95
Pele Grade 6 5.67 74.11
Life of Lois Lowry Grade 6 7.20 72.03
The Lifeline of the Nile Grade 6 7.48 63.63
Building Pyramids Grade 6 8.35 56.23

182
Temperature and Humidity Grade 6 8.41 62.59
Clouds and Precipitation Grade 6 6.15 76.43
Biddy Mason M.S. 3.61 85.33
Malcolm X M.S. 8.67 61.71
Immigration Part I M.S. 10.59 41.12
Immigration Part II M.S. 8.30 59.37
Life Cycle of Starts Part I M.S. 6.50 68.19
Life Cycle of Stars Part II M.S. 6.12 72.14
Where the Ashes Are Part I H.S. 5.66 76.72
Where the Ashes Are Part II H.S. 6.31 74.03
Where the Ashes Are Part III H.S. 7.13 68.00
World War I Part I H.S. 12.36 42.22
World War I Part II H.S. 8.67 60.36
World War I Part III H.S. 9.27 57.19
Characteristic of Viruses H.S. 9.74 49.18
Part I
Characteristics of Viruses H.S. 9.53 48.33
Part II
Characteristics of Viruses H.S. 11.54 32.49

183
Appendix C
Explanation of RIT Scores
The Rausch Unit Scale
The RIT Scale is a curriculum scale that uses individual item difficulty values to
estimate student achievement. An advantage of the RIT scale is that it can relate the
numbers on the scale directly to the difficulty of items on the tests. In addition, the RIT
scale is an equal interval scale. Equal interval means that the difference between scores is
the same regardless of whether a student is at the top, bottom, or middle of the RIT scale,
and it has the same meaning regardless of grade level.
RIT scales, like scales underlying most educational tests, are built from data about
the performance of individual examinees on individual items. The theory governing scale
construction is called Item Response Theory (IRT). NWEA uses a specific IRT model
conceived by Danish mathematician, Georg Rausch, (1901-1980). Rausch is best known
for his contributions to psychometrics, and his model is used extensively in assessment in
education, particularly for skill attainment and cognitive assessments (Northwest
Evaluation Association, 2005b).
Characteristics of the RIT Scale include:
• It is an achievement scale.
• It is an accurate scale.
• It is an equal interval scale.
• It helps to measure growth over time.
• It has the same meaning regardless of grade or age of the student.

184
Scale Variance by Subject
Why do RIT scales vary from subject to subject (e.g. the mathematics RIT scale
goes higher than other subject areas)? A ceiling effect exists when an assessment does not
have sufficient range to accurately measure students at the highest performance levels. It
has nothing to do with the actual numbers attached to the scale and everything to do with
the position of students on it. For example, in reading, the RIT scale measures with
relative accuracy up to about 245. This represents the 93rd percentile at grade 10, and the
95th percentile at grade 8. If a student scores above we know that student performed high
but may not be able to accurately assess how high they performed. Relative to other tests,
therefore, there is very little true ceiling effect in this assessment. Even most high
performing 10th graders receive a technically accurate measure of their skill.

185
Appendix D
Department of Corrections Policy 1.24
I. AUTHORITY
The Commissioner of Corrections adopts this policy pursuant to the authority
contained in 34-A M.R.S.A. Sections 1216 and1403.
II. APPLICABILITY
Entire Maine Department of Corrections
III. POLICY
It is the policy of the Maine Department of Corrections to support, promote and
participate in research, evaluation, and performance measurement functions
relevant to correctional programs, services and operations, in order to accomplish
the overall goals and mission of the Department. The Department shall
continually seek to improve its effectiveness and efficiency by emphasizing the
use of research, evaluation and performance measurement. All research must be
approved by the Commissioner or the Deputy Commissioner for Legislative and
Program Services.
IV. CONTENTS
Procedure A: Client Participation in Research
Procedure B: Application for Permission to Conduct Research
Procedure C: Requirements for Approval
Procedure D: Conduct of Research
Procedure E: Dissemination of Finding

186
V. ATTACHMENTS
ATTACHMENT A: RESEARCH AGREEMENT
Attachment B1: Research Consent Form (Client)
Attachment B2: Research Consent Form (Staff)
VI. PROCEDURES
PROCEDURE A: CLIENT PARTICIPATION IN RESEARCH
1. Clients are prohibited from participating in testing for medical, mental
health, pharmaceutical or cosmetic experimental or research projects.
2. Client participation in research, other than that prohibited above, shall be
permitted only with the voluntary consent of the client.
PROCEDURE B: APPLICATION FOR PERMISSION TO CONDUCT
RESEARCH
1. Any person wishing to conduct research shall submit an application to the
Department’s Deputy Commissioner for Legislative and Program Services.
2. The application shall include the following information:
a. Title of project;
b. Names, addresses and telephone numbers of principal researcher and all
research assistants and other information necessary for the completion
of background checks.
c. Documentation that the applicant is a member of a recognized
organization, such as a university, college, private foundation or
consulting firm, or a public agency and has the permission of that
organization or agency to perform the proposed research.

187
d. A summary of the goals of the project and the justification for the
research; and
e. A detailed research design including the following elements:
i. Departmental resources, including staff, that may be needed for the
project and the extent of the need;
ii. Criteria and procedures for selection of subjects or records for the
research;
iii. Type of data to be collected:
iv. Procedures for data collection and copies of research instruments
to be used, including interview schedules, questionnaires, data
collection forms, and tests;
v. Procedures to protect the privacy of participants and the
confidentiality of protected information, including copies of
proposed consent forms; and
vi. A written summary explaining to potential subjects the goals and
methods of the project.
3. If the project is to be conducted at a Departmental facility or in a
community corrections region, upon request of the Commissioner or the
Deputy Commissioner for Legislative and Program Services, the facility
Chief Administrative Officer or Regional Correctional Administrator shall
review the project proposal and shall recommend whether or not the
project should be approved.
188
4. The Deputy Commissioner for Legislative and Program Services shall
ensure that all researchers receive a copy of this policy and agree to
comply with it. The Research Agreement (Attachment A) shall be signed
by the principal researcher and all research assistants. The Commissioner
or the Deputy Commissioner shall indicate approval of the research
project by signing the Research Agreement and returning a copy to the
principal researcher, with a copy to the Chief Administrative Officer or
Regional Correctional Administrator, if applicable.
5. No research project shall be conducted without the prior written approval
of the Commissioner or Deputy Commissioner for Legislative and
Program Services.
PROCEDURE C: REQUIREMENTS FOR APPROVAL
1. An approval of a request to conduct a research project shall not be given
unless the following requirements are met:
a. The research is requested by and is to be conducted by professional
researchers, university or college faculty, graduate students as part of a
degree program, or qualified public agency staff.
b. The principal researcher and all research assistants pass any
background checks.
c. An acceptable application for the proposed project is submitted.
d. The proposed project is likely to promote the overall goals and mission
of the Department.

189
e. The project will not significantly disrupt Department routine or
interfere with staff carrying out their duties.
f. Participation of staff and clients is to be done strictly on a voluntary
basis.
g. Subjects participating in the project will not be identified by name or
number or in any other way which might lead to the subject’s
identification.
h. The principal researcher agrees to submit a draft of the research report
to the Commissioner or Deputy Commissioner for Legislative and
Program Services for review prior to completion and publication and to
make revisions as requested. This review shall be concerned only with
factual errors, misinterpretations of Departmental policies, procedures,
or practices, and violations of confidentiality, and not with the findings
or conclusions reached by the researcher.
2. It is within the complete discretion of the Commissioner or the Deputy
Commissioner for Legislative and Program Services to determine whether
to approve a research project that fulfills the above requirements.
3. Approval to conduct research may be withdrawn at any time, whether
prior to or during the project, at the complete discretion of the
Commissioner or the Deputy Commissioner for Legislative and Program
Services.
PROCEDURE D: CONDUCT OF RESEARCH

190
1. The principal researcher or research assistants shall explain the goals and
methods of the project to all potential subjects. A written summary shall
be provided to each potential subject. All staff and clients shall be
informed that their participation in the research is purely voluntary. All
clients shall be informed that regardless of whether they agree to
participate or not, there will be no effect on the length, terms or conditions
of their custody or supervision.
2. The principal researcher or research assistants shall obtain a signed consent
form (Attachment B) from staff and clients who agree to participate in the
research, including the consent of a parent or guardian of a client, as
necessary. If required by the organization or agency sponsoring the
research project, participants may also be asked to sign additional consent
forms.
3. The researcher shall provide foreign language assistance to those non-
English speaking clients who are to be included in the research project.
4. Neither the principal researcher nor any research assistant may remove an
original record or copy of a record or identifying data from the
Department facility or office where the record is kept.
5. Neither the principal researcher nor any research assistant may disclose, in
writing or orally, any information regarding security practices, the custody
or supervision of clients, or any other matter concerning the operations of
the Department or concerning clients or staff knowledge of which has
been obtained, directly or indirectly, by virtue of participating in the

191
research project, except to the extent the information is collected and
reported as described in the project proposal and in the written summary
provided to the subjects prior to participation in the project.
6. Any data collected during the course of the research shall be used only in
the manner described in the project proposal and in the written summary
provided to the subjects prior to participation in the project.
7. No staff of the Department or client shall receive compensation of any kind
for participation in the research project, unless specifically approved, in
writing, by the Commissioner or Deputy Commissioner for Legislative
and Program Services.
8. The principal researcher and research assistants shall abide by all
Department security practices and shall comply with all instructions of
Department staff in the event of an emergency or critical incident.
PROCEDURE E: DISSEMINATION OF FINDINGS
1. The Department reserves the right to disseminate any findings or
conclusions reached as a result of the research within the Department or to
other state agencies or criminal justice agencies.
2. All requests for information received by the Department related to a
research project shall be referred to the Department’s Public Affairs
Coordinator.
VII. PROFESSIONAL STANDARDS
ACA:

192
ACI - 4-4108 The institution or parent agency supports and engages in research
activities relevant to its programs, services, and operations.
ACI - 4-4109 Written policy, procedure, and practice provide that the
warden/superintendent encourages and uses research conducted by outside professionals.
ACI - 4-4110 Operational personnel assist research personnel in carrying out
research and evaluation.
ACI - 4-4111 Written policy and procedure govern the conduct of research in the
institution, including compliance with professional and scientific ethics and with state
and federal guidelines for the use and dissemination of research findings.
ACI – 4-4112 The warden/superintendent reviews and approves all institutional
research projects prior to implementation to ensure they conform with the policies of the
parent agency.
ACI - 4-4113 Written policy and procedure govern voluntary inmate
participation in non-medical, non-pharmaceutical, and noncosmetic research programs.
ACI - 4-4402 (MANDATORY) The use of offenders for medical,
pharmaceutical, or cosmetic experiments is prohibited. This does not preclude offender
participation in clinical trials that are approved by an institutional review board based on
his/her need for a specific medical intervention. Institutions electing to perform research
will be in compliance with all state and federal guidelines.
4-ACRS-7D-12 In facilities that engage in, or allow the conduct of research,
the facility complies with state and federal guidelines for the use and dissemination of
research findings, with accepted professional and scientific ethics, and issues of legal
consent and release of information. Procedures govern the voluntary participation of

193
offenders in nonmedical, nonpharmaceutical, and noncosmetic research programs. The
facility administrator reviews and approves all research projects prior to implementation.
All research results are made available to the facility administrator for review and
comment prior to publication or dissemination.
4-JCF-6F-06 The facility or parent agency supports, engages in, and uses
research activities relevant to its programs, services, and operations.
1. The facility administrator reviews and approves all research prior to
implementation to ensure compliance with professional/scientific ethics,
agency policy, and state and federal guidelines for the use and
dissemination of research findings.
2. Juvenile participation is voluntary in nonmedical, nonpharmaceutical, and
noncosmetic research programs.
3. Access to records is granted for the purpose of research, evaluation, and
statistical analysis in accordance with a formal written agreement that
authorizes access, specifies use of data, and ensures confidentiality.
4. All research results are made available to the facility administrator for
review and comment prior to publication or dissemination.

194
Appendix F
Example of a Completed QRI-4 Assessment
(Leslie & Caldwell, 2006) Assessments