Embed Size (px)
Citation preview
©Pollere, Inc. www.pollere.net
The Controlled Delay (CoDel) AQM Approach to fighting
bufferbloat
BITAG TWGBoulder, CO
February 27, 2013
Kathleen NicholsVan Jacobson

Pollere, INC.network
analysis &
architecture,
performance
©Pollere, Inc. www.pollere.net
Background
• The “persistently full buffer” problem, now called bufferbloat, has been around for 30 years
• The solution, active queue management (AQM), has been known for more than 20 years• Unfortunately, the AQMs invented so far only “kind of” work• It’s much easier to control long-lived TCPs than mixes• A lot of AQMs accept large queue delays• Most have many settings and are complex• Dynamic link bandwidths are common today
• Using average queue length as a congestion indicator is a big part of the problem
2
Pollere, INC.network
analysis &
architecture,
performance
©Pollere, Inc. www.pollere.net 3
Sender Receiver
Time
Que
ue le
ngth
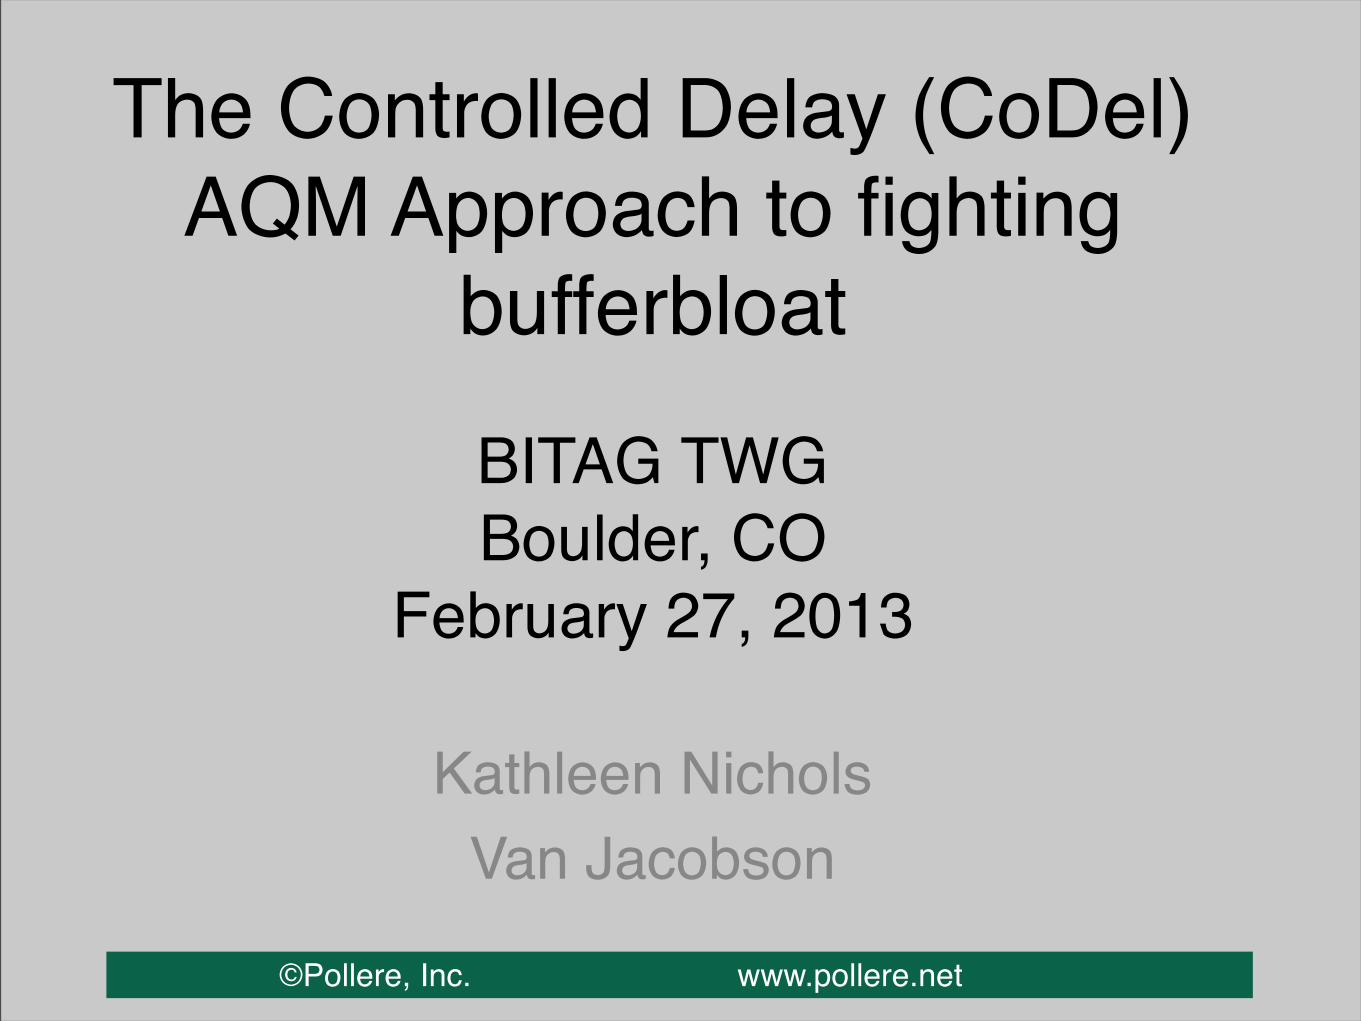
A TCP with a 25 packet window into a connection with an intrinsic pipe size of 20 packets:
After the initial burst of packets, settles into a 5 (+/-1) packet standing queue. The average queue size is the window mismatch to the pipe size, unrelated to the sending rate:
good queue
bad queue

Pollere, INC.network
analysis &
architecture,
performance
©Pollere, Inc. www.pollere.net
Tracking Bad Queue
4
• Good queue goes away in an RTT, bad queue hangs around.
➡ queue length min() during a sliding window interval measures bad queue ...
➡ ... as long as window is at least an RTT wide.
Time
Que
ue le
ngth
Interval
Van made this observation in 2006 (see talk at MIT Lincoln Labs)

Pollere, INC.network
analysis &
architecture,
performance
©Pollere, Inc. www.pollere.net
How low should we go?
• As we reduce that “standing queue” of slide 3, don’t want to risk forcing the link to go idle.
• Need to leave an MTU of backlog (i.e., don’t drop if there’s less than an MTU sitting in the buffer).
• A larger backlog can result in higher utilization, particularly where there are a small number (1 to 3) of bulk transfers, but at a cost of higher delay.
• To identify an appropriate range for the backlog, we turn to analysis to find a bandwidth-independent value for this backlog, which we call the target
5

Pollere, INC.network
analysis &
architecture,
performance
©Pollere, Inc. www.pollere.net 6
0 20 40 60 80 100
7580
8590
9510
0
Utilization vs. Target for a single Reno TCP
Target (% of RTT)
Bottl
enec
k Li
nk U
tiliz
atio
n (%
of m
ax)
Tolerating some standing queue results in a higher utilization but it reaches 90%with a target that is about 30% of the RTT

Pollere, INC.network
analysis &
architecture,
performance
©Pollere, Inc. www.pollere.net 7
This suggests exploring targetsin the range from 1 to 15 ms.
Cubic gets better utilizations.
0 20 40 60 80 100
0.70
0.75
0.80
0.85
0.90
0.95
1.00
Power vs. Target for a Reno TCP
Target (as % of RTT)
Aver
age
Powe
r (Xp
ut/D
elay
)
0 5 10 15 20 25 30
0.93
0.94
0.95
0.96
0.97
0.98
0.99
1.00
Power vs. Target for a Reno TCP
Target (as % of RTT)
Aver
age
Powe
r (Xp
ut/D
elay
)

Pollere, INC.network
analysis &
architecture,
performance
©Pollere, Inc. www.pollere.net
Controlled Delay (CoDel) AQM Goals
• no knobs - parameterless
• separate good queue and bad queue - keep median delays (over time) low while permitting bursts
• insensitive (or nearly so) to RTT, link rates, traffic loads
• adapt to dynamically changing link rates with no negative impact on utilization
• simple and efficient implementation
8

Pollere, INC.network
analysis &
architecture,
performance
©Pollere, Inc. www.pollere.net
CoDel Innovations1. Use the local minimum of queue as the observed statistic
2. The information needed about the local minimum (how long queue has been below/above target) can be kept in a single state variable, no need to keep a sliding window of the actual values
3. Use the packet sojourn time in the queue (the actual packet delay) rather than queue size in bytes or packets as the value observed
Use of minimum means all the work can be done at queue departure time and no locks are needed (the minimum can only change on departure)
9

Pollere, INC.network
analysis &
architecture,
performance
©Pollere, Inc. www.pollere.net
CoDel in a nutshell• CoDel assumes that a standing queue of target is acceptable (as determined by the
local minimum) and that it is unacceptable to drop when there are fewer than an MTU worth of bytes in the buffer
• To ensure that the minimum value is not stale, it has to have been experienced in the most recent interval (sliding window)
• When the sojourn time has exceeded target for at least an interval, a packet is dropped and a control law used to set the next drop time
• The next drop time is decreased in inverse proportion of the square root of the number of drops since the dropping state was entered (to get a linear change in throughput)
• When the sojourn time goes below target the controller stops dropping. • Prevented from re-entering dropping state too soon after exiting it and resumes the
dropping state at a recent control level if one exists
Target and interval are constants: acceptable queue delay and a time on the order of a worst case RTT of connections through the bottleneck. Experimented with target from 1 to 20ms, but 5ms and interval of 100ms works well for range of RTTs from 10ms to 1sec, with excellent performance in 10ms - 300ms range.
10

Pollere, INC.network
analysis &
architecture,
performance
©Pollere, Inc. www.pollere.net
Results
11
• from the original work last year
• all CoDel runs use exactly the same algorithm
• RED runs each use the link bandwidth to set parameters

Pollere, INC.network
analysis &
architecture,
performance
©Pollere, Inc. www.pollere.net
Results: Range of static link rates (high)
Various loads (FTP, web-browsing, CBR), RTTs from 10ms-500ms sorted by link rate
12
0
0.005
0.010
0.015
0.020
3 10 45 100
CoDel Median Pkt Delay (sec) by Bandwidth (Mbps)
0.40.50.60.70.80.91.0
3 10 45 100
CoDel Link Utilization by Link Bandwidth (Mbps)
0
0.005
0.010
0.015
0.020
3 10 45 100
RED Median Pkt Delay (sec) by Bandwidth (Mbps)
0.40.50.60.70.80.91.0
3 10 45 100
REDLink Utilization by Link Bandwidth (Mbps)

Pollere, INC.network
analysis &
architecture,
performance
©Pollere, Inc. www.pollere.net
Results: Range of static link rates (low)
Data for both 500 byte MTU and 1500 byte MTU: the larger MTU increases delays but effect diminishes as bandwidth moved toward 1.5 Mbps. CBRs use 100 byte packets. (The low bandwidths don’t work with RED.)
13
blue: 500B MTUgreen: 1500B MTU
0
0.02
0.04
0.06
0.08
0.10
0.12
0.14
0.16
0.128 0.256 0.512 1.5
Median Packet Delays by Bandwidth
Web-only Traffic
0.4
0.6
0.8
1.0
0.9
1.0
0.128 0.256 0.512 1.5
Link Utilization by Link Bandwidth (in Mbps)

Pollere, INC.network
analysis &
architecture,
performance
©Pollere, Inc. www.pollere.net
Dynamic Link: the fun stuff
• Nominal 100 Mbps link with rate changes, buffer size of 830 packets
• 4 FTPs, 5 packmime connections/sec
• Note the throughput line for undersized buffer of 10 packets: throughput is about 75% less. CoDel same throughput as tail drop but 2.7ms median delay, 5ms 75th percentile
• Experimentally duplicated by Stanford grad students: http://reproducingnetworkresearch.wordpress.com/2012/06/06/solving-bufferbloat-the-codel-way/
14
100 Mbps 10Mbps 1Mbps 50Mbps 1Mbps
100Mbps
CoDel (black)RED (red)Tail drop (blue)
0
2
10
0 50 100 150 200 250 300
Per-Packet Queue Delay for Dynamic Bandwidth
100 Mbps 10Mbps 1Mbps 50Mbps 1Mbps
100Mbps
0
0.5
1.0
0 50 100 150 200 250 300
Detail of Per-Packet Queue Delay vs. Simulation Time (sec)
blue: Tail dropblack: CoDelred: RED
10 pckt buffers
0
5
10
15×105
0 50 100 150 200 250 300
Cumulative Kbytes transferred vs simulation time (sec)

Pollere, INC.network
analysis &
architecture,
performance
©Pollere, Inc. www.pollere.net
Consumer Edge type example• Symmetric links• Load of two-way 64Kbps CBR, infinite FTP download, web browsing at a rate of 2
connections per second, uploads of small FTPs (1MB with 5-15 second idle periods)
• Compared two rates, CoDel and Tail drop• CoDel never drops packets at a higher rate (usually less) than Tail drop • CoDel keeps a much smaller queue and transfers similar amounts of data
15
metric
512 Kbps Links512 Kbps Links512 Kbps Links512 Kbps Links512 Kbps Links512 Kbps Links 1.5 Mbps Links1.5 Mbps Links1.5 Mbps Links1.5 Mbps Links1.5 Mbps Links1.5 Mbps Links
metric downloaddownloaddownload uploaduploadupload downloaddownloaddownload uploaduploaduploadmetric
C T C/T C T C/T C T C/T C T C/T
pkt drop % 8 8 100% 1.5 5.8 25% 3.5 4.7 75% 1.4 2.5 56%
median delay (ms) 18 73 25% 9 37 25% 8 49 17% 0 0 100%
total Mbytes 17 18 95% 12.8 13.9 92% 37 40 92% 22 21 103%
fairness of drops 0.87 0.89 98% 0.93 0.89 104% 0.81 0.96 84% 0.6 0.71 85%

Pollere, INC.network
analysis &
architecture,
performance
©Pollere, Inc. www.pollere.net
Results: Range of RTTs
16
CoDel Median Delays (sec)
CoDel 95th Percentile Delay (sec)
0
0.01
0.02
0
0.02
0.04
0.06
10 30 50 100 150 200 500
CoDel Median Link Utilizations
0.5
0.6
0.7
0.8
0.9
1.0
10 30 50 100 150 200 500
RED Median Link Utilizations
0.5
0.6
0.7
0.8
0.9
1.0
10 30 50 100 150 200 500
RED 95th Percentile Delay (sec)
RED Median Delays (sec)
0
0.01
0.02
0
0.02
0.04
0.06
10 30 50 100 150 200 500

Pollere, INC.network
analysis &
architecture,
performance
©Pollere, Inc. www.pollere.net
Interesting “Fairness” Results
17
0
0.2
0.4
0.6
0.8
1.0
10 30 50 100 150 200 500
RTT in milliseconds
CoDel isn’t really concerned with “fair shares” of the bottleneck bandwidth but we did want to see if the drops were distributed in proportion to the usage of the link. Used the Jain Fairness Index, where 1.0 is best:
(P
i xi)2
n · (P
i x
2i )

Pollere, INC.network
analysis &
architecture,
performance
©Pollere, Inc. www.pollere.net
Issues
18
Pollere, INC.network
analysis &
architecture,
performance
©Pollere, Inc. www.pollere.net
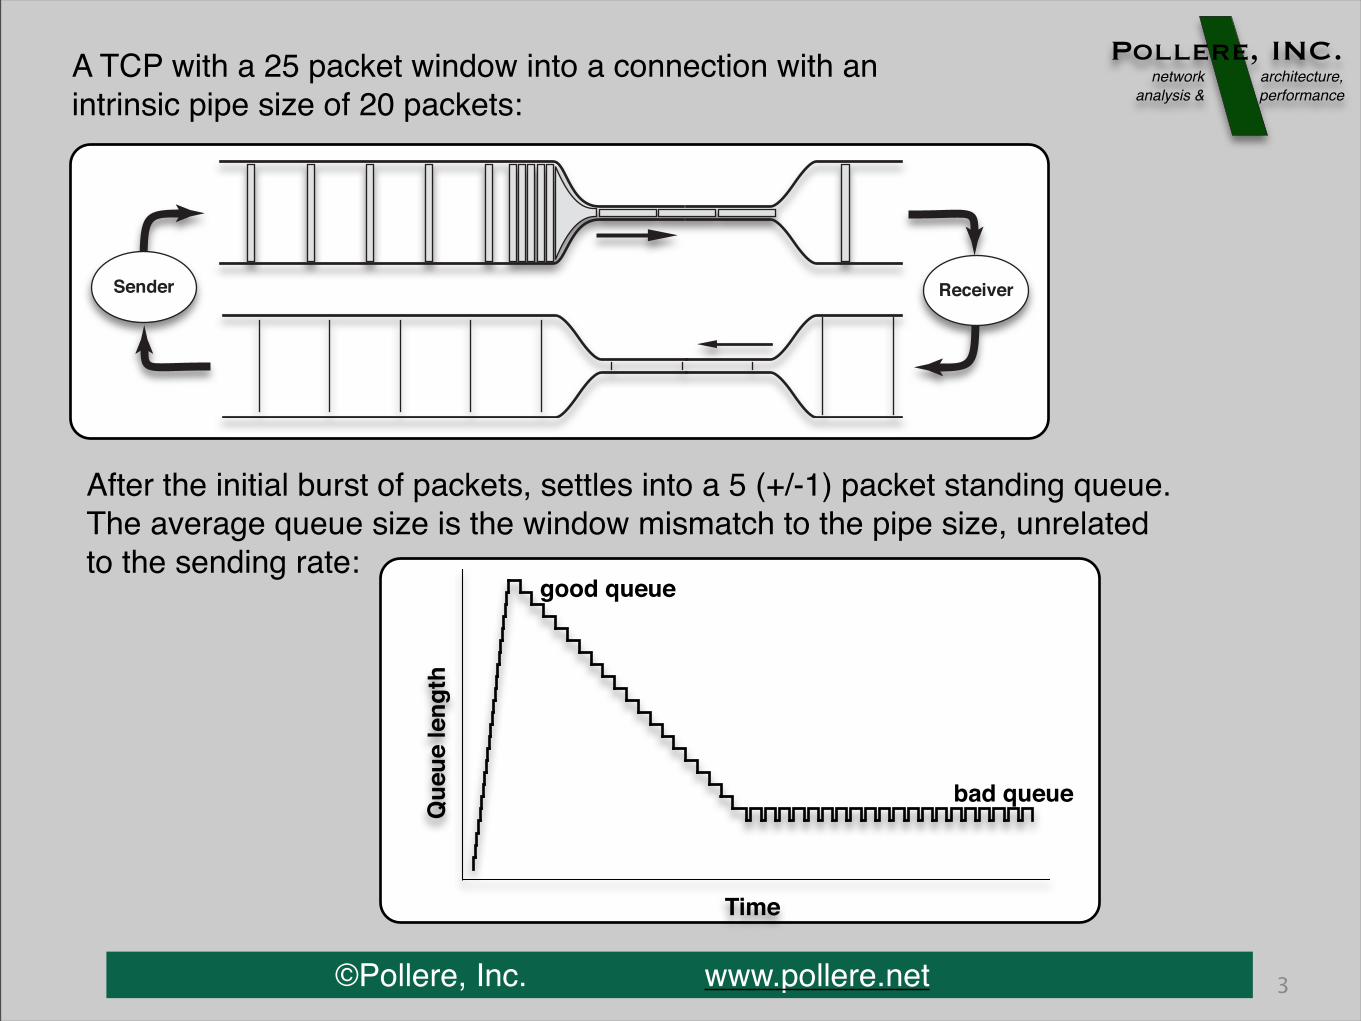
CoDel Can’t Fix Concatenated Queues
Solutions:• rate control• AQM in CM• Flow control
19
CM bufferCable Modem
CPE Router
Ethernet(100 Mbps-1Gbps)
upstream(2Mbps-?)Scheduler
user pkts
Monitor buffer to determinewhen there are sufficient
packets for efficient operationSignal router to stop
sending packetsBuffers are managed to appropriatesize and the most critical packets canbe selected at sending opportunities
CM bufferCable Modem
CPE Router
Ethernet(100 Mbps-1Gbps)
upstream(2Mbps-?)Scheduler
Rate mismatch willcause CM buffer to fill(bufferbloat) and may
cause priority inversion
user pkts
When uplink is heavily utilizedthe router buffers will fill
Flow control
Pollere, INC.network
analysis &
architecture,
performance
©Pollere, Inc. www.pollere.net
Traffic-Related Issues• When “forward” tcp data streams are mixed with “reverse”
acks, this has always created problems.• When long-lived file transfers are mixed with bursty web
request streams or VoIP, the latter suffer• Though running CoDel will help the second problem some
due to keeping shorter delays, the real solution lies beyond using an AQM
• The best solution for VoIP is a prioritized queue• The best solution for creating a better traffic mixing and
solving ack compression problems is to run a stochastic flow queue algorithm across a moderate number of bins and then run CoDel on each bin (Dumzaet)
20

Pollere, INC.network
analysis &
architecture,
performance
©Pollere, Inc. www.pollere.net
Algorithm Issues
• A more sophisticated Control Law that can recognize a steady state (various “hacks” to mitigate problems)
• Although good results across a range of RTTs have come with a fixed minimum-tracking interval of 100-200ms, making the algorithm more robust to RTT is desireable
• An analytic and experimental study of the optimal number of bins for an sfq is needed
21

Pollere, INC.network
analysis &
architecture,
performance
©Pollere, Inc. www.pollere.net
Educational Issues
• The meaning of target and interval• “bursty macs” don’t require larger targets (I wrote a note on
this and posted on web site)• use packet traces to figure out what is really going on• knowledge is power
22

Pollere, INC.network
analysis &
architecture,
performance
©Pollere, Inc. www.pollere.net
Notes, Caveats
• The “second order” parts of CoDel are still being explored.• We want to keep this algorithm available to anyone and
not encumbered by patent stuff: un-encumbered code (BSD/GPL dual-license) available for ns2, ns3, linux
• We have submitted this as in internet draft to the IETF TSV WG and recently updated (draft-nichols-tsv-codel-01)
• We have put our simulator code and other goodies, including links to Van’s talk at www.pollere.net/CoDel.html
• CoDel is in Linux kernels from 3.5 on.• There is a lot of active experimentation in linux which is
tracked by Dave Taht at http://www.bufferbloat.net/projects/codel
23