Embed Size (px)
Citation preview
NeuroImage 59 (2012) 3967–3975
Contents lists available at SciVerse ScienceDirect
NeuroImage
j ourna l homepage: www.e lsev ie r .com/ locate /yn img
The contribution of myelin to magnetic susceptibility-weighted contrasts inhigh-field MRI of the brain☆
Jongho Lee a,b,⁎, Karin Shmueli a, Byeong-Teck Kang c,d, Bing Yao a, Masaki Fukunaga e, Peter van Gelderen a,Sara Palumbo f, Francesca Bosetti f, Afonso C. Silva c, Jeff H. Duyn a
a Advanced MRI Section, Laboratory of Functional and Molecular Imaging, National Institute of Neurological Disorders and Stroke, National Institutes of Health, Bethesda, MD, USAb Department of Radiology, University of Pennsylvania, Philadelphia, PA, USAc Cerebral Microcirculation Unit, Laboratory of Functional and Molecular Imaging, National Institute of Neurological Disorders and Stroke, National Institutes of Health, Bethesda, MD, USAd Department of Veterinary Internal Medicine, College of Veterinary Medicine, Chungbuk National University, Cheongju, Chungbuk, Republic of Koreae Biofunctional Imaging, WPI Immunology Frontier Research Center, Osaka University, Osaka, Japanf Brain Physiology and Metabolism Section, National Institute of Aging, National Institutes of Health, Bethesda, MD, USA
☆ This research was supported (in part) by the IntramNIH, NINDS.⁎ Corresponding author at: 3 W Gates Building, 340
19104, USA. Fax: +1 215 349 5579.E-mail address: [email protected] (J. Lee).
1053-8119/$ – see front matter. Published by Elsevier Idoi:10.1016/j.neuroimage.2011.10.076
a b s t r a c t
a r t i c l e i n f oArticle history:Received 25 July 2011Revised 17 October 2011Accepted 20 October 2011Available online 29 October 2011
Keywords:T2* decayR2* relaxationPhase imageResonance frequency imageDemyelinationCuprizoneFormalin fixation
T2*-weighted gradient-echo MRI images at high field (≥7 T) have shown rich image contrast within and be-tween brain regions. The source for these contrast variations has been primarily attributed to tissue magneticsusceptibility differences. In this study, the contribution of myelin to both T2* and frequency contrasts is in-vestigated using a mouse model of demyelination based on a cuprizone diet. The demyelinated brainsshowed significantly increased T2* in white matter and a substantial reduction in gray-white matter frequen-cy contrast, suggesting that myelin is a primary source for these contrasts. Comparison of in-vivo and in-vitrodata showed that, although tissue T2* values were reduced by formalin fixation, gray-white matter frequencycontrast was relatively unaffected and fixation had a negligible effect on cuprizone-induced changes in T2*and frequency contrasts.
Published by Elsevier Inc.
Introduction
In recent years, T2*-weighted gradient-echo MRI has revealed richcontrast between and within tissue types in both normal anddiseased brains (Budde et al., 2010; Duyn et al., 2007; Hammondet al., 2008; Li et al., 2006; Marques et al., 2009). At high field (7 Tand above), contrast in T2*-weighted MRI is dominated by magneticsusceptibility effects, which can affect both the magnitude and thephase (through resonance frequency changes) of the MRI signal. Mul-tiple sources and mechanisms underlying contrast in T2*-weightedMRI have been suggested and identified, including iron (Fukunagaet al., 2010; Haacke et al., 2005; Ogg et al., 1999; Schweser et al.,2011; Yao et al., 2009), myelin (Li et al., 2009; Liu et al., 2011; Ogget al., 1999; Zhong et al., 2011), deoxyhemoglobin (Haacke et al.,2004; Lee et al., 2010a; Marques et al., 2009; Petridou et al., 2010;Reichenbach et al., 1997; Sedlacik et al., 2008), calcium (Schweseret al., 2010; Wu et al., 2009), macroscopic geometry (Chu et al.,
ural Research Program of the
0 Spruce St, Philadelphia, PA
nc.
1990; Schäfer et al., 2009a; Shmueli et al., 2009), microstructuralorientation (Bender and Klose, 2010; Denk et al., 2011; He andYablonskiy, 2009; Lee et al., 2010b, 2011; Liu, 2010; Schäfer et al.,2009b; Wiggins et al., 2008) and chemical exchange (Luo et al.,2010; Shmueli et al., 2011; Zhong et al., 2008).
The relative contribution of the sources underlying magneticsusceptibility-weighted contrast has been found to vary across brainregions, and in certain regions, a single source may dominate. Forexample, tissue iron has been found to dominate T2* contrast in thebasal ganglia and various intracortical regions (Fukunaga et al.,2010, 2011; Haacke et al., 2005; Hopp et al., 2010; Ogg et al., 1999;Yao et al., 2009), and deoxyhemoglobin is responsible for venouscontrast (Haacke et al., 2004; Reichenbach et al., 1997). Interestingly,the role of myelin is less well established despite its well-recognizedbiological importance. One reason for this is that, unlike iron, themagnetic susceptibility of myelin is not known and is difficult tomeasure.
There are several pieces of evidence supporting a significant roleof myelin in T2* relaxation in the brain. One is the observation of dia-magnetic frequency contrast in white matter relative to gray matterdetected after iron extraction, suggesting that iron-free myelinatedwhite matter is more diamagnetic than iron-free gray matter(Fukunaga et al., 2010). This notion of a negative frequency shift

3968 J. Lee et al. / NeuroImage 59 (2012) 3967–3975
induced by a diamagnetic myelin susceptibility is further affirmed byrecent findings in mouse models of demyelination (Baxan et al., 2010;Liu et al., 2011), and a study of human neonates (Zhong et al., 2011)which both showed reduced gray-white matter frequency contrastwhen myelin is mostly absent. In addition, several studies havefound a dependence of T2* on white matter fiber orientation relativeto B0, consistent with the notion that diamagnetic and anisotropicallystructured myelin would result in microscopic field variations thatare orientation dependent (Bender and Klose, 2010; Denk et al.,2011; Lee et al., 2011; Schäfer et al., 2009b; Wiggins et al., 2008,2011). Importantly, this orientation dependence was found to berather strong, modulating R2* (=1/T2*) by about 60% in in-vivobrain at 7 T (Sati et al., 2011; Wiggins et al., 2011). Finally, variationin myelin density rather than iron content explained T2* variationobserved in a recent study of selected white matter fiber bundles (Liet al., 2009).
Despite these findings, which support an important role for myelinin magnetic susceptibility-weighted contrast, a direct link betweentissue myelin content and T2* relaxation has not been established. Toaddress this, we used a mouse model of cuprizone-induced demyelin-ation (Blakemore, 1973) to investigate the contribution of myelin toT2* both in vivo and in formalin fixed tissue in vitro.
Materials and methods
Cuprizone diet
Cuprizone (bis-cyclohexanone oxalyldihydrazone) is a copper che-lator and is known to induce demyelination in the central nervous sys-tem when it is ingested as a mixture of food (Blakemore, 1973). Acuprizone mouse model has previously been used to demonstratechanges in several MRI properties such as T1, T2, diffusion, magnetiza-tion transfer and phase contrasts (Baxan et al., 2010; Merkler et al.,2005; Song et al., 2005; Sun et al., 2006; Wu et al., 2008; Zaaraoui etal., 2008; Zhang et al., 2011).
MRI scans
All procedures were performed under a NIH-approved animal pro-tocol, in accordance with NIH guidelines. Fourteen 8-week-old maleC57BL/6 mice were used for this study. Cuprizone (Sigma, St. Louise,MO) was mixed into the powdered diet (0.2% of the diet weight)prepared by Research Diet Inc. (New Brunswick, NJ), as previously de-scribed (Palumbo et al., 2011a, 2011b). Mice were fed ad libitum witheither the cuprizone (n=8) or a control diet (n=6) for 6 weeks, andthen underwent MRI scans. Just prior to MRI, the cuprizone-treatedgroup had an average weight of 16.1±2.3 g compared to 28.3±4.3 gfor the control group.
A 7 T animal MRI scanner (30 cm bore diameter, Bruker BioSpin,Ettlingen, Germany) was used to measure T2* and frequency contrast.The systemhas a 15-cmgradient system (Resonance Research, Billerica,MA) which delivers up to 450 mT/m gradients in 130 μs. A custom-designed 1.27 cm diameter surface coil was used for signal receptionand a body coil was used for signal transmission.
For in-vivo scans, animals were initially anesthetized with 5%isoflurane and then switched to 2% isoflurane during MRI scans. Ani-mals were secured in a stereotaxic head-holder using a tooth bar andear bars. The rectal temperature was monitored and maintained at37 °C using a circulating warmwater channel. TheMRI scan was startedwith a localizer, followed by transmitter and receiver gain calibrationsand region-of-interest-based shimming (MAPSHIM, Bruker). After that,high resolution 2D multi-echo gradient-echo (GRE) data were acquiredformagnitude and phase images, whichwere used to calculate T2*mapsand frequency contrast respectively. Four coronal slices were scannedwith in-plane resolution=50×50 μm2, slice thickness=0.75 mm, slicegap=0.25 mm, FOV=5.12×5.12 cm2, TR=1.5 s, TE=6/13/20 ms and
flip angle=70°. The total scan time was 25.6 min. The locations of theslices were approximately at Bregma +1, 0, −1, and −2 mm (Franklinand Paxinos, 2007).
After MRI, each mouse was intracardially perfused with saline fol-lowed by 10% formalin solution. The brains were extracted from theskull and stored in 10% formalin for fixation. After a week of fixation,each brain was placed in the center of a tube (diameter=16 mm, andlength=120 mm) and the tube was filled with phosphate bufferedsaline (PBS). The brains were rescanned at room temperature withthe same parameters as in vivo. The long axis of the tube was alignedalong the B0 field of the magnet.
Histological staining
For one cuprizone-fed mouse and one normal mouse, brains werestained for myelin. First, the brains were cryoprotected using 30% su-crose solution and then cut on a cryostat (LI-COR, Bioscience, Lincoln,NE). Histology was performed on 30-μm-thick coronal sections usinga Gallyas stain (Pistorio et al., 2006) to demonstrate the difference inmyelination between the two samples.
MRI data processing
First, the complex raw data were reconstructed using a two-dimensional fast Fourier transform. The absolute and phase values ofthe resulting complex image data were used to form magnitude andphase images respectively. The phase images were unwrapped using a2D unwrapping method (Jenkinson, 2003) and low-spatial-frequencybackground field variations were removed using a 2D high-passGaussian filter (FWHM=19 voxels) within a hand-drawn mask thatexcluded areas with large off-resonance frequency offsets. Frequencyimages were calculated by dividing each phase image by its echo timeand by 2π and then averaging the frequency images over the threeecho times. T2* maps were estimated by fitting a straight line to thelog of the measured magnitude values against echo time by least-squares error estimation.
After generating all the T2* and frequency images, the images fromdifferent animals were aligned together to generate averaged images.First, in-vivo frequency images of all control and cuprizone-treatedmice were aligned to frequency images of one of the cuprizone-treated mice using a 2D linear registration program (Smith et al.,2004). Then, all the realigned frequency images were averaged togenerate a temporary averaged frequency image. The individual fre-quency images were realigned to this temporary averaged frequencyimage to refine the registration. The registration was further im-proved by manually aligning the frequency images in the superior–inferior direction. After that, these results were averaged to formfinal averaged frequency images. Three averaged images were gener-ated: one ‘total’ average over all mice (both cuprizone-treated andcontrols), one cuprizone group average and a control group average.The total average was used for drawing regions of interest (ROIs) asdescribed below and the cuprizone and control group average imageswere compared to investigate the effects of demyelination. Note thatROIs were drawn on the total averaged images of the cuprizone-treated and control mice because the gray-white matter boundarywas not clear in certain slices of the cuprizone mice.
The alignment parameters from the frequency images were appliedto the T2* images and total, cuprizone, and control group averageimages were created. The same alignment and averaging process wasapplied to the in-vitro dataset. To quantify cuprizone-induced frequencycontrast changes, ROIs were manually drawn in gray matter (cortex)and white matter (corpus callosum) on the total averaged frequencyimages (in vivo and in vitro separately). The same ROIs were also usedfor T2* quantification. Student's t-tests were performed on each pair ofconditions (i.e. cuprizone vs. control, in-vivo vs. in-vitro, and gray vs.white matter). Statistical significance was assessed using a threshold

3969J. Lee et al. / NeuroImage 59 (2012) 3967–3975
of p=0.05. Since each comparison was performed on each pair ofconditions individually, there was no need to adjust the significancethreshold for multiple comparisons.
Fig. 1. Averaged frequency images and T2* maps in control and cuprizone-treated mice in vinificantly reduced gray-white matter contrasts both in frequency and T2*. ROIs are colored in
Because the average body weight between the two groups wasdifferent (16.1±2.3 g for cuprizone and 28.3±4.3 g for control), wetested whether the body weight had any influence on the measured
vo. Compared to the control (B and D), the cuprizone-treated mice (C and E) show sig-yellow for the cortex (gray matter) and green for the corpus callosum (white matter).

3970 J. Lee et al. / NeuroImage 59 (2012) 3967–3975
contrasts. Within each group, the individual animal's body weightwas regressed out from the frequency, T2* gray, T2* white, and T2*gray-white contrasts measured in vivo and in vitro (a total of 8 -measured contrasts in each group). Then a p-value was calculatedfor each contrast. To account for multiple comparisons, we used aBonferroni correction and considered only differences with pb0.05/8=0.0063 to be significant. The brain image area was also measuredto check the difference in brain size between the two groups. The firstecho image from the in-vivo data was used to draw an ROI followingthe boundary of brain and the brain area was calculated as the num-ber of voxels in this ROI.
Results
Among the 14 mice, one cuprizone-treated mouse showed en-larged ventricles and was excluded from further processing to avoidmisalignment. As a result, 7 cuprizone-treated mice and 6 controlmice were aligned to generate the results shown here.
The MRI results from in-vivo mouse brains are shown in Fig. 1. Thetotal average frequency images over all mice and the ROIs for graymatter (cortex) and white matter (corpus callosum) are shown inFig. 1A. When the control group average frequency images (Fig. 1B)are compared to the cuprizone group average frequency images(Fig. 1C), a significant reduction in gray-white matter contrast isobserved in the cuprizone-treatedmice. Themeasured gray-whitemat-ter frequency contrast was 3.58±0.91 Hz (all values will be presentedas mean±standard deviation throughout this paper) and 1.45±0.43 Hz in the control and cuprizone-treated mice respectively. Thisdifference was statistically significant (p=6.5×10⁻⁴). Images ac-quired in vivo suffered severely from artifacts that were most likely tooriginate from poor shims, physical motion, and B0 fluctuation (Nolland Schneider, 1994) as these artifacts are not present in the fixedtissues (Fig. 2). It should be noted that, because the background fieldvariation was removed from the frequency images during processing,only the relative contrast (e.g. between gray andwhitematter) ismean-ingful in the frequency images. This is unlike T2* for which absolutevalues are meaningful.
The T2* measurement also showed reduced gray-white matter T2*contrast in the cuprizone-treated mice (Figs. 1D and E). In the controlgroup, the mean gray matter T2* was 34.0±3.3 ms (R2*=29.6±3.0 Hz) whereas the mean T2* in white matter was 28.4±3.4 ms(R2*=35.7±4.6 Hz) yielding a moderately significant gray-whitematter difference (p=0.007). In comparison, the cuprizone-treatedgroup had a gray matter T2* of 37.2±1.2 ms (R2*=26.9±0.9 Hz) anda white matter T2* of 39.4±2.8 ms (R2*=25.5±1.7 Hz) and thesegray-white matter values were not significantly different (p=0.055).The mean T2* in gray matter showed a marginally significant increasein the cuprizone group relative to the controls (p=0.033). The meanwhite matter T2* values were significantly increased in the cuprizone-treated mice compared to controls (p=5.3×10⁻⁵). These ROI resultsand statistical tests are summarized in Fig. 3 and Table 1.
These in-vivo results were corroborated by the measurements invitro which showed superior image quality and reduced ROI standarddeviations (Fig. 2). The gray-white matter frequency contrast was3.91±0.43 Hz in the control group and 1.10±0.31 Hz in the cuprizonegroup which was significantly different (p=1.4×10⁻⁷) (Figs. 2B andC). The mean T2* values in control mice (Fig. 2D) were significantly dif-ferent (p=0.0013) in gray matter 30.3±2.4 ms (R2*=33.2±2.9 Hz)compared to white matter 25.2±1.8 ms (R2*=39.8±3.1 Hz).However, there was no significant difference between the mean gray(T2*=33.3±2.2 ms; R2*=30.1±2.1 Hz) and white (T2*=32.6±2.2 ms; R2*=30.8±2.1 Hz) matter T2* values in the cuprizone-fedgroup (p=0.29). Comparing mean T2* values between the cuprizone-fed and control groups, there was a significant increase (p=1.9×10⁻⁵)in the white matter T2* in the cuprizone-treatedmice relative to the con-trols. The mean gray matter T2* values were marginally increased in the
cuprizone-treated mice relative to the controls (p=0.02) suggestingthat the cuprizone diet also affected gray matter in addition to the strongeffects found in white matter.
Tissue fixation effects
To test the effects of tissue fixation on frequency contrast and T2*values, the results obtained in fixed tissues were compared to the mea-surements made in vivo. The gray-white matter frequency contrast wasnot significantly changed byfixation (p=0.22 for the control group andp=0.066 for the cuprizone group) suggesting that formalin fixationhad little effect on frequency contrast. On the other hand, the T2* valueswere reduced in the fixed tissues compared to the values in vivo: in thecontrol group, the gray matter T2* was reduced by 3.7±1.7 ms(p=0.025) and the white matter by 3.1±1.6 ms (p=0.044). In thecuprizone group, the gray matter T2* decreased by 3.9±0.96 ms(p=0.0014), and the white matter T2* decreased by 6.8±1.3 ms(p=1.53×10⁻⁴). Despite overall decreases in T2* values, the relativecontrasts were sustained after fixation, giving a clear gray-white matterdifferentiation in control mice.
Previous studies have shown that formalin-fixation reduces T1 andT2 relaxation parameters (Dawe et al., 2009; Kamman et al., 1985;Shepherd et al., 2009a, 2009b; Thelwall et al., 2006; Tovi andEricsson, 1992; Yong Hing et al., 2005). Hence, the reduced T2* ob-served in fixed tissues may have been caused by a decrease in T2 onfixation. Note that the reduced T2* values observed in fixed brainsmay not have originated solely from the formalin fixation process asthere was a temperature difference between the scans (i.e. 37 °C invivo vs. room temperature in vitro).
Body weight and brain size
When the body weight of individual animals was regressed outfrom each contrast in each group, none of the contrasts showed a sig-nificant correlation with body weight for pb0.05/8=0.0063 withBonferroni correction for multiple comparisons. The p-values for thecorrelation of body weight with (i) gray-white matter frequency con-trast were 0.33, 0.68, 0.39, and 0.11 for in-vivo control, in-vivo cupri-zone, fixed control and fixed cuprizone groups respectively (the sameorder hereafter); (ii) gray matter T2* values: 0.14, 0.66, 0.54, and0.11; (iii) white matter T2* values: 0.22, 0.10, 0.40, and 0.015; and(iv) gray-white matter T2* contrast: 0.95, 0.19, 0.95, 0.54. These re-sults suggest that the body weight is not a major contributor to thecontrast changes observed in the cuprizone-treated mice.
The brain size measured in the four slices was not significantly dif-ferent between the two groups. The total number of voxels in thecuprizone-treated group was 70236±887 voxels whereas it was69122±1610 voxels in the control group and the resulting p-valuewas 0.09.
Myelin staining
The myelin stained images, approximately at Bregma=1.3 mm,(Franklin and Paxinos, 2007), show a similar pattern of changes tothose observed in T2* and frequency contrast images (Fig. 4). Demye-lination of the corpus callosum was evident in the cuprizone-treatedmouse.
These results suggest that myelination is a major source of T2* andfrequency contrast between gray and white matter in these mousebrains.
Discussion
In this study, we have investigated the effect of demyelination onMRI T2* and frequency (phase) contrasts using a cuprizone mousemodel. The results show a significant decrease in frequency contrast
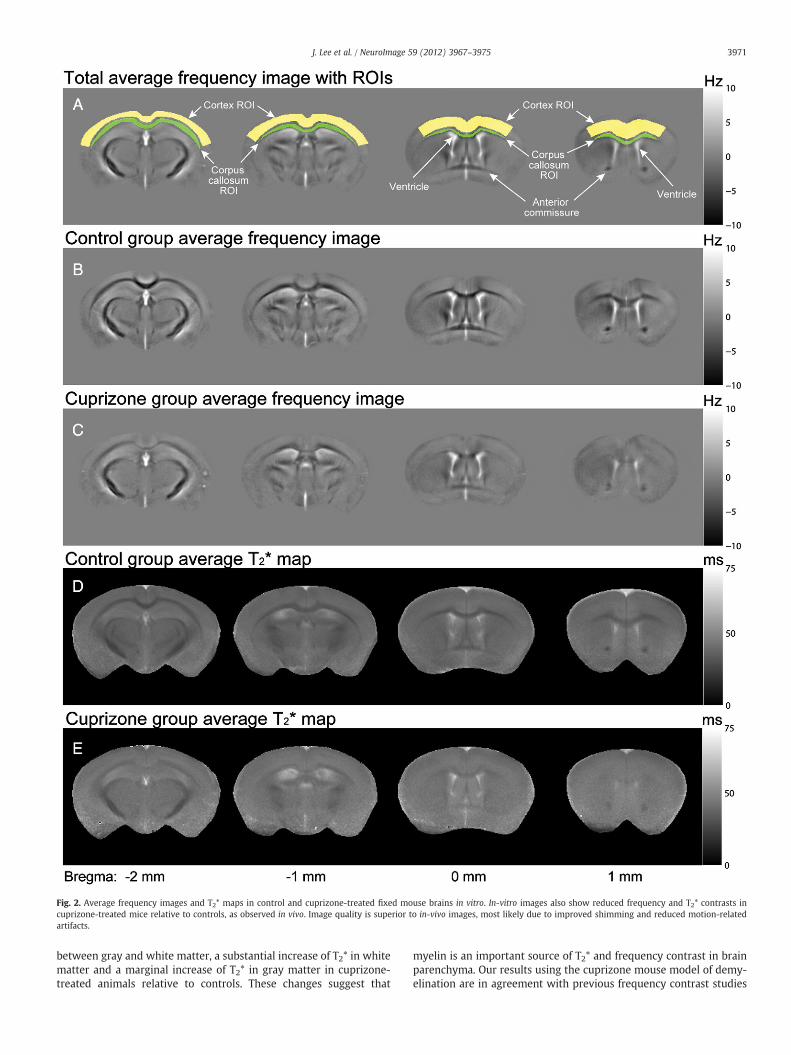
Fig. 2. Average frequency images and T2* maps in control and cuprizone-treated fixed mouse brains in vitro. In-vitro images also show reduced frequency and T2* contrasts incuprizone-treated mice relative to controls, as observed in vivo. Image quality is superior to in-vivo images, most likely due to improved shimming and reduced motion-relatedartifacts.
3971J. Lee et al. / NeuroImage 59 (2012) 3967–3975
between gray and white matter, a substantial increase of T2* in whitematter and a marginal increase of T2* in gray matter in cuprizone-treated animals relative to controls. These changes suggest that
myelin is an important source of T2* and frequency contrast in brainparenchyma. Our results using the cuprizone mouse model of demy-elination are in agreement with previous frequency contrast studies

Fig. 3. Frequency and T2* results with t-test comparisons: the cuprizone diet significantly reduced the gray-white matter frequency and T2* contrasts. Fixation only induced significantchanges in T2* values.
3972 J. Lee et al. / NeuroImage 59 (2012) 3967–3975
of dysmyelination in a shiverer mouse model (Liu et al., 2011) and oflow or absent myelination in human neonates (Zhong et al., 2011).
In this study, we also investigated the effects of tissue fixation onT2* and frequency contrasts, and found that frequency contrast be-tween gray and white matter is minimally affected by fixation. Onthe other hand, T2* values in these tissues were significantly reducedby fixation. We attribute these divergent effects of fixation to changesin the microscopic tissue structure, which may preferentially affectT2* through changes in microscopic (or sub-voxel) field gradients.Alternatively, changes in water diffusion or tissue water contentcould also differentially affect T2* and frequency contrasts.
In our analysis, the brains were realigned and averaged to drawROIs. This was necessary because the cuprizone-treated group did notshow a clear gray-white matter tissue boundary. Despite our efforts torealign the brains as closely as possible, realignment errors due toindividual variability and small differences in slice positioning were
Table 1Statistical comparisons are given together with the p-values obtained from t-tests. Sig-nificant differences (pb0.05) are highlighted with an asterisk (*).
Comparison p-value Significancepb0.05
Frequencycontrast
In-vivo CTL GM–WM In-vivo CPZ GM–WM 6.5×10⁻⁴ *
Fixed CTL GM–WM Fixed CPZ GM–WM 1.4×10⁻⁷ *In-vivo CTL GM–WM Fixed CTL GM–WM 0.22In-vivo CPZ GM–WM Fixed CPZ GM–WM 0.066
T2* contrast In-vivo CTL GM In-vivo CTL WM 0.007 *In-vivo CPZ GM In-vivo CPZ WM 0.055In-vivo CTL GM In-vivo CPZ GM 0.033 *In-vivo CTL WM In-vivo CPZ WM 5.3×10⁻⁵ *Fixed CTL GM Fixed CTL WM 0.0013 *Fixed CPZ GM Fixed CPZ WM 0.29Fixed CTL GM Fixed CPZ GM 0.02 *Fixed CTL WM Fixed CPZ WM 1.9×10⁻⁵ *In-vivo CTL GM Fixed CTL GM 0.025 *In-vivo CTL WM Fixed CTL WM 0.044 *In-vivo CPZ GM Fixed CPZ GM 0.0014 *In-vivo CPZ WM Fixed CPZ WM 1.53×10⁻⁴ *
CTL = control group and CPZ = cuprizone treated group.
unavoidable and some structures (e.g. internal capsule) were not wellvisualized in the averaged images due to partial volume effects.
Demyelination in cuprizone-fed mice
The secondary effects of the cuprizone treatment are a primarylimitation of the current study. Cuprizone is known to specificallyaffect mature oligodendrocytes, which then fail to fulfill their highmetabolic demand and undergo apoptosis (Matsushima and Morell,2001; Palumbo et al., 2011b). Cuprizone also causes an inflammatoryresponse in the brain but without disrupting the blood–brain barrier(McMahon et al., 2002). To our knowledge, specific effects of cupri-zone on brain perfusion or hemoglobin saturation have not been in-vestigated and remain an uncertainty in this study. In addition, it isplausible that the cuprizone diet may have affected other tissueconstituents, such as proteins, which may affect T2* and frequencycontrast. Such confounds from other sources are also present in pre-vious studies (Liu et al., 2011; Zhong et al., 2011). For example, shi-verer mice are deficient in myelin basic protein (Popko et al., 1987)and neonatal brains have a different concentration of iron thanadult brains (Hallgren and Sourander, 1958). Despite the confound-ing factors being different in each study, the common factor in allthese studies is that the myelination changes. The results of thesestudies agree in the sense that reduced myelination decreases thegray-white matter contrast. Hence, myelin is likely to be an importantsource of gray-white matter T2* and frequency contrasts. Comparedto shiverer mice, whose myelin concentration is low throughouttheir life span, the cuprizone treatment used in this study inducestemporary demyelination in adult animals. If cuprizone is later re-moved from the diet, remyelination occurs spontaneously.
Cuprizone may also remove certain types of iron from the whitematter, most importantly the iron storage protein ferritin. However,the concentration of iron in the corpus callosum is low (Sergeantet al., 2005; White et al., 1999). Furthermore, a decreased iron con-centration is expected to lead to a more negative frequency shiftwhich is inconsistent with the observed increase in the white matterfrequency relative to gray matter in the cuprizone group compared tothe controls (Figs. 1B, C and 2B, C). At the same time, it is unlikely thatcuprizone predominantly affected the gray matter as the strongestT2* increases between the control and cuprizone groups were ob-served in the white matter.

Fig. 4. Myelin stained images from (A) a control mouse brain and (B) a cuprizone-treated mouse brain. The cuprizone-treated mouse brain shows significantly reduced staining inthe corpus callosum. The slices were approximately at Bregma+1.3 mm (Franklin and Paxinos, 2007).
3973J. Lee et al. / NeuroImage 59 (2012) 3967–3975
Unlike previous studies (Liu et al., 2011; Zhong et al., 2011), thecurrent study includes the effects of demyelination on T2* valuesand the effects of fixation on T2* and frequency contrasts. Because fre-quency images contain only relative contrast information, one cannotargue with certainty that the reduced gray-white matter frequencycontrast in the cuprizone-treated mice results from a susceptibilitychange in white matter. Rather, the reduced frequency contrast be-tween gray and white matter could also have been caused by achange in gray matter susceptibility. The fact that the predominantT2* change was observed in the white matter suggests that the reduc-tion in frequency contrast was probably caused by changes in the sus-ceptibility of white matter. In other words, the results suggest a whitematter frequency increase rather than a gray matter frequency de-crease. This example illustrates the importance of investigating bothT2* and frequency changes.
Compared to the 1.95 Hz frequency contrast between gray andwhite matter measured at 9.4 T in control mice (Liu et al., 2011),our results at 7 T show a larger gray-white matter frequency contrast(3.91 Hz). This discrepancy may originate from differences in the ageand type of animals used. In addition, different ROIs were used andthe high-pass filtering included here in the processing significantlyaffects the frequency contrast (Chen et al., 2010).
In the current study, small increases in gray matter T2* were ob-served in cuprizone-treated mice. This may be related to cuprizone-induced reductions of the myelin in gray matter (Norkute et al.,2009).
In the cuprizone-treated mouse images, different white matterstructures show different contrast changes. For example, the anteriorcommissures in Figs. 1, 2 and 4 (labeled in Fig. 2) show stronger gray-white matter contrast than the corpus callosum. It has been reportedthat cuprizone treatment causes different levels of demyelination indifferent white matter regions (Stidworthy et al., 2003; Yang et al.,2009). The heterogeneity in the maturation of white matter hasbeen suggested as a possible reason for the differential effects ofcuprizone treatment (Yang et al., 2009). In our study, we focused onthe corpus callosum because it is one of the structures most stronglyaffected by cuprizone treatment.
It is interesting to consider that, from the data presented here, onemay be able to derive a rough estimate of the magnetic susceptibilityof myelin. Let us assume that the water protons that contribute to themeasured MRI signal are predominantly found in elongated compart-ments (e.g. cylinders) outside the myelin itself (He and Yablonskiy,2009), and that their susceptibility-mediated transverse relaxation(characterized by T2′ or R2′) is dominated by static dephasing effects.In that case, the shifts in resonance frequency and R2′ (Δf and ΔR2′
respectively) attributed to the susceptibility of myelin are relatedand can be approximated by (He and Yablonskiy, 2009; Yablonskiyand Haacke, 1994):
Δf ¼ γ―⋅0:5⋅Δχ⋅B0⋅ sin2θ⋅s ð1Þ
ΔR2
0���
��� ¼ 2π⋅γ―⋅0:5⋅ Δχj j⋅B0⋅ sin
2θ⋅s ð2Þ
where γ― is the gyromagnetic ratio in Hz∙T−1; Δχ is the magnetic sus-ceptibility difference between myelin and the surrounding medium;B0 is main magnetic field strength (γ―∙B0=298 MHz at 7 T); θ is theangle between the B0 field and the cylinders; and s is the volume frac-tion of myelin. Note that these equations were derived based on SIunits (χSI=4πχCGS), and that large-scale (supra-voxel) susceptibilityeffects were ignored. In our experiments, Δf and |ΔR2′| were -2.13 Hzand 10.2 Hz respectively, where Δf was approximated by the white-gray matter frequency contrast difference between the control andcuprizone groups in vivo (neglecting potential bulk frequency shiftsfrom the sparser and more randomly oriented myelin in gray matter)and ΔR2′ was approximated by the R2* difference in white matter be-tween the two groups in vivo. Further, if we consider that the whitematter fibers of the mouse corpus callosum run predominantly per-pendicular to the B0 field (i.e. θ=90°), and assume the volume frac-tion of myelin in white matter to be 16% (O'Brien and Sampson,1965), Δχ calculated from the Δf and |ΔR2′| values given aboveusing Eqs. (1) and (2) is found to be −0.089 and -0.068 ppm respec-tively. The sign used for Δχ calculated from |ΔR2′| was taken from thesign of Δχ calculated from Δf because |ΔR2′| is independent of sign.The relatively low myelin susceptibility estimated from |ΔR2′| maybe related to our assumption that the protons are primarily in thestatic dephasing regime which may not be fully valid. These Δχ valuesare in good agreement with the reported susceptibility of mouse cor-pus callosum (−0.0132 ppm) (Liu et al., 2011) when taking into ac-count the 16% myelin volume fraction.
Tissue iron, copper, and chemical exchange
Other sources of T2* and frequency contrast include tissue iron,copper, and chemical exchange. It has been shown that tissue iron isan important source of T2* and frequency contrasts (Fukunaga et al.,2010; Haacke et al., 2005; Ogg et al., 1999; Yao et al., 2009). In mice,the concentrations of iron in cortex and corpus callosum are similarand substantially lower than those in human brains (Sergeant et al.,2005; White et al., 1999). Therefore, tissue iron may not contribute togray-whitematter contrasts in themouse asmuch as it does in humans,although this needs further investigation.
Because cuprizone is a copper chelator, it is reasonable to suggestthat copper could be another source for the observed changes. Little isknown about the effects of copper on T2* and frequency contrast. Theconcentration of copper is ~2.6–4 times lower than iron in the C57B6/D2 mouse (Sergeant et al., 2005) and its susceptibility is close to thatof water (slightly more diamagnetic) (Schenck, 1996). Therefore, itmay not have significant effects.
Chemical exchange of protons between free water and macromol-ecules is another source of gray-white matter frequency contrast (Luoet al., 2010; Shmueli et al., 2011; Zhong et al., 2008). It has been

3974 J. Lee et al. / NeuroImage 59 (2012) 3967–3975
shown that white matter has a positive exchange-induced frequencyshift compared to gray matter and this is opposite to the overall gray-white matter frequency contrast observed in vivo (Shmueli et al.,2011). This suggests that the chemical-exchange-induced gray-whitematter frequency difference acts together with and in opposition to aneven greater susceptibility-induced gray-white matter frequency con-trast. In the current study, demyelination in the cuprizone-fed mice islikely to reduce macromolecules in white matter as suggested in amagnetization transfer study (Zaaraoui et al., 2008). This reduction inmacromolecules is expected to lead to a corresponding reduction inchemical-exchange-induced frequency shifts in the white matter. Sucha reduction would increase the overall gray-white matter frequencydifference because the exchange-induced frequency shifts generallyoppose the susceptibility-induced frequency shifts (Luo et al., 2010;Shmueli et al., 2011). The decreased gray-white matter frequency con-trast observed in the cuprizone-treated mice suggests that the effect ofcuprizone on the exchange-induced component of the frequency con-trast was smaller than on the susceptibility-induced component.
Tissue fixation effects
The effects of tissue fixation on MRI parameters have been an im-portant topic of research as a large number of studies have been per-formed in fixed tissues and the results were used to infer the contrastexpected in vivo. Most studies have focused on T1, T2 and diffusionchanges, revealing decreased T1, T2 and water diffusivity after fixation(Dawe et al., 2009; Kamman et al., 1985; Shepherd et al., 2009a,2009b; Thelwall et al., 2006; Tovi and Ericsson, 1992; Yong Hinget al., 2005). It has also been shown that the decreased relaxationparameters and diffusivity can be restored once tissues are soakedin PBS (Shepherd et al., 2009b). To our knowledge, however, no pre-vious study has demonstrated T2* and frequency contrast changesafter fixation. Note that the temperature also differed between thescans: from 37 °C in vivo to room temperature for the fixed tissues.Therefore, this temperature difference could also have contributedto the observed contrast changes. Since most fixed tissue studies areperformed at room temperature, it is useful to demonstrate the com-bined effects of fixation and temperature rather than separating outthe effect of fixation.
Recently, a dependence of T2* onfiber orientation has been observedin brain white matter and it has been suggested to use this dependenceto map fiber orientation and to study white matter integrity (Lee et al.,2011). The measured change in T2* for fibers parallel vs. perpendicularto B0 (ΔT2*) was only 3 ms in fixed tissue (Lee et al., 2011) but reachedup to 15 ms in vivo (Wiggins et al., 2011) suggesting that fixation has alarge effect on ΔT2*. The current study suggests that this decrease inΔT2* on fixation could be partly due to an overall reduction in T2 andT2* values on fixation.
Conclusion
Myelin is a considerable source of magnetic susceptibility-weightedcontrast between gray andwhitematter at highfield (7 T). Both T2* andfrequency contrast are substantially reduced in mice with significantmyelin loss induced by a cuprizone diet. This finding holds true forexperiments both in vivo and in vitro, and has implications for the inter-pretation of T2* and frequency contrast across brain regions. The sign ofthe observed frequency changes with demyelination are consistentwith a diamagnetic susceptibility of myelin; this conforms a previouslysuggested notion that iron and myelin differentially affect T2* and fre-quency contrast originating from tissue magnetic susceptibility.
Acknowledgment
The authors appreciate useful comments from Dr. Hang Joon Jo atNIH.
References
Baxan, N., Harsan, L.-A., Dragonu, I., Merkle, A., Hennig, J., von Elverfeldt, D., 2010.Myelin as a primary source of phase contrast demonstrated in vivo in the mousebrain. Proceedings of the 18th Annual Meeting of ISMRM, Stockholm, Sweden, p.3016.
Bender, B., Klose, U., 2010. The in vivo influence of white matter fiber orientationtowards B0 on T2* in the human brain. NMR Biomed. 23, 1071–1076.
Blakemore, W., 1973. Demyelination of the superior cerebellar peduncle in the mouseinduced by cuprizone. J. Neurol. Sci. 20, 63–72.
Budde, J., Shajan, G., Hoffmann, J., Uğurbil, K., Pohmann, R., 2010. Human imaging at 9.4 Tusing T2*, phase, and susceptibility weighted contrast. Magn. Reson. Med. 65,544–550.
Chen, Z., Johnston, L.A., Kwon, D.H., Oh, S.H., Cho, Z.H., Egan, G.F., 2010. An optimisedframework for reconstructing and processing MR phase images. NeuroImage 49,1289–1300.
Chu, S.C., Xu, Y., Balschi, J.A., Springer Jr., C.S., 1990. Bulk magnetic susceptibility shiftsin NMR studies of compartmentalized samples: use of paramagnetic reagents.Magn. Reson. Med. 13, 239–262.
Dawe, R.J., Bennett, D.A., Schneider, J.A., Vasireddi, S.K., Arfanakis, K., 2009. PostmortemMRI of human brain hemispheres: T2 relaxation times during formaldehyde fixa-tion. Magn. Reson. Med. 61, 810–818.
Denk, C., Torres, E.H., MacKay, A., Rauscher, A., 2011. The influence of white matterfibre orientation on MR signal phase and decay. NMR Biomed. 24, 246–252.
Duyn, J.H., van Gelderen, P., Li, T.Q., de Zwart, J.A., Koretsky, A.P., Fukunaga, M., 2007.High-field MRI of brain cortical substructure based on signal phase. Proc. Natl.Acad. Sci. U. S. A. 104, 11796–11801.
Franklin, K.B.J., Paxinos, G., 2007. The Mouse Brain in Stereotaxic Coordinates, 3rdEdition. Academic Press.
Fukunaga, M., Li, T.Q., van Gelderen, P., de Zwart, J.A., Shmueli, K., Yao, B., Lee, J., Maric,D., Aronova, M.A., Zhang, G., 2010. Layer-specific variation of iron content in cere-bral cortex as a source of MRI contrast. Proc. Natl. Acad. Sci. U. S. A. 107,3834–3839.
Fukunaga, M., van Gelderen, P., Lee, J., Li, T.-Q., de Zwart, J.A., Merkle, H., Matsuda, K.M.,Matsuura, E., Duyn, J.H., 2011. Investigation of magnetic susceptibility contrastacross cortical grey matter and white matter. Proceedings of the 19th AnnualMeeting of ISMRM, Montreal, Canada, p. 12.
Haacke, E.M., Xu, Y., Cheng, Y.C., Reichenbach, J.R., 2004. Susceptibility weightedimaging (SWI). Magn. Reson. Med. 52, 612–618.
Haacke, E.M., Cheng, N.Y.C., House, M.J., Liu, Q., Neelavalli, J., Ogg, R.J., Khan, A., Ayaz,M., Kirsch, W., Obenaus, A., 2005. Imaging iron stores in the brain using magneticresonance imaging. Magn. Reson. Imaging 23, 1–25.
Hallgren, B., Sourander, P., 1958. The effect of age on the non-haemin iron in thehuman brain. J. Neurochem. 3, 41–51.
Hammond, K.E., Lupo, J.M., Xu, D., Metcalf, M., Kelley, D.A.C., Pelletier, D., Chang, S.M.,Mukherjee, P., Vigneron, D.B., Nelson, S.J., 2008. Development of a robust methodfor generating 7.0 T multichannel phase images of the brain with application tonormal volunteers and patients with neurological diseases. NeuroImage 39,1682–1692.
He, X., Yablonskiy, D.A., 2009. Biophysical mechanisms of phase contrast in gradientecho MRI. Proc. Natl. Acad. Sci. U. S. A. 106, 13558–13563.
Hopp, K., Popescu, B.F.G., McCrea, R.P.E., Harder, S.L., Robinson, C.A., Haacke, M.E.,Rajput, A.H., Rajput, A., Nichol, H., 2010. Brain iron detected by SWI high passfiltered phase calibrated with synchrotron X ray fluorescence. J. Magn. Reson.Imaging 31, 1346–1354.
Jenkinson, M., 2003. Fast, automated, N-dimensional phase-unwrapping algorithm.Magn. Reson. Med. 49, 193–197.
Kamman, R., Go, K., Stomp, G., Hulstaert, C., Berendsen, H., 1985. Changes of relaxationtimes T1 and T2 in rat tissues after biopsy and fixation. Magn. Reson. Imaging 3,245–250.
Lee, J., Hirano, Y., Fukunaga, M., Silva, A.C., Duyn, J.H., 2010a. On the contribution ofdeoxy-hemoglobin to MRI gray-white matter phase contrast at high field. Neuro-Image 49, 193–198.
Lee, J., Shmueli, K., Fukunaga, M., van Gelderen, P., Merkle, H., Silva, A.C., Duyn, J.H.,2010b. Sensitivity of MRI resonance frequency to the orientation of brain tissuemicrostructure. Proc. Natl. Acad. Sci. U. S. A. 107, 5130–5135.
Lee, J., van Gelderen, P., Kuo, L., Merkle, H., Silva, A.C., Duyn, J.H., 2011. T2*-based fiberorientation mapping. NeuroImage 57, 225–234.
Li, T.Q., van Gelderen, P., Merkle, H., Talagala, L., Koretsky, A.P., Duyn, J., 2006. Extensiveheterogeneity in white matter intensity in high-resolution T2*-weighted MRI ofthe human brain at 7.0 T. NeuroImage 32, 1032–1040.
Li, T., Yao, B., van Gelderen, P., Merkle, H., Dodd, S., Talagala, L., Koretsky, A., Duyn, J.,2009. Characterization of T2* heterogeneity in human brain white matter. Magn.Reson. Med. 62, 1652–1657.
Liu, C., 2010. Susceptibility tensor imaging. Magn. Reson. Med. 63, 1471–1477.Liu, C., Li,W., Johnson, G.A.,Wu, B., 2011.High-field (9.4 T)MRI of brain dysmyelination by
quantitative mapping of magnetic susceptibility. NeuroImage 56, 930–938.Luo, J., He, X., d'Avignon, D.A., Ackerman, J.J.H., Yablonskiy, D.A., 2010. Protein-induced
water 1H MR frequency shifts: contributions from magnetic susceptibility andexchange effects. J. Magn. Reson. 202, 102–108.
Marques, J.P., Maddage, R., Mlynarik, V., Gruetter, R., 2009. On the origin of the MRimage phase contrast: an in vivo MR microscopy study of the rat brain at 14.1 T.NeuroImage 46, 345–352.
Matsushima, G.K., Morell, P., 2001. The neurotoxicant, cuprizone, as a model to studydemyelination and remyelination in the central nervous system. Brain Pathol. 11,107–116.

3975J. Lee et al. / NeuroImage 59 (2012) 3967–3975
McMahon, E.J., Suzuki, K., Matsushima, G.K., 2002. Peripheral macrophage recruitmentin cuprizone-induced CNS demyelination despite an intact blood–brain barrier. J.Neuroimmunol. 130, 32–45.
Merkler, D., Boretius, S., Stadelmann, C., Ernsting, T., Michaelis, T., Frahm, J., Brück, W.,2005. Multicontrast MRI of remyelination in the central nervous system. NMRBiomed. 18, 395–403.
Noll, D.C., Schneider, W., 1994. Respiration artifacts in functional brain imaging:sources of signal variation and compensation strategies. Proceedings of the Societyof Magnetic Resonance, San Francisco, USA, p. 647.
Norkute, A., Hieble, A., Braun, A., Johann, S., Clarner, T., Baumgartner, W., Beyer, C.,Kipp, M., 2009. Cuprizone treatment induces demyelination and astrocytosis inthe mouse hippocampus. J. Neurosci. Res. 87, 1343–1355.
O'Brien, J.S., Sampson, E.L., 1965. Lipid composition of the normal human brain: graymatter, white matter, and myelin. J. Lipid Res. 6, 537–544.
Ogg, R.J., Langston, J.W., Haacke, E.M., Steen, R.G., Taylor, J.S., 1999. The correlation be-tween phase shifts in gradient-echo MR images and regional brain iron concentra-tion. Magn. Reson. Imaging 17, 1141–1148.
Palumbo, S., Toscano, C., Parente, L.,Weigert, R., Bosetti, F., 2011a. Time-dependent changesin the brain arachidonic acid cascade during cuprizone-induced demyelination andremyelination. Prostaglandins Leukot. Essent. Fatty Acids 85, 29–35.
Palumbo, S., Toscano, C.D., Parente, L., Weigert, R., Bosetti, F., 2011b. The cyclooxygenase 2pathway via the PGE2 EP2 receptor contributes to oligodendrocytes apoptosis incuprizone induced demyelination. J. Neurochem. (available online). doi:10.1111/j.1471-4159.2011.07363.x.
Petridou, N., Wharton, S.J., Lotfipour, A., Gowland, P., Bowtell, R., 2010. Investigatingthe effect of blood susceptibility on phase contrast in the human brain. Neuro-Image 50, 491–498.
Pistorio, A.L., Hendry, S.H., Wang, X., 2006. A modified technique for high-resolutionstaining of myelin. J. Neurosci. Methods 153, 135–146.
Popko, B., Puckett, C., Lai, E., Shine, H.D., Readhead, C., Takahashi, N., 1987. Myelindeficient mice: expression of myelin basic protein and generation of mice withvarying levels of myelin. Cell 48, 713–721.
Reichenbach, J.R., Venkatesan, R., Schillinger, D.J., Kido, D.K., Haacke, E.M., 1997. Smallvessels in the human brain: MR venography with deoxyhemoglobin as an intrinsiccontrast agent. Radiology 204, 272–277.
Sati, P., Silva, A.C., van Gelderen, P., Gaitan, M.I., Wohler, J.E., Jacobson, S., Duyn, J.H., Reich,D.S., 2011. In vivo quantification of T2* anisotropy inwhite matter fibers inmarmosetmonkeys. NeuroImage (available online). doi:10.1016/j.neuroimage.2011.08.064.
Schäfer, A., Wharton, S., Gowland, P., Bowtell, R., 2009a. Using magnetic field simula-tion to study susceptibility-related phase contrast in gradient echo MRI. Neuro-Image 48, 126–137.
Schäfer, A., Wiggins, C.J., Turner, R., 2009b. Understanding the orientation dependentT2* contrast of the cingulum in ultra high fields. Proceedings of the 17th AnnualMeeting of ISMRM, Honolulu, Hawaii, p. 955.
Schenck, J.F., 1996. The role of magnetic susceptibility in magnetic resonance imaging:MRI magnetic compatibility of the first and second kinds. Med. Phys. 23, 815–850.
Schweser, F., Deistung, A., Lehr, B.W., Reichenbach, J.R., 2010. Differentiation betweendiamagnetic and paramagnetic cerebral lesions based on magnetic susceptibilitymapping. Med. Phys. 37, 5165–5178.
Schweser, F., Deistung, A., Lehr, B., Reichenbach, J., 2011. Quantitative imaging ofintrinsic magnetic tissue properties using MRI signal phase: an approach to invivo brain iron metabolism? NeuroImage 54, 2789–2807.
Sedlacik, J., Kutschbach, C., Rauscher, A., Deistung, A., Reichenbach, J.R., 2008. Investigationof the influence of carbon dioxide concentrations on cerebral physiology bysusceptibility-weighted magnetic resonance imaging (SWI). NeuroImage 43, 36–43.
Sergeant, C., Vesvres,M., Devès, G., Guillou, F., 2005. Calcium, potassium, iron, copper and zincconcentrations in the white and gray matter of the cerebellum and corpus callosum inbrain of four genetic mouse strains. Nucl. Instrum. Methods Phys. Res. B 231, 234–238.
Shepherd, T.M., Flint, J.J., Thelwall, P.E., Stanisz, G.J., Mareci, T.H., Yachnis, A.T., Blackband,S.J., 2009a. Postmortem interval alters thewater relaxation and diffusion properties ofrat nervous tissue—implications for MRI studies of human autopsy samples. Neuro-Image 44, 820–826.
Shepherd, T.M., Thelwall, P.E., Stanisz, G.J., Blackband, S.J., 2009b. Aldehyde fixativesolutions alter the water relaxation and diffusion properties of nervous tissue.Magn. Reson. Med. 62, 26–34.
Shmueli, K., de Zwart, J.A., van Gelderen, P., Li, T.Q., Dodd, S.J., Duyn, J.H., 2009. Magneticsusceptibility mapping of brain tissue in vivo using MRI phase data. Magn. Reson.Med. 62, 1510–1522.
Shmueli, K., Dodd, S.J., Li, T.Q., Duyn, J.H., 2011. The contribution of chemical exchangeto MRI frequency shifts in brain tissue. Magn. Reson. Med. 65, 35–43.
Smith, S.M., Jenkinson, M., Woolrich, M.W., Beckmann, C.F., Behrens, T.E., Johansen-Berg, H., Bannister, P.R., De Luca, M., Drobnjak, I., Flitney, D.E., 2004. Advances infunctional and structural MR image analysis and implementation as FSL. Neuro-Image 23, S208–S219.
Song, S.K., Yoshino, J., Le, T.Q., Lin, S.J., Sun, S.W., Cross, A.H., Armstrong, R.C., 2005.Demyelination increases radial diffusivity in corpus callosum of mouse brain.NeuroImage 26, 132–140.
Stidworthy, M.F., Genoud, S., Suter, U., Mantei, N., Franklin, R.J.M., 2003. Quantifyingthe early stages of remyelination following cuprizone induced demyelination.Brain Pathol. 13, 329–339.
Sun, S.W., Liang, H.F., Trinkaus, K., Cross, A.H., Armstrong, R.C., Song, S.K., 2006. Nonin-vasive detection of cuprizone induced axonal damage and demyelination in themouse corpus callosum. Magn. Reson. Med. 55, 302–308.
Thelwall, P.E., Shepherd, T.M., Stanisz, G.J., Blackband, S.J., 2006. Effects of temperatureand aldehyde fixation on tissue water diffusion properties, studied in an erythro-cyte ghost tissue model. Magn. Reson. Med. 56, 282–289.
Tovi, M., Ericsson, A., 1992. Measurements of T1 and T2 over time in formalin-fixedhuman whole-brain specimens. Acta Radiol. 33, 400–404.
White, A.R., Reyes, R., Mercer, J.F.B., Camakaris, J., Zheng, H., Bush, A.I., Multhaup, G.,Beyreuther, K., Masters, C.L., Cappai, R., 1999. Copper levels are increased in thecerebral cortex and liver of APP and APLP2 knockout mice. Brain Res. 842,439–444.
Wiggins, C.J., Gudmundsdottir, V., Le Bihan, D., Lebon, V., Chaumeil, M., 2008. Orienta-tion dependence of white matter T2* contrast at 7 T: a direct demonstration.Proceedings of the 16th Annual Meeting of ISMRM, Toronto, Canada, p. 237.
Wiggins, G., Wiggins, C., Zhang, B., Brown, B., Stoeckel, B., Sodickson, D., 2011. Explor-ing orientation dependence of T2* in white matter by extreme rotation of thehuman head at 7 T. Proceedings of the 19th Annual Meeting of ISMRM, Montreal,Canada, p. 13.
Wu, Q.Z., Yang, Q., Cate, H.S., Kemper, D., Binder, M., Wang, H.X., Fang, K., Quick, M.J.,Marriott, M., Kilpatrick, T.J., 2008. MRI identification of the rostral caudal patternof pathology within the corpus callosum in the cuprizone mouse model. J. Magn.Reson. Imaging 27, 446–453.
Wu, Z., Mittal, S., Kish, K., Yu, Y., Hu, J., Haacke, E.M., 2009. Identification of calcificationwith MRI using susceptibility weighted imaging: a case study. J. Magn. Reson.Imaging 29, 177–182.
Yablonskiy, D.A., Haacke, E.M., 1994. Theory of NMR signal behavior in magneticallyinhomogeneous tissues: the static dephasing regime. Magn. Reson. Med. 32,749–763.
Yang, H.J., Wang, H., Zhang, Y., Xiao, L., Clough, R.W., Browning, R., Li, X.M., Xu, H., 2009.Region-specific susceptibilities to cuprizone-induced lesions in the mouse fore-brain: implications for the pathophysiology of schizophrenia. Brain Res. 1270,121–130.
Yao, B., Li, T.Q., Gelderen, P.V., Shmueli, K., de Zwart, J.A., Duyn, J.H., 2009. Susceptibilitycontrast in high field MRI of human brain as a function of tissue iron content.NeuroImage 44, 1259–1266.
Yong Hing, C.J., Obenaus, A., Stryker, R., Tong, K., Sarty, G.E., 2005. Magnetic resonanceimaging and mathematical modeling of progressive formalin fixation of the humanbrain. Magn. Reson. Med. 54, 324–332.
Zaaraoui, W., Deloire, M., Merle, M., Girard, C., Raffard, G., Biran, M., Inglese, M., Petry,K.G., Gonen, O., Brochet, B., 2008. Monitoring demyelination and remyelinationby magnetization transfer imaging in the mouse brain at 9.4 T. MAGMA 21,357–362.
Zhang, J., Jones, M.V., McMahon, M.T., Mori, S., Calabresi, P.A., 2011. In vivo and ex vivodiffusion tensor imaging of cuprizone induced demyelination in the mouse corpuscallosum. Magn. Reson. Med. (available online). doi:10.1002/mrm.23032.
Zhong, K., Leupold, J., von Elverfeldt, D., Speck, O., 2008. The molecular basis for grayand white matter contrast in phase imaging. NeuroImage 40, 1561–1566.
Zhong, K., Ernst, T., Buchthal, S., Speck, O., Anderson, L., Chang, L., 2011. Phase contrastimaging in neonates. NeuroImage 55, 1068–1072.