Embed Size (px)
Citation preview

1
IntroductionSociety is in the midst of a connected revolution which is blurring the lines between the digital and physical worlds. It is fundamentally transforming the way we live, work and communicate with one another (Exhibit 1).
The possibilities are endless for millions of users who are connected through multiple smart devices which have unprecedented processing power, storage capacity, and access to knowledge. Meanwhile, novel technologies, such as 3D printing and the Internet of Things (IoT), and new processes involving data-driven production and artificial intelligence (AI), are having a major impact on productivity, employment, income distribution and the environment.
The COVID-19 pandemic has accelerated the transformation by increasing the pace of adoption of technology across a broad spectrum of applications. It has also widened the gap between the ‘winners’ and ‘losers’, with Big Tech being a major beneficiary of the pandemic while many industries and companies have suffered (Exhibit 2).
We have also seen heightened awareness of environmental and social issues amongst both consumers and investors which, in turn, is pushing governments and companies to take action. Global funds linked to environmental, social and governance (ESG) principles benefited from nearly USD350bn of inflows last year compared with USD165bn in 2019.1
HNW_NRG_B_Inset_Mask
The connected revolution through an ESG lensThe RBC Emerging Markets Equity team
Exhibit 1: Industrial and technological revolutions through history
Industry 1.0Steam
1700s
Industry 2.0Electricity
1800s
Industry 3.0Computing
1900s
Industry 4.0Connectedness
Today
Source: Radwell International. Data as at December, 2018.
1 Morningstar Direct, Financial Times, December 2020.

The connected revolution through an ESG lens
2
As the technological revolution continues to gain pace and key beneficiaries become increasingly dominant, there will be greater scrutiny in terms of sustainability and ESG. In this report, we explore the key ESG-related opportunities and challenges posed by the rapidly-expanding technology industry. What will become clear from this report is that the relationship is complex and is one that requires a detailed assessment of materiality by company, country and sub-sector (Exhibit 3).
Part 1: ESG opportunities
Improving quality of life and standard of livingThroughout history, technological breakthroughs have brought about dramatic paradigm shifts in society. From the advent of agriculture to the various industrial revolutions, technological advancements have led to improved living standards and quality of life. Although there are limitations on how the relationship between economic growth and technological innovation can be measured, the empirical relationship is well established by a large body of economic literature. Moreover, a positive correlation can be observed between economic indicators such as gross domestic product (GDP) per capita and technological innovation or automation (Exhibit 4).
Technological advancement and access to technology have also played important roles in the alleviation of poverty by facilitating better education and broader opportunities for work and income generation. The ongoing technological revolution will provide a significant opportunity to reduce poverty in many developing countries where more than 80% of people work in the informal or ‘gig’ economy.2 The rise of the sharing economy, enabled by digital technology, is facilitating peer-to-peer transactions, bringing down costs and opening up new avenues of income generation (Exhibit 5).
Exhibit 2: Increasing dominance of Big Tech – 9 of the 10 largest companies in the world today are technology companies
Source: Bloomberg. Data as at December, 2020.
Exhibit 3: Key ESG opportunities and challenges of the connected revolution
Source: RBC Global Asset Management. Data as at February, 2020.
The connected revolution through an ESG Lens
ESG opportunities ESG challenges
Improving quality of life and standard of living. Carbon intensity and energy usage.
“Democratisation” of services by improving access and affordability.
Packaging and e-waste.
Tackling climate change. Cyber security and data protection.
Sustainable agriculture and food security. Rising inequality and labour dislocation.
Improving efficiency and safety in company supply chains. ESG disclosure.
2 World Economic Forum, 2015.

The connected revolution through an ESG lens
3
“Democratisation” of services due to improving access and affordabilityTechnological innovation has accelerated the delivery of fundamental services such as education, healthcare and finance to a broader consumer base globally.
Approximately 3.8 billion people around the world currently have access to mobile internet; this represents 80% of the
population in the developed world compared with only 45% in emerging markets (EM).3 That said, internet penetration is increasing rapidly in many EM, with South East Asia and Latin America reporting a significant growth in internet penetration in recent years (Exhibit 6).
Improvements in internet penetration and information and communications technology (ICT) infrastructure are facilitating the adoption of online learning in many EM. A survey conducted by Pew Research Center, involving over 36,000 participants across developing countries, found that the internet had the most positive influence on education (Exhibit 7).4 Similarly, the OECD identifies a direct correlation between high-speed internet and academic performance: for instance, South Korea’s broadband speed significantly exceeds the global average with its students among the top-ranked in the world, according to PISA scores.5
The COVID-19 pandemic has reinforced the value proposition for online education, with almost 1.4 billion students globally unable to attend school as a result of government lockdowns.6 Moreover, studies suggest that online learning requires 40%-60% less time than a physical classroom setting, and can increase retention rates by 25%-60%.7 This has led to increased demand for online learning tools in recent years.
Exhibit 4: Technological innovation vs GDP per capita (Global Innovation Output Sub-Index rank used as a proxy for technological innovation)
Source: Global Innovation Index, World Bank Data. Data as at December, 2020. Note: The overall GII score is the average of the scores of the Input and Output Sub-Indices. The Innovation Input Sub-Index is comprised of five pillars that capture elements of the national economy that enable innovative activities: 1) Institutions, 2) Human capital and research, 3) Infrastructure, 4) Market sophistication, and 5) Business sophistication. The Innovation Output Sub-Index provides information about outputs that are the result of the innovative activities of economies. There are two output pillars: 6) Knowledge and technology outputs and 7) Creative outputs.
Exhibit 5: Gig economy as primary and secondary sources of income by country
Source: BCG Future of Work 2018 worker survey, conducted with Research Now SSI. Data as at January, 2019.
3 HSBC, 2020. 4 Findings were based on a survey conducted by Pew Research Center involving 36,619 people in 32 emerging and developing countries between March 17 and June 5, 2014. 5 OECD, Bank of America (BofA) Global Research, November 2016. 6 Refers to students enrolled at pre-primary, primary, lower-sec-ondary, upper-secondary and tertiary levels of education. Source: UNESCO, March 2020. 7 Brandon Hall Study, The Research Institute of America, April 2016.

The connected revolution through an ESG lens
4
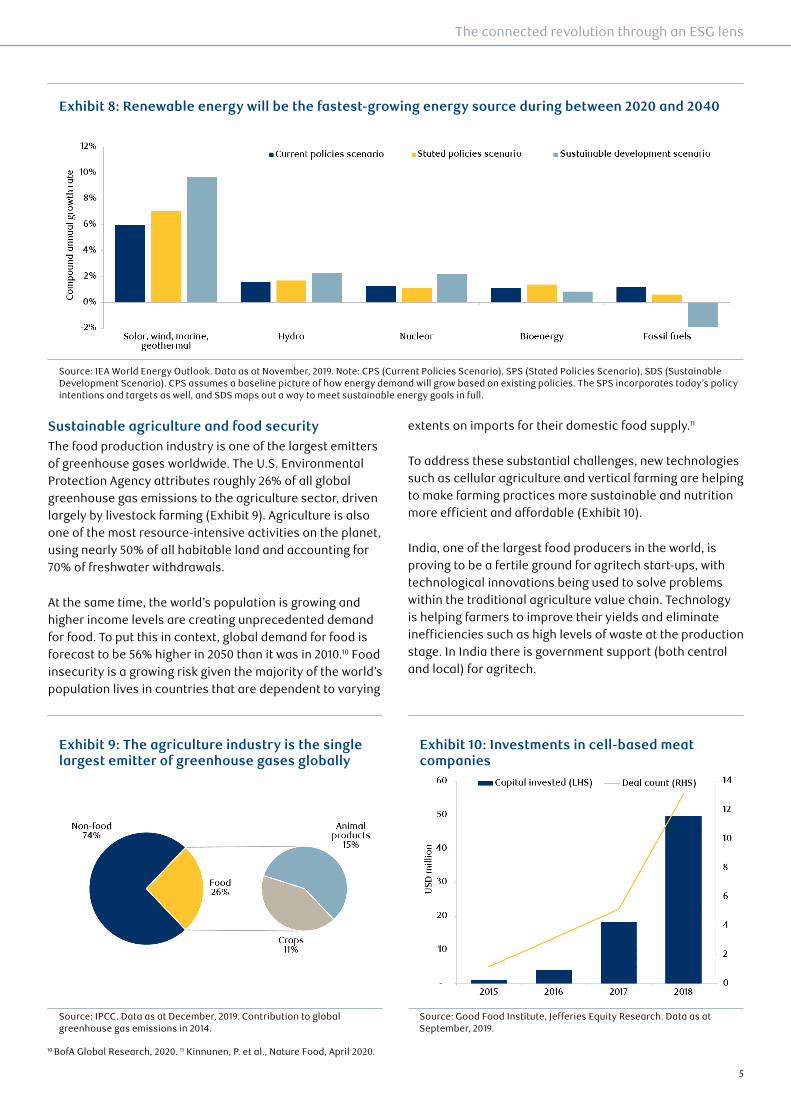
Tackling climate changeThe critical role of technology in the global fight against climate change is widely acknowledged. Declining renewable energy costs due to advances in technology, together with more efficient and affordable batteries, is making climate-friendly energy and transportation more accessible to everyone. Electric vehicles (EV) are forecast to account for 56% of all passenger vehicle sales, and over 30% of the global passenger vehicle fleet, by 2040, while renewable energy is expected to be the fastest-growing energy source in the next 20 years (Exhibit 8). In many countries the cost of solar and wind energy has fallen below that of fossil fuels and, according to Bloomberg New Energy Finance, will account for around 72% of all new electricity investments between 2021 and 2050.8
As climate change becomes more prominent on the global political agenda and governments commit to ambitious environmental targets, we expect to see significant investment in climate-related technologies in future. Notably China, which is responsible for approximately 30% of global CO2 emissions and 64% of the increase since 2000, recently pledged to become carbon neutral by 2060.9 Climate technologies are expected to play a critical role in the country’s path to net zero emissions.
Exhibit 6: Internet penetration is rising in many EM, from low levels (internet penetration, 2019 and improvement in internet penetration, 2014-2019)
Source: World Bank, World Development Indicators. Data as at February, 2021.
Exhibit 7: Survey of individuals in 32 developing countries indicates that the internet has the most positive influence on education
Source: Pew Research Center. Data as at 2014. Findings were based on a survey involving 36,619 people in 32 emerging and developing countries between March 17 and June 5, 2014.
8 Bloomberg New Energy Finance Outlook, 2019. 9 European Commission Joint Research Centre (JRC). Emission Database for Global Atmospheric Research (EDGAR) release version 5.0, Goldman Sachs Global Investment Research, January 2021.
The connected revolution through an ESG lens
5
Sustainable agriculture and food securityThe food production industry is one of the largest emitters of greenhouse gases worldwide. The U.S. Environmental Protection Agency attributes roughly 26% of all global greenhouse gas emissions to the agriculture sector, driven largely by livestock farming (Exhibit 9). Agriculture is also one of the most resource-intensive activities on the planet, using nearly 50% of all habitable land and accounting for 70% of freshwater withdrawals.
At the same time, the world’s population is growing and higher income levels are creating unprecedented demand for food. To put this in context, global demand for food is forecast to be 56% higher in 2050 than it was in 2010.10 Food insecurity is a growing risk given the majority of the world’s population lives in countries that are dependent to varying
extents on imports for their domestic food supply.11
To address these substantial challenges, new technologies such as cellular agriculture and vertical farming are helping to make farming practices more sustainable and nutrition more efficient and affordable (Exhibit 10).
India, one of the largest food producers in the world, is proving to be a fertile ground for agritech start-ups, with technological innovations being used to solve problems within the traditional agriculture value chain. Technology is helping farmers to improve their yields and eliminate inefficiencies such as high levels of waste at the production stage. In India there is government support (both central and local) for agritech.
Exhibit 8: Renewable energy will be the fastest-growing energy source during between 2020 and 2040
Source: IEA World Energy Outlook. Data as at November, 2019. Note: CPS (Current Policies Scenario), SPS (Stated Policies Scenario), SDS (Sustainable Development Scenario). CPS assumes a baseline picture of how energy demand will grow based on existing policies. The SPS incorporates today’s policy intentions and targets as well, and SDS maps out a way to meet sustainable energy goals in full.
Exhibit 9: The agriculture industry is the single largest emitter of greenhouse gases globally
Source: IPCC. Data as at December, 2019. Contribution to global greenhouse gas emissions in 2014.
Exhibit 10: Investments in cell-based meat companies
Source: Good Food Institute, Jefferies Equity Research. Data as at September, 2019.
10 BofA Global Research, 2020. 11 Kinnunen, P. et al., Nature Food, April 2020.
The connected revolution through an ESG lens
6
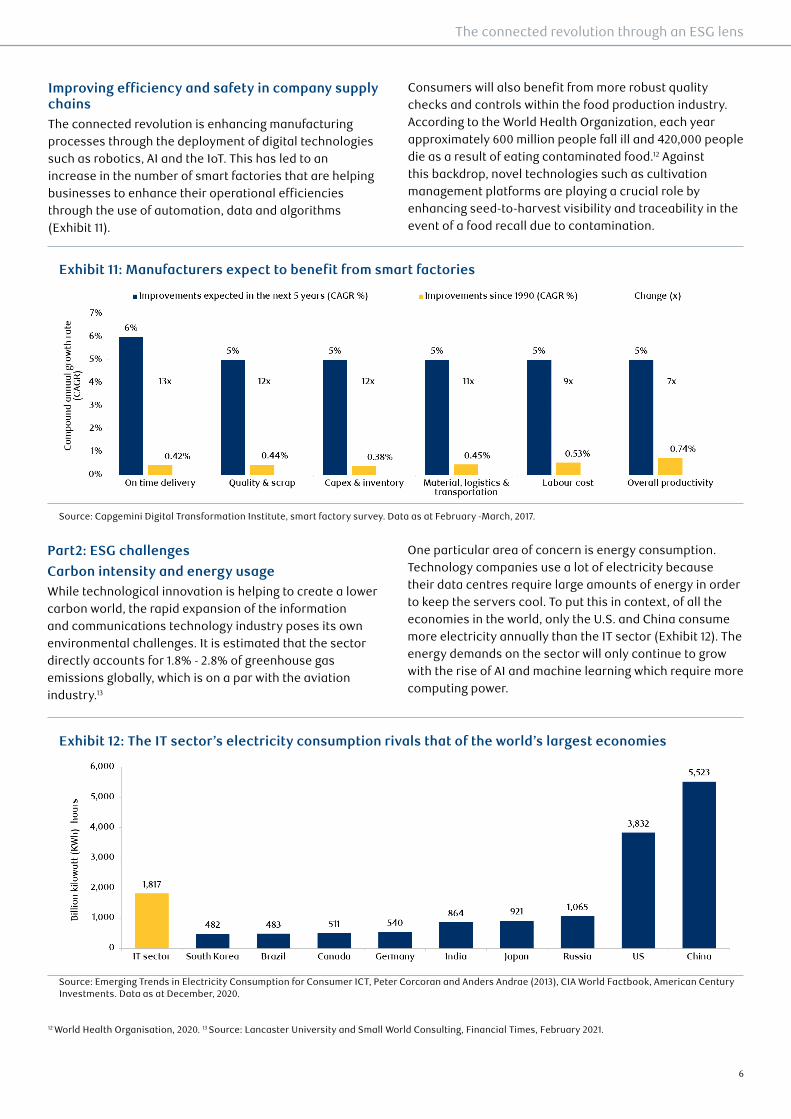
Improving efficiency and safety in company supply chainsThe connected revolution is enhancing manufacturing processes through the deployment of digital technologies such as robotics, AI and the IoT. This has led to an increase in the number of smart factories that are helping businesses to enhance their operational efficiencies through the use of automation, data and algorithms (Exhibit 11).
Consumers will also benefit from more robust quality checks and controls within the food production industry. According to the World Health Organization, each year approximately 600 million people fall ill and 420,000 people die as a result of eating contaminated food.12 Against this backdrop, novel technologies such as cultivation management platforms are playing a crucial role by enhancing seed-to-harvest visibility and traceability in the event of a food recall due to contamination.
Part2: ESG challenges
Carbon intensity and energy usageWhile technological innovation is helping to create a lower carbon world, the rapid expansion of the information and communications technology industry poses its own environmental challenges. It is estimated that the sector directly accounts for 1.8% - 2.8% of greenhouse gas emissions globally, which is on a par with the aviation industry.13
One particular area of concern is energy consumption. Technology companies use a lot of electricity because their data centres require large amounts of energy in order to keep the servers cool. To put this in context, of all the economies in the world, only the U.S. and China consume more electricity annually than the IT sector (Exhibit 12). The energy demands on the sector will only continue to grow with the rise of AI and machine learning which require more computing power.
Exhibit 11: Manufacturers expect to benefit from smart factories
Source: Capgemini Digital Transformation Institute, smart factory survey. Data as at February -March, 2017.
Exhibit 12: The IT sector’s electricity consumption rivals that of the world’s largest economies
Source: Emerging Trends in Electricity Consumption for Consumer ICT, Peter Corcoran and Anders Andrae (2013), CIA World Factbook, American Century Investments. Data as at December, 2020.
12 World Health Organisation, 2020. 13 Source: Lancaster University and Small World Consulting, Financial Times, February 2021.
The connected revolution through an ESG lens
7
Another area coming under increased scrutiny is the semiconductor industry. An essential component in many new technologies, the production of semiconductors requires significant amounts of energy. According to McKinsey, a typical semiconductor manufacturing plant uses as much power in a year as about 50,000 homes.14 The bulk of the global electronics production value chain, from memory chip manufacturing to final assembly, is located in Asian countries including China, South Korea, Taiwan and Vietnam. In many of these locations memory chip manufacturing operations still rely on non-renewable energy sources, although the contribution from renewable energy is increasing. We expect this to continue, supported by government policy and corporates.
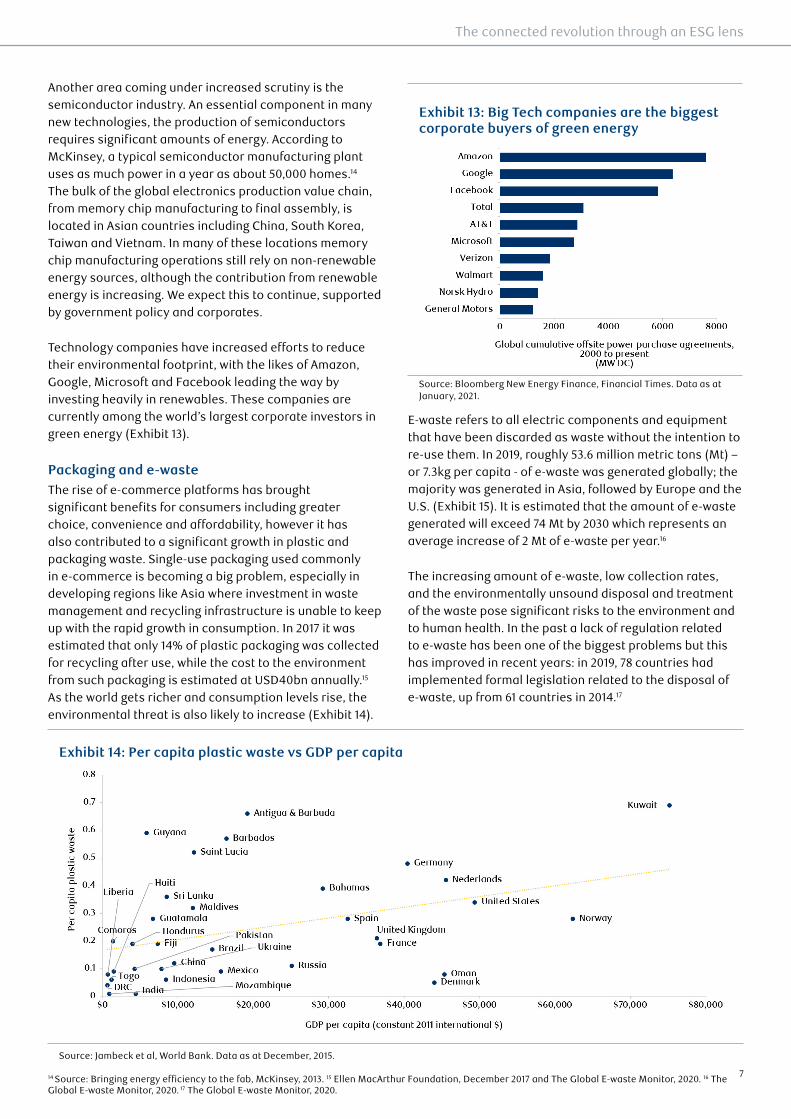
Technology companies have increased efforts to reduce their environmental footprint, with the likes of Amazon, Google, Microsoft and Facebook leading the way by investing heavily in renewables. These companies are currently among the world’s largest corporate investors in green energy (Exhibit 13).
Packaging and e-wasteThe rise of e-commerce platforms has brought significant benefits for consumers including greater choice, convenience and affordability, however it has also contributed to a significant growth in plastic and packaging waste. Single-use packaging used commonly in e-commerce is becoming a big problem, especially in developing regions like Asia where investment in waste management and recycling infrastructure is unable to keep up with the rapid growth in consumption. In 2017 it was estimated that only 14% of plastic packaging was collected for recycling after use, while the cost to the environment from such packaging is estimated at USD40bn annually.15 As the world gets richer and consumption levels rise, the environmental threat is also likely to increase (Exhibit 14).
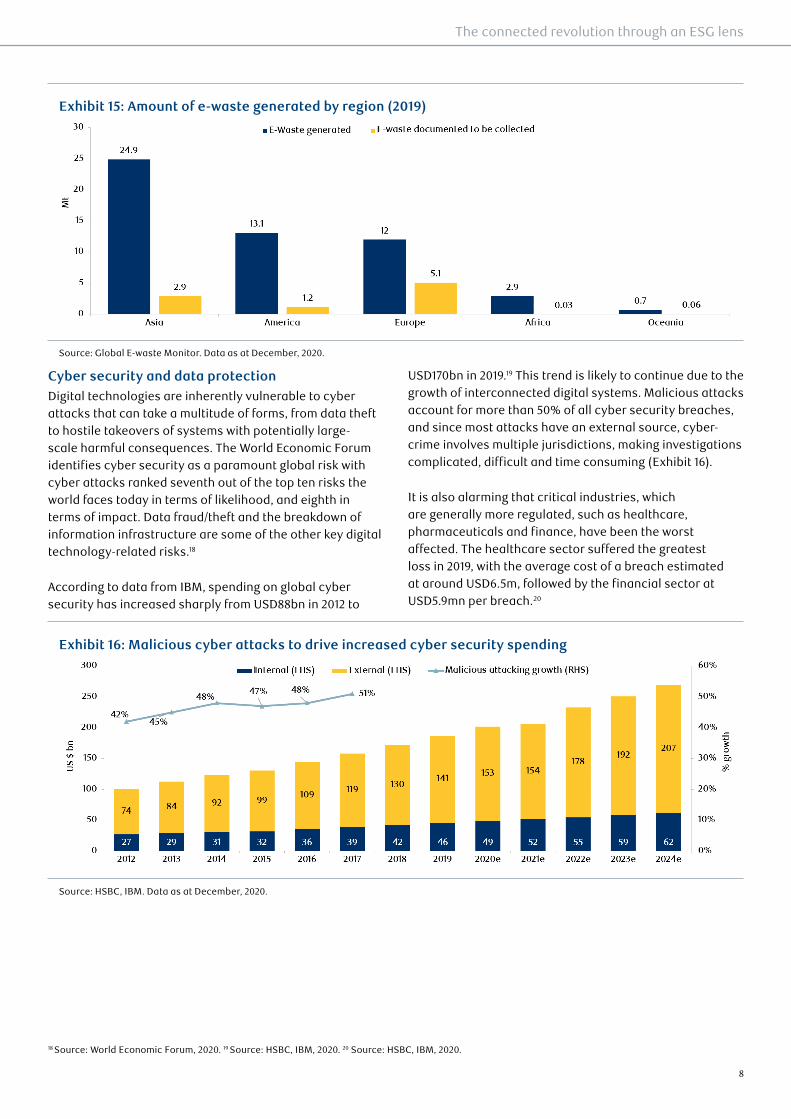
E-waste refers to all electric components and equipment that have been discarded as waste without the intention to re-use them. In 2019, roughly 53.6 million metric tons (Mt) – or 7.3kg per capita - of e-waste was generated globally; the majority was generated in Asia, followed by Europe and the U.S. (Exhibit 15). It is estimated that the amount of e-waste generated will exceed 74 Mt by 2030 which represents an average increase of 2 Mt of e-waste per year.16
The increasing amount of e-waste, low collection rates, and the environmentally unsound disposal and treatment of the waste pose significant risks to the environment and to human health. In the past a lack of regulation related to e-waste has been one of the biggest problems but this has improved in recent years: in 2019, 78 countries had implemented formal legislation related to the disposal of e-waste, up from 61 countries in 2014.17
Exhibit 13: Big Tech companies are the biggest corporate buyers of green energy
Source: Bloomberg New Energy Finance, Financial Times. Data as at January, 2021.
Exhibit 14: Per capita plastic waste vs GDP per capita
Source: Jambeck et al, World Bank. Data as at December, 2015.
14 Source: Bringing energy efficiency to the fab, McKinsey, 2013. 15 Ellen MacArthur Foundation, December 2017 and The Global E-waste Monitor, 2020. 16 The Global E-waste Monitor, 2020. 17 The Global E-waste Monitor, 2020.
The connected revolution through an ESG lens
8
Cyber security and data protectionDigital technologies are inherently vulnerable to cyber attacks that can take a multitude of forms, from data theft to hostile takeovers of systems with potentially large-scale harmful consequences. The World Economic Forum identifies cyber security as a paramount global risk with cyber attacks ranked seventh out of the top ten risks the world faces today in terms of likelihood, and eighth in terms of impact. Data fraud/theft and the breakdown of information infrastructure are some of the other key digital technology-related risks.18
According to data from IBM, spending on global cyber security has increased sharply from USD88bn in 2012 to
USD170bn in 2019.19 This trend is likely to continue due to the growth of interconnected digital systems. Malicious attacks account for more than 50% of all cyber security breaches, and since most attacks have an external source, cyber-crime involves multiple jurisdictions, making investigations complicated, difficult and time consuming (Exhibit 16).
It is also alarming that critical industries, which are generally more regulated, such as healthcare, pharmaceuticals and finance, have been the worst affected. The healthcare sector suffered the greatest loss in 2019, with the average cost of a breach estimated at around USD6.5m, followed by the financial sector at USD5.9mn per breach.20
Exhibit 15: Amount of e-waste generated by region (2019)
Source: Global E-waste Monitor. Data as at December, 2020.
Exhibit 16: Malicious cyber attacks to drive increased cyber security spending
Source: HSBC, IBM. Data as at December, 2020.
18 Source: World Economic Forum, 2020. 19 Source: HSBC, IBM, 2020. 20 Source: HSBC, IBM, 2020.

The connected revolution through an ESG lens
9
Rising inequality and labour dislocationWealth inequality has been on the rise globally in recent years and this has been the source of increasing social unrest (Exhibit 17). One contributing factor to social instability has been rapid technological change.
The rise of automation and its increased cost efficiency is fuelling demand for industrial robots, with an estimated three million robots currently being deployed in factories worldwide.21 While these technologies are improving efficiencies and raising health and safety standards within company supply chains, there is a downside for society.
Oxford Economics estimates that approximately 20 million manufacturing jobs worldwide could be lost to automation
by 2030, while the World Bank assesses that over 50% of all jobs in the developing world are potentially at risk from automation (Exhibit 18).22 The impact will vary significantly by industry and country however, and will ultimately depend on wage levels, quality of education, and the pace of technological adoption.
It is also expected that new jobs will be created which should offset the jobs lost to automation in the near term. These new roles, including those for data analysts and software developers, require greater cognitive skills and technological proficiency and it is therefore crucial that governments focus on developing education and vocational training in order to increase the adaptability and resilience of their workforces.
Exhibit 17: Global wealth growth and inequality
Source: Jefferies, WID. World. Data as at December, 2019. Note: Growth rates are expressed in real terms after the deduction of inflation.
Exhibit 18: Projected job losses due to automation
Source: Oxford Economics. Data as at December, 2019.
21 Source: International Federation of Robotics, 2020. 22 Source: World Bank, 2016.
The connected revolution through an ESG lens
10
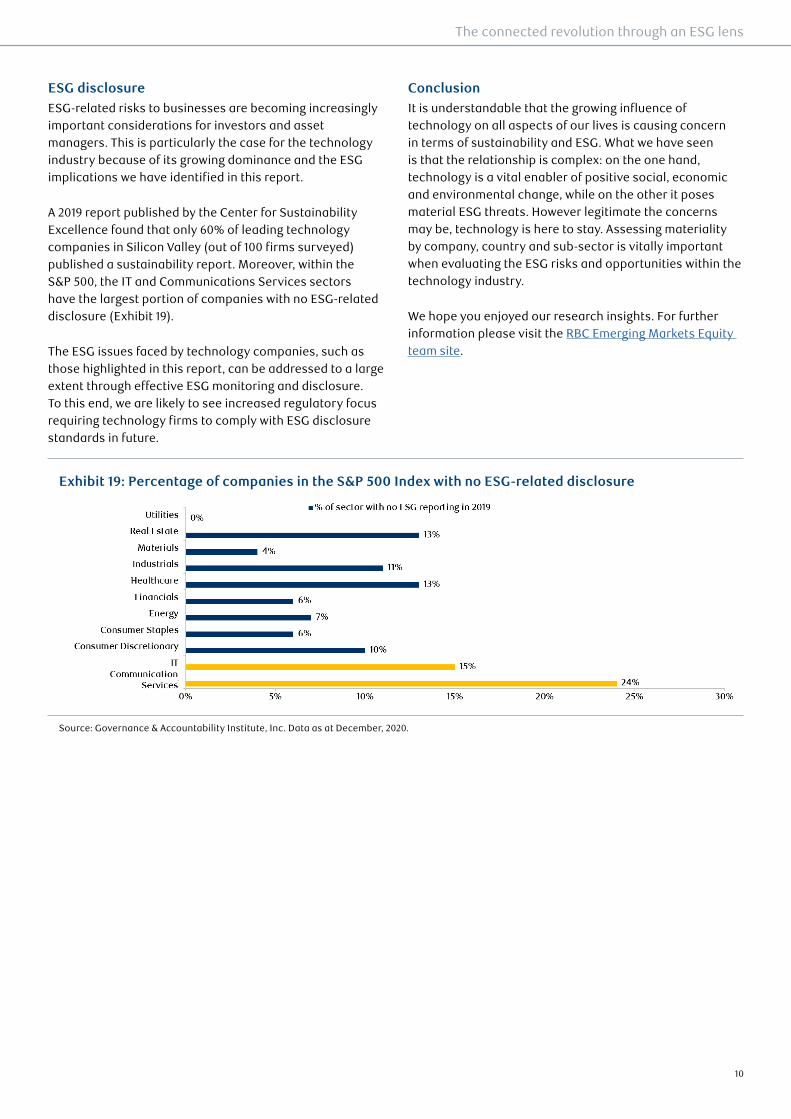
ESG disclosureESG-related risks to businesses are becoming increasingly important considerations for investors and asset managers. This is particularly the case for the technology industry because of its growing dominance and the ESG implications we have identified in this report.
A 2019 report published by the Center for Sustainability Excellence found that only 60% of leading technology companies in Silicon Valley (out of 100 firms surveyed) published a sustainability report. Moreover, within the S&P 500, the IT and Communications Services sectors have the largest portion of companies with no ESG-related disclosure (Exhibit 19).
The ESG issues faced by technology companies, such as those highlighted in this report, can be addressed to a large extent through effective ESG monitoring and disclosure. To this end, we are likely to see increased regulatory focus requiring technology firms to comply with ESG disclosure standards in future.
ConclusionIt is understandable that the growing influence of technology on all aspects of our lives is causing concern in terms of sustainability and ESG. What we have seen is that the relationship is complex: on the one hand, technology is a vital enabler of positive social, economic and environmental change, while on the other it poses material ESG threats. However legitimate the concerns may be, technology is here to stay. Assessing materiality by company, country and sub-sector is vitally important when evaluating the ESG risks and opportunities within the technology industry.
We hope you enjoyed our research insights. For further information please visit the RBC Emerging Markets Equity team site.
Exhibit 19: Percentage of companies in the S&P 500 Index with no ESG-related disclosure
Source: Governance & Accountability Institute, Inc. Data as at December, 2020.

The connected revolution through an ESG lens
This document is provided by RBC Global Asset Management (RBC GAM) for informational purposes only and may not be reproduced, distributed or published without the written consent of RBC GAM or its affiliated entities listed herein. This document does not constitute an offer or a solicitation to buy or to sell any security, product or service in any jurisdiction; nor is it intended to provide investment, financial, legal, accounting, tax, or other advice and such information should not be relied or acted upon for providing such advice. This document is not available for distribution to investors in jurisdictions where such distribution would be prohibited.
RBC GAM is the asset management division of Royal Bank of Canada (RBC) which includes RBC Global Asset Management Inc., RBC Global Asset Management (U.S.) Inc., RBC Global Asset Management (UK) Limited, RBC Global Asset Management (Asia) Limited, and BlueBay Asset Management LLP, which are separate, but affiliated subsidiaries of RBC.
In Canada, this document is provided by RBC Global Asset Management Inc. (including PH&N Institutional) which is regulated by each provincial and territorial securities commission with which it is registered. In the United States, this document is provided by RBC Global Asset Management (U.S.) Inc., a federally registered investment adviser. In Europe this document is provided by RBC Global Asset Management (UK) Limited, which is authorised and regulated by the UK Financial Conduct Authority. In Asia, this document is provided by RBC Global Asset Management (Asia) Limited, which is registered with the Securities and Futures Commission (SFC) in Hong Kong.
Additional information about RBC GAM may be found at www.rbcgam.com.
This document has not been reviewed by, and is not registered with any securities or other regulatory authority, and may, where appropriate and permissible, be distributed by the above-listed entities in their respective jurisdictions.
Any investment and economic outlook information contained in this document has been compiled by RBC GAM from various sources. Information obtained from third parties is believed to be reliable, but no representation or warranty, express or implied, is made by RBC GAM, its affiliates or any other person as to its accuracy, completeness or correctness. RBC GAM and its affiliates assume no responsibility for any errors or omissions.
Opinions contained herein reflect the judgment and thought leadership of RBC GAM and are subject to change at any time. Such opinions are for informational purposes only and are not intended to be investment or financial advice and should not be relied or acted upon for providing such advice. RBC GAM does not undertake any obligation or responsibility to update such opinions.
RBC GAM reserves the right at any time and without notice to change, amend or cease publication of this information.
Past performance is not indicative of future results. With all investments there is a risk of loss of all or a portion of the amount invested. Where return estimates are shown, these are provided for illustrative purposes only and should not be construed as a prediction of returns; actual returns may be higher or lower than those shown and may vary substantially, especially over shorter time periods. It is not possible to invest directly in an index.
Some of the statements contained in this document may be considered forward-looking statements which provide current expectations or forecasts of future results or events. Forward-looking statements are not guarantees of future performance or events and involve risks and uncertainties. Do not place undue reliance on these statements because actual results or events may differ materially from those described in such forward-looking statements as a result of various factors. Before making any investment decisions, we encourage you to consider all relevant factors carefully.
® / TM Trademark(s) of Royal Bank of Canada. Used under licence. © RBC Global Asset Management Inc., 2021
Publication date: March 2021. GUKM/21/063/APR22/A
For more information, please contact us at: www.rbcgam.com
ABOUT THE AUTHOR
Dijana Jelic
Product Specialist, RBC Emerging Markets Equity RBC Global Asset Management (UK) Limited
BIO
IMC (2015), BA (History of Art) (2010), University of Warwick, UK.
Dijana is a product specialist on the Emerging Markets Equity Team at RBC GAM. Prior to joining the firm in 2018, Dijana was vice president at an international bank, where she spent six years in the managed investments and investment marketing businesses, focusing on the positioning of investment capabilities and thought leadership. Dijana began her investments career at an auditing firm in 2011. Prior to this, she worked at a leading global auction house.