Embed Size (px)
Citation preview

roiw_343 661..685
INTANGIBLE CAPITAL AND U.S. ECONOMIC GROWTH
by Carol Corrado*
The Conference Board, New York
Charles Hulten
University of Maryland and NBER
and
Daniel Sichel
Federal Reserve Board, Washington DC
Published macroeconomic data traditionally exclude most intangible investment from measured GDP.This situation is beginning to change, but our estimates suggest that as much as $800 billion is stillexcluded from U.S. published data (as of 2003), and that this leads to the exclusion of more than $3trillion of business intangible capital stock. To assess the importance of this omission, we add intangiblecapital to the standard sources-of-growth framework used by the BLS, and find that the inclusion ofour list of intangible assets makes a significant difference in the observed patterns of U.S. economicgrowth. The rate of change of output per worker increases more rapidly when intangibles are countedas capital, and capital deepening becomes the unambiguously dominant source of growth in laborproductivity. The role of multifactor productivity is correspondingly diminished, and labor’s incomeshare is found to have decreased significantly over the last 50 years.
1. Introduction and Background
The revolution in information technology is apparent in the profusion of newproducts available in the marketplace (goods with the acronyms PCs, PDAs,ATMs, wi-fi), as well as items like the internet, cell phones, and e-mail. Theseinnovations are part of a broader technological revolution based on the discoveryof the semiconductor, often called the “IT revolution.” However, while its effectsare apparent in the marketplace, its manifestation in the macroeconomic statisticson growth has been slow to materialize. Writing in 1987, Robert Solow famouslyremarked that “you see the computer revolution everywhere except in the produc-tivity data” (Solow, 1987). Some ten years later, Alan Greenspan observed that thenegative trends in measured productivity observed in many services industriesseemed inconsistent with the fact that they ranked among the top computer-using
Note: Earlier versions of this paper were presented at the CRIW/NBER Summer Institute work-shop (July 2004), the OECD (March 2005), the BEA (November 2005), and the Joint Meeting of theNBER Labor Studies and Productivity Programs (March 2006). We thank Dale Jorgenson, DarrelCohen, Larry Slifman, Tom Tallarini, and participants at all workshops for helpful comments. Theviews expressed in this paper are those of the authors and should not be attributed to the Board ofGovernors of the Federal Reserve System or other members of its staff.
*Correspondence to: Carol A. Corrado, Economics Programs, The Conference Board, 845 ThirdAvenue, New York, NY 10022-6600, USA ([email protected]).
Review of Income and WealthSeries 55, Number 3, September 2009
© 2009 The AuthorsJournal compilation © 2009 International Association for Research in Income and Wealth Publishedby Blackwell Publishing, 9600 Garsington Road, Oxford OX4 2DQ, UK and 350 Main St, Malden,MA, 02148, USA.
661

industries.1 Greenspan also questioned the accuracy of the consumer price index,in part because of its failure to adequately account for the new or superior goodsmade possible by the IT revolution.2
The IT revolution began to appear in the productivity data in the mid-1990s.This pickup has been linked to investment in IT capital in a series of papers(Jorgenson and Stiroh, 2000; Oliner and Sichel, 2000, 2002; Jorgenson et al.,2002; Stiroh, 2002), all of which estimate the contribution of IT capital to outputgrowth within the Solow–Jorgenson–Griliches sources-of-growth (SOG) frame-work. However, the productivity pickup did not remove all suspicion about theability of official data to accurately capture the factors that affect U.S. economicgrowth. Both firm-level and national income accounting practice have historicallytreated expenditure on intangible inputs such as software and R&D as an inter-mediate expense and not as an investment that is part of GDP. The exclusion ofintangibles obscures the role of many factors at the center of the innovationprocess that have, according to available evidence, played an important role ineconomic growth.
This situation has begun to change with the capitalization of software in theU.S. National Income and Product Accounts (NIPAs), which alone had an appre-ciable effect on the growth of output per worker in the non-farm business sector.3
Moreover, the growing literature on intangibles suggests that this is just the tip ofthe iceberg.4 Our own earlier estimates suggest that, in 1999, software spending wasless than 15 percent of a more complete list of intangible business investments thatincludes spending on innovative property (e.g. R&D) and economic competenciesas well as software and other computerized information (Corrado, Hulten, andSichel, 2005; hereafter CHS). We found that total business investment in intan-gibles was approximately one trillion dollars in 1999, an amount that is roughly thesame as investment in tangible capital at that time. The magnitude of these esti-mates suggests that uncounted intangibles have an appreciable effect on the levelof GDP, as well as on the rate of investment and level of labor productivity. This
1Chairman Greenspan’s concerns about the measured productivity trends in services industrieswere first expressed in remarks at an FOMC meeting in late 1996 in regard to a staff analysis ofdisaggregated productivity trends (Corrado and Slifman, 1999). Gullickson and Harper (1999) alsoinvestigated this issue. The observation that many of the services industries that had negative produc-tivity trends were among the top computer-using industries owes, at least in part, to Stiroh (1998) andTriplett (1999).
2Similar views were expressed by Nordhaus (1997), who concluded from his analysis of the historyof lighting that official price and output data “miss the most important technological revolutions inhistory.” Also, Hausman (1999) noted that cell phones were absent from the CPI market basket formany years after they appeared in the marketplace.
3In addition to the capitalization of software expenditures by the Bureau of Economic Analysis(BEA), the capitalization of scientific R&D is under serious consideration for both the U.S. NIPA andthe United Nations System of National Accounts. See Grimm, Moulton, and Wasshausen (2005) for adescription of BEA’s procedures for estimating software.
4See the work sponsored by the OECD (OECD Secretariat, 1998; Khan, 2001) and Nakamura(1999, 2001, 2003), Brynjolfsson and Yang (1999), Brynjolfsson et al. (2002), Hall (2000, 2001a, 2001b),McGrattan and Prescott (2000, 2006), Lev (2001), and Basu et al. (2004). This literature approachesintangibles from various perspectives, and it builds upon previous work that has linked aggregateproductivity to stock market performance (e.g. Baily, 1981; Hall and Hall, 1993) and constructedfirm-level intangible stocks using financial data (e.g. Griliches, 1981; Cockburn and Griliches, 1988;Hall, 1993).
Review of Income and Wealth, Series 55, Number 3, September 2009
© 2009 The AuthorsJournal compilation © International Association for Research in Income and Wealth 2009
662

paper builds on our previous work by examining whether the relative magnitude ofthe discrepancy in the level of investment carries over to the rates of growth ofcapital stock and real output. Our ultimate objective is to examine how thecapitalization of intangible expenditures affects the SOG analyses that have playedsuch a prominent role in recent analyses of the productivity pickup.
We use our new SOG estimates to address the following issues: how muchgrowth in output went uncounted because of the omission of intangibles; what isthe contribution of intangible capital to output growth; how does the inclusion ofintangibles affect the allocation of output growth between capital formation andmultifactor productivity growth; and does the post-1995 productivity pickup lookdifferent when intangibles are taken into account? To our knowledge, this is thefirst paper to examine these issues in the SOG framework with a more-or-lesscomplete list of intangible assets.
We find that the inclusion of intangibles makes a significant difference in themeasured pattern of economic growth: the growth rates of output and of outputper worker are found to increase at a noticeably more rapid rate when intangiblesare included than under the baseline case in which intangible capital is completelyignored, and capital deepening (when expanded to include both tangibles andintangibles) becomes the unambiguously dominant source of growth in laborproductivity. We also find that the inclusion of intangibles has an important effecton the labor share of income. The $1 trillion increase in GDP (in 1999) arising fromaddition of intangible investment to GDP results in an equal increase in GrossDomestic Income (GDI), all of which accrues to the owners of capital. This leadsto a significant increase in the share of GDI accruing to capital and a lower sharefor labor income.
The paper is organized as follows. We first examine the theoretical basis forthe claim that intangibles should be treated as capital rather than as intermediateinputs. We then describe how intangible capital, which is often viewed as qualita-tively different from tangible capital, can be incorporated in the neoclassicalframework on which the sources-of-growth model is based. Our procedures forestimating the flow of intangible investment and the corresponding stock of intan-gible capital are then discussed, after which our growth accounting results arepresented and discussed.
2. Are Intangibles Really Capital?
2.1. The Treatment of Intangible Expenditures
The first question to be settled is theoretical: Should intangible expendituresbe classified as capital or as an intermediate good? The logic underlying the twoalternatives becomes more apparent when the production functions and account-ing identities associated with the two approaches are made explicit. This can beaccomplished by considering a world of three goods, consumption C, tangibleinvestment goods I, and an intangible N. When intangibles are regarded as beingan intermediate good, labor L and tangible capital K are allocated to the produc-tion of all three goods, and N is an input to C and I. The production function andflow account for each of the three sectors is then:
Review of Income and Wealth, Series 55, Number 3, September 2009
© 2009 The AuthorsJournal compilation © International Association for Research in Income and Wealth 2009
663

N t F L t K t t P t N t P t L t P t K tNN N
N LN
KN( ) = ( ) ( )( ) ( ) ( ) = ( ) ( ) + ( ) ( ), , ; ;(1a)
I t F L t K t N t tP t I t P t L t P t K t
II I I
I LI
KI
( ) = ( ) ( ) ( )( )( ) ( ) = ( ) ( ) + ( )
, , , ;(( ) + ( ) ( )P t N tN
I ;(1b)
C t F L t K t N t tP t C t P t L t P t K t
CC C C
C LC
KC
( ) = ( ) ( ) ( )( )( ) ( ) = ( ) ( ) + ( )
, , , ;(( ) + ( ) ( )P t N tN
C ;(1c)
with the adding up conditions L = LN + LI + LC, K = KN + KI + KC, and N = NI +NC, as well as the accumulation equation K(t) = I(t) + (1 - dK)K(t - 1).5 The pro-duction functions in each equation are linked to the accounting identities by theassumption that each input is paid the value of its marginal product. In thisformulation, N(t) is both an output and an intermediate input to the production ofthe other products, and therefore nets out in the aggregate. Thus, N(t) does notappear in the GDP identity, which has the form:
P t Q t P t C t P t I t P t L t P t K tQ C I L K′( ) ′( ) = ( ) ( ) + ( ) ( ) = ( ) ( ) + ( ) ( ).(1d)
This is the approach taken by financial accounts for individual firms, theUnited Nation’s System of National Accounts (United Nations, 1993), and, untilthe recent move to capitalize software, the U.S. NIPAs. In equation (1d), theprimes on the left-hand side of the equation are used to distinguish the case inwhich intangibles are excluded from the case described below in which intangiblesare counted as investment.
A different model of production accounting applies when the intangible isclassified as capital. The output of the intangible, N(t), now appears in the pro-duction functions of the consumption and tangible investment sectors as a cumu-lative stock, not as a contemporaneous input as above. An accumulation equationfor intangible capital, R(t) = N(t) + (1 - dR)R(t - 1), parallels the correspondingequation for tangibles. The sectoral equations become:
N t F L t K t R t tP t N t P t L t P t K t
NN N N
N LN
KN
( ) = ( ) ( ) ( )( )( ) ( ) = ( ) ( ) + ( )
, , , ;(( ) + ( ) ( )P t R tR
N ;(2a)
I t F L t K t R t tP t I t P t L t P t K t
II I I
I LI
KI
( ) = ( ) ( ) ( )( )( ) ( ) = ( ) ( ) + ( )
, , , ;(( ) + ( ) ( )P t R tR
I ;(2b)
C t F L t K t R t tP t C t P t L t P t K t
CC C C
C LC
KC
( ) = ( ) ( ) ( )( )( ) ( ) = ( ) ( ) + ( )
, , , ;(( ) + ( ) ( )P t R tR
C .(2c)
5We adopt the convention that intermediates used by the industry that produced them are nettedout of final output. We have therefore omitted NN from the production function and accounts of theintermediate good industry. We also ignore the complication of chain weighting to keep the expositionsimple.
Review of Income and Wealth, Series 55, Number 3, September 2009
© 2009 The AuthorsJournal compilation © International Association for Research in Income and Wealth 2009
664

The balance equations set out above are modified to replace the equationN = NN + NI + NC with R = RI + RC + RN.6 Again, the production functions in eachequation are linked to the accounting identities by the assumption of marginalproductivity pricing. The GDP identity, in this case, must be expanded to includedthe flow of new intangibles on the product side and the flow of services from theintangible stock on the income side:
P t Q t P t C t P t I t P t N tP t L t P t K t
Q C I N
L K
( ) ( ) = ( ) ( ) + ( ) ( ) + ( ) ( )= ( ) ( ) + ( ) ( )) + ( ) ( )P t R tR .
(2d)
The price PR(t) is the user cost associated with the services of the intangible stockwhich is a source of income that is absent from the conventional intermediategoods case (1d). The concept of GDP in this expanded identity is more compre-hensive and larger in magnitude than in the conventional case.
2.2. Growth Accounting with Intangible Capital
The conventional SOG framework allocates the growth rate of output to theshare-weighted growth rates of the inputs plus a residual. Following Solow (1957),the SOG equation is derived from the conventional framework of equations (1a)–(1d) by logarithmic differentiation of (1d):
g t s t g t s t g ts t g t s t g t g
Q C C I I
L L K K A
′
′
( ) = ′ ( ) ( ) + ′( ) ( )= ′ ( ) ( ) + ′ ( ) ( ) + tt( ).
(1e)
The notation gX(t) is used to denote the rate of growth of the respective variables;for example, gQ′(t) thus denotes the growth rate of aggregate output (the Divisiaindex of the growth rates of consumption, gC(t), and investment, gI(t)), and gA′(t)denotes the growth rate of multifactor productivity (MFP) defined in the usualway. The output shares ′ ( ) = ( ) ( )[ ] ( ) ( ) + ( ) ( )[ ]s t P t C t P t C t P t I tC
C C I , etc, and inputshares ′ ( ) = ( ) ( )[ ] ( ) ( ) + ( ) ( )[ ]s t P t L t P t L t P t K tL
L L K , etc, are assumed to be equal tothe corresponding output elasticities. Intangible input and output play no role inthe formulation of this SOG equation.
When intangible capital is treated symmetrically with tangibles, the structure(2a)–(2d) governs the equations of growth, and the SOG model becomes:
g t s t g t s t g t s t g ts t g t s t g t
Q C C I I N N
L L K K
( ) = ( ) ( ) + ( ) ( ) + ( ) ( )= ( ) ( ) + ( ) (( ) + ( ) ( ) + ( )s t g t g tR R A ,
(2e)
6In this second formulation we expand the technology of the intangible producing sector to use theoutput that it produced in previous years (that is, to use its own stock of accumulated intangibles). Inother words, the knowledge investments of past years are allowed to be productive in producing currentand future knowledge. This allows investment to be aimed not just at direct product or processinnovation, but also at furthering the capability of the innovation process itself. Indeed, this is a keyaspect of the R&D process, because research is often done to further the research capability of R&Dresearchers. Moreover, some firms continue to do research even when a competitor has beat them to thepunch, in order to keep up with best practice and perhaps get out in front in the next round. This lineof reasoning does not fit well with the preceding formulation (1a)–(1d) in which the accumulated stockof past knowledge is treated as an intermediate input and omitted from the technology for producingknowledge.
Review of Income and Wealth, Series 55, Number 3, September 2009
© 2009 The AuthorsJournal compilation © International Association for Research in Income and Wealth 2009
665

where the output shares are now sC(t) = [PC(t)C(t)]/[PC(t)C(t) + PI(t)I(t) +PN(t)N(t)], etc., and the true input shares are sL(t) = [PL(t)L(t)]/[PL(t)L(t) +PK(t)K(t) + PR(t)R(t)], etc.
A comparison of (1e) and (2e) reveals that the alternative view of intangiblesinvolves more than the growth terms gN(t) and gR(t), and the associated shares, butalso requires a restatement of all shares. The shares are linked by the factor ofproportionality:
λ = +( ) + +( )p C p I p C p I p NC I C I N .(3)
The basic result is that labor’s share when intangibles are capitalized is smallerby this factor: s sL L= ′λ , and the income share of capital is thus larger. A similaranalysis applies to the rates of saving and consumption. Consumption shares withand without intangibles are related by the same proportionality factor as above,s sC C= ′λ . The consumption share is smaller and the rate of saving/investment iscorrespondingly higher. This result is relevant in view of the perception of a lowrate of saving in the U.S. economy, particularly because existing measures excludemuch of the investment in knowledge capital that is a defining feature of themodern U.S. economy. Finally, the residual estimates of multifactor productivityfrom (1e) and (2e), gA′(t) and gA(t), respectively, differ by the factor l when theeconomic system is in Golden Rule steady state growth, a result derived fromJorgenson (1966), but the bias due to ignoring intangible capital, gA(t) - gA′(t), hasa more complicated form in other cases.
2.3. The Criteria for Capitalizing Intangibles
The two approaches set out above give different structural representations ofthe same economy, and both cannot be simultaneously correct. Fortunately, stan-dard capital theory provides criteria for choosing one over the other. As discussedin CHS, capital theory implicitly defines capital in the context of an optimalconsumption plan based on the maximization of an intertemporal utility functionsubject to the usual constraints (Weitzman, 1976). The solution to this optimiza-tion problem determines the optimal path of consumption over time and thusconsumer saving behavior, which in turn determines the paths of investment andcapital. As discussed in Hulten (1979), the solution to this optimization problemhas an important implication for the treatment of intangible capital: any use ofresources that reduces current consumption in order to increase it in the futurequalifies as an investment. This result argues for symmetric treatment of all typesof capital and that business expenditures aimed at enhancing the value of a firmand improving its products, including human capital development as well as R&D,be accorded the same treatment as tangible capital in national accounting systems.
The symmetry between tangible and intangible capital is less apparent fromthe production side of the economy, which is perhaps one reason that intangibleshave traditionally not been counted as capital. Indeed, some have argued—particularly in the accounting world—that intangible assets often are producedwithin the firm that uses them, and the marketplace does not generate observableand verifiable data with which to estimate the value of current production,
Review of Income and Wealth, Series 55, Number 3, September 2009
© 2009 The AuthorsJournal compilation © International Association for Research in Income and Wealth 2009
666

designated as the flow PN(t)N(t) in the notation of this paper. A related problemarises because it is also difficult to separate PN(t)N(t) into separate price andquantity components; indeed, sometimes it is even difficult to define the units inwhich PN(t) and N(t) ought to be measured (for example, in what units shouldknowledge be denominated?).
The lack of verifiability per se does not automatically make intangibles anintermediate input. Some tangible assets are also produced internally (someconstruction projects, for example) and therefore do not pass through externalmarkets that generate verifiable transactions data. On the other hand, manyintangible assets are acquired through external markets (technology licenses,patents and copyrights, and the economic competencies acquired throughpurchases of management and consulting services). In any case, the real issue ofwhether intangibles should be classified as intermediates or as capital depends onthe economic character of the good, as per the preceding discussion, and not on theease with which PN(t)N(t) can be measured.
The non-rivalness of many types of intangible capital, such as R&D knowl-edge, implies that it can be employed by many users simultaneously withoutdiminishing the quantity available to any single user. In this situation, the balanceequations would be N = NN = NI = NC and R = RI = RC = RN. Moreover, each addi-tional unit of output produced would not need an additional “unit” of knowledge,suggesting that the marginal product of R is zero. While the marginal product ofR used in the direct production of output may indeed be zero, this is the wrongmargin to examine when a firm pays to increase its R and the increase improves theefficiency of its production or quality (and hence quantity) of its output. Inaddition, many types of intangible capital—such as brand equity and organiza-tional and human competencies—are not purely non-rival, but instead arefirm-specific and valuable, at least in part, because the firm is able to excludecompetitors from gaining access to key information and technology.
The non-appropriability of some intellectual property is a related aspect ofintangibles. The full benefits of R&D and worker training may not be captured bythe firm making the investment, and the measured prices PN(t) and PR(t) mayreflect only private benefits and costs.7 However, as before, the capitalization issuepivots on whether the provision of R increases future output and consumption, notwhether R is partly non-appropriable or non-rival, and these two features do notinvalidate the need to capitalize many intangible expenditures. That is determinedby whether or not the expenditure is intended to yield output in some future timeperiod. This is the conceptual analogue on the production side to the symmetrycriterion of whether the expenditure was made in order to increase future con-sumption. Many intangibles satisfy these criteria and must therefore be treated ascapital.
Symmetry in production does impose one important restriction on intangibleassets. To proceed as we have in the formulation of the equations (2a)–(2d), weassume that the same neoclassical investment rules that apply to tangible capital
7Any externalities due to unappropriated benefits from R&D or other investments appear as a shiftin the production function and are picked up in measured MFP (Hulten, 2001). This is essentially themechanism of endogenous growth theory when externalities arise from R&D (Romer, 1986) andeducation (Lucas, 1988).
Review of Income and Wealth, Series 55, Number 3, September 2009
© 2009 The AuthorsJournal compilation © International Association for Research in Income and Wealth 2009
667

also apply to intangibles: investment in tangibles is assumed to proceed up to thepoint that the present value of the stream of future user costs, PK(t + t) just equalsthe cost of acquiring a marginal unit of the investment good, PI(t). Applied tointangibles, this assumption implies that investment is made using marginalistprinciples. An alternative Schumpetarian view of the firm might reject this assump-tion, but we adopt the marginalist approach because our objective is to integrateintangible capital into the neoclassical sources-of-growth framework of equation(2e), which is based on marginalist principles.
2.4. Prices and Deflators
The SOG equations of the preceding section are computationally derivedfrom the accounting structure in equations (2a)–(2d) using price deflators toconvert nominal values into their real counterparts. As discussed above, a dif-ficult aspect of this computation is measuring the price deflator PN(t) needed toconvert estimates of expenditure PN(t)N(t) into real estimates. This has proved tobe one of the most difficult empirical issues in the study of R&D investment, inlarge part because of the verifiability and visibility issues described above. Thestrategy in the R&D literature has been to use input costs to proxy for PN(t); themost common approach has been to average a wage deflator and a price deflatorfor a broad measure of output on the grounds that R&D expenditures areroughly 50 percent labor costs and 50 percent supplies (Jaffe, 1972; Griliches,1984).
In contrast to this approach, we opt for a pure output deflator as a proxy forthe price of intangibles. Although we consider this proxy only a placeholder untilfurther research develops deflators for specific intangibles, we believe that a pricemeasure is preferred to a wage measure for the following reason. Under constantreturns to scale in the technology in (2a), the growth rate of the price of theintangible capital good is:
g t s t g t s t g t s t g t g tPN LN PL KN PK RN PR AN( ) = ( ) ( ) + ( ) ( ) + ( ) ( ) − ( ),(4)
where sLN(t) = [PL(t)LN(t)]/[PL(t)LN(t) + PK(t)KN(t) + PR(t)RN(t)] is labor’s incomeshare in the production of intangible investment, gPN is the growth rate of the priceof the intangible good, and the other share and growth rate terms are definedanalogously. Using the wage PL(t) as a proxy for PN(t) is equivalent to assumingthat the growth rate of the output price is gPN(t) is equal to the growth rate ofwages, gPL(t). As can be seen in equation (4), this will occur only if labor is the soleinput to the production of the intangible and if the rate of multifactor productivitygrowth in the production of intangibles, gAN(t), and the shares of tangible andintangible capital, sKN(t) and sRN(t), are all zero. These assumptions are extremelyimplausible, because, for example, R&D programs require plant and equipment,and knowledge builds on knowledge. Because using a wage deflator tends to givebiased results, we adopt the non-farm business output price deflator as a proxy forPN(t). This proxy can be rationalized by the fact that much R&D and coinvest-ments in marketing and human competencies are tied to specific product lines.Integrating the cost of productivity-enhancing investments back into the “using”
Review of Income and Wealth, Series 55, Number 3, September 2009
© 2009 The AuthorsJournal compilation © International Association for Research in Income and Wealth 2009
668

industries is accomplished generally by adopting the non-farm business outputprice as the deflator for intangibles.8
The search for an appropriate deflator for the user cost of intangibles, PR(t),also poses challenges. The corresponding user cost of tangible capital, PK(t), is notusually observed but can be imputed following Jorgenson (1963) and Hall andJorgenson (1967). When intangibles are ignored, the conventionally measuredrental flow, PK(t)K(t), is estimated by the residual income not attributable to labor,PC(t)C(t) + PI(t)I(t) - PL(t)L(t). This leads to an error because, when incomeaccrues to intangible capital, the conventionally measured residual term for capitalincome actually equals
P t C t P t I t P t L t P t K t P t R t P t N tC I L K R N( ) ( ) + ( ) ( ) − ( ) ( ) = ( ) ( ) + ( ) ( ) − ( ) ( )).(5)
The conventional practice of ignoring intangible capital thus leads, in general,to a biased estimate of the income accruing to tangible capital. There is, moreover,another subtle issue that arises because the total capital income on the right-handside of (5) is measured by the sum of all property-type income (interest, dividends,retained earnings, taxes, and depreciation). This list accounts for all the non-laborpayments accruing to both tangible and intangible capital, i.e. to PK(t)K(t) +PR(t)R(t), leaving no apparent role for the intangible investment, PN(t)N(t). As theright-hand side of equation (5) illustrates, the answer to this apparent contradic-tion is that the income accruing to intangible investments is reflected on the inputside as uncounted profits. Specifically, when intangibles are treated as an interme-diate input, the spending on intangibles is subtracted from revenue as an expense,reducing measured profits. On the other hand, when intangibles are treated as aninvestment, they are not subtracted from revenue in the period of purchase, andprofits are higher. Thus, the symmetric treatment of tangible and intangible capitalis not just about PN(t)N(t) as uncounted output, but also about PN(t)N(t) asuncounted income accruing to capital.
3. Estimates of Intangible Investment and Capital
3.1. Measuring Investment in Intangibles
In our earlier work, we developed estimates of a broad range of businessinvestments in intangibles in the 1990s. We first introduced basic categories ofintangibles and suggested specific types of intangible spending within eachcategory. We then estimated expenditures on each type of intangible and, based onavailable economic research and evidence, determined how much of each expen-diture type might be considered business investment according to the criterion ofwhether the expenditure could be deemed to yield future consumption.
The rationale for our choice of categories is discussed in some detail in ourprevious paper. We only note here that the choice was driven, in large part, by ourdesire to go beyond existing categories to develop a more comprehensive list. Ourfirst broad category, business investment in computerized information, is largely
8Martin Baily offered this rationale for the deflation of the output of management consultancies(see Triplett and Bosworth, 2004, p. 260).
Review of Income and Wealth, Series 55, Number 3, September 2009
© 2009 The AuthorsJournal compilation © International Association for Research in Income and Wealth 2009
669
composed of the NIPA series for business investment in computer software.9 Oursecond category, innovative property, includes the National Science Foundation(NSF) Industrial R&D series. However, the NSF’s survey is designed to captureinnovative activity built on a scientific base of knowledge and therefore does notfully capture resources devoted by businesses to innovation and new product/process R&D more broadly. This “other” R&D—we called it non-scientificR&D—includes the revenues of the non-scientific commercial R&D industry, asmeasured in the Census Bureau’s Services Annual Survey (SAS), the costs ofdeveloping new motion picture films and other forms of entertainment, invest-ments in new designs, and a crude estimate of the spending for new productdevelopment by financial services and insurance firms.10 We found that, by the late1990s, investment in non-scientific R&D was as large as investment in scientificR&D.
Our third general category includes investment in what we have called“economic competencies.” This includes spending on strategic planning, spendingon redesigning or reconfiguring existing products in existing markets, investmentsto retain or gain market share, and investments in brand names. Expenditures foradvertising are a large part of the investments in brand equity, but as stressed inour earlier work, not all spending on intangibles should be counted as capitalspending. Based on results from the empirical literature on advertising, we esti-mated that only about 60 percent of total advertising expenditures were for adsthat had long-lasting effects (that is, effects that last more than one year comparedwith ads for, say, “this week’s sale”).
Investment in firm-specific human and structural resources is the second typeof economic competency included in our estimates. It includes the costs ofemployer-provided worker training and an estimate of management time devotedto enhancing the productivity of the firm. Our estimates of the former are based onBureau of Labor Statistics (BLS) surveys; the latter are based on SAS revenues forthe management consultant industry and trends in the cost and number of personsemployed in executive occupations. Without doubt, these spending flows areimprecisely estimated, but business investments in firm-specific human and struc-tural resources through strategic planning, adaptation, reorganization, andemployee-skill building are important drivers of innovation and profitability inindustry and require treatment as investment to be consistent with capital theory.11
Moreover, this last category is, by our reckoning, the largest type of businessintangible investment. And, total investment in economic competencies is nearly aslarge as the investment in the other two major categories combined.
9The NIPA software series is conceptually consistent with our intertemporal criterion for definingcapital because the software measure includes both purchased and own-account components. Nationalaccountants estimated the own-account component indirectly to overcome the verifiability issuediscussed earlier (Parker and Grimm, 1999).
10Many new products in the financial services industry involve computerized information; to avoiddouble-counting (particularly with the own-account portion of computer software), we deliberatelywere very conservative in our estimates for this component.
11Moreover, the microdata evidence of Abowd et al. (2005) suggests that firm-level differences inorganizational practices (proxied by firm-level distributions of human capital) are strongly related tooutcomes such as revenue per worker and market valuation. A similar conclusion is reached by Bloomand Van Reenen (2007), who find that a firm’s productivity, profitability, and market value (relative tothe book value of its tangible capital) are all strongly related to an index of management effectiveness.
Review of Income and Wealth, Series 55, Number 3, September 2009
© 2009 The AuthorsJournal compilation © International Association for Research in Income and Wealth 2009
670

Two other facts emerged from our earlier work. First, total investment inintangibles grew more rapidly than investment in tangibles over the decade ofthe 1990s, although the levels of the two were nearly equal in magnitude for thedecade as a whole. Second, investment in the categories of intangibles alreadyincluded in the NIPAs was only a fraction of our estimated total, even if allscientific R&D were included. Together, these findings suggest that a longer timeseries on the growth of intangible business investment would indicate a strongdynamic role for intangibles in explaining economic growth and might signifi-cantly affect our understanding of the sources of growth of the U.S. non-farmbusiness sector.
Table 1 reports our new estimates of business investment in the intangiblesby decade, starting in 1950. In general, the estimates were derived using the samemethods and sources as used in our earlier paper. Most of the needed sourcedata begin at least by the late 1940s, and the series for spending on scientific
TABLE 1
Business Investment in Intangibles (billions of dollars, annual average for period shown)
1950–59 1960–69 1970–79 1980–89 1990–99 2000–03(1) (2) (3) (4) (5) (6)
1. Total CHS intangibles 19.4 41.9 103.4 349.3 749.8 1,226.22. Computerized information
(mainly computer software)– 0.8 4.5 23.2 85.3 172.5
3. Innovative property(a) Scientific R&D 7.7 16.9 34.0 104.6 157.7 230.5(b) Non-scientific R&D 0.5 1.7 10.9 58.4 145.2 237.2
4. Economic competencies(a) Brand equity 5.3 9.5 18.2 54.4 105.7 160.8(b) Firm-specific resources 5.9 13.0 35.7 108.7 255.9 425.1
Related series1
5. Computer software, NIPAs – 0.7 4.5 22.7 83.6 169.66. Industrial R&D, NSF2 5.2 14.1 25.3 75.8 136.9 196.07. Advertising, Coen report 8.6 15.0 30.6 89.6 165.0 240.38. Business fixed investment,
NIPAs38.2 71.5 188.4 485.7 807.1 1,141.9
8a. Tangibles 35.6 67.3 171.4 421.1 676.5 893.48b. Intangibles3 2.5 4.2 17.0 64.6 130.7 248.5
Memo:9. CHS intangibles, ratio to
NIPA tangibles0.54 0.62 0.60 0.82 1.10 1.36
10. New CHS intangibles4 16.9 37.7 86.3 284.7 619.2 977.711. Non-farm business output,
ratio of existing to adjustedfor new CHS intangibles (l)
0.95 0.94 0.94 0.92 0.90 0.89
Notes: All figures for investments in intangibles are derived using the sources and methodsdescribed in CHS, based on a one-year service life cutoff.
1Sources indicated are as follows: NIPAs, the U.S. National Income and Product Accounts; NSF,the National Science Foundation; and Coen report, advertising data developed by Bob Coen forUniversal-McCann.
2Prior to 1953, the industrial R&D estimates are from N. Terleckyj (1963).3Includes computer software, mineral exploration, and architectural and design services embedded
in structures and equipment purchases.4Intangibles not recognized as capital in the NIPAs.
Review of Income and Wealth, Series 55, Number 3, September 2009
© 2009 The AuthorsJournal compilation © International Association for Research in Income and Wealth 2009
671

R&D and on brand equity begin much earlier. However, for a few componentswe could not use the same sources for earlier periods, and the components wereextrapolated backward in time using related series. This occurred most promi-nently for the series based on SAS data, which are not available prior to themid-1980s. All SAS series were extrapolated back to the late 1940s using arelated aggregate in the BEA’s gross product by industry system.12
For employer-provided training we made some changes to the estimates forrecent years and made some special adjustments to estimates for earlier years. Inour earlier work, we used trends in wage costs and the industrial structure of theworkforce to extrapolate the results of surveys conducted by the BLS in themid-1990s. For this paper, we improved our extrapolations for more recent yearsby linking them to estimates from surveys that have been conducted by theAmerican Society for Training and Development (ASTD) since 1997.13 These newresults suggest a slight pullback in firms’ per-employee expenditure on training in2002, perhaps reflecting the cyclical episode in 2001. We know of no similarsurvey-based data for business outlays on employer-provided training in earlierperiods.
The studies that established the link between training and productivity at thefirm level (Bartel, 1991, 1994) used data for earlier years (the mid-1980s), but thetraining measures were qualitative indicators, not actual figures on the amountfirms invested in their employees (see also Black and Lynch (1996), whose datawere for the early 1990s). The BLS surveys and the more recent ASTD data suggestthat per-employee rates of spending on (formal) training increases with the size ofthe firm.14 The BLS surveys also show that employees in professional and mana-gerial occupations receive the most training (in terms of hours).15 With the growthof the modern corporation and a rough doubling of the ratio of employees inprofessional and managerial occupations in the total workforce since the late1960s, the incidence of employer-provided training likely has also increased by anotable, albeit unknown, amount.16 Because an extension of the methods used inour earlier work would not build in an increase in incidence (except indirectlythrough its impact on the distribution of wage costs by industry), we boosted thetrend in training implied by an extension of our earlier work by a small amount(less than 2 percent per year) between 1948 and 1988.
12Specifically, the rate of change in value added in miscellaneous professional services was used toextend the series for R&D in the social sciences and humanities, market research services, and man-agement consulting services from 1985 back to 1947.
13See www.astd.org or Bassi et al. (2001) for further information.14See table 1 in the employer survey at www.bls.gov/ept. Only 69 percent of small establishments
(fewer than 50 employees) provided formal training in 1995 compared with nearly all medium-sized(50–249 employees) and large (250 or more employees) establishments.
15Employees in professional and paraprofessional occupations received essentially twice thenumber of hours of formal and informal training as those in other occupational groups, with trainingmost prevalent for computer, professional and technical, and management skills. See tables 1 and 6 inthe employee survey at www.bls.gov/ept.
16The reported increase in the ratio of professional and managerial occupations in the workforceis based on data from BLS’s Current Population Survey (CPS). Nakamura (2001) presents anddiscusses the increase in this ratio from 1982 to 2000. We developed similar estimates using more limitedCPS occupational categories that extend back to 1967.
Review of Income and Wealth, Series 55, Number 3, September 2009
© 2009 The AuthorsJournal compilation © International Association for Research in Income and Wealth 2009
672
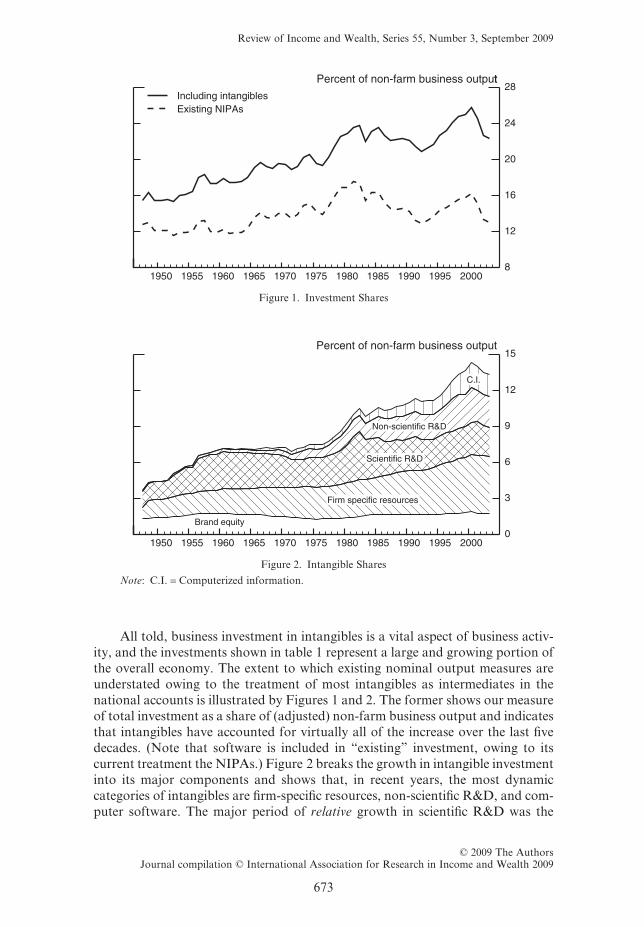
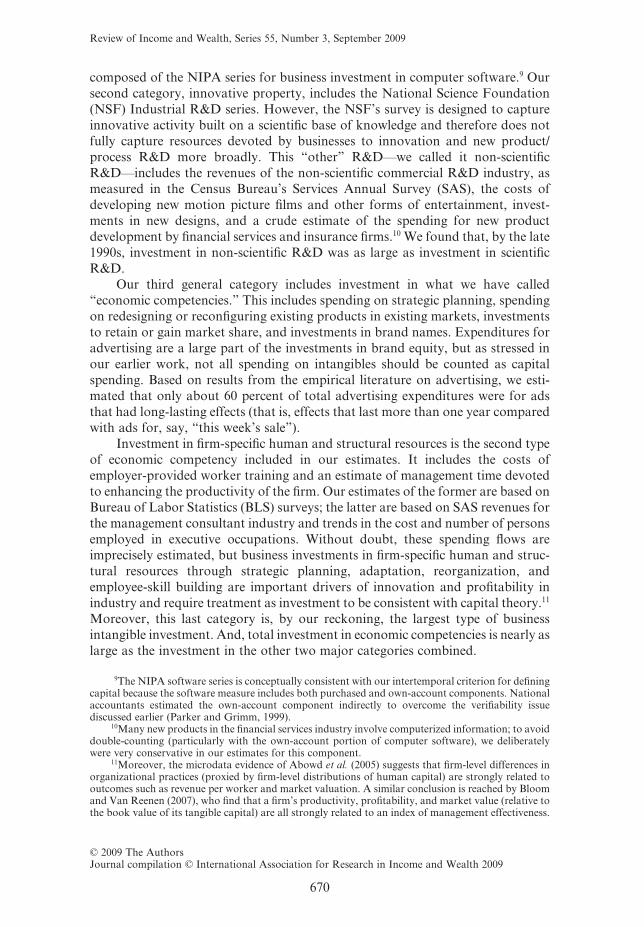
All told, business investment in intangibles is a vital aspect of business activ-ity, and the investments shown in table 1 represent a large and growing portion ofthe overall economy. The extent to which existing nominal output measures areunderstated owing to the treatment of most intangibles as intermediates in thenational accounts is illustrated by Figures 1 and 2. The former shows our measureof total investment as a share of (adjusted) non-farm business output and indicatesthat intangibles have accounted for virtually all of the increase over the last fivedecades. (Note that software is included in “existing” investment, owing to itscurrent treatment the NIPAs.) Figure 2 breaks the growth in intangible investmentinto its major components and shows that, in recent years, the most dynamiccategories of intangibles are firm-specific resources, non-scientific R&D, and com-puter software. The major period of relative growth in scientific R&D was the
Percent of non-farm business output
Figure 1. Investment Shares
Percent of non-farm business output
Non-scientific R&D
Figure 2. Intangible Shares
Note: C.I. = Computerized information.
Review of Income and Wealth, Series 55, Number 3, September 2009
© 2009 The AuthorsJournal compilation © International Association for Research in Income and Wealth 2009
673

1950s.17 Figure 2 also shows the relative importance of investment in economiccompetencies as a share of the total investment.
The last four rows of Table 1 present data on related series as a basis forfurther comparisons. The most interesting is perhaps the last row, which presentsour estimates of the parameter l from our equation (3). This parameter is the ratioof output with and without unrecognized intangibles. When non-farm businessoutput is adjusted to include our estimates of the unrecognized intangibles, theadjusted output is 12 percent (1/l - 1, expressed as a percent) higher than theexisting measure in the 2000–03 period. Fifty years ago, the adjusted measure wasonly about 5 percent higher.
3.2. Real Intangible Investment and Capital Stocks
The ultimate objective is to estimate the SOG equation (2e). In order to dothis, estimates of the real investment in intangibles are necessary, as are thecorresponding stocks of capital. Real investment for each new category of intan-gibles was obtained by deflating the nominal investment estimates of the precedingsection by the non-farm business output deflator.18 As noted in Section 2, webelieve this deflator is a plausible placeholder until further research permits bettermeasures. The NIPA price index for software is retained and used for that categoryof intangibles.
To obtain intangible capital stocks, we start with our estimates of real invest-ment series N(t) and apply the capital accumulation identity of Section II,R(t) = N(t) + (1 - dR)R(t - 1).19 Two further elements beyond N(t) are needed toimplement the identity: a depreciation rate, d, and a capital benchmark, R(0), foreach intangible asset.
Relatively little is known about depreciation rates for intangibles. Based onthe limited information available, we made the following assumptions aboutdepreciation rates:
Category Depreciation Rate (percent)
Computerized information (other than software) 33R&D, scientific 20R&D, non-scientific 20Brand equity 60Firm-specific resources 40
17Scientific R&D also bulged in the 1979–82 period, but this bulge is accounted for by a jump inmineral exploration, which we include in scientific R&D along with the NSF’s Industrial R&D series.Expenditures on oil and gas well drilling and mining, the dominant component of mineral exploration,are already capitalized in the NIPAs.
18The non-farm business output deflator begins in 1948. To deflate nominal investment data thatbegin earlier (scientific R&D and brand equity, for example), the non-farm business output deflator islinked to the GDP deflator.
19Note that we are assuming that R&D investment becomes productive as soon as it is put in place;that is, we are assuming a gestation lag of zero. In contrast, Fraumeni and Okubo (2005) assumed aone-year gestation lag. We maintained a gestation lag of zero to avoid the complication of differentgestation lags for different assets as is done in much of the growth accounting literature. Hopefully,future research will shed further light on this issue.
Review of Income and Wealth, Series 55, Number 3, September 2009
© 2009 The AuthorsJournal compilation © International Association for Research in Income and Wealth 2009
674

For computerized information, our estimate is based on the BEA’s assump-tions for own-account software (depreciation rate of 33 percent, five-year servicelife). Our estimate of the depreciation rate of R&D capital (20 percent) is in themiddle of the range of the rates reported in the existing literature on R&D. ForR&D, Bernstein and Mamuneas (2006) find that the depreciation rate in theUnited States is 18 percent. Nadiri and Prucha (1996) obtain a figure of 12 percent.Pakes and Schankerman (1978), using data for several European countries, obtainan average rate of 25 percent; in a later paper (Pakes and Schankerman, 1986),they estimate a range of 11–26 percent.20 For advertising, the empirical literaturefinds the effects of ads to be relatively short-lived (as noted earlier) but reportsa wide range of findings on the longevity of advertising capital; our own inter-pretation of this literature is that advertising capital depreciates by 60 percentper year.21
For firm-specific resources, we averaged the rates for brand equity and R&D.As just described, the firm-specific resources category has two components. On theone hand, the discernible and direct link between employer-provided training andfirm-level productivity suggests that investments in this component are long-lasting. On the other hand, investments through strategic planning and reorgani-zation reflect the need of business to constantly adapt to changing economicconditions. While such investments undoubtedly have a long-lasting “learning-by-doing” dimension (similar to that in R&D), we believe they also have a short-lived“organizational forgetting” dimension (similar to that in advertising).
For each asset, the initial capital stock was set to zero in the year shownbelow.
Category Year Initial Stock Set to Zero
Computerized information 1958R&D, scientific 1928R&D, non-scientific 1945Brand equity 1928Firm-specific resources 1946
The assumption that initial capital stocks are zero (rather than an unknownpositive value) has little effect on our growth accounting analysis because all of thedepreciation rates are relatively high and the true value of the benchmark will havedepreciated away by the date that we start our growth accounting analysis (1973).
Table 2 shows our estimate of the nominal intangible capital stock in 2003 (inbillions of dollars) and the annual average growth rate of real intangible capital
20The 33 percent figure is the double-declining balance rate for BEA’s assumed service life of fiveyears for own-account software, calculated as 1.65/5. This ratio was originally developed by Hulten andWykoff (1981).
21We concluded that advertising had a service life of less than 3 years based on work by Landes andRosenfield (1994) who estimated implied annual geometric rates of decay of advertising for 20 two-digitSIC industries covering manufacturing and many services. The Landes–Rosenfield findings alsogenerated our conclusions on the amount of advertising that should be expensed (about 40 percent;see footnote 21 in CHS). The literature is not settled on these issues. Some find that all (Comanor andWilson, 1974) or a higher fraction (Hall, 1993) of advertising expenditures should be expensed, whileothers suggest that little or no expensing is appropriate (Lev, 2001). Yet another econometric studyfound the durability of advertising capital to be as high as 7 years (Ayanian, 1983).
Review of Income and Wealth, Series 55, Number 3, September 2009
© 2009 The AuthorsJournal compilation © International Association for Research in Income and Wealth 2009
675
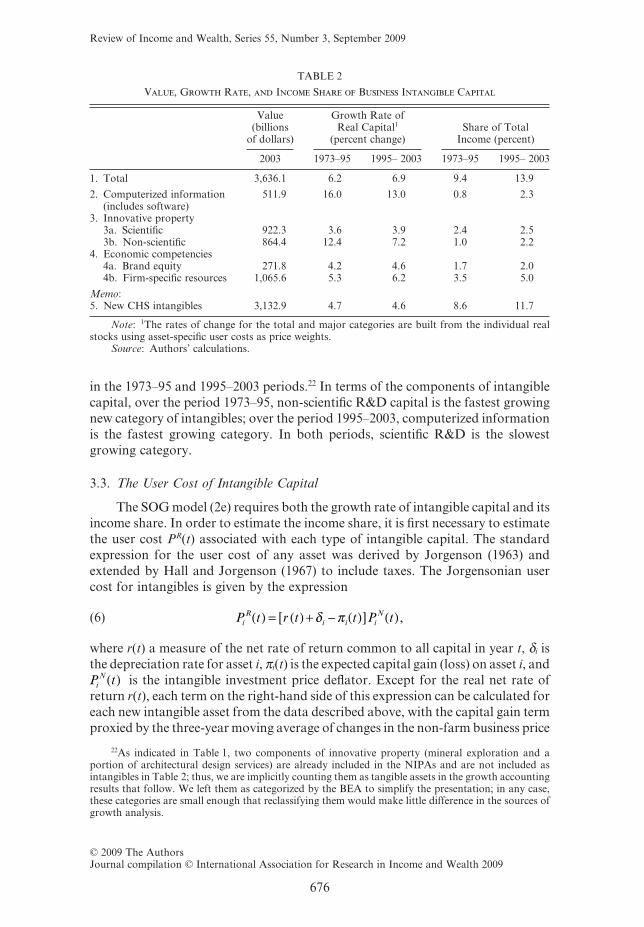
in the 1973–95 and 1995–2003 periods.22 In terms of the components of intangiblecapital, over the period 1973–95, non-scientific R&D capital is the fastest growingnew category of intangibles; over the period 1995–2003, computerized informationis the fastest growing category. In both periods, scientific R&D is the slowestgrowing category.
3.3. The User Cost of Intangible Capital
The SOG model (2e) requires both the growth rate of intangible capital and itsincome share. In order to estimate the income share, it is first necessary to estimatethe user cost PR(t) associated with each type of intangible capital. The standardexpression for the user cost of any asset was derived by Jorgenson (1963) andextended by Hall and Jorgenson (1967) to include taxes. The Jorgensonian usercost for intangibles is given by the expression
P t r t t P tiR
i i iN( ) = ( ) + − ( )[ ] ( )δ π ,(6)
where r(t) a measure of the net rate of return common to all capital in year t, di isthe depreciation rate for asset i, pi(t) is the expected capital gain (loss) on asset i, andP ti
N( ) is the intangible investment price deflator. Except for the real net rate ofreturn r(t), each term on the right-hand side of this expression can be calculated foreach new intangible asset from the data described above, with the capital gain termproxied by the three-year moving average of changes in the non-farm business price
22As indicated in Table 1, two components of innovative property (mineral exploration and aportion of architectural design services) are already included in the NIPAs and are not included asintangibles in Table 2; thus, we are implicitly counting them as tangible assets in the growth accountingresults that follow. We left them as categorized by the BEA to simplify the presentation; in any case,these categories are small enough that reclassifying them would make little difference in the sources ofgrowth analysis.
TABLE 2
Value, Growth Rate, and Income Share of Business Intangible Capital
Value(billions
of dollars)
Growth Rate ofReal Capital1
(percent change)Share of Total
Income (percent)
2003 1973–95 1995– 2003 1973–95 1995– 2003
1. Total 3,636.1 6.2 6.9 9.4 13.9
2. Computerized information(includes software)
511.9 16.0 13.0 0.8 2.3
3. Innovative property3a. Scientific 922.3 3.6 3.9 2.4 2.53b. Non-scientific 864.4 12.4 7.2 1.0 2.2
4. Economic competencies4a. Brand equity 271.8 4.2 4.6 1.7 2.04b. Firm-specific resources 1,065.6 5.3 6.2 3.5 5.0
Memo:5. New CHS intangibles 3,132.9 4.7 4.6 8.6 11.7
Note: 1The rates of change for the total and major categories are built from the individual realstocks using asset-specific user costs as price weights.
Source: Authors’ calculations.
Review of Income and Wealth, Series 55, Number 3, September 2009
© 2009 The AuthorsJournal compilation © International Association for Research in Income and Wealth 2009
676

deflator. We include the usual Hall–Jorgenson tax terms in our actual calculationsalthough they are not shown in (6) for simplicity of exposition. We estimate the netrate of return r(t) using the procedure developed in Jorgenson and Griliches (1967)that solves for the common value of r(t) in each year that causes the accountingidentity in equation (5) to hold for all types of capital, intangible and tangible.23
3.4. Output Measures and Income Shares
The next link in completing the data needed for the SOG equation (2e) is theestimation of output and the associated income shares. Following equation (2d),nominal output in the non-farm business sector is the sum of our estimates ofcurrent dollar intangible investment, PN(t)N(t), and deliveries of consumptionand tangible investment to final demand, PC(t)C(t) + PI(t)I(t). The income sharesfollow immediately by dividing each element on the right-hand side of (2d),PL(t)L(t), PK(t)K(t), and PR(t)R(t), by the value of output. These shares are shownin the last column of Table 2 for the periods 1973–95 and 1995–2003.
To highlight how the accounting differs when intangibles are counted asinvestment, Table 3 shows the elements of the income identity PQ(t)Q(t) =PL(t)L(t) + PK(t)K(t) + PR(t)R(t), along with the associated shares. As can be seenin the memo items, including all intangibles lowers the labor share of income fromabout 70 percent to 60 percent and raises the capital share (the sum of lines 12 and13) from about 30 percent to 40 percent. Note that intangibles account for 37.5percent of all capital income (line 13 as a share of line 12 plus line 13).
The full time series of the new labor share is provided in Figure 3. Thelowering of the labor share is one of the more startling results of the “new view” ofintangibles. Not only is labor’s share significantly lower when all intangibles arecapitalized, the “new” share is no longer constant (as it appeared to be beforesoftware was capitalized). Rather, the new share trends downward over the pastfive decades, particularly since 1980. The growing wedge between the old and newviews of labor’s share reflects the fact that an increasing fraction of capital incomehas been associated with intangibles.24
To obtain an index of real output growth including the new intangibles, weaggregate the existing real non-farm business output and the real investment seriesfor each of the new categories of intangible assets, N ti( ), using a Divisia index
23It is worth emphasizing that the Jorgenson–Griliches procedure for estimating the rate of returnresults in a common rate of return to both tangibles and intangibles. This assumes that businessesarbitrage their investments across all types of capital, investing in each type until the rate of return forall assets is equal. While this assumption about investment may be disputed by Schumpeterians, webelieve that it is the logical starting point for incorporating intangibles into the sources-of-growthanalysis because it treats intangibles symmetrically with the way tangibles are treated in the existingSOG literature. In particular, it is symmetric with the way the official SOG estimates are constructedby the BLS. We also note that we developed these estimates in March 2005, and at that time the BLSdata only extended through 2002. Following Oliner and Sichel, we use a regression equation to projectr(t) for 2003; explanatory variables include two lags of r(t), inflation in the non-farm business sector, theacceleration of real output in the non-farm business sector, the unemployment rate, and the profitshare.
24This income appears in the first column of Table 3 (and on the income statements of companiesin the economy) as retained earnings. Additions to retained earnings translate into a long-run increasein national wealth as corporate share values increase. To the individual investor, it appears as anincrease in personal wealth from stocks, pensions, insurance, etc.
Review of Income and Wealth, Series 55, Number 3, September 2009
© 2009 The AuthorsJournal compilation © International Association for Research in Income and Wealth 2009
677

TABLE 3
Value of Output and Inputs, Non-Farm Business Sector, 2000–03(annual average, billions of dollars)
Conventional, WithoutIntangibles
Equation (1d)
This Paper, WithIntangibles
Equation (2d)
1. Conventional nominal output (PC C + PI I) 7,670 7,6702. + Intangible investment (PN N) 0 1,2063. = Nominal output 7,670 8,8764. - Indirect business taxes1 736 7365. - Statistical discrepancy -52 -526. = Total income 6,986 8,192
7. Total income 6,986 8,1928. = Labor compensation (PLL) 4,915 4,9159. + Income accruing to tangible capital (PK K)2 2,071 2,046
10. + Income accruing to intangible capital (PR R) 0 1,231
Memo: Shares out of total income (percent)11. Labor compensation (8)/(7) 70.4 60.012. Tangible capital (9)/(7) 29.6 25.013. Intangible capital (10)/(7) 15.0
Notes: The figures in this table are consistent with those used by the BLS in putting together itsmultifactor productivity estimates for the non-farm business sector. The figures in the first column,however, exclude software, and thus nominal output (line 3) and total income (line 7) are lower byNIPA estimates for software spending by non-farm businesses.
1Estimates of indirect business taxes for the non-farm business sector (now known as taxes onproduction and imports) were inferred, given figures for lines 3, 5, and 6.
2The figure for income accruing to tangible capital in the second column differs from that in thefirst column because the net rate of return—the term r(t) in equation (6)—changes slightly whenintangibles are included.
Percent of total income, non-farm business sector
Figure 3. Labor Share
Source: Authors’ calculations.
Review of Income and Wealth, Series 55, Number 3, September 2009
© 2009 The AuthorsJournal compilation © International Association for Research in Income and Wealth 2009
678

procedure.25 The result is the growth rate of output gQ(t) = sC(t)gC(t) +sI(t)gI(t) + SisNi(t)gNi(t). This is the final data series needed to complete the SOGanalysis.
4. Growth Accounting Results
The estimates of Section 3 provide the elements needed to construct growthaccounts with intangibles. We can then compare the SOG models with andwithout intangibles (equations (1e) and (2e) of Section 2). The SOG results areshown in Table 4 for two periods, 1973–95 and 1995–2003, which were selected inorder to analyze the role played by intangible investments in the productivitypickup that is usually dated from 1995 in the recent SOG literature.26
The top panel in Table 4 presents the growth accounts based on equation(1e), the SOG without any intangibles.27 These results are based on BLS estimates
25Because nominal business investment for each of the new intangible assets is deflated with thenon-farm business deflator, Divisia aggregation and fixed-weight (or simple sum) aggregation yieldthe same series for real non-farm business output including business investment in intangible assets.
26The figures here follow the methodology described above, which also coincides with that used bythe BLS to produce their estimates of multifactor productivity growth. For a description of theirmethodology, see BLS (1983).
27The figures in Table 4 and throughout the paper are consistent with the 2004 annual revision ofthe NIPAs.
TABLE 4
Annual Change in Labor Productivity, Non-farm Business Sector
1973–95 1995–2003Memo:Accel.2
Published data, excluding software1. Labor productivity (percent)1 1.36 2.78 1.42
Contribution of components:2
2. Capital deepening 0.60 0.98 0.383. IT equipment 0.33 0.70 0.374. Other tangible capital 0.27 0.28 0.01
5. Labor composition 0.28 0.38 0.106. Multifactor productivity 0.48 1.42 0.94
Published data, including business investment in intangibles1. Labor productivity (percent)1 1.63 3.09 1.45
Contribution of components:2
2. Capital deepening 0.97 1.68 0.713. Tangibles 0.55 0.85 0.30
4. IT equipment 0.30 0.60 0.305. Other3 0.25 0.24 -0.01
6. Intangibles 0.43 0.84 0.417. Software 0.12 0.27 0.158. Other (new CHS) 0.31 0.57 0.26
10. Labor composition 0.25 0.33 0.0811. Multifactor productivity 0.41 1.08 0.67
Notes:1Output per hour of all persons.2Percentage points. Components may not sum to totals because of independent rounding.3Includes mineral exploration and the architectural and design services embedded in equipment
purchases.
Review of Income and Wealth, Series 55, Number 3, September 2009
© 2009 The AuthorsJournal compilation © International Association for Research in Income and Wealth 2009
679

of the growth of labor productivity in the non-farm business sector, from whichwe have excluded software.28 The estimates provide the baseline for comparisonwith SOG estimates based on equation (2e) with intangibles, shown in the bottompanel of Table 4. A number of conclusions can be drawn from a comparison ofthe two panels. First, it is apparent that the capitalization of intangibles increasesthe rate of growth of output per hour in both the 1973–95 and 1995–2003 periods.Interestingly, the increase in growth rates relative to the baseline is largest in theearlier period (20 percent) compared with the second (11 percent). However, it isworth noting that the second period covers both the technology boom and thesubsequent technology bust. Estimates that refer only to the 1995–2000 periodwould show a greater influence of intangible investments on labor productivitygrowth. The dependence of growth accounting estimates on the period of analysis,and particularly on the endpoints, is a well-known characteristic of this type ofanalysis.
Second, the relative importance of the factors “explaining” growth changessignificantly when intangibles are introduced. In the first period, the portion oftop-line growth explained by intangibles goes from 0 percent in the top panel(by definition) to 26 percent with them, and the corresponding numbers for the1995–2003 period are 0 percent and 27 percent, respectively. Moreover, intangiblesmoved up to parity with tangible capital in its importance as a source of growthduring the second period. Put another way, capital plays a larger role in account-ing for labor productivity growth once intangibles are included. In the earlierperiod, capital accounted for 59 percent of labor productivity growth when intan-gibles are included, but only 44 percent when they are excluded. In the latterperiod, the difference is even greater, with capital accounting for 54 percent ofgrowth when intangibles are included but only 35 percent when they are excluded.
Third, a comparison of MFP growth rates reveals that this source of growthdeclines both in absolute and relative importance when intangibles are included asinvestment. This is most pronounced for the second period, during which theaverage annual growth rate of MFP drops from 1.42 percentage points under the“old” view to 1.08 percentage points when intangible investments are included inthe analysis. Expressed as a fraction of the rate of growth in output per hour, MFPdeclines in importance from 51 percent to 35 percent. This result is not particularlysurprising in light of Jorgenson and Griliches (1967) and in view of the fact thatMFP is measured as a residual.
Fourth, one thing that cannot be claimed for the “new” view is that intan-gibles affected the size of the mid-1990s pickup in labor productivity itself. Thethird column in both panels shows the percentage-point acceleration in each SOGfactor between the two periods. It is apparent that the size of the acceleration inlabor productivity in percentage points was virtually the same in both panels.
Fifth, the source of the mid-1990s acceleration in labor productivity doeschange when intangibles are included. In the top panel, the acceleration in MFP
28The items listed under the heading “Contribution of Components” are the growth rate of eachinput weighted by the corresponding income share. In moving from one formulation to the other, wemake appropriate adjustments to the income shares. We should note that we prepared these estimatesin March 2005, at which time BLS’s published estimates extended through 2002. We estimated the year2003 using procedures developed in Oliner and Sichel (2000, 2002).
Review of Income and Wealth, Series 55, Number 3, September 2009
© 2009 The AuthorsJournal compilation © International Association for Research in Income and Wealth 2009
680

accounts for two-thirds of the total pickup when intangibles are excluded, butaccounts for less than half in the bottom panel when intangibles are included.Correspondingly, the role of capital in the acceleration of labor productivity isconsiderably larger when intangibles are included.
In sum, the results shown in Table 4 strongly suggest that intangibles matternot just for national income and wealth accounting, but for growth accounting aswell. Indeed, our estimates, rough as they may be, imply that the traditionalpractice of expensing intangibles results in a seriously distorted picture of thesources of growth.
Table 5 continues the SOG of Table 4 by disaggregating line 6 of that table’slower panel into the separate components shown in Table 1. It is probably notsurprising that computerized information (software) is an important factor drivingthe growth of the total intangible variable in Table 4, but it is perhaps moresurprising that firm-specific resources are found to be of equal importance. Therather small role of scientific R&D also is surprising in light of the attention thatR&D has been given in the literature on innovation. Scientific R&D accounts foronly a modest portion of total intangible capital deepening and is markedly lessimportant than investment in software.29 It is also worth noting that the non-traditional types of intangibles highlighted in this paper—non-scientific R&D,brand equity, and firm-specific resources—together account for nearly 60 percentof total intangible capital deepening since 1995. Because software is already capi-talized in the NIPAs, and scientific R&D will probably be sometime over the nextdecade, our results suggest that growth accountants should not lose sight of theseother forms of intangible capital.
This paper highlights the importance of intangibles as a source of economicgrowth. However, because software is already included in published growth
29This result hinges, at least in part, on our assumption that the non-farm business output price isan appropriate deflator for scientific R&D. If we followed the R&D literature and used a deflator witha wage component, the result that scientific R&D played a relatively small role in accounting for recentU.S. economic growth would be, if anything, stronger. On the other hand, if the deflator for ITinvestment were used instead (as suggested by Mairesse and Kosoglu, 2005), we would find thatscientific R&D played a more important role.
TABLE 5
Contribution of Intangible Capital Deepening to the AnnualChange in Labor Productivity, Non-Farm Business Sector
(percentage points)
1973–95 1995–2003Memo:Accel.
(1) (2) (3)
1. Intangible capital deepening 0.43 0.84 0.412. Computerized information 0.12 0.27 0.153. Innovative property 0.13 0.22 0.09
3a. Scientific 0.05 0.08 0.033b. Non-scientific 0.08 0.14 0.06
4. Economic competencies 0.17 0.35 0.184a. Brand equity 0.04 0.08 0.044b. Firm-specific resources 0.13 0.27 0.14
Note: Components may not sum to totals because of indepen-dent rounding.
Review of Income and Wealth, Series 55, Number 3, September 2009
© 2009 The AuthorsJournal compilation © International Association for Research in Income and Wealth 2009
681

accounts, another question is relevant: how much impact would the capitalizationof the other intangibles have on published growth rates? Table 6 addresses thisquestion by showing estimates for the non-farm business sector, including soft-ware but not the other intangibles, for periods shown in Tables 4 and 5. A com-parison of the top-line result in Table 6 with the corresponding estimate on line 1in the lower panel of Table 4 indicates that the growth rate of output per hour isnot greatly increased by the inclusion of the other intangibles from 1995–2003(2.95 percent versus 3.09 percent). However, the composition of the sources ofgrowth is affected, with a significantly greater role for capital deepening with thefull accounting for intangibles and a proportionately smaller role for MFP. Again,the capitalization of intangibles matters for the understanding of U.S. economicgrowth.
5. Conclusion
The rapid expansion and application of technological knowledge in its manyforms (research and development, capital-embodied technical change, humancompetency, and the associated firm-specific co-investments) are key features ofrecent U.S. economic growth. Accounting practice traditionally excludes theintangibles component of this knowledge capital and, according to our estimates,excludes approximately $1 trillion from conventionally measured non-farm busi-ness sector output by the late 1990s and understates the business capital stock by$3.6 trillion. The current practice also overstates labor’s share of income by asignificant amount and masks a downward trend in that share. Our results alsosuggest that the inclusion of intangibles both as an input and as an output can havea large impact on our understanding of economic growth. We have found that theinclusion of intangible investment in the real output of the non-farm businesssector increases the estimated growth rate of output per hour by 10–20 percentrelative to the baseline case which completely ignores intangibles. Thus, the
TABLE 6
Annual Change in Labor Productivity, Non-Farm BusinessSector
1973–95 1995–2003Memo:Accel.2
1. Labor productivity (percent)1 1.47 2.95 1.48Contribution of components:2
2. Capital deepening 0.73 1.26 0.533. IT equipment and software 0.46 0.99 0.534. Other equip. and structures 0.27 0.27 0.00
5. Labor composition 0.27 0.37 0.106. Multifactor productivity 0.47 1.32 0.85
Notes:1Output per hour of all persons.2Percentage points. Components may not sum to totals because
of independent rounding.Source: Unpublished update to Oliner and Sichel (2000, 2002)
based on data from Bureau of Labor Statistics, Multifactor Produc-tivity Trends, 2002 (2004).
Review of Income and Wealth, Series 55, Number 3, September 2009
© 2009 The AuthorsJournal compilation © International Association for Research in Income and Wealth 2009
682

inclusion of intangibles matters for labor productivity growth rates, although ithas little effect on the acceleration of productivity in the 1990s. On the input side,intangibles reached parity with tangible capital as a source of growth after 1995,and when the two are combined, capital deepening supplants MFP as the principalsource of growth. Moreover, the majority of the contribution of intangibles comesfrom the non-traditional categories of intangibles identified in this paper.
It is also worth noting that the fraction of output growth per hour attributableto the old “bricks and mortar” forms of capital investment (labeled “other tan-gible” capital in the lower panel of Table 4) is very small, accounting for less than8 percent of the total growth in the period 1995–2003. While it is inappropriate toautomatically attribute the other 92 percent to “knowledge capital” or “the knowl-edge economy,” it is equally inappropriate to ignore the association betweeninnovation, human capital, and knowledge acquisition, on the one hand, andinvestments in intangibles, IT capital, labor quality change, and multifactor pro-ductivity, on the other.
That intangibles, and more generally, knowledge capital should be such animportant driver of modern economic growth is hardly surprising, given the evi-dence from everyday life and the results of basic intertemporal economic theory.What is surprising is that intangibles have been ignored for so long, and that theycontinue to be ignored in financial accounting practice at the firm level. The resultspresented this paper are intended to illustrate the potential magnitude of the biasarising when they are excluded from economic growth accounting. In the process,we have been forced to make a host of assumptions about many empirical issues, inorder to measure such items as output deflators and non-market inputs like firm-specific organization and human competencies. Further research will undoubtedlyfind better ways to deal with these issues, and future data collection efforts willevolve to fill the gaps that this paper only traverses lightly. However, while ourresults are clearly provisional, we are also mindful of the famous dictum of JohnMaynard Keynes that it is better to be imprecisely right than precisely wrong.
References
Abowd, John M., John Haltiwanger, Ron Jarmin, Julia Lane, Paul Lengermann, Kristin McCue,Kevin McKinney, and Kristen Sandusky, “The Relation among Human Capital, Productivity,and Market Value: Building Up from Micro Evidence,” in C. Corrado, J. Haltiwanger, and D.Sichel (eds), Measuring Capital in the New Economy, Studies in Income and Wealth, Vol. 65,University of Chicago Press, Chicago, 2005.
Ayanian, Robert, “The Advertising Capital Controversy,” Journal of Business, 56, 349–64, 1983.Baily, Martin Neil, “Productivity and the Services of Capital and Labor,” Brookings Papers on
Economic Activity, 1, 1–65, 1981.Bartel, Ann, “Employee Training Programs in U.S. Businesses,” in David Stern and Josef Ritzen (eds),
Market Failure in Training: New Economic Analysis and Evidence on Training of Adult Employees,Springer-Verlag, 1991.
———, “Productivity Gains from the Implementation of Employee Training Programs,” IndustrialRelations, 33, 411–25, 1994.
Bassi, Laurie J., Paul Harrison, Jens Ludwig, and Daniel P. McMurrer, “Human Capital Investmentsand Firm Performance,” Mimeo, Human Capital Dynamics, Washington, DC, 2001.
Basu, Susanto, John G. Fernald, Nicholas Oulton, and Sylaja Srinivasan, “The Case of the MissingProductivity Growth, or Does Information Technology Explain Why Productivity Accelerated inthe United States But Not in the United Kingdom?” in Mark Gertler and Kenneth Rogoff (eds),NBER Macroeconomics Annual 2003, MIT Press, 9–63, 2004.
Review of Income and Wealth, Series 55, Number 3, September 2009
© 2009 The AuthorsJournal compilation © International Association for Research in Income and Wealth 2009
683
Bernstein, Jeffrey, I. and Theofanis P. Mamuneas, “R&D Depreciation, Stocks, User Costs andProductivity Growth for U.S. R&D Intensive Industries,” Structural Change and EconomicDynamics, 17, 70–98, 2006.
Black, Sandra and Lisa M. Lynch, “Human Capital Investments and Productivity,” American Eco-nomic Review, 86, 263–7, 1996.
Bloom, Nick, and John Van Reenen, “Measuring and Explaining Management Practices Across Firmsand Countries,” Quarterly Journal of Economics, 122, 1351–408, 2007.
Brynjolfsson, Erik and Shinkyu Yang, “The Intangible Costs and Benefits of Computer Investments:Evidence from the Financial Markets,” Proceedings of the International Conference on InformationSystems, Atlanta, GA, 1999.
Brynjolfsson, Erik, Lorin M. Hitt, and Shinkyu Yang, “Intangible Assets: Computers and Organiza-tional Capital,” Brookings Papers on Economic Activity, 1, 137–98, 2002.
Bureau of Labor Statistics, Trends in Multifactor Productivity, Bulletin 2178, September 1983.Cockburn, Iain and Zvi Griliches, “Industry Effects and Appropriability Measures in the Stock
Market’s Valuation of R&D and Patents,” American Economic Review, 78, 419–23, 1988.Comanor, William and Thomas Wilson, Advertising and Market Power, Harvard University Press,
Cambridge, MA, 1974.Corrado, Carol and Larry Slifman, “A Decomposition of Productivity and Costs,” American Economic
Review, 89, 328–32, 1999.Corrado, Carol, Charles Hulten, and Daniel Sichel, “Measuring Capital and Technology: An Expanded
Framework,” in C. Corrado, J. Haltiwanger, and D. Sichel (eds), Measuring Capital in the NewEconomy, Studies in Income and Wealth, Vol. 65, University of Chicago Press, Chicago, 2005.
Fraumeni, Barbara M. and Sumiye Okubo, “R&D in the National Income and Product Accounts: AFirst Look at its Effect on GDP,” in C. Corrado, J. Haltiwanger, and D. Sichel (eds), MeasuringCapital in the New Economy, Studies in Income and Wealth, Vol. 65, University of Chicago Press,Chicago, 2005.
Griliches, Zvi, “Market Value, R&D and Patents,” Economic Letters, 7, 183–7, 1981.——— (ed.), R&D, Patents, and Productivity, University of Chicago Press, Chicago, 1984.Grimm, Bruce, Brent Moulton, and David Wasshausen, “Information Processing Equipment and
Software in the National Accounts,” in C. Corrado, J. Haltiwanger, and D. Sichel (eds), Measur-ing Capital in the New Economy, Studies in Income and Wealth, Vol. 65, University of ChicagoPress, Chicago, 2005.
Gullickson, William and Michael J. Harper, “Possible Measurement Bias in Aggregate ProductivityGrowth,” Monthly Labor Review, 122, February, 47–67, 1999.
Hall, Bronwyn H., “The Stock Market Value of R&D Investment During the 1980s,” AmericanEconomic Review, 83, 259–64, 1993.
Hall, Bronwyn H. and Robert E. Hall, “The Value and Performance of U.S. Corporations,” BrookingsPapers on Economic Activity, 1, 1–34, 1993.
Hall, Robert E., “e-Capital: The Link between the Stock Market and the Labor Market in the 1990s,”Brookings Papers on Economic Activity, 2, 73–118, 2000.
———, “Struggling to Understand the Stock Market,” American Economic Review Papers and Pro-ceedings, 91, May, 1–11, 2001a.
———, “The Stock Market and Capital Accumulation,” American Economic Review, 91, 1185–202,2001b.
Hall, Robert E. and Dale W. Jorgenson, “Tax Policy and Investment Behavior,” American EconomicReview, 57, 391–414, 1967.
Hausman, Jerry, “Cellular Telephone, New Products, and the CPI,” Journal of Business & EconomicsStatistics, 17, 188–94, 1999.
Hulten, Charles R., “On the ‘Importance’ of Productivity Change,” American Economic Review, 69,126–36, 1979.
———, “Total Factor Productivity: A Short Biography,” in New Developments in ProductivityAnalysis, Studies in Income and Wealth, Volume 65, University of Chicago Press, Chicago,2001.
Hulten, Charles R. and Frank C. Wykoff, “The Estimation of Economic Depreciation Using VintageAsset Prices,” Journal of Econometrics, 15, 367–96, 1981.
Jaffe, Sidney A., “A Price Index for Deflation of Academic R&D Expenditures,” NSF Working PaperNo. 72-310, National Science Foundation, Washington, DC, 1972.
Jorgenson, Dale W., “Capital Theory and Investment Behavior,” American Economic Review, 53,247–59, 1963.
———, “The Embodiment Hypothesis,” Journal of Political Economy, 74, 1–17, 1966.Jorgenson, Dale W. and Zvi Griliches, “The Explanation of Productivity Change,” Review of Economic
Studies, 34, 349–83, 1967.
Review of Income and Wealth, Series 55, Number 3, September 2009
© 2009 The AuthorsJournal compilation © International Association for Research in Income and Wealth 2009
684

Jorgenson, Dale W. and Kevin J. Stiroh, “Raising the Speed Limit: U.S. Economic Growth in theInformation Age,” Brookings Papers on Economic Activity, 1, 125–211, 2000.
Jorgenson, Dale W., Mun S. Ho, and Kevin J. Stiroh, “Projecting Productivity Growth: Lessons fromthe U.S. Growth Resurgence,” Atlanta Fed Economic Review, Third Quarter, 1–14, 2002.
Khan, Mosahid, “Investment in Knowledge,” STI Review, 42, 19–48, 2001.Landes, Elisabeth M. and Andrew M. Rosenfield, “The Durability of Advertising Revisited,” Journal
of Industrial Economics, 42, 263–76, 1994.Lev, Baruch, Intangibles: Management, Measurement, and Reporting, Brookings Institution, Washing-
ton, DC, 2001.Lucas, Robert E. Jr, “On the Mechanics of Economic Development,” Journal of Monetary Economics,
22, 3–42, 1988.Mairesse, Jacques and Yusuf Kosoglu, “Issues in Measuring Knowledge: The Contribution of R&D
and ICT to Growth,” presented at Advancing Knowledge and Knowledge Economies Conferenceat the National Academies, Washington, DC, January 10–11, 2005.
McGrattan, Ellen and Edward C. Prescott, “Is the Stock Market Overvalued?” Quarterly Review,Federal Reserve Bank of Minneapolis, 24(4), 20–40, 2000.
———, “Why did U.S. Market Hours Boom in the 1990s?” Federal Reserve Bank of MinneapolisResearch Department Staff Report 369, February 2006.
Nadiri, M. Ishaq and Ingmar R. Prucha, “Estimation of the Depreciation Rate of Physical and R&DCapital in the U.S. Total Manufacturing Sector,” Economic Inquiry, XXXIV, January, 43–56, 1996.
Nakamura, Leonard, “Intangibles: What Put the New in the New Economy?” Business Review, FederalReserve Bank of Philadelphia, July/August, 3–16, 1999.
———, “What is the US Gross Investment in Intangibles? (At Least) One Trillion Dollars a Year!”Federal Reserve Bank of Philadelphia Working Paper No. 01-15, 2001.
———, “The Rise in Gross Private Investment in Intangible Assets Since 1978,” Mimeo, FederalReserve Bank of Philadelphia, 2003.
Nordhaus, William D. “Do Real Output and Real Wage Measures Capture Reality? The History ofLight Suggests Not,” in Timothy F. Bresnahan and Robert J. Gordon (eds), The Economics of NewGoods, Studies in Income and Wealth, Vol. 58, University of Chicago Press, Chicago, 1997.
OECD Secretariat, “Measuring Intangible Investment: Selected Bibliography,” OECD, 1998 (http://www1.oecd.org/dsti/sti/industry/indcomp/prod/paper16.pdf).
Oliner, Stephen D. and Daniel E. Sichel, “The Resurgence of Growth in the Late 1990s: Is InformationTechnology the Story?” Journal of Economic Perspectives, 14, Fall, 3–22, 2000.
———, “Information Technology and Productivity: Where are We Now and Where are We Going?”Atlanta Fed Economic Review, Third Quarter, 15–44, 2002.
Pakes, A. and M. Schankerman, “The Rate of Obsolescence of Knowledge, Research Gestation Lags,and the Private Rate of Return to Research Resources,” Working Paper No. 78-13, C.V. StarrCenter for Applied Economics, New York University, 1978.
———, “Estimates of the Value of Patent Rights in European Countries during the Post-1950 Period,”Economic Journal, 96, 1052–76, 1986.
Parker, Robert and Bruce Grimm, Recognition of Business and Government Expenditures for Software asInvestment: Methodology and Quantitative Impacts, 1959–98, Bureau of Economic Analysis, 1999.
Romer, Paul M., “Increasing Returns and Long-Run Growth,” Journal of Political Economy, 94,1002–37, 1986.
Solow, Robert M., “Technical Change and the Aggregate Production Function,” Review of Economicsand Statistics, 39, 312–20, 1957.
———, “Book Review,” New York Times, p. 36, July 12, 1987.Stiroh, Kevin J., “Computers, Productivity, and Input Substitution,” Economic Inquiry, 36, 175–91,
1998.———, “Information Technology and the U.S. Productivity Revival: What Do the Industry Data
Say?” American Economic Review, 92, 1559–76, 2002.Terleckyj, Nestor, Research and Development: Its Growth and Composition, Studies in Business Eco-
nomics No. 82, National Industrial Conference Board, New York, 1963.Triplett, Jack E., “Economic Statistics, the New Economy, and the Productivity Slowdown,” Business
Economics, 34, April, 13–17, 1999.Triplett, Jack E. and Barry P. Bosworth, Productivity in the U.S. Services Sector, Brookings Institution
Press, Washington, DC, 2004.United Nations, System of National Accounts 1993, Commission of the European Communities,
International Monetary Fund, Organization for Economic Co-operation and Development,United Nations, and World Bank.
Weitzman, Martin L., “On the Welfare Significance of National Product in a Dynamic Economy,”Quarterly Journal of Economics, 90, 156–62, 1976.
Review of Income and Wealth, Series 55, Number 3, September 2009
© 2009 The AuthorsJournal compilation © International Association for Research in Income and Wealth 2009
685