Embed Size (px)
Citation preview

The Conditions ofBiodiversity Maintenance in Asia
edited byMichael R. Dove and Percy E. Sajise
with the assistance ofHelen F. Takeuchi
EAST-WEST
CENTER I-,;
Program on Environment Institute of EcologyHonolulu, Hawaii Bandung, Indonesia
Institute of EnvironmentalScience and Management
Los Banos, Philippines

Floral Diversity Profile of Mount Makiling Forest Reserve, Philippines 199
Locality record`Alternate
Major role\taxon role' Habit" B.S. Kar TimFicus linearifolia la st - - +Ficus minahassae la mt - - +Ficus nota la It + + +Ficus odorata la St - + -
Ficus pseudopalma la sh + + +Ficus septica la St + + +Ficus subulata la sh + - -
Ficus ulmifolia la h + + +Ficus variegata la It + + +Fissistigma rufum la sh + - _Flacourtia indica ft St - - +Flagellaria indica cot Ii - + -
Forrestia hispida or h + - -
Garcinia binucao ft mt - + -
Gliricidia sepium fu St + - -
Goniothalamus elmeri la St - + -
Grewia multiflora fi mt - + -
Guioa koelreuteria la st - + -
Habenaria hystrix or h + - -
Harpulia arborea la St - - +Homalanthus populneus la st - + -
Homalomena philippinensis or h + - -
Hopea plagata tin It + - -
Hoya multiora or sh + - -
Illigera luzonensis la v - + -
Intsia bijuga tin It - - +lodes philippinensis la v + - -
Kleinhovia hospita fi It + + -
Kolowratia elegans la h + + -
Koordersiodendron pinnatum tin It + - +
Lagerstroemia speciosa la St + + -
Languas brevilabris la h + - -
Languas sp. la h - + -Leea manillensis la St - + -Leea philippinensis la St - + -Leucaena leucocephala fu St + + -
Leucosyke capitellata la sh - + -Litsea glutinosa la st - - +Litsea perrottetii la It - + -
Livistona rotundifolia la ti + - -
Lygodium circinatum cot f - - +Macaranga bicolor la It + + -

`tt William Sm. Gruezo
Locality record`Alternate
Major role\taxon role' Habit° B.S. Kar TimMacaranga grandifolia la It + - -Macaranga hispida la It + - -
Macaranga tanarius la it + + +Macrothelypteris polypodioides or f + + +Maesa denticulata la sh + + -
Mallotus philippensis la, dye st - + -
Marsdenia tinctora ec v + - -
Melanolepis multiglandulosa la It + + +Melochia umbellata Ii v - + -
Microcos stylocarpa la It + - -
Microlepia speluncae or f + + +Micromelon minutum la st - - +Microsorium longissimum or f + - -
Murraya crenulata la sh - + -
Musa acuminata ec h + - -
Musa balbisiana ec h + - -
Ormosia calavensis la mt - + -
Oroxylum indicum la mt - + +Otophora fruticosa la sh - - +Pachystachys coccinea la sh + - -
Parkia timorensis la It - - +Phacelophrynium interruptum la sh + + -
Phaius flavus or h + - -Phrynium philippinense la h + - -
Phyllanthus reticulatus la sh - - +Piper nigrum sp v + - -
Piper sarcopodium ec v + - -
Pipturus arborescens fi sh + + +
Pisonia umbellifera la It + + +
Pithecellobium clypearia la li - + -Pityrogramma calomelanos or f - + -
Planchonia spectabilis la mt - + -
Pleocnemia macrodonta or f + + -
Pneumatopteris microlandia or f + - -
Pollia macrophylla w h + - -
Pollia secundi,Jlora w h + + -
Polyalthia glauca la st - + -
Polyscias nodosa la st + + -
Pometia pinnata la It + - -
Pothodium lobbianum ec v - + -
Pothomorphe umbellata ec sh + +
Premna cumingiana la st - + -

Floral Diversity Profile of Mount Makiling Forest Reserve, Philippines 201
Locality record`Alternate
Major role\taxon role' Habit" B.S. Kar TimPrunus grisea la mt - + -Psychotria luconiensis la sh - + -
Pteris blumeana or f + + +Pteris ensiformis or f + + +Pteris longipes or f + - -
Pteris tripartita or f - + -
Pterocarpus indicus tin, la it - + +Pterocymbium tinctorium la It + +Pterospermum diversifolium la it - - +Pycnarrhena manilensis med sh + + -
Pyrrosia adnascens or f - + -Rhaphidophora pinnata or v + - -
Rourea minor ec li - - +Samanea saman tin, la It - - +Sapindus saponaria la It - - +Saurauria latibractea la It + - -Schefflera insularum la ep + - -Schefflera odorata la ep + + -Schizostachyum diffusum sec v + + -Selaginella cupressina or h + - -Semecarpus cuneiformis med mt - - +Setaria palmifolia w h - - +Shorea contorta tin It + - -Sphaerostephanos heterocarpus or f + - -Sphaerostephanos lobatus or f + - -Sphaerostephanos productos or f + - -Sphaerostephanos unitus or f + - -
Sterculia foetida la It - - +Sterculia stipularis la It + - -
Sterculia sp. la Lt - - +Strombosia philippinensis tin It - + -
Syzygium calubcob la It + - -
Syzygium polycephaloides la, ft mt - - +Talauma villariana la mt - + -
Taxillus estipitatus ec, par par + - -
Tectaria dissecta or f + - -
Tectaria siifolia or f - + -
Terminalia microcarpa tin, ft It - + -
Tetracera scandens or v + - -
Tetrastigma loheri ec v + + -
Tinomiscium philippinensis po v + - -
Toona calantas la it + + -

The volume editors:
Michael R. DoveDirectorProgram on EnvironmentEast-West Center1601 East-West RoadHonolulu, HI 96848-1601
Percy E. SajiseDirectorSEAMEO Regional Center for Graduate Studyand Research in Agriculture (SEARCA)College, Laguna 4031-37200, Philippines
Cover photo: Close-up of the Spotted Wood Kingfisher (Actenoides lindsayt), a beautiful butuncommon forest endemic found in Mount Makiling, Luzon, Philippines. Photo taken in 1994.(See page 223, "Threatened Species and Their Status," for more information regarding thisspecies.)
Cover photo credit: Juan Carlos T. Gonzalez
© 1997 by East-West Center. All rights reserved.Printed in the United States of America.
202 William Sm. Gruezo
Locality record`Alternate
Major role\taxon role' Habit° B.S. Kar Tim
Trema on entails fi, la mt - + -Trigonostemon philippinensis la sh + - -
Turpinia pomijera la It + - -
Villebrunea rubescens la st - + -Wikstroemia meyeniana fi sh - + -
Wrightia laniti la It + - -
Zizyphus talanai la It - + -Introduced/naturalized species
Ceiba pentandra fi It - - +
Gmelina arborea fi, tin mt - - +
Spathodea campanulata la It + + +
Sweitenia macrophylla tin, la it + + +
a. cc = ecological; fc = fruit crop; fi = fiber source; ft = fruit tree; la = landscape; med = medicinal;or = ornamental; po = poisonous; rc = root crop; sp = spice; veg = vegetable; w = weed.b. ep = epiphyte; f = fern; h = herb; li = liana (woody vine); It = large tree; mt = medium-sized tree;par = parasite; sh = shrub; st = small tree; t1 = tree-like; v = vine.c. B.S. = Bagong Silang and vicinity, Los Banos, Laguna; Kar = Sitio Karay, Barangay Pansol,Calamba, Laguna; Tim = Magnetic Hill and vicinity, Barangay Timugan, Los Banos, Laguna.

Chapter 9
Ecology and Distribution of Vertebrate Faunaof Mount Makiling Forest Reserve
Juan Carlos T. Gonzalez and Andres Tomas L. Dans
Introduction
The Philippine islands contain one of the most diverse assemblages of wildlife fauna in theworld. Vertebrate fauna diversity is high with about 1,039 species scattered among 7,100 islandsin the archipelago. Endemicity is exceptionally high, with over 400 endemic species or 40percent of the total vertebrates considered unique to the islands, most of which have only beenrecently described (Dans and Gonzalez 1995). The Philippines can be divided into five majorfaunal regions based on the composition of species on each island group in relation to landbridges formed during the late Pleistocene (Heaney 1986): Greater Luzon, Greater Mindanao,Negros-Panay, Mindoro, and Palawan. The island of Luzon is the largest island (111,520 km2),followed by Mindanao (91,537 km2). This corresponds to the patterns of island endemism, with61 endemic species found on Luzon and only 54 on Mindanao.
The Philippines is considered a global "hot spot" for the high faunal diversity and endemicity itholds, and it is a critical area for conservation due to the many highly threatened endemic birdareas (Hauge et al. 1986; Bibby et al. 1992; Gonzalez 1995). Most of the once-forested islands inthe Philippines have been converted to man-made ecosystems: only 8 percent of the originalprimary dipterocarp forest is left (Norman-Myers 1988). In 1992, the island of Luzon was listedas sixth in the critical priority listing for endemic bird areas in the world. It contains two endemicbird areas, namely the Luzon mountains and the Luzon lowlands and foothills. The latterincludes most of the forested areas around central and southern Luzon below 1,300 meters abovesea level (m asl) (Bibby et al. 1992).
Luzon island is considered a melting pot for faunal elements in the Oriental region, influencedby Paleoarctic, Indo-Malayan, and Papua-Australian sources, and long periods of isolation. Amajor portion of the diversity of Luzon is attributed to the separation of the island into twodistinct biogeographical portions, namely northern Luzon and southern Luzon. Although both ofthese portions have been well studied, the research has been done mostly in the highland andmontane areas. South-central Luzon is a distinct biogeographical center, being an intermediatelink between the northern Cordilleras and southern Bicol Peninsula (Goodman and Gonzales1990). The lowlands and mountains of south-central Luzon are the least studied on the island.
Faunal Diversity on Mount Makiling
Numerous studies have been conducted on Mount Makiling, due to the presence of the School ofAgriculture and School of Forestry (now at the University of the Philippines at Los Banos) at itsbase. Catibog-Sinha (1987) published a list of vertebrate fauna found in Mount Makiling.Gonzalez (1993b) reported the presence of 375 vertebrate species, 128 of which are endemic to
203

iv Contents
11 Biodiversity Maintenance at the Farm Level: Socioeconomic Determinants and CommunityPerception 267
by Herminia A. Francisco
12 A Landscape Fragmentation Index for Biodiversity Studies Using GIS 281by Dante Gideon K Vergara
13 Biodiversity as An Indicator of Sustainability in the Ayangan Landscape of Haliap-Panubtuban,Asipolo, Ifugao Province, Philippines 297
by Mariliza V. Ticsay-Ruscoe
204 Juan Carlos T. Gonzalez and Andres Tomas L. Dans
the Philippines, including 21 species of amphibians, 69 reptiles, 241 birds, and 44 mammals.Baril and Diesmos (1993) and Dans, Espiritu, and Mallari (1994) conducted faunal inventorieson various sites on the mountain.
Most of the studies conducted focused on aspects of the biology or ecology of a particular groupor species of vertebrate fauna (i.e., amphibians, reptiles, birds, and mammals) present on themountain. For birds, it was Zimmer (1918) who started the study of avian fauna on MountMakiling, although it was Alviola (1977) who first compiled a list of birds for the mountain.Other avian studies include Catibog-Sinha (1986) and Mendoza (1986), which led to the updatedlist of birds of Mount Makiling compiled by Mendoza (1987). Additional notes on birds werelisted by Jackman, Fiedler, and Waldbauer (1983), Sargeant (1992), and Fisher (1992, as cited byGonzalez 1993b). Other research concerning avian ecology, particularly habitat preference, wasconducted by Apilat and Garcia (1985), Miranda (1987), Catibog-Sinha (1987), Gonzalez(1990), Ricero (1991), Dy (1993), and Bueser, De Guia, and Rosell (1995). Others focused onbiology and physiology, such as Villacarillo (1991) and Pedregosa (1992) (Dans and Gonzalez1994).
Mammals, especially bats, are frequently studied on Mount Makiling, although the mostimportant study is the inventory of bats in the forests by Ingle (1992). Other studies concentratedon the biology and physiology of bats on Mount Makiling, such as those by Sabio (1992), Pargas(1991), and Gonzalez (1996); and others focused on the ecology and roosting habits, such asthose by Rubio (1977) and Balete (1988). Numerous scientists from the Rodent Research Center(now the National Crop Protection Center) have studied various aspects of rodent infestation oncroplands around the mountain (Barbehenn, Sumangil, and Libay 1973). Other studies on nativeforest rodents include those by Sumangil (1996) and Rabor (n.d., as cited by Gonzalez 1993b).Ticsay (1981) studied the ecology of civets on Mount Makiling, as did Gruezo and Soligam(1989). The herpetofauna of Mount Makiling was first studied by Taylor (1922). A number ofsucceeding studies of herpetofauna have been done, including those by Castillo and Soriano(1993), Gonzalez and Dans (1994), Espiritu-Afuang (1993, as cited by Gonzalez 1993b), andAlcala et al. (1995) on amphibians, and Custodio (1986) on reptiles (Dans and Gonzalez 1994).
This study aims to (1) identify the vertebrate fauna present in the Mount Makiling ForestReserve; (2) determine the extent of faunal diversity and relative abundance in relation to floraldiversity, in order to find out how much biodiversity is maintained between natural and disturbedecosystems; and (3) provide a more comprehensive checklist of wildlife species on MountMakiling. Wildlife are important indicators of biodiversity and can be used to compare diversityin different ecological zones or habitats. The results can be used as baseline data to determine theextent of management and conservation needed in order to maintain biodiversity.
Methodology
Methods for rapid assessment of faunal diversity were conducted for all four major vertebrategroups (amphibians, reptiles, birds, and mammals). This inventory of terrestrial wildlife includesvarious applications to maximize the amount of data gathered in the study site. This includestrapping of nonvolant mammals, mist-netting of bats and birds, transect survey of birds, andherpetofauna. Additional notes from on-site observation, physical evidence (i.e., footprints, fecalremains), and ethnobiological accounts were also used. This study was based on the standardmethodology used by Afuang and Gonzalez (1995).

Figures and Tables
Figures
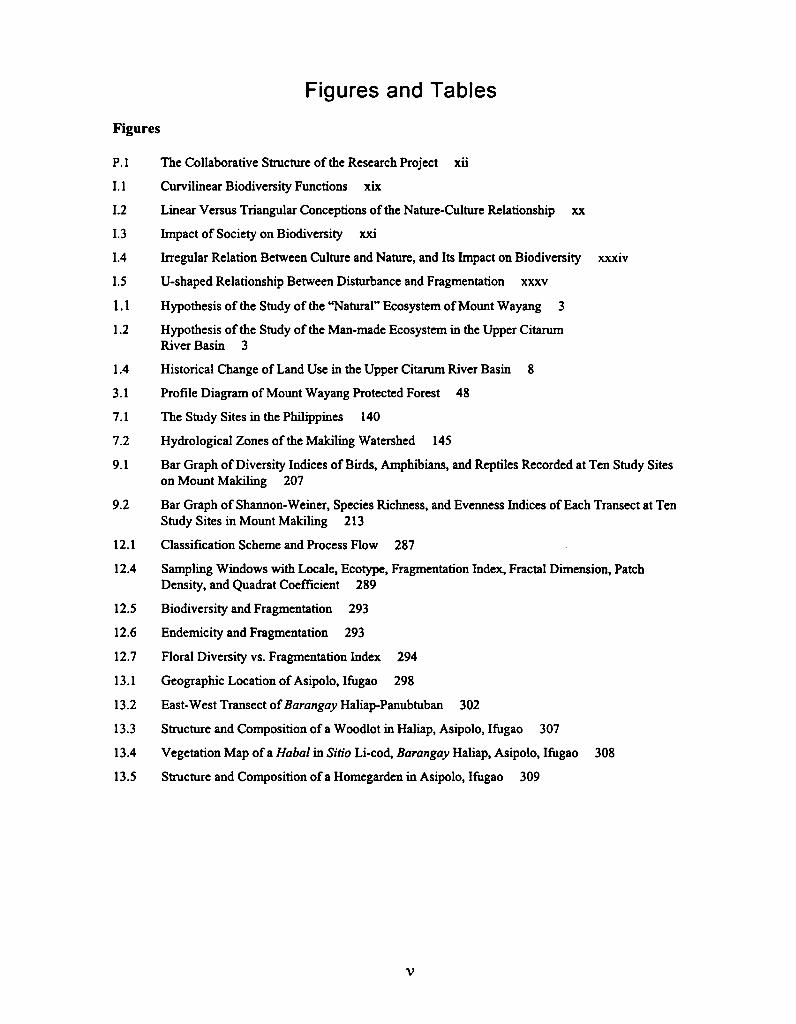
P.1 The Collaborative Structure of the Research Project xii
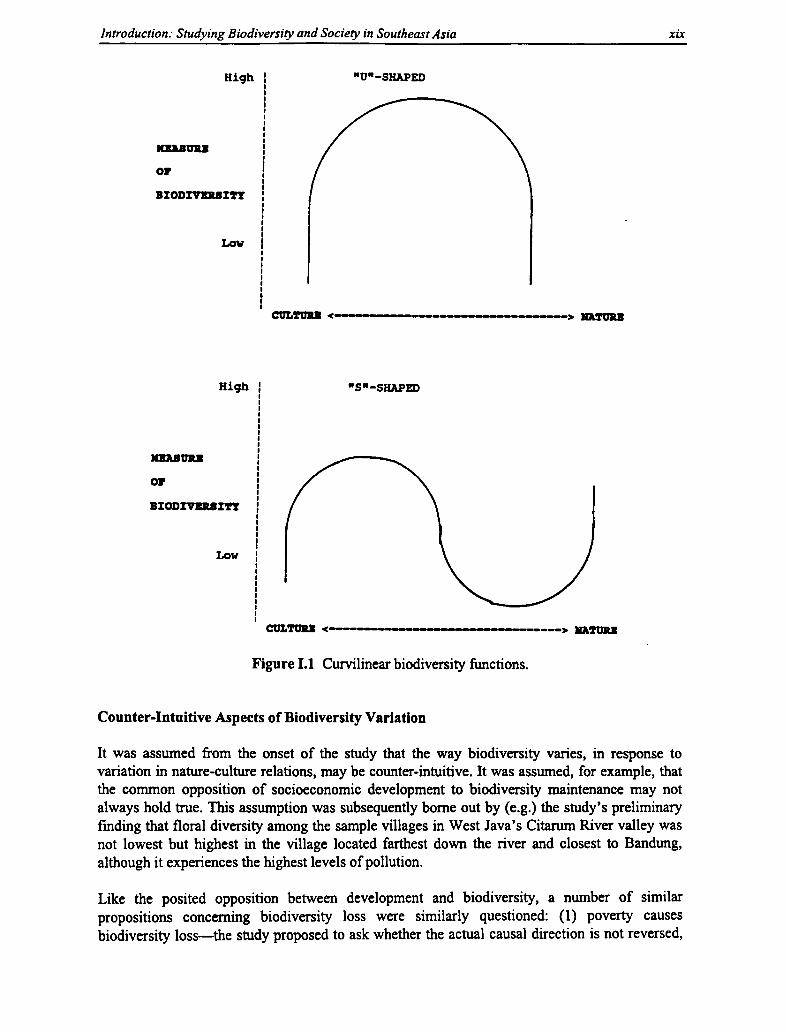
I.1 Curvilinear Biodiversity Functions xix
I.2 Linear Versus Triangular Conceptions of the Nature-Culture Relationship xx
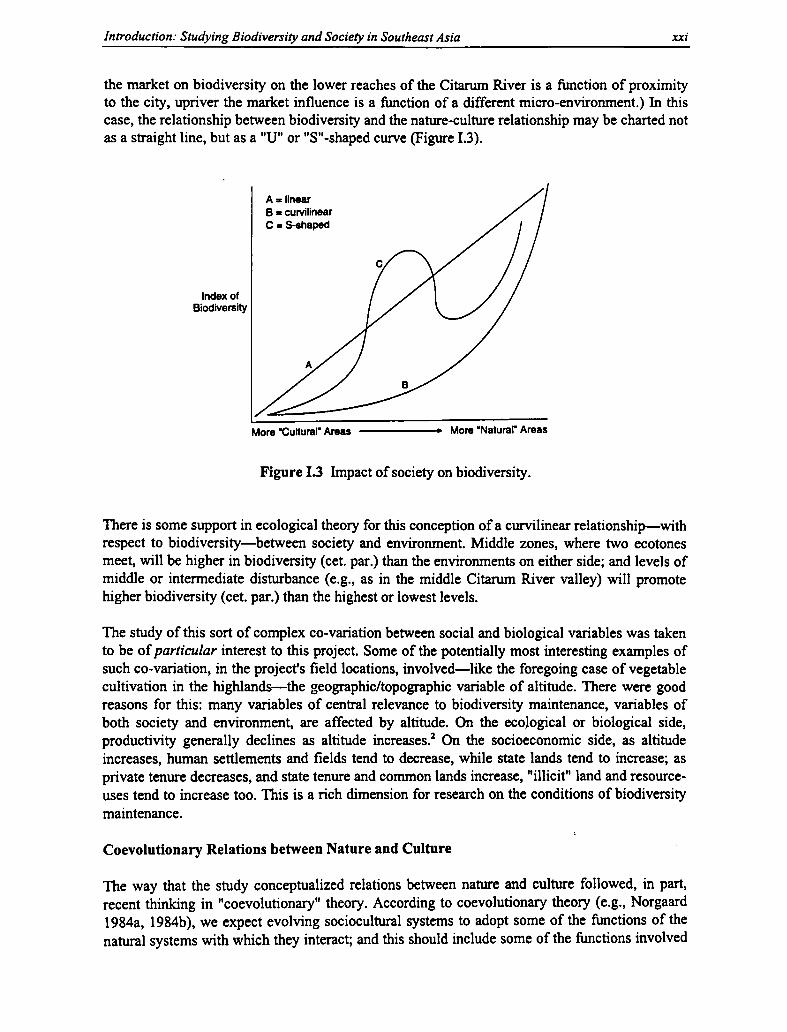
I.3 Impact of Society on Biodiversity xxi
I.4 Irregular Relation Between Culture and Nature, and Its Impact on Biodiversity xxxiv
I.5 U-shaped Relationship Between Disturbance and Fragmentation xxxv
1.1 Hypothesis of the Study of the "Natural" Ecosystem of Mount Wayang 3
1.2 Hypothesis of the Study of the Man-made Ecosystem in the Upper CitarumRiver Basin 3
1.4 Historical Change of Land Use in the Upper Citarum River Basin 8
3.1 Profile Diagram of Mount Wayang Protected Forest 48
7.1 The Study Sites in the Philippines 140
7.2 Hydrological Zones of the Makiling Watershed 145
9.1 Bar Graph of Diversity Indices of Birds, Amphibians, and Reptiles Recorded at Ten Study Siteson Mount Makiling 207
9.2 Bar Graph of Shannon-Weiner, Species Richness, and Evenness Indices of Each Transect at TenStudy Sites in Mount Makiling 213
12.1 Classification Scheme and Process Flow 287
12.4 Sampling Windows with Locale, Ecotype, Fragmentation Index, Fractal Dimension, PatchDensity, and Quadrat Coefficient 289
12.5 Biodiversity and Fragmentation 293
12.6 Endemicity and Fragmentation 293
12.7 Floral Diversity vs. Fragmentation Index 294
13.1 Geographic Location of Asipolo, Ifugao 298
13.2 East-West Transect of Barangay Haliap-Panubtuban 302
13.3 Structure and Composition of a Woodlot in Haliap, Asipolo, Ifugao 307
13.4 Vegetation Map of a Habal in Sitio Li-cod, Barangay Haliap, Asipolo, Ifugao 308
13.5 Structure and Composition of a Homegarden in Asipolo, Ifugao 309
L

Ecology and Distribution of Vertebrate Fauna 205
Trapping of Nonvolant Mammals
The wildlife research team was equipped with three types of traps (Sherman live traps, Nationalcage traps, and Victor snap traps in various sizes) to study nonvolant mammals. Traps werebaited mainly with steamed coconut meat mixed with peanut butter, and live earthworms (familyMescoglossidae: Annelida). Traps (each spaced at 5-10 meter intervals) were placed on theground near fallen logs or holes, and along runways or openings of the root systems of trees,stumps, and bamboo. Some were placed along the branches of trees and palms above the ground.The position of the trap and the condition of the microhabitat were noted. Traps were rebaitedtwice each day, during early morning and late afternoon. Rickart, Heaney, and Utzurrum (1991)suggested that the ideal number of traps to be administered was a minimum effort of 100 trap-nights (one trap-night is equivalent to one trap set for one night) per day (for four to five days)per site. An average of 300-400 trap-nights were set per study site on Mount Makiling.Nomenclature and classification were based on Heaney, Gonzales, and Alcala (1987) andHeaney et al. (in prep.)
Mist-netting of Volant Mammals and Birds
Mist-nets were used to catch birds and volant mammals such as bats. Nets were kept open duringthe day to catch birds (net-day) and left open at night (net-night) to capture nocturnal birds andbats. Black nets with an average mesh size of 36 mm and an average height of 2.5 meters wereemployed. Mist-netting stations composed of 10-30 nets (60-180 meters in length) were set-upin each study site, and the nets were left open for four to five consecutive nights and days. Netswere set 2-3 meters high while the bottom edges of the net were set generally around 0.3 meterabove the ground. Mist-nets were strategically placed along the top of ridges, cliffs, clearings,and in patches of forest growth, and along streams that are possible flyways of understory birdsand bats. Sky nets were hoisted up with a pulley and nylon rope to a height of about 10-20meters to capture canopy species. Nets were checked three to five times during the day, espe-cially during early morning for netted bats and nocturnal birds, at noon, and late afternoon(before dusk) and guarded in the evening for an hour for catching insectivorous bats.
Netted and trapped animals were carefully and humanely removed from the nets or traps andplaced in cloth bags to minimize stress prior to examination. Specimens captured were identifiedto the species level. Basic information such as sex, age, body measurements, molt (birds),weight, and reproductive condition were recorded in standard field catalog sheets. Standardmeasurements vary for each animal. For birds, this includes tail length, tarsus length, winglength, bill length, gape length, and total body length; for mammals, this includes tail length,hindfoot length, forearm length, ear length, and total body length. Most of the captures weremarked (or banded) and released after examination unless voucher specimens needed to becollected. Specimens were preserved either in 10 percent buffered formalin solution (or in 80percent ethyl alcohol), as study skins or as skeletons. Skulls were removed and cleaned properlyto aid in the identification of mammals. The numbers of species and individuals per study sitewere documented to calculate the netting success. Relative abundances overall and by individualspecies captured were determined as suggested by Heaney (1991).' Identification, nomenclature,and classification were based on Ingle and Heaney (1992) and Heaney, Gonzales, and Alcala(1987) for bats, and du Pont (1971), Clements (1991), and Dickinson, Kennedy, and Parkes(1991) for birds.

vi Figures and Tables
COLOR PLATES
Following Page 3
1.3 Citarum River Basin
Following Page 287
12.2 Land Cover/Land-Use Map
12.3 Location of Sampling Windows
Tables
3.1 Average Individual Density per Plot for Each Category/Group in Three Altitudinal Intervals 52
3.2 Diversity Measures of Vegetation in Mount Wayang 56
3.3 Diversity Measures in Three Different Altitudinal Zones 57
3.4 Similarity Index of Each Category/Group Between Two Zones 58
3.5 Matrix of Similarity Index Between Two Categories of Trees 59
5.1 Dairy Cattle Population and Growth 114
7.1 Major Features of the Study Sites in the Philippines 141
7.2 Summary of Methodologies Used at Different Hierarchical Levels 142
7.3 Description and Location of Study Sites in Mount Makiling Forest Reserve 144
8.1 Number and Location of Study Plots for Floral Diversity Assessment 155
8.2 Species Diversity Indices in the Mossy Forest Zone 156
8.3 Species Diversity Indices in the Dipterocarp Mid-montane Forest Zone 158
8.4 Species Diversity Indices in the Grassland Ecosystem Zone 159
8.5 Species Diversity Indices in the Agroforestry Zone 161
8.6 Comparison of Plant Diversity Levels in Fifteen Study Plots Established Within the AgroforestryZone 162
8.7 Inter-ecosystem Zone Comparison of Species Diversity in Mount Makiling Forest Reserve 164
8.8 Comparison of Native and Introduced Plant Diversity Levels in Fifteen Study Plots in theAgroforestry Zone 166
8.9 Inter-site Comparison of Species Diversity 168
8.10 Functional Roles Attributed to 682 Species of Flora in Four Ecosystem Zones 170
9.1 Vertebrate Fauna 209
9.2 Similarity Indices of Faunal Species Among Ten Study Sites 215
9.3 Intolerant Species of Vertebrates Recorded at the Different Study Sites 217
9.4 Faunal Species No Longer Observed 222
11.1 Distribution of Farms to Crop Diversity 270
11.2 Plant Species in Fifteen Agroforestry Plots 271
11.3 Categories Used in Classifying Household Respondents for Selected SocioeconomicVariables 271

206 Juan Carlos T. Gonzalez and Andres Tomas L. Dans
Transect Survey for Birds
Standard 2-km transect routes were selected for each of the ten study sites for faunal inventory ofMount Makiling. Transects were kept within a certain vegetation type and elevation with adistance of at least 100 m asl. The transect route was traversed by one observer traveling by footat a speed of 15 minutes for every 250 meters of the transect line. The observer recorded thefollowing parameters in a standard data sheet: species name; number of individuals;perpendicular distance from the transect line; type of habitat; strata or vertical distance from theground; if seen or heard; perched or flying; if seen singly or in pairs; feeding as a group or inmixed flocks. The transect counts were done several times a day, especially during earlymorning (5:30 A.M. to 10:00 A.M.) and late afternoon (3:00 P.M. to 6:30 P.m.), for a total of fortyhours of transect counts for each site. The methodology is based primarily on Danielsen et al.(1991), Mallari (1992), Miranda (1987), and Gonzalez (1993a). Identification of sighted birdswas based on du Pont (1971) and King and Dickinson (1975). Nomenclature and classification ofbird species were based on Clements (1991) and Dickinson, Kennedy, and Parkes (1991).
Transect Line for Herpetofauna
The transect route was also used to study the herpetofauna of Mount Makiling. Observationswere limited to a maximum perpendicular distance of 25 meters on both sides of the transect.These transects were traversed during the day for diurnal reptiles and at night for nocturnalamphibians. Since ocular observations were often less reliable for species identification, animalswere collected by hand, with insect nets, with dip nets (for tadpoles), or by other means forverification purposes. Some herpetofauna were collected from traps, especially lizards and largefrogs captured from snap traps as well as from cage traps. Baseline information on sex, age, bodymeasurements (snout-to-vent length, total length, hindlimb length for both amphibians andreptiles with the exception of snakes and tail length for reptiles), head scalation (reptiles),number of mid-dorsal scales (reptiles), extent of webbing and disk enlargement (amphibians),coloration, type of habitat, and period of collection were noted. Nomenclature and classificationwere based on Alcala (1986) and Crombie (1994).
Other Methods for Survey of Terrestrial Vertebrates
Other methods and survey techniques were used to identify land vertebrates present in the studyareas. Direct observation of local traps (e.g., silo or noose-slings set by local people), footprints,fecal droppings, nesting or roosting sites, animal remains (skeletal remains, skin, feathers), andshelter areas (holes, burrows) were noted during transect counts, servicing of nets, and rebaitingof traps. Animals traded or kept as pets by local communities were also noted, especially if theseanimals were directly taken from the study area. These observations were included in ourchecklist of the terrestrial fauna of Mount Makiling. Ethnobiological surveys of local inhabitants(e.g., local guides, hunters, hikers, and residents of local communities) were also conducted,focusing on the presence of wild vertebrates, local names, abundance or frequency, month orseason observed, behavior, and economic importance. Extent of hunting, trapping, and otherexploitation was noted. Likewise, household disturbance, crop damage, and livestock predationby introduced commensal wildlife and feral animals were assessed during local interviews.

Figures and Tables vii
11.4 IQV and Proportion of Households 272
11.5 Factors Affecting Crop and Plant Biodiversity at the Fann Level 273
11.6 Indicator Species According to Project Biologists 276
12.1 Fractal Dimension, Patch Density, Quadrat Coefficient, Fragmentation Index, BiodiversityIndices, and Fauna Endemicity 288
12.2 Regression Coefficients and Probabilities 290
12.3 Fragmentation Index and Alernative Index 290
12.4 Regression Coefficients and Probabilities for Fractal Dimension with Patch Density and QuadratCoefficient 291
12.5 Regression Coefficients and Probabilities for Fragmentation Index and Measures of Biodiversityand Faunal Endemicity 292
13.1 Methodologies Used for Biodiversity Assessment and Data Analysis 301
13.2 Significant Factors Affecting Mean Species Count at the Household Level 304
13.3 Mean Species Count for Different Resource Bases 305
13.4 Biodiversity Indices for Different Resource Bases 306
13.5 Similarity and Dissimilarity Indices Among the Different Resource Bases 306
13.6 Significant Factors Affecting Mean Species Count in the Resource Base Level 313
13.7 Functional Analysis of Biodiversity in the Species Level 322
Appendix Tables
2.1 Number of Domesticated and Wild Species Found in Bamboo-tree Gardens and Homegardens ofThree Study Villages 38
2.2 Range and Average Number of Species in Bamboo-tree Gardens and Homegardens of ThreeStudy Villages 38
2.3 Total and Average Number of Species/Individuals of Domesticated and Wild Species in Bamboo-tree Gardens Based on Their Function 39
2.4 Average Number of Species/Individuals per Stratum in Bamboo-tree Gardens 39
2.5 Correlation Between Species/Individual Number and Land Area of Bamboo-tree Gardens 40
2.6 Mean Diversity and Evenness Indices of Domesticated and Wild Species in Bamboo-treeGardens 40
2.7 Total and Average Number of Species/Individuals of Domesticated and Wild Species inHomegardens Based on Their Function 41
2.8 Average Number of Species/Individuals per Stratum in Homegardens 41
2.9 Correlation Between Species/Individual Number and Land Area of Homegardens 42
2.10 Mean Diversity and Evenness Indices of Domesticated and Wild Species in Homegardens 42
2.11 Summary of Structural and Functional Differences Between Bamboo-tree Gardens andHomegardens 43
3.1 Species' Importance Value of Mature Trees Category 67
3.2 Species' Importance Value of Poles Category 68

S3
3.5
3
d 2.5
S 2
L 1.5
> 1O
0.!S3 BirdsS2 ReptilesSi Amphibians
Ecology and Distribution of Vertebrate Fauna 207
Analysis of Data
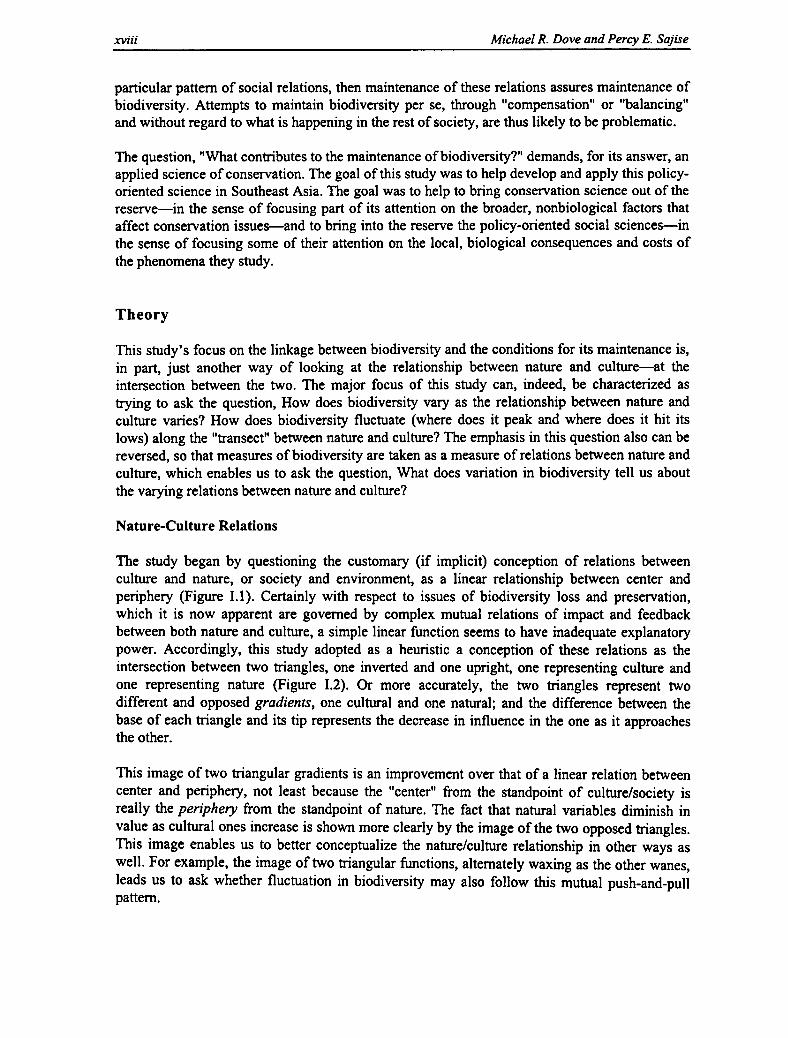
A species-effort curve was used to test if the maximum number of species was recorded at eachsite. All data from trapping, netting, transects, and ethnobiological surveys were put into adatabase program. Biodiversity was determined using both quantitative and qualitative analysison each faunal group, and for all fauna combined. Computations for diversity indices were basedon the standard formulas for Species Richness (R), Shannon-Weiner's formula (1963) formeasuring species Diversity Index (H'), Equitability or Evenness Index (e) using Pielou'sformula (1966), and Similarity Index (S) using Sorensen's formula. The level of endemicity wasdetermined from taking the percentage of endemic species in each site.
Results and Discussion
Implications of Faunal Diversity in Mount Makiling
Faunal diversity was analyzed based on the results gathered from the study of the four highervertebrate groups conducted in ten study sites on Mount Makiling. Faunal diversity at the variousstudy sites on Mount Makiling was compared to study differences and similarities betweenhabitats or zones. The comparison of these diversity indices shows the possible differencesamong habitat types, particularly between forests and anthropogenic ecosystems (Figure 9.1).
study sites a 9 10
Legend: 1—Agroforestry Bagong Silang; 2—Monoculture Bagong Silang; 3—Mixed Tree Bagong Silang;4—Grassland Puting Lupa; 5—Dipterocarp Puting Lupa 450-500 m asl; 6—Dipterocarp Puting Lupa 550-650 m asl; 7—Dipterocarp Dampalit; 8—Dipterocarp Mid-montane 400-500 m asl; 9—Dipterocarp Mid-montane 500-600 m asl; 10—Mossy forest
Figure 9.1 Bar graph of diversity indices of birds, amphibians, and reptilesrecorded at ten study sites on Mount Makiling.

viii Figures and Tables
3.3 Species' Importance Value of Sapling Category 69
3.4 Species' Importance Value of Shrub Group 70
3.5 Species' Importance Value of Ground Vegetation Group 71
4.1 List of Bird Species, Food Class, Status, and Its Presence in Each Land-use Type in UpperCitarum River Basin 104
4.2 Diversity Measurement of Avifauna in Upper Citarum River Basin 108
4.3 Diversity Measurement of Flying Insects in Upper Citarum River Basin 109
4.4 Diversity Measurement of Terrestrial Insects in Upper Citarum River Basin 110
4.5 Diversity Measures of Terrestrial Squamata in Upper Citarum River Basin 111
8.1 Vascular Plants Within the Mossy Forest Zone 176
8.2 Vascular Plants Within the Dipterocarp Mid-montane Forest Zone 179
8.3 Vascular Plants Within the Grassland Ecosystem 189
8.4a Vascular Plants Within the Agroforestry Zone: Role, Habit, and Locality 191
8.4b Vascular Plants (Weeds) Within the Agroforestry Zone 194
8.4c Vascular Plants (Indigenous/Native Forest Species and Introduced/Naturalized Species) Withinthe Agroforestry Zone 197
9.1 Amphibians Recorded on Mount Makiling Rainforest Park 232
9.2 Reptiles Recorded on Mount Makiling Rainforest Park 233
9.3 Birds Recorded on Mount Makiling 234
9.4 Netting Results for Birds 237
9.5 Mammals Recorded on Mount Makiling 238
9.6 Netting Success for Bats 239
9.7 Trapping Success of Nonvolant Small Mammals 240
9.8 Residency Status and Endemicity of Vertebrates 241
9.9 Feeding Guilds or Trophic Groups of Birds 242
10.1 Plant Species in the Dipterocarp Mid-montane Forest Zone 263
10.2 Vertebrate Groups and Plant Groups in Forests and Agroecosystems 265
10.3 Vertebrate Groups and Pollinated Plant Groups in Forests and Agroecosystems 266
13.1 Biodiversity Indices for a Woodlot 328
13.2 Biodiversity Indices for a Coffee Plantation 329
13.3 Biodiversity Indices for a Swidden 330
13.4 Biodiversity Indices for a Terraced Rice Field 331
13.5 Biodiversity Indices for a Bean Garden 332
13.6 Biodiversity Indices for a Homegarden 333
13.7 Plant Species Found in the Haliap-Panubtuban Landscape 335
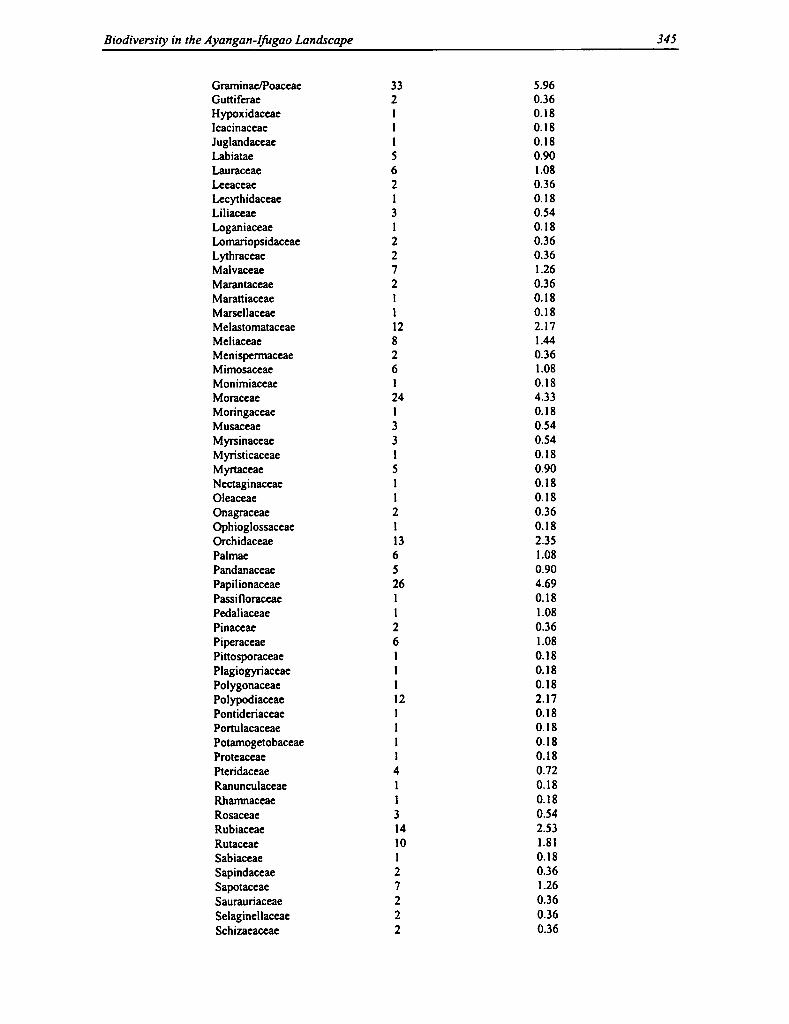
13.8 Distribution of Family Species 344

208 Juan Carlos T. Gonzalez and Andres Tomas L. Dans
Diversity of Amphibians. A total of 11 species of amphibians in three families were recorded inten study sites on Mount Makiling (see Appendix Table 9.1). Of the 11, nine are consideredendemic to the Philippines. The other two resident species observed are considered commensalspecies, which favor areas with human habitation. Four of the endemic species are found only inthe Greater Luzon faunal region. These include Woodworth's Frog (Rana woodworthi), theLuzon Narrow-mouthed Frog (Kaloula kalingensis), and two undescribed species. One of thesetwo new species of frogs, the Mount Makiling Forest Frog (Platymantis sp. nov. A), is endemiconly to the mountain, and another, the Luzon Forest Frog (Platymantis sp. nov. B), is found onlyon Mount Makiling and Mount Banahaw (Alcala, personal communication).
Ranid frogs (family Ranidae) predominate in the study area. The highest number of speciesbelongs to the genus (Rana), which is explained by the closeness of the study sites to watersources. A significant number of species belong to the genus Platymantis, which are strictlyforest species and do not require a nearby water source for survival, and are an importantindicator of the relatively humid microclimate in the forest. The dominant amphibian speciesrecorded on Mount Makiling is the Common Forest frog (Platymantis dorsalis), which wasfound at eight of the ten study sites. This is followed by the Corrugated Forest Frog (P.corrugatus) with six sites, and the Luzon Forest Frog recorded at five sites. Endemicity was highat each site, since most of the frog species present were all endemic (Table 9.1).
The highest diversity for amphibians was found in mid-montane dipterocarp forest at 500-600 masl, followed by the lowland dipterocarp forest in Dampalit, and the mossy forest and the mid-montane dipterocarp forest at 400-500 m asl. All four sites have more or less undisturbedaquatic habitats and forest vegetation. The correlation of endemicity and diversity at these sitesindicates the quality or health of the environment compared to the other study sites that weremore disturbed by human encroachment. Amphibians are important indicators of the condition ofvegetation and the quality of water in riverine forested areas such as Mount Makiling. Thus, theycan be used to determine the extent of human disturbance to the landscape (Alcala et al. 1995).
Diversity of Reptiles. A total of 19 reptiles (11 lizards and eight snakes) in seven families wererecorded at ten sites on Mount Makiling (see Appendix Table 9.2). There were twelve endemicPhilippine species, two of which are endemic only to Luzon island. The reptilian fauna wasdominated by Skinks (family Scincidae), represented by eight species, and Colubrid snakes(family Colubridae), represented by five species. The most dominant species in terms ofabundance were Cox's Sphenomorphus (Sphenomorphus coxi) and Steere's Sphenomorphus (S.steerei), both observed at six sites, followed by Jagor's Sphenomorphus (S. jagori), observed atfive sites. Although the current list of species for this study is comparatively high for any studyarea in the Philippines, an improvement in the surveying techniques for herpetofauna mightdeliver more significant data, since many reptiles are cryptic in nature.
For reptiles, the highest Diversity Index was noted for the mid-montane dipterocarp forest at500-600 m asl (H'=2.21086) and at 600-750 m asl (H'=2.16434), both of which lie between themossy forest zone and the anthropogenic zones at Bagong Silang. Although reptiles, particularlyendemic forest species, are often cryptic and naturally occurring in low populations (as is thecase for snakes) and are therefore difficult to observe, our data show that reptile diversity in theforest ecosystems was significantly higher compared to anthropogenic ecosystems, whichharbored mostly commensal species rather than indigenous species.
Contributors
Oekan S. AbdoellahResearcher, Institute of Ecology (ResearchInstitute) andLecturer, Department of AnthropologyFaculty of Social and Political SciencesPadjadjaran UniversityBandung, Indonesia
Andres Tomas L. DansHead CuratorDr. Dioscoro S. Rabor Wildlife CollectionMuseum of Natural HistoryUniversity of the Philippines at Los BarlosCollege, Laguna 4031 Philippines
Nani DjuangsihDirector, Institute of Ecology (ResearchInstitute) andLecturer, Department of BiologyFaculty of Mathematics and Natural SciencesPadjadjaran UniversityBandung, Indonesia
DjuniwartiDepartment of BiologyFaculty of Mathematics and Natural SciencesPadjadjaran UniversityBandung, Indonesia
Michael R. DoveDirector (through 10/97)Program on EnvironmentEast-West Center1601 East-West RoadHonolulu, HI 96848-1601As of 12/97:Professor of Social EcologySchool of Forestry and Environmental StudiesYale University205 Prospect StreetNew Haven, CT 06511
Tatang S. ErawanResearcher, Institute of Ecology (ResearchInstitute) andLecturer, Department of BiologyFaculty of Mathematics and Natural SciencesPadjadjaran UniversityBandung, Indonesia
Herminia A. FranciscoStudy LeaderSocioeconomic ComponentSUAN-ENV Biodiversity Study in MountMakiling andAssistant ProfessorCollege of Economics and ManagementUniversity of the Philippines at BanosCollege, Laguna 4031, Philippines
Juan Carlos T. GonzalezInstructor in ZoologyWildlife Biology LaboratoryDivision of Animal BiologyInstitute of Biological SciencesCollege of Arts and SciencesUniversity of the Philippines at Los BanosCollege, Laguna 4031 Philippines
William Sm. GruezoStudy Leader, Floral ComponentSUAN-ENV Biodiversity Study in thePhilippines andAssociate ProfessorPlant Biology DivisionInstitute of Biological SciencesCollege of Arts and SciencesUniversity of the Philippines at Los BanosCollege, Laguna 4031, Philippines
Budhi GunawanResearcher, Institute of Ecology (ResearchInstitute) andLecturer, Department of AnthropologyFaculty of Social and Political SciencesPadjadjaran UniversityBandung, Indonesia
Lucia S. IstantiStudent, Department of BiologyFaculty of Mathematics and Natural SciencesPadjadjaran UniversityBandung, Indonesia
ix
M
Table 9.1 Summary of vertebrate fauna recorded on MountAmphibian Reptile Bird Mammal total
No. of No. of No. of No. of No. of No. of No. of No. of No. of No. ofHabitat type Study site species endemic species endemic species endemic species endemic species endemic
Agroforest Agroforestry 1 1 4 3 50 24 7 2 62 28areas Bagong Silang
Monoculture 0 0 4 3 38 21 6 2 48 27Bagong Silang
Mixed tree 3 3 6 5 54 31 6 2 69 40Bagong Silang
Grasslands Grassland 1 0 1 0 27 7 5 0 33 6Puting Lupa
Mid-mountain Diptcrocarp 3 3 2 0 33 24 2 1 40 4diptcrocarp Puting Lupa 450-forests 500
Dipterocarp 5 4 2 2 48 33 9 4 66 11Puting Lupa 550-650
Dipterocarp 6 4 0 7 49 33 7 5 61 41Dampalit
Dipterocarp 5 4 5 8 56 39 7 4 73 37mid-montane 400-500
Dipterocarp 3 3 8 5 52 30 11 5 74 50mid-montane 500-600
Mossy forests Mossy forest 6 4 2 3 23 18 6 4 37 27Peak II
All sites 1 I 9 15 8 100 49 21 9 147 75(Total)
0.
o•
co
ti

x Contributors
Rusydi KotanegaraResearcher, Institute of Ecology (ResearchInstitute) andLecturer, Department of AnthropologyFaculty of Social and Political SciencesPadjadjaran UniversityBandung, Indonesia
Muhammad MuchtarStudent, Department of BiologyFaculty of Mathematics and Natural SciencesPadjadjaran UniversityBandung, Indonesia
ParikesitResearcher, Institute of Ecology (ResearchInstitute) andLecturer, Department of BiologyFaculty of Mathematics and Natural SciencesPadjadjaran UniversityBandung, Indonesia
Erwin PurnawanStudent, Department of AnthropologyFaculty of Social and Political SciencesPadjadjaran UniversityBandung, Indonesia
Percy E. SajiseDirector, SEARCASEAMEO Regional Center for Graduate Studyand Research in Agriculture (SEARCA)College, Laguna 4031-37200, Philippines
Harris SetianaStudent, Department of BiologyFaculty of Mathematics and Natural SciencesPadjadjaran UniversityBandung, Indonesia
Mariliza V. Ticsay -RuscoeProject OfficerSUAN-ENV Biodiversity Study in thePhilippinesSUAN Support SecretariatInstitute of Environmental Science andManagementUniversity of the Philippines at Los BahosCollege, Laguna 4031, Philippines
Dante Gideon K. VergaraUniversity Research AssociateInstitute of Environmental Science andManagementUniversity of the Philippines at Los BaiiosCollege, Laguna 4031, Philippines
Fani WiardiDepartment of BiologyFaculty of Mathematics and Natural SciencesPadjadjaran UniversityBandung, Indonesia
H. Y. YadikusumahResearcher, Institute of Ecology (ResearchInstitute) andLecturer, Department of BiologyFaculty of Mathematics and Natural SciencesPadjadjaran UniversityBandung, Indonesia
210 Juan Carlos T. Gonzalez and Andres Tomas L. Dans
Diversity of Birds. A total of 109 bird species in 42 families were recorded at the ten study siteson Mount Makiling (see Appendix Table 9.3). Of this total, 49 species are endemic to thePhilippines, and seven of these are endemic only to the Greater Luzon faunal region: the SpottedButton-quail (Turnix ocellata), the Luzon Bleeding-heart (Gallicolumba luzonica), RufousCoucal (Centropus unirufus), Scale-feathered Malkoha (Phaenicophaeus cumingi), Red-crestedMalkoha (Phaenicophaeus superciliosus), Luzon Hornbill (Penelopides manillae), and the Blue-breasted Flycatcher (Cyornis herioti). Ten migratory species were also recorded in MountMakiling, all of which are land birds. Two species recorded were regarded as introduced ornonnative species. Endemicity was high compared to any other forest reserve of similar size inthe Philippines. Although endemicity at the species level was high, the number of endemicsubspecies may prove to be even higher.
Based on the transect counts, the avian fauna of Mount Makiling is dominated by the followingbird families: Sylviidae (13 species); Columbidae (10); Cuculidae (9); Apodidae (6); Turdidae(5); and Dicaeidae (6). Therefore, the warblers, pigeons, and cuckoos are the dominant familygroups in the area, which is typical of most tropical lowland forest ecosystems in Asia. Warblersand cuckoos are Old World birds, which have both forest and grassland species, although theyalso predominate on open grassland habitats. Most forest pigeons and doves are canopyfrugivores, which form dense feeding flocks with other fruit-eating birds. Trophic groups aredominated by insectivores, primarily foliage-gleaning insectivores (such as warblers). There is asignificant number of omnivores, especially arboreal insectivores and frugivores, which can feedon both small insects and fruits. A large number of species are arboreal frugivores, mostlypigeons, parrots, and small flowerpeckers.
Mist-netting carried out at ten study sites on Mount Makiling obtained 32 bird species, of which24 are endemic to the Philippines (see Appendix Table 9.4). The results show that a largenumber of endemic birds are understory species and are highly cryptic in behavior. Most of thesebirds were observed more regularly during netting operations than during transect counts. A totalof 609 net-days were devoted to our ten sites on Mount Makiling, with an average of 60 net-daysper site. Netting success was highest in the lowland dipterocarp forest in Dampalit and mixedtree plantation in Bagong Silang, which yielded the most number of captures per net-day. Thehigh rate of capture may have been influenced by the presence of low canopy trees and thickundergrowth. The greatest number of species was caught in the mid-mountain "dipterocarps2forest site at 500-600 m asl (19 species), followed by the mid-mountain dipterocarp forest inPuting Lupa at 550-650 m asl (14 species) and the lowland dipterocarp forest in Dampalit (with13 species).
Transect counts for birds show that diversity indices for the monoculture plantation(H'=3.50852) and the agroforestry zone at Bagong Silang (H' =3.45574) were high, althoughboth are situated in anthropogenic sites near highly disturbed forests. These two sites had higherdiversity indices than the forest sites (mossy and mid-montane dipterocarp forest). However,although the two anthropogenic sites had higher H' values for avian diversity, it was the mid-montane dipterocarp forest at 500-600 m asl on the northeast side of Mount Makiling (BagongSilang area) that had the most number of species (56). This suggests that important habitats forbirds are still present on this side of Mount Makiling. Although bird species diversity is higher atthese three sites (monoculture plantation, agroforestry zone, and mid-montane forest),comparatively they have lower levels of endemicity. On the other hand, the mossy forest site hasthe highest endemicity at 78.26 percent. This is followed by the mid-montane dipterocarp forestat 450-500 m asl in Puting Lupa with 72.73 percent endemicity. These two sites both possess a
Preface
The 1994-96 research project upon which this monograph is based, instead of dwelling on theconditions that bring about loss of biodiversity, focused on the conditions associated withsuccessful biodiversity maintenance. It proposed to develop and apply a comparative, interdisci-plinary and policy-oriented approach to identifying the biosocial circumstances responsible forbiodiversity maintenance in Southeast Asia. The project asked how the maintenance of biodi-versity relates to the maintenance of society; it attempted to develop the theoretical andmethodological tools needed for the answer, and it hoped to begin applying this answer towardthe transformation of conservation policy in Southeast Asia. The ultimate goal of the project,thus, was to develop an approach to assist the region's governments to forge policies to supportbiodiversity maintenance. The goal was to enable governments to assess whether biodiversity isbeing maintained or not; if so, to identify and support the factors responsible; and if not, todetermine why not and what needs to be done. The goal was not to maintain biodiversity on anad hoc basis, but rather to support the conditions responsible for its maintenance.
This project was unusual not only in the questions that it asked, but in the institutional structurethat it put in place to try to answer these questions. The project was international, interdis-ciplinary, and collaborative to an extent seldom attained in research projects. The project was co-designed by an American anthropologist and a Philippine ecologist, and it involved formalcollaboration among four different institutions in the United States and Southeast Asia. Projectparticipants were brought together during the project in five separate international workshops,including a one-month-long workshop in Honolulu. The research was carried out by seventeenscholars from the four participating institutions, plus their students. During the project, eightBachelor's students, three Master's students, five Ph.D. students, and two post-doctoral studentscarried out research—in most cases for their theses—with the full or partial support of theproject: thirteen of these students came from institutions in Southeast Asia, and five came fromthe United States. The various participating individuals and institutions brought different, oftenconflicting approaches to the project, which were particularly noticeable with respect to themethodologies employed for assessing biodiversity. Instead of treating this as a problem,however, to be dealt with by imposing a single approach on all participants, these differenceswere embraced for the insights that they offered into real issues of problems-formulation, theseinsights thus being afforded the project by virtue of its collaborative character. Not onlydifferences in approach, but also differences in levels of expertise—for example, in statisticalanalysis or the use of GIS methods—were put to work for the overall good of the project throughinter-institutional exchanges and training. The structure of the project is summarized in FigureP.1.
The project was jointly led and administered by the East-West Center's Program on Environment(ENV) and the Southeast Asian Universities Agroecosystem Network (SUAN). The East-WestCenter is a public, non-profit institution; and SUAN is an association of university-basedresearch groups in Indonesia, the Philippines, the People's Republic of China, Thailand, andVietnam. The project took advantage of the East-West Center's research experience at bothmicro- and macro-levels in most of the countries of Asia, and its experience in forging linkagesbetween these levels, across national boundaries, and between research and policy. SUANbrought to the project research experience on biodiversity, detailed knowledge of the social andphysical environments in Myer's Asian "hot spots," and a demonstrated strength in rural survey
xi

Ecology and Distribution of Vertebrate Fauna 211
higher endemicity, compared to other sites that have higher species diversity. This suggests thatthese forest sites, despite their low diversity, are vital as habitats for less tolerant endemicspecies. The level of endemicity in birds is therefore useful in identifying important habitats forconservation.
It is important to stress at this point that even anthropogenic ecosystems such as agroforestryareas can harbor a high number of species almost on a par with the forest ecosystem. Note thatthis is affected by the distance of such agroforestry areas to a forest habitat. Proximity fromforests strongly influences the increase in species diversity on agroecosystems. Even someendemic species can tolerate the high levels of disturbance in agroforestry areas. The highdiversity values in agroecosystems are a function of the mixing of tolerant endemic andnonendemic forest birds with colonizing species from the open grasslands and agricultural areas.This is brought about by the edge effect between these two different habitats. There are 15 forestbirds that are unable tolerate man-made disturbance and habitat conversion, and there are 16colonizing species that favor such conditions.
The mixture of forest birds with colonist species increases diversity but shows minimalendemicity. The reason for this was because most tolerant species and colonists are nonendemicspecies, such as migrants and introduced birds. Almost all endemic birds are forest dwellers andhave restricted habitat distribution. Endemicity remains higher in forest communities, whereeven the single-island endemics are abundant. Therefore, diversity should not be measured onlyby total numbers and values but also by the composition of the species and their status in aparticular ecosystem. Although diversity indices are proven indicators for overall biologicaldiversity, other measures such as endemicity must also be utilized (i.e., endemicity).
Diversity of Mammals. A total of 30 species of mammals were recorded at ten sites on MountMakiling, twelve of which are considered endemic to the Philippines (see Appendix Table 9.5).A majority of the mammalian fauna were bats and small mammals (such as rodents and shrews);of the total number of species, 17 were volant mammals. The bats included six frugivorousspecies (suborder Megachiroptera; family Pteropodidae) and 11 insectivorous species (suborderMicrochiroptera), most of which play important ecological roles in forests and agroecosystems.They function as dispersers of tropical forest fruits and seeds, as pollinators, and as biologicalcontrols for many airborne pests and harmful insects in the rural areas.
A total of 594 net-nights were devoted to the ten sites on Mount Makiling, for an average ofalmost 60 net-nights per site (see Appendix Table 9.6). Netting success was highest for the mid-mountain dipterocarp forest at 500-600 m asl, followed by the mid-mountain forests at 400-500m asl. Both of these sites are important natural forest sites with a high number of bats of bothfrugivorous and insectivorous species. The dominance at these sites of caulifloric species of figs(Ficus sp.) and pendulifloric bananas (Musa sp.) attracts fruit bats to feed and pollinate theirflowers and fruits.
Most of the larger species of nonvolant mammals were noted indirectly through physicalevidence, such as the presence of tracks, feces, and calls. These include the Philippine browndeer (Cervus mariannus) and the Philippine warty pig (Sus philippensis). Among the smallmammals, there were five species recorded, of which two are endemic species and three arecommensal species. The two Philippine endemics are the Luzon forest shrew (Crocidura grayi)and the Philippine Forest rat (Rattus everetti) (which is the dominant small mammal, with morethan 29 captures for all sites). Mount Makiling is generally considered to be depauperate of small
stingms
xii Preface
1 PI 2 Post- 4 Ph.D. 5 scholars S BA/BSc 7 scholars 3 MA/MSc 1
& 2 Doctoral students students & 1 Ph.D. P1
scholars scholars students
PROJECT RESEARCHERS
Figure P.1 The collaborative structure of the research project.
methodologies. SUAN and the East-West Center together brought to the project a long andsuccessful record of collaborative research.
The project's fieldwork was carried out in two countries: in Indonesia, by PadjadjaranUniversity's Institute of Ecology; and in the Philippines, by the University of the Philippines atLos Banos Institute of Environmental Science and Management. In each country, two to fourcases of successful biodiversity maintenance were being identified and studied. Each studyconsisted of (1) measuring the extent of biodiversity maintenance, (2) identifying the factorsresponsible at not only community but also regional and national levels, and (3) analyzing thesefactors, focusing on the linkages between different levels of organization and the balancebetween factors favorable versus inimical to biodiversity maintenance.
The current publication is intended to promote discussion regarding the study's findings; it is notintended as a final, authoritative publication. For that purpose, a follow-up publication iscurrently being planned.
This report on the project's findings was made possible by the assistance of many talentedpeople in a number of different institutions and countries. This includes Project Team Leadersand Senior Scientists William Gruezo and Marhz T. Ruscoe at the Institute for EnvironmentalScience and Management in Los Bafios; and Nani Djuangsih and Oekan S. Abdoellah at theInstitute of Ecology in Bandung. At the East-West Center in Honolulu, thanks are due, forsecretarial support, to Tammy Castleforte, Loraine Ikeda, and Sandy Osaki; for administrativeand fiscal support, to Vivian Gutierrez, Meg White, and Karen Yamamoto; for library researchsupport, to John Cusick and Marilyn Li; for GIS support, to Jefferson Fox; and for editorialsupport, to Deanna Donovan and, in particular, Helen Takeuchi. Thanks also are due to the John

212 Juan Carlos T. Gonzalez and Andres Tomas L. Dans
mammal fauna. Despite a total of 2,359 trap-nights devoted to all ten sites, the diversity of smallmammal fauna remained low, unlike other mountains in Luzon that harbor many endemic forestrodents (e.g., Mount Banahaw with eight endemic forest rodents and Mount Isarog with seven).The results also indicate the absence of rare endemic rodent species previously recorded onMount Makiling, such as the Luzon short-nosed rat (Tryphomys adustus) (a lowland species),last recorded in the 1970s (Barbehenn, Sumangil, and Libay 1973). The highest trapping successwas observed in the mid-montane dipterocarp forest at 500-600 m asl and in the mossy forest(see Appendix Table 9.7).
Comparatively, amphibian and reptile diversity are both important indicators of the health of theenvironment. They are both essential tools in identifying key habitats for conservingbiodiversity, such as forests. However, birds are also an important indicator for biodiversity, andthis has proved to be significant as well as practical in many studies (Miranda 1987; Gonzalez1993a; Gonzalez and Dans 1994). Based on our results, bird species diversity does notnecessarily show diversity to be strongly correlated with the lack of man-made disturbance. Thisis unlike the case with amphibians and reptiles, of which species diversity shows an inverselyproportional relationship with human encroachment to the environment. Therefore, our resultsshow that amphibians and reptiles are better indicators for biodiversity than birds, although birdsare more practical to study than amphibians and reptiles. On the other hand, the data also showthat increasing perturbation in the environment results in the decrease in endemicity for all threevertebrate groups.
Comparison Across Sites for All Faunal Groups. Trends in the analysis of biodiversity oftenuse the results of diversity indices in each faunal group to compare different sites. Traditionally,species diversity is treated separately for birds, mammals, and herpetofauna. In this study, anaggregated value for diversity was determined for all four vertebrate groups to find out theeffects of overall faunal diversity to the different sites. The overall trend shows an increase indiversity from less natural to more natural habitats, especially from more open to more closedvegetation (Figure 9.2). The resulting diversity indices aggregated from all faunal speciesrecorded on Mount Makiling follows a similar pattern with the indices for bird species diversity.The highest value for H' was observed in the agroforestry area in Bagong Silang (H'=4.613),followed by the mid-montane dipterocarp forest at Dampalit and the monoculture plantation atBagong Silang (both H' =4.569). Ecotones influence the patterns of faunal diversity found onanthropogenic sites, because these intermediate habitats are formed by the "edge-effect" betweentwo converging areas, such as forests and agroecosystems. This merger of two ecosystem typesresults in the mixing of two sets of fauna: tolerant forest species and colonizing nonforestspecies. Therefore, ecotonal effect influences the higher values shown for agroecosystems withgreater proximity to forests, represented in both the agroforestry zone and the monocultureplantation in Bagong Silang. Note that these higher levels of biodiversity do not necessarilyindicate high "good"' biodiversity. These sites may contain high values, but do not necessarilyreflect the diverse indigenous species typical of natural forests. Note that quantitative results donot stand alone; they must also be analyzed qualitatively to provide a clear picture of therelationship between faunal diversity and with natural and anthropogenic ecosystems.
Our data also show that diversity increases from grasslands (lowest value) to mossy forests, thento agroforestry areas and finally to mid-mountain dipterocarp forests (highest value). The highdiversity values in the dipterocarp forests are attributed to the presence of multiple niches due tolayering of the forest structure. Tropical forests harbor naturally large numbers of unique speciesthan anthropogenic areas, due to this greater vertical stratification. The high value found in the
Preface xiii
D. and Catherine T. MacArthur Foundation for generous and stimulating support of this project,in particular Senior Program Officer Kuswata Kartawinata, Director of the World Environmentand Resources Program Dan Martin, and Grants Administrator Judith Rayter.
Michael R. Dove and Percy E. Sajise31 October 1997, Honolulu

Ecology and Distribution of Vertebrate Fauna 213
Shannon -Weiner Species Richness Evenness Index
5 3.5 3.54.5 3
3
4
3.5 m3 c
vVE 2I 2.5
lii !1UI
=x'1. Xv
y
1.5 N 1 W1
0.50.5 0.5
0 0 01 3 5 7 9 1 3 5 7 9
Study sites Study sites Study sites
IUSenesi •SerieslI n Seriesl
Legend: 1—Agroforestry Bagong Silang; 2—Monoculture Bagong Silang; 3—Mixed Tree Bagong Silang;4--Grassland Puting Lupa; 5—Dipterocarp Puting Lupa 450-500 m asl; 6—Dipterocarp Puting Lupa 550-650 m asl; 7—Dipterocarp Dampalit; 8—Dipterocarp Mid-montane 400-500 m asl; 9—Dipterocarp Mid-montane 500-600 m asl; 10—Mossy forest
Figure 9.2 Bar graph of Shannon-Weiner, Species Richness, and EvennessIndices of each transect at ten study sites in Mount Makiling, Luzon, Philippines.


214 Juan Carlos T. Gonzalez and Andres Tomas L. Dans
agroforestry areas can be attributed to the effect of ecotones, wherein the tolerance of forestspecies to man-made disturbance is an important factor. Those intolerant forest species arereplaced by colonizing species, and thus the number of species remains high. The decrease indiversity of species in mossy forests can be attributed to elevation, or an increase in elevationgenerally means a decrease in diversity for most fauna. With less stratification in the mossyforest, there are less habitat variety and niches available.
The Evenness Index shows that there is an increase in evenness of species from higher habitatcomplexity to lower habitat complexity (the opposite of species diversity). Thus evenness valuesincrease from the mid-mountain dipterocarp forest (lowest value) to the agroforestry areas, thento grasslands, and finally to mossy forests (highest value). This index determines the degree towhich a species is evenly distributed in an area. A higher diversity value means that there aremore species relative to the population, while a lower value means that there are fewer speciesrelative to the population. The lesser the diversity in an area, the more uniform are the speciespresent relative to the population. However, the values obtained in the agroecosystems showmoderate-to-high species diversity and evenness. Compared with forests, agroforestry areascontain more individuals of a species from a set of species, whereas forests contain more specieswithin a fewer number of individuals. Therefore, agroforestry areas show moderate diversity butwith less consistency in the species, whereas forests show high diversity and less consistency inthe species. Although many species are present in agroforestry sites, these species occur with agreater frequency than on other sites. Note that in the species diversity index, the number ofspecies is largely influenced by the frequency of each species, and even though agroforestry sitescontain generally fewer number of species than forest sites, the higher frequency in each speciescompensates. Grasslands and mossy forests both show low species diversity than agroforestryareas and forests, but contain higher evenness. The reason lies on the occurrence of fewer butmore consistent species. Both sites contain low-to-moderate diversity, but with higherconsistency in the species. Therefore, species diversity indices are not the only indicators forbiodiversity and should not be used as a singular basis. Other indices, such as evenness, areuseful for providing additional insights on the degree of diversity in a particular area.
The results of the analysis for faunal species richness (R) show an increase in values from theless "natural"` to the more natural ecosystems. The values increase from the agroforestry areas tothe grasslands, then to the mid-mountain dipterocarp forests, and finally to the mossy forests.This trend seems to be based on a human disturbance gradient, with the lowest diversity beingfound on sites with the most human disturbance and the highest value being found on sites withthe least human disturbance.
There also appears to be a relationship between diversity of species and frequency of species.The agroforestry areas have moderate diversity but with high frequency in species, whereas themid-mountain dipterocarp forests have high diversity but with low frequency per species. On theother hand, the cogon grasslands have low diversity but with high frequency per species, and themossy forests have moderate diversity but with high frequency per species. Most of this diversitycan be attributed to variability in distribution brought about by increased habitat diversity. Thelatter generally involves vertical stratification or layering of communities associated withdifferent species of vegetation at different heights. Increasing the layering of components inforests increases the availability of niches along the vertical profile (Gonzalez 1992).

I Introduction

Ecology and Distribution of Vertebrate Fauna 215
Table 9.2 Summary of similarity indices of faunal species among ten study sites on Mount Makiling
Loca- Agrof- Mono- Mix Grass- Dipte- Dipte- Dipte- Dipte- Dipte- Mosstion BS BS tree land PL45 PL56 Damp mid4 mid6 forest
Agrof- 73.39 64.57 35.56 8.82 17.95 54.1 53.45 48.89 45.36BS
Mono- 56.14 31.17 3.64 12.31 47.71 46.6 49.18 40.48BS
Mix 27.37 8.22 14.46 59.84 57.84 57.14 47.06tree
Grass- 5.56 13.04 17.78 14.29 19.42 24.62land
Dipte- 41.67 11.76 12.9 7.41 18.6PL45
Dipte- 25.64 27.78 26.37 26.42PL56
Dipte- 53.45 59.26 45.36Damp
Dipte- 63.57 48.35mid4
Dipte- 45.45mid6
Mossforest
Legend: AgrofflS = Agroforestry Bagong Silang; MonoBS = Monoculture Bagong Silang; Mix tree =Bagong Silang; Grassland = Puting Lupa; DiptePL45 = Dipterocarp Puting Lupa 450-500 m asl; DiptePL56 =Dipterocarp Puting Lupa 550-650 m asl; DipteDamp = Dipterocarp Dampalit; Diptemid4 = Dipterocarp mid-montane 400-500 m asl; Diptemid6 = Dipterocarp mid-montane 500-600 m asl; Mossy forest.
Similarity Indices are useful analysis to quantify the comparison of faunal components on ourstudy sites on Mount Makiling (Table 9.2). The Similarity Indices show that mixed treeplantations are similar to that in agroforestry areas and monoculture plantations (all above 60percent similarity). The least similar of the study sites is the mixed tree plantation in BagongSilang and the mid-montane dipterocarp forest in Puting Lupa at 450-500 m asl. The extremedistance between these sites along the mountain and differences in vegetation probably affect thecomposition of species (also the forest area in Puting Lupa is depauperate of fauna). Among thedipterocarp forests, the mid-montane forest at 500-600 m asl is highly dissimilar with that of themid-montane forest at 450-500 m asl in Puting Lupa. Their Similarity Index is much lower thanthe index for the lowland dipterocarp forest at Dampalit and the mixed tree plantation andagroforestry at Bagong Silang. The similarity between the agroecosystems at Bagong Silang andthe forest ecosystem at Dampalit is a result of the proximity of the agroforestry sites in MountMakiling to forests. Although human disturbance in these agroecosystem areas has allowednonnative colonizing species to enter, many tolerant forest species were also allowed to enter
216 Juan Carlos T. Gonzalez and Andres Tomas L. Dans
these anthropogenic areas. The retention of tolerant endemics and resident forest species intoagroforestry areas provided the initial base of species, thus resulting in high Similarity Indicesamong agroforests and forests. From this initial set of species was the addition of colonizingspecies from grasslands and agricultural areas that replaced most of the intolerant species.
Implications of Tolerance to Disturbance to Faunal Diversity
The importance of endemicity, feeding guilds or trophic levels, and the dominance of familiesand species groups in relation to conditions for biodiversity maintenance can be significant to theanalysis of diversity other than strict statistical analysis often associated with biodiversitystudies. The current results were analyzed based on statistical analysis, but other importantfactors also were studied to qualify the results and the implications for maintaining suchbiodiversity. These factors include the degree of tolerance of a species to human disturbance andhow species are displaced due to this disturbance.
Classifying the tolerance of a particular species to disturbance is an important factor to considerwhen diversity along disturbance gradients is being studied. Other factors include the importanceof ecological niches and their application by various species in response to the consequences ofhabitat change, either natural or man-made. Also important are ecotones or areas intermediatebetween two different habitats. On Mount Makiling, ecotones often act as buffer zones betweenthe "natural" forest habitats and the areas with the most significant human impact. There arethree categories of tolerance to human habitat disturbance (modified from Johns 1986):intolerant species, tolerant species, and colonizing species.
Intolerant Species. These are mostly endemics, especially the island endemics and restrictedrange species. All are strictly forest species with defined microhabitats and are unable or rarelyventure out or into disturbed areas. Some can be found in mature second growth, but some arehighly restricted to primary or old-growth forests. Most of the species are considered rare orhave a threatened status. The high diversity in the tropical forests had led some species to requiredefinite niches, in which they have complex relationships with particular food sources foundonly in these habitats. When a forest area is disturbed by logging, or clearing for agriculture, orother activities (man-made or natural), these species are often the first species to disappear; thus,they are important indicators for extreme disturbances in the environment (Table 9.3). Mostunderstory endemic birds on Mount Makiling such as the Blue-breasted Flycatcher (Cyornishen oil) and the Black-crowned Tree-Babbler (Stachyris nigrocapitata) are sensitive todisturbance and most likely disappear after human encroachment into the forest.
Tolerant Species. Some of these species are endemics, most of which are hardy and common;many are native forest residents (nonendemic resident breeders in forests but with endemicsubspecies); and some are nonendemic forest species (nonendemic species and subspecies).These species are able to tolerate disturbance and change in their habitat and can also venture outinto ecotones. Most of these species are considered to be abundant and not threatened. In somecases, these species may in fact benefit from the presence of ecotones or other minimaldisturbances. These species often require a bit of open area, such as the natural gaps in forestcanopy. These species (such as woodpeckers Dendrocopos maculatus and creepers Rhabdornismysticalis) may feed on boring insects in dead or dying trees; others (flycatchers Hypothymisazurea and falconets Microhierax erythrogenys) use open areas to feed on insects; or still others(bulbuls Hysipetes philippinus and pigeons Chalcophaps indica) feed on pioneer tree species
Introduction
Studying Biodiversity and Society in Southeast Asia
Michael R. Dove and Percy E. Sajise
Background
The magnitude of the contemporary threat to the biodiversity of the earth appears to be if notunique, certainly rare. Thus, Myers (1986) suggests that the current pace of species losses in theworld's tropical forests threatens to produce an "extinction spasm" as great as any suffered by theearth during prehistory. Soule (1991) predicts that "The loss of most tropical wildlands in thenext 50 years or so, an epochal catastrophe for earthly life, appears a virtual inevitability." Evenin countries (e.g., Costa Rica) that are thought to be islands of success in the tide of biodiversityloss, recent appraisals indicate that the threat to biodiversity maintenance is still severe (Hunter1994). Whereas the nature of the threat is extraordinary, however, the nature of proposedsolutions appears to be much more ordinary—and therein perhaps lies one of the problems. Wesuggest that successful stemming of the tide of species extinctions will require radical recon-ceiving of the problem; we suggest, that is, that it will require not just coming up with answers tothe questions being asked about biodiversity conservation, but asking different questions in thefirst place. The question that primarily concerns us here is how the environmental relations oflocal communities bear on the issue of biodiversity loss.
The Problem
The past approach has been to ask, What are local communities doing that is inimical tobiodiversity and how can we counter it? The thesis of this study was that we would do better toask, What are these communities doing that support biodiversity and how can we strengthen (orat least not weaken) it (cf. Dove 1993a)? Alarm over the former relationship has led us tooverlook the latter one; yet failure to reverse the human-ecological relations that diminishbiodiversity may be less injurious in the long run than failure to support those relations thatmaintain it.
This is the central question of this study, namely, What are the conditions associated withbiodiversity maintenance? Is there a systematic relationship in this regard between society andenvironment? There is tentative, although compelling, evidence of some co-variation: thus,severe degradation of natural resources often is associated with equivalent trauma in proximatehuman communities. But what of the positive side of this relationship? Are sustainable environ-mental relations associated with social relations that are (in their own way) also sustainable? Isintegrity in the environment—as indicated by biodiversity—associated with integrity in society?Evidence of some co-variation is, again, highly suggestive.
Demonstration of such an association between environment and society would end their currentunproductive dichotomization in the field of conservation. It would open up new approaches todealing with contemporary threats to biodiversity beyond "circling the wagons." Indeed, it wouldopen up new avenues for supporting the integrity of environment md society at the same time.This study asked, therefore, how the maintenance of biodiversity relates to the maintenance of
xv

Ecology and Distribution of Vertebrate Fauna 217
growing in these gaps. Disturbed areas in Mount Makiling represent, in effect, nonnatural gaps inthe forest, which these species use to their advantage (Miranda 1987; Gonzalez 1992).
Table 9.3 List of intolerant species of vertebrates recorded at the different study sites onMount MakilingFaunal group or common name Species Remarks
Amphibians: 6Woodworth's Frog Rana woodworthi R-Luzon endemicPhilippine Woodland Frog Rana magna macrocephala endemicLuzon Forest Frog Platymantis sp. nov. U-Luzon endemicMount Makiling Forest Frog Platymantis sp. U-Makiling onlySmooth-skinned Tree Frog Philautus surdus endemicLuzon Narrow-headed Frog Kaloula kalingensis R-Luzon endemic
Reptiles: 4Philippine Bent-toed Gecko Cyrtodactylus philippinicus endemicBlack-sided Sphenomorphus Sphenomorphus decipiens R-Luzon endemicCuming's Eared Skink Otosaurus cuminigi R-endemicWhite-spotted Angle head Gonocephalus semperi R-endemic
Mammals: 5Luzon White-toothed Shrew Crocidura grayi R-endemicPhilippine Pygmy Fruit Bat Haplonycteris fscheri R-endemicPhilippine Forest Noseleaf Bat Hipposideros obscurus R-endemicYellow-faced Horseshoe Bat Rhinolophus virgo endemicOrange-fingered Myotis Myotis rufopictus endemic
Birds: 15Luzon Bleeding-heart Gallicolumba luzonica N-Luzon endemicAmethyst Brown Dove Phapitreron amethystina endemicPhilippine Frogmouth Batrachostomus septimus endemicPhilippine Trogon Harpactes ardens N-endemicSpotted Wood Kingfisher Actenoides lindsayi N-endemicLuzon Tarictic Hornbill Penelopides manillae T-Luzon endemicBlackish Cuckoo-shrike Coracina coerulescens N-endemicPhilippine Fairy-Bluebird Irena cyanogaster T-endemicBlack-crowned Tree-Babbler Stachyris nigrocapitata N-Luzon endemicSooty Woodpecker Mulleripicusfunebris endemicGuaiabero Bolbopsittacus lunulatus N-endemicBlue-breasted Flycatcher Cyornis herioti N-endemicDubois' Leaf-Warbler Phylloscopus cebuensis endemicWhite-browed Shama Copsychus luzoniensis endemicFlaming Sunbird Aethopygaflagrans endemic
Total species: 30 Total endemic: 30 Total Luzonendemic: 7
Legend: (U) Undescribed species; (R) Rare; (N) Near-threatened; (T) Threatened.
Colonizing Species. They are mainly nonendemic residents that venture into ecotones andsecondary growth forests. These are mostly migratory species (e.g., Lanius cristatus), introduced
or exotic species (e.g., Geopelia striata), and commensals (species dependent on human habita-tion, e.g., Rattus tanezumi). Most of these species are abundant, and some have even becomeserious agricultural pests. The majority of these species frequent open grasslands and marshes,
xvi Michael R. Dove and Percy E. Sajise
society; it attempted to develop the theoretical and methodological tools needed to arrive at ananswer; and it hoped to begin applying this answer toward the transformation of conservationpolicy in East and Southeast Asia.
Research Framework
The problems that this study addressed can be disaggregated as follows: first, there has been atendency in the past to reify the concept of biodiversity, to identify it with the material environ-ment, whereas it is really a measure of the character of the environment, or a measure of thecharacter of human relations with the environment. Thus, it misses the point to attempt topreserve biodiversity per se; what must be preserved are the conditions that sustain it. Second,we do not know enough about these conditions, and what we do know focuses on whatdiminishes biodiversity as opposed to what maintains it. Yet the preservation of biodiversitydepends not only on mitigating the factors that diminish it, but supporting those that maintain it.We need to ask why some communities and not others can preserve biodiversity. What is thecharacter of relations between environment and society, at both micro- and macro-levels, thatexplains this? And third, how do we combine the approaches of the biological and socialsciences to answer these questions? How do we link the concerns of the researcher and the policymaker? The potential reward for meeting these challenges is the ability to replicate isolatedsuccesses in biodiversity maintenance on a broader scale.
One direction of analysis identified as relevant early on concerns whether biodiversitymaintenance at the local level is associated with diversity (as opposed to homogeneity) at otherlevels of organization (e.g., the region or nation). This question, regarding how factors of scaleand hierarchy affect biodiversity maintenance, has direct implications for policy. Some of thelinkages between levels are counter-intuitive: popular opinion in much of Asia holds thatresource degradation and biodiversity loss are due to a gradual increase in pressure fromimpoverishment and population growth in the local community. However, the data often showthat degradation and loss do not occur gradually but quickly, due not to the needs of the localpopulation but to the activities of outsiders (Sajise and Omengan 1990). Such activities may bemade possible by brief lapses or "windows of (dis)opportunity" in governmental regulatoryapparatus. Another example is the "window" that occurs in state development when a nationalgovernment dismantles local institutions of resource control before it is capable of installingeffective replacements.
Many of the possible determinants of biodiversity maintenance, identified early in the study, canbe ranged along continua, as below:
• Intensive agriculture H extensive• High population density H low• Socioeconomic equity lower H higher• Local resource management institutions weak H strong• Less autonomy from market forces H more• More involvement in government planning t-* less• Urban H rural• Center H periphery
Analysis then focused, in each case, on the balance between the forces that promote versusinhibit biodiversity maintenance—which is a matter of central concern to the project—and how

218 Juan Carlos T. Gonzalez and Andres Tomas L. Dans
agroecosystems, and urban areas and are mostly nonforest species. They are termed "colonizingspecies" because they can colonize forest gaps opened by disturbance and make use of nichesvacated by other species. Since the Philippines was formerly covered mostly by forest, somesuch colonizing species are recent additions to open grasslands from marshy areas andmangroves. They can be important indicators of environmental change, since their presencesignals that disturbances have altered the environment to suit them.
Disturbance (natural or man-made) in forest ecosystems greatly affects the degree of speciesdiversity in an area. To maintain the diversity often entails determining what conditions need tobe maintained in a disturbed area to reduce the effects of habitat change on intolerant species anddiscourage colonizing species. In ecotones such as agroforestry areas, there was an increase indiversity due to the addition of colonizing species, which combines with the tolerant speciesalong secondary vegetation. Ecotones are important intermediate buffering areas betweenagroecosystems with high human disturbance and natural forest (either secondary or primary).Such diversity in ecotonal areas (agroforestry areas) may mimic the high species diversity foundin forest habitats, but such values cannot be higher than those found in natural forest ecosystems(Gonzalez 1992).
Species Replacement by Congeners. The replacement of species in habitats is often a result ofcompetition due to niche overlaps, such that similar species compete for the same food sourceusing the same feeding guilds. Due to this competition, one species may yield and be replaced bythe other. Species replacement also occurs when conditions in the habitat changes, such that onespecies is unable to survive (intolerant), and a similar species more adaptable may take over thevacated niche. Thus, intolerant forest species in ecotones is compensated by the invasion of acolonizing species. Some tolerant species that occur rarely in natural forests due to the lowabundance of their preferred food source become abundant in ecotones when that food sourcebecomes prevalent (Goodman and Gonzales 1990).
Congeners are a pair of species belonging to the same genus. Their similarities often result in theoverlapping of niche requirements, although originally either of the species may be found indifferent habitats and have variable degrees of adaptability. The niche vacated by one speciesmay be occupied by other congeneric species with higher adaptability and tolerance todisturbance. More often, competing tolerant forest species can replace intolerant forestcongeners and thus become more dominant in disturbed areas. A number of congeners in MountMakiling allow replacement of forest endemics (intolerant) with nonendemics (tolerant) ofrelated species of the same genus. They have similar niches and may have overlappingrequirements, but they usually meet only at ecotones. Among these congeners are species of thegenus Copsychus, Cyornis, Phylloscopus, Phapitreron (birds); Kaloula, Rana (amphibians);Gekko, Lycodon (reptiles); Hipposideros, Rattus (mammals). For example, the White-browedShama (Copsychus luzoniensis), an endemic forest bird, is rarely observed outside forest habitatsin Mount Makiling. It is often replaced by a related nonendemic species, the Magpie Robin(Copsychus saularis), which is abundant in lowland agroecosystems on Mount Makiling. Asimilar case is seen between the restricted range and Luzo—the endemic Blue-breastedFlycatcher (Cyornis herioti) was observed only in dipterocarp forests in Mount Makiling, whilethe common nonendemic resident Mangrove Blue Flycatcher (Cyornis rufigaster) was found inagroforestry areas. Among mammals, the endemic Philippine Forest Rat (Rattus everetti) is oftenreplaced in Mount Makiling by the introduced Asian Black Rat (Rattus tanezumi) in disturbedareas. However, observations on some study sites on Mount Makiling reveal that altitudinalranges of congeneric species pairs overlap more frequently than predicted, thus following

Introduction: Studying Biodiversity and Society in Southeast Asia xvii
it varies along the continua. An example is the balance between center (e.g., lowland capital) andperiphery (e.g., upland border area) in some Asian countries: Is biodiversity maintenancestrongest in the periphery, because of distance from urban resource consumers (e.g.), or is itweakest because of distance from government oversight—suggesting that it may be strongest ina middle zone where the positive and negative attributes of the center and periphery balance off?A related balance is that between more versus less authoritarian forms of governance: Is self-determination (e.g.) associated with biodiversity maintenance?'
Much of the methodology that was employed to study these issues was experimental. It wasthought that existing methods did not provide the necessary speed and scope, so we proposed todevelop for conservation the equivalent of the Rapid Rural Appraisal techniques developed foragriculture and rural development (Pei 1992; cf. Sajise et al. 1974). Given the rapidity withwhich biodiversity can be threatened in today's world, the multi-year, intensive study of diversityin a tiny enclave of "natural" vegetation is as inappropriate—for policy purposes—as theanthropologist's multi-year study of a single, "traditional" community. Further, just as RapidRural Appraisal techniques combined biological and sociological approaches in the study ofrural development, so did we hope to combine them in the field of conservation. Whereasbiology explains the concept of biodiversity, it does not suffice to explain its persistence versusloss. The current challenge to conservation—the endangerment and extinction of species—islargely nonbiological in origin, so the nonbiological sciences must be brought into its solution.The third methodological contribution of this project was to apply GIS-based analysis to theexplanation of biodiversity maintenance (cf. Morren 1991). The speed and scope of all thesemethodological innovations suits them to use by government agencies, which was another of thehoped-for accomplishments: developing the tools whereby governments in the region can bridgethe gap between what needs to be done in the field of conservation and their ability to addressthese needs.
The Expectations of the Study
One of the most important goals of this study was to help to re-frame the debate overbiodiversity conservation. The study hoped to transcend the current confines of this debate by (1)identifying not just the factors that threaten biodiversity but the factors that support it, (2)looking beyond local ecosystems and communities to the broader society for challenges tobiodiversity conservation, and (3) approaching the challenge to biodiversity conservation as aproblem not of the environment alone, but also of society. Much development planning in Asiahas been characterized by an artificial dichotomization between the problem of biodiversity andthe problems of society. An example of the quandaries that this leads to is the characterization ofthe conservation challenge as a conflict between "people and parks." This study hoped totranscend such oppositions by placing the concept of biodiversity within its proper, broadercontext. The study hoped to demonstrate that the maintenance or loss of biodiversity is an
indicator of a broader pattern of environmental relations, that loss is a symptom of a broaderproblem, and that the solution to such loss lies in addressing this broader problem. This returnsus to the question with which this Introduction opened, regarding a possible parallel between thestate of society and the state of the environment.
This transcendence of orthodox thinking has the potential to resolve some of the mosttroublesome questions in conservation—such as how to "compensate" local communities forbiodiversity conservation, or how to "balance" conservation against economic development—bysuggesting that these are the wrong questions to ask. If biodiversity is indeed associated with a

Ecology and Distribution of Vertebrate Fauna 219
disturbance gradients over elevation. This suggests that competition may not have played adominant role in structuring the community and may be based on other factors such as toleranceand suitability (Navarro 1992).
Implications of Site-Specific Species on Faunal Diversity
These are species observed to have specific requirements in the habitat. Since wildlife exhibitgreat ecological diversity, several species have adapted to specific modes of living. Each specieshas a preference for certain habitats, having its own definite niche, which may vary only betweensubspecies. With different species interacting in each habitat, the relationships between speciesand the habitat contribute to the formation of ecological communities. To understand this,analysis through measurements of animal populations relative to the diversity of species isgreatly important (Andrewartha 1961). Some of these species may require distinct characteristicsin their habitat, such as specialized microhabitats; highland species with elevational andvegetational limits; commensal species that depend on human habitation; and semi-aquaticspecies relying on unpolluted freshwater. Some species show an opposite response (i.e., they arecosmopolitan and have a wide distribution along elevational gradients, habitat gradients, andeven disturbance gradients).
Site-Specific Species. The Philippines has been isolated from the rest of Southeast Asia since thePleistocene period. This fact emphasizes the high degree of endemicity among wildlife. Manyendemic species are highly restricted to specific forest habitats, forming an almost symbioticrelationship with their food source. Most of these forest elements are unable to survive in anyother habitat, other than to what they are suited. The intolerant species, such as the PhilippineTrogon (Harpactes ardens), in Mount Makiling are site-specific and were found only in a few ofthe forest sites (Appendix Table 9.8). Other species have peculiar relationships to theenvironment. For instance in Mount Makiling, the Eurasian Tree Sparrow (Passer montanus) (anintroduced species from northern Asia) would rarely venture out of areas around humanhabitation. They are considered commensal and are not usually found in forests, only in highlydisturbed areas. However, some commensals, depending on the degree of disturbance, do ventureinto ecotones and adjacent habitats. The Asian house rat (Rattus tanezumi) was observed in themossy forest and dipterocarp forests on the mountain. Another case of a site-specific species isthe White-browed Shortwing (Brachypteryx montana) considered to be mainly a highlandspecies. It is abundant in the mossy forest of Mount Makiling, but rarely found below 500 m asl.Three principal factors influence altitudinal structuring of communities. These are abruptchanges in habitats, gradual changes in environmental parameters, and competition (Navarro1992). The Philippine Woodland Frog (Rana magna macrocephala) requires unpolluted, fast-flowing watercourses (e.g., mountain creeks and streams) and is rarely found beyond the limitsof freshwater. Altogether, human disturbance, elevation, vegetation type, and water limit theoccurrence of these species. These factors are an important determinant for diversity and need tobe considered when surveying for diversity in an area.
Cosmopolitan Species. These species can adapt to variable conditions in different habitats, withlittle or no specificity. They have been observed in almost all (if not all) the study sites on MountMakiling. The nonendemic Common Dog-faced Fruit Bat (Cynopterus brachyotis) and themigratory Brown Shrike (Lanius cristatus) can be both observed in forests, ecotones, grasslands,and agroecosystems and even in suburban areas on Mount Makiling.

220 Juan Carlos T. Gonzalez and Andres Tomas L. Dans
Time-specific Species. Another area of concern is rarely observed species, which can be highlycryptic, occurring in very low populations and may have a threatened status. These include, forexample, owls and other birds of prey, as well as burrowing reptiles and large mammals, whichmay always occur in limited density. Migratory bird species also have a significant effect on thevalues of diversity, since they have seasonal movements from their winter feeding grounds andreturn to their summer breeding grounds annually. Such factors need to be considered whenplanning field surveys, since their presence or absence can introduce some bias into the data.
Implications of Community Structure in Faunal Diversity
Generally, it is known that faunal diversity increases with increasing vegetation diversity andhabitat complexity in an area. Also, the different altitudinal communities have different speciesdiversity due to stratification (vertical structure) of vegetation pattern along elevational gradients(MacArthur and MacArthur 1961). In this study, diversity was found to increase with increasingvegetation size and succession, due to definite division of habitats and increasing niche diversity(Miranda 1987). Species diversity is not affected by distribution of species and individuals alone;trophic levels and community structure also contribute to the analysis of diversity. Trophic levelsare influenced by the amount of habitat complexity and niche diversity. The decrease in availableniches causes competition and species replacement due to severe factors of habitat degradationor disturbance (Alviola 1977; Miranda 1987; Apilat and Garcia 1985). Vegetation has a vitalinfluence on faunal diversity; it determines habitat structure, having the primary food source formost vertebrates (Johns 1986; Gonzalez 1992). Altogether, the analysis of vertical stratificationand trophic levels on their contribution to habitat complexity in forests and agroecosystems isknown as "community structure."
Vertical Stratification and Elevation. The most significant factor in the diversification of theforest habitats on Mount Makiling is stratification. The vertical structure of the forest can bedivided into several definite layers, with different species occupying different layers (e.g., theemergent layer, main canopy, subcanopy or middle layer, understory, undergrowth or groundcover, forest floor, and subterranean soil). Stratification is represented well in the mid-montanedipterocarp forest in Dampalit, where birds show a definite vertical distribution from the toplayer to the forest floor. For example, the emergent layer is occupied by raptors (e.g., Spilornisholospilus) and large frugivores (e.g., Penelopides manillae); main canopy by medium- to small-sized frugivores and omnivores (e.g., Coracina striala, Dicaeum bicolor); subcanopy by bark-gleaning woodpeckers (e.g., Chrysocolaptes lucidus); the understory by flycatching insectivores(e.g., Dicrurus balicassius, Pachycephala philippinensis); the undergrowth by small insectivores(e.g., Orthotomus derbianus); and the forest floor by ground-feeding birds (e.g., Pittaerythrogaster).
Layering of the habitat is greatly influenced by elevation, which affects ambient temperaturesand humidity, which in turn affect the growth and species of vegetation in the area. The lowlandhumid forest contains the most number of layers and offers the most niches to fauna. Aselevation increases, temperature decreases, and stratification becomes limited, resulting in areduction of diversity for some faunal groups. This can be observed between the mossy forestsite found almost at the peak and in the mid-montane dipterocarp forest site at Dampalit foundnearest the base of Mount Makiling. Species diversity follows the general trend, wherein themossy forest shows lower diversity than dipterocarp forests.

XZZBURI
07
BXODIVZtBITT
Low
CULTURE < ---). JMTURE
Introduction: Studying Biodiversi ty and Society in Southeast Asia xix
High 11"U"-SHAPED
CULTURE < - > J►TVRs
High "Sw-SHAPED
KZABURE
OF
BIODIVZRBITY
Low
Figure I.1 Curvilinear biodiversity functions.
Counter-Intuitive Aspects of Biodiversity Variation
It was assumed from the onset of the study that the way biodiversity varies, in response tovariation in nature-culture relations, may be counter-intuitive. It was assumed, for example, thatthe common opposition of socioeconomic development to biodiversity maintenance may notalways hold true. This assumption was subsequently borne out by (e.g.) the study's preliminaryfording that floral diversity among the sample villages in West Java's Citarum River valley wasnot lowest but highest in the village located farthest down the river and closest to Bandung,although it experiences the highest levels of pollution.
Like the posited opposition between development and biodiversity, a number of similarpropositions concerning biodiversity loss were similarly questioned: (1) poverty causesbiodiversity loss—the study proposed to ask whether the actual causal direction is not reversed,

Ecology and Distribution of Vertebrate Fauna 221
In agroecosystems, the multiplicity of crops may produce stratification in vegetation, whichapproximates the natural vertical layering found in forest ecosystems. For example, orchardscontain a main canopy, coconuts provide an emergent layer, and cultivated crops along withweeds become the understory or undergrowth.
Trophic Groups, Feeding Guilds, and Temporal Distribution. In the forest sites on MountMakiling, some species are separated into their specialized niches to avoid competition, and theyare usually defined by their habitats that are influenced by the degree of stratification (arborealor terrestrial), trophic group (herbivore, insectivore, carnivore), and their habits or methods ofextracting their food (e.g., bark-gleaning, sweeping, sallying, and foliage gleaning) (seeAppendix Table 9.9). Temporal distribution refers to the activity of the animal at varying times,such as night (nocturnal), day (diurnal), or twilight (crepuscular), and other inherent properties.Some species may in fact have similar habits, but be active at different periods in time(temporal), and thus do not overlap in terms of activity separated by day and night. This wasobserved in the Long-tailed Nightjar (Caprimulgus macrurus), which feeds on flying insects, andthe Glossy Swiftlet (Collocalia ecsulenta), which feeds on winged insects in the daylight. ThePhilippine Serpent-Eagle (Spilornis holospilus), a diurnal bird of prey, is replaced by thePhilippine Scops-Owl (Otus megalotis) at night (a nocturnal bird of prey). Although factorsdetermine the extent of species that can occur in a particular area, such factors may not comeinto play in a particular faunal group; therefore, trends may vary for each group or species.
The majority of fauna found in agroecosystems on Mount Makiling are insect-eating and fruit-eating animals. These species maintain some degree of specialized habits, although most of themare opportunistic omnivores. Insect pests abound around cash-crops and provide an importantfood resource for insectivores. The same crops in turn provide food for some opportunisticanimals. The abundance of frugivores in ecotones (i.e., agroforests) is attributed to the benefitsof secondary vegetation composed mainly of trees, which are considered as keystone mutualist(which accompanies pioneer trees, i.e., fruiting figs, Ficus sp.). These trees produce fruit year-round, but in agroforestry areas, they are replaced or joined by exotic species and cultigens.Some frugivores adapt to these exotic food sources in agroecosystems and may become pests, tosome extent. On the other hand, some species play an important role in pollination, dispersal, andpest control, thus benefiting man. These additional food sources allow tolerant species to ventureinto agroforestry areas to feed, but they return to the forest to roost and nest. In the agroforestrysites, the insectivores are dominated by sweeping insectivores such as swifts, swiftlets, andswallows (e.g., Collocalia esculante), foliage-gleaners such as warblers (e.g., Megaluruspalustris), sweeping-sallying such as bee-eaters (e.g., Merops viridis), semi-raptorials (e.g.,Lanius cristatus), and arboreal frugivores such as seed-eaters (e.g., Lonchura punctulata).
Conservation Status of Threatened Fauna in Mount Makiling
The high occurrence of endemic, rare, and threatened species of wildlife on Mount Makilingsuggests that the study area is an important stronghold for the conservation of these species.Endangered species are important indicators of environmental health. The conservation status ofsuch species at the study sites can help provide insights for biodiversity maintenance. Somethreatened species are no longer found on Mount Makiling. The lack of recent records considersthese species to be extirpated on the mountain.
Localized Extinctions or Extirpated Species. Extirpated species are species that have becomeextinct in a specific geographic area (e.g., on a mountain such as Mount Makiling). Species from

nross
CULTU1a
xx Michael R. Dove and Percy E. Sajise
Figure I.2 Linear versus triangular conceptions of the nature-culture relationship.
such that poverty is instead created by biodiversity loss; (2) ties to the market inevitably causebiodiversity loss—the study proposed to ask whether the impact on biodiversity varies with the
Xyp of market tie; (3) biodiversity loss is caused gradually by local socioeconomic factors—thestudy asked whether biodiversity loss instead occurs in spurts, caused by extra-local factors; (4)protected area status conserves biodiversity—the study proposed to examine cases where suchstatus seems to erode biodiversity; and (5) biodiversity loss is caused by in-migration and/orpopulation growth—the study proposed to examine whether higher population density might notalso strengthen conservation regimes.
The findings of the study in the end supported many of these counter-intuitive suggestions,pointing to a nonunilinear relationship between biodiversity on the one hand, and on the other thenature-culture relationship. The accepted wisdom is that biodiversity should vary in a linearfashion with relations between nature and culture: under more natural conditions, there should begreater biodiversity; and under more cultural conditions, there should be less. But the studyfindings showed that this linear relationship often does not hold. What does hold is not itsopposite, but rather something more complex.
An example is the negative impact on biodiversity of the recent introduction of capital-intensive,monocropped, market-oriented agriculture in the highlands of both Java and Luzon. Theenvironment and especially altitude of these two regions is relatively less favorable to thecultivation of traditional subsistence crops; it traditionally mitigated against dense humansettlement, and thus to some extent it formerly sheltered both natural and agriculturalbiodiversity. Today, however, the altitude of these regions is drawing in the cultivation of high-profit, market-oriented, and traditionally temperate-zone vegetable crops, which cannot be grownin the lowlands. As a result, the biodiversity of these formerly peripheral regions may be morethreatened today than that of some regions that are more integrated into society and (at leastformerly) closer to "culture" on the nature-culture continuum. (Thus, whereas the influence of

222 Juan Carlos T. Gonzalez and Andres Tomas L. Dans
Mount Makiling unable to tolerate the increasing disturbance include the Rufous Hornbill(Buceros hydrocorax), among others (Table 9.4). The Rufous, or Great Philippine Hornbill, wasonce abundant in the lowland dipterocarp forests on Mount Makiling, but encroachment of theirhabitat has caused their demise—with the last one observed in 1971 (Alviola 1977). One of thereasons this large hornbill was unable to cope with the changes in its habitat was the loss of itsfeeding and nesting trees. Hornbills are canopy birds that specialize on strangling figs andrequire tall emergent trees as their hosts. These trees, however, had entirely disappeared inMount Makiling. The loss of the tall trees almost meant the loss of most nest sites. Hornbillsmake use of large tree cavities to nest, where the monogamous pair will raise two to four young(only one or two usually survive).
Table 9.4 List of faunal species no longer observed on Mount Makiling (since circa1970; probably extirpated)
Faunal group or common name Species Remarks
Birds
Philippine Eagle Pithecophagajefferyi CE-endemic
Rufous hydrocorax Buceros hydrocorax T-endemic
Philippine Forest Kingfisher Ceyx melanurus T-endemic
Golden-crowned Tree-Babbler Stachyris dennistouni N-Luzon endemic
Green-faced Parrot finch Erythrura viridijacies T-endemic
Mammals
Golden-crowned Flying Fox Acerodonjubatus T-endemic
Luzon short-nosed Rat Tryphomys adustus I-Luzon endemic
Lowland striped Shrew-rat Chrotomys mindorensis R-endemic
Luzon broad-toothed Rat Abditomys latidens I-Luzon endemic
Reptiles
Banded Burrowing Snake Oxyrhabdium leporinum R-endemic
Legend: (T) Threatened; (N) Near-threatened; (I) Intermediate; (R) Rare; (CE) Criticalendangered.
Their size is attractive to hunters, and killing a breeding male also results in the death of thefemale and young enclosed in the nest cavity, which the male feeds laboriously. As such, largehornbills are very sensitive to perturbation and easily succumb to changes in their habitat. Thesmaller Luzon Tarictic Hornbill (Penelopides manillae) still occurs in almost all the forest sitesand in some of the agroforestry areas in Mount Makiling, although their numbers are low. Itseems that this species may soon follow the same faith with the Rufous Hornbill unless adequateprotection is provided. The Luzon Tarictic Hornbill was found to be uncommon in the forestsites, with the most numbers observed in the dipterocarp forest at Dampalit (14 individuals). Itwas also found in mid-mountain dipterocarp forest at 400-500 and 500-600 m asl (with 3

Index ofBiodiversity
Introduction: Studying Biodiversity and Socie ty in Southeast Asia xxi
the market on biodiversity on the lower reaches of the Citarum River is a function of proximityto the city, upriver the market influence is a function of a different micro-environment.) In thiscase, the relationship between biodiversity and the nature-culture relationship may be charted notas a straight line, but as a "U" or "S"-shaped curve (Figure I.3).
More 'Cultural Areas • More 'Naturar Areas
Figure I.3 Impact of society on biodiversity.
There is some support in ecological theory for this conception of a curvilinear relationship—withrespect to biodiversity—between society and environment. Middle zones, where two ecotonesmeet, will be higher in biodiversity (cet. par.) than the environments on either side; and levels ofmiddle or intermediate disturbance (e.g., as in the middle Citarum River valley) will promotehigher biodiversity (cet. par.) than the highest or lowest levels.
The study of this sort of complex co-variation between social and biological variables was takento be of particular interest to this project. Some of the potentially most interesting examples ofsuch co-variation, in the project's field locations, involved—like the foregoing case of vegetablecultivation in the highlands—the geographic/topographic variable of altitude. There were goodreasons for this: many variables of central relevance to biodiversity maintenance, variables ofboth society and environment, are affected by altitude. On the eco'ogical or biological side,productivity generally declines as altitude increases. 2 On the socioeconomic side, as altitudeincreases, human settlements and fields tend to decrease, while state lands tend to increase; asprivate tenure decreases, and state tenure and common lands increase, "illicit" land and resource-uses tend to increase too. This is a rich dimension for research on the conditions of biodiversitymaintenance.
Coevolutionary Relations between Nature and Culture
The way that the study conceptualized relations between nature and culture followed, in part,recent thinking in "coevolutionary" theory. According to coevolutionary theory (e.g., Norgaard1984a, 1984b), we expect evolving sociocultural systems to adopt some of the functions of thenatural systems with which they interact; and this should include some of the functions involved

Ecology and Distribution of Vertebrate Fauna 223
individuals each), but none was found in Puting Lupa because of high hunting activity. It wasalso found to be uncommon in agroforestry areas, such as in the mixed tree plantation (9individuals), monoculture plantation (2), and agroforestry site (1) in Bagong Silang.
Other lowland forest species that are no longer found in Mount Makiling include the PhilippineForest Kingfisher (Ceyx melanurus) and the Golden-crowned Tree-babbler (Stachyrisdennistouni), both of which are understory species that require stratified habitats within theseclosed canopy forests. They are unable to adapt to the less stratified mid-montane forest andmossy forests found at the higher elevations, probably due to the lack of similar feeding ornesting areas. The Green-faced Parrot finch (Erythrura viridffacies) is another threatenedendemic bird no longer found on Mount Makiling, probably the result of scarcity of food,because this species feeds primarily on bamboo seeds. The bamboo of various kinds that oncecovered the lowlands of Mount Makiling is now covered by suburban settlements andagricultural development. The changing landscape of Mount Makiling, particularly in thelowland forests, has a severe impact on the forest endemics, which have a specialized adaptationto elevation and forest stratification.
Threatened Species and Their Status. Some ten threatened birds, four threatened and rareamphibians, three threatened and rare reptiles, and four threatened mammals were observed onMount Makiling during the study. These species are valuable indicators of habitat quality,indicating areas that have high or low impact of human disturbance to the environment. Bothendemicity and status of conservation can indicate the amount of change in biological diversitybetween different habitats, where indices and numbers prove to be unclear. In the ten sites, onlyone bird species, the Luzon Tarictic Hornbill (Penelopides manillae), is known to be threatened.Most of the other birds, such as the Blue-breasted Flycatcher (Cyornis herioti), BlackishCuckoo-shrike (Coracina coerulescens), Spotted Wood Kingfisher (Actenoides lindsayi),Philippine Fairy Bluebird (Irena cyanogaster), Guaiabero Fig-Parrot (Bolbopsittacus lunulatus),Spotted Button-quail (Turnix ocellata), Rufous Coucal (Centropus unirufus), and the LuzonBleeding-heart (Gallicolumba luzonica) are considered to be near-threatened species (Collar andAndrew 1988). All the species mentioned above are Philippine endemics, and five are strictlyLuzon island endemics. Some eight species are identified as "restricted range species." The highnumber of threatened or endangered endemics in the study area suggests that there should be aconsideration for classification as an official Important Bird Area (IBA) in the Philippines.
The conservation status of the mammals observed in our study suggests that the mid-montanedipterocarp forest at 500-600 and 400-500 m asl, and the mid-montane dipterocarp forest atPuting Lupa at 550-650 m asl, are all important habitats since they harbor the Philippine PygmyFruit Bat (Haplonycteris fischeri), a species designated as vulnerable in the IUCN Red List(1994). Significantly a number of endemic and rare species of horseshoe bats were also recordedin these three study sites. Other species with similar conservation value in the study area werethe Lowland Striped shrew-rat (Chrotomys mindorensis), the Southern Luzon Giant cloud rat(Phloeomys cumingi), the Long-tailed Macaque (Macacafascicularis), the Philippine brown deer(Cervus mariannus), the Philippine warty pig (Sus philippensis), and the Large flying fox(Pteropus vampyrus). More importantly, two new records (Miniopterus schreibersi andPipistrellus stenopterus, which were not previously known to occur on Mount Makiling) wereadded to the faunal list for bats on the mountain.
Frogs are important indicators of environmental health, since they are highly intolerant of severechanges in water quality. One species, Woodworth's Frog (Rana woodworthi), classified as
xrii Michael R. Dove and Percy E. Sajise
in the maintenance of biodiversity. This process is reflected in an observed distinction amongspecies that are good "indicators" of high biodiversity: they tend to have more biologicalfunctions in less "disturbed" areas, whereas they have more sociological functions in moredisturbed areas (an example of the latter being the Areca palm in the Ifugao study site—seeChapter 13).
This coevolutionary perspective enables us to expand our explanations of the conditions ofbiodiversity maintenance and nonmaintenance. For example, this perspective shows us that whensocial systems have undergone this evolution and adopted some of the functions of the naturalsystem, concentrations or "peaks" of biodiversity may be moved toward culture along the nature-culture continuum. An example of this is the biodiversity of home gardens in the Citarum Rivervalley, which (as was hypothesized by the study team) may reach a peak not at the top of thevalley but in its middle and, thus, closer to the "cultural" end of the continuum.
A coevolutionary perspective also helps to explain how high and low biodiversity values arebalanced between nature and culture. Looking at the coevolution of weeds, cultigens, and the"natural" vegetation cover, for example, the study researchers hypothesized that as crop diversitydecreases, weed diversity will increase, and vice-versa.' It was hypothesized, that is, that thegreater the diversity in the agricultural system, and the more it emulates the diversity of thenatural vegetation cover, the less diverse will be the weeds; whereas the less the diversity of theagricultural system and the less it mimics the natural vegetation, the greater will be the diversityof the weeds. (Note how this "push-pull" effect between culture and nature—with biodiversityon one side of the nature/culture line being affected, inversely, by biodiversity on the otherside—fits the triangle image in Figure I.2.) This hypothesis was generally borne out by thestudy's findings in the field (see Chapter 8). This suggests, again counter-intuitively, that theabsence of weed diversity may be a key indicator of biodiversity maintenance (see "indicatorspecies" in next section).
The just-posited relationship between nature and culture, in which diversity "moves" back-and-forth, raises one of the thornier issues of this study: namely, equal levels of diversity, but ofdifferent type and in different locations, may not necessarily seem equally attractive to thehuman observer. Weed versus crop diversity obviously raises this issue. This issue can be seenmore clearly by looking at the general relationship between diversity and (human) standard-of-living. High natural biodiversity often appears to be associated with high standards-of-living(e.g., among tropical forest horticulturalists); and conversely, low biodiversity is associated withlow incomes. In contrast, low man-made biodiversity may often be associated with high incomes(in productive monocultures). Does diversity lose its benefit to humans when it crosses the linefrom nature to culture? Or is the posited comparison invalid (e.g., because it ignores economicexternalities like pollution, and because it ignores the standards-of-living of non-landowningworkers)? In any case, the thorny question of good versus bad biodiversity will be pursuedfurther in the next section.
Methodology
Some of the most difficult challenges encountered during this study involved questions ofmethod. We tried to treat these questions not as merely irritating obstacles to the research,however, but as matters intrinsic to the most basic issues of research itself. We acknowledge alarge conceptual dimension to our study of the relationship between nature and culture and the

224 Juan Carlos T. Gonzalez and Andres Tomas L. Dans
endemic and rare (Alcala 1986) was recorded in some of the study sites on Mount Makiling.Three skinks found on Mount Makiling are endemic and rare in the Philippines. These includethe Black-sided Sphenomorphus (Sphenomorphus decipiens), Steere's Sphenomorphus (S.steerei), and Cuming's Eared Skink (Otosaurus cumingi). Four endemic species represented newrecords to Mount Makiling: the White-spotted Angle head (Gonocephalus semperi), the Smooth-skinned Tree Frog (Philautus surdus), the Luzon Forest Frog (Platymantis sp. A), and the MountMakiling Forest Frog (Platymantis sp. B). The two new species found only in mid-montaneforests of Mount Makiling (and Mount Banahaw) represent two new rare, restricted range,single-island endemics that are worthy of conservation (Alcala, personal communication 1996).
Sociocultural Importance of Fauna
Many residents in Mount Makiling are familiar with the large edible animals and birds, such asdeer, wild pig, hornbills, pigeons, doves, junglefowl, quail, civets, frogs, monitor lizards, and thepython. Other animals are recognized for particular uses such as the Red Junglefowl (Gallusgallus) locally called Labuyo, which is kept for use in cockfighting, or parrots such as theColasisi (Loriculus philippensis) and the Guaiabero (Bolbopsittacus lunulatus), which are caughtalive in glue-traps and sold as pets. Some commensal species are recognized because of thedamage they cause to crops or human habitation. Examples are the Oriental house rat (Rattustanezumi) and the Asian house mouse (Mus musculus) or, because they favor human habitation,the colonizing commensal house geckoes and the Eurasian Tree Sparrow (Passer montanus).Others such as snakes (although they are only a small fraction of the total snake fauna in thePhilippines lethal to man) are recognized because of the harm they can inflict. Rarely wereecological indicators recognized, although some residents do consider fauna as important vectorsfor pollination and dispersal, based on their personal experience. One elderly farmer noted howhe observed sunbirds pollinating the flowers of coconuts and some garden plants around hishouse. Some residents in Bagong Silang identified fruit bats as an indicator of high biodiversity,where the abundance of bats signify the abundance of fruits.
Even with the various laws, administrative orders, and regular patrols of concerned individualson Mount Makiling, disturbance of wildlife is still very evident. Poachers (commercial hunters)and sport hunters enter the reserve illegally to kill and capture a number of species for food, fortrade, and as trophies. Most of these wildlife are vulnerable to extinction. The forest reserve areais administered under the auspices of the Institute of Forest Conservation and the MakilingExperimental and Demonstration Forest, which oversee the awarding of permits to researchersauthorized to conduct studies on the mountain. Hunting, trapping, catching, or killing any kind ofgame or nongame bird or taking the nests or eggs of any such bird is prohibited, except whenauthorized by license issued by the Dean of the College of Forestry.
In this study, trappers in Bagong Silang and Puting Lupa were observed catching Colasisi(Loriculus philippensis), taking 20 individuals in a day to be sold in the marketplace. A hunterkept the head of a Philippine Brown deer (Cervus mariannus) and the pelt of a Southern LuzonGiant cloud rat (Phloeomys cumingi) he had acquired in 1993, and he still continues to huntwithin the reserve. He recently shot a Large flying fox (Pteropus vampyrus), where an orphanednewly born bat was still attached. Despite the control for hunting, sport hunters manage to evadebeing caught, using other means to enter the reserve to hunt. Even inside the reserve (rainforestpark area), evidence of hunting, such as a captive Philippine warty pig (Sus philippensis) andseveral caged Colasisi (Loriculus philippensis) in Bagong Silang, can be observed.

Introduction: Studying Biodiversity and Society in Southeast Asia xxiii
implications of this relationship for biodiversity. Accordingly, we viewed questions about andproblems with methodology as "signposts," as often as not, pointing to unarticulated andunresolved conceptual problems in the way we were framing the research (Thompson,Warburton, and Hatley 1986).
Biodiversity Assessment
The study began (and continued, in some cases) by considering many of the more widely usedmeasures of biodiversity, including (1) the number of endemic species, (2) the number of extinctand endangered species, (3) the pace of genetic erosion, (4) the predominance of market-orientedand monocropped species, (5) agroecological diversity, (6) habitat diversity, and (7) functionalattributes at the community and ecosystem levels (e.g., nutrient pumping, allelopathy). However,because one of the aims of the study was to develop tools for informing policy, with its heavydiscount for time efficiency, much attention also was paid to developing techniques of "RapidBiodiversity Appraisal," with the expectation that such methods would complement, not replace,more traditional, time-consuming methods. These techniques focused in part (although notentirely; see Chapter 6) on identifying and developing so-called "surrogate measures" ofbiodiversity.
Indicator Species. The term "surrogate measures" refers to phenomena that co-vary withbiodiversity but that can be measured more easily or rapidly than biodiversity. Surrogatemeasures that were tentatively identified for the principal Philippine study site on MountMakiling included (1) the presence of Dendrochnide megemiana or nettle plant in the forest,which is interpreted as an indicator of a low incidence of visitation by villagers, which is in turninterpreted as an indicator of undisturbed vegetation and high associated biodiversity; and (2) thepresence of Arenga pinnata in agroecosystems, which is interpreted as an indicator of highbiodiversity because it serves as an important source of food for many wildlife species. For theprincipal Indonesian field site in the Upper Citarum River valley, surrogate measures that wereidentified included (1) low density of a Solanum species, which is interpreted as an indicator ofhigh levels of extraction of fuelwood, which is in turn interpreted as an indication of low levelsof biodiversity; and (2) factors leading to homogenization of the landscape, such as irrigation,riverine flooding, and commercial cultivation of vegetables, all of which are interpreted asindicators of low biodiversity, based on a theorized association of high biodiversity withheterogeneous landscapes.
The use of surrogate measures rests on complex underlying premises, some of which are ascontentious as the methodological problem they are being used to overcome. For example, theuse of three of the four surrogate measures just discussed rests on the premise that humandisturbance is inimical to biodiversity, which is contrary to the ostensible thesis of this study (seelater section on "hierarchical/institutional functions"). For these and other reasons, the topic ofsurrogate measures has attracted considerable attention in the scientific literature, in particular onthe subject of so-called "indicator species," like the aforementioned Dendrochnide megemiana orArenga pinnata. The principal message in much of this literature is the reminder of the manyunstated premises that lie behind the label that something is an "indicator" (viz., of biodiversitymaintenance), of the need to make these premises explicit, and of the need to carefully examinethem.
The purpose of using indicator species is to take advantage of a presumed association between aneasily studied species (or family, or taxa), meaning the "indicator," and some larger group of less

Ecology and Distribution of Vertebrate Fauna 225
Consistent habitat degradation has been experienced in the outlying areas, far from theadministrative center, in the form of agricultural and residential encroachment, illegal loggingand harvesting of forest plants, and disturbances from pollution and even overuse from tourism.Peak II is an example of how disturbances caused by ecotourism can affect the diversity andendemicity of a particular forested area. The mossy forest site along the trail leading to thecamping area at Peak II is where much of the unique vegetation has been damaged by campers.Bottles, cans, plastic containers, and many nonbiodegradable trash litter the camp and the trail.Some hikers continue to remove epiphytic plants from the trees and vandalize forest plants,reducing potential habitats for small forest fauna. In 1995, about a thousand hikers visited PeakII during their summer vacation. Currently, data are not available about the effects of tourism onthe wildlife of Mount Makiling. There are, however, some positive aspects to human influence inthe forest reserve. The local residents in Bagong Silang have begun to regulate the entry ofpoachers, immigrants, and wood collectors into the reserve, although they also continue toharvest wildlife from the adjacent forest as alternative sources of protein and for additionalincome, and for sociocultural uses.
Differences in protection schemes also have an effect on the degree of disturbance wildlife canreceive from the community directly. Dipterocarp forests in Puting Lupa, which has the lowestdiversity among any of the sites on Mount Makiling, experience high human disturbance fromhunting and receive no protection, being the farthest site from the administrative center. Thedipterocarp forests at Bagong Silang experience moderate-to-high diversity due to a decrease inhunting pressure, because of the social impact of the forest reserve and the university policiesand projects that regulate disturbance directly to animals. The dipterocarp forest at Dampalit hasthe highest diversity because it is part of the Los Banos watershed that is protected and prohi-bited from entry.
Conclusion
A total of 170 species of fauna (109 birds, 30 mammals, 19 reptiles, and 12 amphibians) wererecorded in the ten study sites on Mount Makiling. This brings a total of 311 species ofvertebrates known to occur in Mount Makiling, including those previously recorded by otherresearchers. This total consists of 22 species of amphibians, 65 reptiles, 181 birds, and 45mammals. About 135 species from the total are endemic. This is an exceptionally high value forany reserve in the country, almost rivaling the number of wildlife species found in the SierraMadre Mountains in Cagayan and Isabela (Danielsen et al. 1991). It is comparable to thediversity of species found in other national parks in Luzon such as Mount Isarog or MountKitanglad in Mindanao. A total of 40 species of vertebrates on Mount Makiling, most of whichare endemic, are threatened or endangered, which supports the call to increase conservationefforts on the mountain.
The present study observed more than one-half of the known species previously recorded onMount Makiling, in addition to records of new species. The study recorded almost one-half theknown amphibians occurring in Luzon island, about 20 percent of the known reptiles, 45 percentof the known birds, and 30 percent of the known mammals. This indicates that the current studyarea is an invaluable example of the absolute biological diversity present on the island of Luzon,and it can be on a par with other known centers of biodiversity.

xxiv Michael R. Dove and Percy E. Sajise
easily studied species, which will allow the latter to be monitored through the former. A typicalexample is the attempt by Daniels et al. (1991) to calculate the "conservation value" of differentecological zones, habitats, and geographical regions in India, based on the occurrence or non-occurrence of bird taxa, in an attempt to generate conservation prescriptions. The authors notethat they focused on birds because they are well-distributed and much data are available on them(but they also note that bird diversity is negatively correlated with the diversity of some otherorganisms). Another example is the 1994 effort by the Center for Conservation Biology atStanford University to discuss the impact of urbanization on the diversity of bird communities bystudying the diversity of butterflies, based on the presumption that the latter correlates well withthe former.
The obvious ease of relying on indicator species as a "shortcut" to measuring biodiversity has ledto abuses of the concept and to some critical rethinking. A general review is found in Wilson's(1987, 1988) discussion of the importance of the "little things," as well as "big things," that runthe world. Similarly, Pimm and Gittleman (1992) make the point that the "large and cuddly"species that tend to attract the attention of conservationists sometimes serve as good indicatorsfor the rest of the natural environment in conservation planning, but sometimes they do nQt. Alsoresponding to the increasing use of vertebrates as indicator species, Landres, Verner, andThomas (1988) critique, in particular, their use as indicators of population trends and habitatconditions for other species. They suggest that rigorous use of indicators requires (1) clearstatement of the goals of this use, (2) use only when more thorough methods are not possible, (3)use of explicit criteria to select indicator species, (4) use as indicators of all species that meetthese criteria, (5) intensive knowledge of the indicator species, (6) making explicit all subjectiveaspects of the use of the indicator, (7) submission to peer review of all aspects of themethodology, and (8) eventually trying to go beyond the use of status quo indices like indicatorspecies toward measures that can account for natural population variability. A more self-criticaluse of vertebrate indicator species, which can be read as an attempt to deal with these sorts ofcriticisms, is represented by Hanley's (1993) study. Hanley, a U.S. forester, suggests that theSitka black-tailed deer is a good indicator of forest management in Alaska, which can be used asa valuable tool in calculating trade-offs between timber management on the one hand, and on theother the biological and social values of the region's forests. He bases this assessment on the factthat (1) the biology and ecology of the deer is well-known, (2) their large range requirementsnecessitate management of landscapes as opposed to isolated patches, (3) they need a year-roundfood supply, the source of which varies according to the season, and (4) they are an importantgame species for local communities.
Keystone Species and Societies. The concept of indicator species is related to, but distinct from,and commonly confused with, the concept of "keystone species." Keystone species refers toplant and animal resources that assume critical roles, during periods of resource scarcity, insustaining particular ecosystems. Thus, Terborgh (1986a, 1986b) defines as "keystone plantresources," those nonfruit food resources that are available in tropical forests during seasonalperiods of fruit scarcity and that help to support the fruit-eating populations during these leanperiods. The significance of these plant resources lies in the fact that they appear to set thecarrying capacity of the forest. To the extent that keystone plant resources indicate what aforest's carrying capacity is and whether that carrying capacity is still intact, they may beregarded as a sort of "indicator species"—but this is still clearly distinct from the ways justdiscussed in which particular easily studied species/families/taxa are used as proxies orsurrogates or indicators for larger numbers of less easily studied species/families/taxa.

226 Juan Carlos T. Gonzalez and Andres Tomas L. Dans
Attention has been recently given to the use of amphibians as indicators of environmental health(Alcala et al. 1995). Most endemic Philippine forest frogs (e.g., Rana woodworthi) inhabitremote, pristine, and unpolluted creeks and rivers. They easily succumb to deterioration in waterquality through pollution (pesticides, fertilizers, heavy metals, detergents, and other chemicals)and siltation from soil erosion. The majority of terrestrial forest frogs in Mount Makiling live inmicrohabitats ranging from leaf litter in the forest floor to epiphytes and leaf axils in the treecanopy. They are seriously affected by degradation of their forest habitats by activities such aslogging, and land-clearing for agriculture and development. Their demise is also a strongindicator of marginal conditions and degree of disturbance within natural forest ecosystems.
Birds are also good and practical indicators of diversity. They are easy to observe, requiring littleequipment, and show high complexity in community structure (MacArthur and MacArthur 1961;MacArthur 1969, as cited by Gonzalez 1992). However, various other factors affect birddiversity, among which is the effect of elevation. An increase in elevation typically results in adecrease in diversity, such that diversity is inversely proportional to altitude. This was clearlyobserved in the decrease in diversity in the mossy forest site near the peak compared with higherdiversity in the lowland sites on Mount Makiling, such as in the dipterocarp forest in Dampalit.Species richness is highest at low elevations and declines with increasing altitude. Richness,however, is relatively uniform within habitat types, but a high level of species turnover is foundat habitat ecotones (Navarro 1992). This is clearly seen in agroforestry areas on Mount Makiling,wherein diversity is high due to the mixing of species from two different habitat types (forestsand agroecosystems) on an ecotone.
The majority of the mammals in the Philippines are bats and small mammals (such as rodentsand shrews). Due to the lack of large and conspicuous mammals that require large tracts of foresthabitats, alternative mammalian indicators of biodiversity are needed. The high diversity of batsand rodents in the Philippines provides a valuable source of indicators, since many are endemicforest species. These endemics are often restricted in range and are found mostly in primary orold-growth forest. Some are highly restricted and are found only on specific mountains andislands. Others are highly specific to certain microhabitats, with peculiar trophic guilds, feedingon worms, fruits or leaves; a large number are found on highland forests. Small mammals andbats are affected with an increase in disturbance to the habitat, causing a decrease in endemicityand diversity (Rickart, Heaney, and Utzurrum 1991). This was clearly observed in our study siteson Mount Makiling, wherein mammals decreased with increasing human disturbance. Amongbats, the trend is the same as for birds; an increase in elevation results in a decrease in diversity(but not necessarily endemicity). Among small mammals, an opposite trend is observed, whereinan increase in elevation results in an increase in diversity and endemicity. However, this was notthe case for Mount Makiling because of the very few captures despite the high trapping effort.Intolerant endemic small mammals in the forests are replaced by introduced commensal species.
Due to indiscriminate clearing of forests in the Philippines, islands of forests have been formed.These island forests have more critical conditions of biodiversity due to the patchy distributionof vegetation, which prevents species or population from spreading to exchange genetic diversityor isolates populations from their food sources. The fragmentation of the Philippine forests hascaused the decline of many intolerant species, which can be used as indicators of habitat qualityand degree of disturbance. There is a need to connect these forest islands and allow them toregrow or regenerate. Ecotones can provide corridors of habitat for tolerant species to continue tosurvive. They allow secondary growth to regenerate, and through succession provide maturesecond-growth vegetation, allowing some intolerant species to survive as well. The ecotones also

Introduction: Studying Biodiversity and Society in Southeast Asia xxv
A related concept that is highly relevant to this study, however, is that of "keystone societies."After reviewing the literature on human environmental relations, Meilleur (1994) discusses theconcept of "keystone species." Meilleur defines "keystone species" in the orthodox ecologicalsense of "predators at high trophic levels that prey upon organisms at lower trophic levels withinecosystems that would be more uniform under nonkeystone conditions" (viz., in the absence ofthe keystone species). He then suggests that some "biodiversity-enhancing" human societies playa role that is analogous to that of keystone species, in that they are responsible for maintainingthe structure and dynamic of a more diverse and species-rich ecosystem than would exist in theirabsence. He suggests that we call such human societies "keystone societies." Meilleur does notclaim that all human societies—not even all "traditional" human societies—are keystonesocieties, but he maintains that some are (which stands in contrast to the work of some recentscholars, who insist that all human societies invariably diminish the biodiversity of theirenvironments).
An example of what Meilleur labels a "keystone society" is presented in Dove (1993b), which isan analysis of the system of agricultural augury of the Kantu' (a Dayak group in WestKalimantan). Dove argues that the augural system (based on forest birds) helps the Kantu' torandomize agricultural strategies by overriding human predispositions to purposive behaviorthat, in the effectively random environment of the tropical rain forest, get the farmers intotrouble. The overall impact of this belief system, therefore, is to heighten the diversity of theagricultural system and, consequently, that part of the physical environment caught up in it. Thisis one example of the sort of social institutions that make some human societies "keystonesocieties" of the sort described by Meilleur.
The concept of keystone societies is reflected in one of the principal theses of this study, namelythat local communities can contribute not just to biodiversity degradation, but also tobiodiversity maintenance. The study represented, in part, an effort to find, identify, andunderstand the sorts of social institutions that make a keystone society.
Biodiversity Conservation Prioritizing. The wider context in which concepts like "indicatorspecies" have been developed is one of the increasing scope of the contemporary threat to globalbiodiversity, coupled with our increasing awareness of this scope, which together have presentedconservation scientists and activists with a challenge: namely, even if it would be desirable toconserve all biodiversity everywhere, this is not possible. The limitations on the resourcesavailable for conservation make it necessary to use these resources selectively, with the implicitagenda generally being to obtain the greatest impact with the smallest resource expenditure. Theapproach of ecological economics aside (e.g., Perrings, Folke, and Maler 1992), the conceptualbasis for this process of selection has in recent years been focused on the identification of somesort of biodiversity "hot spot" (e.g., Braatz 1992).
The theoretical use of the concept of "hot spots" is illustrated by the article by Pimm et al.(1995), in which it is argued that endemic-rich "hot spots" have disproportionately contributed,by chance alone, to past global patterns of extinction. The authors contrast an "extinction coldspot," the northeastern United States, where historic large-scale deforestation (during Europeancolonization), did not result in a large number of species extinctions, with two "extinction hotspots," the Philippines and Indonesia, where current large-scale deforestation is resulting in ahigh number of extinctions. On the other hand, some of the theoretical shortcomings of theconcept of "hot spots" are illustrated in the recent analysis by Tuomisto et al. (1995), in which itis suggested that recent studies of Amazonian biodiversity have all been guilty of ignoring the

Ecology and Distribution of Vertebrate Fauna 227
provide buffer zones from human disturbance, mitigating the impact of human activities onforest ecosystems. In this analysis, intolerant species and colonizing species are importantindicators of disturbance, although other species may, in turn, provide cues to determine thequality of natural forest.
The Philippines has a network of protected areas comprising several dozen fragments of forest,but only ten of them are larger than 100 km 2 . Most of these fragments have been reduced tovirtually ecological islands; they are of dubious value as enclaves for the many threatenedspecies. Moreover, human encroachment into these national parks and reserves due to greed andpoverty has caused significant disturbance, reducing forest growth and causing further reductionin size by reclassification (Norman-Myers 1988).
Notwithstanding the severe cases of man-made disturbances on the environment and theiradverse effects on biological diversity, some disturbances have allowed, if not an increase,maintenance of their diversity, as was seen in the high avian diversity of agroforestry areas(Figure 9.1). Even monocultural plantations (e.g., citrus, coffee, or coconut plantations in MountMakiling) contained considerable species diversity, apparently as a result of creating a bufferbetween natural and cultivated vegetation and natural forest ecosystems, creating an ecotone.The so-called edge effect allow tolerant forest species to mix with colonist species from the openareas within an intermediate habitat. However, although biological diversity is high at these sites,the status of the species present is not always significant; thus, there are typically few endemic,threatened, or endangered species.
We can then conclude that agroforestry areas can act as buffering ecotones between agriculturaladvancement and forest conservation. It is less important to analyze diversity based on speciescounts and statistical analysis alone. These quantitative data represent only a small fraction ofthe analysis because other factors such as endemicity, tolerance to disturbance, species-specificconditions, and community structure need to be emphasized with regard to the bigger picture onwhat indicators and factors are valuable for biodiversity maintenance. Furthermore, there is moreto be known about the fauna of Mount Makiling. Thus, there is a need to study the fauna to agreater extent by conducting more comprehensive and long-term researches over the standardrapid assessment method. Several other sites around Mount Makiling have not been clearlystudied due to inaccessibility. These sites may provide more insights into the factors that affectand maintain faunal diversity in this area.
Notes
1.Netting results determine the number of individuals captured per net-night or net-day, wherein one net-night or net-day is equivalent to one net set for one night or day.2. Note that after years of disturbance on Mount Makiling, the original dominant dipterocarps are nowreplaced by the more dominant balobo (Diplodiscus paniculatus). However, in this study, the term"dipterocarp" also refers to primary or secondary forests that contain some dipterocarp trees and comprisemostly indigenous forest species.3. The term "good" biodiversity as opposed to "bad" biodiversity refers to diversity in the context ofnaturally occurring species or indigenous species wherein the diversity may be high but may notnecessarily comprise the species typically of the area.4. The term "natural" refers to either primary or secondary forests that contain mostly indigenous rainforestspecies, as opposed to exotics. Natural forest may be disturbed to some extent, but not altered byintroduced vegetation.

xxvi Michael R. Dove and Percy E. Sajise
ecological heterogeneity of the region's dryland forests. The authors argue that field- andLandsat-based studies show that these forests are much more heterogeneous than had beenthought. This ecological heterogeneity includes plant associations a few hundred meters long,landscape patches several kilometers in diameter, and regional patterns hundreds of kilometers insize. Based on these data, the authors suggest that the so-called centers of biodiversity orendemism that have previously been identified in the Amazon have been falsely inferred frominadequate and biased biogeographical data. They conclude by urging greater attention to thecomparability of ecological patches when planning field surveys and extrapolating the results.
The concept of "hot spots" has experienced the typical "life cycle" of recent conceptual advancesin ecological science, starting with limited recognition, proceeding to widespread acceptance anduse, and then falling into some disrepute. Current critics of the concept generally propose, in itsstead, much more complex and "nuanced" methods of identifying areas of importance forconservation. Dinerstein and Wikramayake (1993), focusing on the Indo-Pacific region, critiquemethods of prioritizing based on the concept of either "hot spots" or "mega-diversity countries."They develop an alternate mechanism for prioritizing areas for conservation investment that theycall the "CPTI," for conservation potential threat index. This index forecasts how deforestationduring the coming decade will affect conservation or establishment of forest reserves (whichthey see as the key to conservation). Their index is based on five variables: (1) biologicalrichness, (2) reserve size, (3) size of protected areas, (4) size of remaining forest cover, and (5)deforestation rate. Sisk et al. (1994) are similarly critical of approaches to conservation thatemphasize species (in particular rare species) based on concepts of "regional hot spots,""megadiversity countries," or "range restricted birds." In response these authors developed a toolfor analyzing anthropogenic threats to biodiversity based on (1) geographic patterns in speciesdistribution, (2) species habitat use, (3) forest loss, and (4) human demographic trends. Both ofthese studies, and especially the latter one, point out that their results are dependent on theirassumptions regarding what constitute good indicators of both biodiversity and threats tobiodiversity (both studies assume that deforestation growth and human population growth arecritically important). Sisk et al. (1994) note that their method yields high priority rankings forsome countries (e.g., Taiwan, Angola, Guatemala, Nigeria) that have not been prioritized byscientists using other methods. It is also noteworthy that whereas the "hot spots" and relatedmethods prioritize Indonesia, neither Sisk et al. (1994) nor Dinerstein and Wikramayake (1993)do so; but both prioritize the Philippines (which also is prioritized by the "hot spots" and relatedmethods).
Special Emphases
It became clear early on in this study that the most interesting and useful subject for analysis wasnot a simple listing or inventory of the remaining biodiversity in Southeast Asia, but rather ananalysis of what is happening to biodiversity. It became clear, that is, that what needed to beanalyzed was the dynamics or process of biodiversity maintenance. Accordingly, the emphasis ofthe study shifted from the maintenance of biodiversity per se, to the maintenance of thenecessary and sufficient conditions for biodiversity. The emphasis was shifted to the question,Where—in the interaction of society and environment across space and time—is biodiversitybeing (most successfully and least successfully) maintained? This resulted in corollary emphaseson nonclimax vegetation and on agricultural landscapes, not exclusively but to an extent unusualin a study of biodiversity.

228 Juan Carlos T. Gonzalez and Andres Tomas L. Dans
References Cited
Afuang, L. E., and J. C. T. Gonzalez. 1995. A manual in wildlife 101: Introduction to Philippine wildlife.3rd ed. Los Banos: Wildlife Biology Laboratory, University of the Philippines at Los Banos.
Alcala, A. C. 1986. Guide to Philippine flora and fauna. Vol. 10, Amphibians and reptiles. Manila:National Resources Management Center and University of the Philippines.
Alcala, A. C., C. C. Custodio, A. C. Diesmos, and J. C. T. Gonzalez. 1995. List of amphibians of MountMakiling, Laguna Province, Philippines, with notes on their population status. Paper read at FourthSymposium on Philippine Vertebrates and Annual Meeting of the Wildlife Conservation Society of thePhilippines, April, at University of the Philippines, Diliman, Quezon City.
Alviola, P. L., III. 1977. Avifauna of Mount Makiling. Master's thesis, University of the Philippines at LosBanos, Laguna.
Andrewartha, H. G. 1961. Introduction to the study of animal populations. Journal of Animal Ecology32(1): 82-88.
Apilat, J., and L. Garcia. 1985. Comparative study of the avifauna of three different elevations of MountMakiling. Undergraduate special problem in zoology, University of the Philippines at Los Banos, Laguna.
Balete, D. S. 1988. Feeding ecology of the Malayan false vampire bat, Megaderma spasma (Linnaeus),(Chiroptera, Megadermatidae) in Mount Makiling, Laguna, Philippines. Undergraduate thesis in zoology,University of the Philippines at Los Banos, Laguna.
Barbehenn, K., J. P. Sumangil, and J. L. Libay 1973. Rodents of the Philippine croplands. PhilippineAgriculturist 56:217-42.
Baril, J. A., and A. C. Diesmos. 1993. Birds and mammals of Mount Makiling, Laguna, Philippines. Part ofthe Biodiversity Project of Mount Makiling under the Museum of Natural History, University of thePhilippines at Los Banos.
Bibby, C. J., N. J. Collar, M. J. Crosby, M. F. Heath, C. H. Imboden, T. H. Johnson, A. L. Long, A. J.Stattersfield, and S. J. Thirgood. 1992. Putting biodiversity on the map: Priority areas for globalconservation. International Council for Bird Preservation, United Kingdom.
Bueser, G. L., M. G. De Guia, and R. G. B. Rosell. 1995. Bird species diversity of Dampalit, MountMakiling, Lalakay, Los Banos, Laguna. Undergraduate special problem in ornithology, University of thePhilippines at Los Banos, Laguna.
Castillo, J. A., and F. Soriano. 1993. Notes on frogs found in leaf axils of some forest plants on MountMakiling. Undergraduate special problem in wildlife, University of the Philippines at Los Banos, Laguna.
Catibog-Sinha, C. 1986. The food habits of some forest birds in Mount Makiling, Laguna. SylvatropTechnical Journal for Philippine Ecosystems and Natural Resources 1(1): 68-78.
. 1987. The wild vertebrate fauna of Mount Makiling, Laguna. Philippine Journal of Science116:19-29.
Clements, F. 1991. Birds of the world: A checklist. 4th ed. Vista, Calif.: Ibis Publication.
Collar, N. J., and P. Andrew. 1988. Birds to watch: The ICBP world checklist of threatened birds. ICBPTechnical Publication No. 8. International Council for Bird Preservation, United Kingdom.
Crombie, R. 1. 1994. Checklist of Philippine herpetofauna. Smithsonian Institution, National Museum ofNatural History, Washington, D.C.
Custodio, C. C. 1986. Altitudinal distribution of lizards of the Scincidae in Mount Makiling, Laguna.Sylvatrop Philippine Forest Research Journal 11(3/4): 181-202.
Danielsen, F., D. S. Balete, T. D. Christensen, M. Heegard, 0. F. Jacobsen, A. Jensen, T. Lund, and M. K.Poulsen. 1991. Conservation of biological diversity in the northern Sierra Madre Mountains in Isabela and

Introduction: Studying Biodiversity and Society in Southeast Asia xxvii
Fragmentation. The "forests" examined in this study were, in fact, forest fragments. Forestfragments have been the subject of systematic, widespread study for less than two decades. Oneof the pioneering studies in this field was the "Minimum Critical Size of Ecosystems Project"launched in 1979, which was structured to study what happened to forest fragments as theybecame fragmented.` The "Minimum Critical Size of Ecosystems Project" took advantage of aBrazilian law requiring ranchers to leave 50 percent of the forest cover on their lands intact; thus,the forest fragments being studied are those that ranchers were obliged to leave intact whenclearing the tropical forest for pasture.' Project scientists note that the factor of area has notreceived much attention in the past in studies of extinction, but it is of increasing importancetoday because of the fragmentation of formerly continuous natural habitats (Lovejoy et al. 1984).Project scientists say that even by the early 1990s, we still knew relatively little about the impactof forest fragmentation on ecosystem function and structure, even with respect to answering suchstraightforward questions as to how big a "fragment" has to be before it becomes a viable naturereserve (Bierregaard et al. 1992).
One early publication of some of the results of the "Minimum Critical Size of EcosystemsProject," by Lovejoy et al. (1984), is devoted to a detailed analysis of the effects offragmentation on birds, butterflies, mammals, amphibia, and woody plants. The authors notesome interesting examples of linkage of prospects for survival versus extinction, for examplebetween peccaries and the frogs that live in their wallows, and between army ants and ant-following birds. Another early publication from this project discusses edge effects (referring notto the increase in species at the junction of two major habitats but rather to the consequences ofcreating a sharp edge at a forest margin), including (1) change in microclimate, (2) plantmortality, (3) crowding effects in understory birds, (4) attraction of some birds to the edge, and(5) invasion by secondary growth insect species (Lovejoy et al. 1986). The authors also discuss"area effects" (effects of isolation) on primates, other mammals, army-ants and ant-followingbirds, and euglossine bees. They distinguish between first-order biological responses (e.g., treefall), second-order (e.g., increase in secondary growth insect populations), and third order (e.g.,increase in insectivorous species). They also distinguish two distinct phases of adjustment toforest fragmentation: (1) species adjust to the changing ecological conditions, and (2) the speciesmust then further adjust to demographic and genetic problems. A later report from this projectseparates the major effects of forest fragmentation into five main categories: (1) the effects ofvarying distance of the fragment from the main forest, (2) the effect of varying fragment size, (3)the significance of edge effects in fragments, (4) biotic changes in the fragment because of edgeeffects, and (5) the impact on the fragment of the character of the surrounding vegetation(Bierregaard et al. 1992).
The "Minimum Critical Size of Ecosystems Project" scientists explicitly state that, of the twocomponents of habitat fragmentation—the habitat destruction that creates the fragmentation andthe isolation that follows the fragmentation—their project explicitly focuses on the latter(Lovejoy et al. 1984), with the avowed purpose of informing the design and management ofparks and protected areas, testing island biogeographic theory, and addressing certain issues incommunity ecology (Lovejoy et al. 1986). Whereas this is a typical emphasis for conservation-oriented science, it arguably reduces conservation science to the study of already-degradedenvironments, as opposed to the study of how to prevent or minimize such degradation in thefirst place. An example of how it is possible to do more than study degradation after the fact iscontained in Rudel and Horowitz's (1993) study of how, in practice, forests are fragmented inthe first place. They begin their insightful paper with a discussion of definitions of deforestationand of the way patterns of deforestation vary around the world. Small farmers clear forest along
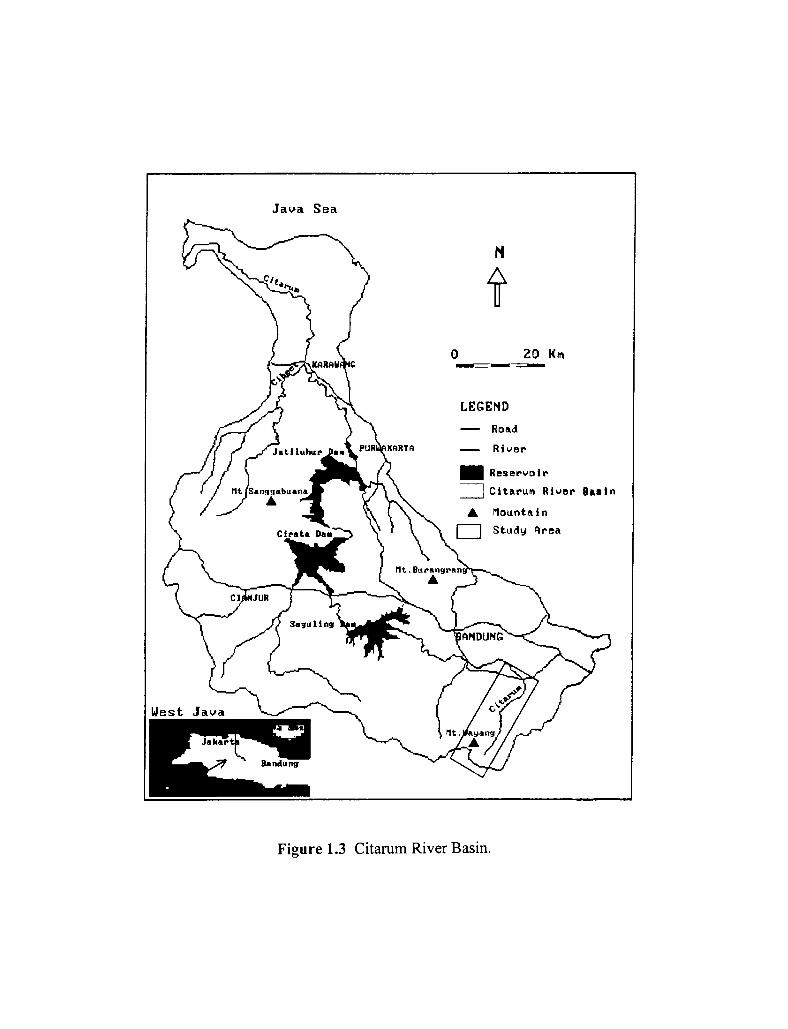
Ecology and Distribution of Vertebrate Fauna 229
southern Cagayan Province, the Philippines. Department of Environment and Natural Resources, Manila;the International Council for Bird Preservation, United Kingdom; and the Danish Ornithological Society,Copenhagen.
Dans, A. T. L., L. M. Espiritu, and N. A. D. Mallari. 1994. Wildlife inventory of Mount Makiling, Laguna,Philippines. Final report, UPLB Basic Research, University of the Philippines at Los Banos.
Dans, A. T. L., and J. C. T. Gonzalez. 1994. Biodiversity study of Mount Makiling, Laguna Province,Luzon, Philippines (wildlife fauna component). Progress report. In The conditions of biodiversity mainte-nance in Asia: The policy linkages between environmental conservation and sustainable development,annual report 1994, ed. M. R. Dove and P. E. Sajise. Khon Kaen: Southeast Asian Universities Agroeco-system Network and East-West Center, Honolulu.
1995. Biodiversity study of Mount Makiling, Laguna Province, Luzon, Philippines (wildlife faunacomponent). Progress repo rt. In The conditions of biodiversity maintenance in Asia: The policy linkagesbetween environmental conservation and sustainable development, annual report 1995, ed. M. R. Doveand P. E. Sajise. Khon Kaen: Southeast Asian Universities Agroecosystem Network and East-West Center,Honolulu.
Dickinson, E. C., R. S. Kennedy, and K. C. Parkes. 1991. The birds of the Philippines. BOU Checklist No.12. British Ornithologists Union, United Kingdom.
Du Pont, J. E. 1971. Philippine birds. Delaware Museum of Natural History, Greenville.
Dy, E. M. 1993. Comparative avian inventory at Mudspring area and at Makiling Botanic Garden area.Undergraduate special problem in zoology, University of the Philippines at Los Banos, Laguna.
Espiritu-Afuang, L. M. 1993. Herpetofauna of Mount Makiling. Paper read on the Philippine vertebrates:A symposium on its conservation and preservation, April, University of the Philippines at Los Banos,Laguna.
Gonzalez, J. C. T. 1990. A comparative survey of avifauna in a grassland and marshland habitat in Laguna.Undergraduate special problem in zoology, University of the Philippines at Los Banos, Laguna.
1992. A comparative study on community structure: Birds of Puerto Galera, Mindoro island,Philippines. Undergraduate thesis in zoology, University of the Philippines at Los Banos, Laguna.
1993a. An avifauna] survey of Puerto Galera, Oriental Mindoro Province, Philippines. Asia LifeSciences 2(2): 163-76.
1993b. Annotated checklist of the vertebrates of Mount Makiling, Laguna, Philippines.Unpublished list.
1995. Island endemism of land vertebrates in the Philippines: A basis for conservation. Paper readat lBS graduate seminar, Institute of Biological Sciences, University of the Philippines at Los Banos.
1996. Morphoanatomy and histology of the testis of five Philippine fruit bats (Chiroptera-Pteropodidae). Graduate special problem in reproductive physiology, University of the Philippines at LosBanos, Laguna.
Gonzalez, J. C. T., and A. T. L. Dans. 1994. Microhabitat analysis of endemic frogs and skinks of MountMakiling, Laguna, Philippines. Asia Life Sciences 4(1).
Goodman, S. M., and P. C. Gonzales. 1990. The birds of Mount Isarog National Park, southern Luzon,Philippines, with particular reference to altitudinal distribution. Fieldiana Zoology (New Series) 60:1-39.
Gruezo, W. S., and A. C. Soligam. 1989. Identification and germination of seeds from droppings ofParadoxurus philippinensis. Journal of Natural History of Siam Society.
Hauge, P., J. Terborgh, B. Winter, and J. Parkinson. 1986. Conservation priorities in the PhilippineArchipelago. Forktail 2:83-91.

Xxviii Michael R. Dove and Percy E. Sajise
a pioneer front at the forest's edge, or around islands of clearing within the forest. Large land-owners or -users clear forest either in large blocks (e.g., for plantations) or along corridors (e.g.,timber operations). Of great interest, they suggest that fringe or edge clearing is most commonfor subsistence farmers, whereas corridor-type clearing is more common for market-orientedusers.
Successional Vegetation. The forces that result in forest fragmentation often also result insuccessional vegetation (Brown and Lugo 1990), which has also attracted more interest byconservation scientists in recent years and figured prominently in our project as well. One focusof this attention is management of various sorts of secondary forests by local communities:increasingly, what were formerly seen as unmanaged, even abandoned secondary forests, arebeing recognized as complex, economic forests managed or semi-managed by localcommunities. For example, Hecht, Anderson, and May (1988) describe successional babassupalm forests in Brazil, which provide important economic support to the rural poor, and whichoccur as the result of a combination of natural and anthropogenic factors. Mary and Michon(1987) describe the process by which natural forests in parts of Sumatra are being replaced byanthropogenic, Damar-based agroforests. And Padoch and Peters (1993) describe the dependenceof West Kalimantan Dayak on (1) forest gardens (which grow up on former village sites), (2)managed forests (adat lands where the forests have never been cleared but are managed), and (3)agroforestry plots (such as rubber gardens, which are established on former swidden sites).Padoch and Peters offer the novel theory that the Dayak move their village sites not because theland has been exhausted by swiddening but because the economic trees that they have planted orotherwise managed in the vicinity of village start to overshadow their front yards, thus making itimpossible to dry rice and other goods there! Of most importance, Padoch and Peters argue thatthe forest gardens, managed forests, and agroforestry plots all represent sophisticated indigenousways of managing natural resources and conserving biodiversity, but because they do notconform to "modem Western" ideas of management, they are rejected by government officialswho try to replace them with monocultural plantations of rubber or oil palm (e.g.).
Agricultural Landcapes. A third recent emphasis in both our project and the wider field ofconservation studies is the study of agricultural landscapes, which were long ignored in the rushto find "untouched" forests to study (Anderson [ 1952] 1971, 45-46):
Once he is in the field, the average taxonomist is an incurable romantic.... Follow inthe taxonomist's footsteps when he leads an expedition into the tropics or establishes afield station in Central America. There one meets with wide areas of thorn scrub andsavanna used as range and pasture, considerable land in field crops and in gardens, and athigher elevations, wide expanses of pinewood, more or less pastured and more or lesscut over. Very rarely a remote ridge rises to a peak and is clothed around the summitwith a cloud forest. From the moment a taxonomist arrives in the area these tiny patchesof cloud forest are the center of his interest; from his behavior one would suppose theywere his main reason for being in Central America. Admittedly they are beautiful andbiologically interesting in more ways than one. Scientifically they offer no morefundamental problems than do dump heaps or dooryards or maize fields or villagegardens, all of which will be ignored by your true taxonomist.
In attempting to answer this question of, Where is biodiversity?, a strong but not exclusive—emphasis developed in our own project on the study of biodiversity in agricultural landscapes orecosystems and on the processes of agricultural change and evolution that may be affecting

230 Juan Carlos T. Gonzalez and Andres Tomas L. Dans
Heaney, L. R. 1986. Biogeography of the mammals of Southeast Asia: Estimates of colonization,extinction, and speciation. Biological Journal of the Linnean Society 28:127-65.
. 1991. An analysis of patterns of distribution and species richness among Philippine Fruit Bats(Pteropodidae). Bulletin of American Museum of Natural History 206:145-67.
Heaney, L. R., D. S. Balete, L. Dolar, A. C. Alcala, A. T. L. Dans, P. C. Gonzalez, N. R. Ingle, M. Lepiten,W. R. Oliver, E. A. Rickart, B. R. Tabranza Jr., and R. C. B. Utzurrum. In prep. A synopsis of themammalian fauna of the Philippine islands.
Heaney, L. R., P. C. Gonzales, and A. C. Alcala. 1987. An annotated checklist of the taxonomic andconservation status of land mammals in the Philippines. Silliman Journal 34(1-4): 32-66.
Ingle, N. R. 1992. The natural history of bats on Mount Makiling, Luzon island, Philippines. SillimanJournal 36(1): 1-26.
Ingle, N. R., and L. R. Heaney. 1992. A key to the bats of the Philippine islands. Fieldiana Zoology (NewSeries) 69:1-44.
IUCN (International Union for the Conservation of Nature and Natural Resources). 1994. IUCN red list ofthreatened animals: Philippines. Unpublished list.
Jackman, J., L. Fiedler, and A. Waldbauer. 1983. A checklist of birds of Los Banos and Mount Makiling,Laguna, Philippines. Unpublished list.
Johns, A. D. 1986. The effects of selective logging on the ecological organization of a peninsularMalaysian rainforest avifauna. Forktail 2:65-79.
King, B. F., and E. C. Dickinson. 1975. A field guide to the birds of South-east Asia. London: Collins.
MacArthur, R. H., and J. W. MacArthur. 1961. On bird species diversity. Ecology 42(1).
Mallari, N. A. D. 1992. Species diversity along elevational gradients in different study sites in the SierraMadre Mountains in Isabela and Cagayan. Undergraduate thesis in biology, University of the Philippines atLos Banos, Laguna.
Mendoza, M. M. 1986. Optimal time and duration of avian census in a forested area. Sylvatrop PhilippineForest Research Journal 11(3/4): 161-80.
. 1987. Updated checklist of Mount Makiling avifauna. Philippine Journal of Science 116:31-47.
Miranda, H. C., Jr. 1987. Bird species diversity as related to the vegetation structure of disturbed lowlandforest in Mount Makiling. Master's thesis, University of the Philippines at Los Banos, Laguna.
Navarro, A. G. 1992. Altitudinal distribution of birds in the Sierra Madre del Sur, Guerrero, Mexico. TheCondor 94:29-39.
Norman-Myers, M. S. 1988. Environmental degradation and some economic consequences in thePhilippines. Environmental Conservation 15(3): 205-13.
Pargas, I. F. 1991. Comparative study of kidney structures in various groups of Philippine bats (ClassMammalia: Order Chiroptera). Undergraduate thesis in zoology, University of the Philippines at LosBanos, Laguna.
Pedregosa, M. DG. 1992. Blood parameters of the Blue-headed Fantail (Rhipidura cyaniceps) on MountMakiling, Laguna. Undergraduate thesis in biology, University of the Philippines at Los Banos, Laguna.
Ricero, C. P. 1991. An ecological study and survey of a grassland community at the Dairy Training andResearch Institute, University of the Philippines at Los Banos. Undergraduate special problem in zoology,University of the Philippines at Los Banos, Laguna.
Rickart, E. A., L. R. Heaney, and R. C. B. Utzurrum. 1991. Distribution and ecology of small mammalsalong an elevational transect on southeastern Luzon, Philippines. Journal ofMammalogy 72(3): 458-69.

Introduction: Studying Biodiversity and Society in Southeast Asia xxix
biodiversity. The premise of this focus is that agricultural biodiversity mimics, reflects, andpromotes natural biodiversity.
One of the earliest foci of this biodiversity-oriented interest in agriculture were the home gardensof Java, a subject in which several of this project's scientists did pioneering work (Widagda et al.1984), and which continued to figure prominently in our own study (see especially Chapters 2and 4). The subject of home gardens continues to attract interest, including Anderson's (1993a,1993b) comparative reviews of home gardens in Malaysia and Singapore, and in Southeast Asiaand Mexico, and Dove's (1990) analysis of their political dimensions. Of particular relevance tothe findings of our own study is the analysis by Mary and Michon (1994) of "forest gardens" inthe vicinity of Bogor.6 Mary and Michon are interested in the process of garden "conversion"brought about by population pressure and increasing market orientation in semi-urban zones. Inthis process of conversion, the economic and ecological functions of the gardens change. Thesechanges help the village achieve more of a balanced relationship with the city, but they also (ofrelevance to our project) tend to have deleterious effects on biodiversity. Perhaps of most interestand importance, there still are gardens where there were gardens before; and so to the untutoredeye little has changed—but in reality a great deal has changed.
A more recent focus in research on biodiversity in agricultural landscapes has been the greenrevolution and its impacts, both direct and indirect (e.g., Brush, Corrales, and Schmidt 1988;Brush 1992; Yapa 1993). The focus on this and other dimensions of agricultural intensificationand development leads to such questions as, Where in the agroecosystem is biodiversity? Anexample from our own study of one way to answer this question is the analysis in Chapter 4 ofthe correlation between avian biodiversity and agroecosystem complexity (cf. Chapters 11 and13). Another way of operationalizing this question is to ask, In what land-use types (within agiven agroecosystem) are most endangered species found (or in what land-use types are speciesmost endangered)? A corollary question is, What land-use types are most endangered? Bothquestions reflect this project's emphasis not on biodiversity per se, but on the linkage betweenbiodiversity and the conditions for its maintenance.
An important thesis underlying much of this research on biodiversity in agricultural landscapes,and which is explicit in our own study, is that a critical determinant of agricultural biodiversity isthe heterogeneity of the agricultural landscape, so that as this heterogeneity varies, so too willbiodiversity vary. This thesis is thoroughly investigated on the unique agricultural landscape ofthe Ifugao, in Chapter 13 of this volume. A corollary, more general thesis is that as theheterogeneity of the overall landscape (cultural as well as natural) varies, so too will overallbiodiversity. This thesis is explored in Chapter 12, in a pioneering application of GIS method-ologies to this topic.
Additional possibilities for theoretical studies of biodiversity in agricultural landscapes areillustrated by Kruess and Tscharntke's (1994) examination of the hypothesis that extinctions insmall and isolated habitat patches do not affect all insect species equally. Looking at insects inexperimental plots of clover established in agricultural landscapes in Germany, the authors foundthat the isolation of the clover patches had the greatest negative impact on diversity ofparasitoids. The parasitoids most likely to disappear are those with small and fluctuatingpopulations. The authors conclude that habitat fragmentation affects insect predators more thantheir insect hosts, thereby also reducing overall predation, releasing pest insects from parasitism,and potentially allowing pest outbreaks. They suggest that designing the agricultural landscape tomaintain connections among habitats may contribute to bio-control of insects. Another example
Ecology and Distribution of Vertebrate Fauna 231
Rubio, R. P. 1977. Food and feeding habits of the house bat, Scotophilus temminckii (Horsfield),Chiroptera: Vespertilionidae. Master's thesis, University of the Philippines at Los Banos, Laguna.
Sabio, M. P. Y. 1992. Determination of some Haematological values of three species of Philippine fruitbats. Doctor of Veterinary Medicine thesis, University of the Philippines at Los Banos, Laguna.
Sargeant, D. E. 1992. A birder's guide to the Philippines. Norfolk, England.
Sumangil, J. A. 1996. Identification of plantar pads of small mammals on Mount Makiling, Laguna,Philippines. Undergraduate special problem in zoology, University of the Philippines at Los Banos.
Taylor, E. H. 1922. Herpetological fauna of Mount Makiling. Philippine Agriculturist 11(5): 127-38.
Ticsay, M. V. 1981. Paradoxurus hermaphroditus. Master's thesis, University of the Philippines at LosBanos, Laguna.
Villacarillo, E. P. 1991. A study on the morpho-histological structure of the stomach of field birds withnotes on their feeding habits. Undergraduate thesis in zoology, University of the Philippines at Los Banos,Laguna.
Zimmer, J. T. 1918. A few rare birds from Luzon, Mindanao, and Mindoro. Philippine Journal of Science13:223-32.

xxx Michael R. Dove and Percy E. Sajise
is Warner's (1994) analysis of the impact of agricultural intensification on bird populations inlinear (viz., edge) grassland habitats in Midwestern United States. Warner concludes that suchhabitats do not sustain birds requiring interior habitats or even some edge-adapted species. Inaddition, he concludes that such linear habitats are not always the "predator traps" for nestingbirds that they are popularly thought to be. In general, Warner finds that the sustainability ofbirds in such habitats is greatly affected by the nature of the surrounding matrix.
Biodiversity: Measures and Issues
In addition to the methodological issues discussed in the preceding section, concerning how westudy and assess biodiversity, a number of important, more conceptual issues were raised in thisstudy, concerning what we ultimately made of the biodiversity data that we gathered. Theseissues all involve the general question, What do we mean by "biodiversity"? More specifically,they concern the distinction between (1) "good" versus "bad" biodiversity, (2) species diversityversus ecological function, and (3) biodiversity per se versus various other inferred dimensionsof the environment.
Types of Biodiversity
A fundamental question in this and in all other current research on biodiversity is this: Is high
biodiversity the same thing as good biodiversity? This question, among others, began to be askedin reaction to the overly simplified, mechanical equation of high biodiversity figures with a"good" environment. (The unqualified valuation of all high biodiversity is analogous, in itssimplicity [although it is philosophically opposed to], to the unqualified valuation of all"undisturbed" environments.) This reaction led to the conceptualization of types of biodiversitythat were not valued, perhaps most notably "weedy" biodiversity. As the term implies, this refersto biodiversity that has developed in association with human perturbation of the environment;and as the pejorative connotations of the term also imply, this is not the sort of biodiversity thatis valued by conservation scientists. In a typical analysis, Noss (1991) attacks the thesis thatsince human disturbance promotes diversity, human disturbance is not such a bad thing. Noss(ibid.) goes on to the point that most of the diversity thus promoted is of the "weedy" sort, that itis already abundant, and, thus, that it does not need our further protection and promotion.Although there is considerable logic in this type of argument, it does ignore the fact that some ofthe world's "weedy species" predate twentieth century clearing of forests for supermarkets (etc.),but have co-evolved with humans and their perturbations over a much longer period of time(Richard, Goldstein, and Dewar 1989).
If "bad" biodiversity is characterized as "weedy" species, then "good" biodiversity seemsincreasingly to be characterized as endemic species. (This is in keeping, of course, with thecommon if questionable belief that "undisturbed" habitat equates with biodiversitymaintenance.) Even in our own study (Chapters 7, 8, 11), the preference for endemic species isbeing used to "deconstruct" field data showing that measures of biodiversity in agroforestry plotson Mount Makiling may rival measures in "natural" forest, to argue that the agroforestrybiodiversity is not as "good" as it appears because few if any endemic species are involved. Doesthis sort of qualification, based on the distinction between good and bad biodiversity, add to orsubtract from our understanding of the situation? Is the dichotomy between endemic and weedyspecies just another unilluminating way of dichotomizing nature and culture all over again?

232 Juan Carlos T. Gonzalez and Andres Tomas L. Dans
Appendix Table 9.1 List of amphibians recorded on Mount Makiling Rainforest Park, Luzon,Philippines
Common name Family Species Remarks
Philippine Woodland Frog Ranidae Rana magna macrocephala endemic
Woodworth's Frog Ranidae Rana woodworthi endemic
Variable-backed Frog Ranidae Rana signata similis endemic
Common Small-headed Frog Ranidae Occidozyga laevis commensal
Common Forest Frog Ranidae Platymantis dorsalis endemic
Corrugated Forest Frog Ranidae Platymantis corrugatus endemic
Luzon Forest Frog Ranidae Platymantis sp. A endemic
Mount Makiling Forest Frog Ranidae Platymantis sp. B endemic
Common Tree Frog Rhacophoridae Polypedates leucomystax commensal
Smooth-skinned Tree Frog Rhacophoridae Philautus surdus endemic
Luzon Narrow-mouthed Frog Microhylidae Kaloula kalingensis endemic
Total species: 12Total endemic: 10

Introduction: Studying Biodiversity and Society in Southeast Asia xxxi
The value-laden distinction between endemic and weedy species is clearly related to the widerdebate about the validity of distinctions between the wild and the non-wild, between nature andculture. This has been the subject of an intensifying debate over the past few years. In one widelyread article, for example, Denevan (1992) critiqued the notion that North America was a pristinewilderness at the time of the first European contact (cf. Cronon 1983). Callicott (1991) takes thisargument further and argues that in contemporary planning the concept of nature reserves or"wilderness" areas is dualistic, ethnocentric, and not workable (cf. Gomez-Pompa and Kaus1992). Rolston (1991), in a rebuttal to Callicott, argues that the concept of "natural wilderness" isvalid and necessary. (It is quite clear that if we accept the validity of the concept of "naturalforest" in the first place, there certainly was none in our study sites: even in the protected areasof Mount Makiling in Luzon and Mount Wayang in Java, the forest has been heavily modifiedthrough human interaction.)
These divisions between nature and culture loomed continuously in the background of our study.For example, in one of the earlier workshops, the aversion of the project researchers to makingmeasurements or observations along garbage-strewn trails (because they seem "un-natural") wasdiscussed. It was agreed that because of the emphasis in our biodiversity study on the linkagebetween society and environment, this is precisely the sort of place that the project should study;so a considerable effort was made to suppress this "aversion," but with what success we cannotsay. Richard, Goldstein, and Dewar (1989) is an illuminating example of an effort to tackle thisissue head-on, by studying garbage-eating, "weedy" macaques in Pakistan (cf. Dove 1992). It isimportant, in any case, for conservation scientists to recognize that the aversion and thedichotomy that underlies it bear heavy costs, one of the most consequential of which is theperhaps unnecessary opposition between conservation and society (especially local society). Thisopposition underlies the dominant development paradigm that Dasmann (1988) says has made itimpossible to promote either cultural or biological diversity except at the other's expense. Thisdichotomy has, in effect, made it difficult if not impossible to even conceive of cultural andbiological priorities except in opposition to one another, completely irrespective of the fact thatthere is frequent covariation between cultural and biological priorities.
Species versus Functions
Another way of dealing with the distinction between good and bad biodiversity is to distinguishspecies from "functions." A number of analysts have responded to overly simplistic valuations ofhigh biodiversity (viz., regardless of type) by arguing that levels of biodiversity are notmeaningful without considering functions, meaning that these levels must be evaluated in termsof their wider ecological as well as social functions. For example, the results of the project'sstudies on Mount Makiling in Luzon indicate that biodiversity levels in less human-affectedecosystems such as the mountain's mossy forest and mid-montane dipterocarp forest are onlyslightly higher than the levels in the agroforestry systems that are also found on the mountain(Chapters 7, 8, 11). The latter biodiversity levels, however, have very different social andecological implications than the former ones: namely, the agroforestry system has strongeconomic and social functions, whereas the forest has stronger ecological functions.
This differentiation in functions can be partially explained in terms of the coevolutionary theorydiscussed earlier (see "coevolutionary relations between nature and culture"). According to thistheory, in more anthropogenic landscapes (e.g., close to the foot of Mount Makiling or far downthe Citarum River valley in West Java), some of the functions of the natural system are likely tohave been assumed by the cultural system. This means that high biodiversity levels in such areas

Ecology and Distribution of Vertebrate Fauna 233
Appendix Table 9.2 List of reptiles recorded on Mount Makiling Rainforest Park, Luzon, Philippines
Common name Family Species Remarks
Philippine Bent-toed Gecko Gekkonidae Cyrtodactylus philippinicus endemic
Jagor's Sphenomorphus Scincidae Sphenomorphusjagori endemic
Black-sided Sphenomorphus Scincidae Sphenomorphus decipiens endemic
Steere's Sphenomorphus Scincidae Sphenomorphus steerei endemic
Cox's Sphenomorphus Scincidae Sphenomorphus coxi endemic
Cuming's Eared Skink Scincidae Otosaurus cumingi endemic
Spotted Green Tree Skink Scincidae Lamprolepis smaragdina resident
Common Mabouya Scincidae Mabuya multifasciata commensal
Spiny Waterside Skink Scincidae Tropidophorus grayi resident
White-spotted Angle head Agamidae Gonocephalus semperi endemic
Malay Monitor Lizard Varanidae Varanus salvator resident
Spot-bellied Short-headed Snake Colubridae Oligodon modesdum endemic
Paradise Tree Snake Colubridae Chrysopelea paradisii resident
Elongate-headed Tree Snake Colubridae Ahaetulla prasina resident
Common Rat Snake Colubridae Elaphe erythrura resident
Northern Triangle-spotted Snake Colubridae Cyclocorus lineatus endemic
Philippine Cobra Elapidae Naja philippensis endemic
Barred Coral Snake Elapidae Calliophis calligaster endemic
Philippine Pit-viper Viperidae Trimeresurus flavomaculatus endemic
Total species: 19Total endemic: 12Total commensal: 1

xxxii Michael R. Dove and Percy E. Sajise
are likely to be associated with more social functions and fewer ecological ones. A question thatremains to be asked is how levels of biodiversity are affected by this coevolutionary process,whether they are necessarily likely to be lower when associated with social as opposed toecological functions, and so on. Another question that remains to be asked is, What is the bestway to manage this coevolutionary process, or what is the best way to moderate nature/culturerelations, to ensure that all necessary functions—social as well as ecological—are filled?
This focus on function thus points us back toward a question raised earlier that underlies all ofthis discussion: namely, what is the biodiversity for? What kind of biodiversity should bemaintained? One further way to answer this question is in terms of sustainability, meaning thesustainability of the overall system of environmental relations or resource-uses. Given theeconomic, ecological, and social forces at different hierarchical levels that impinge on aparticular area over time, what biodiversity levels and functions will promote a sustainable land-use system?
Inferences from and to Biodiversity
It should be clear from the preceding sections that there is considerable debate about thesignificance of different measures of biodiversity. Even more problematic, perhaps, is variationin the way that the term "biodiversity" itself is interpreted and used. The term has come to beused loosely as a gloss for a variety of conservation-related states. More specifically, from theperspective of this study, the maintenance of biodiversity is often being inferred when there isevidence that any value of dimension of the value of the environment—whether related tospecies diversity or not—is being conserved. An example is the earlier-mentioned tendency inthis project to infer biodiversity richness and maintenance from evidence of endemicity.Another, more problematic example involves the inference of biodiversity richness and main-tenance from nondisturbance of habitat.
An issue that kept surfacing in the fieldwork for this study was the importance of distinguishingbetween biodiversity maintenance on the one hand, and on the other hand the lack of disturbanceor perturbation of natural habitats. Study researchers were continually challenged by thetemptation to conflate the two, to "read" lack of human disturbance as biodiversity maintenance.For example, species that are good indicators of undisturbed forest and water were implicitlyused as good indicators of high biodiversity. In fact, although lack of habitat disturbance maycorrelate with high biodiversity, it will not necessarily correlate with biodiversity maintenance inthe sense that it is used in this study. The term "maintenance" itself implies a context ofdisturbance or perturbation, within which biodiversity is actively maintained through humanmanagement. Indeed, one of the central theses of this study is that the presence —not absence—of local communities can contribute to the maintenance of biodiversity. This study represents anattempt, therefore, to try to understand the difference between the maintenance versusdegradation of biodiversity in "disturbed" anthropogenic environments, not simply the obviousdifference between presumed pristine versus disturbed environments. (If all human presence andhabitat perturbation was classified as detrimental to biodiversity, then this thesis could not, bydefinition, be investigated.)

234 Juan Carlos T. Gonzalez and Andres Tomas L. Dans
Appendix Table 9.3 List of birds recorded on Mount Makiling, Luzon, Philippines, and their residency status and feeding guildsFeeding
Common name Local name Family Species name guilds RemarksOsprey Lawin Pandionidae Pandion haliaetus R migrant
Besra Sparrowhawk Lawin Accipitridae Accipiter virgatus R resident
Philippine Serpent-eagle Agila Accipitridae Spilornis holosphilus R endemic
Philippine Falconet jbong-bingi Falconidae Microhierax erythrogenys SR endemic
Red Junglefowl Labuyo Phasianidae Gallus gallus TIF resident
Blue-breasted Quail Pugo Phasianidae Coturnix chinensit TIF resident
Barred Button-quail Pugo Tumicidae Turnix suscitator TIF resident
Spotted Button-quail Pugo Turnicidae Turnix ocellata TIF Luzonendemic
Pompadour Green Pigeon Punay Columbidae Treron pompadora AF resident
Green Imperial Pigeon Balud Columbidae Ducula aenea AF resident
Philippine Cuckoo-Dove - Columbidae Macropygia tenuirostris AF endemic
Common Emerald-Dove Umamban Columbidae Chalcophaps indica TF resident
Luzon Bleeding-heart Lagaran Columbidae Gallicolumba luzonica TF Luzonendemic
White-eared Brown Dove Limukon Columbidae Phapitreron leucotis AF endemic
Amethyst Brown Dove Kukuk Columbidae Phapitreron amethystina AF endemic
Cream-bellied Fruit Dove Punay Columbidae Ptilinopus occipitalis AF endemic
Turtle Dove Batu-bato Columbidae Streptopelia sp. TF resident
Zebra Dove Batu-bato Columbidae Geope is striata TF intro-duced?
Guaiabero Bubutok Psittacidae Bolbopsittacus lunulatus AF endemic
Colasisi or Philippine Hanging- Kolasisi Psittacidae Loriculusphilippensis AF endemic
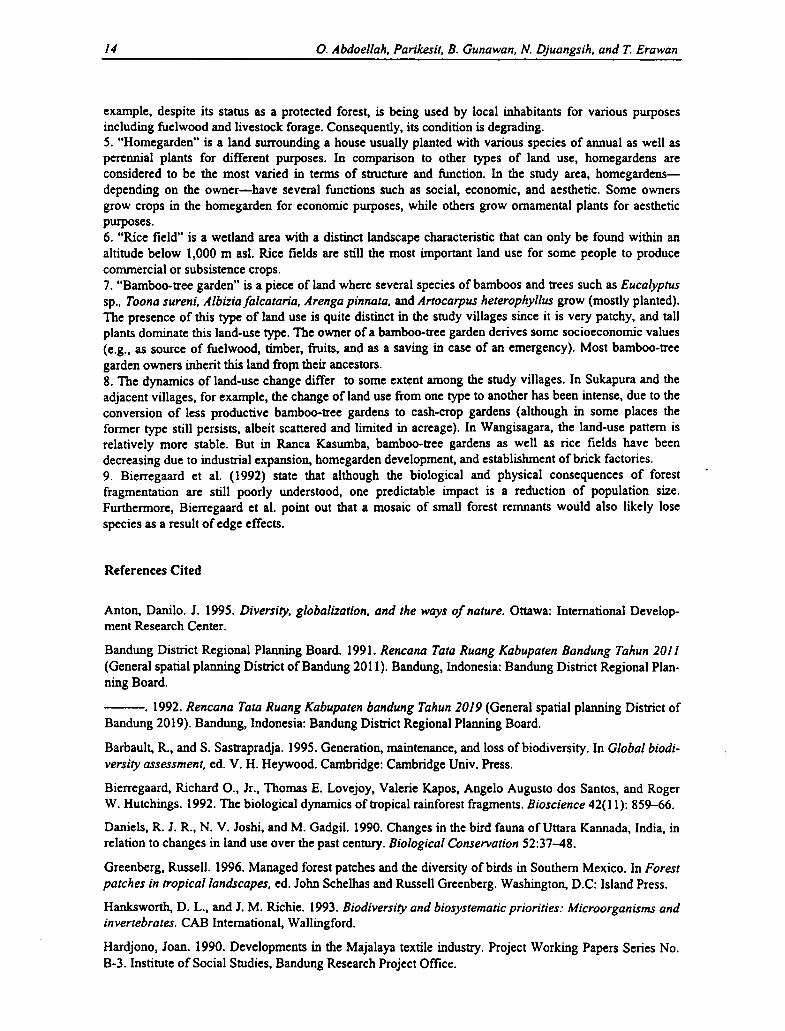
Introduction: Studying Biodiversity and Society in Southeast Asia xxxiii
Biodiversity Variation
The final question raised in this study of biodiversity is, What factors are responsible forbiodiversity variation? The study researchers were early on able to identify numerous possibledeterminants including (1) physical factors such as stage of ecological succession, altitude, andproximity to zonal transitions, in particular those between nature and culture; (2) managementfactors such as the length of human settlement, diversity of the human resource-base, openversus closed access to resources, intensity of resource-use, and extent and character of marketlinkages; and (3) dimensions of perturbation, including its temporal and spatial pattern, inparticular the extent of landscape fragmentation. Subsequent analysis of these determinantsrevealed the existence of several integrating relations or "functions," which appear to haveimportant explanatory power with respect to biodiversity variation.
Spatial Functions
One of the most obvious functions involved in biodiversity variation is spatial: that is, variationin biodiversity levels often appears to have distinct spatial dimensions. One of the initialhypotheses of this study, indeed, was that biodiversity does not vary in a linear fashion along thecontinuum from more anthropogenic to more natural environments, which has been to someextent supported by evidence from the field research. Figure I.3 shows various conceptions of theway that biodiversity may vary along this culture-nature continuum. Figure I.3A shows a strictlylinear relationship, in which biodiversity increases in a proportionate manner to decreases in thedistance to more natural habitats (or in a manner proportionate to decreases in the amount ofanthropogenic influence on the habitat). Few scholars today would argue that biodiversity variesin this fashion, however. Most would argue that variation in biodiversity is best represented byFigure 1.3B, which shows a curvilinear relationship between biodiversity and the culture-naturevariable. In this view, biodiversity increases only slowly as one moves away from anthropogenicenvironments (like cities), but then it accelerates as one nears more natural environments (likeprotected forests). (This is our implicit, customary geography of the nature-culture continuum.)This vision lies behind the planning of most protected areas, which try (along with their bufferzones) to encircle the accelerated or steep portion of the biodiversity curve I.3B, in order toprotect as much biodiversity as possible within as little territory as possible.
The curvilinear relationship hypothesized in this project differs slightly from that shown inFigure I.3B. The project's hypothesis was that something happens in the middle zones betweenmore anthropogenic and more natural environments, which is unlike what happens either aboveor below this place on the curve. The result is an anomaly on the curve, which is something likethe S-shaped curve shown in Figure I.3C. And, in fact, this thesis of an S-shaped curve has beensupported by many of the project's field findings. At both of the project's major field sites, in theCitarum River valley and on Mount Makiling, high (and in some cases the highest) measures ofbiodiversity have been obtained in middle zones. This finding has potentially great implicationsfor the design of protected areas, which—as suggested above—are implicitly based on normalnot S-shaped curvilinear functions. (That is, the customary geography of protection assumes thatprotected values increase in a linear fashion with distance.) This finding raises the possibility, forexample, that a protected area's buffer zone may contain higher biodiversity than the protectedarea itself (which raises problematic questions such as, Which zone is "subsidizing" the other?).
There is a related research finding, involving the fact that for any given territory, the curvilinearfunction that obtains for one direction will likely not obtain for all other directions. For example,

Ecology and Distribution of Vertebrate Fauna 235
Appendix Table 9.3 List of birds recorded on Mount Makiling, Luzon, Philippines, and their residency status and feeding guildsFeeding
Common name Local name Family Species name guilds RemarksWhite-throated Kingfisher Salak-sak Alcedinidae Halcyon smyrnensis TI resident
Luzon Tarictic Hornbill Tariktik Bucerotidae Penelopides manillae FF Luzonendemic
Chestnut-headed Bee-eater - Meropidae Merops viridis SSI resident
Blue-tailed Bee-eater - Meropidae Merops philippinus SSI resident
Coppersmith Barbet - Capitonidae Megalaima haemacephala AIF resident
Philippine Pygmy Woodpecker Manuktok Picidae Dendrocopos maculatus BGI endemic
Crimson-backed Woodpecker Manuktok Picidae Chrysocolaptes lucidus BGI resident
Sooty Woodpecker Manuktok Picidae Mulleripicus funebris BGI endemic
Red-breasted Pitta - Pittidae Pitta erythrogaster TI resident
Barn Swallow Layang-layang Hirundinidae Hirundo rustica Swl migrant
Barred Cuckoo shrike Uwak-uwakan Campephagidae Coracina striata AIF resident
Blackish Cuckoo shrike Uwak-uwakan Campephagidae Coracina coerulescens AIF endemic
Pied Triller Thong-pan Campephagidae Lalage nigra FGI resident
Philippine Fairy Bluebird - Irenidae Irena cyanogaster AIF endemic
Yellow-wattled Bulbul - Pycnonotidae Pycnonotus urostictus AIF endemic
Yellow-vented Bulbul Pulangga Pycnonotidae Pycnonotus goiavier AIF resident
Philippine Bulbul Turunyak Pycnonotidae Hypsipetes philippinus AIF endemic
Balicassiao Balikasyaw Dicrundae Dicrurus balicassius Sal endemic
Elegant Titmouse - Paridae Parus elegans FGI endemic
Velvet-fronted Nuthatch - Sittidae Sittafrontalis BGI resident
Striped-headed Rhabdomis - Rhabdomithidae Rhabdornis mysticalis BGI endemic
Black-crowned Tree Babbler - Timaliidae Stachyris nigrocapitata AIF endemic
White-browed Shortwing - Turdidae Brachypteryx montana TI resident
Magpie Robin - Turdidae Copsychus saularis FGI resident
White-browed Shama - Turdidae Copsychus luzoniensis TI endemic
Island Thrush - Turdidae Turdus poliocephalus FGI resident
Pied Chat - Turdidae Saxicola caprata TI resident
Arctic Warbler - Sylviidae Phylloscopus borealis FGI migrant
Philippine Leaf-warbler - Sylviidae Phylloscopus olivaceus FGI endemic
Duboi's Leaf-warbler - Sylviidae Phylloscopus cebuensis FGI endemic
Mountain Leaf-warbler - Sylviidae Phylloscopus trivirgatus FGI resident
Oriental Reed-warbler - Sylviidae Acrocephalus orientalis FGI migrant
Striated Grasshopper Warbler - Sylviidae Locustella fasciolata FGI migrant
Philippine Tailorbird - Sylviidae Orthotomus castaneiceps FGI endemic
Grey-backed Tailorbird - Sylviidae Orthotomus derbianus FGI endemic
Mountain Tailorbird - Sylviidae Orthotomus cucullatus FGI resident
Tawny Grassbird Tinteryok Sylviidae Megalurus timoriensis FGI resident
Striated Grassbird Tinteryok Sylviidae Megalurus palustris FGI resident
Bright-capped Fantail-warbler - Sylviidae Cisticola exilis FGI resident
Oriental Bush Warbler - Sylviidae Cettia diphone FGI migrant
Blue-breasted Flycatcher - Muscicapidae Cyornis herioti Sal Luzonendemic
Grey-streaked Flycatcher - Muscicapidae Muscicapagriseisticta Sal migrant
Black-naped Blue Monarch Chiki-chiki Monarchidae Hypothymis azurea Sal
Blue-headed Fantail - Rhipiduridae Rhipidura cyaniceps Sal endemic
Yellow-bellied Whistler - Pachycephalidae Pachycephala philippensis Sal endemic
Olive Tree Pipit - Motacillidae Anthus hodgsoni TI migrant
Petchora's Pipit - Motacillidae Anthus gustavi TI migrant

xxxiv Michael R. Dove and Percy E. Sajise
Surrounding Social Environment
Protected • Area
• 1 1
•tom, t ^ S
.......................•
Key: ...... boundary of protected area— — — - limit of nth % of total biodive rsity
Figure I.4 Irregular relation between culture and nature, and itsimpact on biodiversity.
the GIS data for Mount Makiling show that the extent of landscape fragmentation varies aroundthe mountain; it is not uniform.' To the extent that the project thesis associating fragmentationwith high biodiversity has held true, then these GIS data mean that measures of biodiversity-and the society-environment relations that explain them—also vary around the mountain (viz., asfactors like topography, access, arability, etc., also vary). This lack of uniformity is illustrated inFigure I.4, which shows how the distance within which some "nth" percentage of a protectedarea's biodiversity will be maintained will vary in an irregular fashion around that area. Thisfinding, of a two-dimensional lack of uniformity in the conditions of biodiversity maintenance,has obvious implications for planning protected areas, which typically assume uniformity. It alsorelates to a more general discussion within conservation regarding the character of artificialplanning boundaries. For example, Janzen (1986) argues that the boundaries to protected areasare entirely artificial constructions that are ignored by much of the natural (and also social)world. Cross-boundary threats come from normal dispersal, migration, "subsidies," crops andcrop pests, pesticides, fire, and even climate change. He notes that "edge effects" should beexpected within 5 kilometers of the boundary of protected areas of tropical forest, and that thisdistance will be even greater when wide-ranging vertebrates are involved.
A second related research fording involves the interesting relationship between fragmentationand disturbance. It is theorized that the relationship between these two variables is probablyshaped liked an inverted U, as illustrated by Figure I •5.8 This seems intuitively correct: incompletely disturbed areas (e.g., like a plantation), there will be little fragmentation, and incompletely undisturbed areas, there (e.g., a protected forest) also will be little fragmentation; sothe highest degree of fragmentation will come somewhere in between. Returning to our thesisregarding the relationship between landscape fragmentation and biodiversity maintenance, this.supports our suggestion that high (if not highest) biodiversity will occur in middle zones. That is,Figure I.5 supports the biodiversity function shown in Figure I.3C.

236 Juan Carlos T. Gonzalez and Andres Tomas L. Dans
Appendix Table 9.3 List of birds recorded on Mount Makiling, Luzon, Philippines, and their residency status and feeding guildsFeeding
Common name Local name Family Species name guilds RemarksBrown Shrike Tarat Laniidae Lanius cristatus SR migrant
Long-tailed Shrike Berdugo Laniidae Lanius schach SR resident
White-breasted Wood-swallow - Artamidae Artamus leucorhynchus SSI resident
Coleto Kuhling Stumidae Sarcops calvus AIF endemic
Olive-backed Sunbird .Pipit-puso Nectariniidae Nectarinia jugularis IN resident
Purple-throated Sunbird Pipit-puso Nectariniidae Nectarinia sperata IN resident
Lovely Sunbird - Nectariniidae Aethopyga shelleyi IN endemic
Flaming Sunbird - Nectariniidae Aethopygaflagrans IN endemic
Buzzing Flowerpecker - Dicaeidae Dicaeum hypoleucum AF endemic
Pygmy Flowerpecker - Dicaeidae Dicaeum pygmaeum AF endemic
Bicolored Flowerpecker - Dicaeidae Dicaeum bicolor AF endemic
Orange-breasted Flowerpecker - Dicaeidae Dicaeum trigonostigma AF endemic
Philippine Flowerpecker - Dicaeidae Dicaeum australe AF endemic
Striped Flowerpecker - Dicaeidae Dicaeum aeruginosum AF endemic
Eurasian Tree Sparrow Mayang-bato Passeridae Passer montanus AF introduced
Mountain White-eye Matang-isda Zosteropidae Zosterops montanus AIF resident
Golden-yellow White-eye Matang-isda Zosteropidae Zosterops nigrorum AIF endemic
Philippine White-eye Matang-isda Zosteropidae Zosterops meyenl AIF endemic
Chestnut Munia Mayang-pula Estrildidae Lonchura malacca AF resident
White-breasted Munia Maya Estrildidae Lonchura leucogastra AF resident
Legend: R - Raptorial; SR - Semi-raptorial; TI = Terrestrial Insectivore; Swl - Sweeping Insectivore; Sal - Sallying Insectivore; SSI =Sallying or Sweeping Insectivore; FGI = Foliage-gleaning Insectivore; BGI = Bark-gleaning Insectivore; FF = Faunivore or Frugivore; AIFArboreal Insectivore or Fntgivore; TIF = Terrestrial Insectivore or Frugivore; IN - Nectarivore or Insectivore; TF = Terrestrial Frugivore; AF =Arboreal Frugivore.

Index ofFragmentation
Introduction: Studying Biodiversity and Society in Southeast Asia xxxv
(Completely Index of Disturbance (CompletelyDisturbed UndisturbedAreas) Areas)
Figure I.5 U-shaped relationship between disturbance and fragmentation.
Temporal Functions
The second obvious function involved in the variation of biodiversity is temporal: that is, thereare distinct patterns of variation in biodiversity levels over time. An important question bears onthe relationship between the temporal and spatial functions. What is the relationship, therefore,between perturbation and fragmentation? More specifically, how does the temporal patterning ofperturbation relate to the spatial patterning of fragmentation; and how does this affectbiodiversity? To ask these questions is to ask how time and space are related with respect tobiodiversity maintenance. This is a complex and difficult question but clearly one of greatrelevance to the question how biodiversity is maintained.
It is also important to compare temporal processes in culture and nature. Natural succession itselfis obviously a temporal phenomenon. Orthodox thinking in conservation long held that the bestmaintenance of biodiversity is associated with the most mature natural successions, which byimplications give the larger role in biodiversity maintenance to nature and the smaller role toculture. (That is, biodiversity maintenance is associated with less, not more, human interferenceor perturbation in natural processes.) But another temporal process with implications for biodi-versity maintenance is the coevolutionary process described earlier. It often appears as ifbiodiversity maintenance also is associated with mature coevolutionary relations, in which manyimportant functions have been assumed from nature by culture, which means a small role fornature in biodiversity maintenance and a larger role for culture. Mature coevolutionary relationsoften can be observed in long-established human settlements, which raises the question whethersuch settlements are analogous to mature natural successions in terms of their implications forbiodiversity.
National Environmental Transitions. It also is useful to compare natural and cultural temporalprocesses on a wider or larger scale. A number of observers have suggested, for example, thatrelations between society and environment around the globe generally follow a customarydevelopmental path. Thus, Ludwig, Hilborn, and Walters (1993) suggest that all resource

Ecology and Distribution of Vertebrate Fauna 237
Appendix Table 9.4 Netting results for birds recorded at Mount Makiling, Luzon, Philippines,1993-96
Species A B C D E F G H I i
Turn Ix ocellata' - - - 1 - 1 - - -
Chalcophapsindica - - 1 - - - 1 - - -
Phapitreron leueotis - - - - - 1 - - - -
Gallicolumba luzonica - - - 1 - - - - - -
Bolbopsittacus lunulatus - I - - I - - - - -
Otus megalotis - - 1 - - - - - -
Harpactes ardens I - - I - - - - -
Actenoides lindsayi 1 1 1 4 1 2 - 1 - -
Dendrocoposmaculatus - - - - I - - - - -
Siva frontalis - - I - - I - - - -
Lanius cristatusb - 2 - - 2 2 4 1 - 2
Dicrurus balicassius - - 1 6 - - - - 1 -
Parus elegans 1 1 5 - I I - - - -
Pycnonotus urostictus I - 2 2 - 2 - - -
Pycnonotus goiavier - - 10 - - - - - -
Hypsipetes philippinus 1 6 3 16 6 4 - 6 - 5
Stachyris nigrocapitata - 1 3 4 1 - - 2 - -
Brachypteryx montana 2 1 2 - I - - - 1 -
Copsychus luzoniensis - 1 1 5 1 - - - - -
Megalurus timoriensis - - - - - - l - - -
Phylloscopus cebuensis - - I - - - - - -
Phylloscopus olivaceus - - 1 6 - - - - - 1
Orthotomus derbianus - - 3 1 - - - - - -
Rhipidura cyaniceps 3 10 22 11 1 4 - 1 - -
Pachycephala - 6 9 17 6 - - - 2 -philippensis
frena cyanogaster - - I - • - - - - -
Anthus gusto° - - - - - - -
Zosterops nigrorum - 1 - - - - - - -
Dicaeum pygmaeum - 6 31 - 31 - - - - -
Dicaeum australe - - 1 3 1 - - - -
Lonchura leucogastra - - - - - - 1 - - -
Cyornis herioti - 1 2 - 1 - - - - -
Total species 6 21 15 13 14 8 5 5 3 8Total endemic 5 16 12 12 12 5 1 4 2 6Percent endemic 83 76 80 92 86 63 20 80 67 75Total individuals 9 65 49 77 65 18 7 11 4 13a. Bold text endemic species.
b. Migrant species.
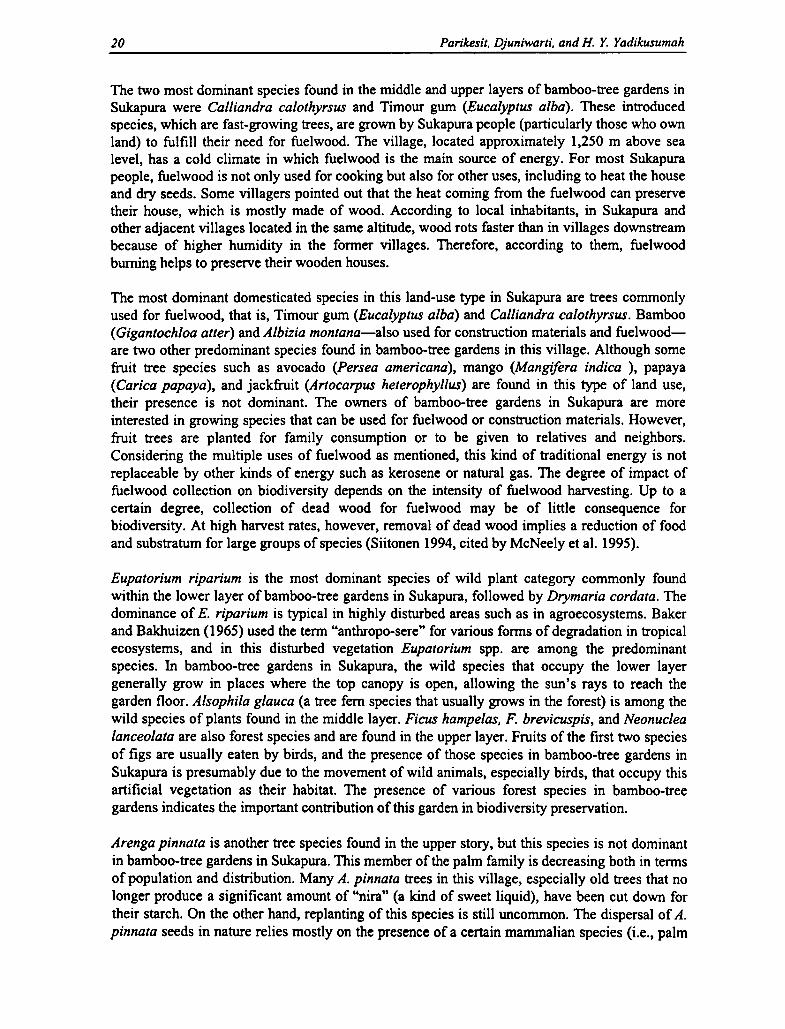
xrxvi Michael R. Dove and Percy E. Sajise
degradation follows an historically established pattern, which we must study and understand tohave any hope of changing. One of the most powerful ways of analyzing this pattern involves theconcept of "national environmental transitions." This has been the subject of recent analyses byPanayotou (1994) and Mather (1990); with the latter arguing that in the course of their economicdevelopment, all nations go through a "forest transition" in which they first degrade and thenrestore their forests, and the former arguing that in fact some such transition takes placeinvolving all natural resources. Mather (1990) begins by discussing the "forest transition" thathas taken place in a number of the Northern industrialized countries. This consists of an earlydiminishment in forest cover, followed by a subsequent restoration in this cover. This process,which may take centuries to complete, is called the "forest turn-round" by Mather. Matherpresents convincing evidence to suggest that all nations have experienced, or will experience,this pattern of deforestation and afforestation. On the other hand, Panayotou (1994) begins withthe famous "Kuznets curve" from economic development theory. Kuznets postulated that duringa country's economic development, disparities between rich and poor will rise early on and thenbegin to fall—meaning that the relationship between development and income disparity is U-shaped. Panayotou argues that a similar relationship holds for environmental degradation. Thus,just as socioeconomic inequity rises early on in the development process, only to fall later on, thesame holds true for environmental degradation. This correlation in the curves of socioeconomicequity and environmental conservation is in accord with the premise underpinning this study,namely that there is a functional association between the "health" of society and the "health" ofthe environment. It follows from this premise, therefore, that socioeconomic and environmentboth worsen early on in the development process, and that both improve at the same time later onin this process.
The analyses by Mather and Panayotou offer a powerful paradigm for thinking about thehistorical and national-level processes—the wider temporal and spatial context—that frame themicro-level processes of biodiversity maintenance. Their work shows us, first, that the conditionsof biodiversity maintenance that we study at the level of the household, community, and evenwatershed, river system, or mountain, are subsumed within—and thus affected by—largernational-level (and, of course, even international-level) forces, which we must not neglect. Theirwork shows us, second, that studies of biodiversity maintenance at these various levels give usonly a "snapshot" in time of these processes, and that we need to see how these snapshots fit intothe longer temporal processes that precede as well as follow them. Thus, we need to know notjust where Mount Makiling and the Citarum River basin are today in terms of biodiversity, weneed to know where they are going and where they will be in the future. We need to be able tosay, in short, where these study sites are on the transitional curves of which Mather andPanayotou speak. This is particularly important if we want this project to impact nationalconservation policy.
An example of how this perspective can be used to design conservation interventions is found inDove (1995), which focuses specifically on social forestry in Asia but is generally concernedwith the theory of planned intervention to counter environmental degradation. Dove's analysisbegins with a critique of the notion that environmental change—in this case, deforestation—is agradual process, resulting from the irrational pressure of local communities on their resourcebase. Instead, he suggests that drastic environmental changes often take place in very shortperiods of time, precipitated not by unpredictable local economic variables but by predictableextra-local political ones (cf. Sajise and Omengan 1990). Dove also suggests that just asenvironmental degradation may be concentrated during short periods of time, so may theopportunities (or "windows") for planned intervention be similarly limited in time. (Focusing on
238 Juan Carlos T. Gonzalez and Andres Tomas L. Dans
Appendix Table 9.5 List of mammals recorded on Mount Makiling, Luzon, Philippines, 1993-96
Common name Family Species Remarks
Common Short-nosed fruit bat Pteropodidae Cynopterus brachyotis resident
Philippine Pygmy fruit bat Pteropodidae Haplonycterisfischeri endemic
Dagger-toothed flower bat Pteropodidae Macroglossus minimus resident
Musky fruit bat Pteropodidae Ptenochirusjagorii endemic
Common rousette Pteropodidae Rousettus amplexicaudatus resident
Large flying fox Pteropodidae Pteropus vampyrus resident
Diademe roundleaf bat Rhinolophidae Hipposideros diadema resident
Philippine forest roundleaf bat Rhinolophidae Hipposideros obscurus endemic
Arcuate horseshoe bat Rhinolophidae Rhinolophus arcuatus resident
Big-eared horseshoe bat Rhinolophidae Rhinolophus macrotis resident
Small rufous horseshoe bat Rhinolophidae Rhinolophus subrufus endemic
Yellow-faced horseshoe bat Rhinolophidae Rhinolophus virgo endemic
Common bent-winged bat Vespertilionidae Miniopterus schreibersii resident
Common Asiatic myotis Vespertilionidae Myotis horsefieldii resident
Orange-fingered myotis Vespertilionidae Myotis rufopictus endemic
Javan pipistrelle Vespertilionidae Pipistrellusjavanicus resident
Narrow-winged pipistrelle Vespertilionidae Pipistrellus stenopterus resident
Luzon forest shrew Soricidae Crocidura grayi endemic
Asian house shrew Soricidae Suncus murinus commensal
Asian House mouse Muridae Mus musculus commensal
Common Philippine forest rat Muridae Rattus everetti endemic
Polynesian rat Muridae Rattus exulans commensal
Oriental house rat Muridae Rattus tanezumi commensal
Lowland striped shrew-rat Muridae Chrotomys mindorensis endemic
Southern Luzon giant cloud rat Muridae Phloeomys cumingi endemic
Long-tailed macaque Cercopithecidae Macacafascicularis resident
Common palm civet Viverridae Paradoxurus hermaphroditus resident
Malay civet Viverridae Viverra tangalunga resident
Philippine warty pig Suidae Sus philippensis endemic
Philippine brown deer Cervidae Cervus mariannus endemic
Total species: 30Total Philippine endemic: 12Total commensal: 4
Introduction: Studying Biodiversity and Society in Southeast Asia zxxvii
the issue of local economic versus extra-local political determinants of degradation, Dove thencritiques the notion that the solution to degradation is to add resources to the local system, asopposed to reforming wider institutional structures of power.)
Long-Term Climate Change: Cyclic and Noncyclic. There are long-term, large-scale processeswith natural as well as cultural dynamics, which can affect biodiversity. An example of currentinterest is the ENSO (El Nino-Southern Oscillation) phenomenon. El Niflo is a marked increasein the temperatures of the eastern equatorial Pacific (and La Nina is a marked decrease), and theSouthern Oscillation is a regular pattern of oceanic and atmospheric fluctuations. El Niflo usuallyoccurs with extreme fluctuations in the Southern Oscillation, so the two are called ENSO. ElNino is associated with drought in Indonesia and elsewhere in Southeast Asia (and La Nina isassociated with very wet weather) (Nicholls 1993). ENSO-related drought and wet periods arenot random events, therefore. Moreover, they tend to occur at the same time of the year whenthey do occur. In addition, El Nino events tend to be followed by La Nina events, and vice-versa.Nicholls (1993) argues that ENSO plays a very large role in the natural ecology of SoutheastAsia, in agriculture, and in human health.
Salafsky (1994) carried out an intensive study of the impact of ENSO phenomena on one localein West Kalimantan. He begins by pointing out that ENSO-related droughts do occur inenvironments that we otherwise think of as very wet, such as Kalimantan. He documents thedeleterious economic impact of one such drought (in 1991) on the durian, coffee, rice, non-timber forest products, and other economic resources of several villages in West Kalimantan,concluding that the drought cost the villages one-fourth to one-half of their annual income.Salafsky also suggests that the intensity of ENSO-related droughts may be increasing due toglobal climate change.
Another example of a global process, where there is much more evidence of interaction betweennatural and cultural processes, is global warming. Pimm and Sugden (1994) cite recent researchthat documents a worldwide increase in the rate of forest "turnover," which is a measure of therecruitment of individuals into, and the death of individuals from, a given area of forest. Theysuggest that this increase is linked to the buildup in atmospheric CO2 (which enhances plantproductivity), as the result of the release of increasing amounts of greenhouse gases. Oneconsequence of this increased turnover is likely to be a decrease in species diversity in the forest.Thus, we can see a linkage between anthropogenic global climate change and biodiversitydegradation.
Hierarchical/Institutional Functions
In addition to the spatial and temporal dimensions, there is a third critical dimension ofbiodiversity variation, namely the institutional. This refers to hierarchical, social organizationalvariables and the need to view localized issues of biodiversity variation within this widerinstitutional context. The major hierarchical levels involved, and some of the major determinantsof biodiversity that operate at each level, are (1) the community level, with determinantsincluding intensity of resource use (e.g., cropping intensity), heterogeneity of land uses,population density, strength of local institutions for resource management, socioeconomicequity, tenurial regimes, cultural diversity, length of settlement, and extent of incorporation intothe nation-state; (2) the regional level, with determinants including distance from andinvolvement in markets, extent of government control and involvement in developmentprograms, access to road or water transport, proximity to international borders, and ecosystem

Ecology and Distribution of Vertebrate Fauna 239
Appendix Table 9.6 Netting success for bats recorded on Mount Makiling, Luzon, Philippines,1993-96
Study sitesA B C D E F G H I J
Total Net-nights 20 71 128 90 120 36 32 30 27 40
Total individuals 4 75 119 38 93 3 13 3 9 14
Netting success 0.2 1.07 0.93 0.42 0.78 0.08 0.41 0.1 0.33 0.35
Total species 3 6 9 5 7 1 3 2 5 4
Total endemic 1 2 4 1 3 - 1 1 1 2
Percent endemic 33.3 33.3 44.4 20 42.9 - 33.3 50 20 50
Total megabats 3 4 4 3 4 1 3 1 3 4
Netting success 0.20 1.04 0.66 0.4 0.43 0.08 0.41 0.07 0.19 0.35megabats
Total microbats - 2 5 2 3 - - 1 2 -
Netting success - 0.03 0.27 0.02 0.35 - - 0.03 0.15 -microbats

xxxviii Michael R. Dove and Percy E. Sajise
types and structures; (3) the national level, with determinants including conservation policy,resource policy, tax and trade policy, land-use classification, environmental consciousness andethics, and political/regulatory constancy; and (4) the global level, with determinants includinginternational market pressures, and international attitudes toward resource degradation.
One of the most obvious ways that larger-scale institutional processes affect smaller-scalenatural processes is through political instability. There is a growing literature on the effects ofwarfare and security concerns on biodiversity. For example, Nietschmann (1990) analyzes theimpact of two decades of war on the natural environment of Nicaragua, drawing attention toseveral aspects of the Nicaraguan government's attempt to fight rural "insurgents," in particularthe forced relocation of people from rural to urban areas and the ban on possession of firearms.These policies (among others) had the indirect effect of taking pressure off overstressed rural,natural environments. Nietschmann calls the positive impact an "environmental windfall."Although not all of the consequences of Nicaragua's civil war were good for its naturalenvironment, the overall impact seems to have been positive. In contrast, most of the data fromAsia suggest that when resource management regimes are disrupted by civil or internationalconflict, such that both oversight and incentives for conservation are removed, resources areabused and natural environments are degraded. Conflict seems typically, that is, to be a "windowof >j-opportunity" as far as the environment is concerned. And indeed, whereas theenvironment of Nicaragua had been "rejuvenated," in Nietschmann's words, when most of theconflict in Nicaragua ended around 1990, the people had also been impoverished, and this raisedthe specter of overuse of natural resources in the immediate post-war years, as the ruralpopulation concentrated simply on feeding itself. So the long-term impact of the conflict on thenatural environment is still unclear. A final point: Nietschmann correctly notes that theNicaraguan civil war not only had an impact on natural resources and the environment, but it wasin fact about (control of) natural resources and the environment .9
Another way that macro-micro linkages affect biodiversity maintenance is through theestablishment of conceptual boundaries for systems of both resource-use and resourceconservation. The implications for biodiversity maintenance are especially great in the not-uncommon case in which there are discontinuities between the two types of boundaries. Thesediscontinuities lead to questions about who is degrading versus protecting biodiversity, who isbenefitting from biodiversity and who is not, and who is taking responsibility for biodiversityand who should take it. During a project workshop in Indonesia in the fall of 1994, theparticipants visited a small local shrine within a protected forest on Mount Wayang in West Java.The workshop participants initially attempted to find some sort of instrumental linkage betweenthe shrine and the protected forest. But the local villagers who were interviewed did not supportthis effort: on the contrary, they said that although they had to pay the price of maintaining theshrine—by not exploiting resources in its vicinity, etc.—all of its benefits were reaped by theoutsiders who came to seek its blessings.
This image of local cost (and blame) and extra-local benefit (and presumptive innocence) isechoed in many current "revisionist" analyses of conservation challenges. An example isGadgil's (1992) analysis of biodiversity in India. Gadgil blames the degradation of bothbiological and cultural diversity in India on the British-initiated "omnivores" of state-subsidizedbusiness, and also the British-initiated conversion of lands into open access resources. He notesthe role that religion plays in indigenous conservation of biodiversity, and the way thatgovernment has undercut this supportive role through state attacks on sacred groves (etc.). Heargues that instead of chasing after imaginary causes of biodiversity degradation (often located
240 Juan Carlos T. Gonzalez and Andres Tomas L. Dans
Appendix Table 9.7 Trapping success of nonvolant small mammals recorded on Mount Makiling,Luzon, Philippines, 1993-96
Study sitesA B C D E F G H I J
Crocidura grays' 1 0 0 0 0 0 0 0 0 0
Mus musculus" 0 0 0 0 0 0 0 1 1 0
Rattus everetti' 15 7 3 11 6 0 0 1 0 1
Rattus exulansb 0 0 2 1 1 0 0 0 1 1
Rattus tanezumi'° 1 0 3 0 0 0 5 1 1 1
Total individuals 17 7 8 12 7 0 6 3 3 3
Total trap-nights 280 326 128 253 300 124 209 200 257 282
Trapping success 6.07 2.15 6.25 4.74 2.3 0 4.59 1.5 1.57 1.06
Total no. species 3 1 3 2 2 0 1 3 1 3
Total no. endemic 2 1 1 1 1 0 0 1 0 1
Percent endemic 66.7 100 33.3 50 50 0 0 33.3 0 33.3
a. Endemic species.
b. Introduced or commensal species.

Introduction: Studying Biodiversity and Socie ty in Southeast Asia xxzix
in the villages), the state needs to recognize its own contribution to the problem and end itssubsidization of the "omnivorous" businesses that are really most at fault.
Some analysts suggest that problems like those identified by Gadgil are not the result of failingto correctly understand the situation (as Gadgil implies), rather they are the result of genuine andpredictable differences in self-interest. For example, Wells (1992) systematically compares thecosts and benefits of biodiversity conservation at local, regional, and global levels, and heconcludes (like the aforementioned villagers of Mount Wayang) that the costs of suchconservation typically fall most heavily at the local level, while the benefits typically concentrateat some higher level. He concludes, in short, that costs and benefits vary inversely across theselevels: costs are greatest at the smallest scales, while benefits are greatest at the widest scales (cf.Fox 1992). However, Breckenridge (1992) suggests that the situation may be more complex thanthis. Thus, he argues that the instrumental linkage between protection of the environment andprotection of human rights (a linkage that is in keeping with the central thesis of our study, thatthe health of the natural and social communities is interlinked) provides a shared interest to bothlocal and global (environmentalist) communities, which is starting to be reflected in actualalliances.
Some scholars argue that any engagement with the global community is likely to be inimical tobiodiversity conservation. Thus, Lohmann (1991) notes that in Thailand, business and the statehave caused the most biodiversity losses, whereas the greatest defenders of biodiversity havebeen common farmers. He argues that local people, therefore, have a vested interest in practicesthat are associated with biodiversity conservation, whereas national and international agencieshave a vested interest in the reverse. He especially disagrees with the argument currently popularamong economists that the key to biodiversity conservation is greater engagement with theglobal market economy. He argues, instead, that what is needed is more engagement; heargues that there is a basic flaw in the global environmentalist credo that conservation can takeplace within the global market economy (cf. Corry 1993; Dove 1993a).
Dove's (1996) conclusions are similar to those of Lohmann in his analysis of the proposed use ofthe Western mechanism of intellectual property rights (IPRs) to compensate local communitiesin less developed countries for their role in creating and maintaining biogenetic resources. Hesuggests that while this effort may be well-intentioned, it is likely to fail, if not backfire, becauseof problems not of international but national inequity. The local communities responsible forcreating and maintaining biogenetic diversity are often politically, economically, and culturallymarginal; and as a result, it is unlikely that national elites would pass on to them the benefits ofthe IPRs being offered by the international community. On the contrary, the fact that thesemarginal communities possess valuable biogenetic resources is likely to lead to greater, notlesser, disenfranchisement by covetous national elites. There is, in short, little agreement andmuch disagreement over who the victims, villains, and potential saviors are in the battle overbiodiversity conservation. Closure on this important question may well simply be out of reach atthe present state of our knowledge. But all researchers in the field can, minimally, recognize thatthis is an important dimension of the debate and, above all, make their own subjective valuationson this subject as explicit as possible.
Although there is still disagreement over the role of local communities in biodiversitymaintenance, there is near-universal acceptance (in a dramatic reversal of the situation just onedecade ago) of the fact that local communities must play a central role if biodiversity is to beconserved. This recognition has led to efforts, for example, to promote on practical (as well as

Ecology and Distribution of Vertebrate Fauna 241
Appendix Table 9.8 Summary of residency status and endemicity of vertebrates recorded on MountMakiling Rainforest Park, Luzon, Philippines
Location Faunal groupTotal
speciesTotal
endemic
TotalLuzon
endemicTotal
nonendemicTotal
migrant
Total intro-duced or
commensal
Philippines Amphibian 81 44 - 37 - 5Reptile 236 150 - 77 - 9
Bird 556 169 - 211 171 5Mammal 182 110 - 65 - 7
Total 1055 478 - 390 171 26
Luzonb Amphibian 27 16 4 7 - 4
Reptile 102 68 14 27 - 7
Bird 386 93 25 252 36 5
Mammal 103 54 33 43 - 6
Total 618 231 76 329 36 22
Mount Amphibian 22 12 - 6 - 4Makiling`
- 19 - 6- 84 26 3- 24 - 4
- 133 26 17
3 3 - 2
Reptile 65 38Bird 181 68Mammal 45 17Total 311 13
Present study Amphibian 12 10SUAN
Reptile 19 8 - 7 - 1
Bird 109 49 5 49 10 2
Mammal 30 8 - 10 - 3
Total 170 75 8 69 10 8
a. Afuang and Gonzalez 1995.b. Dickinson, Kennedy, and Parkes 1991.c. Gonzalez 1993b.

xl Michael R. Dove and Percy E. Sajise
political) grounds the in situ (viz., on-the-site) conservation of crop biodiversity, which refers toconservation of biodiversity within indigenous agricultural systems. Brush (1991) offers ageneral review of in situ conservation by farmers of crop diversity (cf. Browning 1991); andShigeta (1990) analyzes a case study of in situ conservation from Ethiopia. Increasingly,planning for collaborative conservation projects with local communities is based on one of thesame theoretical premises that underlies this study, namely that any efforts to safeguard thehealth of the local physical environment cannot be separated from efforts to safeguard the healthof the local social environment, because there is a functional interdependence of biological"health" and social "health," of social diversity and biodiversity. (This equation of biological andsocial health represents one of the most significant efforts to collapse the Cartesian dichotomy ofnature and culture.) The most common application of this new perspective is in planningprotected areas. Thus, Hyndman (1994) critiques the old conservation paradigm that dependedon isolating presumed "natural" areas from people and discusses various aspects of the newparadigm for conservation, which he terms the "social ecology" or "ecodevelopment" paradigm.He says that this is based on "green or indigenous capitalism," assumes the interdependence ofbiological and cultural diversity, and tries to promote conservation through promoting the self-determination of local communities. Similarly Clay (1991) presents a number of examples fromaround the world of how this new paradigm can be used to correct destructive resourcemanagement systems, successfully involve indigenous peoples in the management of protectedareas, and involve local community-level organizations in conservation (cf. Hames 1991).
Study Chapters
The foregoing issues of theory and methodology all arise in the field data-based chapters thatfollow this Introduction. The chapters are organized by country—first Indonesia and then thePhilippines—and then by topic. In addition, the first chapter in each country-section representsan overview of the studies for that country.
Indonesia
Chapter 1, by Oekan S. Abdoellah, Parikesit, Budhi Gunawan, Nani Djuangsih, and Tatang S.Erawan, introduces the reader to the Indonesian team's studies of biodiversity maintenance in theCitarum River valley in West Java, where most of the Indonesian field studies wereconcentrated. This site is close to the home base of the Indonesian team at PadjadjaranUniversity in Bandung. The chapter begins with a discussion of the team's methodological andanalytic approaches. This is followed by a synthesis of the biophysical and socioeconomicconditions of the study sites in the Upper Citarum River valley. The third major section of thechapter summarizes the dynamics of biodiversity maintenance in, first, a protected area of forestat the head of the valley and, second, several sites on the agricultural landscape lower down thevalley.
Chapter 2, by Parikesit, Djuniwarti, and H. Y. Yadikusumah, focuses on the flora of theagricultural landscape in the Citarum River valley. It begins with an overview of the compositionand distribution of this flora. Its central section is devoted to analyses of floral diversity in twocomponents of this landscape, namely bamboo-tree gardens and home gardens, plus a brieferreview of floral diversity in the two remaining principal landscape components, rice fields andcash-crop gardens, and a comparison of diversity measures between samples, between land-usetypes, and between villages.

tiati
Appendix Table 9.9 Summary of feeding guilds or t rophic groups of birds recorded at ten study sites on Mount Makiling, 1993-96Carnivore Insectivore Omnivore Frugivore
Study site R SR TI SwI Sal SSI FGI BGI FF AIF TIF IN TF AF Total
Agroforestry Bagong 1 1 3 1 4 1 13 2 1 9 1 2 1 6 46Silang
Monoculture 1 1 3 2 4 1 8 2 1 5 0 2 I 6 37Bagong Silang
Mixed tree 1 2 3 3 3 u 11 3 1 10 1 1 u 8 47Bagong Silang
Grassland 1 2 I 4 0 0 7 1 0 3 0 0 1 2 22Puting Lupa
Dipterocarp u u u u u I u u u u u u u u uPuting Lupa 450-S00
Dipterocarp u u u u u u u u u u u u u u uPuting Lupa 550-650
Dipterocarp 2 0 3 3 4 I 6 5 1 8 0 2 2 II 48Dampalit
Dipterocarp 1 0 2 1 4 0 9 4 1 9 0 1 1 5 38mid-montane 400-500
Dipterocarp 2 1 4 3 4 1 10 5 1 10 0 2 1 7 51mid-montane 500-600
Mossy forest 0 0 2 1 3 0 4 3 0 5 0 0 0 4 22Peak II
All sites 9 7 21 18 26 5 68 25 6 59 2 10 7 49 312(Total)
Legend: R - Raptorial; SR - Semi-raptorial; TI - Terrestrial Insectivore; Swl - Sweeping Insectivore; Sal - Sallying Insectivore; SSI - Sallying or SweepingInsectivore; FGI - Foliage-gleaning Insectivore; BGI - Bark-gleaning Insectivore; FF - Faunivore or Frugivore; AIF = Arboreal Insectivore or Frugivore; TIF- Terrestrial Insectivore or Fnigivore; IN - Nectarivore or Insectivore; TF - Terrestrial Frugivore; AF - Arboreal Frugivore.
Introduction: Studying Biodiversity and Socie ty in Southeast Asia xli
Chapter 3, by Parikesit, Fani Wiardi, and Djuniwarti carries this analysis of floral diversity intothe protected forest on Mount Wayang at the head of the Citarum River valley. It begins with ananalysis of the vertical structure of the vegetation in this forest, and changes in the vegetation'sstructure as well as composition in three different zones of altitude and human influence. Thenext section examines floral diversity in the forest and the changes in this by, again, zone as wellas sampling method. The final section of the chapter surveys the use of forest resources by localcommunities and analyzes the impact of these uses on floral diversity.
Chapter 4, by Tatang S. Erawan, Nani Djuangsih, Muhammad Muchtar, Harris Setiana, andLucia S. Istanti, repeats these studies of diversity with the faunal populations of the UpperCitarum River valley. The chapter begins with an analysis of the diversity of four faunal groupsin the protected forest on Mount Wayang: avifauna, flying insects, surface soil insects, andterrestrial Squamata. The next section examines the diversity of these same four faunal groups onthe agricultural landscapes of the lower valley, broken down by land-use types: namely, bamboo-tree gardens, home gardens, rice fields, and cash-crop gardens.
Chapter 5, by Budhi Gunawan, Oekan S. Abdoellah, and Erwin Purnawan, examines the impacton biodiversity maintenance of one particular "perturbation" in the Upper Citarum River valley,namely a dairy cattle project introduced by the government into a village on the borders of theprotected forest on Mount Wayang. The chapter begins with an overview of the village and thecattle project. It then goes into the micro-economics and micro-ecology of cattle-raising, withspecific reference to the implications for the biodiversity of the adjoining forest. The chapterconcludes with a discussion of how inadequate planning resulted in this developmentintervention, which was intended to take pressure off the forest but actually increased thispressure in some respects. The problem is that the linkages between nature and culture, betweenforest and village, in livestock raising, are officially unrecognized linkages.
Chapter 6, by Budhi Gunawan, Parikesit, Oekan S. Abdoellah, and Rusydi Kotanegara,synthesizes the methods adapted or developed by the Indonesian team (as reflected in Chapters 1through 5) for carrying out accelerated assessments of biodiversity maintenance. The chapterbegins with a discussion of the conceptual and analytic underpinnings of "Rapid Appraisal forBiodiversity Maintenance" (RABM). It continues with a discussion of six specific indicators ofbiodiversity that can be utilized in RABM. The final section of the chapter lays out the basicsteps involved in carrying out RABM, both in the field and in preparation for fieldwork.
Philippines
The second major section of the book consists of the Philippine studies of biodiversitymaintenance. The first chapter in this section, Chapter 7, by Percy E. Sajise and Mariliza V.Ticsay-Ruscoe, introduces the reader to the principal (but not only) Philippines study site, onMount Makiling, in Laguna, in Batanga Province. This site, as was the case with the principalIndonesian site, is proximate to the home base of the Philippines team at the University of thePhilippines in Los Banos (indeed, Mount Makiling is under the administrative control of UPLB).After a brief discussion of aims and methods, the chapter describes the team's study sites in eachof four zones on Mount Makiling: (1) mossy forest, (2) dipterocarp mid-montane forest, (3)grasslands, and (4) agroecosystems. The rest of the chapter is devoted to a description of themultiple methods used to analyze floral, and to a lesser extent faunal, diversity on the mountain.

Chapter 10
The Functional RelationshipsBetween Plant and Animal Indicator Species
on Mount Makiling, Luzon, Philippines
William Sm. Gruezo and Juan Carlos T. Gonzalez
Introduction
Many ecological studies have determined that plant diversity directly affects animal diversity,forming a complex web of interconnections between flora and fauna to maintain the balance oflife in tropical environments. Due to the stratification and diversification in tropical foresthabitats, the interlinkages between rainforest plants and animals become more cospecific so asnot to invoke competition among other organisms. This one-to-one relationship of specializationbecomes an important driving force for species evolution, as symbiotic (mostly commensal)relationships develop from these partnerships between plants and animals.
Numerous animals coexist in tropical rainforests by subdividing food resources, making use ofdistinct niches to reduce competition and further promote speciation. There has been loosecoevolution between plants and animals, but actual close coevolution is less common. Amongthe most important relationships evident between plants and animals in tropical forests arepollination and seed dispersal. Flowering plants develop syndromes of features to suit particulargroups of pollinators, distinguishing among bats, birds, and insects. Syndromes for fruitcharacteristics are also group-specific, each adaptive to the particular organisms that dispersethem. Some plant species that employ the same animal as pollinators or seed dispersers coexistby flowering or fruiting at different times (or seasons). During lean periods for animalpollinators and dispersers between seasonal fruiting, keystone plant species provide thenecessary food for survival. Plant webs are formed by related plants with similar defensivechemicals, and their insect pests evolve specific feeding guilds, enabling them to detoxify theplant toxins. The effects of "pest pressure" prevent plants belonging to a particular plant webfrom becoming dominant. Within plant webs, members can share pollinators or dispersers,forming "mobile links." Both keystone species and mobile links among plant webs are integral tothe maintenance of ecosystem diversity (Whitmore 1990). Similarly, some faunal speciesdependent on keystone plant species are often considered indicator species as well. The study ofinterconnections between plants and animals is essential to understanding the functioning ofecosystems and how this is prone to disruption.
Seed Dispersal
Fruits are an important food for many rainforest vertebrates (see Appendix Tables 10.1 and10.2). The amount of fruit varies throughout the year, and the number of animals the forest cansupport is determined by the amount of fruits produced during the lean period. Keystone species,which bear fruits year-round, such as figs, provide the staple food for rainforest animals duringdifficult times (Whitmore 1990). Many vertebrate fauna (mostly frugivorous bats and birds) in
243

xlii Michael R. Dove and Percy E. Sajise
Chapter 8, by William Sm. Gruezo, begins with a presentation of the team's findings on floralspecies diversity in each of the aforementioned four zones on Mount Makiling. This is followedby a comparative analysis of floral diversity levels, looking first at differences among the fourzones, then differences by study sites, then by ecosystems, and then by landscapes. The chapterconcludes with a discussion of the functional roles of flora and the utility of indicator species.
Chapter 9, by Juan Carlos T. Gonzalez and Andres Tomas L. Dans, shifts this analysis from theflora of Mount Makiling to its fauna. The chapter begins with a detailed accounting of therigorous field methodology used to trap, net, and survey Mount Makiling's fauna. The rest of thechapter is devoted to analysis of (1) the field data on the diversity of amphibians, reptiles, birds,and mammals, (2) the impact on this diversity of habitat disturbance, (3) the implications of site-specificity for diversity, (4) the implications of community structure for diversity, (5) the statusof threatened species on Mount Makiling, and (6) the sociocultural importance of fauna.
Chapter 10, by William Sm. Gruezo and Juan Carlos T. Gonzalez, combines the results ofChapters 8 and 9 to examine the functional relationships between flora and fauna, in particularbetween floral and faunal "indicator species." The chapter successively examines flora-faunarelations involving (1) seed dispersal, (2) pollination, (3) herbivory, (4) other sorts ofinteractions, and (5) flora-fauna relations in agricultural systems.
Chapter 11, by Herminia A. Francisco, extends the analyses of biodiversity on Mount Makilinginto the agricultural zone on part of its lower slopes. The chapter begins by presenting somebackground information on the community, their farming system, and their attitudes towardbiological diversity. The next section of the chapter then correlates agricultural biodiversity witha number of socioeconomic variables, including household income, farm size, age of farm, andage and education of household head. The rest of the chapter is devoted to a comparison ofscientific versus "folk" conceptions of "indicator species," and a presentation of seven differentindicator species used by the local community.
Chapter 12, by Dante Gideon K. Vergara, synthesizes and analyzes the overall pattern ofbiodiversity on Mount Makiling in relation to one particularly important determinant: namely,fragmentation of the landscape, specifically fragmentation or patchiness of forested landscapes.The chapter begins by reviewing and then rejecting the only existing fragmentation index. Itproceeds to development of a completely new index. The rest of the chapter is devoted to aninvestigation of the relationship between this index and the various biodiversity indices analyzedin Chapters 7 through 11. The results of this investigation generally indicate that biodiversityinitially increases as fragmentation increases, only to later decrease as fragmentation exceedssome fixed limit. The results support this study's hypothesized curvilinear (inverted U-shaped)biodiversity function along the nature-culture continuum (cf. Figures I.1 and I.3).
The last chapter in the section on the Philippines, and in the book as a whole, Chapter 13, byMariliza V. Ticsay-Ruscoe, deals with a second Philippines field site among the famous terracedhillsides of the Ifugao in Asipolo, Ifugao Province. This chapter also begins with a detailedexplanation of the methods used, including several RABM techniques, such as vegetationmapping and profiling, kitchen and market surveys, and participatory transect walks. The rest ofthe chapter is devoted to an analysis of biodiversity in each of six land-use types—woodlot,coffee plantation, swidden, rice terraces, bean garden, and home garden—and an assessment ofthe impact on biodiversity of over one dozen different physical and social variables.

244 William Sm. Gruezo and Juan Carlos T. Gonzalez
the tropics are important as primary seed dispersers for forest plants, which help in the mainte-nance of the natural vegetation, and are vital also for recolonization of cleared forest land.
Fruit Bats
Bats (Chiroptera) in the tropics and subtropics feed on plants, specifically on fruit, nectar, andpollen. The Old World fruit bats of the family Pteropodidae (not to be confused with New Worldfruit-eating bats) play an important role as pollinators and seed dispersers and are responsible forthe propagation of many forest plants useful to humans (e.g., fruit trees, timber trees). In thePhilippines, there are 27 species of fruit bats, of which 17 species are endemic (Heaney et al. inprep.). Eight species (three endemic) are recorded on Mount Makiling, six of which wereobserved in this study. Some of these fruit bats have significant interactions with rainforestplants on the mountain.
Fruits eaten by fruit bats are usually borne on long hanging stalks (penduliflory); some are borneon exposed branches under the canopy (ramiflory), and others are borne on the trunk of the tree(cauliflory). These adaptations in the position of the fruit make them readily accessible to bats.Fruits are made attractive by color and odor, in addition to position on the tree. In thePhilippines, the most significant group of forest plants dependent on bat dispersal are the figs(Ficus sp.) (Moraceae), although many other plants (e.g., Piperaceae, Bombacaceae) have someadaptations that are probably conspecific with fruit bats. Actually, little is known about thespecific relationships of most Philippine endemic fruit bats with their food plants, which is thusan important subject for conservation-related research.
Flying Foxes and Figs (Moraceae). Three species of flying foxes are recorded from MountMakiling, including the Golden-crowned flying fox (Acerodon jubatus), the Large flying fox(Pteropus vampyrus), and the Island flying fox (Pteropus hypomelanus). P. hypomelanus issmaller than the other two species and occurs widely at low elevations in disturbed andundisturbed habitats. The other two species, A. jubatus and P. vampyrus, are known to inhabitprimary lowland forests on Mount Makiling. However, only P. vampyrus still has extant buthighly reduced populations on Mount Makiling, while the Philippine endemic A. jubatus has notbeen observed for the past ten to twenty years. This species is one of a number of endemicwildlife species that have been unable to survive the radical changes in the vegetation of lowlandhabitats on the mountain. There has been a drastic decline in the population of A. jubatus in all ofthe previous distribution ranges in the Philippines, prompting its inclusion in the list ofthreatened animals in the country (IUCN 1994).
Both A. jubatus and P. vampyrus can occur in mixed colonies in roosts (both are considered oneof the largest bats in the world, by wingspan and weight) within forest habitats throughout theircommon range in the Philippines. This must have been the usual scenario—the lowland forestsof Mount Makiling before disturbances caused the demise of A. jubatus. A similar fate befell P.vampyrus, where it is said to have declined in recent years with the same causal factors. Illegalhunting of flying foxes on Mount Makiling for sport still continues. Mostly shot from their dayroosts, these bats are killed for their meat, which is occasionally served as pulutan (finger-food)with alcoholic beverages, or displayed as hunters' trophies. These large bats are also the subjectof local superstitious beliefs, causing fear among the townsfolk. The lack of communityeducation regarding the ecological importance of flora and fauna to local farm people is one gapthat needs to be filled to increase awareness for biodiversity conservation.

Introduction: Studying Biodiversity and Society in Southeast Asia xliii
Notes
1. Other zones of balanced forces that might affect biodiversity maintenance include international bordersand proximity to natural hazards (where zones of tension are created not by pressure on resources but bythe high costs of resource-use).2. Personal communication, William Gruezo, IESAM staff.3. Personal communication, W. Gruezo, IESAM staff. Cf. Baker (1991) on weed evolution and Ellen(1991) on the ethnobotany of weeds.4. For a more typical approach to the study of biodiversity in forest fragments, see Diamond, Bishop, andBalen's (1987) apposite (for this project) analysis of the impact of the 86-hectare Bogor Botanical Gardenon species conservation.5. This raises an interesting question: could these conservation-minded scientists have had a bigger impactby studying the ranchers instead of the forest fragments left behind by the ranchers?6. See also Schelhas' (1994) analysis of the sustainability of an agro-ecological mosaic in Costa Rica.7. Presentation by Dante Vergara during the April 1995 workshop in Los Ba^os.8. Presentation by Dante Vergara during the April 1995 project workshop in Los Banos.9. Some of these same issues are raised by Formoli (1995) in his examination of the impact of the Sovietinvasion on the environment of Afghanistan.
References Cited
Anderson, Edgar. [ 1952] 1971. Plants, man, and life. Berkeley: Univ. of California Press.
Anderson, E. N. 1993a. Gardens in tropical America and tropical Asia. Biotica 1:81-102.
1993b. Southeast Asian gardens: Nutrition, cash, and ethnicity. Biotica 1-11.
Baker, Herbert G. 1991. The continuing evolution of weeds. Economic Botany 45(4): 445-49.
Bierregaard, Richard 0., Jr., Thomas E. Lovejoy, Valerie Kapos, Angelo Augusto dos Santos, and RogerW. Hutchings. 1992. The biological dynamics of tropical rainforest fragments: A prospective comparisonof fragments and continuous forest. BioScience 42(11): 859-66.
Braatz, S. 1992. Conserving biological diversity: A strategy for protected areas in the Asia-Pachc region.Washington, D.C.: The World Bank.
Breckenridge, Lee P. 1992. Protection of biological and cultural diversity: Emerging recognition of localcommunity rights in ecosystems under international environmental law. Tennessee Law Review 59(4):735-85.
Brown, Sandra, and Ariel E. Lugo. 1990. Tropical secondary forest. Journal of Tropical Ecology 6:1-32.
Browning, J. Artie. 1991. Conserving crop plant-pathogen coevolutionary processes in situ. In Biodiversityculture, conservation, and ecodevelopment, ed. M. L. Oldfield and J. B. Alcorn. Boulder: Westview Press.
Brush, Stephen B. 1991. A farmer-based approach to conserving crop germ plasm. Economic Botany45(2): 153-65.
1992. Reconsidering the green revolution: Diversity and stability in cradle areas of cropdomestication. Human Ecology 20(2): 145-67.
Brush, Stephen B., Mauricio Bellon Corrales, and Ella Schmidt. 1988. Agricultural development and maizediversity in Mexico. Human Ecology 16(3): 307-28.
Callicott, J. Baird. 1991. The wilderness idea revisited: The sustainable development alternative. TheEnvironmental Professional 13(3): 235-47.
Functional Relationships Between Plant and Animal Indicator Species 245
However, the most severe cause of indiscriminate killing of fruit bats is the misconception thatbats are the main pests of orchards and coconut groves. Actually, most of these large fruit batsfeed mainly on different kinds of native fruits found in the forests (including some grown outsidethe forest as cash-crops). Larger species of fruit bats, such as the flying foxes, tend to take biggerfruits than smaller species, and these different bats are often found in the vertical strata of theforest. Generally, large fruit bats feed on the fruits borne in the canopy layer but may alsoventure down into the middle layer. The smaller fruit bats are found in the understory, thoughthey can also exploit fruits found in the upper strata. The details of which fruit is eaten and whenare determined by the seasonality of fruiting of the different plants. These bats migrate from treeto tree following the fruiting times of each species and make use of keystone species (such asfigs) when other fruits are not available. Figs are the staple diet of most fruit bats, but fig treesbear relatively few ripe fruits on a given night, such that each bat must visit several trees to getenough food. They also must apply a hit-and-run foraging pattern for selecting ripe fruits toavoid predators (i.e., snakes), taking the fruit elsewhere to eat in safety (Fenton 1992). As such,fruit bats do not stay in one fruiting tree for long periods.
Due to the low protein content of most ripe figs, bats must process a volume of fruits each nightequal to twice their body weight (even more for breeding females). Furthermore, the lowincidence of ripe figs per tree obliges these bats to visit several trees each night. This requireslarge amounts of energy. Hence, the high carbohydrate loading from the large quantities ofsugary fruits they ingested provides them the energy to sustain long flights. There is then animportant interplay between the low-protein content in figs and the need to feed on as muchfruits each night to augment this deficiency. Bats ingest only the juice, pulp, and seeds of figs,and these seeds pass quickly through the digestive tract due to the presence of a laxative. Theseare ejected along with the feces during flights between feeding areas and roosts, thus widelydispersing the seeds and allowing natural forest regeneration when deposited in clearings andgaps (Fenton 1992).
Understory Fruit Bats and Cauli ioric Figs (Moraceae). Many fruit bats feed on caulifloric figtrees of the genus Ficus that are especially adapted for bat dispersal. This adaptation, orcauliflory, involves the bearing of fruits on the trunk and main branches below the main canopy.This allows easy access of the fruits to low-flying frugivorous bats in the middle layer of therainforest strata under the thick foliage of the canopy. In addition, fruits are large and round,exude a strong odor when ripe, and often are bright yellow, which makes them conspicuous tofruit bats at night. In Mount Makiling, these figs are fed upon by the endemic Philippine Muskyfruit bat (Ptenochirus jagori) and the Short-nosed fruit bat (Cynopterus brachyotis). These batswere commonly observed in the understory of forested habitats on all sites in the study area,although the C. brachyotis has a wider distribution than the P. jagori.
Figs like Tibig (Ficus nota), Hawili (Ficus septica), Isis (Ficus guyeri), and Hagimit (Ficusminahassae) are a pioneer species in second-growth forest, where they are easily dispersed byfruit bats when these travel from one feeding tree to another. Fruit bats take the fruit from thetree by snatching the fruit with their mouth, using the four sharp canines to take a solid hold onthe fruit, and then flying off to feed quietly on a perch away from the feeding tree, to avoidquarrels with other bats. Thus, the fruit is eaten away from the parent tree; it is quickly consumedto avoid competitors; and it is easily dispersed during transit (most of the smaller fruits areswallowed easily, fruit and seeds together). Figs contain a laxative substance; hence, the gutcontents are readily digested, making the travel of the fruit through the alimentary tract of the batquite brief.

xliv Michael R. Dove and Percy E. Sajise
Center for Conservation Biology. 1994. At what cost urbanization? Patterns of biodiversity along adisturbance gradient. Update 8(1): 6-7.
Clay, Jason. 1991. Cultural survival and conservation: Lessons from the past twenty years. In Biodiversity:Culture, conservation, and ecodevelopment, ed. M. L. Oldfield and J. B. Alcorn, 248-73. Boulder:Westview Press.
Corry, Stephen. 1993. The rainforest harvest: Who reaps the benefit? The Ecologist 23(4): 148-53.
Cronon, William. 1983. Changes in the land: Indians, colonists, and the ecology of New England. NewYork: Hill and Wang.
Daniels, R. J. Ranjit, et al. 1991. Assigning conservation value: A case study from India. ConservationBiology 5(4): 464-75.
Dasmann, Raymond F. 1988. Toward a biosphere consciousness. In The ends of the earth: Perspectives onmodern environmental history, ed. D. Worster, 277-88. Cambridge: Cambridge Univ. Press.
Denevan, William M. 1992. The pristine myth: The landscape of the Americas in 1492. Annals of theAssociation ofAmerican Geographers 82(3): 369-85.
Diamond, Jared M., K. David Bishop, and S. Van Balen. 1987. Bird survival in an isolated Javanwoodland: Island or mirror? Conservation Biology 1(2): 132-42.
Dinerstein, Eric, and Eric D. Wikramayake. 1993. Beyond "hotspots": How to prioritize investments toconserve biodiversity in the Indo-Pacific region. Conservation Biology 7(1): 53-65.
Dove, Michael R. 1990. Review article: Socio-political aspects of home gardens in Java. Journal ofSoutheast Asian Studies 21(1): 155-63.
. 1992. The dialectical history of "jungle" in Pakistan: An examination of the relationship betweennature and culture. Journal of Anthropological Research 48(3): 231-53.
. 1993a. A revisionist view of tropical deforestation and development. Environmental Conservation20(1): 17-24, 56.
. 1993b. Uncertainty, humility, and adaptation to the tropical forest: The agricultural augury of theKantu'. Ethnology 32(2): 145-67.
. 1995. The theory of social forestry intervention: The state of the art in Asia. Agroforestry Systems30(3): 315-40.
. 1996. Center, periphery, and biodiversity: A paradox of governance and a developmentalchallenge. In Intellectual property rights and indigenous knowledge, ed. S. Brush and D. Stabinsky, 41-67.Washington, D.C.: Island Press.
Ellen, Roy. 1991. Grass, grerb, or weed? A Bulmerian meditation on the category Monote in Nuaulu plantclassification. In Man and a half.• Essays in Pacific anthropology and ethnobiology in honour of RalphBulmer, ed. Andrew Pauley, 95-101. Memoir No. 48. Auckland: The Polynesian Society.
Formoli, Tareq A. 1995. Impacts of the Afghan-Soviet war on Afghanistan's environment. EnvironmentalConservation 22(1): 66-69.
Fox, J. 1992. The problem of scale in community resource management. Environmental Management16(3): 289-97.
Gadgil, Madhay . 1992. Conserving India's biodiversity: The human context. In Sustainable management ofnatural resources, ed. T. N. Khoshoo and Manju Sharma, 243-55. New Delhi: Malhotra Publishing House.
Gomez-Pompa, Arturo, and Andrea Kaus. 1992. Taming the wilderness myth. BioScience 42(4): 271-79.
Hames, Raymond. 1991. Wildlife conservation in tribal societies. In Biodiversity: Culture, conservation,and ecodevelopment, ed. M. L. Oldfield and J. B. Alcorn. Boulder: Westview Press.

246 William Sm. Gruezo and Juan Carlos T. Gonzalez
The seeds of these figs are covered by a fleshy pericarp, which is removed during digestion butleaves the seeds unharmed in the gut (some bats may spit out or avoid eating fruit parts that areindigestible, such as cellulose). The very small seeds (less than 2 mm) have a hard covering, andthe round and slightly fusiform shape of the seeds allows easy passage through the digestivetract. Fruit bats can defecate while on a perch in the roosting areas, which are changed regularly.They also release their load of seeds during flight, while in transit from their feeding areas.
Pygmy Fruit Bats and Mid-montane Plants. Some interactions of frugivory and seed dispersalare specific to certain plants and animals. The Philippine Pygmy fruit bat (Haplonycterisfischeri) is a species found mostly in primary lowland dipterocarp forest and mid-mountainforests (elevational range from 100 to 1,550 m). It is a Philippine endemic with a limited habitatrange, although it may rarely venture into more disturbed habitats. Two endangered speciesclosely related to H. fischeri are the Mindanao Pygmy fruit bat (Alionycteris paucidentata)(found only in primary montane forests in Mindanao island) and the Luzon Pygmy fruit bat(Otopteropus cartilagonodus) (found in montane forests of Luzon island). Due to their limitedrange, both species may be specialist frugivores for particular plant groups in the mountainforests of Luzon and Mindanao, and thus may have no ecological overlap with H. fischeri.However, little is known about their feeding ecology, and further study is needed to verifylinkages between Pygmy fruit bats and primary montane plant species. All three pygmy fruit batspecies were included in the most recent list of threatened animals in the Philippines (IUCN1994).
The Philippine Pygmy fruit bat forages largely in the understory, subcanopy, and canopy and,occasionally, along clearings on the forest edge. On Negros island, this species feeds on thefruits of Pepperomia plants (family Piperaceae) found in montane forests (Mickleburgh, Hutson,and Racey 1992). On Mount Makiling, these plants are prevalent in the mid-montane forest sites,where H. fischeri was also found. Fruits of Piper species are small, globose or ovoid drupesborne on upright fleshy stalks to be conspicuous in the understory, where they are randomlydispersed. Droppings of one individual, which was caught in the mid-montane forest site near thepeak, contained the seeds of figs (Moraceae, such as Ficus irisana, F. septica, F. nota) and aspecies of Piper (Gonzalez 1996). Both Piper arborescens and P. interruptum were found inplots in the mid-montane dipterocarp forest site at 800 m above sea level (asl) on a ridge top nearthe peak, where H. fischeri was also observed. Heideman and Heaney (1989) noted that thenumbers of H. fischeri seem to be positively correlated with the abundance of two species ofPiper vines in the Lake Balinsasayao forest on Negros island. But they also noted that it is notclear to what extent the species rely on these fruits.
The pendulous flowers and fruits of the Medinilla magnifica (family Melastomataceae) are alsoadapted for bats for pollination and dispersal. The Medinilla is one of the most common andconspicuous plants in the mid-montane and mossy forest of Mount Makiling. Two fruit batspecies are found within this elevation, namely Ptenochirusjagori and H. fischeri, both of whichhave been observed to frequently visit the flowers and fruits of this plant.
Fruit-eating Birds
Canopy Birds As Frugivore Specialists on Strangling Figs. Birds are distributed among variousstrata in the rainforest canopy. Some birds spend most of their lives in the top layer of thecanopy, feeding, roosting, and nesting, making little effort to move down the strata where theniches are already taken by other species. Fruit is an important component of their diet, although
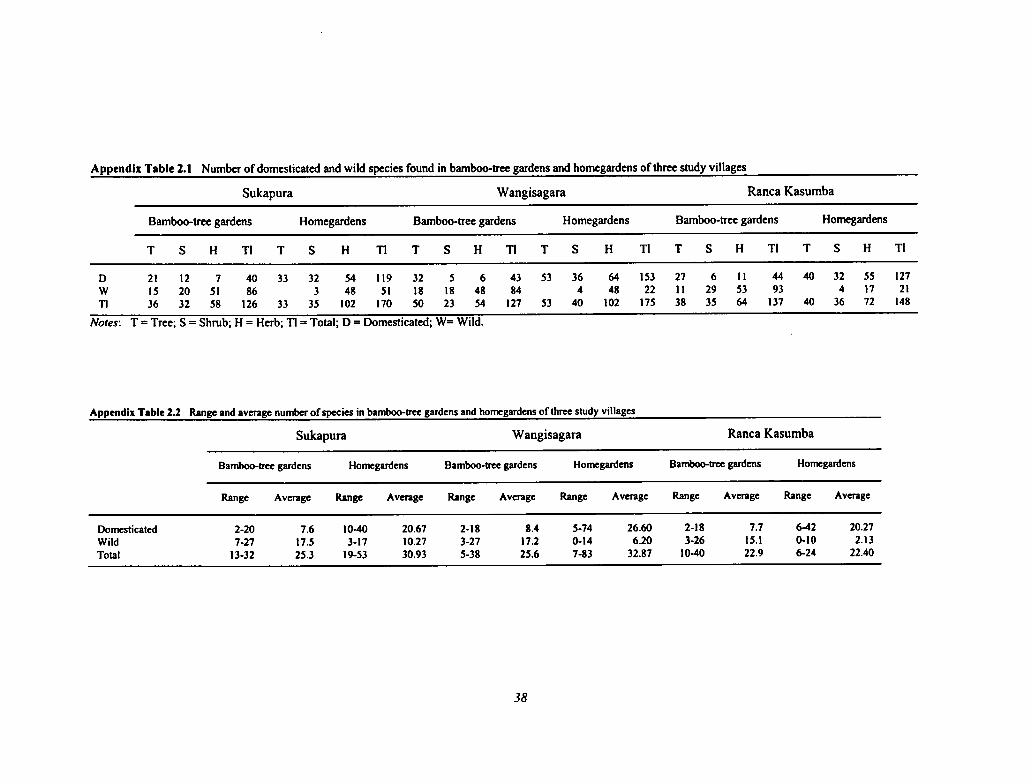
Introduction: Studying Biodiversity and Society in Southeast Asia xlv
Hanley, Thomas A. 1993. Balancing economic development, biological conservation, and human culture:The Sitka black-tailed deer Odocoileus hemionus sitkensis as an ecological indicator. BiologicalConservation 66(1): 61-67.
Hecht, S. B., A. B. Anderson, and P. May. 1988. The subsidy from nature: Shifting cultivation,successional palm forests, and rural development. Human Organization 47(1): 25-35.
Hunter, J. Robert. 1994. Is Costa Rica truly conservation-minded? Conservation Biology 8(2): 592-95.
Hyndman, David. 1994. Conservation through self-determination: Promoting the independence of culturaland biological diversity. Human Organization 53(3): 296-302.
Janzen, Daniel H. 1986. The eternal external threat. In Conservation biology: The science of scarcity anddiversity, ed. Michael E. Soule, 286-303. Sunderland, Mass.: Sinauer Associates.
Kruess, Andreas, and Teja Tscharntke. 1994. Habitat fragmentation, species loss, and biological control.Science 264:1581-84.
Landres, Peter B., Jared Verner, and Jack Ward Thomas. 1988. Ecological uses of vertebrate indicatorspecies: A critique. Conservation Biology 2(4): 316-28.
Lohmann, Larry. 1991. Who defends biodiversity? Conservation strategies and the case of Thailand. InBiodiversity: Social and ecological perspectives, ed. Vandana Shiva, Patrick Anderson, Heffa Schucking,Andrew Gray, Larry Lohmann, and David Cooper, 77-104. London/Penang: Zed Books/World RainforestMovement.
Lovejoy, T. E., R. O. Bierregaard, Jr., A. B. Rylands, J. R. Malcolm, C. E. Quintela, L. H. Harper, K. S.Brown, Jr., A. H. Powell, G. V. N. Powell, H. O. R. Schubart, and M. B. Hays. 1986. Edge and othereffects of isolation on Amazon forest fragments. In Conservation biology: The science of scarcity anddiversity, ed. Michael E. Soule, 257-85. Sunderland, Mass.: Sinauer Associates.
Lovejoy, Thomas E., Judy M. Rankin, R. O. Bierregaard, Jr., Keith S. Brown, Jr., Louie H. Emmons, andMartha E. Van der Voort. 1984. Ecosystem decay of Amazon forest remnants. In Extinctions, ed. MatthewH. Nitecki, 295-325. Chicago: Univ. of Chicago Press.
Ludwig, Donald, Ray Hilborn, and Carol Walters. 1993. Uncertainty, resource exploitation, andconservation: Lessons from history. Science 260:17, 36.
Mary, Fabienne, and Genevieve Michon. 1987. When agroforests drive back natural forests: A socio-economic analysis of a rice-agroforest system in Sumatra. Agroforestry Systems 5:27-55.
1994. Conversion of traditional village gardens and new economic strategies of rural householdsin the area of Bogor, Indonesia. Agroforestry Systems 25:31-58.
Mather, Alexander S. 1990. Chapter 3, Historical perspectives on forest resource use. In Global forestresources, 30-57. Portland: Timber Press.
Meilleur, Brian A. 1994. In search of "keystone societies." In Eating on the wild side: The pharmacologic,ecologic, and social implications of using noncultigens, ed. Nina L. Etkin, 259-79. Tucson: Univ. ofArizona Press.
Morren, G. 1991. New technology and regional studies in human ecology. In Applications of space-agetechnology in anthropology, ed. C. Behrens and T. Sever, 137-65. John Stennis Space Center, Miss.:NASA.
Myers, Norman. 1986. Tropical deforestation and a mega-extinction spasm. In Conservation biology: Thescience of scarcity and diversity, ed. Michael E. Soule, 394-409. Sunderland, Mass.: Sinauer Associates.
Nicholls, Neville. 1993. ENSO, drought, and flooding rain in South-East Asia. In South-East Asia'senvironmental future, ed. H. Brookfield and Y. Byron, 154-75. Tokyo/Kuala Lumpur: UNU Press/OxfordUniv. Press.
Nietschmann, Bernard. 1990. Conservation by conflict in Nicaragua. Natural History 11:4248.

Functional Relationships Between Plant and Animal Indicator Species 247
it is supplemented by other foods such as insects, to augment their ingestion of protein especiallyduring the nesting and molting season. Coadaptation allows birds and fruit-bearing trees todevelop characteristics that maximize the access of the animal and plant to each other.
In Mount Makiling, pigeons, flowerpeckers, hornbills, and most other frugivorous birds feed onthe sweet, juicy, soft flesh of figs such those of the Hagimit (Ficus minahassae) and Balete orstrangling figs (e.g., Ficus balete, F. concinna). The fruits of Balete are brightly colored (red andeasily seen in daylight among the green foliage), small, roundish, and borne on the tips ofbranches, thus exposing them. The synconia are smaller than those of the caulifloric, bat-dispersed figs, and because they are found on the axil of each leaf node, large fruits would placetoo heavy a burden on the thin branches. In addition, the small size allows the fruit to be easilyswallowed by birds, especially the smaller frugivores like flowerpeckers. Like most other figs,the seeds are small but numerous (being a multiple fruit). Indeed, the seeds are almostmicroscopic, enveloped in a jelly-like coating to facilitate their passage through the alimentarycanal of the birds. This coating also protects the seed from digestion, but its removal during itsshort stay in the gut may help promote germination of the seed. The sugary low-protein fig fruitalso contains a laxative that hastens the passage of the seeds through the digestive tract of birds.The high sugar content of the fruit is an important source of high energy (but easily combustible)for the frugivores' sustained commuting flights between feeding trees, similar to that of fruitbats. Unlike fruit bats, however, most frugivorous birds can feed on insects (and otherinvertebrates or small vertebrates) to supplement the low protein fig diet. The strangling figs onMount Makiling include Ficus balete, F. concinna, and F. subulata. These figs are considered asa keystone resource, which provides staple food, because they bear nonseasonal fruits. Keystonespecies have a vital function because climatic conditions can later cause shortage of food sourcesduring lean periods.
The bills or beaks of these frugivorous birds are adapted for feeding on small fruits, and eachspecies has its own method of access. Pigeons—for example, the White-eared Brown-Dove(Phapitreron leucotis) and the Green Imperial Pigeon (Ducula aenea), like most other species ofthe family Columbidae—have a tweezer-like bill. The thin and pointed bill, with a soft fleshyhorn to cover the nostrils (operculum), is adapted for carefully picking the soft, ripe fig fruitsfrom the branches with care, because the ripe fruits are easily detached from the branches. Incontrast, the bill of hornbills seems massive and bulky in appearance, but actually these bills arehollow and light. The elongated ends and the pointed tips are highly efficient fruit-pickers,capable of delicately picking out ripe fruits from branches.
Flowerpeckers, on the other hand, are small birds with wide, pointed bills, like short tweezers forpicking out the small fig fruits and mashing the pulp in the beak before the contents areswallowed. Other birds mash the fruits in their beaks while foraging along the thin branches,feeding from fruit to fruit, swallowing only the fruit contents and discarding the peel along withexcess seeds; while still others swallow the fruit whole. The digestive tract of flowerpeckersincludes a gizzard that separates the berry pulp from the exocarp and discards the exocarp inpackets along with the feces. Some flowerpeckers have guts wherein the berries bypass thegizzard, since most of the ingested material is already made up of pulp. In these cases, thegizzard is still important for digesting insects, which add protein to the low protein diet of figs,especially during the breeding season.
Due to the large percentage of figs eaten by these canopy frugivores, they can be referred to asfrugivore specialists or fig specialists. These include most of the large pigeons and doves such as
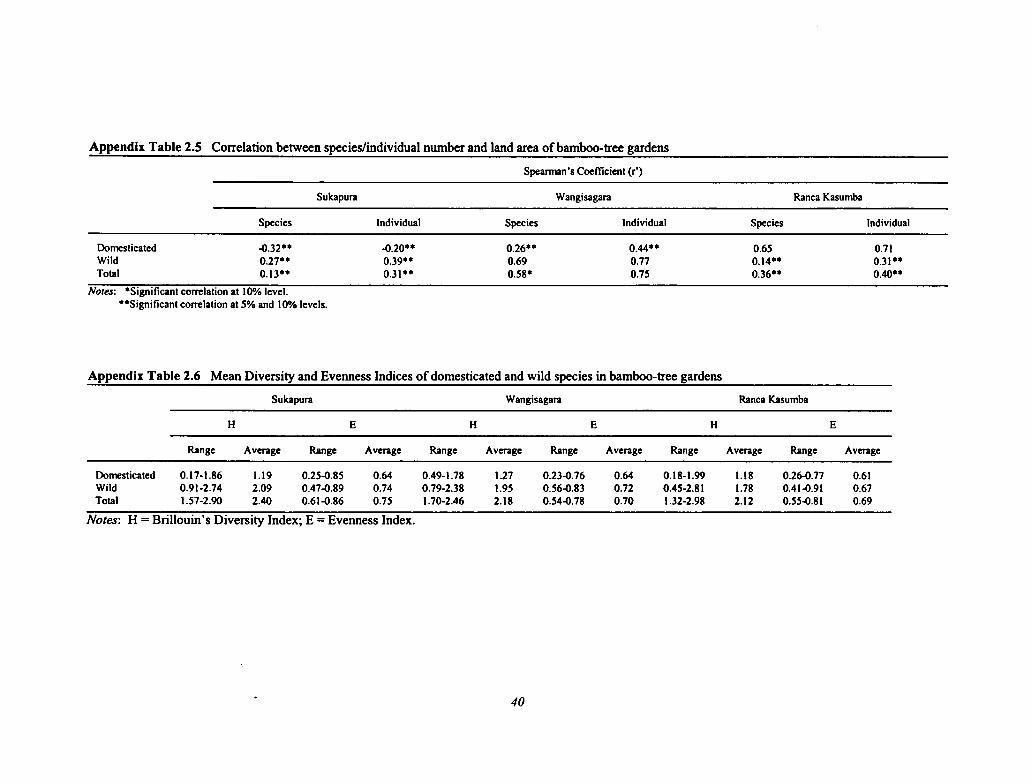
xlvi Michael R. Dove and Percy E. Sajise
Norgaard, Richard A. 1984a. Coevolutionary agricultural development. Economic Development andCulture Change 32(3): 525-46.
. 1984b. Coevolutionary development potential. Land Economics 60(2): 160-73.
Noss, Reed F. 1991. Do we really want diversity? In Learning to listen to the land, ed. Bill Willers, 41-45.Washington, D.C.: Island Press.
Padoch, Christine, and Charles Peters. 1993. Managed forest gardens in West Kalimantan, Indonesia. InPerspectives on biodiversity: Case studies of genetic resource conservation and development, ed. C. S.Potter, J. I. Cohen, and D. Janezewski, 167-76. Washington, D.C.: AAAS Press.
Panayotou, Theodore. 1994. Empirical tests and policy analysis of environmental degradation at differentstages of economic development. Pacific and Asian Journal of Energy 4(1): 23-42.
Pei Shengji. 1992. Relevance of rapid inventory techniques for the conservation of biodiversity. Paperpresented at National Workshop on Himalayan Biodiversity, Srinagar.
Perrings, Charles, Carl Folke, and Karl-Goran Maler. 1992. The ecology and economics of biodiversityloss: The research agenda. Ambio 21(3): 201-11.
Pimm, Stuart L., and John L. Gittleman. 1992. Biological diversity: Where is it? Science 255:940.
Pimm, Stuart L., Gareth J. Russell, John L. Gittleman, and Thomas M. Brooks. 1995. The future ofbiodiversity. Science 269:347-50.
Pimm, Stuart L., and Andrew M. Sugden. 1994. Tropical diversity and global change. Science 263:933-34.
Richard, A. F., S. J. Goldstein, and R. E. Dewar. 1989. Weed macaques: The evolutionary implications ofmacaque feeding ecology. International Journal of Primatology 10(6): 569-94.
Rolston, Holmes, III. 1991. The wilderness idea reaffirmed. The Environmental Professional 13(3): 370-77.
Rudel, Thomas K., with Bruce Horowitz. 1993. Chapter 1, The changing geography of tropicaldeforestation. In Tropical deforestation: Small farmers and land clearing in the Ecuadorian Amazon. NewYork: Columbia Univ. Press.
Sajise, P. E., and E. Omengan. 1990. The changing upland landscape of the northern Philippines. InKeepers of the forest: Land management alternatives in Southeast Asia, ed. M. Poffenberger, 56-68. WestHartford, Conn.: Kumarian Press.
Sajise, P. E., N. M. Orlido, L. C. Castillo, J. S. Lales, and R. C. Atabay. 1974. Quantitative analysis ofPhilippine grasslands, I: Floristic composition and community dynamics. The Philippine Agriculturalist59:9-10.
Salafsky, Nick. 1994. Drought in the rain forest: Effects of the 1991 El Nino-Southern Oscillation event ona rural economy in West Kalimantan, Indonesia. Climatic Change 27:373-96.
Schelhas, John. 1994. Building sustainable land uses on existing practices: Smallholder land use mosaics intropical lowland Costa Rica. Society and Natural Resources 7(1): 67-84.
Shigeta, Masayoshi. 1990. Folk in-situ conservation of Ensete (Ensete Ventricosum (Welw.) E. E.Cheesman): Towards the interpretation of indigenous agricultural science of the Ari, southwesternEthiopia. African Study Monographs 10(3): 93-107.
Short, Jeff, and Bruce Turner. 1994. A test of the vegetation mosaic hypothesis: A hypothesis to explainthe decline and extinction of Australian mammals. Conservation Biology 8(20): 439-49.
Sisk, Thomas D., Alan E. Launer, Kathy R. Switky, and Paul R. Ehrlich. 1994. Identifying extinctionthreats: Global analyses of the distribution of biodiversity and the expansion of the human enterprise.BioScience 44(9): 592-604.
Soule, Michael E. 1991. Conservation: Tactics for a constant crisis. Science 253:744-50.
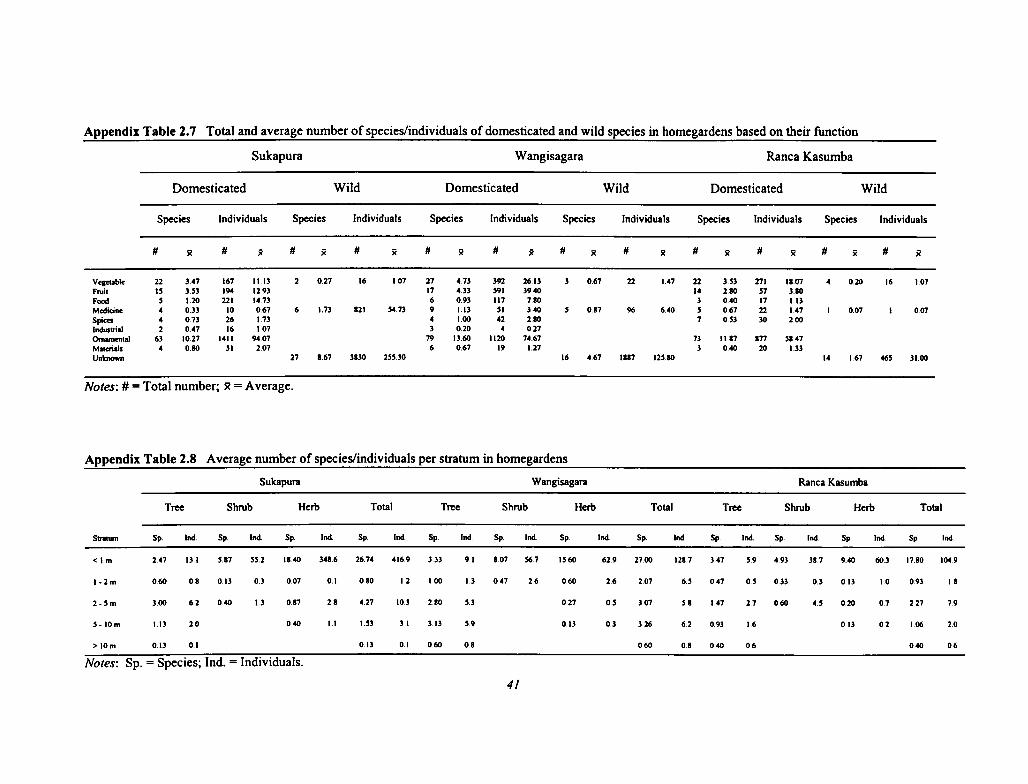
248 William Sm. Gruezo and Juan Carlos T. Gonzalez
Pompadour Green Pigeon (Treron pompadora), Brown Doves (Phapiteron sp.), Imperial Pigeons(Ducula sp.), the Luzon Tarictic Hornbill (Penelopides manillae), and some of the flowerpeckers(Dicaeum sp. and Prionochilus sp.). Although Ficus fruits are consumed in great quantity bythese specialist frugivores, they are also exploited by opportunistic frugivores and omnivores,such as Bulbuls, White-eyes, and Starlings. Most often, specialists form mixed feeding flocks,which in turn attract other frugivores (such as opportunistic birds) by their noisy foragingactivities. One flock observed on Mount Makiling contained mostly Green Pigeons and someImperial Pigeons that feed as a main group, but on the outer perimeter were Philippine Bulbuls(Ixos philippinus), Guaiabero Fig Parrots (Bolbopsittacus lunulatus), Colasisi (Loriculusphilippensis), and a few flowerpeckers. Feeding in large flocks can be both advantageous butalso disadvantageous to a specialist. To avoid predators, there is safety in numbers, but sinceflocks attract large numbers of frugivores, the ripe fruit-load may be limiting (some figs onlyproduce a few ripe fruits at a time, which is a mechanism for dispersal, because this forcesfrugivores to perform long commuting flights from one fruiting tree to another).
Not all fig specialists participate in mixed feeding flocks; some form strictly single-speciesfeeding groups. The Luzon Tarictic Hornbills (Penelopides manillae) are territorial frugivoresthat deter other species competing for the limited resources such that they often form big flocks(ten to twenty individuals). However, due to their intolerance to disturbances in their habitat,there has been a sharp decline in the population of this endemic frugivore specialist on MountMakiling. In this study, P. manillae were rarely observed in groups larger than four or five (andit is more likely to see them singly or in pairs, or none at all) in all sites. Another hornbillspecies, which was recorded on Mount Makiling, is the Rufous or Great Philippine Hornbill(Buceros hydrocorax), also a fig specialist. Sadly, it has not been observed in the past twodecades on the mountain and was probably extirpated due to hunting pressure and loss of habitat,because it inhabits lowland dipterocarp forests, which was heavily degraded and converted toforest plantations on Mount Makiling. Consequently, the alteration of these lowland forests had asevere effect on the survival of these important keystone species. Similarly, there had been asignificant decline in the occurrence of Balete on the mountain in recent years. Further study istherefore needed to determine how populations of specialist frugivores are affected by changes inthe status of keystone plant species in the habitat, and vice versa.
The importance to strangling figs of seed dispersal by canopy birds is great, since these figsprobably would have difficulty surviving without the aid of these birds. Birds fly along theskyway of canopy trees, defecating in transit or while perching on tall canopy or emergent trees.Some of the seeds fall onto suitable branches, ideally containing some humus and thengerminate, sending down aerial roots and eventually strangling the host tree. It is not clear,however, if there is a significant difference in germination potentials when the seeds passthrough the digestive tract or not.
Flowerpeckers (Dicaeidae) and Mistletoes (Loranthaceae). Flowerpeckers (family Dicaeidae)can indirectly disperse the seeds of mistletoes (family Loranthaceae), plants parasitic on otherplants in the forest (Gruezo 1985). Mistletoes produce small fleshy fruits that are edible andattractive to small frugivorous birds like flowerpeckers and possibly White-eyes (familyZosteropidae). The seeds of mistletoes are small (almost microscopic), and it is not knownwhether the seeds pass the digestive tract of birds unharmed and are dispersed throughdefecation (Gruezo 1985). Infection can also be possible during feeding, when birds mash themistletoe fruit and wipe their beaks onto the branches of a host tree to get rid of the excess pulp
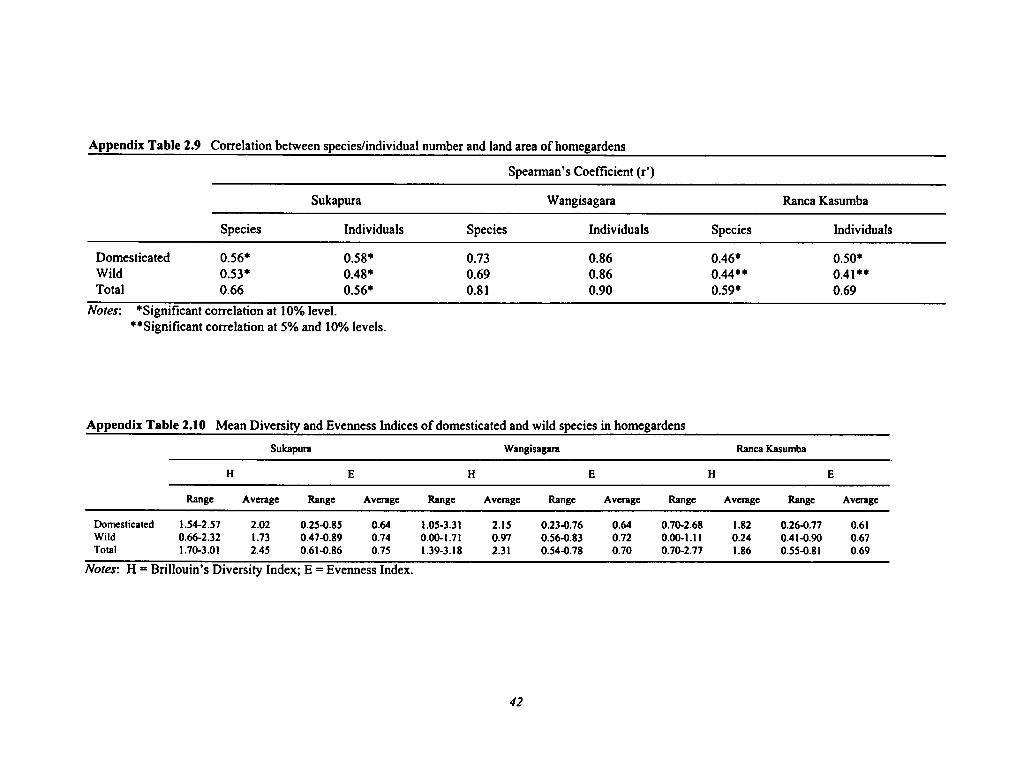
Introduction: Studying Biodiversity and Society in Southeast Asia xlvii
Terborgh, John. 1986a. Community aspects of frugivory in tropical forests. In Frugivores and seeddispersal, ed. A. Estrada and T. Flemming, 371-84. Dordrecht: W. Junk.
1986b. Keystone plant resources in the tropical forest. In Conservation biology: The science ofscarcity and diversity, ed. Michael E. Soule, 330-44. Sunderland, Mass.: Sinauer Associates.
Thompson, M., M. Warburton, and T. Hatley. 1986. Uncertainty on a Himalayan scale: An institutionaltheory of environmental perception and a strategic framework for the sustainable development of theHimalaya. London: Ethnographica.
Tuomisto, Hanna, Kalle Ruokolainen, Risto Kalliola, An Linna, Walter Danjoy, and Zoila Rodriguez.1995. Dissecting Amazonian biodiversity. Science 269:63-66.
Warner, Richard E. 1994. Agricultural land use and grassland habitat in Illinois: Future shock formidwestern birds? Conservation Biology 8(1): 147-56.
Wells, Michael. 1992. Biodiversity conservation, affluence, and poverty: Mismatched costs and benefitsand efforts to remedy them. Ambio 21(3): 237-43.
Widagda, Linda C., Oekan Abdoellah, Gerald Marten, and Johan Iskandar. 1984. Traditional agroforestryin West Java: The pekarangan (home garden) and kebun-talun (perennial-annual rotation) croppingsystems. Environment and Policy Institute Working Paper, East-West Center, Honolulu.
Wilson, Edward O. 1987. The little things that run the world. Conservation Biology 1(4): 344-46.
1988. The big things that run the world—A sequel to E. O. Wilson. Conservation Biology 2(4):402-3.
Yapa, Lakshman. 1993. What are improved seeds? An epistemology of the green revolution. EconomicGeography 69(3): 254-73.
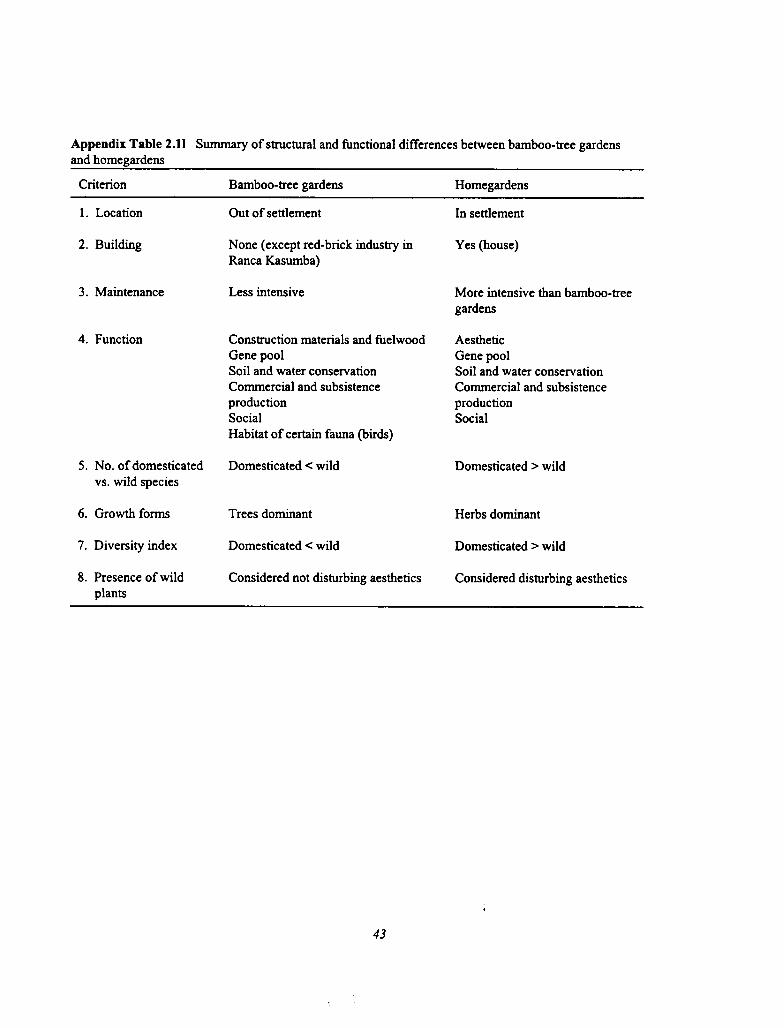
Functional Relationships Between Plant and Animal Indicator Species 249
and seeds sticking on their bills (especially if the pulp is sticky), scratching the bark in theprocess and passing the mistletoe seeds to infect the branches of the tree.
Parrots (Psittacidae) and Forest Fruits. Most parrots feed on fruit, nuts or seeds, and nectar(occasionally animal matter). Their bill is a highly specialized tool for feeding on nuts, where thehinged beak (with the naso-frontal hinge) allows the upper mandible to bend upward toaccommodate large nuts and seeds for cracking. This ability of parrots to break nuts and seedsmeans that dispersal of intact seeds cannot occur. The term "seed-destroyers" is thus moreapplicable to these parrots than seed-dispersers. The seeds of many tropical rainforest trees areoften equipped with toxins to avoid this sort of seed predation and ensure its dispersal.
Many species of parrots are scattered in the Philippine archipelago. On Mount Makiling, twospecies are observed in the forest and agroforestry areas: the Colasisi or Philippine HangingParrot (Loriculus philippensis) (largely a fruit- and nectar-feeder), and the Bubutuk or Guaiabero(a species related to fig parrots). They have a mutual relationship with some fruit-bearingrainforest trees unlike other larger seed-destroying species. Thus, they have more delicate billsthat appear less menacing to seeds. Miranda (1987) classified L. philippensis both as aspecialized arboreal frugivore of top canopy and as a seed-eater. The Colasisi is closely relatedto the lories, a group of nectar-feeding parrots, whose bills are elongated and adapted for lappingup nectar from the corolla of flowers. The Colasisi is often seen feeding among the flowers ofpalms like coconuts in the agroforestry areas. However, they are also seen feeding on the fruitsof figs, such as Balete and Hagimit, and other small fruits of the family Moraceae, as well asMeliaceae. One bird was observed to feed on the soft berry-like fruit of the Aratilis (Muntingiacalabura), mashing the pulp and swallowing the contents, including the small seeds. Althoughthe excess seed and pulp on the bill were wiped off on a branch, most of the seeds passedthrough the bird's digestive tract and were later expelled intact with the feces. Therefore, likemost other canopy birds, they help disperse the seeds. Since the Colasisi are able to venture intoagroforestry areas, they help disperse the seeds of rainforest trees into second-growth areas.However, these parrots cannot survive in agroforestry areas alone; they still require forests forroosting and nesting. They need tall trees with suitable cavities for nesting and regular sources offruit and nectar for their nestlings (probably supplemented with insects for protein).
The same is true for the Guaiabero Parrot (Bolbopsittacus lunulatus), which is closely related tothe fig parrots of New Guinea and Indonesia. This species is specialized for feeding on the fruitsof figs and other small fruits found in dipterocarp forests. Unlike the Colasisi, the Guaiaberorarely feeds on nectar; its large, bulky black bill is not adapted for delicately foraging on nectar.The Guaiabero and the Colasisi both use their zygodactylous feet (two toes at front and back offoot) to clamber about the branches of a fruiting tree from one laden twig to another. Thisbehavior permits them to feed along the canopy layer without having to fly out of the protectivecover of leaves. Their predominantly green coloration camouflages them among the leaves andalso helps them avoid predators such as hawks.
Pioneer Plants and Opportunistic/Generalist Frugivores. Pioneer plants are important for thecontinued succession of vegetation from cleared areas to forests. These plants are fast-growingand initially provide the valuable shade that most other trees require for growth, and later givingrise to climax species such as dipterocarps. Some of the most important pioneer species of plantsare those belonging to the genera Macaranga and Mallotus (family Euphorbiaceae), becausethey bear edible fruits that can be dispersed by frugivores. The Macaranga trees (e.g.,Macaranga tanarius, M. grandifolia, and M. bicolor) are pollinated by insects, but their fleshy


250 William Sm. Gruezo and Juan Carlos T. Gonzalez
fruits with small seeds are dispersed by small- to medium-sized birds such as bulbuls, white-eyes, some flowerpeckers, some doves, crows, and malkohas. Most of these birds customarilymove back and forth between forest habitats and into clearings and grasslands, which facilitateseed dispersal.
Pioneer plants have sugar-rich fruits and flowers as an evolutionary adaptation to attract birds forpollination and dispersal (Fodgen 1972, as cited by Miranda 1987). To supplement their highcarbohydrate diet, flowerpeckers also feed on insects to augment the protein deficiency. Birdsthat feed on the fruits of pioneer plants are usually small to moderate in size and tend to begeneralists rather than specialists. That is why they opportunistically exploit the availability ofedible fruits rather than depend on a single fruit species or plant web. As a result, these birds arehighly successful in tolerating disturbances in their habitat and easily assimilate in any modifiedhabitat as long as edible fruits are available. Because of this association, these birds can promotethe dispersal of seeds of these pioneer plants to form secondary growth and parang vegetation.The spread of parang vegetation and secondary growth on the lower slopes of Mount Makilingwas probably promoted by the interactions between these generalist frugivores and pioneerplants.
The ability to readily shift feeding guilds to exploit a variety of resources is an importantsurvival trait of these birds. This makes them highly successful species, inhabiting a much widerarray of habitats, including agroecosystems. Such generalists are usually not strict frugivores;most of them are omnivores, feeding on both insects and fruits as major components of their diet.
The bulbuls (Pycnonotidae) are a widespread avian family of generalists in the Philippines,represented by three species (two endemic) on Mount Makiling. The Philippine Bulbul (Ixos
philippinus) is one of the most abundant bird species on the mountain, inhabiting forestedhabitats and even agroecosystems. They may even venture into open grasslands and suburbanareas. The Yellow-wattled Bulbul (Pycnonotus urostictus) is a bit more restricted to forests thanI. philippinus, although they can sometimes be found in parang vegetation. The nonendemicYellow-vented Bulbul (Pycnonotus goiavier) is a highly adaptable species. It is rarely found inless disturbed forest habitats where the other species are abundant. It is, however, abundant inparang vegetation and agroecosystems, and it is able to adapt to urban areas.
The White-eyes (Zosteropidae) are another group of generalist frugivores. They are associatedwith some pioneer plants and secondary growth species such as Alagaw (Premna odorata) andBignay (Antidesma bunius), among which they are frequently observed to feed. The PhilippineWhite-eye (Zosterops meyeni) is a common endemic species that can be encountered aroundsecondary growth and agroforestry areas, such as Ipil-ipil stands (Leucaena leucocephala) andAcacia or Raintrees (Samanea saman), among others. They forage noisily in small to mediumflocks of ten to twenty or more. Those species found at higher elevations, such as the MountainWhite-eye (Zosterops montana), may have less varied opportunities due to limitations ofaltitudinal range. The Golden-yellow White-eye (Zosterops nigrorum) may have the sameopportunistic attributes as Z. meyeni, but it limits its distribution to forested habitats and rarelyventures into parang vegetation.
The Flowerpeckers (Dicaeidae), though earlier thought to be more frugivorous than omnivorous,are probably generalists as well, although some species tend to be restricted to less disturbedforest habitats. The Red-keeled or Philippine Flowerpecker (Dicaeum australe) is an endemicspecies that is able to venture into disturbed habitats such as parang, agroecosystems, and, to

II Indonesia

Functional Relationships Between Plant and Animal Indicator Species 251
some extent, suburban areas. Some nonendemic resident Sunbirds (Nectarinidae) can, to somedegree, be opportunistic if necessary. Using generalists to effectively disperse seeds isadvantageous, because pioneer plants are often unable to survive in forested areas due tocompetition with climax trees (i.e., light), and making use of unspecialized frugivores (notrestricted by habitat types) allows their seeds to be dispersed on a wide scale of ecological types.
Nonvolant Mammals
Civets (Viverridae) and Palms (Palmae). One of the most notable relationships between faunaand flora in the forest is the dispersal of palm seeds by frugivorous mammals such as civets.Seed dispersal among civets is conspicuous: their seed-laden feces are often encountered alongtrails, with forest fruit seeds being replaced by the seeds of coffee (Coffea arabica, C.canephora) near the agroforestry areas. The Musang or Masked Palm Civet (Paradoxurushermaphroditus) is recognized as being responsible for dispersal of the seeds of Sarawag(Pinanga insignis) (Gruezo and Soligam 1990) and the Kaong or Sugar palm (Arenga pinnata)(Gruezo 1995) on Mount Makiling. This species of civet inhabits forested habitats, and itsnocturnal habits make it difficult to observe in the wild. However, they leave abundant evidenceof their presence through scattered droppings on the forest floor. Scats of these fruit-eatingcarnivores are common in different forested sites around the mountain.
The status of the civet population on Mount Makiling is not known, but local residents considerthem to be common, and they probably have more stable populations than any other medium- tolarge-sized mammals. They are trapped around agroforestry areas due to their appeal as pets andalso their status as pests. They are quite unpopular around coffee plantations, as well as orchards,because of their presumed fruit predation. Actually, little is known about the feeding ecology ofthese civets in agroecosystems, and in the absence of knowledge there is little basis for cullingthe species by killing or trapping. One probable cause of the conflict with humans can be tracedto the decline of fruiting palms on Mount Makiling, which is part of their traditional diet,together with other fruits and small vertebrates. But on Mount Makiling today, the cane of theclimbing palms (Calamus spp., Daemonorops spp.) is collected for the furniture and baskettrade, and the fruit itself is also collected for food, as is the shoot (locally called Ubod, which iscooked as a vegetable). The resulting lack of available native food items may have obliged thePalm civet to forage in the agroforestry areas for a substitute in their diet. On Palawan island, thePalm Civet is also known to feed on the fruits of rattans or climbing palms (Calamus spp.),which it also disperses through its droppings.
The feces of the Asian Palm Civet are laid along trails unlike those of the much larger species,the Alamid or Malay Civet Cat (Viverra tangalunga) whose feces are rarely seen. The feces ofboth species are clearly composed mainly of undigested seeds. The seeds of Pinanga insignis(Palmae) appear to be laid unharmed, and indeed the passage of the seeds through the digestivetract of civets significantly improves germination (Gruezo and Soligam 1990). The same can besaid of Sugar palm seeds.
Long-tailed Macaques and the Katmon Tree (Dilleniaceae). Another relationship between largefrugivorous (or omnivorous) mammals and fruit-bearing trees was observed between Long-tailedMacaques (the only species of monkey in the Philippines) and the Katmon tree (Dilleniaphilippinensis). The katmon or katmon-gubat is a species found in mid-montane dipterocarpforest sites on Mount Makiling. It bears large, round fruits that exude a sweet odor when ripe;their taste is slightly sour. Villagers living in the vicinity of the reserve considered the fruit
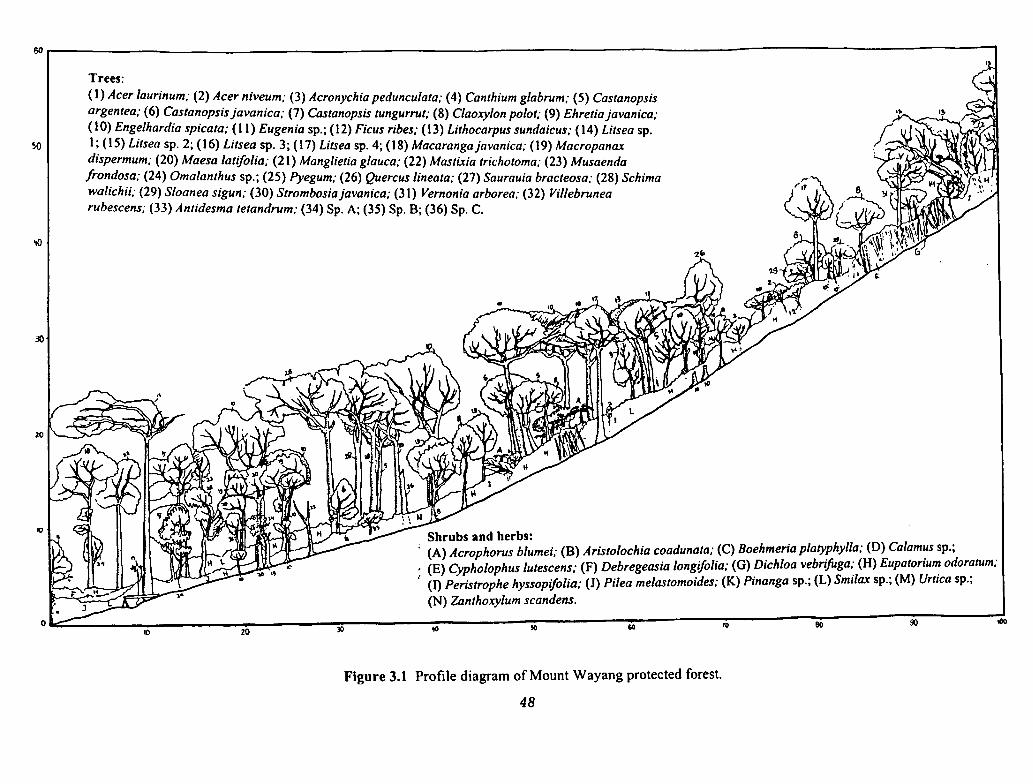

252 William Sm. Gruezo and Juan Carlos T. Gonzalez
edible (sometimes using it for cooking). They refer to it as "monkey-fruit" because they oftenobserved macaques feeding on it. However, this study was not able to verify this interaction,which requires further research. The seeds are small enough to allow easy passage through thedigestive system and dispersal through the feces. Long-tailed Macaques (Macaca fascicularis)are opportunistic omnivores that also feed on other rainforest fruits such as wild rambutan andprobably rattan palms. They also feed on small vertebrates and invertebrates and are able toventure into agroecosystems where they are believed to cause damage to crops.
Wild Pigs (Sus philippensis) and Rafflesia manillana (Rafflesiaceae). The foraging activitiesof wild pigs in the forest indirectly promote the dispersal of some organisms. The PhilippineWarty Pig (Sus philippensis) (family Suidae) forage on the forest floor by uprooting tubers androots in the soft soil. In the process they incidentally damage the roots of forest plants like lianasand woody vines, exposing the inner bark with their hoofs and teeth. If their hoofs and teeth arecontaminated with seeds of the edible fruit of Rafflesia (family Rafflesiaceae), the exposed barkcan become infected. This form of dispersal has been suspected to occur in some other species ofRafflesia (Mat Saleh 1991). Like most other species of the genus, Rafflesia manillana is parasiticon roots of large lianas in the forest belonging to genus Tetrastigma of the grape family,Vitaceae. Their rarity and highly specialized habits make them an important indicator species.The reduction in the population of wild pigs on Mount Makiling due to hunting, hybridizationwith feral pigs, and loss of habitat may have affected the occurrence of R. manillana on themountain. Such interactions are not yet fully documented, and they should be priority forresearch on the dispersal of endemic parasitic plant species.
These plants do not have photosynthetic parts, such that only the flower and buds are exposedfrom the host vine for pollination. When open, the Rafflesia flower produces a foul odor thatattracts mostly flies (Diptera) as pollinators. Edible fruits may also be dispersed by smallmammals like squirrels (Rodentia) and tree shrews (Scandentia), both of which are absent inMount Makiling.
Pollination
Nectar is a rich, energy substance that attracts bats, birds, and insects to flowers as a reward forpollination (see Appendix Table 10.3). It is basically just sugar water, which is high incarbohydrates but lack protein. Many rainforest plants have evolved to attract a given group orspecies of nectivore or nectar-feeder. Feeding on nectar is a feeding guild exploited mainly byinsects (i.e., bees, butterflies), but were also exploited by bats and birds (Fenton 1992).
Often, continuous interaction between flowering plants and nectivores has allowed coevolution.Insect-pollinated flowers are usually brightly colored (sometimes masked), sweetly scented, andshow portways for landing—such as those pollinated by bees. Others are foul-smelling andpollinated by flies. Bat-pollinated flowers are conspicuously placed outside the crown of leavesfor easy access (i.e., ramiflorous), are white or red, odoriferous, and produce a small amount ofnectar. In contrast, bird-pollinated flowers are tubular and produce much nectar, and theirstamens and stigmas are placed near the outer dorsal end of the flower to facilitate pollen toattach to the forehead or crown of the bird. Sequential flowering occurs in species that attract thesame pollinators (possibly within the same plant web) to enhance cross-pollination. This can bedone by either blooming simultaneously in conspecific groups or by blooming at different
Chapter 1
Biodiversity Condition and Its Maintenancein the Upper Citarum River Basin
Oekan S. Abdoellah, Parikesit, Budhi Gunawan,Nani Djuangsih, and Tatang S. Erawan
Introduction
Background
The magnitude of Indonesia's biological diversity—up to the present time—is still significant,even though the future of many natural ecosystems in particular regions of the country isuncertain. Although Indonesia only covers 1.3 percent of the earth's surface, the country housesapproximately 10 percent of the world's flowering plant species and more than 10 percent of itsmammals, birds, reptiles, and amphibians (World Bank 1994). Many of those species areendemic to Indonesia.
As one of the earth's nations that possess the highest biological diversity, and as a predominantlyagrarian country, Indonesia depends heavily on its biological resources for the development of itsnational economy. The magnitude of these resources in Indonesia thus has both direct andindirect values for the country's national development. Direct values include source of food,commercial products (such as timber and nontimber forest products), and fuelwood; whereasindirect values include contributing to environmental stability, providing scientific (research andeducation) and recreational (aesthetics) objects, and maintaining cultural diversity.
Since economic development in future decades will still have to rely on existing biologicalresources, it is undoubtedly true that the future condition of Indonesia's biological diversity willcome under serious stress. This is particularly true for regions like the province of West Javawhere population density is among the highest in the country (815/km 2), and development ofboth the agricultural and industrial sectors is occurring at a rapid rate. This rapid developmentcan be seen in many watersheds in West Java where conversion of natural and stable ecosystemsto man-made less stable ones has been accelerating in the last few decades. The exact figure ofland conversion in West Java is unknown but Soeriaatmadja (1991, cited by Sugandhy 1995)writes that natural forest conversion nationwide averages 15 to 20 thousand hectares per year.The ultimate consequence of this land use for the vegetative cover and its constituent species hasbeen pronounced. The alteration of natural forest containing a high degree of biological diversityto agricultural lands on which monocultural systems predominate has involved a significantdecrease in plant diversity and the disappearance of many local varieties that once played acrucial role in traditional subsistence systems.
One of the largest and most important watershed in West Java where this transformation at the"natural" setting is taking place is the Citarum River Basin. The development of the regionaleconomy of the basin has led to habitat alteration and loss, overharvesting of the resources thatstill remain in the "natural" forest, and forest fragmentation. Factors such as population growth,the advent of agricultural practices that cause pollution, and the introduction of high-yielding

Functional Relationships Between Plant and Animal Indicator Species 253
periods. Pollination occurring between two different individual plants results in out-breeding, inwhich there is high genetic recombination.
Cross-pollination is important to provide gene flow, ensuring that each generation is geneticallydiverse, is operated on by selection, and thus will have strong specialization for different niches.Many out-breeders are dioecious. Self-pollinated plants are obligate in-breeders and have lowgenetic recombination. Plants that bypass pollination altogether are Apomicts, but they can stillreproduce. Apomixis is common in cultivated rainforest fruit trees such as mangosteen (Garciniamangostana), langsat or lanzones (Lansium domesticum), and some mangoes (Mangifera spp.),and clove relatives (Syrygium spp.) (Whitmore 1990).
Mammals as Pollinators
Flower-visiting Fruit Bats and Bananas (Musaceae). Chiropterophilous plants or bat-pollinatedflowers have syndromes that allow them to bloom at night, where the visiting bats are brushedwith pollen each time they drink nectar. However, due to the small amount of nectar producedand the few flowers that open on each plant, bats are obliged to forage from plant to plant to filltheir stomachs. This ensures more successful cross-pollination that maximize genetic variationand plant vigor (Fenton 1992). Bats need to supplement their diet with a rich source of protein,since nectar, although a high energy source, lacks protein. Some nectar-feeding bats ingestpollen during grooming, because pollen is a rich source of protein but difficult to digest.However, roosting bats drink some of their own urine to create very acidic conditions in theirstomach necessary to digest pollen.
Old World fruit bats (Pteropodidae) are one of the most diverse mammalian groups in thePhilippines. Most are exclusively frugivorous, and others are nectivorous, having long snoutsand exceptionally long tongues to lap up nectar from bat-pollinated flowers. These belong to thetribe Macroglossinae, which feeds on both nectar and pollen. Two species of flower-visiting fruitbats are recorded on Mount Makiling—the Dawn bat or Cave Nectar bat (Eonycteris spelaea)and the smaller Dagger-toothed Flower bat (Macroglossus minimus). Dawn bats (Eonycteris) arecave-roosting species, dependent on caves for nesting, but they forage into primary andsecondary forest habitats, although E. spelaea also uses other habitats such as agroecosystems. Itis considered an essential pollinator of many commercially important tree species in SoutheastAsia, such as Durian, Kapok, Abaca, and mangroves. Despite its tolerance and adaptability tohuman habitation, the Dawn bat is uncommon in Mount Makiling; it was never observed in anyof the study sites, but it is known to occur in the lowlands. This is due to the lack of large caveson the mountain to accommodate roosting colonies.
One of the most common interactions between nectivorous bats and rainforest plants involves thewild banana (i.e., Musa acuminata, Musaceae) and the Dagger-toothed Flower bat(Macroglossus minimus). It also pollinates other wild and hybrid banana plants (e.g., Musaparadisea, M. sapientum) and the commercially important fiber plant Abaca (Musa textilis).Banana plants have flowers borne on a stalk outside the main composite of leaves (penduliflory),which allows the bat to forage on the flowers' nectar easily outside the trunk. They alsooccasionally roost in dead banana leaves, or roost in trees and palms in the vicinity of their foodsource (Mickleburgh, Hutson, and Racey 1992). This small fruit bat uses a wide range ofhabitats, and on Mount Makiling it was observed in the mossy forests from the peak down to theagricultural areas near sea level. Despite their diminutive size, they can travel over extensiveareas, often singly, to feed in patches of forests and in agricultural areas. Although it is known to

2 0. Abdoellah, Parikesit, B. Gunawan, N. Djuangsih, and T. Era wan
varieties to replace local ones are among the major factors that are transforming the naturalsetting of the Citarum River Basin. The state of the basin's forest is critically important to thelongevity of three major reservoirs (Cirata, Saguling, and Jatiluhur) and the sustainability ofhuman activities downstream. Nevertheless, the remaining forests are confined to themountainous areas and none of them is left completely undisturbed by human intervention.'
The rapid changes that are occurring and will be occurring in the Citarum River Basin in comingyears will have serious consequences for environmental stability within the river basin. The mostpronounced consequences are likely to be soil erosion, decreasing water availability and quality,and expansion of critical lands. The most significant consequences of agricultural developmentare likely to be decreasing crop yield, pest outbreaks, and depletion of the gene pool. If thenatural environment in the Citarum River Basin is not managed properly, economic developmentin this river basin will eventually be jeopardized. Mooney et al. (1995) point out that in highlymanaged landscapes, human system may be best maintained where land-use managementpractices confer functional diversity on both ecological and economic systems.
A comprehensive study concerning the conditions of biodiversity and its maintenance in theCitarum River Basin is therefore called for, particularly in the upper part of the basin. Sincewatershed systems usually consist of both "natural" and man-made ecosystems, the study willincorporate both ecosystems. It will include, for example, components of the "natural" ecosystemsuch as the remnant forest found in the river basin. Apart from being a home for numerous biotasand a source of biological resources vital for the survival of local inhabitants, natural vegetationplays a crucial role in maintaining the sustainability of human activities and the overall regionaldevelopment within the watershed. Moreover, even though human interaction with theenvironment has been occurring for centuries, many aspects of the biotic and abioticrelationships that exist in the natural ecosystem are still poorly understood.
The current development of the Upper Citarum River Basin cannot be isolated from aspects ofdevelopment at a wider scale, which has also affected the maintenance of biodiversity in thebasin. In fact conditions in this river basin reflect in microcosm the relations between center andperiphery. Almost all the villages located along the Citarum River are connected with urbanareas—the center of economic growth—by a major road. Two key questions are thereforeaddressed in this study: What is the condition of biodiversity in the "natural" ecosystem ofMount Wayang, and how is distance/access between center and periphery associated withbiodiversity maintenance in the man-made ecosystem? The first hypothesis of this study is thatthe biodiversity condition of the middle zone of Mount Wayang is the most disturbed, comparedwith peak and lower areas (Figure 1.1). The second hypothesis is that the maintenance ofbiodiversity in the man-made ecosystem does not co-vary in a linear fashion with distance fromthe center and proximity to the periphery. Rather, biodiversity is lowest in a zone of transition, anarea influenced in the same way both from center and periphery (Figure 1.2).
Indonesian Site
General Features
Citarum River Basin, sited in the province of West Java, Indonesia, crosses seven differentdistricts. Its catchment area of 6,000 km makes this basin the largest among the rivers of WestJava. The river runs approximately 350 km northward from Mount Wayang in the southern partof Bandung to the Java Sea (north of Jakarta). One of the unique aspects of the river is the

254 William Sm. Gruezo and Juan Carlos T. Gonzalez
feed on the flower of other plants such as coconuts and Kapok, it is most closely associated withbananas.
Flying Foxes as Pollinators. Flying foxes (Family Pteropodidae) are large fruit-eating bats toolarge to be considered efficient pollinators. However, they are known to feed on pollen andnectar, as well as a wide variety of fruits. Some have important relationships with severalrainforest trees (i.e., Bombaceae). The Kapok tree (Ceiba pentandra) is a night-blooming tree,whose white, odoriferous, penduline flowers attract large numbers of bats (by the colony) tofacilitate massive pollination in a short period. Feeding groups are often large (ten to twenty) andnoisy. Two species of flying foxes, Giant flying fox (Pteropus vampyrus) and the Island flyingfox (Pteropus hypomelanus), still have extant populations on Mount Makiling. Within therainforest park, large groups of up to thirty P. vampyrus were observed feeding on the flowers ofthe Kapok tree during the summer blooming season. In the morning, the forest floor was litteredwith spent blooms from the previous night's feeding frenzy. Actually this species can be foundin a variety of habitats, from primary forests to orchards and coconut groves, where it also feedson coconut nectar and pollen. It may also feed on the flowers of other commercially importanttrees, as well as their fruit.
Birds as Pollinators
Nectivorous Birds and Flowering Plants. Several species of sunbirds are on Mount Makiling,some of which are restricted to forest habitats, whereas others are able to adapt to disturbed andman-made habitats. The common Olive-backed Sunbird (Nectariniajugularis) can be found on awide range of habitats, from secondary forests to orchards and gardens. However, rarely arethese species found in primary or mature secondary dipterocarp forests and montane forests. TheFlaming Sunbird (Aethopyga flagrans) and the Lovely Sunbird (Aethopyga shelleyi) arePhilippine endemics observed in lowland and mid-montane dipterocarp forests on MountMakiling. It feeds on the tubular flowers of epiphytes in the canopy such as the Aeschynanthusphilippinensis, Dichrotrichum chorisepalum (both of the family Gesneriaceae), and the largeendemic liana species, the Jade Vine (Strongylodon macrobotrys), which is an importantindicator species. The Flaming Sunbird may also feed on the nectar of various vines and treesalong the middle layer of the strata. These Sunbirds (Aethopyga) on Mount Makiling may feedon the flowers of giant ginger-like understory plants, Catimbium speciosum (Zingiberaceae). Thetubular tongue of Aethopyga has frayed ends to facilitate the collection of nectar in the corolla ofthe flowers, making these birds adapted for feeding only on nectar (Gonzalez 1993).
Some long-billed species of Flowerpeckers (family Dicaeidae), though frugivores, willoccasionally feed on nectar, such as the Orange-breasted Flowerpecker (Dicaeum trigonostigma)and the Pygmy Flowerpecker (Dicaeum pygmaeum). Both species, like the sunbirds, have a longsharply pointed beak adapted for feeding on nectar. They were seen feeding on the flowers andfruit of the Hagimit (Ficus minahasse) in the mid-montane dipterocarp forest sampling sites onMount Makiling. To supplement their diet, nectar-feeding birds also feed on insects and otherarthropods for protein. Sunbirds and Spiderhunters (Arachnothera) feed on small spiders to addprotein to their diet, especially during the breeding season. They also make use of the silkythreads of the web to build their penduline nests.
Some birds observed in Mount Makiling are omnivorous, feeding on insects and fruits regularly,as well as nectar, and they include the White-eyes (family Zosteropidae), Bulbuls(Pycnonotidae), and some Starlings (Sturnidae). Others are exclusively insectivorous, such as the

HighBI0DIVERSITY
Low
HighBI0DIVERSITY
Low
Biodiversity Condition and Its Maintenance in Upper Citarum River Basin 3
PEAK AREA MIDDLE ZONE LOWER AREA
Figure 1.1 Hypothesis of the study of the "natural" ecosystem of Mount Wayang.
CENTER ZONE OF PERIPHERYTRANSITION
Figure 1.2 Hypothesis of the study of the man-madeecosystem in the Upper Citarum River Basin.
existence of three large reservoirs along it: Saguling, Cirata, and Jatiluhur. These reservoirsfunction particularly to generate electricity, to irrigate rice fields in the lowland areas, to controlfloods, and to provide a venue for tourism (Figure 1.3).
The Citarum River Basin bears great potential in agriculture, industry, and other nonforestrysectors. In the last two decades, development in those sectors has been very intense. Agriculturaldevelopment has been the most significant activity in the river basin, and development of theindustrial sector is also becoming very important and impacting the livelihood of the localpeople. Increasingly intensive human activity in the river basin is placing the Citarum RiverBasin in a critical condition. This is reflected in the flooding that takes place during the rainyseason every year, affecting agricultural as well as other human activities in the mid-section ofthe basin. Recently, the government (i.e., Department of Public Works) has been conducting a

Functional Relationships Between Plant and Animal Indicator Species 255
Warblers (family Sylviidae), but may feed occasionally on nectar. Nectar needs to becontinuously available to support a large number of nectivores and opportunists; and pioneerplants, like Melastomataceae, are keystone species that flower throughout the year. Manysecondary growth plants in Mount Makiling bloom for extended periods, attracting nectivoresespecially during the lean periods.
Herbivory
Folivorous Birds and Mammals
The Decline of the Philippine Brown Deer. The forests of Mount Makiling is home to only onespecies of large ungulate mammal, the Philippine Brown Deer (Cervus mariannus). It was quitecommon in the mountain, but now it appears that it has been extirpated and has not beenobserved in recent years. A large antler of one male was reported to have been taken from MountMakiling in 1991, and some sport hunters claim that a few deer may still remain in the upperelevations. This deer is the only true folivorous herbivore on the mountain, where it browses onleaves of shrubs, small trees, and some grasses. It is known to feed on the leaves of Tibig andother small trees of the family Moraceae.
Cloud Rats as Folivores. The Cloud rats or cloud runners are a group of large Murid rodentsfound only in the Philippines. Little is known about their biology, and due to their nocturnalhabitats, they are difficult to observe in the wild. The Southern Luzon slender-tailed Cloud rat(Phloeomys cumingi) is the only species found on Mount Makiling, and it is found only inlowland dipterocarp forests. However, it has been known to venture out of the forest into nearbyagroecosystems and human dwellings, where they are sometimes mistaken for giant rodent pests.They usually forage at night on the ground for fallen fruits or on the large branches of trees.They are arboreal and feed on the delicate fresh young leaves and soft fruits, and build nests intree hollows. This species may feed on the tubers and leaves of sweet potatoes in captivity, aswell as the leaves of the Water Crest or Kangkong (Ipomoea aquatica, Convolvulaceae). Oneindividual was observed foraging on a Saurauria latibractea tree (Saurauriaceae) on MountMakiling, which was also visited by several Giant Flying foxes. Folivory among Philippinerodents is rare, and it is probably exemplified only by the Cloud rats, which are not entirelyexclusive to feeding on foliage although it may comprise a major part of its diet. One problem isthat leaves contain cellulose, which is not readily digested without the aid of fermentation withmicroflora in the digestive tract. Cloud rats probably have the same means for digestion as mostfolivorous rodents. They may include into their diet of leaves, some seeds and fruits, such asguava, papaya, and bananas, and are known to venture into cultivated areas where it has beennoted feeding on young corn (Gonzales and Kennedy 1996).
Guaiabero Fig Parrot and the Shoots of Ficus Variegata (Moraceae). The Bubutuk orGuaiabero Fig Parrot was observed eating the young shoots on the branches of the Tangisang-bayawak (Ficus variegata), a species of fig with small caulifloric fruits. Birds like the Bubutukare fig specialists, with the fruits of Ficus being an important component of their diet. However,fruits, especially figs, need to be supplemented by other foods richer in protein, particularlyduring the nesting and molting season (Whitmore 1990). Fig fruits are considered to be low inprotein, such that their leaves are said to have a much higher protein content than the fruit itself.This partial folivory for fig leaves by frugivorous birds exploits other sources of protein(reducing competition with insectivorous birds for protein). It is not known how the Bubutuk

4 0. Abdoellah, Parikesit, B. Gunawan, N. Djuangsih, and T. Erawan
project intended to widen the river body and to straighten out the river channel to reduce floodingin downstream areas. As a result, in the rainy season of 1995-96 and 1996-97, flooding was notreported in those areas.
The Biophysical Conditions of the Study Area
Topography and Climate. The altitude of the Citarum River Basin ranges from sea level to 1,500m above sea level (asl), in the headwaters located on Mount Wayang. The altitude of our studyvillages ranges from approximately 650 to 1,500 m asl, with the lowest being Ranca Kasumbaand the highest being Taruma Jaya. This wide altitudinal range encompasses a diversetopography, mostly "hilly" in the upper part of the basin (Taruma Jaya and Sukapura) and fromundulating to a plain from Maruyung down to Ranca Kasumba.
The Citarum River Basin has a tropical climate characterized by distinct rainy and dry seasons.The rainy season runs from November to April, and the dry season from May to October.Rainfall varies considerably from year to year; it also varies within the basin. Within the studyarea, the mean annual rainfall ranges from 1,500 to 3,000 mm. The daily means of minimum andmaximum temperature also vary within the basin. Within the study area, the lowest is between15° and 19°C in the upper part of the basin, whereas the highest is between 22° and 29°C in thelower section.
Soil. Andosols and an association of andosols and regosols are found in the upper part of thestudy area; soil associations of andosols and regosols, latosols and regosols, and a complex ofred-yellow podzolic soils are found in the middle part; and an alluvial association of latosols andregosols is found in the lower part. The difference in soil types to some extent affects theproductivity and types of agricultural system.
Studies indicate that erosion in the Citarum River Basin is accelerating (IOE 1981) due to humanactivities in various sectors, particularly agriculture. These studies show that in the upper part ofthe basin—where very intensive upland agriculture is practiced—gullies and exposed slopes areeroded even by low-intensity rainfalls. In areas with the most extreme topography, landslidesalso occur during the rainy seasons. The annual erosion rate varies from site to site, depending onthe topographical and geological features of the river basin. _
The sources of sediments in the Citarum River are mainly riverbank erosion and land cultivation,especially on sloping lands. Cultivation in the state forest under the tumpangsari systempracticed by local farmers prior to 1986 was formerly suspected as another source of sedimenta-tion. Efforts to control erosion and sedimentation have consisted of revegetating critical landsand making terraces on agricultural lands.
Accessibility
Efficient transportation links to the upper basin, by means of an asphalt road, were developed inthe 1970s. This has made interaction between the villages and the market centers more conve-nient. The most important effect of the improved transportation network has been the generalimprovement of amenities, including opportunities to market agricultural products, opportunitiesto receive information and services, and acceleration in other infrastructural development. Theimproved network has also been very important in facilitating movement of villagers to nearbycities, especially during the dry season.

256 William Sm. Gruezo and Juan Carlos T. Gonzalez
digests these leaves. This requires more in-depth studies to determine how fig leaves can providealternative protein sources for its own dispersers and pollinators.
Other Interactions Between Plants and Animals
Natural Control of Forest Plant Pests
Insectivorous Birds for Natural Control of Plant Pests. The high diversity of arthropods in thetropical forests is matched by the diversity of insectivorous birds. Among the most importantinsect-bird relationships are those involving the bark-gleaning birds and tropical rainforesthardwood trees. Five species of bark-gleaning birds were observed on Mount Makiling,including three Woodpeckers (Chrysocolaptes lucidus, Mulleripicus funebris, Dendrocoposmaculatus), Tree Creepers (Rhabdornis mysticalis), and Velvet-fronted Nuthatches (Sittafrontalis). Woodpeckers are essential to forests as they provide nesting cavities for othersecondary hole-nesting species, such as parrots, some hawks, and owls.
Bark-gleaners provide opportunities for other insectivorous birds to forage for insect prey. Infact, insectivores form feeding flocks around bark-gleaning birds, whose action of probingthrough the bark flushes out other insects. Those that are flushed are eaten by sallyinginsectivores such as flycatchers; while those that escape and land on nearby leaves are eaten byfoliage-gleaning insectivores, such as warblers (Sylviidae) and tits (Paridae). As such, none iswasted because these insectivores feed in mixed groups using different feeding guilds.
Birds have numerous feeding guilds, each of which exploits insects along a vertical stratification.Each species or group of highly specialized insectivores can therefore control a particular insectpest associated with its niche and habitat. Terrestrial insectivores such as Thrushes (Turdidae)and Pittas (Pittidae) patrol the forest floor, searching among the leaf litter for small invertebrates.Tailorbirds (Sylviidae) patrol for insects in the thick foliage of the understory. Flycatchers(Muscicapidae), Monarchs (Monarchidae), and Whistlers (Pachycephalidae) are salliers thatpatrol the middle forest layer above the undergrowth. Cuckooshrikes (Campephagidae) glean theleaves and branches for insects in the top canopy. Needletails and Swiftlets (Apodidae) aresweepers, which patrol the area beyond the crown cover.
Nesting and Shelter
Tailorbirds and Large-leaved Understory Plants. Two species of Tailorbirds were recorded onMount Makiling—the Philippine Tailorbird (Orthotomus castaneiceps) and the Grey-backedTailorbird (0. derbianus). Both are small insectivores that forage in undergrowth. Both havecryptic coloration but are easily recognized by their conspicuous calls. Tailorbirds get their namebecause of the method they use to build their nests. These birds bind together large fresh leavesin the undergrowth, sewing the edges by piercing them with their bills and inserting long silkythreads (from a spider's web). Once bound together, the cup-shaped interior is lined with driedleaves.
Pittas and Understory Palms. Pittas or Jewel-thrushes (Pittidae) are ground-dwelling birds withlong legs and bright plumage. They forage on the forest floor for invertebrates, flipping over thedebris of leaves to search for small insects and other invertebrates. They have been known tomake use of exposed rock as a "thrushes-anvil" to smash open small land snails, like
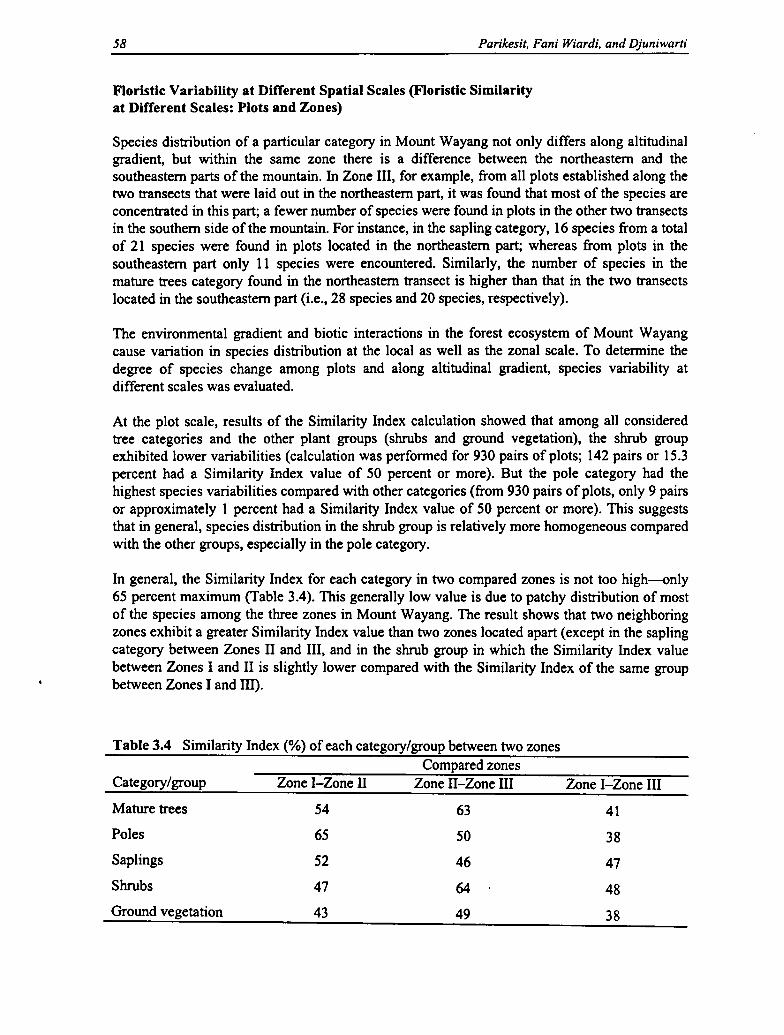
Figure 1.3 Citarum River Basin.

Functional Relationships Between Plant and Animal Indicator Species 257
Cyclophorus, which is common on Mount Makiling. Pittas are understory species and secretive,and little is known about their habits. They have been observed to nest near the ground to avoidcompetition for nest sites in the upper layers with other birds. Due to the closed canopy in mostrainforests, however, few understory plants can be used as nest sites, and the forest floor is tooopen for nesting.
Among the possible areas for nesting are the common short, shade-loving understory climbingpalms (Calamus spp.). The base of the petioles of these palms catches falling debris, whichprovide possible nesting spots for Pittas. These palms surround their trunk and leaves with longsharp thorns or spines, which also offer protection from predators. Pittas make their nest betweenthe petioles of the palm leaves, concealing the entrance to avoid discovery by predators. Onlytwo species of Pittas can be found on Mount Makiling—the Red-breasted Pitta (Pittaerythrogaster), which inhabits forests, and the Hooded Pitta (Pitta sordida), which inhabitsbamboo scrub and second-growth areas. A study by Tan, Gruezo, and Cuy (1982) on nestingplant materials of Philippine swiftlets (Collocalia esculenta) included some observations fromMount Makiling. However, additional research of this nature should be conducted.
Arboreal Frogs and Bird's Nest Ferns (Aspleniaceae). The Bird's nest ferns or Pakpak-lawinare arboreal epiphytic ferns (such as Asplenium nidus and A. cymbifolium), which collect humusin the frond bases. These bases are made up of roots and debris collected from the canopy andbryophytes, and they serve as small platforms in the middle strata layer where they are foundattached to tree trunks and branches. They are an important breeding site for small arborealforest frogs of the genus Platymantis, which lay their clutch of eggs on these platforms, safefrom predators. The eggs are large and gelatinous, and require high humidity, which is present inthe always-drenched frond bases. The eggs undergo direct development, bypassing the tadpolestage and hatching out as small frogs. One species of Forest Frog (Platymantis) found in the mid-montane dipterocarp forest sites uses ferns as breeding sites. Other species of this genus may doso as well, possibly even the tree frog (Philautus surdus), which also lays large eggs that undergodirect development.
Other vertebrates make use of these platforms not only as sites for nesting, but also for shelterduring the day for nocturnal feeders. Some endemic forest geckoes make use of the frond basesas retreats, safe from predators, and accessible for foraging. One of these is the endemicPhilippine Bent-toed Gecko (Cyrtodactylus philippinicus), which is found on the mid-montanedipterocarp forests on Mount Makiling. Invertebrates also make use of this platform as abreeding site, exemplified by the Giant Helical Snail (Ryssota ovum) (locally known as theBayuko). It lays clusters of white eggs on top of the frond bases.
Arboreal Frogs and Leaf Axil of Plants. Some forest plants have prominent leaf axil thatbecome filled with water after rain and retain it for some time. Most of these leaf axil occur onclimbing plants such as the climbing pandanus (Freycinetia spp.) and understory species ofscrewpines such as Pandanus luzonensis and P. loherianus (Pandanaceae). Some leaf axils arelarge and provide shelter for small vertebrates, such as small geckoes that hide in the axil of wildbananas (Musa) and some large screwpines (Pandanus). For the plant themselves, the water-filled leaf axil serves no important purpose aside from water conservation. Such is the case forthe Giant Taro (Alocasia macrorrhizos, Araceae), which has large water-filled axil that sheltersnumerous organisms like spiders, katydid grasshoppers, ants, roaches, nematode worms, andvarious protozoa.

258 William Sm. Gruezo and Juan Carlos T. Gonzalez
One of the most interesting inhabitants of this microhabitat is the Arboreal Forest Frog(Platymantis). It uses the leaf axil only during the day, creeping out of these protective shelters atnight to feed in the surrounding cover of the understory. During the day, the frog is submerged inwater, with just its head exposed. When the axil is disturbed, the frog pushes its body deeper intothe axil, although in some cases, fast retreat is also an option. The axil becomes important duringthe short dry season, when water in the intermittent creeks become limited or absent. The forestfrog makes use of the water-filled axil as rehydration sites, both safe and cool. The practice ofusing water-filled axil as shelter is also observed in Microhylid frogs such as Kaloula baleata.
Other relationships between frogs and forest plants arise from the need for protection, not justshelter. Observations of arboreal male Platymantis on Mount Makiling show that they call tofemales from spiny rattan stems or leaves, good vantage points for attracting females andavoiding predation. Similarly, tree frogs (Philautus surdus) were observed resting on the leavesof nettle plants or Lipang-kalabaw (Dendrochnide meyeniana, Urticaceae), unharmed by thestinging leaves. They incidentally use these leaves for protection against predators, allowingthem to call females in relative safety.
The Effect of Exotic Vegetation on Native Fauna
The modification of rainforest vegetation affects faunal diversity in a number of ways. Originallymade up of primary dipterocarp forest, much of the lowland forests on Mount Makiling has beenlost or reduced to secondary forest. Only mid-mountain dipterocarp forest remains intact on themountain, above 600 m asl, but even there human encroachment is slowly taking its toll. Theintroduction of exotic trees for reforestation and commercial fruit trees in the orchards on thelower slopes below 300 meters has transformed much of the forest to a mosaic of secondarygrowth, orchard, grassland, or parang vegetation (Miranda 1987). At present, humanencroachment is spreading up onto the upper slopes at the edge of the mid-montane forest.
Miranda (1987) noted that there was a loss or reduction of birds in the rainforest park belongingto the families Muscicapidae, Trogonidae, Timaliidae, Pittidae, and some Alcedinidae because ofdisturbance in the understory vegetation. These birds have been replaced by some generalizedfeeders like Bulbuls (Pycnonotidae) and White-eyes (Zosteropidae), as well as birds such assome Flowerpeckers (Dicaeidae) and Rhabdornis (Rhabdornithidae), which are able to shiftfeeding guilds. The majority of specialized insectivores, most notably the flycatchers andterrestrial insectivores, are especially vulnerable to habitat change. The less specialized groupslike omnivores (insect- and fruit-eaters) and most foliage-gleaning insectivores were found to bemore tolerant. The introduction of the Large-leaf Mahogany (Sweitania macrophylla) to MountMakiling apparently reduced avian diversity, but this decrease is higher than that observed inparang vegetation. Opportunistic species take over from the intolerant nonendemic species. Areduction among endemic forest species is thus evident, especially among the threatenedendemics.
Similar results have been found in other rainforest avifaunas, which also have undergone habitatmodification. Johns (1986) noted that selective logging (a common practice in the Philippines)produced a significant decrease in bird species richness in the lowland dipterocarp forests ofPeninsular Malaysia. Many of the intolerant species were forest endemics, particularly birds ofthe families Timaliidae and Muscicapidae. There also was a drastic decrease in bird speciesrichness in areas where the lowland rainforests of Peninsular Malaysia were cleared.

Biodiversity Condition and Its Maintenance in Upper Citarum River Basin 5
Socioeconomic Conditions in Upper Citarum
The ethnic background of the inhabitants of the Upper Citarum River Basin is mostly Sundanese,although as the industrial sector has developed, migrants from Central Java (Javanese) have comeand settled in the lower part of the study area. These migrants are not involved in farmingactivities.
The total population in the Upper Citarum River Basin is approximately 950,000, giving apopulation density of 519 persons/Ian, which is lower for the upland areas of Java at 671persons/km 2 (World Bank 1989). Actually, the "felt" population density of the Upper CitarumRiver Basin is much higher than 519 persons/km since the calculation of this statistic includes thestate forests and plantations in the basin. If forests and plantations are excluded from thecalculation, the population density of the villages in Upper Citarum River Basin ranges between2,000 and 10,000 persons/km2.
Agricultural activities are the most important source of income for the inhabitants of UpperCitarum River Basin. The types of agricultural activities vary among the five villages dependingon their respective environmental conditions. The industrial sector is an important source ofincome in the lower part of the basin, where the textile industry has been developing since theearly 1930s (Hardjono 1990).
Despite the importance of the agricultural sector, the majority of people in Upper Citarum RiverBasin are landless. Our study indicates that the percentage of landowning households in threevillages (Sukapura, Wangisagara, and Ranca Kasumba) varies between 10 and 40 percent. This isin accordance with wider statistics on landownership in West Java, which show that more than 50percent of the people are landless.
Agricultural activities in the uppermost study villages (located 1,200 m asl) include cash-cropping, raising of dairy cows, and cultivating tea. Nearby is a large tea plantation, owned by ajoint venture between the government and a foreign company, and a state-owned cinchonaplantation. The agricultural sector offers many wage-labor opportunities for the landless people.The dominant cash-crops cultivated by most farmers are vegetables. In the past, most farmersgrew only carrots and potatoes. But today a number of additional crops, such as cabbage,cauliflower, and green onion, have been introduced and are being grown as major cash-crops.
Prior to 1986, farmers living in villages adjacent to the state forest cultivated crops in the forestunder the so-called tumpangsari program. Local people were allowed to cultivate cleared andreforested areas with the condition that they had to take care of the newly planted trees. Thecultivation period lasted two to three years, after which time the farmers had to move on toanother newly cleared area to repeat the process. As flooding in the lower part of the CitarumRiver Basin became more frequent, however, the program was terminated.
Agricultural activities in the middle and lower parts of the Upper Citarum River Basin aredominated by rice cultivation, although cash-crop cultivation, fish raising, and sheep raising alsoplay an important role for some of the local farmers. Farmers grow rice mostly for subsistencepurposes. Only a few farmers who own many hectares of rice fields grow rice for commercialpurposes as well. Farmers in this area grow high-yielding varieties (HYVs) of rice twice a year.The HYVs replaced local varieties that were grown only once a year.

Functional Relationships Between Plant and Animal Indicator Species 259
Development has led to the replacement of these Malaysian forests with rubber tree plantations,a form of cash-crop monoculture.
Relationship of Plants and Animals in Agroecosystems
Birds as Agents of Dispersal and Pollination
Mount Makiling has extensive plantations of coconuts on its slope in lowland areas near Bay andSto. Tomas. Copra is one of the major products, which is used as a base of many commercialproducts. Coconut flowers are pollinated by many vectors, including insects (bees, wasps, andsome beetles), bats (flying fox, flower bats), and birds (usually sunbirds, but also otherfrugivores). Some birds are specialized for feeding on nectar and are major pollinators ofcoconut flowers and other fruit-bearing bird-pollinated trees. The sunbirds (Nectarinidae) arehighly specialized nectivores, some of which are also adapted to plants found in agroecosystems.The Olive-backed Sunbird (Nectarinia jugularis) and the Purple-throated Sunbird (N. sperata)are common nectivores of gardens and orchards, particularly coconut groves. They contributegreatly to the pollination of these palm flowers. Pairs of sunbirds sometimes establish and guardterritories within the canopy of palm fronds, staking out feeding areas.
The Colasisi (Loriculus philippensis) is a canopy frugivore, which feeds on small fruits of figs(Ficus), other fruits that may be available, and nectar, especially nectar from palms such ascoconuts. These birds also venture out from forest habitats into agroecosystems to exploitalternative sources of food. However, the importance of the Colasisi as a major pollinator ofcoconuts must be scrutinized since, like most nectar-feeding parrots, the Colasisi has anunspecialized bill that can crush the flowers and render them useless for pollination after thenectar has been squeezed out. We need to study in detail whether the Colasisi is actually doingmore harm than good.
The Colasisi occurs infrequently on Mount Makiling, where it is much sought after by poachersfor its market. In a mid-montane dipterocarp forest in Puting-Lupa (Site E), a poacher wasobserved setting-up patda or glue traps made from cooked sap of Antipolo (Artocarpussericicarpus, Moraceae) at about 4:00 A.M., using a live female as decoy. The poacher camedown at about 10:00 A.M. with a catch of twenty birds for that day, which he sells for 20-50pesos (about US$1—US$2) each to bird hawkers from Calamba, Laguna. These birds are sold aspopular cage birds in pet shops in Calamba and Los Banos (Laguna Province), Tanauan(Batangas Province), and even up to Manila. Prices range from 100-200 pesos (about US$4-US$8) in Los Banos to as much as 500 pesos (about US$20) in Manila pet shops. Poachers claimthat trapping these birds is relatively easy (but tedious) and helps provide additional income totheir impoverished farm households.
Bats: Our Misunderstood Guardians
Many plants economically important to humans benefit from pollination and seed dispersal byfruit bats. Among these are the chiropterophilic bananas (Musaceae), which are bat-pollinated.Indeed the status of the banana crop may depend on the status of their associated pollinators,such as Macroglossus minimus. Many other tropical fruits such as Durian (Durio zibethinus),lanzones (Lansium domesticum), and Kapok (Ceiba pentandra) are bat-pollinated, as are anumber of commercially valuable timber trees. Among the most important cash-crops affecting

6 0. Abdoellah, Parikesit, B. Gunawan, N. Djuangsih, and T. Erawan
Only a small proportion of the population in the uppermost villages of the basin are involved inoff-farm activities. To gain additional income, some landless people (mainly men) of bothvillages collect fuelwood from the nearby forest to be sold for local consumption. In the middleand lower parts of the study area, however, off-farm activities play a significant role as a sourceof income for local people, particularly for the landless. Sand and stone quarries and brickfactories are major sources of off-farm income. Another off-farm sector that absorbs thousandsof local people as labor is the textile industry.
Methodology
The first step of the study was to carry out pilot surveys, using Rapid Appraisal for BiodiversityMaintenance (RABM) in five villages in the Upper Citarum River Basin, namely Taruma Jaya,Sukapura, Maruyung, Wangisagara, and Ranca Kasumba (about RABM, see Gunawan et al. inthis volume). The selection of these villages was based on their distance from Bandung and theirproximity to the Citarum River. Based on these, three villages were selected for intensive study:Sukapura representing the periphery; Wangisagara, the zone of transition;' and Ranca Kasumba,the center. In addition to carrying out RABM, standard quantitative data on biological diversityin each type of land use and the socioeconomic status of the population were gathered in thesethree villages. This succeeding intensive study was designed to integrate all the biological andsocioeconomic aspects being investigated. In each intensive study village, data concerning flora,fauna, and socioeconomic factors were collected through direct measurement and interview. In afourth site, the remnant forest at the head of the basin, standard survey methods using transectsand plot quadrats were used.
Approach
This study uses an ecosystem approach in assessing the conditions of biodiversity and itsmaintenance. Barbault and Sastrapradja (1995) point out that to face the challenge of the loss andmanagement of biodiversity, a spatial and ecosystemic-oriented approach appears to be moreuseful than an accumulation of species-centered studies. This study uses land-use type as its entrypoint, based on the assumption that the dynamics of land use at the ecosystem level affectbiodiversity at the species or genetic level. These dynamics will be analyzed both synchronicallyand diachronically. After describing the dynamics of land use, the study proceeds with ananalysis of flora, viewing this aspect both as a habitat for other taxa and as a biological resourcefor human survival.
Avifauna was selected as one of the faunal components for intensive study. This taxon is oftendrawn on for indicator species, due to its wide distribution at local, regional, and continentalscales (Daniels, Joshi, and Gadgil 1990; Soule and Kohm 1989; Noss 1990; Hanksworth andRichie 1993; Kremen et al. 1993; Samways 1994, cited by Stork and Samways 1995). Alsodeemed significant is the close relation of avifauna with floristic aspects. This study also assessesterrestrial and flying insects as another taxon, in part for its usefulness as a potential indicator ofland-use change (Soule and Kohm 1989; Noss 1990; Hanksworth and Richie 1993; Kremen et al.1993; Samways 1994, cited by Stork and Samways 1995). Another taxon, squamata, is includedin the study because of its high sensitivity to ecological changes (Johns 1981). Although theseseveral taxa are analyzed and integrated, we have no intention of aggregating them into a singlevalue to describe the condition of biodiversity at each study site.

260 William Sm. Gruezo and Juan Carlos T. Gonzalez
the livelihood of the local people around Mount Makiling is the coconut. It is one of the mainplantation crops around Barangay Bagong Silang (Los Banos) and other nearby communities.Coconuts also benefit from pollination by bats. Even the large flying foxes (Pteropus sp.)contribute to pollination of coconut flowers, feeding not only on the nectar, but also on pollen.
One of the major conflicts between humans and fruit bats is the belief that these bats causesevere damage in orchards, especially orchards of lanzones. Fruit bats are killed by the hundredsdaily around Laguna and Batangas Provinces. The langsat or lanzones actually bear flowers onthe trunk (cauliflory), which is an adaptation for bat visitation for pollination and seed dispersal.However, the fruit growers see these bats only as a threat rather than as an agent of ecologicalregeneration. In fact, fruit bats such as the Philippine Musky fruit bat (Ptenochrusjagori) detectthe presence of ripe fruit by sight and smell. The large eyes help determine texture, and theirolfactory organs detect ripeness. Such bats, when visiting orchards, seek out and feed only on theripest fruits generally too ripe for human consumption. Most of the other fruits remainundisturbed, and removal of the overripe fruits provides an important sanitary solution,preventing it from rotting and spreading disease to the rest of the crops.
Pest and Pest Control
Norway rats (Rattus norvegicus) and Roof rats (Rattus tanezumi) are serious household pests andcause tremendous damage to crops and stored products. They also transmit many diseases, due totheir close association with human refuse. These rats, including the small house mouse (Musmusculus) and the Polynesian rat (Rattus exulans) are commensal to human habitation, and bothwere recorded in the agroforestry zone adjacent to the mid-montane forest zone. These pests arenaturally controlled by predators, such as the raptorial birds including hawks, eagles, kites, andowls, as well as the terrestrial predators, especially the Common Rat Snake (Elaphe erythrura).This is one of the many snakes found on Mount Makiling, most of which are small,nonpoisonous, and harmless. Human fear of snakes has resulted in indiscriminate culling,reducing their population to the point where they are unable to control their pest prey. (The samething has happened to the raptorial birds, which are regularly trapped or shot for trophies.)
The tropical fruit rambutan (Nephelium lappaceum) is one of the major cash-crops in Laguna. Awild relative of this species (Nephelium ramboutan-oke) occurs in the Mount Makiling forests,and higher-yielding hybrids are planted in orchards on the mountain's lower slopes. Long-tailedMacaques (Macaca fascicularis) are one of the important dispersal agents of wild rambutantrees. On Mount Makiling, there also have been cases when rambutan orchards close to the forestreserve have attracted macaques to feed on the fruits. The shrinking forest habitat of themacaques is one of the reasons these animals come into close contact with agroforestryoperations in the first place. A similar conflict has been observed in coffee plantations, due to thefrugivorous habits of the Palm Civet (Paradoxurus hermaphroditus).
Insectivorous bats also play a major role in maintaining the balance of ecological systems onMount Makiling. The small Myotis and Pipistrellus bats of citrus and coffee orchards arevoracious insect eaters. They can consume as much as double their weight in insect pests in onenight. Hipposideros and Megaderma are two large insectivorous bats, which are still active andnatural pest controls. The smaller Rhinolophus bats are important insectivores in lowland forests.Even the common Brown Bat (Scotophilus kuhli) can consume twice as much as its weight ininsects in one night. For example, if there are 1,000 Pipistrellus, each of whose weight is 4
Biodiversity Condition and Its Maintenance in Upper Citarum River Basin 7
Dynamics of Biodiversity and Its Maintenancein the Upper Citarum River Basin
The conditions of biodiversity and its maintenance are dynamic, because their determinantfactors are not static. Biodiversity management, particularly in tropical ecosystems, is not simple;we still lack a good understanding of the long-term consequences of biodiversity loss andenrichment. Moreover, no single factor can account for the conditions of biodiversity and itsmaintenance; numerous factors—including abiotic interaction among species, environmentalvariables, and the socioeconomic conditions of the local people—interact with one another todetermine biodiversity maintenance .3 Therefore, assessment of biodiversity condition and itsmaintenance must be carried out at a number of different levels, ranging from the genetic level tothe ecosystemic level. This is particularly necessary when looking at human impacts onbiodiversity maintenance.
Prior to intensive human settlement in the nineteenth century, the Upper Citarum River Basinwas covered by natural forest. In the uppermost part of the valley, forest clearing for logging andplantations was undertaken on a large scale by the Dutch. The logged-over forest was left todevelop by itself into secondary forest, whereas the cleared forest was planted with Altingiaexcelsa and Pinus merkuisii. The cleared forest areas also were occupied by local people forsettlement and agriculture.
The dynamics of land-use change in the Upper Citarum River Basin, as a result of logging,development of plantations, human settlement, and intensive development of the agricultural andindustrial sectors (particularly beginning in the 1970s), have turned the basin into a mosaic of"natural" and artificial communities with a different composition and structural vegetationpatterns (Figure 1.4). Human clearing of the natural forest` in the Upper Citarum River Basin hasresulted in the emergence of at least five new major types of land use: tea and cinchonaplantations, settlements/homegardens, s crop gardens (upland crop), rice fields," and bamboo-treegardens.' Recently, the bamboo-tree gardens have been declining or even disappearing fromsome villages, especially in the uppermost part of the basin. $ These transformations of thephysical landscape have had that effect on the overall biological diversity.
At the ecosystem level, there is a tendency that the change of land use over time from one type toanother in the upper part of the study area is relatively faster than that in the lower part. Theconversion of bamboo-tree gardens to cash-crop fields in the uppermost part, for example, isrelatively faster than that in the lower part of the river basin. The climatic condition in the upperpart of the basin and market demand on cash-crops such as cabbage, carrot, potato, and greenonion have stimulated the conversion of economically less productive land use such as bamboo-tree gardens, whereas in the lower part of the basin, climatic condition is a major constraint facedby farmers to grow cash-crops because the cash-crops grown in the upper part of the basinusually require particular growth conditions such as high humidity and a cool climate.
Dynamics of Biodiversity Conditions in Mount Wayang
The vegetation that can be seen today on Mount Wayang is partly a result of forest exploitation,such as logging, practiced over the course of a century or longer. Even though serious pressurefrom human intervention continues to occur (albeit at a less intense rate), the degree of floristicdiversity on Mount Wayang is still relatively high (Parikesit, Djuniwarti, and Yadikusumah, thisvolume), although species distribution throughout the area is not homogeneous. Thisheterogeneous species distribution leaves the area vulnerable to species extinction at the local

Functional Relationships Between Plant and Animal Indicator Species 261
grams, foraging in the agroecosystem zone, they will consume 8,000 grams or 8 kilograms ofinsect prey each night, and nearly three tons in one year!
On the ground, this condition is repeated among the small mammalian insectivores of the familySoricidae, the shrews. Shrews, which need to feed constantly to maintain their high metabolicrate, are voracious insect eaters. The endemic Luzon White-toothed Shrew (Crocidura grayi)was recorded in the mossy forests near the peak of Mount Makiling. This has been replaced by acommensal species in agroecosystems, the Asian House Shrew (Suncus murinus), which helpscontrol the population of many serious pests such as cockroaches and grasshoppers. Its voraciousappetite helps to reduce (if not halt) the use of chemical pesticides.
References Cited
Fenton, M. B. 1992. Bats. Facts On File, Inc.
Gonzales, P. C., and R. S. Kennedy. 1996. A new species of Crateromys (Rodentia: Muridae) from Panay,Philippines. Journal of Mammalogy 77(1): 25-40.
Gonzalez, J. C. T. 1993. An avifaunal survey of Puerto Galera, Oriental Mindoro Province, Philippines.Asia Life Sciences 2(2): 163-76.
1996. Seeds found in the feces of three endemic fruit bats of Luzon island. A special problem inbotany 245 (weed systematics), Institute of Biological Sciences, University of the Philippines at Los Banos,College, Laguna, Philippines.
Gruezo, W. Sm. 1985. Angiospermic parasites of Philippine fruit trees. National Research Council of thePhilippines Bulletin 40(1): 241-67.
1995. Mt. Makiling plant diversity: Additional quantitative data and keystone/indicator species. InThe conditions of biodiversity maintenance in Asia: The policy linkages between environmental conserva-tion and sustainable development, annual report 1995, ed. M. R. Dove and P. E. Sajise, 55-79. KhonKaen: Southeast Asian Universities Agroecosystem Network and East-West Center, Honolulu.
Gruezo, W. Sm., and A. C. Soligam. 1990. Identity and germination of seeds from feces of Philippine palmcivet (Paradoxurus philippinensis Jourdan). Natural History Bulletin of Siam Society 28:69-82.
Heaney, L. R., D. S. Balete, L. Dolar, A. C. Alcala, A. T. L. Dans, P. C. Gonzalez, N. R. Ingle, M. Lepiten,W. R. Oliver, E. A. Rickart, B. R. Tabranza Jr., and R. C. B. Utzurrum. In prep. A synopsis of themammalian fauna of the Philippine islands.
Heideman, P. D., and L. R. Heaney. 1989. Population biology and estimates of abundance of fruit bats(Pteropodidae) in Philippine submontane rainforest. J. Zool., Lond. 218:565-86.
IUCN (International Union for the Conservation of Nature and Natural Resources). 1994. IUCN red list ofthreatened animals. Gland, Switzerland, and Cambridge, United Kingdom.
Johns, A. D. 1986. The effects of selective logging on the ecological organization of a peninsularMalaysian rainforest avifauna. Forktail 2:65-79.
Mat Saleh, K. 1991. Rafflesia, magnificentflower of Sabah. Sabah, Malaysia: Borneo Publishing.
Mickleburgh, S. P., A. M. Hutson, and P. A. Racey. 1992. Old World fruit bats: An action plan for theirconservation. IUCN/SSC Chiroptera Specialist Group, International Union for Conservation of Nature andNatural Resources, Switzerland.
Miranda, H. C., Jr. 1987. Bird species diversity as related to the vegetation structure of disturbed lowlandforest in Mount Makiling. M.Sc. thesis in zoology, University of the Philippines at Los Banos.

8 O. Abdoellah, Parikesit, B. Gunawan, N. Djuangsih, and T. Era wan
NATURAL FOREST -------------
SECONDARY FOREST ........ ► PLANTATION
UPLAND 4-- RICE BAMBOO-TREECROP GARDEN
£*
• ....... ............................
SETTLEMENT/HOME GARDEN
Notes:
Arrow head : Direction of change__ Derived from Soemarwoto and Soemarwoto (1984)..........., : Other changes found in the study area
Figure 1.4 Historical change of land use in the Upper Citarum River Basin.
level if forest encroachment results in further forest fragmentation . 9 Nowadays, some valuabletree species such as Castanopsis argentea and Podocarpus imbri cat us are infrequentlyencountered on Mount Wayang due to past tree harvesting. Continuing forest degradation wouldthreaten the existence of both species.
Even though species diversity along altitudinal gradients on Mount Wayang does not varysignificantly, except for the ground vegetation on the lowest part of the mountain (which harborsthe lowest number of species), average population density per plot does slightly differ among thealtitudinal zones. Factors such as spatial heterogeneity and disturbance level are probablyresponsible for this difference. Although human disturbance is present throughout the forest onMount Wayang and no part of the forest is left undisturbed, it is likely, however, that levels ofdisturbance differ among the three altitudinal zones. For example, as part of a strategy to acquire

262 William Sm. Gruezo and Juan Carlos T. Gonzalez
Tan, B. C., W. Sm. Gruezo, and L. S. Cuy. 1982. Nesting plant materials of Philippine swifflets (Collocaliaesculenta). Kalikasan, Philippine Journal of Biology 11(2-3): 409-14.
Whitmore, T. C. 1990. An introduction to tropical rain forests. Oxford: Clarendon Press.
Wildlife Biology Laboratory. 1994. Educational tour of Mount Makiling Forest Reserve. An informationpamphlet for Viajes Filipinas educational tours.

Floral Diversity Profile of Mount Makiling Forest Reserve, Philippines 187
Appendix Table 8.2 Inventory list of vascular plants present within thedipterocarp mid-montane forest zone of Mount Makiling Forest Reserve(Luzon, Philippines) showing relative density and diversity index value (datafrom eighteen study plots; December 1994 to February 1995)
Taxon p; p; 4 p;
Selaginella delicatula 41 -0.013882Selaginella involvens 20 -0.007571Selaginellajagori 33 -0.011572Selaginella sp. 1 -0.000545Semecarpus gigantifolia 6 -0.002673Shorea contorta 36 -0.012450Shorea negrosensis 3 -0.001452Smilax leucophylla 10 -0.004171Sphaerostephanos lobatus 2 -0.001013Sphaerostephanos productus 28 -0.010075Spondias pinnata 2 -0.001013Stemonorus luzoniensis 1 -0.000545Stenomeris dioscoreaefolia 1 -0.000545Sterculia macrophylla 3 -0.001452Sterculia montana 4 -0.001873Strobilanthes pachys 779 -0.136078Strobilanthes pluriformis 1024 -0.163288Strombosia philippinensis 34 -0.011866Strongylodon macrobotrys 2 -0.001013Strychnos multiflora 2 -0.001013Swietenia macrophylla 1 -0.000545Sympetalandra densiJlora 1 -0.000545Syzygium calubcob 3 -0.001452Syzygium polycephaloides 1 -0.000545Syzygium simile 18 -0.006919Syzygium sp. 7 -0.003059Talauma villariana 1 -0.000545Tectaria crenata 12 -0.004884Tectaria grandifolia 8 -0.003436Tectaria hilocarpa 4 -0.001873Teratophyllum aculeatum 6 -0.002673Terminalia nitens 2 -0.001013Terminalia oocarpa 10 -0.004171Terminalia sp. 1 -0.000545Tetracera scandens 24 -0.008841Tetrastigma loheri 12 -0.004884Theobroma cacao 3 -0.001452Tinomiscium philippinensis 6 -0.002673Tinospora reticulata 1 -0.000545Toona calantas 2 -0.001013

188 William Sm. Gruezo
Appendix Table 8.2 Inventory list of vascular plants present within thedipterocarp mid-montane forest zone of Mount Makiling Forest Reserve(Luzon, Philippines) showing relative density and diversity index value (datafrom eighteen study plots; December 1994 to February 1995)Taxon p; i 1„ p;
Trichadenia philippinensis 3 -0.001452Trichosanthes quadriangulata 1 -0.000545Trigonostemon philippinensis 20 -0.007571Turpinia pomffera 34 -0.011866Uncaria perrottetii 1 -0.000545Uncaria philippinensis 2 -0.001013Uncaria velutina 2 -0.001013Vaginularia trichodea 13 -0.005233Villebrunea rubescens 99 -0.028662Vittaria ensiformis 1 -0.000545Wfkstroemia meyeniana 1 -0.000545Zingiber zerumbet 5 -0.002279Zizyphus cumingiana 1 -0.000545Zizyphus talanai 1 -0.000545
N = 17965 H=3.8971270
S = 374
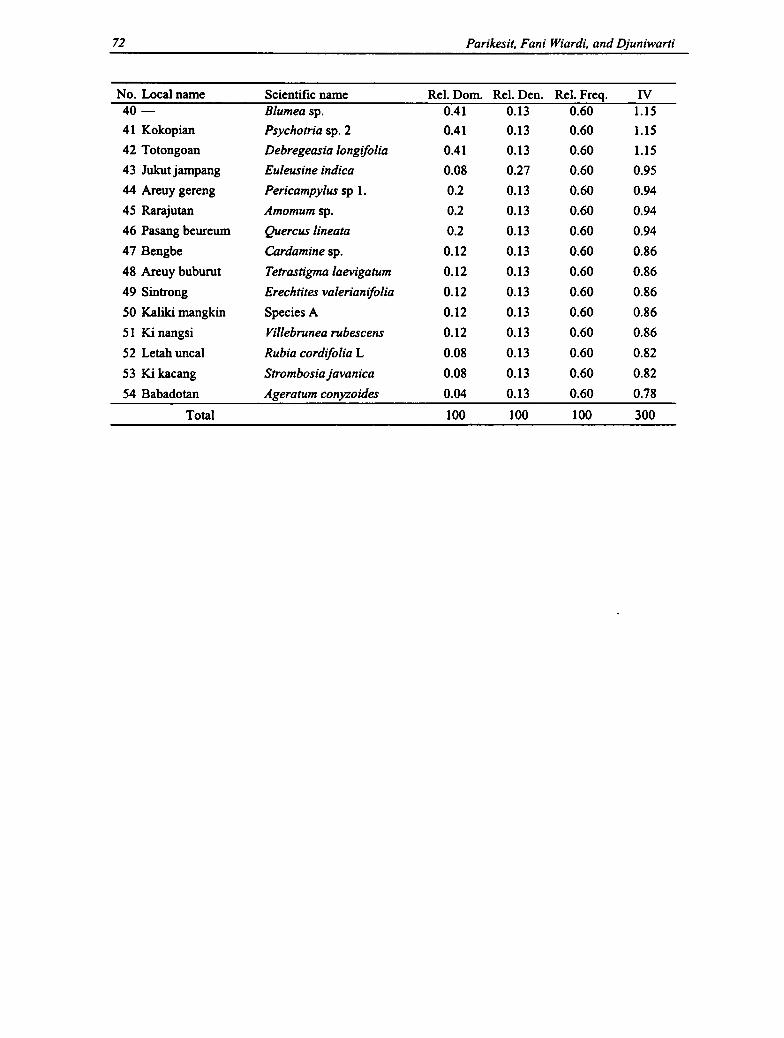
Floral Diversity Profile of Mount Makiling Forest Reserve, Philippines 189
Appendix Table 8.3 Inventory list of vascular plants within thegrassland ecosystem of Mount Makiling Forest Reserve (Luzon,Philippines) showing relative density and diversity index value(data from ten study plots; December 1994)
Taxon p; p; l„ p;
Amorphophallus campanulatus 3 -0.004273Apluda mutica 47 -0.042269Biophytum sensitivum 12 -0.013917Calopogonium mucunoides 1 -0.001634Centella asiatica 3 -0.004273Centrosema pubescens 1 -0.001634Crassocephalum crepedioides 1 -0.001634Desmodium heterocarpum 23 -0.023820Desmodium triflorum 6 -0.007752Elephantopus scaber 11 -0.012940Elephantopus tomemtosus 25 -0.025494Ficus septica 1 -0.001634Ficus ulmifolia 1 -0.001634Fimbristylis monostachya 1 -0.001634Fimbristylis sp. 3 -0.004273Geodorum nutans 3 -0.004273Habenaria malintana 16 -0.017678Hewittia sublobata 1 -0.001634Hyptis rhomboidea 1 -0.001634Ichnocarpus volubilis 4 -0.005477Imperata cylindrica 1961 -0.367827Knoxia corymbosa 1 -0.001634Lantana camara 72 -0.058894Lygodium japonicum 1 -0.001634Melothria indica 10 -0.011946Mikania cordata 266 -0.151266Mimosa pudica 6 -0.007752Mussaenda philippica 1 -0.001634Nervilia discolor 11 -0.012940Paederiafoetida 13 -0.014879Paspalum conjugatum 3 -0.004273Pennesitum purpureum 250 -0.145126Pericampylus glaucus 3 -0.004273Phaseolus artropurpureus 17 -0.018587Phyllanthus amarus 1 -0.001634Pseudelephantopus spicatus 7 -0.008840Pueraria phaseoloides 225 -0.135136Roettboellia exaltata 4 -0.005477
Saccharum spontaneum 2018 -0.367489Schizaea dichotoma 2 -0.003003

190 William Sm. Gruezo
Appendix Table 83 Inventory list of vascular plants within thegrassland ecosystem of Mount Makiling Forest Reserve (Luzon,Philippines) showing relative density and diversity index value(data from ten study plots; December 1994)Taxon p P. P.Scleria lithosperma 137 -0.095247Setaria palmifolia 5 -0.006634Sphaerostephanos unites 9 -0.010932Uraria lagopodioides 55 -0.047814
S = 45 H=1.664378N = 5242
Floral Diversi ty Profile of Mount Makiling Forest Reserve, Philippines 191
Appendix Table 8.4a Inventory list of vascular plants within the agroforestry zoneof Mount Makiling Forest Reserve (Luzon, Philippines) showing their role, habit,and locality record (data from fifteen study plots; December 1994 to February 1995)
Role/taxon Habit' B.S.
Locality record°
Kar Tim
Fruit crop species
Ananas comosus h + + -
Annona muricata st + + +
Annona squamosa st - + +
Artocarpus altilis It - - +
Artocarpus heterophyllus It + + +
Averrhoa bilimbi st - - +
Carica papaya ti + + +
Citrus limon sh + - -
Citrofortunella x microcarpa sh - + +
Citrus maxima st - + -
Cirtrus nobilis sh - +
Citrus reticulata sh + - +
Chrysophyllum cainito mt - - +
Cocos nucifera ti + + +
Durio zibethinus It - - +
Lansium domesticum st + - -
Mangifera indica It + + +
Manilkara zapota st - - +
Musa sapientum h + + +
Nephelium lappaceum st + - +
Persea americana It + + -
Psidium guajava st + + +
Sandoricum koe jape sh + + +
Syzygium cumini mt - + -
Masticatory use
Areca catechu tl + - -
Cover crop/green fertilizer
Calopogonium mucunoides v + - -

192 William Sm. Gruezo
Appendix Table 8.4a Inventory list of vascular plants within the agroforestry zoneof Mount Makiling Forest Reserve (Luzon, Philippines) showing their role, habit,and locality record (data from fifteen study plots; December 1994 to February 1995)
Locality record°
Role/taxon Habit' B.S. Kar Tim
Fuelwood
Gliricidia sepium st + + +
Leucaena leucocephala st + + +
Beverages
Coffea canephora sh + + -
Cofea excelsa sh + - -
Theobroma cacao sh + - +
Root crops
Colocasia esculenta h + + +
Curcuma longa h - + -
Dioscorea alata v + + +
Ipomoea batatas v + - +
Manihot esculenta sh + + +
Xanthosoma sagittifolium h + + +
Zingiber officinale h - + -
Vegetables
Artocarpus heterophyllus It + + +
Carica papaya ti + + +
Colocasia esculenta h + + +
Cucurbita maxima v + + -
Dolichos lablab v - - +
Ipomoea aquatica v - - +
Ipomoea batatas v + - -
Lycopersicon esculentum h + - -
Momordica charantia v - - +
Moringa oleffera st - - +
Phaseolus calcaratus v + - -
Phaseolus lunatus v - + -
Psophocarpus tetragonolobus v - + -
Sesbania grandiJlora st - - +
Solanum melongena sh - - +
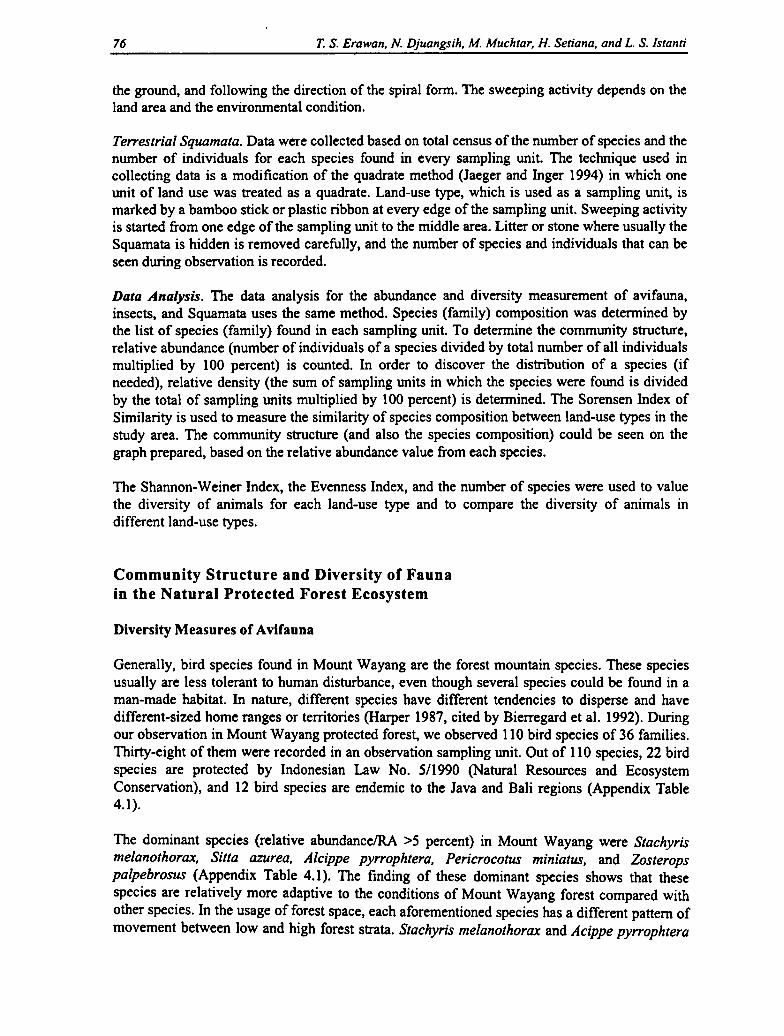
Floral Diversity Profile of Mount Makiling Forest Reserve, Philippines
Appendix Table 8.4a Inventory list of vascular plants within the agroforestry zoneof Mount Makiling Forest Reserve (Luzon, Philippines) showing their role, habit,and locality record (data from fifteen study plots; December 1994 to February 1995)
Role/taxon Habit'
Locality record°
B.S. Kar Tim
Food dye
Bixa orellana sh + - -
Condiments
Capsicum frutescens sh + - -
Curcuma longa h - + -
Zingiber officinale h - + -
Medicinal/herbal medicine
Artemisia vulgaris h - + -
Construction materials
Bambusa blumeana tl - + -
Bambusa vulgaris tl - - +
Soil erosion control
Bambusa blumeana tl - + -
Bambusa glaucescens tl - - +
Bambusa vulgaris tl - - +
Ornamentals/landscape plants
Bambus blumeana tl - + -
Bambusa glaucescens tl - - +
Bambusa vulgaris ti - - +
Chrysalidocarpus madagascariensis tl - - +
a. h = herb; sh = shrub; st = small tree; mt = medium-sized tree; It = large tree; t1=tree-like; v = vine.b. B.S. = Bagong Silang and vicinity, Los Banos, Laguna; Kar = Karay, Pansol,Calamba, Laguna; Tim = Magnetic Hill and vicinity, Timugan, Los Banos, Laguna.
193
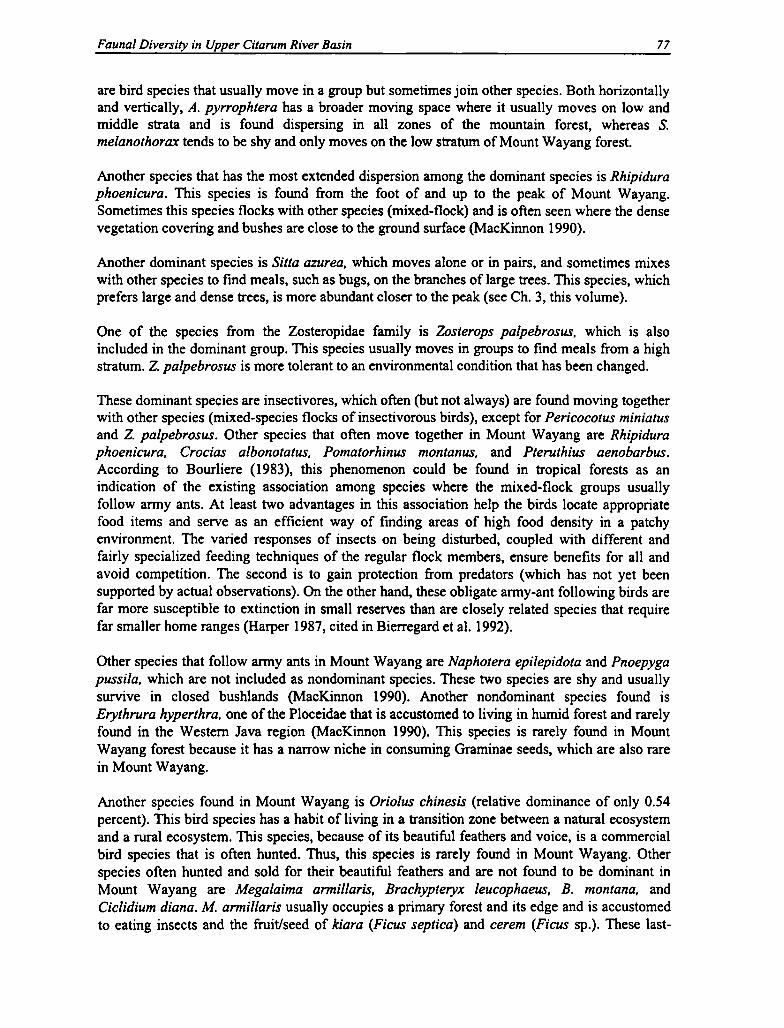
194 William Sm. Gruezo
Appendix Table 8.4b Inventory list of vascular plants within the agroforestry zone of MountMakiling Forest Reserve (Luzon, Philippines) showing their major and alternate roles, habit, andlocality record (data from fifteen study plots; December 1994 to February 1995)
Major role/taxon Alternate role Habit' B.S. Kar Tim
Weeds
Abroma angusta Ecological h - +Achyranthes aspera Ecological h + + -
Adenostemma lavenia Ecological h + - -
Ageratum conyzoides Ecological h + + +
Amaranthus spinosus Ecological h - - +Asystacia gangetica Ecological h + - +
Axonopus compresses Ecological h + - +
Bidens pilosa Ecological h - + +
Blechum pyramidatum Medicinal h - + +
Blumea mollis Ecological h + - _
Borreria articularis Ecological h - - +Brachiaria mutica Forage h - - +Bryonopsis laciniosa Ecological v - + -
Calopogonium mucunoides Cover crop v + _ +
Centella asiatica Vegetable h + - -
Centotheca lappacea Forage h + - +
Centrosema plumieri Forage v + + -
Centrosema pubescens Forage v + + +
Chromolaena odorata Poisonous sh - + -
Cleome rutidosperma Ecological h - - +
Coccinea grandis Ecological v - - +
Commelina benghalensis Ecological h - + +
Commelina diffusa Ecological h + - +
Corchorus acutangulus Vegetable sh - - +
Crassocephalum crepedioides Ecological h + + +
Cyanotis cristata Ecological h - - +
Cyathula prostrata Ecological h + + +
Cyperus brevifolius Ecological h + - +
Cyperus iria Ecological h - - +
Cyperuspilosus Ecological h - - +
Cyrtocccocum patens Forage h + + +
Desmodium laxi forum Ecological sh + + -
Desmodium zonatum Ecological sh + - -
Digitaria ciliaris Forage h - - +
Elephantopus tomentosus Ecological h + - -
Eleusine indica Forage h - - +
Emilia sonchifolia Ecological h - - +
Euphorbia hirta Ecological h - - +
Gynura procumbens Ecological h + - -
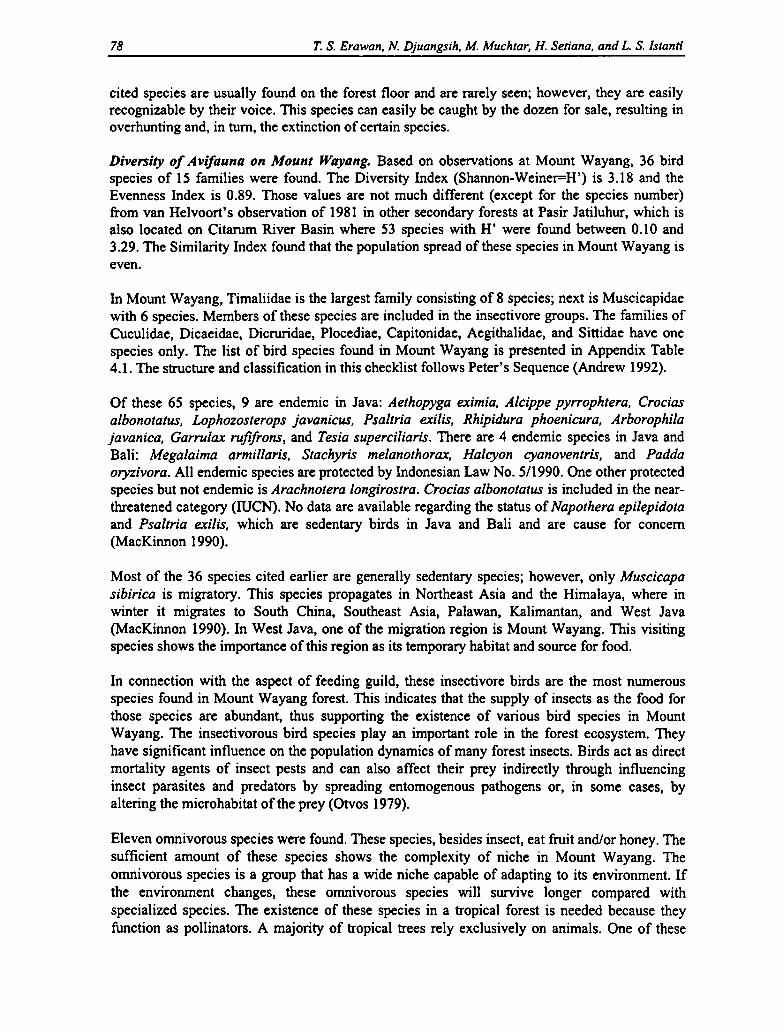
Floral Diversity Profile of Mount Makiling Forest Reserve, Philippines 195
Appendix Table 8.4b Inventory list of vascular plants within the agroforestry zone of MountMakiling Forest Reserve (Luzon, Philippines) showing their major and alternate roles, habit, andlocality record (data from fifteen study plots; December 1994 to February 1995)
Locality record°Major role/taxon Alternate role Habit' B.S. Kar Tim
Hedyotis corymbosa Ecological h + - -Hewittia sublobata Ecological v - + +
Ipomoea alba Ecological v - + +
Ipomoea obscura Ecological v + - +
Ipomoea triloba Ecological v - - +
Kalanchoepinnata Ecological h - + -
Lantana camara Ecological sh + + +
Lindernia cristata Ecological h - - +
Ludwigia decurrens Ecological h - - +
Ludwigia hyssopifolia Ecological h - - +
Melothria indica Ecological v + + -
Merremia gemella Ecological v - - +
Merremia peltata Ecological v - + -
Merremia vitifolia Ecological v - - +
Mikania cordata Ecological v + + +
Moghania strobilifera Ecological sh + - -
Mucuna pruriens Poisonous v - + -
Oplismenus compositus Ecological h + + +
Oxalis barreliero Ecological h - - +
Paederiafoetida Ecological v - - +
Panicum maximum Forage h - - +
Paspalidium flavidum Forage h - - +
Paspalum conjugatum Forage h + + +
Passijlora pulchella Ecological v - - +
Pennisetum purpureum Forage h - - +
Peperomia pellucida Herbal med. h - - +
Pericampylus glaucus Ecological v - + -
Phyllanthus urinaria Ecological h + - -
Physalis angulata Edible fruit sh - - +
Pollia macrophylla Ecological h + - -
Pollia secundiJlora Ecological h + - -
Pseudelephantopus spicatus Ecological h - - +
Pueraria phaseoliodes Cover crop v + - +
Pueraria triloba Cover crop v + - -
Rhynchelytrum repens Forage h - - +
Rottboellia exaltata Forage h + + +
Setaria palmifolia Forage h + - +Sidajavensis Ecological h - - +
Solanum nigrum Ecological sh - + +
Solanum torvum Ecological sh + - +
196 William Sm. Gruezo
Appendix Table 8.4b Inventory list of vascular plants within the agroforestry zone of MountMakiling Forest Reserve (Luzon, Philippines) showing their major and alternate roles, habit, andlocality record (data from fifteen study plots; December 1994 to February 1995)
Locality record°Major role/taxon Alternate role Habit' B.S. Kar Tim
Solanum verbascifolium Ecological sh - - +Stachytarpheta jamaicensis Ecological sh + - -
Synedrella nodiflora Ecological h + + +Tridaxprocumbens Ecological h - - +
Triumfetta bartramia Ecological sh - + +
Urena lobata Ecological sh + + -
Vernonia cinerea Ecological h - - +
Voacanga globosa Ecological sh - + -
Wedelia triloba Ecological h - - +
a. ep = epiphyte; f = fern; h = herb; li = liana (woody vine); It = large tree; mt = medium-sizedtree; par = parasite; sh = shrub; St = small tree; tI = tree-like; v = vine.b. B.S. = Bagong Silang and vicinity, Los Banos, Laguna; Kar = Sitio Karay, Barangay Pansol,Calamba, Laguna; Tim = Magnetic Hill and vicinity, Barangay Timugan, Los Banos, Laguna.

Floral Diversity Profile of Mount Makiling Forest Reserve, Philippines 197
Appendix Table 8.4c Inventory list of vascular plants within the agroforestry zone of MountMakiling Forest Reserve (Luzon, Philippines) showing their major and alternate roles, habit, andlocality record (data from fifteen study plots; December 1994 to February 1995)
Locality record`Alternate
Major role\taxon role' Habitb B.S. Kar Tim
Indigenous/native forest species
Adiantum caudatum or f - - +
Adiantum philippense or f + + +
Aglaia dfffusa la st + - -
Aglaonema simplex or h + - -
Ahernia glandulosa la It + - -
Alangium chinensis la st - + +
Alocasia heterophylla or h + - -
Alocasia portei or h - + -
Alstonia macrophylla med mt - + -
Alstonia scholaris med It - + +
Amomum elegans la h + + -
Amorphophallus campanulatus or h + + -
Amphineuron interruptum or f + - -
Amphineuron terminans or f - - +
Anaxagorea luzonensis la h + + -
Anthocephalus cadamba tm It + - -
Antidesma bunius ft st - + -
Antidesma cumingii ft st - + -
Aphananthe philippinensis la st - + +
Arcangelisiaflava med v + - -
Ardisia pyramidalis la sh + - -
Arenga pinnata fc tl + + +
Artocarpus ovatus la mt - + -
Artocarpus rubrovenius la mt - + -
Artocarpus sericicarpus la ly - + +
Asplenium nidus or ep + - -
Diplazium esculentum or, veg h + - -
Bauhinia purpurea la st - - +
Bischofia javanica la It + + -
Bolbitis mucronata or f + - -
Breynia cernua la sh - + -
Bridelia minutiflora la sh - + -
Broussonetia luzonica la, veg It + - -
Broussonetia papyrijera la st - - +
Calanthe triplicata or h + - -
Canarium asperum la It + + -
Canarium hirsutum la it + - -
Canarium luzonicum la It - + -

198 William Sm. Gruezo
Locality record`Alternate
Major role\taxon role` Habit° B.S. Kar TimCanna indica la h - - +Caryota cumingii la d + + +C. rumphiana var. philippinensis la ti - + -Casearia grewiaefolia la It + - -
Catimbium speciosum or h + - -
Cayratia trifolia cc v + + -
Celtis luzonica tin, la It + + +Ceropegia cumingiana or v - + -
Chloranthus elatior med sh + + -
Christella dentata or f + + +Cinnamomum mercadoi sp mt - - +Cleidion specijlorum la It + + -
Clerodendron intermedium la st - + -
Colona serratifolia fi mt - + -
Connarus semidecandrus la v + - -Cordia dichotoma la st - + -
Corymborchis confusa or h + - -
Cratoxylum celebicum la mt - + -
Cymbidium sp. or h + - -
Dendrochnide meyeniana po St - + +Dennstaedtia smithii or f + - -
Deeringia polysperma la sh + + -
Derris elliptica po li - - +Derris philippinensis la li - + -
Dictyospermum vitiense w h + - -Dillenia philippinensis la It + - -Diospyros blancoi la, fc It + - -Diplodiscus paniculatus fc it + - -Dischidia platyphylla or ep h - + -
Donax cannaeformis cot h + + -
Dracontomelon dao tin It - + +
Dysoxylum gaudichaudianum la It + + -
Ehretia acuminata la sh - + -
Elaeocarpus calomala la It - + -
Elatostema viridescens cc h + - -
Ervatamia pandacaqui med sh - + +
Euodia confusa la It + - -
Ficus angustissima la sh - - +
Ficus balete la li - + -
Ficus concinna la mt - + +
Ficusfistulosa la sh + - -
Ficus guyeri la sh - + -
Biodiversity Condition and Its Maintenance in Upper Citarum River Basin 9
wood from the forest without getting caught, some villagers cut their trees (mostly poles orsapling) in the middle part of the mountain (Zone II). Consequently, this middle zone seems to bemore disturbed; average individual densities of poles and saplings in this middle zone are lowercompared with the other zones.
The dynamics of biodiversity on Mount Wayang reflect the influence of abiotic as well as bioticfactors. On the one hand, the high degree of biodiversity on Mount Wayang indicates themagnitude of the potential biogenetic resources; on the other hand, current exploitation of naturalresources by local people is not being done on a sustainable basis. The problem is exacerbated bythe high number of landless people in the study area, particularly in villages adjacent to stateforests. Some farmers, both landless and landowners, cultivate cash-crops in the state forestillegally. These farmers argue that the soil in the forested areas is more fertile than that in theagricultural land. They point out that the condition of the cultivated land in their village hasdeclined, so that in order to maintain good crop yields they need to continually increase inputs(such as fertilizers and pesticides), and this demands more capital. In contrast, when theycultivate forested land, the needed energy input is partly supplied by the forest itself (i.e., humusfrom decayed vegetation).
Forest encroachment also has occurred, resulting from a cattle project introduced by thegovernment to alleviate poverty in the Upper Citarum River Basin. Due to poor planning, growthon the cattle population has exceeded the carrying capacity of the area, which is indicated by alack of fodder for the cattle. The project has become detrimental to both the physical as well asthe social environment (see Gunawan, Abdoellah, and Purnawan, this volume). Lack of grass tofeed the cattle, for example, forces the farmers to encroach on the state forest of MountWayang—especially during the dry season—to cut young leaves of certain forest trees as asubstitute for grass. The cattle project has led to forest encroachment not only to collect forestfodder but also to cut timber for building and repairing the cattle pens, and to gather fuelwood forboiling milk. These activities have affected the vegetation structure of Mount Wayang forest,particularly in the middle zone (see Parikesit, Wiardi, and Djuniwarti, this volume).
Clearly, local inhabitants have a high dependency on forest resources.- Therefore, strict forestprotection and complete exclusion of the people who reside adjacent to the forest will not solvethe problem of biodiversity maintenance (as also stated by Sponsel, Headland, and Bailey 1996).Biodiversity conservation on Mount Wayang can succeed only if the interests of the local peopleare taken into account.
The current structure of the vegetation on Mount Wayang has a significant impact on thediversity and community structure of the fauna that inhabits the forest. The high diversity of theavifauna on Mount Wayang, for example, is suspected to be associated with the complexity ofthe structure of the vegetation and the diversity of the flora. Complex vegetational structureattracts more species of birds, each occupying different niches and having different habitats andpatterns of movement both vertically and horizontally (Erawan et al., this volume). Even thoughthe majority of avifauna found on Mount Wayang are distributed all along the altitudinalgradient, some species predominate in one zone but not others. Zosterops palpebrosus, forexample, is abundant in the most disturbed zone (Zone II), while Sitta azurea is not.
The avifauna of Mount Wayang include a relatively high number of endemic and protectedspecies. Out of sixty-five species, fourteen species (22 percent) are protected, of which thirteenspecies are endemic to Java and Bali (see Erawan et al., this volume). The relatively highpercentage of endemic and protected species on the mountain indicates that the biodiversity on

Functional Relationships Between Plant and Animal Indicator Species 263
Appendix Table 10.1 Plant species currently found in the dipterocarpmid-montane forest zone of Mount Makiling that serve as food items forbirds, mammals, and humans
Food items forPlant species Birds Mammals Humans
Aglaia diffusa - + +
Alocasia heterophylla + - -Alocaisa zebrina + - -
Alocasia macrorrhizos + - -Amomum elegans - + -
Amorphophallus campanulatus + - -
Arenga pinnata - + +
Ardisia marginata + - _
Bischofia javanica + + +
Breynia cernua + - -
Calamus merrillii - + +
Calamus ornatus - + +
Canarium asperum + + -
Canthium monstrosum + + -
Caryota cumingii - + -
Caryota rumphiana - + -
Catimbium speciosum - + -
Celtis luzonica - + -
Cocos nucijera - - +
Cofea canephora - + +
Daemonorops mollis - +
Dendrochnide meyeniana + - -
Dioscorea elmeri - - +
Diospyros blancoi - + +
Diospyros blancoi - + +
Diospyros discolor - + +
Diplodiscus paniculatus + + +
Dillenia philippinensis - - +
Dillenia reifjerschidia - + +
Elaeocarpus calomala + + -
Ficus balete + + -
Ficus gul + + -
Ficus guyeri + - -
Ficus subulata + + -
Garcinia dulcis - + +
Goniothalamus amuyon - + -
Koordersiodendron pinnatum - + -
Laportea luzoniensis + - -
Leea aculeata + + -
Litchi philippinensis + + +
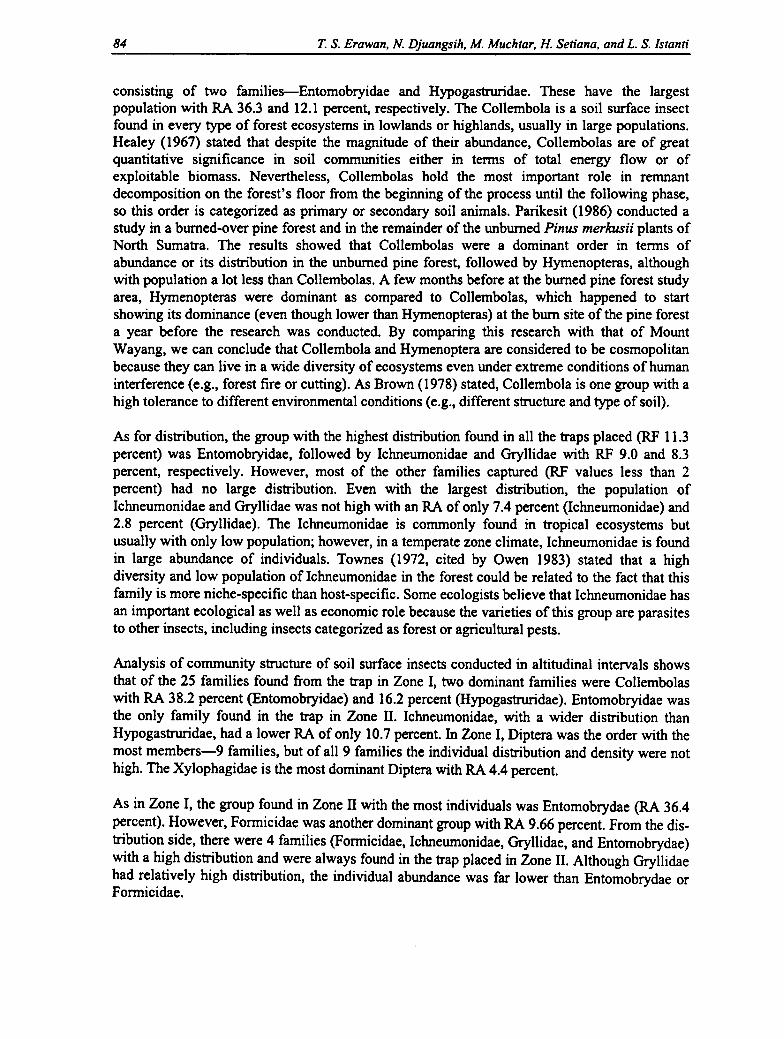
10 0. Abdoellah, Parikesit, B. Gunawan, N. Djuangsih, and T. Erawan
Mount Wayang is still quite high, considering the limited acreage of remnant forest on thismountain (less than 1,000 hectares).
The association of vegetational structure along altitudinal gradient with insects that can beencountered in Mount Wayang is not as distinct as that with avifauna. In general, the dominantgroups of soil surface insects on Mount Wayang do not vary significantly among the threealtitudinal zones. Zone II, though, exhibits a lower diversity of soil surface insects (in terms offamily richness). On the other hand, the dominant groups of flying insects do differ among thethree zones. Unlike the soil surface insects, the diversity of flying insects is highest in Zone II (interms of family richness).
Dynamics of Biodiversity Conditions in Man-made Ecosystems
As in the natural ecosystem, biodiversity conditions and its maintenance in man-madeecosystems are also dynamic. The floristic diversity in various components of the agroecosystem,such as bamboo-tree gardens and homegardens, reflects the functional diversity of the speciesfound in the system. The presence of numerous cultivated as well as wild plant species is notonly important in economic terms, but they also have ecological and social functions. Thisdiversity also reflects the culture of the local people. The dynamics of biodiversity in the UpperCitarum River Basin are not solely determined by the bioclimatic and edaphic factors of the area.Local socioeconomic and cultural factors are crucial determinants of resource management,which greatly affects biodiversity maintenance. Differences in culture play a major role in theway in which biodiversity is perceived, maintained, preserved, used, and appreciated (Heywoodand Baste 1995). Differing attitudes toward nature are often the result of outside influences, suchas interaction with modern culture and intrusion of the market. As these circumstances vary,preference may be given to short-term maximization of levels of productivity or to the diversity,persistence, and stability of production. These factors influence the way in which biodiversity ismanaged (Mooney et al. 1995).
There are important differences in landscape matrixes among the high study village (Sukapura),the middle village (Wangisagara), and the low village (Ranca Kasumba). In the high village thelandscape matrix is dominated by dryland agriculture, whereas the low village is dominated bywet land. In the middle village, the landscape matrix is dominated by dryland as well as wet land.In the middle village, biophysical constraints such as climatic conditions prevent the farmersfrom shifting completely to highland cash-crops such as carrots and potatoes, so they tend tomaintain their bamboo-tree gardens as well as rice fields. They plant the bamboo-tree gardenswith perennial crops and utilize the rice-field bunds for annual crops. In Sukapura village, themarket economy has induced the farmers to grow high-yielding crops for market, replacing theirtraditional crops. This market-oriented economy in Sukapura has altered the condition ofbiodiversity at three hierarchical levels: genetic, species, and ecosystem. At the genetic andspecies levels, some of the traditional crops are disappearing at the same time as the number ofintroduced varieties is increasing. At the ecosystem level, the market-oriented economy isreducing the diversity of land-use types, resulting, for example, in the gradual loss of bamboo-tree gardens. Such losses have implications for biodiversity because the great spatial heteroge-neity to which the different land uses contribute has amplified the opportunities for cultivatedand wild species.
The role of homegardens in contributing to the conditions of biodiversity in the study area isimportant but variable. The local people may select plant species for their homegardens forsubsistence or commercial purposes or aesthetic reasons. Socioeconomic background plays a

264 William Sm. Gruezo and Juan Carlos T. Gonzalez
Appendix Table 10.1 Plant species currently found in the dipterocarpmid-montane forest zone of Mount Makiling that serve as food items forbirds, mammals, and humans
Food items forPlant species Birds Mammals Humans
Litsea garciae + + -
Litsea perrottettii + + -
Livistona rotundifolia - + -
Microcos stylocarpa - + +
Micromelon minutum + - -
Palaquium tenuispetiolatum - + -
Papualthia lanceolata + + -
Persea americana - - +
Pinanga insignis - + -
Polyalthia suberosa - +
Pometia pinnata - + -
Sandoricum koe jape - - +
Seemecarpus gigantifolia - + -
Sehelera insularum + - -
Smilax leucophylla + - -
Syzygium ploycephalum + + +
Tetrastigma loheri + + -
Theobroma cacao - - +
Villebrunnea rubescens + - -
Total 28 40 21
+ = Serves as food item.
- = Does not serve as food item.

Biodiversity Condition and Its Maintenance in Upper Citarum River Basin II
significant role in this variation in homegarden function and plant diversity. The poor families inSukapura that only own small homegardens, for example, tend to use them for commercialpurposes by planting cash-crops, whereas the rich families in the same village, owning muchlarger homegardens, tend to use them for aesthetic purposes.
In terms of species richness, homegardens in the Upper Citarum River Basin are more diversethan bamboo-tree gardens. This is interesting, considering that the homegardens tend to besmaller than the bamboo-tree gardens. This indicates that human factor may override sizeconsiderations in enriching biodiversity. Nevertheless, to what extent diminishment inhomegarden size does not cause a decline in diversity is hard to predict. But one thing iscertain—smaller homegarden size leads to simplification of the vertical structure of thevegetation. Also, in homegardens cultivated species are more diverse than wild species, whereasthe reverse situation is seen in the bamboo-tree gardens. Maintenance intensity is probably one ofthe most important factors in determining the presence or absence of wild species in the twotypes of gardens. Space availability also plays an important role in the presence or absence ofwild species.
The degree of species diversity in the three study villages is not the same. The average number ofspecies in bamboo-tree gardens and homegardens is the highest in Wangisagara. Bioclimatic andedaphic factors and the socioeconomic and cultural conditions of the people play an importantrole in the high degree of biodiversity in this village. Abiotic constraints faced by the localfarmers have forced them to make more intensive use of some local resources. An example canbe seen in the rice fields of Wangisagara—almost all farmers plant subsistence crops on theirrice-field bunds. This makes rice-field crop diversity higher in Wangisagara. A different situationcan be seen in the other two villages, where only a few farmers use their rice-field bunds to growsubsistence crops. The people in Sukapura and Ranca Kasumba are more market-oriented andtend to use their land to maximize the economic benefit of their land. In Ranca Kasumba, forexample, the rice-field bunds are very narrow because the farmers want to maximize the size oftheir rice fields and, thus, the amount of rice planted. Apart from that, the farmers in this villageonly grow one variety of rice called IR-64, which is a high-yielding variety grown widely inJava. In Sukapura, on the other hand, cash-crop growing is the main agricultural activity. Theintensive agriculture practiced by most farmers in this village focuses on a small number of high-yielding crop species and varieties to maximize profit. The overall consequences for biodiversitymaintenance of these changes in the environmental, socioeconomic, and cultural conditions ofthe three study villages are obvious: the increasing commercial orientation has to some extentcaused a decline in biodiversity.
The introduction of improved varieties enriches the local biodiversity on the one hand, but on theother hand it leads to undesirable developments in the surrounding environment such as theemergence of new pests and diseases, and the loss of local and traditional varieties that are moreresistant to pests and diseases. The improved rice varieties replaced at least nineteen traditionalrice varieties that had been grown for decades (some farmers in Wangisagara and Sukapura[kampong Joglo] still grow some local, traditional rice varieties). Such reductions in diversity notonly impoverish biodiversity in the present but they also result in a gradual loss of options for thefuture (Anton 1995; Mannion 1992). In addition, the loss of any one species is likely to have asynergistic or multiplier effect on several others, because species are interconnected andinterdependent (Sponsel, Headland, and Bailey 1996). The introduction of improved varieties inthe area also has undesirable social effects. The improved varieties appear to give a competitiveadvantage to wealthier farmers who are in a better position to make full use of them. Moreover,the labor demand of the new technology have far-reaching effects on village social organization.

Functional Relationships Between Plant and Animal Indicator Species 265
Appendix Table 10.2 Summary of vertebrate groups from Mount Makiling and their dispersed plantgroups found in forests and agroecosystems
Plant partVertebrate Species Natural Agroecosystem used
Fruit bats Haplonycteris f scheri Figs/Pepperomias None Fruit
Acerodonjubatus Various figs None Fruit
Ptenochirus jagori Caulifloric figs Lanzones, chico Fruit
Cynopterus brachyotis Caulifloric figs Lanzones Fruit
Pteropus hypomelanus Various figs Mangoes, chico Fruit
Pteropus vampyrus Various figs Lanzones, mango Fruit
Rousettus amplexicaudatus None Mangoes, chico Fruit
Mammals Macacafasicularis Figs, Katmon Lanzones, rambutan Fruit
Paradoxurus Palms Coffee, banana Fruithermaphroditus
Phloeomys cumingi Various figs Banana Fruit
Rattus everetti Various figs Banana Fruit
Rattus tanezumi Pioneer trees All crops, coconut Fruit
Birds Penelopides manillae Strangling figs None Fruit
Ducula aenea Strangling figs None Fruit
Treron pompadora Strangling figs None Fruit
Phapiteron leucotis Figs, pioneer trees Duhat, Aratilis Fruit
Bolbopsittacus lunulatus Various figs Mangoes, coconut Fruit
Loriculus philippensis Various figs Aratilis, coconut Fruit
Ixos philippinus Figs, palms, etc. Acacia, exotic Fruitshrubs
Pycnonotus urostictus Figs, pioneer trees Exotic shrubs Fruit
Pycnonotus goiavier Pioneer trees Exotic shrubs Fruit
Dicaeun australe Pioneer trees, figs Duhat, Aratilis Fruit
Dicaeum bicolor Various figs None Fruit
Dicaeum hypoleucum Various figs None Fruit
Prionochilus olivaceus Various figs, shrubs None Fruit
Aplonis panayensis Figs, palms Exotic shrubs Fruit
Zosterops meyeni Pioneer tree, Bignay Exotic shrubs Fruit
Zosterops montani Figs, Medinilla None Fruit
Zosterops nigrorum Figs, pioneer trees Exotic shrubs Fruit
12 0. Abdoellah, Parikesit, B. Gunawan, N. Djuangsih, and T Erawan
Analysis of vegetation in the three study villages reveals that floristic composition, horizontalstructure, and floristic diversity are somewhat different. In the middle zone village, floristicdiversity is highest. These floristic differences to some extent result in faunal differences.Changes in land-use types, followed by major changes in structural vegetation patterns andfloristic diversity, affect faunal diversity.
The development of cash-crop cultivation in the uppermost part of the study area has played aprofound role in the decline of wildlife, both in terms of number of individuals and number ofspecies. This can be seen in the lesser diversity of bird species in Sukapura, compared withWangisagara. The low diversity of bird species is related to lesser structural complexity ofvegetation and greater degree of fragmentation. Bamboo-tree gardens, for example, support ahigh diversity of bird species, particularly insectivorous species, compared with the other land-use types. The high diversity of bird species in the bamboo-tree gardens is in accordance withGreenberg (1996), who pointed out that the presence of trees in man-made ecosystemscontributes significantly to the diversity of bird species. Diversity increases with the proportionof the unit covered by trees.
Our study of avifauna also shows a positive relationship between the number of species andindividuals seen and the proportion of trees in the study area. Larger trees, with well-developedunderstorys, support a high diversity of understory species, particularly insectivorous species. Inbamboo-tree gardens, insects that are food for birds, such as Culicidae, Formicidae,Ichneumonidae, and Aphididae, are dominant.
Land-use type and management may significantly affect insect diversity both in terms ofstructural composition and abundance. However, in the short time-period of the study, it wasdifficult to determine whether the influence of abiotic factors on the diversity of insects is moreimportant than human disturbance. The present study indicates that there are differences betweenflying and soil surface insects in man-made ecosystems. Flying insects tend to be more diverse inthe middle village but not more abundant. This study found that the dominant groups of soilsurface insects in the land-use types of the three villages are the same, namely springtails and antgroups. However, different families of insects exhibit different patterns of abundance. Forinstance, ants are more abundant in bamboo-tree gardens than in homegardens, but springtails aremore abundant in homegardens. The abundance of ants in the bamboo-tree gardens indicates thatthey are influenced by the complexity of the vegetative structure.
Conclusion
Our study concludes that in the "natural" ecosystem of Mount Wayang, in accordance with ourhypothesis, biodiversity condition of the middle zone is the most disturbed. While in the man-made ecosystem, inversely with our hypothesis, we conclude that biodiversity does not vary in alinear fashion with distance from society's centers and closeness to its peripheries and thatbiodiversity is highest in the zone of transition.
The present study suggests that the condition of biodiversity maintenance in the Upper CitarumRiver Basin has been significantly affected by several major factors, including biophysicalfactors, government policies, market demand, and the cultural diversity of the inhabitants in thestudy area.

266 William Sm. Gruezo and Juan Carlos T. Gonzalez
Appendix Table 10.3 Summary of vertebrate groups from Mount Makiling and their pollinated plantgroups found in forests and agroecosystems
Vertebrates Species Natural Agroecosystem Plant part used
Fruit bats Pteropus hypomelanus Various figs Coconut Nectar/pollen
Pteropus vampyrus Kapok trees Coconut Nectar/pollen
Macroglossus minimus Wild bananas Cultivated bananas Nectar/pollen
Birds Loriculus philippensis Some figs Coconut Nectar/pollen
Aethopygaflagrans Forest vines/plants None Nectar
Aethopyga shelleyi Figs, wild bananas None Nectar
Nectariniajugularis Pioneer trees Coconut, Acacia Nectar
Biodiversity Condition and Its Maintenance in Upper Citarum River Basin 13
The challenge to conserve the biological resources of the Citarum River Basin is not an easy task.The conditions of biodiversity and its maintenance are the result of a complex interactionbetween natural and (social) cultural factors. The underlying obstacles that need to be solvedinvolve human activities that put too much concern on profit (sometimes with the backing ofgovernment parties), particularly in the agricultural sector, poor understanding regarding theimportance of maintaining biological resources for economic sustainability, lack of humanresources capable of maintaining biodiversity, and institutional handicaps regarding theintegrated management of watershed. Basically, biodiversity conservation can succeed only ifeconomic and ecological functions are in a good balance and benefit local inhabitants as well asexternal actors.
This study suggests that the underlying problem of biodiversity maintenance in the UpperCitarum River Basin is a classical lack of integrated, intersectoral policies and planning. Thedevelopment of cattle projects to alleviate poverty in the upper part of the basin is an example ofthis problem. Although the project initially was beneficial to the local people, since it did nottake into account the carrying capacity of the area, it created problems for the maintenance ofbiodiversity in the forest and in the man-made ecosystem as well. A new approach has to beconsidered by government agencies responsible for development in the region, and an ecosystemapproach is likely to be the most appropriate. Spatial planning that has already been carried outby the Bandung District Regional Planning Board (1991, 1992) must take into account thecurrent condition. With respect to watershed protection, attention should be paid not only to theecological importance of the natural ecosystem but to the man-made ecosystem as well. Thepresent study suggests that bamboo-tree gardens can potentially make a great contribution to theprotection of the Upper Citarum River Basin. Therefore, incentives have to be given to maintainthe basin's bamboo-tree gardens. To this end, an economic instrument (e.g., using the land tax)that can encourage people to maintain their bamboo-tree gardens has to be developed.
Policies concerning tumpangsari programs also must be reviewed so that such programs canprovide economic benefits to the local inhabitants and at the same time can help to save theenvironment. In the long term, market policies must be reoriented toward ecologically soundmarket systems by promoting "green" products.
Further studies that need to be conducted include assessment of possible economic instruments topromote land uses that play an important role in watershed protection, particularly in maintainingbiodiversity. Further study of the impact of human intervention on the forest of Mount Wayangwould also be important, particularly regarding the impact of human disturbance on forest gapdynamics. Studies on the political ecology of watershed systems such as that of the CitarumRiver Basin also are needed.
Notes
1. The remnant forest found on Mount Wayang located nearby Tanana Jaya village is the only "natural"ecosystem that still exists in the study area. Various native trees species such as Podocarpus imbricatus,Podocarpus nerizfolius, and Castanopsis argentea still persist despite relatively intense land encroachmentby local people. This remnant forest is an important source of fuelwood and grass for livestock.2. "Zone of transition" is defined as an area influenced in the same way both from center and periphery.3. Barbault and Sastrapradja (1995) pointed out that ecosystems are very complex systems in which manyorganisms and species directly as well as indirectly interact.4. The basin's remaining forest has recently become very fragmented, and in most areas this "natural"ecosystem is under heavy pressure from human intervention. The remnant forest at Mount Wayang, for
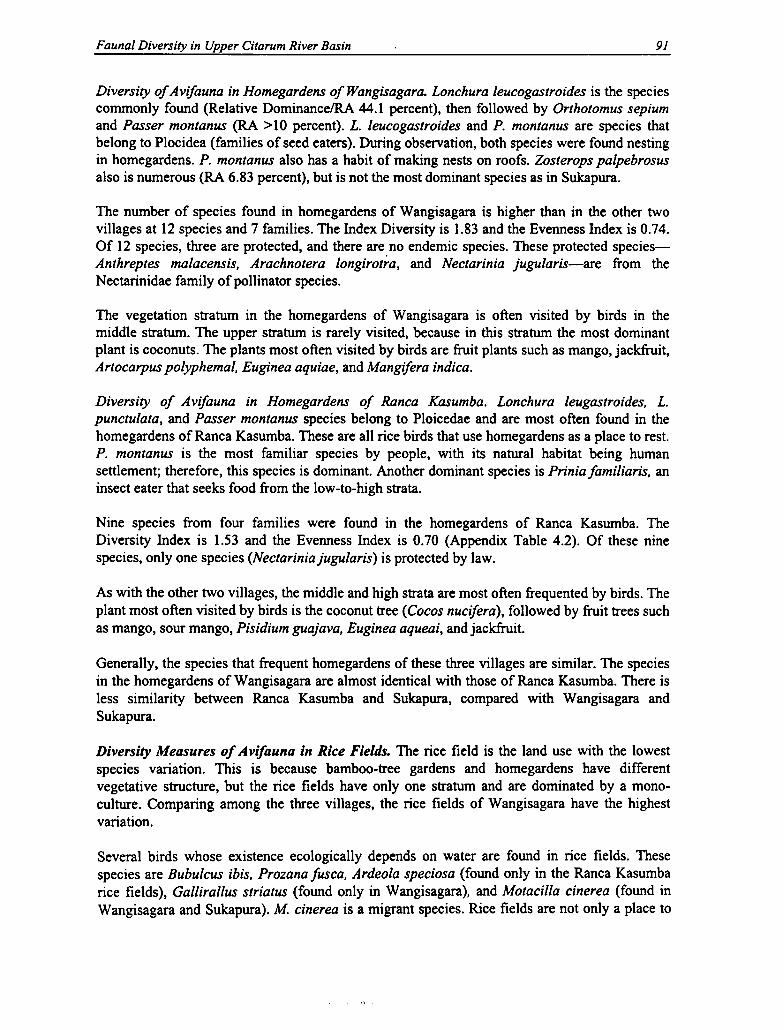
Chapter 11
Biodiversity Maintenance at the Farm Level:Socioeconomic Determinantsand Community Perception
Herminia A. Francisco
Introduction
Socioeconomic Determinants of Crop Biodiversity at the Farm Level
Biodiversity maintenance has now become a major concern in almost all nations. This globalconcern stems from the threats to mankind that loss of biodiversity entails. In particular, the costassociated with the loss of important or potentially important medicinal plants and animalspecies is an important justification for biodiversity maintenance. Since no one can say withcertitude what the potential value of species currently perceived as less important might be,efforts to maintain high biodiversity in all types of natural and man-made ecosystems areimportant. This rationale lends support to the need to understand better the context in whichcurrent biodiversity maintenance is taking place.
A farmer's decision about what particular crop mix to plant on his farm is determined by thesocial, economic, political, and biophysical environment. The social factors include personalattributes and household attributes such as education, household size, the skills and training ofthe farmer, and farming experience. Economic considerations include labor availability, prices ofboth inputs and outputs, presence of marketing facilities, and access to credit. Climatic factors,geographic accessibility, and soil suitability are among the biophysical considerations. Theextent to which farm level biodiversity is influenced by all of these factors merits closerattention. The main concern is to identify the factors that are critical in biodiversity maintenance.
This analysis is based on the use of data gathered in previous surveys in the Makiling ForestReserve. Supplemental data were obtained from key informants, with some of the data furtherchecked with specific households in the area. A survey of key informants was carried out onpeople's opinions on biodiversity issues. The informants in this survey also were asked tovalidate project scientists' identification of indicator species.
Background
The Community and Its Farming System
Most recent estimates of land use in the Makiling Forest Reserve place the area under forest andbrushland at 55 percent. The cultivated area and a small amount of land under special land usesaccount for the remaining 45 percent (Abraham, Sargento, and Torres 1992).
267

14 O. Abdoellah, Parikesit, B. Gunawan, N. Djuangsih, and T. Era wan
example, despite its status as a protected forest, is being used by local inhabitants for various purposesincluding fuelwood and livestock forage. Consequently, its condition is degrading.5. "Homegarden" is a land surrounding a house usually planted with various species of annual as well asperennial plants for different purposes. In comparison to other types of land use, homegardens areconsidered to be the most varied in terms of structure and function. In the study area, homegardens-depending on the owner—have several functions such as social, economic, and aesthetic. Some ownersgrow crops in the homegarden for economic purposes, while others grow ornamental plants for aestheticpurposes.6. "Rice field" is a wetland area with a distinct landscape characteristic that can only be found within an
altitude below 1,000 m asl. Rice fields are still the most important land use for some people to producecommercial or subsistence crops.7. "Bamboo-tree garden" is a piece of land where several species of bamboos and trees such as Eucalyptussp., Toona sureni, Albiziafalcataria, Arenga pinnata, and Artocarpus heterophyllus grow (mostly planted).The presence of this type of land use is quite distinct in the study villages since it is very patchy, and tallplants dominate this land-use type. The owner of a bamboo-tree garden derives some socioeconomic values(e.g., as source of fuelwood, timber, fruits, and as a saving in case of an emergency). Most bamboo-treegarden owners inherit this land from their ancestors.8. The dynamics of land-use change differ to some extent among the study villages. In Sukapura and theadjacent villages, for example, the change of land use from one type to another has been intense, due to theconversion of less productive bamboo-tree gardens to cash-crop gardens (although in some places theformer type still persists, albeit scattered and limited in acreage). In Wangisagara, the land-use pattern isrelatively more stable. But in Ranca Kasumba, bamboo-tree gardens as well as rice fields have beendecreasing due to industrial expansion, homegarden development, and establishment of brick factories.9. Bierregaard et al. (1992) state that although the biological and physical consequences of forestfragmentation are still poorly understood, one predictable impact is a reduction of population size.Furthermore, Bierregaard et al. point out that a mosaic of small forest remnants would also likely losespecies as a result of edge effects.
References Cited
Anton, Danilo. J. 1995. Diversity, globalization, and the ways of nature. Ottawa: International Develop-ment Research Center.
Bandung District Regional Planning Board. 1991. Rencana Tata Ruang Kabupaten Bandung Tahun 2011(General spatial planning District of Bandung 2011). Bandung, Indonesia: Bandung District Regional Plan-ning Board.
1992. Rencana Tata Ruang Kabupaten bandung Tahun 2019 (General spatial planning District ofBandung 2019). Bandung, Indonesia: Bandung District Regional Planning Board.
Barbault, R., and S. Sastrapradja. 1995. Generation, maintenance, and loss of biodiversity. In Global biodi-versity assessment, ed. V. H. Heywood. Cambridge: Cambridge Univ. Press.
Bierregaard, Richard 0., Jr., Thomas E. Lovejoy, Valerie Kapos, Angelo Augusto dos Santos, and RogerW. Hutchings. 1992. The biological dynamics of tropical rainforest fragments. Bioscience 42(11): 859-66.
Daniels, R. J. R., N. V. Joshi, and M. Gadgil. 1990. Changes in the bird fauna of Uttara Kannada, India, inrelation to changes in land use over the past century. Biological Conservation 52:37-48.
Greenberg, Russell. 1996. Managed forest patches and the diversity of birds in Southern Mexico. In Forestpatches in tropical landscapes, ed. John Schelhas and Russell Greenberg. Washington, D.C: Island Press.
Hanksworth, D. L., and J. M. Richie. 1993. Biodiversity and biosystematic priorities: Microorganisms andinvertebrates. CAB International, Wallingford.
Hardjono, Joan. 1990. Developments in the Majalaya textile industry. Project Working Papers Series No.B-3. Institute of Social Studies, Bandung Research Project Office.
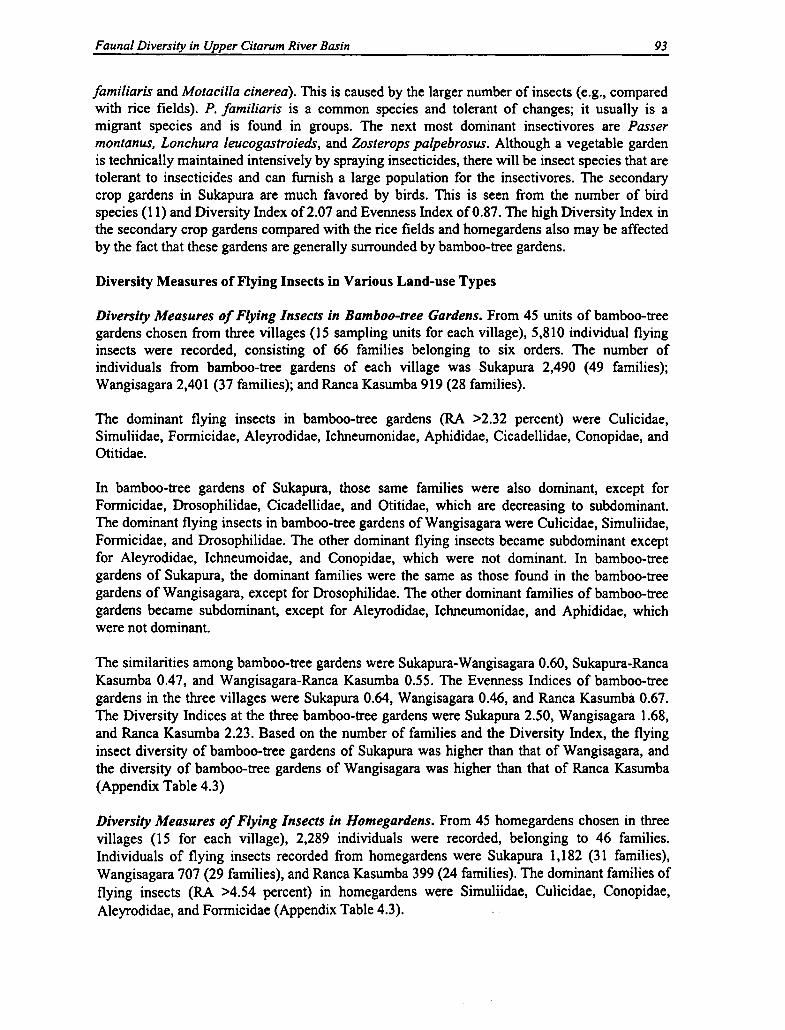
268 Herminia A. Francisco
Conversion of forest to agricultural land in this area began nearly a century ago. Early migrantsinto the forest reserve date as far back as 1898. What started with a few families has since growninto clans. Relatives, friends, and spouses' relatives have found a haven in this very accessibleforest area. Most of the resident households were established in the 1980s. There are six zones inthe reserve (based on hydrology or water drainage patterns), and there are six clans noted todominate the various forest zones.
The current generation of residents is mostly in the middle-age group or is at the child-bearingstage (Francisco, Mallion, and Sumalde 1992). Also, many household members are at themarrying age. As part of Filipino tradition, a newly married couple must form a separatehousehold. Some of the spouses in these marriages are from outside the forest reserve. It is notuncommon for the in-marrying spouse to bring additional family members since marriagelegitimizes his/her rights to be part of the legitimate Makiling forest communities. Thispopulation growth has resulted in parcelization of the existing cultivated areas into smallerlandholdings (as noted in earlier surveys). Furthermore, new farm lands were opened throughforest encroachment.
The primary mode of land acquisition in the Makiling Forest Reserve is largely throughinheritance. Among resident farmers, about 30 percent claim to have cleared the forest to gaincontrol over the area (Dizon 1992). The 1992 census also shows that only twenty-one claimantsmay be considered "big" farmers (i.e., having a total land area of 4-20 hectares. The biglandowners are mostly located in Zone 5 (Bagong Silang area). The average farm size for allfarm claimants was estimated to be 2 hectares.
Previous surveys in the Makiling Forest Reserve showed that farming does not constitute themain source of household income. Agroecosystem analysis done by Cruz, Francisco, and Torres(1991) revealed that farming accounts for only 40 percent of the average Makiling forestresident's household income. The share of farm income to household income nevertheless isexpected to rise in the coming years, however, as the valuable tree component of the agroforestryfarms begins to bear fruit.
Agroforestry is the dominant land-use system in the Makiling Forest Reserve (Sumalde,Francisco, and Fermintoza 1992; Carandang and Lawas 1992). Such a system consists of acombination of annuals, such as root crops and vegetables, and fruit trees, such as lanzones,citrus, and rambutan, coconut, and coffee. A few fruit plantations in the area are mostly ownedby nonresidents and managed by tenants.
Evolution of Farming Systems in the Makiling Forest Reserve
The evolution of land-use patterns in the Makiling Forest Reserve has been studied in previousresearch (Francisco, Mallion, and Sumalde 1992). The initial crops grown consisted mainly ofshort-term crops such as rice and corn. Continuous cropping of annual crops on a given piece ofland proved unsustainable, however. After, at most, five successive croppings, the area had to beabandoned and new areas burned and planted. Some of the abandoned areas reverted tosecondary forest or into grasslands.
The practice of shifting cultivation continued but gradually diminished in the 1970s as forestavailable for clearing became increasingly scarce. The university also took an increasinglycombative position during this period. Some of the settlers were even relocated out of the
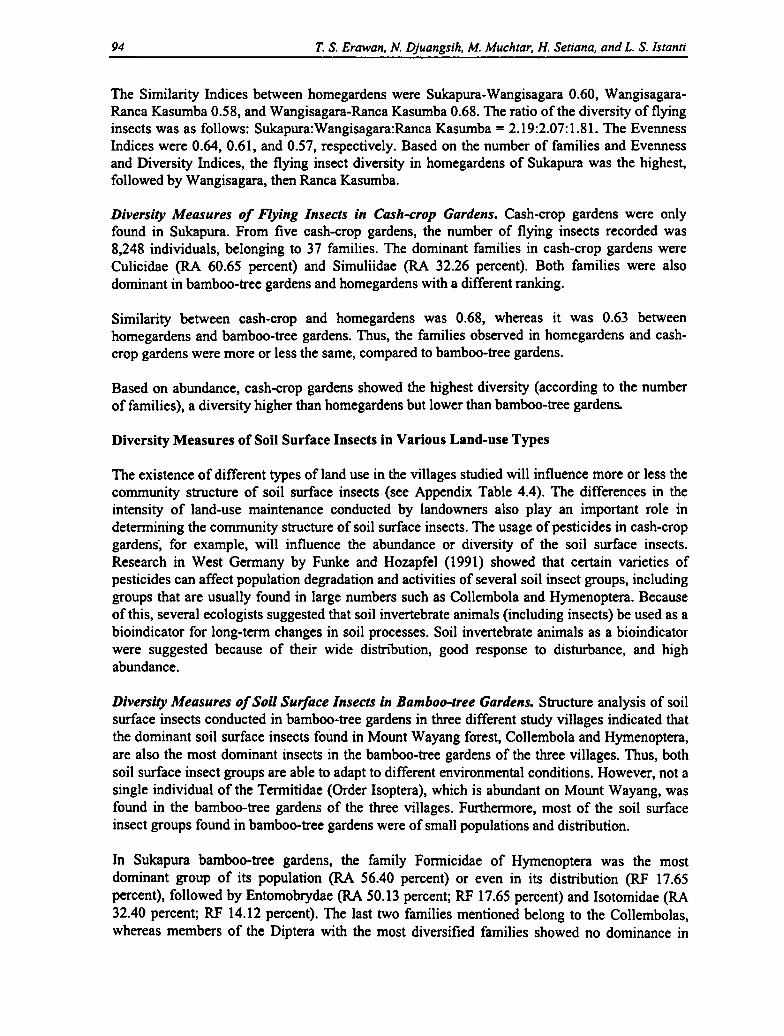
Biodiversity Condition and Its Maintenance in Upper Citarum River Basin 15
Heywood, V. H., and I. Baste. 1995. Introduction. In Global biodiversity assessment, ed. V. H. Heywood.Cambridge: Cambridge Univ. Press.
IOE (Institute of Ecology). 1981. EIA of the Saguling dam: Studies for implementation of mitigation ofimpact. Bandung, Indonesia: Padjadjaran Univ.
Johns, A. D. 1981. The effects of tropical forest timber exploitation on animal communities: Summary ofresearch. Cambridge Univ.
Kremen, C., R. K. Colwell, T. L. Erwin, D. D. Murphy, R. F. Noss, and M. A. Sanjayan. 1993. Terrestrialarthropod assemblages: Their use in conservation planning. Conservation Biology 7:796-808.
Mannion, Antoinette M. 1992. Sustainable development and biotechnology. Environmental Conservation19(4): 297-306.
Mooney, H. A., J. Lubchenco, R. Dirzo, and O. E. Sala. 1995. Biodiversity and ecosystem functioning:Basic principles. In Global biodiversity assessment, ed. V. H. Heywood. Cambridge: Cambridge Univ.Press.
Noss, R. F. 1990. Indicators for monitoring biodiversity: A hierarchical approach. Conservation Biology4:355-64.
Soemarwoto, 0., and I. Soemarwoto. 1984. The Javanese rural ecosystem. In An introduction to humanecology research on agricultural systems in Southeast Asia, ed. A. T. Rambo and P. E. Sajise. Philippines:Univ. of the Philippines at Los Banos.
Soule, E., and K. A. Kohm, eds. 1989. Research priorities for conservation biology. Washington, D.C.:Island Press.
Sponsel, Leslie E., Thomas N. Headland, and Robert C. Bailey. 1996. Tropical deforestation: The humandimension. New York: Columbia Univ. Press.
Stork, N. E., and M. J. Samways. 1995. Inventorying and monitoring. In Global biodiversity assessment,ed. V. H. Heywood. Cambridge: Cambridge Univ. Press.
Sugandhy, A. 1995. Country paper on the implementation of biodiversity management in Indonesia. Paperread at the second meeting of the Conference of the Parties to the Convention on Biological Diversity, 6-17 November, Jakarta.
World Bank. 1989. Indonesia, forest, land, and water: Issues in sustainable development. Report No.7822-IND, 5 June.
. 1994. Indonesia environment and development: Challenges for the future. Report No. 12083-IND.

Biodiversity Maintenance at the Farm Level 269
reserve, but this was not effective and many of the relocated families eventually returned. Theforest claimants then began cultivating more perennial crops such as fruit trees and forest trees.Coffee, citrus, and mango were popular in the early years. The practice of intercropping annualswith perennials gave rise to the agroforestry system that currently prevails in the area.
People's Attitudes Toward Land Tenure and Biodiversity Maintenance
Currently ten active People's Organizations (POs) in the Makiling Forest Reserve are recognizedby the University of the Philippines at Los Banos. These organizations are made up of claimantsin the reserve. Many of the POs were formed in 1992-93, when the university announced that thepeople could become partners in protecting the forest reserve. Local communities had longexpressed a desire for recognition by the university, whom they in turn recognize to havejurisdiction over the reserve.
The university was instrumental in the formation of a number of these POs in the forest reserve.Other POs were formed with the assistance of non-governmental organizations (NGOs) thatworked in the area. The motivation to become members of a PO is quite strong among the localpeople as this may help them acquire recognition for their claims to the land.
The people's claims over what they have planted are being used as the main argument for theirright to stay in the forest reserve. In fact, the establishment of perennial crops is seen by many(i.e., residents and policy makers, as well) as a means of staking a claim in the area. This meansthat financial reasons or conservation considerations may only be secondary factors in thedecision to plant perennial crops in the agroforestry system. Security of tenure seems to be theoverriding consideration.
The various POs' shared goal of protecting the Makiling Forest Reserve is manifested in theiractivities involving the residents of the forest reserve in tree planting along borders of the forestzone and in some critical (highly erodible) areas, in the construction of placards or signs warningpeople against tree cutting, opening of new crop lands, and destruction of the forest, andattendance at joint meetings between the organization and the university. A number of the POshave also conducted training workshops in soil conservation measures and agroforestry. Thesetraining workshops have created greater awareness among the people regarding the need toprotect the Makiling Forest Reserve.
A survey of key informants was undertaken to assess the people's perception of biodiversityissues. The respondents were asked whether they agree that preservation of as many diversespecies as possible in the forest and in their farms is important, and if so, why? A number ofthem correctly pointed out that current uncertainty in the use-value of many forest species is animportant reason for biodiversity maintenance. The need to protect the forest because of itsdiverse economic needs also was pointed out by several respondents. There were also those whoexpressed the need to protect wildlife because they can serve as an alternative source of income.A few also pointed to the medicinal value of many of the plant species in the forest reserve,which is largely unknown to outsiders. No one disagreed, therefore, that biodiversity mainte-nance is an important end in itself. The respondents expressed a commitment toward this goal,particularly in the remaining forest zone of the reserve.


270 Herminia A. Francisco
Scientist Perception of Biodiversity
Biodiversity Measures
This study seeks to establish, in part, whether there is a significant difference between themeasurement of biodiversity using data obtained through personal interviews and field-levelmeasurement of biodiversity using the Shannon-Weiner general index. The biodiversitymeasures in the first approach is based on the diversity of crops grown on the farm as attested toby personal interviews. The farm survey data used in estimating crop diversity-index ofqualitative variation (CD-IQV) were extracted from the household survey conducted by Torres(1992). An IQV is used to measure the biodiversity level using data on a number of species andpopulation size of each species. The distribution of IQV values obtained is given in Table 11.1.A high CD-IQV of 75-100 percent is found on 48 percent of the farms, whereas only 12.5percent of the farms have a low biodiversity index of 0-24 percent. Appendix 11.1 illustrateshow crop diversity is measured using the IQV.
Table 11.1 Distribution of farms tocrop diversity index using IQV
CD-IQV' Percentage
0-24 12.50
25-49 17.91
50-74 21.40
75-100 48.20
Source: Torres (1992).a. Crop diversity-index of qualitativevariation.
Gruezo (1995) used the Shannon-Weiner general index to analyze crop diversity on the samefarms. However, he also included information on other plant species found in the sample plots,namely weeds and forest species. Table 11.2 shows data from the fifteen farms sampled byGruezo (1995). The number of species found in the sample plots, ranging from 18 to 96, supportsthat diversity at the farm level is indeed high relative to diversity in the natural forests. Of theaverage number of species found on the farms (61), a surprisingly large proportion (52 percent)are forest species. The average farm holding of about 2 hectares contains 52 forest species.
Biodiversity Maintenance and Selected Socioeconomic Attributes:Simple Relationship
Using the data from Torres (1992), key socioeconomic variables were categorized into threeclasses (Table 11.3). The variables considered include farmer's age, farm size, number of yearsfarming, household income, education, and household size. Table 11.3 shows the variousgroupings used in categorizing respondents. Subsequently, the CD-IQV for each category andsocioeconomic variable was estimated.
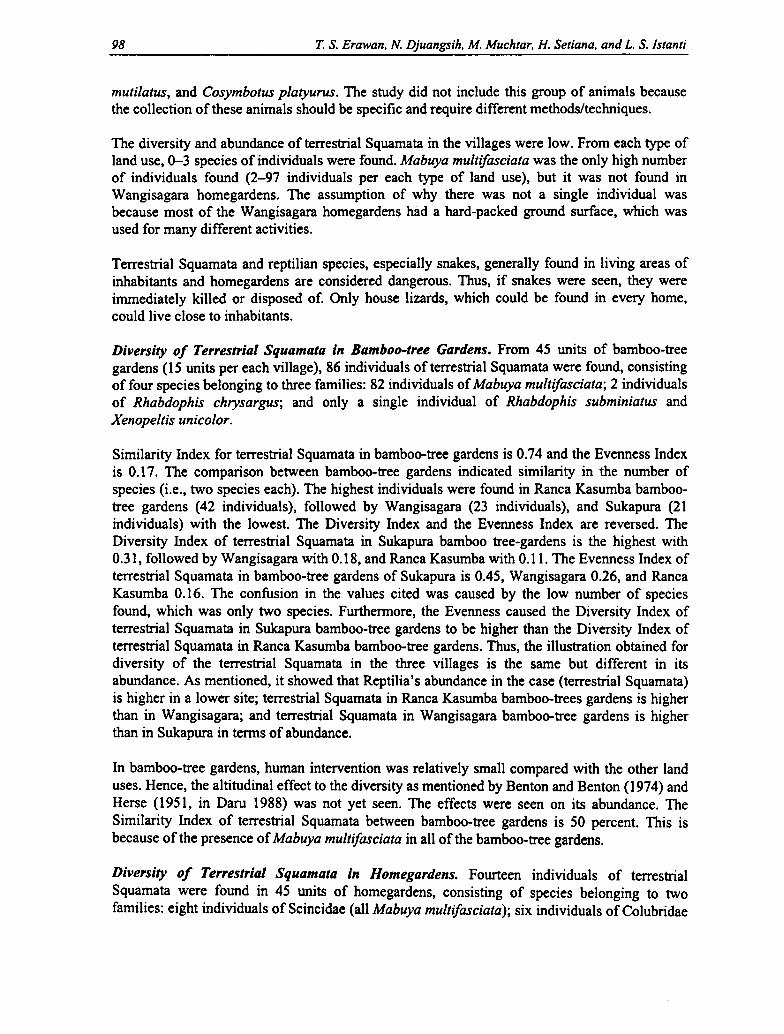
Chapter 2
Spatial Structure and Floristic Diversityof Man-made Ecosystems
in Upper Citarum River Basin
Parikesit, Djuniwarti, and H. Y. Yadikusumah
Introduction
Background
The rural ecosystem usually consists of several components (subsystems) that interact with oneanother, forming an entity. Factors such as altitude, soil properties, socioeconomics, and cultureplay a crucial role in affecting the composition, structure, diversity, and functions of flora thatcan be found in each component of agroecosystems (Karyono 1981, 1990; Soemarwoto andSoemarwoto 1981, 1984). Sometimes similar components (subsystems) may exhibit differentcomposition, structure, and function. Differences in composition and structural vegetationpatterns at local as well as regional scale have a profound impact on rural ecosystems in terms ofits uniqueness and higher biotic diversity.
Bamboo-tree gardens, locally known as kebon tatangkalan (Soemarwoto and Soemarwoto 1984used the term talun for this type of land use),' homegardens, rice fields, and cash-crop gardensare components of a rural ecosystem that have been known for centuries by villagers in Java,particularly in West Java. The diversity of components within a given rural ecosystem not onlyreflects floristic diversity of that ecosystem but also the functional diversity. Not less importantis cultural diversity that develops along with the development of a rural ecosystem. Inevolutionary terms, a rural ecosystem in Java was initially developed a long time ago whenpeople began to clear natural forest for agricultural land and settlement. Along with populationgrowth and the need to fulfill basic needs such as foods, new types of land use such as rice fields,bamboo-tree gardens, and cash-crop gardens emerged as currently seen in many rural areas. Tofulfill daily needs, rural people select and introduce various plant species from the forest. Thesenewly domesticated species are then grown in agricultural lands such as homegardens and talun(Soemarwoto and Soemarwoto 1984). Historically, farmers have tended continually to acquirenew varieties by exchange, through new encounters while traveling, through natural hybridiza-tion, and from the markets (McNeely et al. 1995).
Traditional resource management practices often support the maintenance of genetic, species,and ecosystem diversities. A brief description of an evolving rural ecosystem as mentionedearlier illustrates the significant contribution of this artificial ecosystem in maintaining theconditions of biodiversity. Among rural ecosystem components that significantly contribute tothe maintenance of biodiversity conditions at three hierarchical levels of biodiversity (i.e.,genetic, species, and ecosystem) are the bamboo-tree garden and homegarden. These two typesof land use are commonly found in a watershed system, besides rice fields and uplandagriculture. The composition, structure, and floristic diversity of bamboo-tree gardens andhomegardens may differ from site to site. One of the major factors, other than bioclimatic, that
17

Biodiversity Maintenance at the Farm Level 271
Table 11.2 Number of plant species in fifteen agroforestry plots in the Makiling ForestReserve
No. of No. of No. ofNo. of H-value crop weed forest
Locality and sample plot species and rank species'. species' species`Bagong Silang, LBNo. 1 48 3.062(10) 14 21 13No. 2 31 2.64602) 9 13 9No.3 65 3.169(9) 13 22 30No.4 37 2.407(14) 15 12 10No. 5 54 2.235('s) 9 7 38No.6 79 3.237w'w 3 12 64No. 7 18 2.411(") 4 12 2No.8 29 2.883(") 8 11 10Sta. Cruz, BayNo. 9 63 3.338(5) 10 25 28Pansol, CalambaNo. 10 96 3•590(2) 19 16 61No. 11 90 3.455(4) 7 7 76No. 12 76 3.254(6) 12 17 47Timugan, LBNo. 13 83 3.869w'w 14 37 32No. 14 84 3.562(') 25 23 36No. 15 59 3.200(8) 17 18 24
Average (all plots) 61 — 12 17 32Percentage 100 — 20 28 52Source: Gruezo (1995).a. A crop species is a cultivated species, usually for economic purposes (i.e., food, fiber,medicine).b. A weed species is not cultivated but naturally growing in the wild (i.e., anything out ofplace, not cultivated, not wanted, and usually competing with cultivated species).c. A forest species is a naturally regenerated plant species, usually (but not always)perennial.
Table 11.3 Categories used in classifying household respondents for selectedsocioeconomic variablesVariable Low/small Medium High/largeAge (yr) < 30 30-50 > 50Farm size (ha) < 1.0 1-2 > 2Farming (yr) <5 5-10 > 10Household income (PH? x 1,000) < 10 10-40 > 40Education (yr) <6 6-9 > 10Household size (no.) <3 3-5 >a. Philippine peso.

18 Parikesit, Djuniwarti, and H. Y. Yadikusumah
causes this difference is the intensity of management on the land undertaken by the owner. Tosome extent, components of an artificial ecosystem such as a bamboo-tree garden and home-garden exhibit a feature of forest ecosystem in terms of both species richness and structuralvegetation pattern. As an example, the vertical arrangement of traditional gardens in Cibitungvillage near Bogor, West Java, where approximately 250 species of plants were found, shares acommon feature of natural forest (Michon and Mary 1994). The plant diversity might even behigher as many species found in this artificial vegetation are usually represented by severalvarieties and cultivars. Other studies carried out in homegardens in rural areas in CitarumWatershed by Karyono (1981) and Christanty (1990) also indicated a high degree of biodiversityand complexity of structural vegetation pattern.
Studies of biodiversity have mostly been undertaken in so-called natural ecosystems such as theforest. To date, despite the great potential of anthropogenic ecosystem in biodiversity mainte-nance, studies of biodiversity conservation with regard to the ecological and social functions ofartificial ecosystem, such as the rural agroecosystem, are scanty. Many natural ecosystems aredeclining whereas anthropogenic ecosystems are expanding, as evidenced in many watershedregions in Indonesia, but particularly in West Java. Thus, it seems relevant to focus a compre-hensive study on the maintenance of biodiversity conditions in artificial ecosystems within thewatershed system. This kind of study is crucial. With the advent of agricultural development inparticular and regional development in general, the persistence of traditional anthropogenic eco-systems in the future, like the persistence of many natural forests in West Java, is questionable.For example, many regions in West Java are converting less productive (but supporting a highdegree of floristic diversity) land uses such as bamboo-tree gardens into more productive landuses such as cash-crop gardens (usually with less plant diversity). McNeely et al. (1995) statedthat the highly diverse early farming systems generated very little surplus of production aboveand beyond the needs of the cultivators themselves; therefore, they could only sustain semi-autonomous, small-scale societies.
The present study undertaken in Citarum River Basin tries to assess the conditions of biodi-versity maintenance during rapid development in agriculture and other major sectors. This riverbasin, with its mosaic of agroecosystem components, exhibits a high degree of diversity not onlyin terms of floristic aspect but also in terms of functional and "cultural" diversities. In this studythe emphasis is on the conditions of biodiversity and its maintenance in bamboo-tree gardens andhomegardens. For other land-use types (i.e., rice field and cash-crop garden), assessment of theconditions of biodiversity is carried out in a more qualitative approach. The emphasis is onunderstanding how the dynamics of land use are associated with the conditions of biodiversityand its maintenance in the study villages. In addition, how local conditions, other than abioticfactors, associate with biodiversity maintenance is also described.
Objectives
The objectives of this study are as follows:
• To describe the composition, structure, and function of artificial vegetation in different typesof land use,
• To assess the extent to which diversity of the artificial vegetation correlates with socio-economic factors (i.e., landownership), and
• To understand the overall conditions of biodiversity in the rural ecosystem.

272 Herminia A. Francisco
The succeeding discussion presents a simple test of the relationship between biodiversity asmeasured by IQV and selected socioeconomic variables.
Household Income and CD-IQV. The low-income group, which accounts for 35 percent of thesample households, has a CD-IQV of 71 percent. The high-income group has a lower level ofbiodiversity with a CD-IQV of just 52 percent. The relationship between household income andbiodiversity maintenance is thus inverse. If we associated the higher income with a more market-oriented system of agriculture and the lower income with a more subsistence-oriented system,the difference in crop diversity is the same as usually seen in market-oriented versus subsistence-oriented agriculture (Table 11.4).
Table 11.4 IQV and proportion of householdsLow Medium High
Age (yr) 18%; 73.60 45%; 60.36 37%; 58.28Farm size (ha) 38%; 58.57 32%; 56.11 30%; 62.12Farming (yr) 23%; 54.50 18%; 67.20 59%; 63.30Education (yr) 60%; 62.15 29%; 66.50 11%; 48.67Income (PHP)' 35%; 70.83 49%; 60.72 16%; 51.75a. Philippine peso.
Farm Size and CD IQV The relationship between farm size and biodiversity maintenance is notcompletely clear. Nevertheless, a higher biodiversity index (CD-IQV) seems to be associatedwith a larger farm size. The highest biodiversity index of 62 percent was noted among the largefarms wherein 30 percent of the respondents fall. However, the difference in the biodiversitylevel between small and medium farms is minute and insignificant (Table 11.4).
Number of Years Farming and CD-IQV. There apparently is no discernible relationshipbetween years of farming and biodiversity level. The highest biodiversity level of 67 percent wasobserved among 18 percent of the households who have spent the average amount of time infarming; and low biodiversity was noted among farmers with both fewer and more years offarming experience (Table 11.4).
Education of Household Head and CD-IQV. Low biodiversity is observed on the farms offarmers with higher education. This relationship implies that the more educated the decisionmaker is, the greater is his tendency to specialize in fewer but more lucrative commercial crops.His higher education also allows him to take on more risks with fewer crops, since he has (withhis education) more potential nonfarm alternative sources of income (Table 11.4).
Age of Household Head and CD-IQV. Most (45 percent) of the household respondents are inthe middle-age group with an average biodiversity index of 60 percent. The highest biodiversityindex of 74 percent was noted among the younger households who represent 18 percent of therespondents. A relatively lower biodiversity index of 58 percent was observed among the olderfarmers who account for 37 percent of those interviewed. The relationship between age ofhousehold head and biodiversity index is thus negative. This means that younger farmers tend tohave more diverse farms than the older farmers. Young farmers do not necessarily cultivateyoung or new farms. Many young (new) households acquire their farms through inheritance

Structure and Floristic Diversi ty ofMan-made Ecosystems in Upper Citarum River Basin 19
Methodology
The unit sampling used in this study was landownership. Fifteen samples for each land-use typefound in every studied village were selected so that the total sample was 150. These sampleswere randomly selected based on land area ownership category in every village. Prior torandomization, names of household heads in each study village were censused. Landownership(including type of land use) for each household was also recorded. Following this, all householdsin each study village were categorized into six classes based on their landownership (i.e., landacreage). A number of samples were selected randomly from each category. The number ofsamples of each class was according to the proportion of population of each category over thewhole population within the study village. Data, including name of species, number, and heightof individuals of each species, were collected from each selected sample. Plant species werecategorized as follows: domesticated' and wild species; growth form or habits (herbs, shrubs,trees); and main functions (ornamentals, spices, industry, food, medicinal, fruits, weeds, fences,and materials).' With respect to functional aspect of a plant, a given species is classified onlyinto one particular function based on its main function given by the local inhabitants. Forexample, guava (Psidium guajava) is classified as a fruit tree even though its branches can alsobe used as fuelwood.
To describe the dominance of a given species (species importance), Importance Values Indexwas calculated for each species. This index was determined based on density and frequencyparameters. Diversity measures were also calculated using Brillouin's Diversity Index (Magurran1988), Evenness, and Sorensen's Similarity Indices. Spearman's correlation was used to deter-mine the possible correlation between diversity (and also density) and land area. Landownerswere interviewed to collect data concerning socioeconomic and cultural aspects relevant to bio-diversity maintenance.
Composition and Spatial Distributionof Anthropogenic Vegetation in Three Study Villages
Horizontal Structure of Vegetation in Bamboo-tree Gardens and Homegardens
The vegetation growing in bamboo-tree gardens and homegardens includes domesticated andwild plant species in various habits ranging from understory vegetation (shrubs and herbs) tooverstory vegetation (trees). This diversity of species is the result of a complex interactionamong bioclimatic, soil, and socioeconomic factors and local culture of the people. Each species,either domesticated or wild, has a different benefit and usage for local people. However, none ofthe species found in those two types of land use in the study villages is classified as endemic.
Bamboo-tree Garden. The most dominant species found in bamboo-tree gardens in Sukapuravillage is Eupatorium riparium, followed by Drymaria cordata and Collocasia macrophylla.These three dominant species are wild plant species that grow in the lower layer of bamboo-treegarden vegetation. E. riparium can be found growing in almost all bamboo-tree gardens inSukapura. (This species is also the most dominant species found on forest floors of the remnantforest in Mount Wayang.) The fact that various wild species of plants dominate the vegetation inbamboo-tree gardens suggests that the owners are not intensively managing them.

Biodiversity Maintenance at the Farm Level 273
(Torres 1992), farms that may already have diverse crops planted in them. Parcelization of farmholding goes with marriage in the family. Newly married members of the family are usuallygiven a relatively small landholding. With a smaller farm size, more intensive cultivationthrough diversified cropping systems is likely, thus leading to higher crop biodiversity in younghouseholds (Table 11.4).
Determinants of Biodiversity Maintenance: Regression Analysis
The succeeding discussion will analyze the determinants of biodiversity when all of the differentsocioeconomic factors are considered at the same time. Three measures of biodiversity at thefarm level were used: the CD-IQV, the Shannon-Weiner Index based on number of crop species(CDI, crop diversity index), and the simple number of plant species (PD, plant diversity). Eachof the three measures was used as the dependent variable in the regression analysis. Theindependent variables were selected socioeconomic attributes of the farming households. Theindependent variables are age, sex, years of farming, and education of the household head,household income, household size, and farm size. Several different regression models were tried:linear, log-linear, linear-log, and double-log. (The log-linear form and the linear-log form referto a functional relationship wherein the dependent and the independent variables, respectively,are transformed into logarithmic function.) Of these models, the log-linear model has the best fitand has the highest value of r-square. Further, it has the highest number of significantindependent variables. Table 11.5 shows the results of the regression analysis of the log-linearform.
Table 11.5 Factors affecting crop and plant biodiversity at the farm level in theMakiling Forest ReserveVariable CD-IQV' CDI° PD` x (No. of plots)
Constant 3.8970 1.0570 4.1740Age 0.0100d -0.0023 -0.0071Sex 0.2813 -0.1550 0.1680Education -0.1110` 0.0047 -0.0019Household income -4.33E-07 -7.19E-06` -2.27E-05fHousehold size 0.06848 0.0401d 0.1150eFarm size 0.0341` 0.00959 0.0208Farming (yrs) -0.0076 0.0023 -0.0021
F-value 3.47d 2.746 9.05'R-square 82.95 79.32 92.69Adj. R-square 59.07 50.36 82.45
a. Index of quantitative variation using survey data (Torres 1992).b. Crop diversity index based on field data (Gruezo 1995).c. Plant diversity based on number of plant species in the farm as identified byGruezo (1995).d. Significant at 10% confidence level.e. Significant at 5% confidence level.f. Significant at 1% confidence level.g. Significant at 15-20% confidence level.

20 Parikesit, Djuniwarti, and H. Y. Yadikusumah
The two most dominant species found in the middle and upper layers of bamboo-tree gardens inSukapura were Calliandra calothyrsus and Timour gum (Eucalyptus alba). These introducedspecies, which are fast-growing trees, are grown by Sukapura people (particularly those who ownland) to fulfill their need for fuelwood. The village, located approximately 1,250 m above sealevel, has a cold climate in which fuelwood is the main source of energy. For most Sukapurapeople, fuelwood is not only used for cooking but also for other uses, including to heat the houseand dry seeds. Some villagers pointed out that the heat coming from the fuelwood can preservetheir house, which is mostly made of wood. According to local inhabitants, in Sukapura andother adjacent villages located in the same altitude, wood rots faster than in villages downstreambecause of higher humidity in the former villages. Therefore, according to them, fuelwoodburning helps to preserve their wooden houses.
The most dominant domesticated species in this land-use type in Sukapura are trees commonlyused for fuelwood, that is, Timour gum (Eucalyptus alba) and Calliandra calothyrsus. Bamboo(Gigantochloa atter) and Albizia montana—also used for construction materials and fuelwood-are two other predominant species found in bamboo-tree gardens in this village. Although somefruit tree species such as avocado (Persea americana), mango (Mangffera indica ), papaya(Carica papaya), and jackfruit (Artocarpus heterophyllus) are found in this type of land use,their presence is not dominant. The owners of bamboo-tree gardens in Sukapura are moreinterested in growing species that can be used for fuelwood or construction materials. However,fruit trees are planted for family consumption or to be given to relatives and neighbors.Considering the multiple uses of fuelwood as mentioned, this kind of traditional energy is notreplaceable by other kinds of energy such as kerosene or natural gas. The degree of impact offuelwood collection on biodiversity depends on the intensity of fuelwood harvesting. Up to acertain degree, collection of dead wood for fuelwood may be of little consequence forbiodiversity. At high harvest rates, however, removal of dead wood implies a reduction of foodand substratum for large groups of species (Siitonen 1994, cited by McNeely et al. 1995).
Eupatorium riparium is the most dominant species of wild plant category commonly foundwithin the lower layer of bamboo-tree gardens in Sukapura, followed by Drymaria cordata. Thedominance of E. riparium is typical in highly disturbed areas such as in agroecosystems. Bakerand Bakhuizen (1965) used the term "anthropo-sere" for various forms of degradation in tropicalecosystems, and in this disturbed vegetation Eupatorium spp. are among the predominantspecies. In bamboo-tree gardens in Sukapura, the wild species that occupy the lower layergenerally grow in places where the top canopy is open, allowing the sun's rays to reach thegarden floor. Alsophila glauca (a tree fern species that usually grows in the forest) is among thewild species of plants found in the middle layer. Ficus hampelas, F. brevicuspis, and Neonuclealanceolata are also forest species and are found in the upper layer. Fruits of the first two speciesof figs are usually eaten by birds, and the presence of those species in bamboo-tree gardens inSukapura is presumably due to the movement of wild animals, especially birds, that occupy thisartificial vegetation as their habitat. The presence of various forest species in bamboo-treegardens indicates the important contribution of this garden in biodiversity preservation.
Arenga pinnata is another tree species found in the upper story, but this species is not dominantin bamboo-tree gardens in Sukapura. This member of the palm family is decreasing both in termsof population and distribution. Many A. pinnata trees in this village, especially old trees that nolonger produce a significant amount of "nira" (a kind of sweet liquid), have been cut down fortheir starch. On the other hand, replanting of this species is still uncommon. The dispersal of A.pinnata seeds in nature relies mostly on the presence of a certain mammalian species (i.e., palm
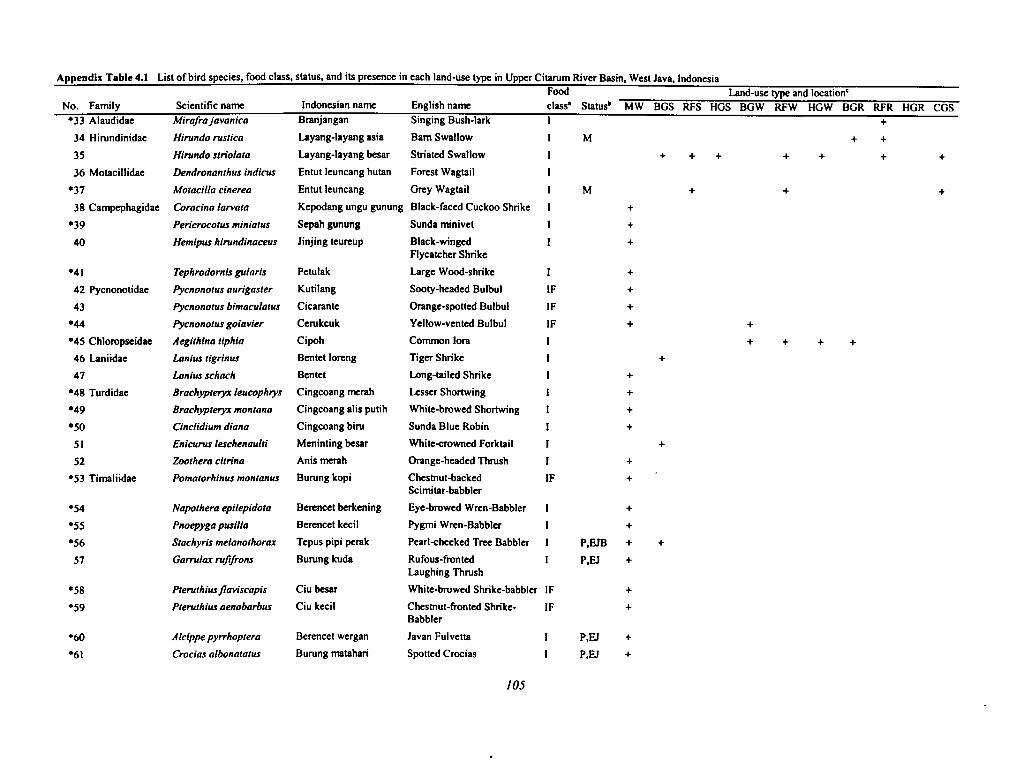
274 Herminia A. Francisco
The analysis reveals that in all three regression runs, the explanatory variables included in themodel account for a large proportion of the variation in the level of the dependent variable(biodiversity). This is indicated in the high values of the coefficient of determination (r-square).The CD-IQV and the CDI both refer to economic crops and hence may be consideredcomparable, and indeed the r-square values are not far from one another. Note, however, that theCD-IQV generated a significant coefficient than did the Shannon-Weiner Index.
The most significant explanatory variables in all measures of biodiversity are farm size andhousehold size, both with positive coefficients. The positive sign means that an increase in thevalue of either variable will bring about an increase in crop diversity at the farm level. Anincrease in household size might mean a larger labor force is available to attend to cropdiversification. An increase in farm size means increased ability to accommodate an increase innumber of crop species cultivated as well as a bigger population for each species. The samerelationship also holds for variation in diversity when measured by a simple number of plantspecies.
The CDI and number of plant species (PD) are both significantly and negatively affected byhousehold income. In both cases, the regression coefficient of household income is quite small,which means that the extent of influence may not really be that substantial. The negative value ofthe coefficient reflects the fact that higher household income is often associated withmonocropping or the plantation type of agriculture. It has been noted on Mount Makiling that thehigh-income group tends to adopt the plantation type of agriculture involving a fewer number ofcrop species. This form of cropping system also requires a larger capital, which only thosehouseholds with higher-income levels can manage. Further, risk increases with fewer cropspecies, and the lower-income groups apparently are not willing to take this risk. As notedearlier, the lower the income, the greater the tendency for the farmer to diversify, whichpresumably reduces one's exposure to risk.
The significant input of age and education on biodiversity as measured by CD-IQV is notsupported in the two other measures of biodiversity. Age has a positive coefficient at asignificance level of 15 to 20 percent, which means that 80 to 85 percent of the time, an olderfarmer will have higher crop diversity in his farm. This result is not consistent with the resultsobtained earlier when considering only age in explaining the level of CD-IQV. It does appearthat in the regression analysis the interaction of other socioeconomic factors has reversed therelationship of age to CD-IQV. The more educated the farmer, the less diverse is his farm as seenin the negative coefficient for education. As with the income variable discussed earlier, the moreeducated farmers may thus be richer and more profit motivated, and more motivated to take risksin cultivating fewer crops on the farm.
In general, the results from the three types of regression analyses are not greatly different fromone another. The variables that emerged from the analysis as significant determinants of cropdiversity are consistent with what would be logically expected. The findings lend support to whatmany have been thinking all along, namely farm size, household size, household income, and, tosome extent, age and education are major determinants of crop and plant diversity. Thesevariables or combinations thereof account for 80-90 percent of the observed variation in thevalue of the dependent variable, crop and plant diversity.
The results seem to indicate that household survey data are reliable, as supported also by the highcorrelation coefficient between the two crop diversity measures—the one based on household

22 Parikesit, Djuniwarti, and H. Y. Yadikusumah
As in the other study villages, many wild species of plants were also found in bamboo-treegardens in Ranca Kasumba. The most dominant wild species are Pseudoelephantopus scaber,Amaranthus gracilis, and Ageratum conyzoides. The wild species most commonly found in theupper layer of bamboo-tree gardens in Ranca Kasumba is Erythrina fusca and Semecarpusheterophyllus. (These two species are also found along the riverbanks in other regions in WestJava.)
Homegarden. Compared with bamboo-tree gardens, maintenance of homegardens by villagers ismore intensive. People in the study villages plant a variety of species (having different functions)in their homegardens, based on their own preferences. In general, the function of mosthomegardens in Sukapura is the same (i.e., more aesthetical), although some gardens have adifferent function. Villagers who plant their homegardens with ornamental species give priorityto aesthetics, whereas other villagers who grow vegetable crops in their homegardens givepriority to commercial purposes.
Among all plant species found in sampled homegardens in Sukapura, the most dominant specieswere Rorippa indica, Drymaria cordata, and Duranta erecta. Although the homegarden is thetype of land use located closest to human settlements, which should mean the most intensivecultivation, this does not mean that wild plant species are completely absent. On the contrary,some wild species categorized by the owners as weeds are quite dominant. For example, R.indica and D. cordata are two wild species that are small but with a high capability of dispersion.These species generally exhibit large population size and wide distribution in homegardens inSukapura village.
If a structural analysis of homegarden vegetation is carried out separately for domesticated andwild species groups, the results show that Duranta erecta, Alternanthera ficodea, andMalvaviscus arboreus are the most dominant domesticated species found in homegardens inSukapura. D. erecta and M arboreus are generally planted as live fence. Musa paradisiaca andPsidium guajava are included among fruit plants commonly grown in homegardens in Sukapura.Besides ornamental and fruit plants, some villagers also plant food crops such as Manihotesculenta and Allocasia indica as subsistence food sources. Some villagers planted Calliandraspp. in their homegardens for fuelwood purposes.
Among wild species, Rorripa indica and Drymaria cordata are the most dominant species. Otherspecies of weeds with small populations but commonly found in homegardens are Alternantheraphiloxeroides and Ageratum conyzoides. It is likely that the higher relative humidity in Sukapuravillage is responsible for the presence of many wild species.
Pseudoelephantopus scaber, Amaranthus gracilis, and Pachyrisus erosus are the most dominantspecies among all species found in the homegardens of Wangisagara village. The first twospecies are wild species that grow in large clumps in homegardens. In fact, the latter species isnot widely distributed in this village—it was grown by only one respondent—but it was grown inlarge numbers for commercial purposes because the bulb of this crop is edible. Polysciasfruticosa is another dominant species commonly planted as a live fence. Its leaves can beconsumed as a vegetable. Some people in Wangisagara also plant various fruit tree species intheir homegardens, but none of these species is dominant. Two species, Psidium guajava andMangifera indica, are among the fruit trees grown in homegardens in Wangisagara.

Biodiversity Maintenance at the Farm Level 275
survey and the other based on field measurements. But differences in the significant variablesobtained with the two measures make it difficult to reject one measure in favor of the other.Additional factors must be brought into the picture, such as the cost of data collection and theconsistency in the reliability of the measures, which would require more study. Nevertheless, thefindings do suggest that household-generated data may provide measures of biodiversity equallyas useful as to the more scientific, but presumably more expensive, plot inventories.
Farmer Versus Scientist Perceptionof Biodiversity Indicators
Biodiversity Indicator Species
The floral component (1995) of this project identified a list of indicator species. Landres, Verner,and Thomas (1988) state that "An indicator species is an organism whose characteristics (e.g.,presence or absence, population density, dispersion, or reproductive success) are used as anindex of attributes too difficult, inconvenient, or expensive to measure for other species orenvironmental conditions of interests." This means that an indicator is a surrogate measure andhence, by definition, may have no direct relationship (or have only a simple cause-and-effectrelationship) to the factor or factors of interest.
Scientists' Perception of Indicator Species. Table 11.6 presents a list of what the projectbiologists consider to be indicator species and what they consider them to indicate (Gruezo1995).
Perception of Indicator Species: Scientist and Community Accounts. The biologists' list ofplant indicator species was reviewed with twenty key informants from the Makiling ForestReserve. Information on the parts of plants used, products consumed and used, and spatial andtemporal distribution were obtained. Their perceptions of the present abundance of the speciesalso were obtained.
Indicator Species According to Local Communities
Nettle Plant (Dendrochnide meyeniana). The plant is perceived to be not useful at all. It cancause contact dermatitis. Some claim that it is often cut because of this characteristic, whileothers claim they are not touched for the same reason. The plant is found all over the forestreserve but thrives best near bodies of water and in relatively cooler environments. Its absence,therefore, can mean both human intrusion (if cutting is practiced) and human absence (if nocutting is practiced).
Sugar Palm (Arenga pinnata). This species is abundant all over the forest reserve but is mostabundant in the innermost part of the forest. The products derived from plant parts includebrooms from leaf midribs, rope from leaf sheath fibers, vinegar from the inflorescence sap,vegetable dish from the palm heart, candied sweets from fruits, and lumber from the tree trunk.This species is observed to grow abundantly from the seeds dispersed by the palm civet and isnot considered scarce. As such, this may not be a good indicator of human disturbance and lossof biodiversity.

Structure and Floristic Diversity of Man-made Ecosystems in Upper Citarum River Basin 21
civet that is also now scarce in the rural ecosystem). The decreasing population of palm civet isdue to the declining of its habitat and hunting because farmers consider this wild animal as pestsfor their fowls.
In bamboo-tree gardens in Wangisagara village, Urena lobata, Mimosa pigra, and Diodeasarmentosa are the most dominant species. These three species are wild plants found in the lowerlayer. Tree species such as Micromelum minutum is found at the middle layer, and none of theindividuals of this species is found more than 2 meters high because they are routinely prunedfor fuelwood. Some inhabitants in Wangisagara village practice pruning to collect fuelwoodinstead of cutting the tree down. Tree pruning stimulates buds to form new branches (Fitter andHay 1981; Loveless 1991). Various species (e.g., Ficus virens, Sterculia hantap, Garciniadulcis), which usually grow in natural forest, are found in the upper layer of vegetation inbamboo-tree gardens in Wangisagara. The origin of those forest tree species is not exactlyknown. It is suspected that they were brought by certain wild animals or planted a long time ago(according to the owner, Sterculia hantap tree has existed in his bamboo-tree garden for morethan seventy years).
Among the domesticated species in bamboo-tree gardens in Wangisagara, Albizia falcata,Gigantochloa verticillata, Duranta erecta, and Bromelia fastuaosa are the most dominant. Thefirst two species are used for construction materials and fuelwood by village people. Severallandowners in Wangisagara lease their bamboo-tree gardens to other farmers. To make morespace available, the owner harvests mature trees so that the renter can grow crops such ascassava and sweet potato. During the rental period, the renter is asked to plant new trees or lookafter the existing young trees. One of the tree species commonly planted is Albizia falcata.Sometimes the renter—by his/her own initiative—will voluntarily plant trees, especially whenthe landowner guarantees to extend rental of the bamboo-tree gardens in the following years.Such arrangements can be very beneficial for biodiversity conservation.
Similar to the other two villages, the horizontal structure of bamboo-tree gardens in RancaKasumba is dominated by wild species in the lower layers. Pseudoelephantopus scaber andAmaranthus gracilis were the most dominant species. P. scaber was found in almost all sampledbamboo-tree gardens in Ranca Kasumba village, and it usually grew in clumps with a largenumber of individuals. Bambusa vulgaris and Swietenia mahagoni, on the other hand, are thedominant species found at the upper layer. The bamboo species grow mostly along the banks ofCitarum River that crosses Ranca Kasumba village. People planted these bamboo trees to preventsoil erosion when flooding occurs.
In the bamboo-tree gardens of Ranca Kasumba, mahagony (Swietenia mahagoni) is the mostdominant species of domesticated plant species, followed by cassava (Manihot esculenta). Otherdomesticated species found rather dominant are banana (Musa paradisiaca) and Gigantochloaverticilata. Although G. verticilata, in terms of species importance, is less important comparedwith S. mahagoni, the former has a higher value in terms of frequency. This indicates that mostbamboo-tree garden owners tend to grow bamboo instead of S. mahagoni. The likely reason isthat most of the villagers in Ranca Kasumba (and indeed throughout the Upper CitarumWatershed) are more familiar with growing bamboo than mahagony, which is an introducedspecies. Besides, bamboos, which are multifunctional and can be harvested several times withoutreplanting, grow faster and can be harvested in a shorter time than mahagony. Landowners usebamboo-tree gardens for many purposes, including as a source for construction materials,fuelwood, and food. On occasion, they also sell bamboo and other trees for additional income.

276 Herminia A. Francisco
Table 11.6 Indicator species according to project biologists
Indicator species What the species indicates
Nettle plant (Dendrochnide The overall appearance and abundance of the plant say somethingmeyeniana) about the extent and degree of human intrusion or disturbance. In
particular, where these are still abundant, human intrusion is less,and hence biodiversity is high.
Sugar palm (Arenga pinnata) This species is correlated with large frugivorous mammals such asthe palm civet (Paradoxurus philippinensis). Different stages ofmaturity also indicate human intrusion since the fruits are eaten byman, and other parts are collected for varied purposes.
Succulent forest floor herbs The abundance and intact closely spaced growth formations(Elatostema viridescens) indicate a high diversity level while absence indicates human
intrusion.
Bird's nest fern (Asplenium spp.) The abundance and matured stages of ornamental ferns indicate ahigh level of biodiversity.
Ground orchids (e.g., Havenaria Their abundance reflects less human intrusion, and hence a highermalinta) biodiversity level.
Lianas, woody climbers Abundance signifies less human intrusion and a high level of(Connarus semidecandrus) biodiversity.
Parasitic/strangler plants Abundance reflects a high diversity level.(Rafflesia manillana; Ficusbalete)
Edible, cane, and ornamental These species have high economic value. Their absence means arattans (e.g., Calamus merrilli) high level of human intrusion and a low diversity level.
Bird's Nest Fern (Asplenium spp.). Some respondents claimed that collection of this species isprohibited. Some say, however, that the species is often collected, and as a result its populationhas decreased. This species is usually found in the dipterocarp and mossy forest zone,particularly clinging to big trees. The fern is collected for ornamental and medicinal purposes.
Ground Orchid. Although the residents of the forest reserve point out that it is illegal to collectthis species, it is collected and sold as a highly priced ornamental plant. This illegal activity hasdecreased its population.
Woody Climbers. Some species are collected for tying purposes (i.e., rope or twine) and otheruses such as shampoo (i.e., Entada phaseoloides), locally known as gugu. The decline in theirpopulation density can therefore indicate human intrusion and decrease in biodiversity levels.
Strangler or Parasitic Plants. Whole plants are uprooted whenever possible, as these species cankill the host plants (e.g., Ficus balete). Likewise, a number of informants have also indicated thatthese species are left undisturbed as their wood quality is very low and do not have any othereconomic value. These species are found all over the reserve, and its abundance or absencecannot be a good indicator of human intrusion or the biodiversity level of the area.
Edible, Cane, and Ornamental Rattans (Calamus spp.). Although the collection of rattan isillegal, these are nonetheless collected for use in cottage industries (i.e., basketry, cane furniture-
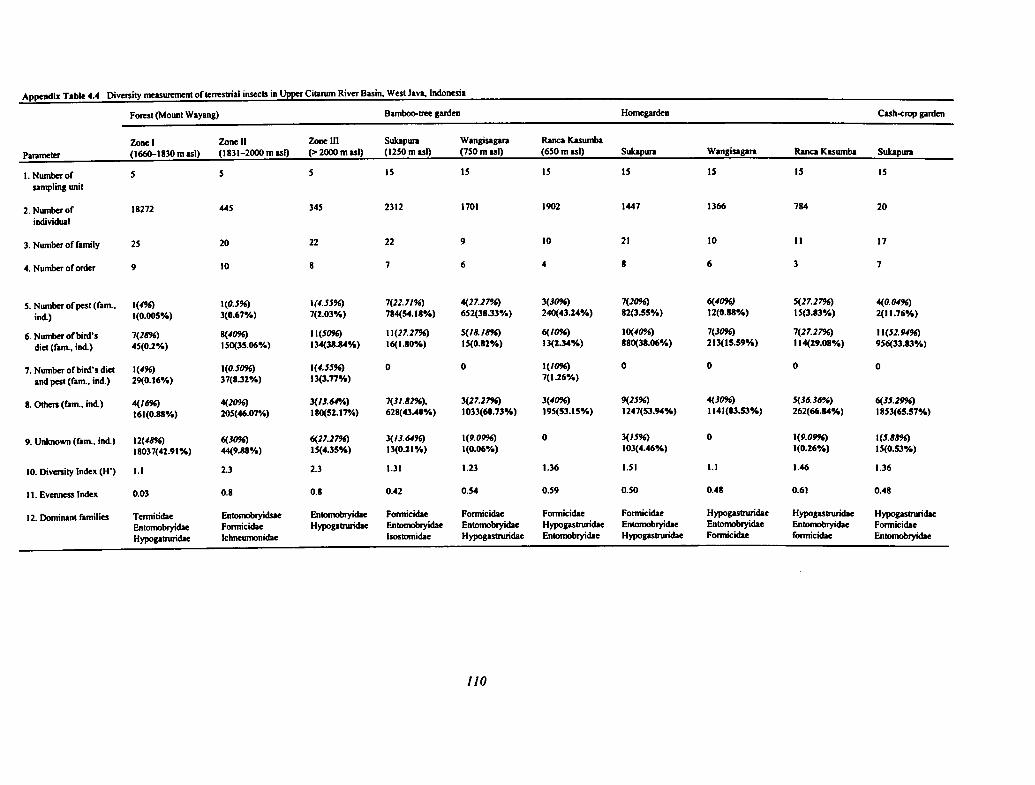
Structure and Floristic Diversi ty of Man-made Ecosystems in Upper Citarum River Basin 23
In the sampled homegardens in Ranca Kasumba, Rorippa indica, Acalypha siamensis, andDuranta erecta are the most dominant species. The two latter species are domesticated plantsused as live fence. R. indica is also a dominant species in lower layers of homegardens inSukapura. Among the wild species, the dominant species in homegardens of Ranca Kasumba aresimilar to those found dominant in homegardens of Wangisagara.
Vertical Structure of Artificial Vegetation in the Study Villages
In general, the vertical structure of vegetation either in bamboo-tree gardens or in homegardensamong the study villages shows only small differences. However, the variability of the verticalstructure of vegetation in the homegardens is greater than in the bamboo-tree gardens. Thevertical structure of vegetation in bamboo-tree gardens of the three villages can be differentiatedinto at least three strata: (1) the lowest stratum, occupied by various species of herbs and shrubsup to I m in height, (2) the mid-stratum, occupied by shrubs and young trees ranging between 1and 5 m in height, and (3) the upper stratum, occupied by various species of trees more than 8 min height. In some bamboo-tree gardens with a dense canopy cover in the upper layer, a canopygap between the upper and mid-strata, or between the middle and lowest strata, can be distinctlyobserved. The complexity of vertical structures in bamboo-tree gardens is often said to "mimic"the vertical structure of the natural forest.
The vertical structure of vegetation in homegardens may vary. Some homegardens consist ofonly one stratum but some show a rather complex vertical structure, in which each stratum isfilled with various plant habits from herbs that occupied the floor stratum up to trees in theuppermost stratum. In some homegardens, trees may reach a height of 8 m or more. Thevariation in vertical structural complexity of homegardens is related to variation in the functionof the homegarden. The simplest vertical structure, which consists of only one stratum, is foundin homegardens composed only of annual crops.
The Floristic Diversity of AnthropogenicVegetation in the Rural Ecosystem
The diversity of land-use types found in the study area provides an opportunity for diversespecies of plants to establish themselves. Hence, the maintenance of land-use diversity has directand significant contributions to the maintenance of biodiversity in general in rural ecosystems.
In general, the floristic diversity found in bamboo-tree gardens is somewhat different from thatfound in homegardens. The diversity (species richness) of domesticated species found inbamboo-tree gardens is lower than that of wild species. On the contrary, the diversity (speciesrichness) of domesticated species found in homegardens is higher than that of wild species. Thisindicates that management of bamboo-tree gardens is less intensive than homegardens. Thislower intensity can be seen, for example, in the fact that most of the people in the three studyvillages do not practice weeding in their bamboo-tree gardens, but they do so in their home-gardens.
The results of interviews regarding management of bamboo-tree gardens show that none of thebamboo-tree garden owners in the three villages did anything to control pests, and only one or

Biodiversity Maintenance at the Farm Level 277
making), as ornamental plants (e.g., Calamus biscolor), or for food (e.g., Calamus merrillii).Rattan species are still abundant in the forest interior. Although the high economic value mayaccelerate depletion of these species, the inaccessibility of where they are found makes itdifficult to associate its abundance or absence with the level of biodiversity.
The key informants were also asked about certain wildlife species—for instance, deer (Cervusmariannus), wild boar (Sus spp.), monkey (Macaca fascicularis), bat (Pteropus vampyrus,Ptenochyrus jagorii), and wild cat (Paradoxurus philippinensis, Viverra tangalunga). The keyinformants noted that these species are rarely observed in the areas of the forest reservefrequented by them. However, when sighted, they are hunted for food. These wildlife species arebelieved to be still abundant in the more densely forested areas of the forest reserve. Where theyare found, biodiversity is believed to be generally high, although it may vary according to thespecies. For example, bats are associated with fruit trees. Where many bats are observed, it isbelieved that there will be many fruit-bearing trees in the area.
Conclusion
Biodiversity Maintenance at the Farm Level and Its Determinants
The level of biodiversity in the Makiling Forest Reserve is considered to be high, based on eitherthe index of qualitative variation (IQV) or the Shannon-Weiner Index. Results of the analysisseem to indicate that use of either the IQV or the Shannon-Weiner Index will accurately measurebiodiversity and assist in understanding the factors influencing biodiversity maintenance in thearea. The former relies on a household survey, while the latter is based on crop species countedin sample plots by researchers. The implication is that one may be able to balance the costlier,time-consuming species count at the farm level with answers provided by the householdrespondents. This issue merits further investigation.
Maintenance of biodiversity in the area has been greatly influenced by the desire of the farmersto justify their occupancy of the land. By practicing agroforestry, which involves planting a largenumber of perennial forest species along with annual food crop species, the farmers can arguethat their land-use system is not incompatible with the protection of the Makiling Forest Reserve.Whereas upland cultivation of short-term crops such as corn is typical of many upland areas ofthe Philippines, this cannot be said of the Makiling Forest Reserve, despite its accessibility.
Larger farm size and bigger household size are both associated with higher biodiversitymaintenance on the farm. In contrast, higher income and better education are associated withlower biodiversity maintenance, as a greater market orientation leads to fewer crops on the farm.Farmers' age has a lesser correlation with biodiversity maintenance.
The local community generally supports the selection of indicator species by the projectscientists. There are some differences in perception, nevertheless, particularly in terms of whatthe indicator species abundance or absence seems to indicate.

24 Parikesit, Djuniwarti, and H. Y. Yadikusumah
two owners in each of the villages fertilize or weed the bamboo-tree garden. On the other hand,more than 50 percent of homegarden owners performed weeding.
Diversity Measures of Bamboo-tree Gardens
Bamboo-tree gardens have diverse ecological, economic, and sociocultural functions. However,because management of bamboo-tree gardens is generally less than optimal, the economicbenefit gained is less than the maximum. Despite this, the owners still maintain these gardens,for reasons including fulfillment for construction materials and for fuelwood, and to pass on totheir descendants.
The result of species inventory conducted in all samples of bamboo-tree gardens showed that thenumber of wild plant species is higher than domesticated plants. The villagers' habit in foregoingintensive maintenance in their bamboo-tree gardens provides opportunities for various wildplants to grow. The total number of species found in bamboo-tree gardens in the three studyvillages were 237 species of plants, classified into 194 genera and 64 families, and consisting of84 domesticated species and 153 wild species. In terms of functional categories, weeds andmaterials (construction and fuelwood) are the most numerous groups represented by 101 speciesand 63 species, respectively.
From the sampled bamboo-tree gardens in Sukapura, 126 species from 101 genera and 47families were found. Of this, 40 species are domesticated, while the rest are wild species(Appendix Table 2.1). The most important families of the domesticated group, represented bythe highest number of species, are Poaceae and Papilionaceae (each consisting of four species).The Poaceae also includes the highest number of wild plants (i.e., nine species), while itsrelative, Cyperaceae, is represented by five species.
The total number of plant species found in the bamboo-tree gardens in Wangisagara does notdiffer significantly with what was found in Sukapura, namely 127 species from 101 genera and43 families. From those species, 43 species are domesticated, while the rest (84 species) are wild(Appendix Table 2.1). The domesticates with the highest number of species come from thePoaceae (grasses), Euphorbiaceae, and Mimosaceae (each represented by four species), whereasthe Asteraceae family is the wild plant group that is represented by the highest number of species(nineteen).
The total number of species found in all samples of bamboo-tree gardens in Ranca Kasumba ishigher than that of the other two villages (i.e., 137 species from 106 genera and 45 families).Forty-four species of the total were domesticated plants while the rest, 93 species, were wildplants (Appendix Table 2.1). Families of domesticated plants with the highest number of speciesare Poaceae and Euphorbiaceae, with six and five species, respectively. Similar to Wangisagara,Asteraceae has the highest number of species (i.e., fourteen species, followed by Poaceae withten species). Although the total number of species found in Ranca Kasumba is the highestcompared with the other two villages, its species average per sample is the lowest. This indicatesthat the variability of species diversity among samples of bamboo-tree gardens in RancaKasumba is higher than in the other two villages.
Compared with the two other villages, bamboo-tree gardens in Wangisagara village has thehighest average number of domesticated species. Abdoellah (1990), Abdoellah et al. (1978),Karyono et al. (1978), Karyono (1981), and Widagda et al. (1984) suggested that farming

278 Herminia A. Francisco
References Cited
Abraham, E. R., J. 0. Sargento, and C. S. Tones. 1992. Census and on-ground verification of farms in theMt. Makiling forest reserve. DAP-ERMP, UPLB, College, Laguna.
Carandang, W. M., and N. R. Lawas. 1992. Assessment of farming systems in the Makiling forest reserve.DAP-ERMP, UPLB, College, Laguna.
Cruz, R. V., H. A. Francisco, and C. S. Torres. 1991. Agroecosystem analysis of Makiling forest reserve.DAP-ERMP, UPLB, College, Laguna.
Dizon, J. T. 1992. Socio-economic profile of farmers in the Makiling forest reserve. DAP-ERMP, UPLB,College, Laguna.
Francisco, H. A., F. K. Mallion, and Z. M. Sumalde. 1992. Economics of dominant forest-based croppingsystems in Mt. Makiling forest reserve. An integrative report. DAP-ERMP, UPLB, College, Laguna.
Gruezo, W. 1995. Mt. Makiling plant diversity: Keystone/indicator species. In The conditions of biodiver-sity maintenance in Asia: The policy linkages between environmental conservation and sustainable devel-opment, annual report 1995, ed. M. R. Dove and P. E. Sajise. Khon Kaen: Southeast Asian UniversitiesAgroecosystem Network and East-West Center, Honolulu.
Landres, Peter B., J. Verner, and J. W. Thomas. 1988. Ecological uses of vertebrate indicator species: Acritique. Conservation Biology 2(4).
Sumalde, Z. M., H. A Francisco, and G. S. Fermintoza. 1992. Profitability analysis of dominant forest-based cropping systems in Makiling forest reserve. DAP-ERMP, UPLB, College, Laguna.
Torres, C. S. 1992. Socio-economic factors affecting farm occupancy patterns in the Makiling forestreserve. DAP-ERMP, UPLB, College, Laguna.

Structure and Floristic Diversi ty of Man-made Ecosystems in Upper Citarum River Basin 25
activities in the rice fields might affect the number of plant species (domesticated plants) in othertypes of land use. The situation found in the bamboo-tree gardens and homegardens in RancaKasumba and Sukapura villages illustrates the validity of this suggestion. Ranca Kasumba is apaddy field area, while Sukapura is a vegetable-producing area. Intensive agricultural activitiesin these two villages result in a lower mean of the number of domesticated species in bamboo-tree gardens (see Appendix Table 2.2). In these two villages, the function of bamboo-treegardens as a source of income is overshadowed by paddy field and cash-crops (vegetables). Thelower number of domesticated species in the bamboo-tree gardens of Sukapura is because thebamboo-tree gardens in this village mainly function to provide fuelwood, so the owners plantfewer species.
Diversity of Domesticated Species in Bamboo-tree Gardens Based on Growth Forms andFunctions. Based on their growth forms, the domesticated species found in the bamboo-treegardens were categorized as trees, shrubs, and herbs. In the domesticated group, the treescategory in bamboo-tree gardens of the three villages has the highest number of species ascompared with shrubs and herbs (see Appendix Table 2.1). Trees are preferred by landownersbecause of the ease in planting and because they only need maintenance when still young. Theyoung trees are usually planted in early wet season, and later fertilized and cleared from weeds atthe end of the season. Soon thereafter, the trees are left to grow until maturity. As mentioned,bamboo-tree gardens function for their owners as a source of construction materials andfuelwood and also as a long-term saving; thus, owners usually do not invest much into bamboo-tree gardens.
Field observations showed that bamboo is the most common domesticated species in thebamboo-tree gardens of the three study villages. Widjaja (1986) mentioned that bamboo has astrong and dense root pattern, suitable for growth in areas with high slopes or along riverbanks.Bamboo roots can inhibit soil erosion and slumping. In addition, bamboo can be used forconstruction materials and fuelwood. Domesticated species planted in bamboo-tree gardens canbe used for other purposes (e.g., as fruits, traditional medicines, and industrial materials). Suchfunctional diversity, in general, supports the maintenance of biodiversity in the rural ecosystem.
Based on their functions for local people, the domesticates in bamboo-tree gardens can becategorized into nine major functions: namely, vegetables, fruits, food, industrial material,medicinals, spices, ornamentals, fences, and materials such as for construction and fuelwood. Ingeneral, it can be stated that the functional diversity of domesticated species and speciescomposition of each functional category in bamboo-tree gardens of the three villages showeddifferences. The most diverse category is materials (construction materials and fuelwood).
In the bamboo-tree gardens of Sukapura, ten species are categorized as construction materialsand fuelwood, and seven species as vegetables (see Appendix Table 2.3 for other categories).Species belonging to the materials category that can be found in almost every bamboo-treegarden are Calliandra callothyrsus, Eucalyptus alba, Albizia montana, and bamboo (of the genusGigantochloa). Species of vegetables and fruits that can be found in almost every bamboo-treegarden are Artocarpus heterophyllus and Musa paradisiaca. Some bamboo-tree gardens in thisvillage are fenced by Cest rum foetidum, Malvaviscus arboreus, and Bromeliafastuaosa.
In bamboo-tree gardens of Wangisagara, nine species for construction materials and fuelwoodwere found, followed by raw vegetables and fruits with six species each (Appendix Table 2.3).Tree species used for construction materials and fuelwood that can be found in almost every

Biodiversity Maintenance at the Farm Level 279
Appendix 11.1
Estimation of Index of Qualitative Variation (IQV)(cf. Torres 1992)
The IQV formula used as a measure of crop biodiversity is given below.
IQV = Total Number of Observed Differences (NOD) X 100Maximum Number of Possible Differences (MNPD)
where:TNOD = [ (Xi) !]
Xi is the i`h observation
(Xi)! where n = 5= X5 * X4 * X3 * X2 * X1+
X4* X3*X2*X1+X3*X2*X1+
X2 *X1MNPD = n2(1-I
21where:
n = total of actual frequency of each crop species1 = number of crop species
The IQV ranges from 0-100.The higher the value, the more diverse the crops are in a given area.
To illustrate:
Given:CoconutCacaoBananaMangoLanzonesAvocado
No. of Trees Planted15020
2006
306

26 Parikesit, Djuniwarti, and H. Y. Yadikusumah
bamboo-tree garden in Wangisagara are Albizia falcata, Melia azedarach, and bamboo (of thegenus Gigantochloa). The dominant species of vegetables and fruits are Pithecelobium dulce andMusa paradisiaca. Unlike the bamboo-tree gardens in Sukapura, people in Wangisagara usuallyuse Duranta erecta, Sericocalyx critata, and Bromelia fastuaosa for live fence.
The number of species used as construction materials and fuelwood in the bamboo-tree gardensof Ranca Kasumba village is the highest, at eighteen species (see Appendix Table 2.3 for othercategories). The most common species used for construction materials and fuelwood in thebamboo-tree gardens of Ranca Kasumba are bamboos (of the genera Bambusa andGigantochloa), Hibiscus similis, and Swietenia mahagoni. Unlike the bamboo-tree gardens of theother two villages, the bamboo-tree gardens of Ranca Kasumba are seldom fenced with plants.Only when the bamboo-tree gardens are used for the family's cemetery were they fenced withBromeliafastuaosa, Duranta erecta, and Polyscias fruticosa.
Overall, the number of species found in bamboo-tree gardens categorized as materials(construction materials and fuelwood) is the highest, followed by vegetables and fruits. Fieldobservation indicated that bamboo-tree gardens located far from the settlement tend to be plantedwith species of plants used for construction materials and fuelwood; bamboo-tree gardenslocated near the settlement are planted with fruit trees. This trend occurs because fruit trees needmore intensive maintenance and also for security (to avoid theft when the trees bear fruits).
Diversity of Wild Species in Bamboo-tree Gardens Based on Growth Forms and Functions.Wild plant species in bamboo-tree gardens are intentionally left undisturbed by the ownerbecause their presence does not inhibit the development of cultivated trees, except for youngtrees. Klingman (1982) stated that the growth of young trees would be inhibited by the presenceof wild plants. It occurs due to the competition among them in procuring nutrients. When thetrees are mature, they generally have denser and wider canopies that will cut off the sun's raysreaching the ground. Consequently, mature trees will inhibit the growth of wild herbaceousspecies, especially the shade-intolerant ones. Ecologically, the presence of wild ground-coveringspecies in bamboo-tree gardens is very desirable because it reduces the rate of surface erosion(Sarief et al. 1981).
The wild species group in the bamboo-tree gardens in the three villages is dominated byherbaceous plants. These generally have a small shape, good capacity of reproduction, and welladapted to less favorable environmental conditions (Anderson 1976; Klingman 1982). Comparedwith the other two villages, trees of the wild species group in Wangisagara village have thehighest species number. It is due to villagers' intention to cultivate and maintain the presence ofthose species. Although Arenga pinnata has quite a highly potential economic value, its presenceis decreasing because the animal responsible for dispersal of its seeds, palm civet (Paradoxurushermaproditus), is also decreasing in number. This animal reproduces the tree through amechanism called endozoocory, in which the seeds are spread out when the civet eats the fruitsand then secrets the seeds together with the feces (Van Der Pijl 1982). In addition to the palmcivet, several species of birds and small mammalians have an important role in the distribution ofvarious species of plants. Dissemination of some species of trees of the family Moraceae, likeFicus brevicuspis and Ficus virens, is assisted by birds. Bats, particularly from the genusPteropus, help in spreading some species of fruits such as Psidium guavaja and some species ofFicus spp. (Van Der Pijl 1982).

280 Herminia A. Francisco
Procedure:
1. Determine the total number of differences for the data in the sample problem by firstmultiplying each frequency by every other frequency. This would produce one product for eachpair of frequencies and then summing these products:
150X20 = 3,000150X200 = 30,000150X6 = 900150X30 = 4,500150X6 = 900
20X200 = 4,00020X6 = 12020X30 = 60020X6 = 120200X6 = 1,200200X30 = 6,000200X6 = 1,2006X30 = 1806X6 = 3630X6 = 180
Total 52,936
2. Compute for the maximum number of possible differences (MNPD):
Coconut ................150Cacao ................... 20Banana.................200Mango................... 6Lanzones............... 30Avocado...............^
Total 412
MNPD = (412,)2 (661)2 (6)
= 70,727
3. Compute for IQV = 52,3366 X 10070,727
= 74%
Structure and Floristic Diversity ofMan-made Ecosystems in Upper Citarum River Basin 27
The results of our ethnographic interview suggest that the decrease in species of wild trees likeFicus brevicuspis, F. virens, Arenga pinnata, Eugenia densifolia, Garcinia dulcis, and Sterculiajavanica is either caused directly by humans through tree cutting or by the decrease in thepopulations of seed-spreading animals. (This suggests that to maintain plant biodiversity,concern has also to be paid to maintaining seed dispersers.)
The wild species in Sukapura can be divided into six functional categories: twenty-three speciesbelong to the materials category (construction materials and fuelwood); ten species, traditionalmedicines; and twenty-five species, of unknown function (see Appendix Table 2.3 for others). InWangisagara, wild species in the bamboo-tree gardens are categorized into five functionalcategories; the most represented is materials with twenty-two species. In Ranca Kasumba, on theother hand, the wild species in the bamboo-tree gardens can be divided into four functionalcategories and, once again, the materials category is the most rich in terms of species, at twentyspecies.
Some of the species found can be used as traditional medicines and vegetables. Some wildherbaceous species such as Ageratum conyzoides, Amaranthus gracilis, Artemisia vulgaris,Plantago major, Elephantopus scaber, Mimosa pudica, Sonchus arvensis, Stromaetus sp., andCentella asiatica can be used for traditional medicines. Gynura crepedioides, Emilia sonchifolia,Eringiumfoetidum, and Solanum torvum can be used as fresh vegetables. Amorphophalus blumeiand Allocasia macrophylla were eaten as famine foods during the Japanese colonization inWorld War II. Although many species used as traditional medicines or as spices are found in thebamboo-tree gardens of the three villages, they are mostly not used for practical reasons, such asdistance of the bamboo-tree gardens from the settlement and the fact that ready-to-use modernmedicines are much easier to obtain.
Some wild tree species such as Micromelum minutum, Euodia macrophylla, Eugenia densifolia,Ficus virens, F. brevicuspis, F. ampelas, Garcinia dulcis, Artocarpus elasticus, Canavaliaensiformis, and Macaranga tanarius are commonly used for fuelwood. These species of treeshave quite hard wood and have many branches. Also included in the wild tree species is Arengapinnata; its syrup, fruits, leaves, and fibers have economic value. A productive tree of thisspecies can yield fruits with a cash value of between IDR5,000 and IDR10,000 per year(approximately US$2.22—US$4.44). So significant is the value that the tree is only cut when it isno more productive. One unproductive tree (aged more than twenty years) is sold at IDR10,000-IDR15,000 (equivalent to US$4.44—US$6.67). Some other wild species found in bamboo-treegardens are used for ornamental plants, such as some species of fern genera likeHymenophyllum, Adiantum, and Nephrolepis, and herbaceous or shrubby species such as Wideliabi iora and Lantana camara.
Number of Species and Individuals in Each Stratum of Bamboo-tree Gardens. Various specieswith different growth forms occupy the existing layering in bamboo-tree gardens. To someextent there is a difference in terms of species diversity and individual densities in bamboo-treegardens of the study villages. This difference is likely due to natural and anthropogenicdisturbances.
High dependency for fuelwood in Sukapura village causes villagers to use shrubs such asChromolaena odorata and Lantana camara for fuelwood. This has resulted in a low average ofindividual density of shrubs with a height <1 m (Appendix Table 2.4). Routine pruning inhibitsthe growth of some trees such as Calliandra callothyrsus to no more than 5 m high.

Chapter 12
A Landscape Fragmentation Indexfor Biodiversity Studies Using GIS
Dante Gideon K. Vergara'
Introduction
This chapter proposes to investigate the effects of landscape patchiness on levels of biodiversityand endemism in a forested reserve that contains farms and settlements within its boundaries.Fragmentation and patchiness will be used throughout the text to mean the same thing, namelyclearings in a forested setting, whether they are human influenced or not. Tree falls and inhospi-table soils or slopes represent nonanthropogenic sources of patchiness in the forest (Forman andGodron 1986). Essentially, therefore, this chapter will deal with nonforest patches or fragmentsin a forested landscape.
The chapter will begin by reviewing the only existing fragmentation index and explaining itsinadequacy for this investigation. It will then proceed to the development of a new fragmentationindex and the methods involved in deriving it from maps and remotely sensed data using geo-graphic information and image processing systems. Regression analyses will then be carried outto examine the relationship between this index on the one hand, and on the other hand the biodi-versity indices and endemicity ratios generated in Chapters 7 to 11.
Landscape Fragmentation Index
Definition of Terms
Before turning to the discussion of the indices themselves, a few words on the definition of termsused in geographic information systems (GIS) and image processing are in order. Spatial data, orinformation regarding space, can be represented in two ways. The first, called raster represen-tation, or simply raster images, consists of digital representation of spatial data. Raster imagesare produced in much the same way as a fax or photocopying machine prints out a graphic page:one row at a time, from left to right, top to bottom. The image is made up of tiny white, black, orcolored dots or cells, organized in rows of fixed width, such as you would have in a framedcross-stitched picture. Each dot, whether colored or not, is referred to as a "pixel," short for"picture element." Each color is referred to as a "class," and different GIS and image processingsystems have different capabilities as to the maximum classes they can handle. Areas of contig-uous pixels of the same class or color are called "polygons." Polygons can have holes in them ofa different class or color, and these holes are called "islands." The whole collection representsthe image, any subset of which is called a "window" of that image.
The second means of displaying spatial data is by vector representation, or simply vector images.This is the more intuitive means of representation and is akin to line drawings, in which onepicks up a pencil and starts drawing on a piece of paper. Each stroke of the pencil is called a
281

28 Parikesit, Djuniwarti, and H. Y. Yadikusumah
The average number of species of shrubs and herbs less than 1 m high in bamboo-tree gardens inWangisagara was higher compared with that of the other two villages. This is presumablybecause bamboo-tree gardens in Wangisagara are more open, allowing propagules of some wildspecies to invade and occupy the existing gaps. The height of individuals of some tree speciessuch as Evodia macrophylla and Micromelum minutum has never reached more than 5 m highbecause they are pruned routinely for fuelwood.
Many bamboo-tree gardens in Ranca Kasumba are used for red-brick industry. In some cases theowners do not totally clear the bamboo-tree gardens but only clear certain parts and build a semi-permanent building made of bamboo where bricks are burned and stored. Such activities causeloss of vegetation cover at lower and middle stories. This can be seen from the low average oftree density at a height of up to 10 m. Nevertheless, in certain parts of the garden floor, clustersof small individuals of wild plants (particularly herbaceous ones) can still be seen as indicated inAppendix Table 2.4 by high individual density at the lower stratum of bamboo-tree gardens inRanca Kasumba. In the upper story, on the other hand, tree species such as bamboo from thegenera Giganthochloa, Swietenia mahagoni, Maesopsis eminii, and Samanea saman are some-times left undisturbed.
Correlation between Species Richness, Density, and Land Area of Bamboo-tree Gardens. Theland area of bamboo-tree gardens is correlated positively with the total number of species(Appendix Table 2.5). This means that the larger the area of the bamboo-tree gardens, the morespecies of plants are found. When the correlation analysis is performed separately fordomesticated and wild species groups, the results show that in Wangisagara village the totalnumber of domesticated species (but not the wild species group) is correlated positively withland area, while Sukapura shows the opposite result: the total number of domesticated species iscorrelated negatively with the land area, meaning that there are no more domesticated species inthe larger bamboo-tree gardens than in the smaller ones. This shows that the owners of bamboo-tree gardens (usually the rich people of the village) do not manage their bamboo-tree gardens forcommercial purposes. Instead of cultivating their bamboo-tree gardens for their incomegeneration, they allocate their resources to the cultivating of their other, more productiveagricultural land such as cash-crop gardens. The only resources they take from their bamboo-treegardens are for personal use. Under certain circumstances, they will convert their bamboo-treegardens into cash-crop gardens to get more income or they will sell the land because they needcash. The species commonly cultivated in bamboo-tree gardens are not too varied, includingGigantochloa atter, Calliandra callothyrsus, Albizia montana, and Eucalyptus alba. Cultivationof those species does not need regular intensive management; yet, it benefits the owner. Bamboo,for example, is used for many purposes, such as sticks to support young plants and forconstruction materials, whereas C. callothyrsus and A. montana are very useful for fuelwood. Allthese circumstances result in the larger bamboo-tree gardens in Sukapura being no more diverse.
The results of correlation analysis (Appendix Table 2.5) between the number of individuals andthe land area of bamboo-tree gardens show a similarity to that between the number of speciesand the land area. In the Wangisagara bamboo-tree gardens, it is shown that the larger the area ofbamboo-tree gardens, the higher the number of individuals of domesticated species. But thelarger area of bamboo-tree gardens in Sukapura is not associated with a higher number ofindividuals of cultivated species.
There is also a trend for a larger area of the bamboo-tree gardens in Sukapura and RancaKasumba villages to be associated with a higher number of wild species. A larger land area
282 Dante Gideon K. Vergara
"line," made up of long or short straight edges called "arcs." Lines that return to their startingpoint and thus enclose an area are also called "polygons" in vector representation, whether theyare regularly shaped or not. They may also have holes or "islands" within them. Polygons,islands, and windows mean the same thing whether they be in vector or raster representation.
Existing Fragmentation Index and Rationale
Currently, the only fragmentation index to be found in the literature is that of Monmonier (1984).Neither the landscape ecology nor the GIS literature refers to any other such index. Limitedjournal searches also yielded no other reference to such an index.
Monmonier's fragmentation index is calculated as follows:
c-1f=
n-1
where f is the fragmentation index,c is the number of classes in the image,
and n is the number of pixels in the image.
Formula 1. Monmonier's index
As can be seen from the formula, this particular index deals only with the qualitative nature ofthe fragments, meaning the number of classes. Since our investigation deals with only twoclasses, nonforest patches in a forested landscape, in our case the numerator of this index willalways be 1, while the denominator will be the same for a fixed window size or total number ofpixels. Hence the indices would be equal even with changes in patch shapes, sizes, and distri-bution for uniform image windows, and thus will certainly not do. Therefore, there is a need todevelop a new index that can incorporate the quantitative aspects of the polygons in the image,meaning their shapes, numbers, sizes, and arrangements in space.
Model Development
The parameters for the new index to be developed should correspond to the spatial quantitiespreviously mentioned, referring to shape, number, and size of the patches relative to the size ofthe window or the image, and the arrangement of the patches in the image. Thus, f=g(S, M, R),
where f is the fragmentation index,g is the model function,S is the parameter for patch shape,M is the parameter for number and size of the patches relative to the
window,and R is the parameter for the spatial patch arrangement.
Formula 2. Fragmentation index
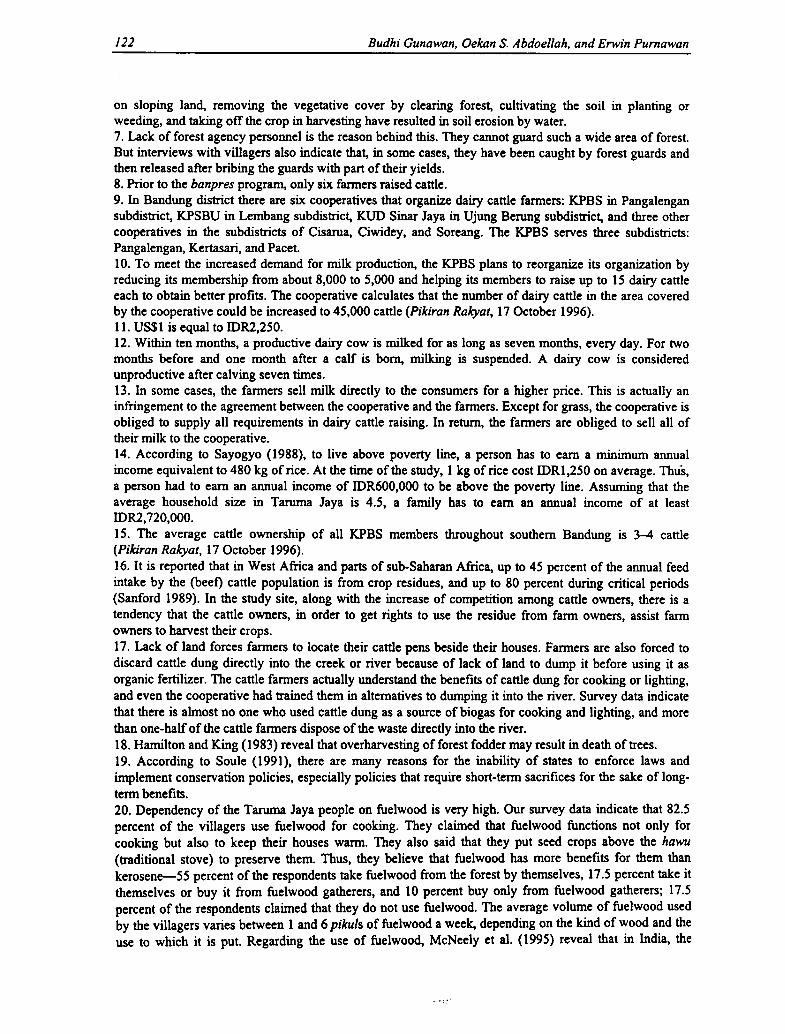
Structure and Floristic Diversi ty of Man-made Ecosystems in Upper Citarum River Basin 29
provided more available space for wild species to invade and establish themselves. Larger spacealso causes less competition for resources, particularly for water and nutrients (Fitter and Hay1981; Loveless 1991). And as described before, less intensive management by landownerscauses population growth of various wild species to become uncontrollable in this type of landuse.
Diversity and Evenness Indices in Bamboo-tree Gardens. The average Diversity Index ofdomesticated species in bamboo-tree gardens is lower than those of wild species for the threestudy villages (see Appendix Table 2.6). This is probably due to higher wild species richness. Inaddition, the lower Diversity Indices of the domesticated species group may also be caused bythe presence of certain overwhelmingly dominant species. For instance, among domesticated treespecies found in the bamboo-tree gardens in Sukapura village, Eucalyptus alba and Calliandracalothyrsus both have high populations, whereas Albizia falcata has a quite high population inthe bamboo-tree gardens of Wangisagara.
Among the three villages, the average Diversity Index of domesticated plants in the bamboo-treegardens is the highest in Wangisagara, whereas Sukapura and Ranca Kasumba show an almostsimilar index value. On the other hand, the Diversity Index of wild species in bamboo-treegardens is the highest in Sukapura village. The higher value of wild species diversity in Sukapurais unlikely to be a function of higher species richness. Instead, it is more likely to be related to ahigher species equitability (higher Evenness Index) (Appendix Table 2.6). In the bamboo-treegardens of Ranca Kasumba, despite the higher number of wild species, the Diversity andEvenness Indices are the lowest. This may be associated with the great dominance in thesegardens of some species such as Pseudoelephantopus scaber, Amaranthus gracilis, andAgeratum conyzoides.
Diversity Measures in Homegardens
The total number of species found in the entire sample of homegardens of the three villages ishigher than that in bamboo-tree gardens of the three villages: 269 species of plants included in232 genera of 71 families. Among those species, 225 are domesticated and 44 are wild. Thediversity in homegardens can even be higher than these figures suggest, as some species arerepresented by more than one variety.
From all of the sampled homegardens in Sukapura village, we found 170 species (includingsedges and grasses) from 109 genera and 61 families. Of them, 119 species were domesticatedplants while the rest were wild plants (Appendix Table 2.1). The most numerous families ofdomesticated plants are Asteraceae and Liliaceae, consisting of twenty-three and nine species,respectively. The family of wild species with the most members is Asteraceae (seventeenspecies). The average number of domesticated species found in the homegardens of Sukapura isslightly higher than that in the homegardens of Wangisagara.
In the homegardens of Wangisagara village, we found 175 species from 148 genera and 63families, of which 153 species were domesticated plants. The best represented family ofdomesticated plants is Euphorbiaceae (twelve species), while for the wild plants it is Asteraceae(seven species). The average number of species in the homegardens of Wangisagara is thehighest compared with the other two villages.

Landscape Fragmentation Index Using GIS 283
Shape. Given two polygons, one complexly irregular and the other perfectly square or circular,and each with an equal number of contiguous pixels or cells in a fixed window, the former spacewould be considered more fragmented than the latter. Two measures are available for shapecomplexity and compactness: the fractal dimension D due to de Cola (1989) and the compactnessratio c (Eastman 1993, 1996). The fractal dimension D is a measure of the complexity of theshapes of a group of polygons and varies from 1 to values less than 2. The compactness ratio ccompares the area to perimeter ratio of a given polygon to that of a circle, the most compactpolygon, and varies from values greater than 0 to 1. Although both measures are normalizedwithin tight bounds or limits, the fractal dimension is preferable since our analyses usually dealwith a group of polygons, while the compactness ratio deals with only one polygon at a time?The fractal dimension is derived from the regression line given below:
ln(P) = ln(C) +D ln(sgrt(A)) + e orln(P) - ln(C) - e
D=ln(sqrt(A ))
where P is are the perimeters of the polygons,sgrt(A;s) are the square roots of the areas of the polygons,C is a constant corresponding to the y-intercept of the regression line,E is the error term,
and D is the fractal dimension or regression coefficient.
Formula 3. Fractal dimension
A fractal dimension of I represents regular polygons, such as circles or squares, and valuescloser to 2 represent very complex polygons. As shape complexity and patchiness of the imageincrease, therefore so too does the fractal dimension. Hence for the model, the fractal dimensionD will be the estimate of the shape parameter S.
Number and Size. For the parameter M that deals with the number and size of the patchesrelative to the window, patchiness increases as the number and sizes of the patches increase. Wethus have
N x (E np)/NM=
n,
where N is the number of polygons in the window,
Enp is the total number of patch pixels,and n, is the total number of pixels in the window.
Formula 4. Parameter M for shape and size of the patches
This equation simplifies to M = En.J;, which is the density of the patch pixels in the window, orsimply the patch density, d. So the parameter M for number and size of the patches will beestimated by patch density d, thus M d.

30 Parikesit, Djuniwarti, and H. Y. Yadikusumah
In the homegardens of Ranca Kasumba village, we found 148 species from 128 genera and 57families, in which 127 species were domesticated plants. Among domesticated species, therichest family is Liliaceae (twelve species), while among the wild plants the richest family isAsteraceae (eight species).
The average number of domesticated species in homegardens is higher than that of wild species(Appendix Table 2.2). In some homegardens in two study villages, Ranca Kasumba andWangisagara, no wild plants were found. Field observations in Ranca Kasumba, for example,show that the use of homegardens, despite their small size, for other activities such as playing,storage of bricks before delivery, and sun drying of rice grain is very high.
Diversity of Domesticated Species in Homegardens Based on Growth Forms and Functions.The majority of plants grown in homegardens of the three villages are small herbaceous plants.The limited size of most homegardens in those three villages inhibits the ability to grow bigtrees. But most herb species have small shapes and are shade-tolerant (Tjitrosoepomo 1988),which allow them to be planted in small pots and placed underneath tree canopies or placed onthe veranda. Trees are usually grown in larger gardens. Tree species with multiple functions suchas fruits, vegetables, and ornaments are typically planted in large homegardens, although some-times one or two trees of a particularly useful species are also found in small homegardens,either for shading or, if the tree grows well and produces fruits, for family consumption.
Based on their function to the local people, domesticated species found in homegardens can becategorized into eight main functions: ornamental, vegetable, fruit, food, industrial, medicine,spice, and materials for construction and fuelwood.
In general, homegardens in the three villages are dominated by ornamental plants (123 species),followed by vegetables (34 species) and fruits (23 species). This suggests that people in the threevillages give highest priority to aesthetics for their homegardens. As stated by Karyono et. al.(1978) and Karyono (1981), the high degree of dominance of ornamental plants in homegardensis partly because homegardens are situated next to the house; thus, they are tied to the prestige ofthe owner. However, although homegardens are dominated by ornamental plants, some peopleuse their homegardens for nurseries, for seed production, or for commercial cash-cropping asseen in some of the homegardens of Sukapura.
A total of 119 species were found in the homegardens of Sukapura village, including 63 speciesof ornamental species, 22 species of vegetables, and 15 species of fruits (see Appendix Table 2.7for other functional categories). Nowadays, due to the extensive use of modem medicines, mostof the people who live in rural areas are reluctant to plant (traditional) medicinal plants.
A total number of 151 species were found in the homegardens of Wangisagara, including 79species of ornaments, 27 species of vegetables, and 17 species of fruits (see Appendix Table 2.7for details). As in the other study villages, homegardens of Wangisagara are dominated byornamental plants.
A total of 127 species were encountered in the homegardens of Ranca Kasumba village, includ-ing 73 species of ornamentals and 22 species of vegetables (see Appendix Table 2.7). Similar tothe other two villages, ornamental plants are always found in homegardens of Ranca Kasumba.Similarly, in almost every homegarden, species of vegetables and fruits are found.

284 Dante Gideon K. Vergara
Spatial Arrangement. Given two windows with an equal number of patches that have equaldensities and equivalent shapes, if the polygons tend to cluster in one window, then that space isless fragmented than if they were randomly distributed. The space would be even patchier if thepolygons were uniformly distributed over the area. To take this logic further, holding all otherthings equal, the higher the degree of clustering the less fragmented the area. This is because asclustering increases, the spaces between the clusters increase; and as uniformity in spatialdistribution increases, the spaces between the patches inversely decrease. The quadrat coefficientQ, which is the ratio of patch density mean to its variance, is a measure of the spatial distributionof points in an area. Values less than 1 denote a more uniform distribution, while values closer to1 denote more randomness, and values greater than 1 denote more clustering. Since the value ofQ increases as clustering increases (and as patchiness decreases), we take the multiplicativeinverse of Q as our estimate. To improve on the bounds or limits of the fragmentation index, weadd I to the quantity Q in the denominator; hence, the parameter R for patch arrangement ordistribution is estimated as R=1/(1 + Q).
The Model and Its Bounds. The formula for calculating the fragmentation index f is thereforegiven as:
Dxdf=
( 1 + Q)
where D is the fractal dimension,d is the patch density,
and Q is the quadrat coefficient.
Formula 5. Fragmentation index (1)
Now the following holds: I <= D <2 and 0 <= d <= 1. Multiplying the two inequalities,weget0<= Dxd<= 2. (1)
But since 0 <= Q <= 2, then I <= 1 + Q <= 3. We now consider two cases with differentvalues of Q to facilitate the analysis:
Case 1:If0<= Q <1, then 1<= 1 +Q<2. (2)
Thus as long as Q is less than 1, by dividing (1) with (2) above, we obtain
Dxd0 <= f= < 1, hence for Q < 1, f is bounded by [0, 1) or is limited to values
1 + Q from and including 0 but less than 1.
Case 2: If 1 <= Q < 2, then adding 1 to all quantities in the inequality, we get2<= 1 +Q<3. (3)
Applying the same logic as in the preceding case, we get 0 <= f < 2/3 < 1. Thus in this case, f isalso bounded by [0,1), or simply put f is limited to values from and including 0 up to valuesapproaching but not including 1.

Structure and Floristic Diversi ty of Man-made Ecosystems in Upper Citarum River Basin 31
Compared with the other two villages, the homegardens of Sukapura have the lowest totalnumber and average species number of ornamental plants, but they have the highest averagenumber of individuals per sample. As mentioned before, some inhabitants of Sukapura villagegrow certain species that have economic function such as cash-crops in their homegardens ratherthan plant ornamental plants.
Homegardens in Wangisagara have the highest total number of species as well as the highestaverage number of species of ornamentals, vegetables, fruits, medicines, and spice plants com-pared to the other two villages. This is also the case for the number of individuals of vegetableand fruit categories.
Diversity of Wild Species in Homegardens Based on Growth Forms and Functions. Althoughweeding in homegardens is more intensive than that in bamboo-tree gardens, the presence ofwild species, particularly the herbaceous sort, is inevitable because these species of herbs have arapid reproductive capability and are quite adaptive to homegarden conditions. Moreover, thewild herbaceous species can be encountered in hidden and inaccessible places, such as waterdrains and underneath the house or chicken coop.
The wild species found in homegardens of the three villages can be categorized into just twofunctions, namely vegetables and traditional medicines (Appendix Table 2.7). But the function(if any) of the majority of the wild plant species encountered are still unknown so they areusually classified as "weed" species.
Some wild herbaceous species, such as Ageratum conyzoides, Amaranthus gracilis, Artemisiavulgaris, Plantago major, Mimosa pudica, Sonchus arvensis, Stromaetus sp., and Centellaasiatica, can be used as raw materials for traditional medicine. And Gynura crepedioides, Emiliasonchifolia, and Eringium foetidum are edible plants. The functional diversity of wild species inhomegardens of the three villages is less varied than that in the bamboo-tree gardens.
Average Number of Species and Individuals in Each Stratum in Homegardens. The number ofspecies and individuals of herbaceous plants (<1 m high) found in homegardens of Sukapuravillage is higher than in the other two villages. Higher individual density at the lowest story isbecause the majority of homegardens in Sukapura are not too large so that most of the villagersplant small herbaceous species. Apart from that, various small herbaceous wild species are alsofound in the lowest story (see Appendix Table 2.8).
The average number of species and individuals of shrubby plants in the lowest layer ofhomegardens in Wangisagara village is higher than in the other two villages. Many homegardensin this village are planted with Duranta erecta, Acalypha siamensis, and Sericocalyx cristata,which are used as live fence. Some tree species such as Artocarpus heterophyllus, Parkiaspeciosa, and Cocos nucifera in some homegardens in Wangisagara may reach more than 5 mhigh. This causes the average number of species and individuals in the upper layer of mosthomegardens in Wangisagara to be higher than that of the same layer in homegardens of theother two villages.
Compared with that in the other two villages, homegardens in Ranca Kasumba have the averagenumber of species and individuals of trees, shrubs, and herbs in all layers (except in thelowermost stratum) lower than the other two villages. But, in the lowermost stratum the averagenumber of tree species with <1 m in height is slightly higher than in the other two villages. In

Landscape Fragmentation Index Using GIS 285
We have therefore found a bound [0,1) for the fragmentation index over all cases of its argu-ments D, d, and Q. Put in another way, for all possible values of the fractal dimension D, thepatch density d, and quadrat coefficient Q in the formula for the fragmentation index f, thefragmentation index can only assume values in the range from and including 0 but less than 1.
Methodology and Analysis
Vegetative Characterization of the Makiling Forest Reserve and Its Environs
Mount Makiling Forest Reserve is dominated by a wet tropical forest. On the fringes of the forestand on the lower slopes of the mountain may be found grasslands and agroforestry areas made upof both multistoried structures of mixed forest and fruit trees, and simpler structures consistingof mixed plantations of coconuts and/or fruit trees, sometimes with understory agriculture. Theplantations are usually cleared of weeds during the dry months of March and April in preparationfor the planting season at the onset of the monsoon rains in June. The grasslands are dominatedby Imperata cylindrica and Sacharrum spp. interspersed with some agricultural fields or fruit-tree plantations. On the mildest slopes there are agricultural fields planted to sugarcane orpineapples, while on completely level areas there are usually rice paddies and settlements.
Data Acquisition and Preparation
This analysis is based on the use of a Landsat 5 TM quarter image taken at 1:38 P.M. on 2 April1993, which was rectified for image distortion at the National Mapping and ResourceInformation Authority of the Philippines. A 400 x 400 pixel subset of the image was used, witheach pixel covering approximately 30 x 30 meters on the ground. To improve contrast, each ofthe seven bands was "stretched" by dropping 2.5 percent of the least significant pixels at theextremes of the spectral responses before any compositing was conducted. Topographic maps(1:50,000 in scale) of the area were obtained and digitized to generate the digital elevationmodel, the drainage network or the system of streams and waterways. They were also used togeo-reference or superimpose a known geographical reference system to the image, using thelatitude-longitude reference system in decimal degree units. Geo-referencing was performed byobtaining the coordinates of the highest peak from the contour map and affixing this to a singlepixel patch in the image corresponding to the only bare spot at the exact peak of the mountain.The accuracy of this fix was tested by taking two recognizable points in the image correspondingto a road crossing and a distinct road curve that were near the edges of the image butdiametrically opposite to each other. The estimates were in error by at most 2 pixels, whichamounts to just one-half of 1 percent error for an image of 400 x 400 pixels. The resulting digitalimage was used for all other analyses. The land-cover/land-use map was derived from this imageafter it was fully classified, and this was further reclassed into forested and nonforested areas forthe fragmentation analysis.
Ground-truthing was conducted by visiting the sampling sites and taking geographic coordinatefixes, wherever possible, using a Magellan Fieldpro V geographical positioning system (GPS)unit. It was not possible to get a GPS "fix" or reading in the closed canopy forest; this was onlypossible in areas with breaks in the canopy cover. The faunal transect lines (which ran throughthe floral sampling points) were estimated using the GPS fixes wherever possible; otherwise,they were estimated using the digital elevation model and drainage system map. The survey datafor the Makiling Forest Reserve were obtained from the Institute of Forest Conservation,

32 Parikesit, Djuniwarti, and H. Y. Yadikusumah
some small homegardens in Ranca Kasumba, local inhabitants prefer to plant dwarfed treespecies such as Ficus benyamina, F. glomerata, Fagara spp., and also various improved varietiesof fruit trees such as Nephelium longana, Mangifera indica, Citrus nobilis, and Euphorialongana. The presence of those grafted species (which are shorter than their plant ancestor) hasmade the lowermost stratum richer in species number at least for quite sometime.
Correlation between Species Richness, Density, and Land Area of Homegardens. Correlationanalysis shows that in terms of number of species, the larger the size of homegardens in RancaKasumba, the higher the number of species (Appendix Table 2.9). The same analysis ofcorrelation performed separately for domesticated and wild plants shows a positive correlationbetween the number of species and area of homegardens in Sukapura and Ranca Kasumba forboth domesticated and wild plants. This indicates that the larger the land, the more freedom theowner has to cultivate more species of plants. Some inhabitants in Sukapura village who haveonly small homegardens tend to plant only one or two species, such as cabbages or carrots, thatthey feel have the most benefit. For wild species, similarly, the more space available inhomegardens the more opportunity for them to grow. Correlation analysis between the number ofindividuals and the area of homegardens also shows a positive correlation (except forhomegardens in Wangisagara) (Appendix Table 2.9). This correlation is presumably associatedwith the greater space available for plants to establish themselves in larger gardens. Apart fromthat, larger homegardens need more time and energy to weed. Most homegarden maintenance iscarried out by family members with limited time (particularly to completely discard weeds).Consequently, less maintenance in larger homegardens gives greater opportunities to wildspecies.
Diversity and Evenness Indices of Homegardens. The species Diversity Index in homegardensin the three villages shows the opposite result to that of bamboo-tree gardens. The DiversityIndex of domesticated species in homegardens is higher than that of wild species (AppendixTable 2.10). Of the three villages, the homegardens in Ranca Kasumba have the lowest averageof Diversity Index value for wild species, because the number of wild species found in thesehomegardens is very low. In addition, from the viewpoint of population density, there are somevery dominant wild species such as Pseudelephantopus scaber and Amaranthus gracilis in thesehomegardens.
The homegardens in all three villages have a species Diversity Index higher than that of thebamboo-tree gardens. Most of the homegardens in the three villages also have a higher averagenumber of species and species Evenness indices than those in the bamboo-tree gardens. This,again, reflects the fact that the use and the maintenance undertaken in homegardens are moreintensive than in bamboo-tree gardens.
The average Evenness indices of domesticated and wild plant groups are not significantlydifferent. In general, species equitability of either domesticated or wild groups is relativelysimilar in homegardens of the three villages.
Floristic Diversity in Other Land-use Types
Rice Fields. Species inventories carried out in the rice fields of the three villages discovered atotal number of 163 species, consisting of 63 species of domesticated plants (including rice) and100 species of wild plants (shrubs, herbs, and grasses). From interviews with farmers of the threevillages, we found that approximately 88 varieties of rice have been known by rice growers in

286 Dante Gideon K. Vergara
University of the Philippines at Los Banos, and used in the computation of the boundaries of thereserve. The classification of the land-cover/land-use map was also greatly aided by the author'sfamiliarity with the mountain.
Image Processing and Interpretation
The IDRISI geographic analysis system' was used for the GIS analysis, as well as for imageprocessing (Eastman 1993, 1996). A principal component analysis over all seven bands, whichresults in a composite image that explains the most variation in the original image and isspecially suited to vegetation studies, was used to select the initial sampling sites before fullclassification of the image could be performed. A normalized difference vegetation index map, atechnique used to describe the relative amount of green biomass in the image, using the nearinfrared and red bands, was also generated.
For the land-cover/land-use map, it was essential to discriminate between forest andcoconut/fruit-tree plantations, and between grasslands and adjacent agricultural areas. Butneither the principal component analysis nor the normalized difference vegetation index, nor anyof the usual techniques for discrimination of vegetation or land-use types afforded the neededdifferentiation (Lachowski n.d.) The band 5, band 4, and band 3 (543) composite in the blue,green, and red channels overestimated the forest, as did the principal component analysis and thenormalized difference vegetation index, while the band 3, band 5, and band 7 (357) compositeoverestimated the patches. But our first-hand knowledge of the canopy structure and under-growth characteristics and the coincidence between the time the image was taken and the annualweeding season led us to attempt to use the thermal band to start a general classification. Bycombining the near and mid-infrared bands 4 and 5 with the thermal band 6, the resultingcomposite (456) successfully differentiated the general areas for forest, mixed agroforestry andgrasslands, and mixed coconut/fruit-tree plantations. Although the poorer resolution of thethermal band (120 x 120 meters) strongly influenced the composite and initially posed a problemby overemphasizing the shapes and sizes of the patches, this was overcome by overlayingselected supervised classes of the other composites with selected supervised classes of the 456composite. The mossy forest, described in the literature at 900 meters above sea level, wasdelineated using the digital elevation model. The classification scheme and process flow aresummarized in Figure 12.1, while Figure 12.2 shows the classified land-cover/land-use map.
GIS Data Input and Analysis
To begin the fragmentation analysis, the land-cover/land-use map was reclassified to show thenonforest polygons on a forest background. Seven floral and five faunal sampling sites fromChapters 7 to 11 were used for this analysis. The five faunal sampling sites corresponded exactlyto five of the seven floral sampling sites. Of these five sites, four had transect lines for the faunalstudies that passed through the centers of their corresponding floral sampling plots. Two of thesetransects were located in the mid-montane forest, one in a grassland, and the other in anagroforestry area. The fifth site, which was located in the mossy forest at the peak of themountain, did not have enough space for a transect line. The last two of the seven floral samplingsites were located in another grassland and agroforestry area, respectively, and had nocorresponding faunal data.

Structure and Floristic Diversi ty of Man-made Ecosystems in Upper Citarum River Basin 33
the Upper Citarum River Basin since the beginning of this century. But nowadays only a few ofthem are still grown in this part of the basin as many lower-yielding varieties (either local orintroduced) have been replaced by newer and higher-yielding varieties. Varieties of paddycultivated in Sukapura differ from those cultivated in the other two villages. Most rice-fieldowners in this village maintain older introduced rice varieties, namely mota and ketan (stickyrice). According to farmers, those two varieties are more adaptable to mountainous areas (>1,000m above sea level) than the new high-yielding variety (i.e., IR-64). Since rice-field areas inSukapura are mostly located on slopes, the size of each plot is not too large. Only a few farmersused the bunds to plant crops such as beans and corn.
The number of paddy varieties cultivated in Wangisagara village is more diverse than in theother two villages. At least five rice varieties were found: Cisadane, Cisanggarung, KetanPadang, Ketan Demak, and IR-64. Rice-field bunds in Wangisagara are relatively wider thanthose in the other two villages, and most of the farmers use them to cultivate various nonricecrops. Species inventories undertaken in rice fields in Wangisagara discovered 53 species ofplants, in which vegetables are the richest in terms of species number. On average, fivedomesticated species were found on each sample rice-field bund.
Varieties of paddy cultivated in Ranca Kasumba are IR-64, Jembar, and Ketan. Rice-field bundsin Ranca Kasumba are generally narrow because most farmers want their rice-field lots as largeas possible so that they can plant more paddy to get higher yields. Only a few farmers use therice-field bund to grow some other crops. Our species inventory showed only ten domesticatedspecies, consisting of one species of food, three species of vegetable, one species of fruit, andfive species of materials category.
Cash-Crop Gardens. Cash-crop gardens are encountered only in Sukapura. In this village, cash-crop growing is the main agricultural activity for income generation. The diversity of speciesdiscovered in this land-use type is higher than that in rice fields. The introduction of new high-yielding varieties may, to some extent, enrich the local biodiversity, but it has offsetting conse-quences for the surrounding environment such as the emergence of new pests and diseases, lossof local and traditional varieties—which are probably more resistant to pests and diseases—andenvironmental changes as a whole due to the higher use of pesticides.
The most common crops cultivated by people in this village are introduced species includingcarrot, potato, leek, and radish, cultivated either in monocultural or mixed systems. Althoughthere is less diversity at the species level, there is more at the varietal level. In addition to themain crops, there are thirty-five species of domesticated plants found in the cash-crop gardens.In general, there is a high variability of species and varieties among the cash-crop gardens. Thiscan be seen from the fact that when 220 sample pairs are compared, only 6.7 percent has aSimilarity Index of 50 percent or more.
The number of cash-crop gardens in Sukapura is expanding over time. Conversion from anotherland-use type such as bamboo-tree garden to cash-crop garden is not uncommon. Farmersbelieve that bamboo-tree gardens are less beneficial from an economic point of view. Since mostfarmers are market-oriented, they tend to neglect the ecological importance of bamboo-treegardens (e.g., with regard to the maintenance of biodiversity in the area). More favorableenvironmental conditions such as more fertile land and higher humidity, which are suitable forvegetable growing, have driven farmers in Sukapura to practice intensive agriculture, eventuallyleading to the use of a small number of high-yielding species and varieties to gain higher profits.

Landscape Fragmentation Index Using GIS 287
VECTORS:
COMPOSITES:
NDVI
PCA
543
456
357
DEM
SAMPLING WINDOWSBOUNDARYSTREAMSTRANSECTSSAMPLING POINTS
SAMPLING MAPFRAGMENTATION
MAP
MID-MONTANE FOREST, COCONUTS,GRASSLANDS
AGRO-FORESTRY AREAS, OPEN/ ECOZONE• BARE, BUILT-UP AREA MAP
• MOSSY FOREST
Figure 12.1 Classification scheme and process flow.
The midpoints of the four transect lines and the centroids of the sampling plots in the remainingthree sampling sites were estimated and used as the centers for the sampling windows in thefragmentation analysis. The sampling windows vary from 33 x 33 pixels to 34 x 34 pixels insize, with the majority within 33 x 34 pixels or approximately 1 km 2 in size. (This variation isabout ± 2.5 percent and thus tolerable.) The size of the sampling window was based on theknowledge that the faunal transects range from I to 2 km in length and run through the centers ofthe floral sampling plots. It was thus confidently felt that the data reported in Chapters 7 to 11must be representative of the sampling windows. Figure 12.3 shows the location of eachsampling window in the study site.
For each sampling window, the patch density and quadrat coefficients were calculated using theQUADRAT module of the IDRISI GIS package. To compute the fractal dimension, the nonforestpolygons in the sampling windows were first determined and counted using the GROUP moduleof IDRISI. The corresponding areas and perimeters of the nonforest polygons were then calcu-lated, using the AREA and PERIMETER modules. These values were exported to a spreadsheet,where the logarithms of the perimeters and the logarithms of the square roots of the areas werecomputed. The fractal dimensions were obtained by regressing the logarithms and calculating theregression coefficients for each of the seven sampling windows. These were used with thecorresponding densities and quadrat coefficients to compute the fragmentation indices for eachsampling window. The results are summarized in Table 12.1.
Results and Discussions
The Nature of the Landscape Fragmentation and Its Proposed Index
Figure 12.4 shows the patchiness of the seven sample sites with their corresponding locations,ecotypes, fragmentation indices, and coefficients of the model components. The sample sites are
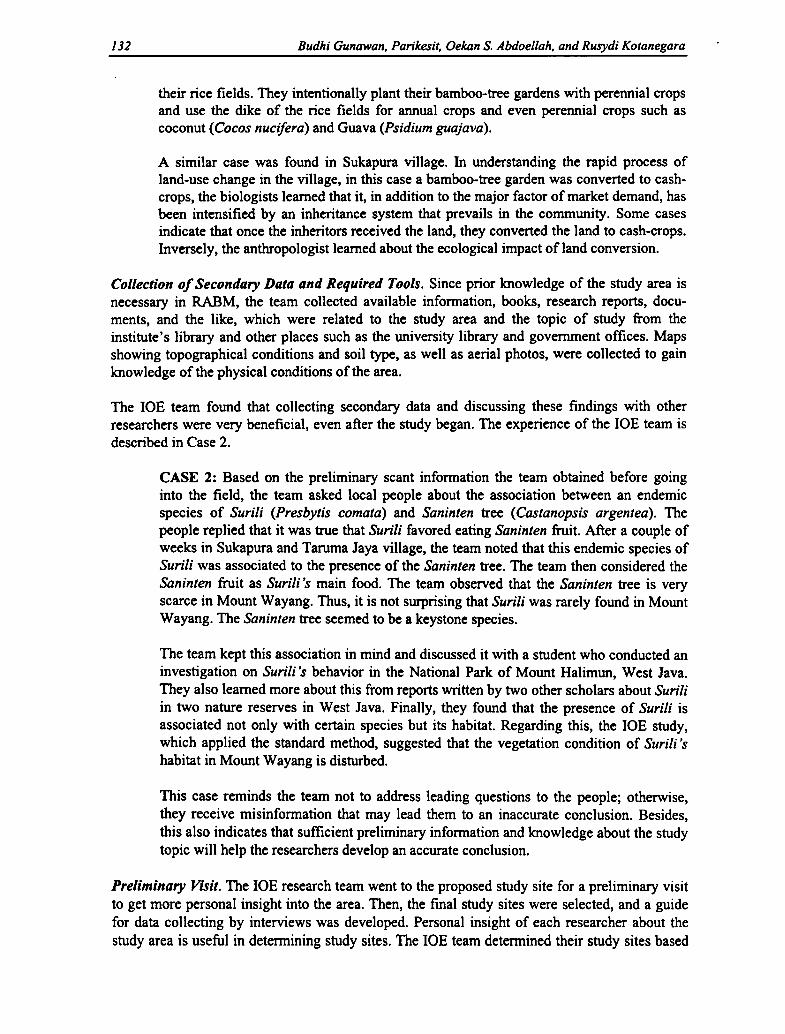
34 Parikesit, Djuniwarti, and H. Y. Yadikusumah
Overall Condition of Biodiversity in the Study Villages
If all plant species found in bamboo-tree gardens and homegardens are combined for eachvillage, the number of species found in Wangisagara village is the highest (302 species),followed by Sukapura (296 species), and Ranca Kasumba (285 species). Likewise, when thenumber of species among the three villages is compared, based only on the number ofdomesticated species found in both types of land use, Wangisagara village still has the highestspecies richness with 196 species, whereas Sukapura and Ranca Kasumba have 159 and 171species, respectively. Based on the average number of domesticated species per sample,Wangisagara still exhibited the highest value for both bamboo-tree gardens and homegardens(8.4 and 26.6, respectively). But the total number of species of wild plants in the two types ofland use in each village shows an opposite trend: Wangisagara has the lowest number of wildspecies (106), compared with Sukapura (134 species) and Ranca Kasumba (109 species).
From the foregoing facts enumerated, in general, regardless of the functional aspects of eachspecies, floristic diversity is highest in Wangisagara. This is the result of interaction of a varietyof factors (e.g., bioclimatic, socioeconomic, and sociocultural) in this village.
Floristic Variability at Different Spatial Scales (Sample, Land-usewithin and between Villages)
Floristic variability in the study area occurs at different scales, such as between plots, betweenland-use types within the village, and between different villages. Species variability betweensample plots and between the same and different land-use types is affected by the existence ofenvironmental heterogeneity and related social aspects. Species turnover at different scales wasevaluated using Similarity Index (SI) calculations.
The results show that very high species variability (indicated by a low SI) occurs in bamboo-treegardens and homegardens of the three study villages, whether at sample or land-use scales. Thehigh dissimilarity (low SI) of species composition between two samples reflects the uniquenessof each sample or land-use type. In other words, no two sample plots or land-use types areidentical in terms of species composition. This suggests that differences in plant compositionamong bamboo-tree gardens, as well as among homegardens, also reflect the individual desireand purpose of the owner, resulting in a high degree of plant diversity in both land-use types.
Bamboo-tree Gardens. Species variability among sample plots of bamboo-tree gardens is veryhigh. This is indicated by the small amount of sample pairs being compared that have SI 50percent or more. For example, there are only 9 pairs (of the total 210 pairs) in bamboo-treegardens in Sukapura that have an SI of 50 percent or more. The same result occurs for bamboo-tree gardens in the other two villages. Moreover, bamboo-tree gardens in Ranca Kasumba show ahigher variability between samples, with only one pair having an SI of more than 50 percent.
If the species turnover analysis is broken down between domesticated and wild plants, the resultsare quite interesting. For domesticates in bamboo-tree gardens in Sukapura and Ranca Kasumba,the number of paired samples that have a value of SI 50 percent or more is greater than thenumber of paired samples for wild plants. This means that, in general, variability ofdomesticated species among plots is lower than that of the wild species group. But, that is not thecase for bamboo-tree gardens in Wangisagara, where variability of domesticated species ishigher than variability of wild plants. The higher variability of domesticated species among

288 Dante Gideon K. Vergara
Table 12.1 Summary of fractal dimension (D), patch density (d), quadrat coefficient (Q),fragmentation index (f), biodiversity indices, and faunal endemicity
D d Q f Flora (H') Fauna (H') Endemism
Mid- 1 0.00346 0.9974 0.00173 3.65083 4.244 0.67568montaneMossy 1.51196 0.01384 0.98701 0.01053 3.56972 4.115 0.72973forestDampalit 1.25627 0.09537 0.90544 0.06287 3.73695 4.569 0.67213Bagong 1.38059 0.51515 0.48528 0.47884 3.22453 4.569 0.5625SilangPuting 1.29811 0.60963 0.39072 0.56903 1.35662 3.647 0.18182LupaSaimsim 1.21492 0.72371 0.27654 0.68877 1.34965Bagong 1.43567 0.67474 0.32554 0.7308 3.17212Silang 2
arranged in increasing fragmentation index from left to right and from top to bottom. Since weare dealing with nonforest patches in a forested landscape, the forest appears as black (class=0),while the nonforest patches appear as white (class=l). The first three sampling windows, corre-sponding to the natural forest, show very few patches and correspondingly low fragmentationindices. The following four sampling windows, corresponding to grasslands and agroforestryareas, show greater fragmented densities, patch shape complexities, patch distribution regular-ities, and consequently higher fragmentation indices.
There were two instances where the sampling windows yielded only two polygons each, theminimum number needed to derive the fractal dimension. These are for sites 5 and 7, withstandard errors equal to 0 in the regression analysis, indicating perfect fit. This is such since ineach case there were only two points to estimate the regression line (and no other point not onthe line). In both instances, one patch is a very large and complex polygon while the other is onlyone pixel in size. Such conditions are far from ideal for calculating the fractal dimension, whichwould be more accurate if there were more polygons of relatively equal sizes and complexities.The two instances mentioned will bias the fractal dimension to values closer to I and suggestthat a larger sample window might have been more appropriate. However, we must also considerwhether our biodiversity data would be representative of a larger sampling window. A compro-mise must therefore be reached in situations such as these, between accurate estimations of patchcomplexity and true representativeness of biodiversity measures. In such cases, it seems wiser tobias the fractal dimension rather than compromise the level of significance of the biodiversityindices, because the discussion to follow shows that the fractal dimension has less influence onthe fragmentation index than the other components of the model.
The sample site in one of the mid-montane forest areas (site 1) had only one square patch in it,which presents computational problems, since it is impossible to compute the fractal dimensionof only one polygon, as we would need two or more polygons for the regression. This onepolygon was assigned a fractal dimension of D= 1, such as we would have for squares and circles.This was an opportunity to test the use of the compactness ratio in lieu of the fractal dimension

Structure and Floristic Diversity of Man-made Ecosystems in Upper Citarum River Basin 35
bamboo-tree gardens in Wangisagara suggests that each owner of bamboo-tree gardens generallyhas different preferences.
Homegardens. As in the bamboo-tree garden, there is a high degree of species variability amonghomegardens in the study villages. From the total sample pairs being compared, only one samplepair has a value of SI >50 percent (i.e., in Sukapura).
The variability of domesticated species in the homegarden samples is greater than the variabilityof wild plants. For example, comparison of sample pairs for domesticated species in home-gardens in Sukapura shows one pair with a value of SI >50 percent, while for wild species thereare up to thirty-six pairs with SI values of 50 percent or more. A somewhat similar result isobtained in homegardens in Wangisagara and Ranca Kasumba. The overall results indicate that,in general, wild plants found in homegardens are more homogeneous than the domesticates.Only wild species are capable of adapting to the stressful environmental conditions of thehomegardens in the study area.
Species Variability between Land-use Types and between Villages. The Similarity Indexanalysis shows that species composition between the same land-use type in different villages ismore similar than that of two different land-use types in the same village. This indicates thatsimilarity in function has caused land-use types in different villages to exhibit, to some extent,similar species composition. On the other hand, species similarity between homegardens andbamboo-tree gardens in Sukapura is higher than that in the other two villages.
When all the species found in homegardens and bamboo-tree gardens are combined for eachstudy village, the species similarity between Ranca Kasumba and Wangisagara is the highest,while between Sukapura and Ranca Kasumba it is the lowest. Sukapura village, situated at anelevation above 1,200 m above sea level (asl), has different climatic conditions than the othertwo villages. Climatic conditions influence farmers' preference in selecting the crops being culti-vated. On the other hand, the climate in Wangisagara and Ranca Kasumba is relatively similar,with both villages situated below 1,000 m asl.
Conclusion
Based on the results of vegetation analysis in bamboo-tree gardens and homegardens in the threestudy villages, we conclude that the two types of land use show some differences in terms ofcomposition, structure of vegetation pattern, and species diversity (Appendix Table 2.11). Landuses with similar functions tend to exhibit similar structures, even when composition and speciesdiversity show small differences. With regard to the maintenance of biodiversity conditions, thefunction of each land-use type is likely to have a significant contribution besides the existingenvironmental factor in the study area. Local people will maintain the presence of certain plantspecies or introduce new species, depending on the benefit they can obtain from them. However,these efforts are not without limiting factors such as the local climatic condition.
Basically, the diversity of land-use types and spatial heterogeneity within each land use in thestudy village is also accompanied by higher floristic diversity in that area. However, no singlefactor is responsible for the maintenance of biodiversity conditions in the three study villages.Instead, various abiotic and socioeconomic as well as cultural factors interact in complex waysand influence the conditions of biodiversity and its maintenance in the study villages. The
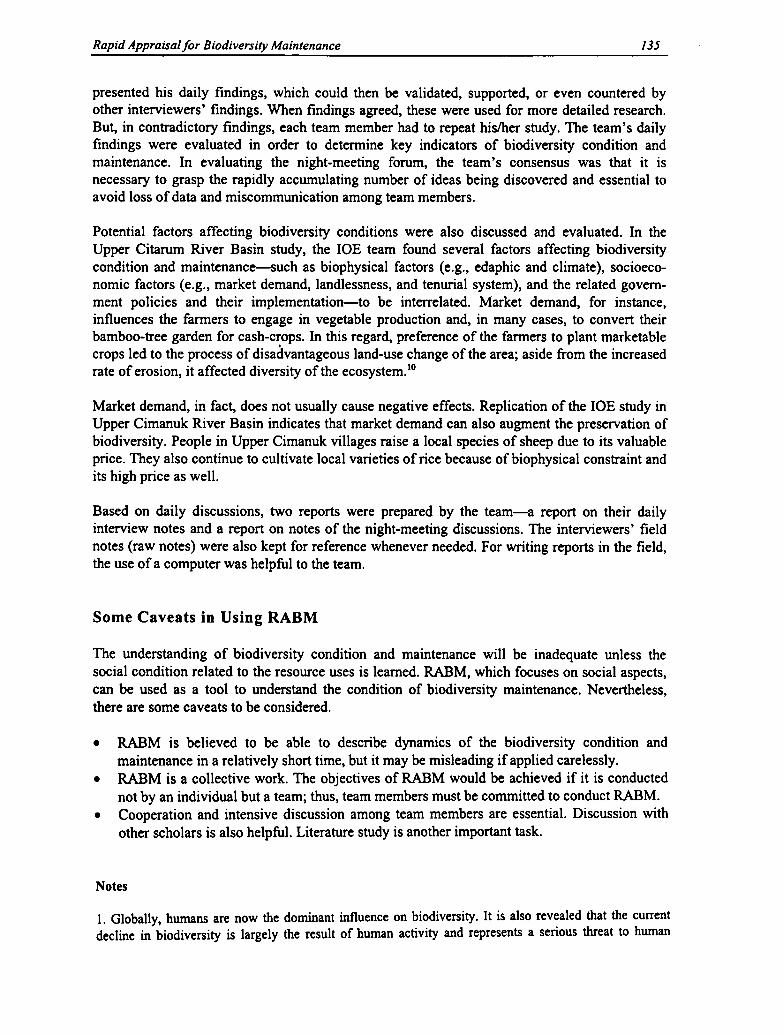
I'1iIt.. I'I; ling, anC Environs by E.cc't, pes (Aptil,1993)
De rees ^••..ti
Grid North
water
: I• i 1111111 1
riI :.. 'r' f c ir e t
mid-montane f orest
coconut:.
I 1 mixed 1if/ : i_i co
mixed Ef; ,Eic1 r c'
0 ri nixed bruoh i ,'grasL r'afiaraL:::Iand
mixed acaro
0 open ^:rc^^ _.-/firl^^ }
0 cper-i lL'uilt-upFigure 12.2 Land cover/land-use map.

36 Parikesit, Djuniwarti, and H. Y. Yadikusumah
strength of market influence has resulted in alteration of land-use patterns that ultimately affectthe floristic diversity of the area. In this respect, Wangisagara exhibited a somewhat slower rateof alteration than the other two villages. On the other hand, from the perspective of speciesdiversity as a whole, Wangisagara village exhibits the highest diversity compared with the othertwo villages.
The development of a market-oriented agricultural sector in Sukapura has caused a decrease inthe area of bamboo-tree gardens. The decrease is caused by the conversion of many bamboo-treegardens to cash-crop gardens. To some extent, the expansion of cash-crop gardens increasesbiodiversity (at the genetic level) because of the number of new domesticated species introduced.However, this introduction is accompanied by a decrease in diversity of local varieties that haveexisted for a long time in the traditional system. The decrease in the area of bamboo-tree gardensis accompanied by the loss of some species of plants associated with this land use. Unlike whatoccurs in Sukapura, the change of bamboo-tree gardens in Ranca Kasumba occurs due to devel-opment of off-farm activities, namely the red-brick industry. The development of this industry,although it does not always change the whole structure of bamboo-tree gardens, to some extentaffects the environmental conditions of bamboo-tree gardens, particularly with regard to itsstructure and the species diversity at a particular stratum. For example, the lower strata in thebamboo-tree gardens in Ranca Kasumba are cleared for establishing the brick factory.
In addition to the development in the agricultural sector affecting the study area, populationgrowth and increasing land scarcity are important factors in the fragmentation of bamboo-treegardens and homegardens. Although the effect of fragmentation on both biological and physicalconditions in the two types of gardens is very hard to quantify, qualitatively it can be detected.The fragmentation of homegardens in Sukapura into smaller sizes, for instance, has altered thevertical structure of vegetation in that type of land use from a complex to a simple structure. Thissimplification of vegetation structure will, to some extent, affect the community structure of thefauna that use those gardens for their habitat.
Notes
1. A bamboo-tree garden is a piece of land planted with various species, mostly perennials, of differentfunctions such as bamboo, fruit trees, and construction materials.2. In this study the term "domesticated" is used to indicate all plant species intentionally planted by thelocal inhabitants, or the plant was initially established by itself but then its presence is maintained by thelandowner.3. The term "materials" is used for plants that function mainly as construction materials and/or fuelwood.
References Cited
Abdoellah, 0. S. 1990. Homegardens in Java and their future development. In Tropical homegardens, ed.K. Landauer and M. Brazil. Tokyo: The United Nations Univ.
Abdoellah, 0. S., Karyono, H. Isnawan, H. Y. Hadikusumah, Hadyana, and Priyono. 1978. The structure ofhomegardens in Desa Selajambe and Desa Pananjung. Institute of Ecology, Padjadjaran Univ., Bandung (inIndonesian).
Anderson, W. P. 1976. Weed science principles. New York: West Publication.

Grid
Sampling Windows for Fragmentation Analysis
Degrees
North
water
Forest
Q non-foresk
A Pirting Lupa (grassland)P. Peak (mossy forest)C. Dampalit (mid-montane 1 ore t)D. Trail (mid-montane forest)E. S imsim (grassland)F. Bagong Silang (agro-forest)0. Bagorig Silarig II (agro-forest)
Figure 12.3 Location of sampling windows.
0.02

Structure and Floristic Diversi ty of Man-made Ecosystems in Upper Citarum River Basin 37
Baker, A., and R. C. Bakhuizen Van Den Brink. 1965. Flora of Java (spermatophytes only). Vol. 2,Angiospermae families, pp. 111 -60. The Netherlands: N.V.P. Noordhooff, Groningen.
Christanty, L. 1990. Homegardens in tropical Asia, with special reference to Indonesia. In Tropicalhomegardens, ed. K. Landauer and M. Brazil. Tokyo: The United Nations Univ.
Fitter, A. H., and R. K. M. Hay. 1981. Environmental physiology of plants. London: Academic Press.
Karyono. 1981. The structure of homegardens in rural areas of Citarum watershed, West Java. Diss.,Padjadjaran Univ., Bandung (in Indonesian).
. 1990. Homegardens in Java: Their structure and function. In Tropical homegardens, ed. K.Landauer and M. Brazil. Tokyo: The United Nations Univ.
Karyono, S. Ambar, A. Ramlan, H. Ahmad, 0. S. Abdoellah, Priyono, and I. S. Noer. 1978. Ecologicalstudy of homegardens in rural areas of Citarum watershed: The structure of homegardens. Institute ofEcology, Padjadjaran Univ., Bandung.
Klingman, G. C. 1982. Weed science: Principles and practices. New York: John Wiley.
Loveless, A. R. 1991. Principles of plant biology for tropics. Translated by K. Kartawinata, S.Danimiharja, and U. Soetisna. Jakarta: PT, Gramedia.
Magurran, A. E. 1988. Ecological diversity and its measurement. New Jersey: Princeton Univ. Press.
McNeely, J. A., M. Gadgil, C. Leveque, C. Padoch, and K. Redford. 1995. Human influences on biodiver-sity. In Global biodiversity assessment, ed. V. H. Heywood. Cambridge: Cambridge Univ. Press.
Michon, G., and F. Mary. 1994. Conversion of traditional village gardens and new economic strategies ofrural households in the area of Bogor, Indonesia. Agroforestry Systems 25:31-58.
Sarief, S., K. Ridwan, E. P. Hadi, Purnomowati, D. Purnomo, D. Suroto, R. A. Muchni, M. Djajadisastra,A. Ramlan, S. Ambar, J. Iskandar, P. Santoso, P. Budiriyanto, and Y. Arifm. 1981. Integrated field diagno-sis in erosion-prone environment. Institute of Ecology, Padjadjaran Univ., Bandung.
Soemarwoto, 0., and I. Soemarwoto. 1981. Homegardens in Indonesia. Institute of Ecology, PadjadjaranUniv., Bandung.
1984. The Javanese rural ecosystem. In An introduction to human ecology research onagricultural systems in Southeast Asia, ed. A. T. Rambo and P. E. Sajise. Philippines: Univ. of thePhilippines at Los Banos.
Tjitrosoepomo, G. 1988. Plant morphology. Yogyakarta: Gadjah Mada Univ. Press (in Indonesian).
Van Der Pijl, L. 1982. Principle of dispersal in higher plants. Heidelberg: Springer Verlag.
Widagda, L. C., 0. Abdoellah, G. Marten, and J. Iskandar. 1984. Traditional agroforestry in West Java:The pekarangan (homegarden) and kebun-talun (perennial-annual rotation) cropping system. Honolulu:East-West Center.
Widjaja, E. A. 1986. Research on bamboo resource in Indonesia: Prospect of utilization and development.Bogor: Center for Research and Development of Biology, Indonesia Research Institute (in Indonesian).

DampalitMid-montane Forcslf=0.06287D=1.23627d-0.09537Q-0.90544
Bagong Silang 2Agro-forestn
• Arca
f-0.7308D-I.43567d-0.67474QL.32554
Mid-montane Forest Pcakf-0.00173 Mossy ForestD
= I f=0.01053
d-0.00346 D=1.S 1196Q-0.9974 d=0.01381
Q=0.98701
Bagong SilangAgro-forcsty Areaf=0.47884D-1.38039d=0.51313Q-0.48528
Puling LupaGrasslandf=0.36903D=1.2981d-0.60963Q-0.39072
SaimsimGrassland(=0.68877D=1.21492d=0.72371Q-0.27654
Landscape Fragmentation Index Using GIS 289
Non-forest Patches on a Forested Landscape
Ut
P
Figure 12.4 Sampling windows with locale, ecotype, fragmentation index (f), fractal dimension(D), patch density (d), and quadrat coefficient (Q).
to estimate patch shape complexity, approximating D =1 with (2-c) where c=0.886154 calculatedusing the CRATIO module. But the corresponding absolute change in the fragmentation indexwas only 0.0001972, which at the most only affected the fourth decimal place in the results of allthe regression analyses involving the fragmentation index. Thus, the overall impact of the changein estimating the patch shape parameter in this one site was insignificant.
Regression Analyses
Components of the Model. Since patch density and the quadrat coefficient are inversely related,they have almost equivalent coefficients and are strongly (Table 12.2, r 2=0.9944) and signifi-cantly (P=0.0000465) related to the fragmentation index, although the relationship is direct in thecase of patch density and inverse in the case of the quadrat coefficient. Thus patch density anddistribution have a high impact on the fragmentation index, as we would expect. In contrast andas mentioned earlier, the relationship of the fractal dimension to the fragmentation index is weak(r2=0.2365) and insignificant (P=0 .6095). This justifies our earlier decision to compromise theestimate of patch shape complexity rather than compromise the biodiversity measures of thesample. Also, it reinforces our belief that as long as the density of the patches remains relativelyunchanged over a landscape, we can increase or decrease the size of the sample window toimprove data representation within the area without too much regard for the complexity of theshapes of the patches. So the decision as to the size of the sample window to use should beguided by how well the windows represent the populations within it, rather than the spatial

Appendix Table 2.1 Number of domesticated and wild species found in bamboo-tree g ardens and homegardens of three study villages
Sukapura Wangisagara Ranca Kasumba
Bamboo-tree gardens Homegardens Bamboo-tree gardens Homegardens Bamboo-tree gardens Homegardens
T S H TI T S H TI T S H Ti T S H T1 T S H TI T S H Ti
D 21 12 7 40 33 32 54 119 32 5 6 43 53 36 64 153 27 6 11 44 40 32 55 127
W 15 20 51 86 3 48 51 18 18 48 84 4 48 22 11 29 53 93 4 17 21
T1 36 32 58 126 33 35 102 170 50 23 54 127 53 40 102 175 38 35 64 137 40 36 72 148
Notes: T = Tree; S = Shrub; H = Herb; TI = Total; D = Domesticated; W = Wild.
Appendix Table 2.2 Range and average number of species in bamboo-tree gardens and homegardens o f three study villages
Sukapura Wangisagara Ranca Kasumba
Bamboo-tree gardens Homegardens Bamboo-tree gardens Homegardens Bamboo-tree gardens Homegardens
Range Average Range Average Range Average Range Average Range Average Range Average
Domesticated 2-20 7.6 10-40 20.67 2-18 8.4 5-74 26.60 2-18 7.7 6-42 20.27
Wild 7-27 17.5 3-17 10.27 3-27 17.2 0-14 6.20 3-26 15.1 0-10 2.13
Total 13-32 25.3 19-53 30.93 5-38 25.6 7-83 32.87 10-40 22.9 6-24 22.40
38
290 Dante Gideon K. Vergara
characteristics of the patches themselves. Needless to say, the size of the windows must be moreor less uniform within a single study, to rule out any biases that varying sample window sizesmay introduce.
Table 12.2 Summary regression coefficients and probabilities
r squared P
f x D 0.055959 0.60955062
f x d 0.9888591 0.00000447 **
f x Q 0.988863 0.00000446 **
f x (D, d, Q) 0.9945032 0.00069072 **
d x Q 1 5.39E-24 ** m=-1.00086
*Significant at 10% level**Significant at 5% level.
Overall, the fragmentation index is highly (r2=0.9972) and significantly related (P =0.00069) toits components if taken together. This speaks well for the robustness of the model for estimatingpatchiness in the landscape, in that the degree of landscape patchiness can be well explained interms of patch density, distribution, and shape complexity.
Patch density is very significantly (P=5.39E-24) but inversely (m=-1.00086) related to thequadrat coefficient. The perfect relationship (r 2= 1) is in fact expected, since the quadrat coeffi-cient is the ratio of the patch density mean to its variance. This perfect relationship, however,raises the possibility of autocorrelation between the two components of the model. An alternativemodel was thus investigated, by omitting patch density, in the hope that the quadrat coefficientand the fractal dimension would account for the variation in patchiness. Table 12.3 shows thecorresponding alternative fragmentation indices (f') and the results of the regression with theoriginal fragmentation indices (f). Although the resulting association was fairly high (r2=0.6318),it was not at all significant (P=0.1277); thus, the alternative index does not estimate the degree of
Table 12.3 Fragmentation index (f) and alternative index (f') of theseven sampling sites
Locale f f'
Mid-montane 0.00173225 0.001929459 f = (D*d)/(1+Q)
Mossy forest 0.01053193 0.760922688
Dampalit 0.06287489 0.087271378 f' = D/(1+Q)
Bagong Silang 0.47884069 0.929513404
Puting Lupa 0.56902784 0.933404803 r squared = 0.6318
Saimsim 0.68877327 0.951728147 P = 0.1277 n.s.
Bagong Silang 2 0.73079827 1.083081284

Appendix Table 2.3 Total and average number of species/individuals of domesticated and wild species in bamboo-tree gardens based on their function
Sukapura Wangisagara Ranca Kasumba
Domesticated Wild Domesticated Wild Domesticated Wild
Species Individuals Species Individuals Species Individuals Species Individuals Species Individuals Species Individuals
# R # R # R # R # R # R # R # R # R # R # R # R
Vegetables 7 0.80 36 2.40 7 2.13 363 24.33 6 1.00 32 213 6 0.73 11$ 7.67 6 1.27 51 3.40 12 2.07 581 38.70Fruits 4 0.67 68 4.53 I 0.13 5 0.33 6 1.07 45 300 3 0.87 51 3.40Food 6 0.67 127 8.47 3 0.20 1 7 1.13 3 0.67 141 9.40Medicine 2 0.13 3 0.20 10 2.27 40.35 26.90 1 0.07 45 3.00 6 0.73 3612 240.80 I 0.07 3 0.20 6 1.07 809 53.90Spice 20 3 0.27 6 0.40Industrial 3 0.20 3 0.20 1 0.33 215 1.33 1 020 6 040 I 007 1 0.07Ornamental 5 0.33 5 0.33 S 1.13 14.33 4 0.60 24 1.60 4 0.47 31 2.07 2 0.20 24 1.60Fencer 6 1.00 282 1 880 701 3 I 33 232 15.47 4 0.33 82 5.47Materials 10 4.00 862 57.47 23 5.00 3549 46.73 9 447 549 3660 22 5.87 5956 397.07 1 E 4.13 362 24.13 20 3.67 657 43.80Unknown 25 6.40 236.60 33 9.07 2283E 1522.53 2E 11.73 6340 422.67
Appendix Table 2.4 Average number of species/individuals per stratum in bamboo-tree gardens
Sukapura wangisagaa Rrrca Katumba
Tree Shrub Herb Taal Tree Shrub Herb Total Tree Shrub Herb TOW
Stratum Sp. Ind. Sp. Ind. Sp. Ind. Sp. Ind. Sp. In Sp. Ind, Sp. Ind Sp. Ind Sp. Ind. Sp. Ind. Sp. Ind. Sp. Ind.
<I m 3.73 324 4.33 57.9 1193 3734 19.99 463.7 3.87 32.4 680 882.0 E47 1118.0 19.14 2032.4 1.27 5.5 6.20 2062. 9.07 368.6 16.54 5803
1 -2 m 2.93 9.3 0.07 0.9 0.13 0.7 3.13 10.9 2.33 64 027 1.1 0.27 1.2 3.07 8.7 0.87 I.5 0.33 5.0 0.47 11.7 1.67 18.2
2-5m 2.80 243 007 0.4 0.20 03 3.07 27.0 2.93 5.7 013 02 0.20 22 3.26 81 1.13 2.4 033 0.4 060 2.8 2.06 5.6
5- 1 0 m 2.60 136 260 13.6 320 II.3 3.20 11.3 2.20 6.6 0.07 1.3 2.27 7.9
> 1 0 m 2.40 8.5 240 8.5 247 61 2.47 6.1 3.27 16.9 3.27 16.9
Notes: Sp. = Species; Ind. = Individuals.
39
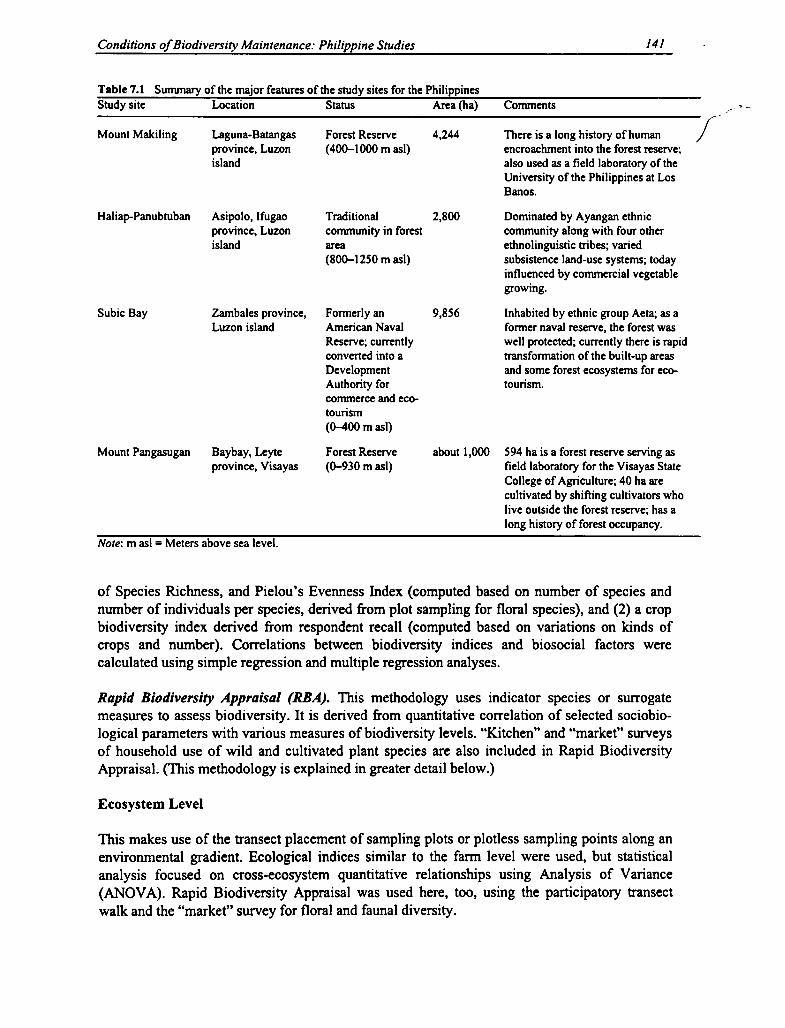
Landscape Fragmentation Index Using GIS 291
patchiness as well as the original model. Also, the alternative model is not as well behaved as itslimits are wider.
The fractal dimension is insignificantly (Table 12.4, P=0.6497) and poorly (r 2=0.2109) related toeither the patch density or the quadrat coefficient. Again, this is to be expected, since you canhave infinitely many shapes for patches even if their density is held constant. Putting it anotherway, since patch density is the ratio of the number of patch pixels to the total number of pixels inthe window, there are infinitely many ways to rearrange a given number of pixels in the window(shape-wise and distribution-wise) without changing the density. As for the quadrat coefficient(distribution) and the fractal dimension (shape complexity), given a fixed number of pixels in afixed number of patches (constant density), you can move the patches around and change theirdistribution in space but still retain their shapes; or you can change their shapes without movingtheir relative locations.
Table 12.4 Summary regression coefficients andprobabilities for fractal dimension (D) with patchdensity (d) and quadrat coefficient (Q)
r squared P
D x d 0.0445091 0.64976 n.s.
D x Q 0.0445101 0.64976 n.s.D x (d, Q) 0.0514443 0.89976 n.s.
This is also true when we take patch density and distribution together and relate it to shapecomplexity. The inverse relationships (m,=-1562.05 and m 2
=-1560.81) between the fractaldimension on the one hand and patch density and distribution on the other hand are poor(r' 0.2268) and very insignificant (P=0.8997). This means that given a fixed shape for thepatches, you can add to or deduct pixels from them and even move them around withoutchanging their relative shapes. Or given a fixed number of pixels and fixed positions of thepatches in space, if you rearranged the contiguous pixels within each patch, you can actuallychange the patch shapes without changing their densities or distributions.
Biodiversity Indices and Other Ratios. The Shannon-Weiner indices of flora and fauna diversity,as well as the ratio of endemic to total faunal species from Chapters 7 to 11 were regressed withtheir corresponding fragmentation indices and presented in Table 12.5. There were seven sitesfor the floral studies and five sites for the faunal studies. The relationships shown are quite loose,with 10 percent being the best level of significance attainable. The relationships with faunalendemism was the highest (r2=0.8547), followed by floral diversity with five samples(r2=0.8121), and then with seven samples (rZ=0.6976). The relationship with faunal diversity isvery poor (r2=0.3508) and insignificant (P=0.5626). The poorness of fit means that therelationships between fragmentation on the one hand, and biodiversity and endemism on theother are not linear, although an inverse trend is apparent. Investigating the behaviors of theirgraphs may reveal more insights into their relationships than do the regressions.

Appendix Table 2.5 Correla tion between species/individual number and l and area of bamboo-tree gardens
Spearman's Coefficient (r')
Sukapura Wangisagara Ranca Kasumba
Species Individual Species Individual Species Individual
Domesticated -0.32'• -0.20•• 0.26'• 0.44•• 0.65 0.71Wild 0.27" 0.39'• 0.69 0.77 0.14•• 0.31 ••Total 0.13'• 0.31" 0.58• 0.75 0.36'• 0.40••
Notes: 'Significant correlation at 10% level."Significant correlation at 5% and 10% levels
Appendix Table 2.6 Mean Diversi ty and Evenness Indices of domesticated and wild species in bamboo-tree gardens
Sukapura Wangisagara Ranca Kasumba
H E H E H E
Range Average Range Average Range Average Range Average Range Average Range Average
Domesticated 0.17-1.86 1.19 0.25-0.85 0.64 0.49-1.78 1.27 0.23-0.76 0.64 0.18-1.99 1.18 0.26-0.77 0.61Wild 0.91-2.74 2.09 0.47-0.89 0.74 0.79-2.38 1.95 0.56-0.83 0.72 0.45-2.81 1.78 0.41-0.91 0.67Total 1.57-2.90 2.40 0.61-0.86 0.75 1.70-2.46 2.18 0.54-0.78 0.70 1.32-2.98 2.12 0.55-0.81 0.69
Notes: H = Brillouin's Diversity Index; E = Evenness Index.
40

292 Dante Gideon K. Vergara
Table 12.5 Summary of regression coefficients andprobabilities for fragmentation index and measures ofbiodiversity and faunal endemicity
n r squared P
Flora x f (7 sites) 7 0.486769 0.081352729
Flora x f (5 sites) 5 0.65953 0.094959616Fauna x f 5 0.123088 0.562638885 n.s.Faunal endemism x f 5 0.730665 0.064958768
*Significant at 10% level
Figure 12.5 shows the relationship of floral and faunal biodiversity to fragmentation for the fivesample plots. Here we see the familiar inverted "U" shaped curve skewed to the left. Aspatchiness increases in the natural forest, biodiversity gradually increases as well. But furtherincreases in fragmentation in the more human-influenced areas bring biodiversity downdrastically. This relationship perhaps points to a threshold level for biodiversity with respect topatchiness. The graph for endemism and fragmentation (Figure 12.6) shows that as we movefrom the natural forest to the grasslands, endemism decreases geometrically. Within the mid-montane forests, faunal endemism is relatively stable even when patchiness varies. But withinthe mossy forest, endemism seems to be enhanced by a factor other than fragmentation, possiblyaltitude or isolation, since endemism in the mossy forest is higher even though the patchinessindex of the mossy forest lies between that of the mid-montane forest sites. Generally though,endemism dramatically drops as forest cover is reduced. Figure 12.7 shows the relationship offloral diversity to patchiness in the seven sites. The graph shows a wider range of patchiness inthe agroforestry areas than in the grasslands; yet, the biodiversity levels in the agroforestry areasare consistently higher than in the grasslands. So there must be other factors involved inmaintaining and enhancing biodiversity levels than just forest versus grassland cover. However,although biodiversity levels may be maintained in the grasslands and agroforestry areas despite awide variation in patchiness, endemicity is dramatically lower in these two areas. It is apparentthat nonendemic species are replacing endemic ones even when overall measures of diversity arebeing maintained.
Conclusion
Model Behavior
Our analysis showed that patchiness increases as patch density and shape complexity increase,and patch clustering decreases. All values for the quadrat coefficient and the fragmentation indexremained within the [0,1) range. It would have been interesting to see how the model behaved ifthe patches were clustered, but this opportunity was not afforded during this study. Due to thenature of the patches, such an investigation would entail a larger sampling window for this studysite and thus more sampling points, or a different study site with more clustered patches.
Another issue that would be worth looking into is whether the model is exhaustive and mutuallyexclusive. Putting it another way, since the fragmentation index for the nonforest patches is

Appendix Table 2.7 Total and average number of species/individuals of domesticated and wild species in homegardens based on their func tion
Sukapura Wangisagara Ranca Kasumba
Domesticated Wild Domesticated Wild Domesticated Wild
Species Individuals Species Individuals Species Individuals Species Individuals Species Individuals Species Individuals
# R # R # R # R # R # R # R # R # R # R # R # R
Vegetable 22 3.47 167 11.13 2 0.27 16 1.07 27 4.73 392 26.13 3 0.67 22 1.47 22 3.53 271 18.07 4 0.20 1 6 1.07Fruit 15 3.53 194 1 2.93 1 7 4.33 591 3940 14 2.80 57 3.80
Food 5 1.20 221 1473 6 0.93 117 7.80 3 0.40 17 1.13
Medicine 4 0.33 10 0.67 6 1.73 821 54.73 9 1.13 51 3.40 5 0.87 96 6.40 5 0.67 22 1.47 1 0.07 1 0.07
Spices 4 0.73 26 1.73 4 1.00 42 2.80 7 0.33 30 2.00
Industrial 2 0.47 1 6 I.07 3 0.20 4 0.27
Ornamental 63 1 0.27 1411 94.07 79 13.60 1120 74.67 73 11.87 877 38.47
Materials 4 0.80 31 2.07 6 0.67 19 1.27 3 0.40 20 1.33
Unknown 27 8.67 3830 233.30 16 4.67 1887 123.80 14 1.67 465 31.00
Notes: # = Total number; = Average.
Appendix Table 2.8 Average number of species/individuals per stratum in homegardens
Sukapura Wangisagara Ranca Kasumba
Tree Shrub Herb Total Tree Shrub Herb Total Tree Shrub Herb Total
Stratum Sp. Ind. Sp. In Sp. In Sp. In Sp. Ind. Sp. Ind. Sp Ind. Sp. Ind. Sp. Ind. Sp. Ind. Sp. Ind. Sp Ind.
< I m 247 13.1 5.87 55.2 18 40 348.6 26.74 4169 333 9.1 8.07 56.7 15.60 62.9 27.00 128.7 3.47 5.9 4.93 38.7 9.40 60.3 17.80 1 049
1.2m 060 0.8 013 0.3 007 0.1 080 1 2 1.00 1.3 047 26 0.60 2.6 207 63 047 05 0.33 0.3 013 1 0 093 1 8
2.5m 3.00 6.2 0.40 1 3 0.87 28 4.27 103 2.80 3.3 027 0.5 3.07 58 1 47 2.7 0.60 4.5 0.20 0.7 227 7.9
5- 1 0 m 1.13 20 040 1.1 1.53 31 3.13 3.9 0.13 0.3 3.26 62 0.93 1.6 013 02 1 06 20
> 10 m 0.13 0.1 0.13 0.1 0.60 0.8 060 0.8 040 06 040 06
Notes: Sp. = Species; Ind. = Individuals.
4/
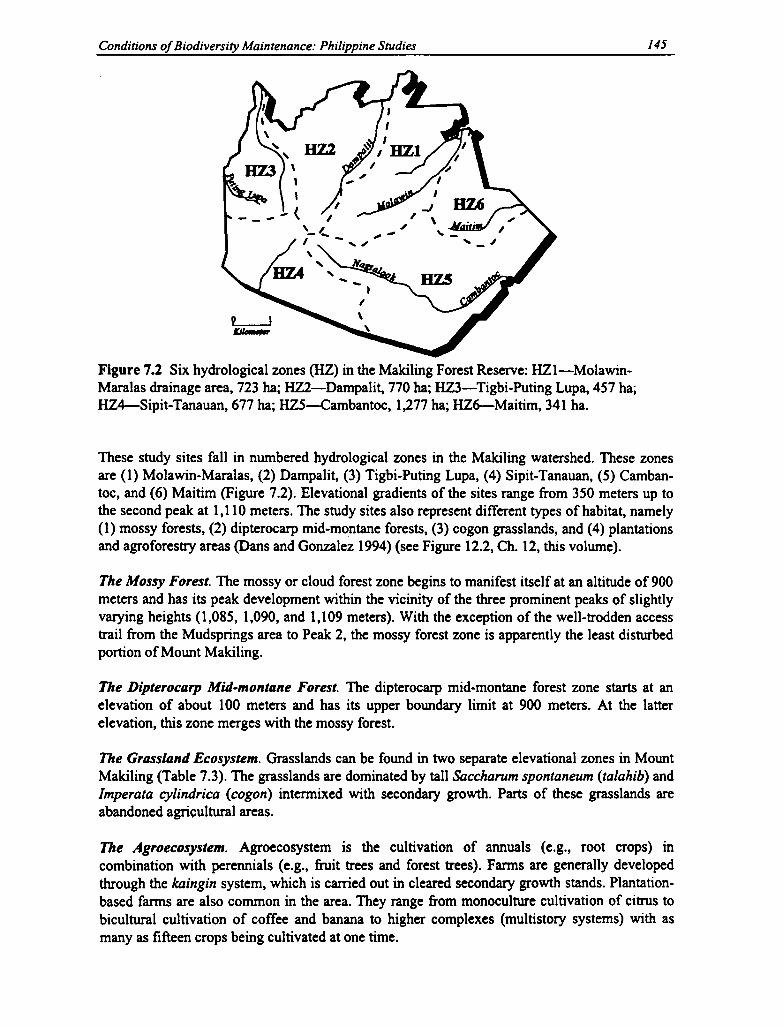
5
• 4.5
4
3.53
2.5
2
1.5
1
0.5
0
-- — flora
—tom fauna
Landscape Fragmentation Index Using GIS 293
biodiversity x fragmentation
0.8
0.7
0.6
0.5
E 0.4
a 0.3
0.2
0.1
0
0 0.1 0.2 0.3 0.4 0.5 0.6
f
Figure 12.5 Biodiversity and fragmentation (five sites).
endemic if
.^" My y$.fi . ,?7kw rG^,' r '^^d'_X`. b̂A ^'^ Y "''^'r?..^ tf r..
;y"Y '\ ' 4. p ,"dry #.,.
'^C ' s ix i T'.:r..; ' ^^s. yx > ,G ̂ ' ^... r
0 0.1 0.2 0.3 0.4 0.5 0.6
f
Figure 12.6 Endemicity and fragmentation.
--t—endemic — —

Appendix Table 2.9 Correlation between species/individual number and land area of homegardens
Spearman's Coefficient (r')
Sukapura Wangisagara Ranca Kasumba
Species Individuals Species Individuals Species Individuals
Domesticated 0.56* 0.58* 0.73 0.86 0.46* 0.50*Wild 0.53* 0.48* 0.69 0.86 0.44** 0.41**Total 0.66 0.56* 0.81 0.90 0.59* 0.69
Notes: *Significant correlation at 10% level.**Significant correlation at 5% and 10% levels.
Appendix Table 2.10 Mean Diversity and Evenness Indices of domesticated and wild species in homegardens
Sukapura Wangisagara Ranca Kasumba
H E H E H L
Range Average Range Average Range Average Range Average Range Average Range Average
Domesticated 1.54-2.57 2.02 0.25-0.85 0.64 1.05-3.31 2.15 0.23-0.76 0.64 0.70-2.68 1.82 0.26-0.77 0.61Wild 0.66-2.32 1.73 0.47-0.89 0.74 0.00-1.71 0.97 0.56-0.83 0.72 0.00-1.11 0.24 0.41-0.90 0.67Total 1.70-3.01 2.45 0.61-0.86 0.75 1.39-3.18 2.31 0.54-0.78 0.70 0.70-2.77 1.86 0.55-0.81 0.69
Notes: H = Brillouin's Diversity Index; E = Evenness Index.
42
0 0.1 0.2 0.3 0.4 0.5 0.6 0.7 0.8
f
- i
0.5
0
294 Dante Gideon K. Vergara
flora x f (seven sites)
4
3.5
3
2.5
x 2 ^z yfi` ,.,^ 1 s t flora
1.5
Figure 12.7 Floral diversity vs. fragmentation Index
bounded within [0,1), if we subtract this from 1, do we get the corresponding fragmentationindex for forest patches? If so, the implications would be immense. For example, if we suspecteda bias in the estimate of any of the model parameters, we could compute for the complementaryindex and subtract this from 1 to get the desired fragmentation index. It would be simple in thecase of the present study to reverse the point of view and compute the fragmentation indices offorest patches to see if together with the complementary indices they added up to 1 for eachsample site. Unfortunately, even if they did add up to 1, this still would not be sufficient to proveexhaustivity nor mutual exclusivity.
Policy Implications
The results from the regression analysis and the graphs between patchiness, biodiversity, andendemicity point out two things. First, there is some positive association between patchiness andbiodiversity. Increasing patchiness in the natural forest landscape increases biodiversity slightly;but beyond a certain point increasing patchiness in the landscape results in dramatic decreases inbiodiversity. It would be interesting to investigate whether or not a threshold value really doesexist with the tools we now have in hand. Such a study should also consider the size andproximity of the natural reservoir (in this case, the forest) from which resources can be drawn toenhance or maintain diversity. The maintenance of relatively high levels of flora in theagroforestry areas, in the face of high levels of habitat fragmentation, shows that humanperturbation may contribute to the maintenance of high levels of diversity (though at the expenseof faunal endemism). Relatively high levels of plant diversity are also maintained in thegrasslands even with high levels of fragmentation, possibly underscoring an anthropogenic factorfor plant diversity maintenance in the grasslands, although probably not as direct as in theagroforestry areas.
Second, the data on endemism show that when faunal biodiversity increases as patchiness isincreased, endemism is actually reduced. This agrees with other findings on species loss andfragmentation (Kruess and Tscharntke 1994). However, we should also keep in mind that some

Appendix Table 2.11 Summary of structural and functional differences between bamboo-tree gardensand homegardens
Criterion Bamboo-tree gardens Homegardens
1. Location
2. Building
3. Maintenance
4. Function
5. No. of domesticatedvs. wild species
6. Growth forms
7. Diversity index
8. Presence of wildplants
Out of settlement
None (except red-brick industry inRanca Kasumba)
Less intensive
Construction materials and fuelwoodGene poolSoil and water conservationCommercial and subsistenceproductionSocialHabitat of certain fauna (birds)
Domesticated < wild
Trees dominant
Domesticated < wild
Considered not disturbing aesthetics
In settlement
Yes (house)
More intensive than bamboo-treegardens
AestheticGene poolSoil and water conservationCommercial and subsistenceproductionSocial
Domesticated > wild
Herbs dominant
Domesticated > wild
Considered disturbing aesthetics
43
Landscape Fragmentation Index Using GIS 295
context specific factors may have been at work here, as no large grazing mammals that wouldnormally be at an advantage in patchy landscapes were observed during the study periods.
For the planning and management of forest reserves with resident settlers in a manner designedto maximize biodiversity conservation, the results presented here reinforce the concept ofleaving the major portion of the forest reserve intact and regularly shaped to act as a biologicalresource pool. Clearings should be distributed in the buffer zone in as sparse, discontiguous, andclustered manner as possible. Clustering the clearings will leave more space untouched forwildlife habitat. Clearing large, contiguous tracts of forest should be avoided. Preferably theclearings should be regular in shape, square and circular, as opposed to long and thin or othercomplex shapes. However, our results suggest that the density and distribution of the patches orclearings are more important than their shape.
Notes
1.Author's e-mail address: [email protected]. One may argue about the merits of using the mean of the compactness ratios of the polygons to deal witha group of them. Unfortunately, this is beyond the scope of this paper, but such an investigation might bepursued if the proposed index stirs enough interest.3. Initially the IDRISI version 4.1 that ran under DOS was used, then later the IDRISI for Windows version1.0 was used.
References Cited
De Cola, E. 1989. Fractal analysis of a classified landsat scene. Photogrammetric Engineering and RemoteSensing 5(5): 601-10.
Eastman, J. R. 1993. IDRISI update manual version 4.1. Clark Labs for Cartographic Technology and Geo-graphic Analysis, Clark University, Worcester, Massachusetts.
1996. IDRISI for windows user's guide. Clark Labs for Cartographic Technology and GeographicAnalysis, Clark University, Worcester, Massachusetts.
Forman, Richard T. T., and Michel Godron. 1986. Landscape ecology. New York: John Wiley.
Kruess, Andreas, and Teja Tscharntke. 1994. Habitat fragmentation, species loss, and biological control.Science 264 (10 June).
Lachowski, H. n.d. Guidelines for the use of digital imagery for vegetation mapping. The Forest ServiceRemote Sensing Steering Committee, Integration of Remote Sensing in Nationwide Forestry ApplicationsProgram, Salt Lake City, Utah.
Monmonier, M. S. 1984. Measures of pattern complexity for chloropleth maps. The American Cartogra-pher 1(2): 159.


Chapter 3
Spatial Aspects of Community Structurein Mount Wayang Forest
Parikesit, Fani Wiardi, and Djuniwarti
Introduction
Background
Data concerning current total forest acreage in Indonesia vary among available sources;however, an estimated 110 million hectares of land in Indonesia is still covered by closed canopyforest. Forty-nine million of total forest area is located in parks and other special reserves, andthe remaining acreage is designated as production forest (World Bank 1994). Nevertheless, aspressure on Indonesia's existing forest is increasing due to population growth and continuingdemand on forest resources, will that figure persist for a few decades to come? This remains abig question for any party and gives much concern regarding biological conservation inIndonesia. Forest exploitation has been destructive because its existing regulations are oftenignored, causing deforestation at approximately 0.5 percent per year from 1981 to 1990 (Riswanand Hartanti 1995).
The magnitude of floristic diversity in the tropical forest of Indonesia is widely known. Thehigher degree of diversity and species endemism (particularly in fauna) is primarily due to thegeographical position of the country and its high number of islands—each with unique environ-mental conditions. Indonesia's tropical forest houses, among others, 10 percent of the world'sflowering plant species, 12 percent of the mammal species, and 17 percent of the bird species.With regard to diversity of insects, no accurate data are available. Many experts believe that thecountry's forest possesses a great number of insects that are still unidentified. Apart from naturalecosystems such as a tropical forest, various land uses mainly in rural ecosystems play asubstantial role in the enrichment as well as impoverishment of biodiversity in Indonesia. Forestgardens and homegardens are among artificial land uses that house many native species(sometimes some species consist of more than one variety). These natural as well as artificialecosystems contribute to the maintenance of biodiversity in many parts of Indonesia.
The great diversity of floras and faunas in Indonesia's tropical forest is not without threat,however. Deforestation, forest fragmentation, habitat loss, population growth, high dependencyon forest resources (both at the national and local levels), the advent of modem agriculture, andland scarcity are among major factors that put current conditions of biodiversity in Indonesiaunder serious pressure. Therefore, biodiversity maintenance in a country such as Indonesia is nota simple matter. No single factor accounts for the higher diversity of flora as well as fauna inIndonesia's tropical forest. Apart from the complex interaction between bioclimatic and edaphicfactors, which are in general favorable for the co-existence of numerous living organisms toinhabit the country's tropical forest, many other important factors such as socioeconomic andcultural conditions (which are as diverse as the country's biodiversity itself) have made themaintenance of biodiversity more complicated. Moreover, the general impacts of the threats
45

Chapter 13
Biodiversity as an Indicator of Sustainabilityin the Ayangan Landscape of Haliap-Panubtuban,
Asipolo, Ifugao Province, Philippines
Mariliza V. Ticsay -Ruscoe
Introduction
Description of the Study Area
The study was conducted in several sitios (hamlets) of two contiguous barangays (villages) ofHaliap and Panubtuban in the newly established municipality of Asipolo (formerly southernKiangan) in the province of Ifugao (Figure 13.1). Ifugao is located in the Central Cordilleramountain range in north-central Philippines (17 0 N of the equator). Asipolo is located at about1,300 meters above sea level (m asl) in the main forest reserve along the southeastern portion ofthe main municipality of Kiangan. Barangay Panubtuban, which is located south of BarangayHaliap and accessible through Barangay Haliap, was formerly a sitio of Barangay Haliap until itdemanded its autonomy in 1989. The study site shall be generally referred to as Haliap-Panubtuban unless particular reference is made to a specific barangay. The succeeding discus-sions and descriptions are made for the two contiguous barangays comprising the study site. Thebarangays were purposively selected because they are inhabited by traditional ethnic commu-nities (viz., Ayangan-Ifugao) and represent the typical traditional, upland biophysical and socio-economic setting that is undergoing rapid transition in the Philippines.
Haliap-Panubtuban lies at an elevation of 800 to 1,200 m asl and is about 335 km north ofManila. Haliap-Panubtuban has a total land area of 2,800 hectares and 304 households with atotal population of 1,628. Ninety-nine percent of the population is Ayangan, which is one of thefive ethnolinguistic tribes of the Ifugao (i.e., Kalanguya, Kankana-ey, Tuwali, Ayangan, andHanglulo).
Haliap-Panubtuban has been the focus of development assistance from government agencies,non-governmental organizations (NGOs), religious and military groups, and professional andstudent researchers, which have influenced the community's pattern of resource use and manage-ment practices and thus the level and pattern of biodiversity.
The purpose of this study was twofold: (1) to identify indigenous mechanisms and other factorsthat enhance biodiversity conservation, and (2) to develop methodologies for analyzing thedynamics of productivity and sustainability of the traditional system at different hierarchicallevels (i.e., species, farm, landscape) using biodiversity as an indicator.
Resource Base and Patterns of Resource Use
Swiddening is the main occupation of the more traditional Ayangan-Ifugao who center theirannual agronomic activities on the preparation and planting of a variety of crops in the swidden.
297

46 Parikesit, Fani Wiardi, and Djuniwarti
mentioned earlier differ significantly among the three hierarchical levels of biodiversity (i.e.,genetic, species, and ecosystem).
Aware that various types of forests and their biotic as well as abiotic components are importantassets for sustainable national development, the government, along with many agencies fromlocal communities to private sectors, has begun to show more concern as to how biodiversity canbe conserved without neglecting the goal of the national economic development. Indonesia'scommitment on managing biodiversity for sustainable development is proven by some strategicsteps undertaken by the government, in cooperation with major institutions such as universities,non-governmental organizations, and the private sector. The government, with assistance ofthose major parties, has published, for example, Act No. 5/1990 concerning the "Conservation ofLiving Resources and Their Ecosystems," the "Tropical Forestry Action Plan of 1991," the"Biodiversity Action Plan of 1991," and the "Indonesian Strategy on Management of BiologicalDiversity." Important strategy has been set out for in-situ and ex-situ conservation within as wellas outside conservation areas, as noted in the Indonesian Biodiversity Action Plan published bythe Ministry of National Development Planning in 1993 (Sugandhy 1995).
Even though the Indonesian government has taken necessary action other than publishingdecrees, efforts to maintain higher biodiversity of numerous types of natural ecosystems found inthe lowland and highland areas face a great challenge. Forest encroachment is still occurring,sometimes at a skyrocketing rate as seen in many parts of remnant forest in Java where thepopulation density is among the highest in the world. Among the montane rainforest in Java—which currently is under serious pressure due to rapid development, particularly in the agricul-tural sector—is the secondary forest in Mount Wayang. This forest is a protected forest (forhydrological function within the Citarum River Basin system) and is currently being adminis-tered by the state forestry company (Perm Perhutani).
The mosaic of agroecosystems that surrounds this remnant "natural" forest in Mount Wayangmakes the forest look like a "forest island" within a "sea of agriculture." The presence of forestfragment "island" may be particularly important to maintaining the biodiversity of tropicalhighland reserves (Stiles 1988; Wheelwright 1983, cited by Guindon 1996). It is within thevicinity of the Mount Wayang secondary forest that the headwater of Citarum River is located.With its catchment area of 6,000 km 2, Citarum River Basin is the largest river in West Java. Thegreat potential of Citarum River Basin is indicated by various activities, such as agriculture,industries, and other nonforestry sectors. Agricultural development is the most significantactivity within the entire river basin. On the other hand, development of the industrial sector islikely to become very important, influencing significantly the lives and the livelihood of thelocal people. All these human activities extending from the uppermost part of the river basindownward have resulted in great pressure on the Citarum River Basin.
Until now, information on the spatial aspects of community structure in Mount Wayang foresthas not been available. Despite its limited acreage (approximately less than 1,000 hectares), theremnant forest in Mount Wayang is believed to house a large amount of biota of various formsand size and provide various resources that can be used by local inhabitants. Forest preservationin the upper Citarum River Basin is very crucial for water and soil conservation, which in turnwill affect the maintenance of regional biodiversity, in particular, and economic activitiesthroughout the river basin, in general.

298 Mariliza Y. Ticsay-Ruscoe
srvDY 12t°
,I S aittrLu n L^Zon a
_ 9- Q
PHILIPPINES - • • -.
i• Provincial capital ► 'y
a 1— — —Provincial boundary n0
Norte' Kaling -wVers -, _ Apayao /' Cagayan
• B.os„u
, Abra i'
t7° ocos S iI Ifugao ' Isabela
i •
r {
Lajawc
{L pion
' L.
;enq
Tti idad {
et , ueva { `
_ Vizcaya,'
all inan1io
Figure 13.1 Geographic location of Asipolo, Ifugao.

Spatial Aspects of Communi ty Structure in Mount Wayang Forest 47
Objectives
The objectives of the study carried out in the remnant forest in Mount Wayang and adjacentvillage were threefold:
• To describe the composition and structure of vegetation in Mount Wayang,• To describe the floristic diversity at different spatial scales, and• To identify forest resources used by local people and to what extent this usage affects forest
structure.
Methodology
In the present study, only one side of the mountain—that located within Citarum RiverBasin—was taken as the study area. Four transects were laid out subjectively within the studyarea crossing the altitudinal contour, from the foot toward the peak of the mountain (see Figure3.1). This was carried out in order to evaluate changes and differences in structural vegetationpatterns and species composition at different altitudinal intervals (zones). The subjectivedetermination of the transects was related to the topographical condition, which was relativelyextreme in some areas of the forest. Along' each transect a number of sampling points weredetermined at intervals of 50 m altitude. On each point a square quadrat of four different sizeswas established and data were collected. The data covered species names encountered in thequadrat, the number of individuals for each species, the stem diameter measured at breast height(only for tree categories), the percentage of the coverage (for shrubs and herbs categories), andthe individual height. These data were then used to calculate the species density, the speciesdominance, the species frequency, Importance Value Index, the Shannon-Weiner's DiversityIndex (Magurran 1988), Evenness Index, Simpson's Dominance Index, and Sorenson'sSimilarity Index (Mueller-Dombois and Ellenberg 1974).
To obtain data concerning activities of the local people in relation to the uses of forest resources,interviews with inhabitants of the nearest village to the forest were also undertaken using aninterview guide and interview schedule. In the latter technique, eighty household respondentswere randomly selected from the community living in Kampong, close to Mount Wayang. Byusing a list of households obtained previously, respondent selection was carried outsystematically and proportionally based on the number of cattle farmers and noncattle farmers.
Spatial Distribution of Vegetation in Mount Wayang
Horizontal Structure
The abiotic conditions such as topography and soil characteristics, the natural phenomena suchas tree falls, forest fragmentation, and other human disturbances in Mount Wayang are somemain factors that influence species composition, population structure (such as reduction inpopulation size and alteration of relative abundance of species), and the species diversity of thelocal vegetation. Intensive human disturbance in the forest can be observed from the occurrenceof open areas caused by tree cutting and illegal agricultural activities. Forest logging in the past(during Dutch colonization), which is still practiced by local people (even though much lessintensively), has, to some extent, influenced the composition and structure of Mount Wayangforest and the surrounding area. The presence of gaps in Mount Wayang is also due to natural
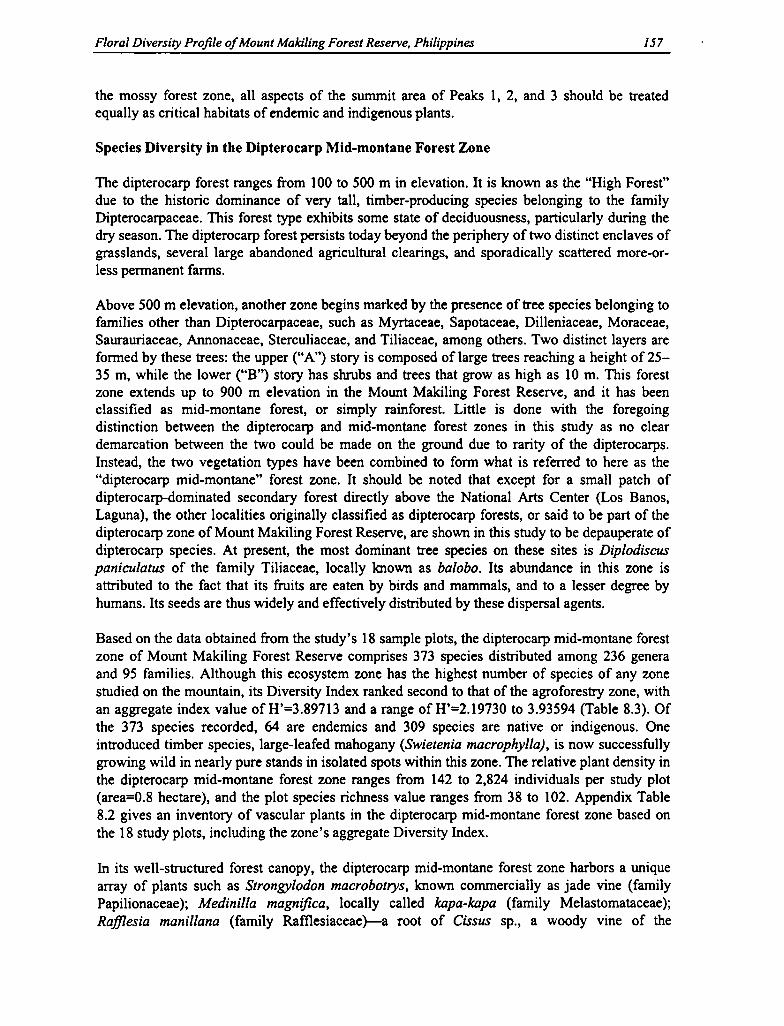
Biodiversity in the Ayangan-Ifugao Landscape 299
Field observations and interviews at the study site revealed a composite swidden system thatinvolves multiple land uses and optimum resource utilization within the landscape, including riceand vegetable production for home consumption plus vegetable (i.e., snap beans) and tree-cropproduction (i.e., coffee and pomelo) for market sales. Furthermore, there is very little variationon the traditional swidden practices in the study area. Variation exists mostly in the length of thefallow period, choice of crops, and crop association.
Ayangan respondents identified seven categories' of land use, which vary according tovegetation cover, terrain, hydrology, and agronomic activity, although not every household hasaccess and control of all resource bases. Two or more different resource bases also may overlapin the landscape. These land-use categories are (1) ala or communal forest; (2) kongo or commu-nal grassland; (3) pinusiu or woodlot; (4) inuma-an or swidden; (5) padjow or rice terrace; (6)garden or vegetable garden; and (7) fubloy or home settlement.
Ala. The ala or (state-owned) communal forest areas are located in the highest elevations of theSto. Domingo Forest Reserve on the northern and eastern side of the barangays and in the UhokForest on the southern part of Baran gay Panubtuban. Original forest cover can still be foundhere, and timber, fuelwood, and other forest products (e.g., honey, rattan) are still freely obtainedhere. Dipterocarp tree species are the dominant species (e.g., Pterocarpus indicus).
Kongo. Kongo or communal grasslands comprise 5 percent of the total land area ofHaliap-Panubtuban, stretching mostly along the eastern slopes and partly along the southwesternportion of the study site. These areas are primarily used for pasturing goats, cows, and carabaos.
Pinusiu. Pinusiu (woodlots) are understory clearings within the margins of the ala. Thesewoodlots are privately owned and managed for fuelwood, timber, fruits, and other products. Ifthe pinusiu is mostly planted to coffee (Coffea spp.), the site is called nakopihan.
Inuma-an. Inuma-an or swidden is a forest patch entirely cleared and burned for cultivatingcrops. Usually located on sloping lands, these plots are planted to tuber crops, legumes, and othervegetables and upland rice, mostly for home consumption. These plots are cultivated for anumber of years before they are permitted to fallow for three to seven years. When the inuma-anis being cropped, it is referred to as a habal. A household may maintain one or more habal at atime, which may be located contiguously or separately.
Padjow. Padjow or payoh (wet rice terraces or pond fields) are privately owned and primarilyplanted to irrigated rice. Boundaries are carefully delineated and are distinctly marked with thered dongla plant (Cordyline fruticosa). The padjow differs from the habal by the presence ofwater and terracing. A habal is never terraced and is always dry and/or rainfed. A padjow isusually wet and flooded and terraced. Small compost mounds called po-o are also formed in thepond field during land preparation, where some vegetables (e.g., onion, mustard, petchay) areplanted. A pit called dolog, measuring 1 meter in diameter and 1 meter deep in the middle of thepond field during the rice-growing stage, is used for fish culture for home consumption.
Garden. A garden is a plot terraced if sloping but preferably flat and usually converted from aswidden or dry rice terrace that is intensively managed specifically for commercial production ofvegetables, usually snap beans (Phaseolus vulgaris var. burik) and sometimes crucifers (e.g.,cabbage, petchay, and mustard). There is no single Ayangan word for garden.
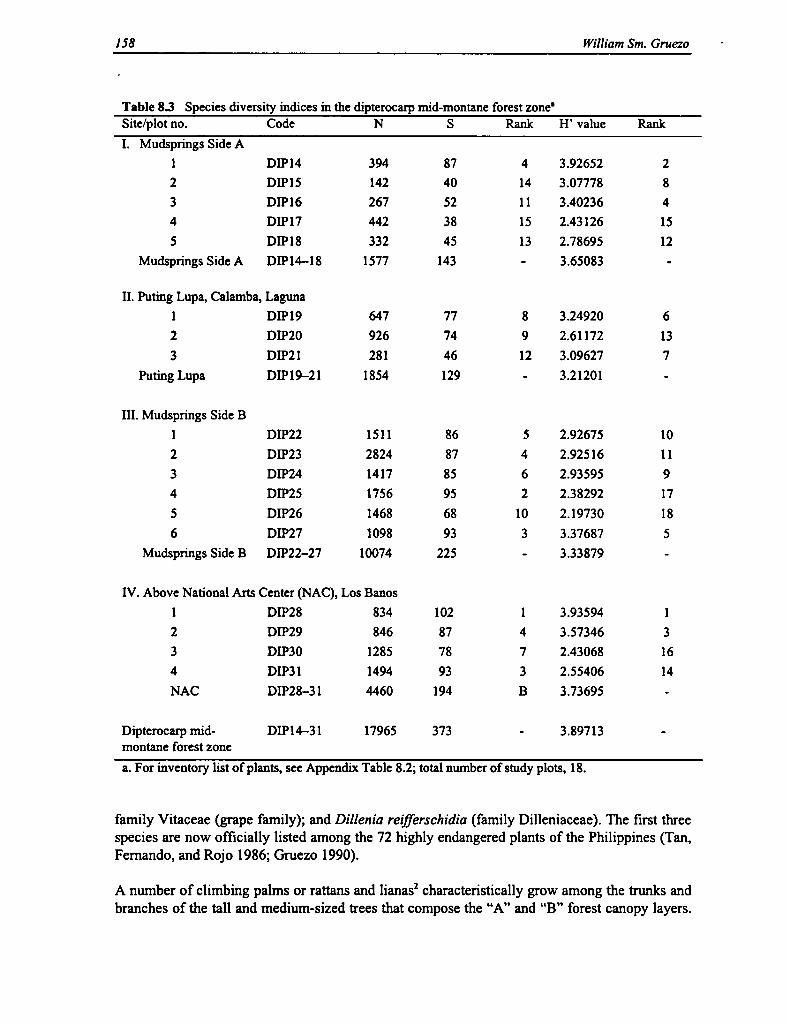
ti0
s0
50
Trees:(1) Acer laurinum; (2) Acer niveum; (3) Acronychia pedunculata; (4) Canthium glabrum; (5) Castanopsisargentea; (6) Castanopsis javanica; (7) Castanopsis tungurrut; (8) Claoxylon polot; (9) Ehretiajavanica;(10) Engelhardia spicata; (11) Eugenia sp.; (12) Ficus ribes; (13) Lithocarpus sundaicus; (14) Litsea sp.1; (15) Litsea sp. 2; (16) Litsea sp. 3; (17) Litsea sp. 4; (18) Macarangajavanica; (19) Macropanaxdispermum; (20) Maesa latifolia; (21) Manglietia glauca; (22) Mastixia trichotoma; (23) Musaenda Yfrondosa; (24) Omalanthus sp.; (25) Pyegum; (26) Quercus lineata; (27) Saurauia bracteosa; (28) Schimawalichif; (29) Sloanea sigun; (30) Strombosia javanica; (31) Vernonia arborea; (32) Villebrunea
)'
rubescens; (33) Antidesma tetandrum; (34) Sp. A; (35) Sp. B; (36) Sp. C. s << X71
z91 f Ji'
I!!!.
t N
Shrubs and herbs:(A) Acrophorus blumei; (B) Aristolochia coadunata; (C) Boehmeria platyphylla; (D) Calamus sp.;
(E) Cypholophus lutescens; (F) Debregeasia longifolia; (G) Dichloa vebrifuga; (H) Eupatorium odoratum;
(I) Peristrophe hyssopijolia; (J) Pilea melastomoides; (K) Pinanga sp.; (L) Smilax sp.; (M) Urtica sp.;
(N) Zanthoxylum scandens.
020 30 40 so 60 ro 80 90 Wa
Figure 3.1 Profile diagram of Mount Wayang protected forest.
48
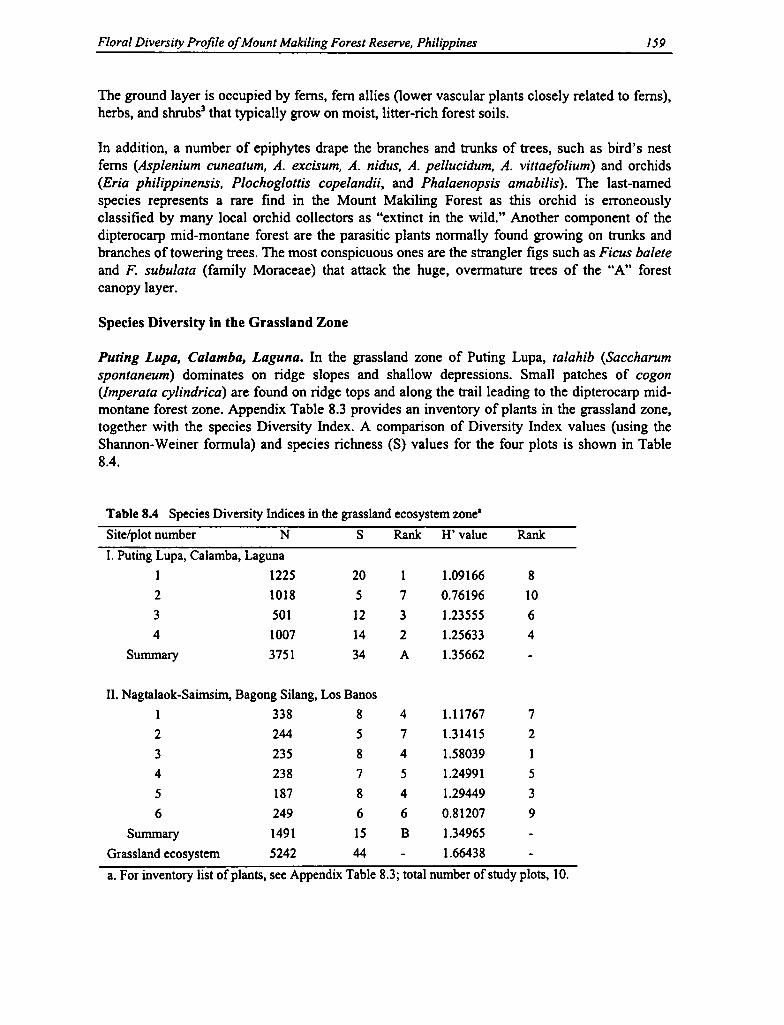
300 Mariliza V. Ticsay-Ruscoe
Fubloy and Ngilig. The fubloy is a cluster of three to ten houses that make up a home settlement.Within the fubloy, the homegarden is an essential resource base for household subsistence. It isan area in the vicinity of the home that is cultivated and maintained not only with ornamentalplants, fruit and shade trees, but also with other crop species, animal pens, and sometimesfishponds. It is distinguished by the presence of the Areca palm and coffee trees. Thehomegarden is separated into two distinct parts: the ketao or the open courtyard in front of thehouse and the ngilig or backyard. A stone-walled livestock pen (fu-hod) is typically located inthe ngilig. A fishpond, if present, will be located wherever the water supply is most abundant.There is no single Ifugao or Ayangan word for either "homegarden" or "fishpond," but villagersusually refer to the former as the ngilig.
In this study, the woodlot (pinusiu) was differentiated from the coffee plantation (nakopihan) onthe basis that the latter is predominantly planted with coffee trees, while the woodlot is coveredwith an assortment of fruit, timber, and secondary forest species. The communal resourcebases—the forest (ala) and grassland (kongo) —were not included in analyzing biodiversity atthe household and farm/plot levels. Baseline information (i.e., species listing) on the forest andgrasslands were, however, obtained at the landscape level during transect surveys.
Methodology
Multiple methodologies were used in data collection (Table 13.1). Baseline information onrelevant biophysical, sociocultural, and economic aspects of the environment, as well as generaltrends of resource utilization in the study sites, was obtained from secondary data sources.
Biodiversity Measurement and Analysis
Quantitative or Standard Measures of Biodiversity. In order to establish a basis for comparisonwith other biodiversity indices derived from other biodiversity studies, standard biodiversityindices such as the Shannon-Weiner Index (H'), the Menhinick Index of Species Richness (R),and the Pielou's Evenness Index (e) were computed for selected resource bases (holding sizeconstant). These standard indices were then compared between and among the different resourcebases. The Sorensen's Index of Similarity (IS) and Dissimilarity (DS), based on the presence(not the absence) of species, was likewise computed for the different resource bases.
Rapid Biodiversity Appraisal Methodology. The rapid approach to biodiversity assessment doesnot compute biodiversity indices but identifies factors or surrogate parameters that may indicateconditions of biodiversity (i.e., loss or maintenance). This methodology integrates biological andsocial information gathered from field observations and interviews in the study site. It involvesonly species identification and recording the total number of species found in a particularsampling area. It does not involve counting the number of individuals per species in a givensampling space to predict species distribution and abundance. Other procedures included in theRapid Biodiversity Appraisal methodology are (1) vegetation mapping and profiling, (2) "kitch-en" and "market" survey, and (3) the participatory transect walk.
Species Listing, Vegetation Mapping, and Profiling. Species listings were carried out in all 323farm plots belonging to the 93 respondents of the survey. (Species listing is purely taxonomic innature, with no frequency counts done for any of the species identified.) With the assistance of alocal informant, a representative sampling plot (selected from the 323 visited) was measured and

Spatial Aspects of Community Structure in Mount Wayang Forest 49
treefall, which is a common phenomenon in tropical forests. Differences in abiotic conditionsamong existing gaps in Mount Wayang, either caused by natural treefalls or human disturbance,create spatial heterogeneity, which in turn affects the diversity of species in the forest. Bank etal. (1992) stated that even within a gap, differences in light, moisture, and temperature regimesand spatial heterogeneity caused by root, bole, and crown zones create a number of potentialregeneration niche. Thus, the overall development of the vegetation in Mount Wayang forest isinfluenced by both environmental and anthropogenic factors. However, the differences andsimilarities of vegetation composition and structure between gaps created by natural treefalls andhuman disturbance in Mount Wayang need further investigation.
In the short-term period of this study, it was not easy to predict changes in the overall forestcommunity structure in Mount Wayang because of complex interaction between the bioclimaticfactors and human disturbance. In certain cases, however, it was possible to detect the effect ofhuman pressure on the occurrence of certain species in the forest, although only in qualitativeevaluation. For example, the present study and some key informants revealed that Zanthoxylumsp., which was once among the common species found in Mount Wayang, is now becoming veryrare. The rarity of this species is presumably caused by overexploitation practiced by localpeople and outsiders to make "bonsai" (a potted plant dwarfed by a special technique) of thisplant. Thus, to predict the impact of overharvesting on the population structure of a species islikely to be more obvious than to predict the overall changes of forest community structure. Onthe other hand, the presence of human intervention in Mount Wayang secondary forest is likelyto obscure the effects of variation in abiotic conditions on structural vegetation patterns in thearea.
Horizontal Structure of Vegetation in the Overall Forest Ecosystem. Although the remnantforest in Mount Wayang is experiencing severe pressure from human disturbance, the foreststructure as a whole still exhibits the characteristics of a forest that, according to Backer andBakhuizen (1965), can be classified as montane ever-wet rainforest. Various plant families suchas Urticaceae, Rubiaceae, Fagaceae, Moraceae, Myrtaceae, and Euphorbiaceae and numerousherbaceous and shrubby species can still be encountered. Such plants are common inmountainous forest ecosystems in Indonesia (especially in West Java). The occurrence of somegenera such as Engelhardia, Schima, Villebrunea, Saurauia, and Homalanthus in Mount Wayangforest indicates that the forest is currently a "seral vegetation" (stage of vegetation successionbefore reaching climax condition).
Among 53 tree species found in the study area, 36 species have individuals with diameter atbreast height 35 cm or more; but of those 53 species, only 6 species were found in a completestage of growth from seedling up to mature trees having a stem diameter of >35 cm (the stemdiameter of some species such as Mussaenda frondosa and Cinchona succirubra may not reachmore than 35 cm). However, the seedlings of the other 17 species were not encountered in thesampled quadrats (they were also rarely found outside the plots). Of the total 53 tree species, 21species (40 percent) were not found in sampled plots belonging to the sapling category (stemdiameter <10 cm). As a whole, this indicates that there is variation in the population structureamong tree species. The variation in population structure among encountered species is influ-enced, among others, by natural factors such as canopy gap, human disturbance (e.g., poaching),and/or the presence of animals responsible for tree pollination and seed dispersion (Peters 1994).
In native forest, the number of individuals usually decreases as the size class increases (Felfili1995), which is also the case in the secondary forest . in Mount Wayang, even though it is
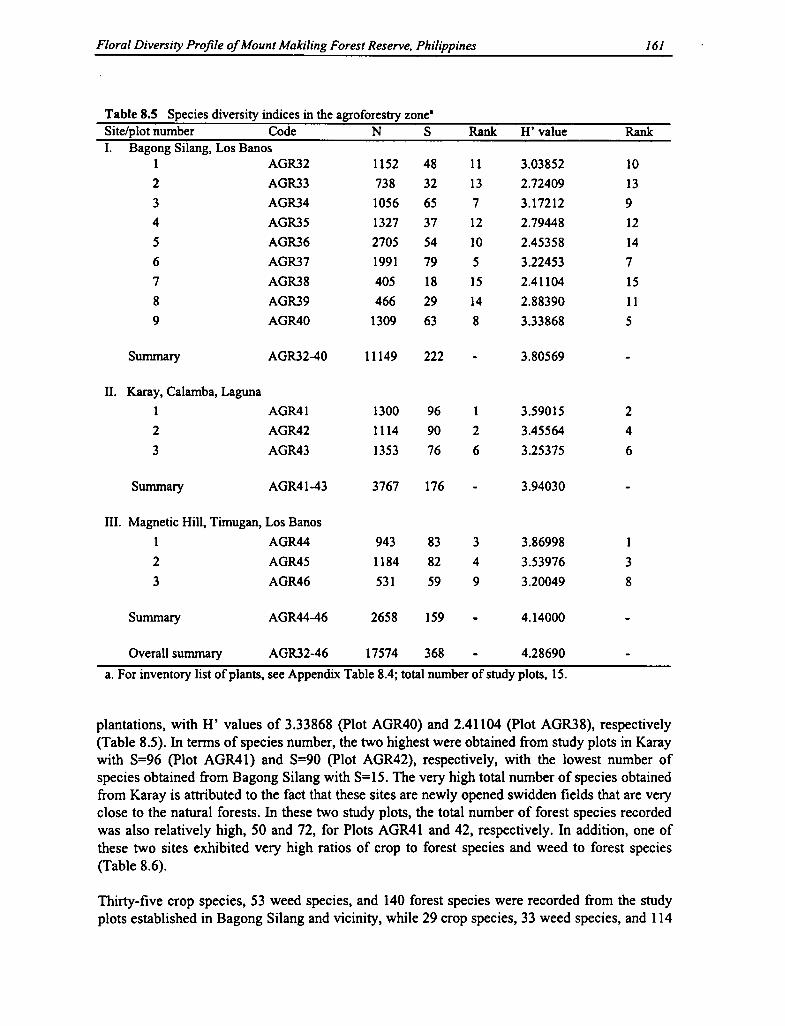
Biodiversity in the Ayangan-Ifugao Landscape 301
drawn to illustrate its exact configuration and dimensions. Plant crops were then identified andplotted to show species association. A vegetation profile was also drawn to show the verticaldistribution of the different plant species from the ground to the top (canopy) story. (Thismethodology is applicable to both natural and agricultural systems, but mostly addresses plantdiversity.)
Table 13.1 Summary of methodologies used for biodivetsity assessment and data analysis
Scope and objectives Level of Unit of Measure of Data acquisitionhnethod-of the study analysis analysis diversity Variables/data required ology/technique used
Resource survey and Plant Species, Species Species: ID, baseline Species inventory; Rapidinventory community/ varieties, and inventories; biodiversity indices Biodiversity Appraisal;
vegetation cultigens indicator interviewscover species
Identify and describe Human Household or Extent of Cropping calendar; crop Review of secondary data;pattern of the community/ farm plot monocropping; association; economic plants; RRA; key informanttraditional swidden- agroecosystem genetic erosion principal staples; cropping interview; participantbased production level history; market orientation; observation; life histories
"Kitchen" or "Market" Survey. Both the household kitchen and the village market are goodplaces to observe the seasonality and abundance (reflective of crop failure or success for theseason) of cultigens and noncultigens, the crop's market value (as reflected in price), and thepeople's dietary preferences. Furthermore, the role of different crops in human nutrition can bededuced. This method involves listing, describing, and identifying the species (both plant andanimal) found, cooked, and prepared for household consumption. The Kiangan market wasvisited weekly while the local store was visited daily. The kitchen survey was done daily.
The Participatory Transect Walk. A transect constitutes a form of systematic sampling whereinthe samples are arranged in a linear fashion. Transects are useful for recording changes in soiltype, topography, elevation (Iskandar and Kotanegara 1993), and land use. The author thereforecarried out an east-west transect across the landscape, and identified and recorded all plantsalong the area (see Figure 13.2). Frequency and occurrence are good indicators of the abundanceand perhaps the functional roles of flora and fauna in the landscape. A local resident wasrequested to act as guide (and interpreter, when needed) during the transect walk to facilitate theacquisition of local nomenclature, as well as to gain insights into local and traditional uses ofeach species found.
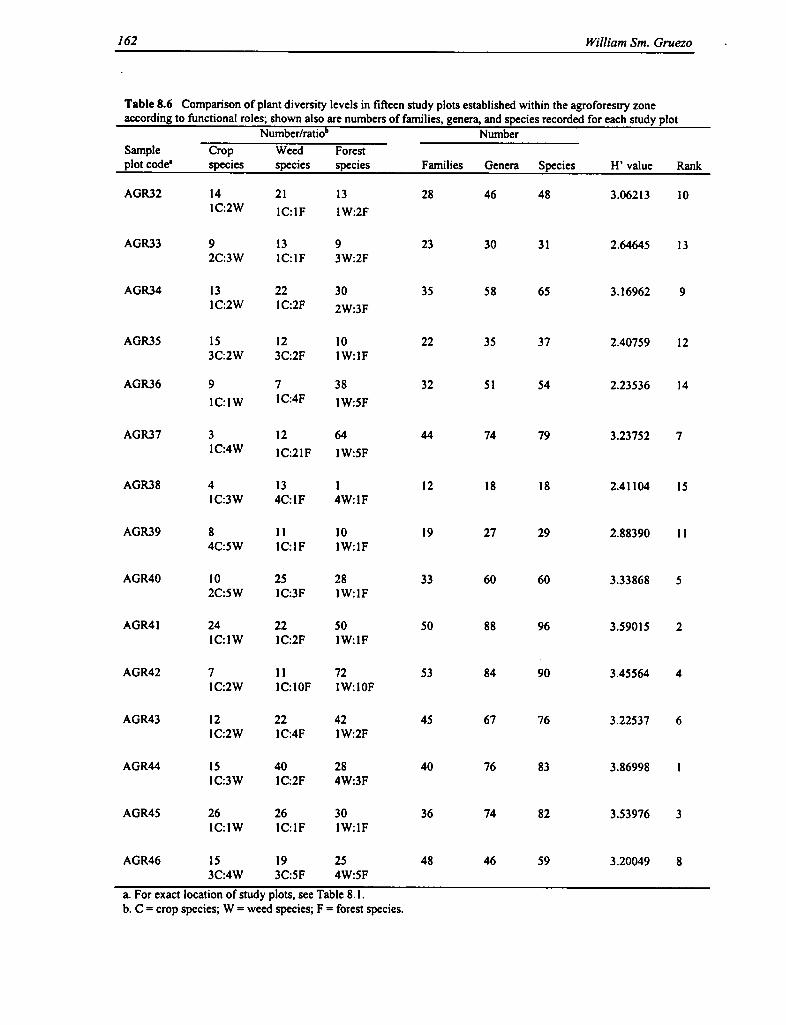
50 Parikesit, Fani Wiardi, and Djuniwarti
experiencing significant pressure from human exploitation. The mean density of trees per plotfor each category is as follows: mature trees (stem diameter >35 cm), 7 individuals (approxi-mately 175 individuals per hectare); poles (stem diameter 10-35 cm), 4.5 individuals (approxi-mately 450 individuals per hectare); and sapling (stem diameter <10 cm), 3.6 individuals(approximately 1,440 individuals per hectare). But the mean density of shrubs and groundvegetation groups are, respectively, 1.5 and 24 individuals per square meter. At species level, allthe encountered tree species have mean individual density less than one per sample plot, whichindicates the rarity of the majority of tree species in Mount Wayang. Peters (1994) pointed outthat in tropical forest rich with a high degree of species diversity, the individuals of a givenspecies usually occur at extremely low densities. This fact indicates that biodiversitymanagement in a tropical ecosystem such as in Mount Wayang protected forest is complexbecause, on the one hand, higher diversity indicates great potential use of forest resources, but onthe other hand, low tree population densities cause the forest to be vulnerable to overharvesting.
Basal area per hectare for each tree category is as follows: mature trees, 51.3 m 2; poles, 12.2 m2;and saplings, 3.1 m 2 . Smiet (1992) has compared several montane forest areas in Java concerningtree density, species number, and basal area with respect to effects of human impact. Butcomparison between the present study and Smiet's results cannot be straightforward since thepresent study uses a different sampling design and tree categories for the three aspects mentionedearlier.
With regard to species importance in the remnant forest in Mount Wayang, the structure of forestcommunity in Mount Wayang varies for each category/group (trees, poles, saplings, shrubs, andground vegetation). In the category of mature trees (diameter at breast height >35 cm),Engelhardia spicata is the dominant species, followed by Quercus lineata and Schima walichii(Appendix Table 3.1). Van Steenis (1972), as cited by Smiet (1992), pointed out thatEngelhardia is a well-known invader, and if this species is left undisturbed, it will lose itspresent dominance and the more varied forest will develop. Among mature trees, two species(i.e., Castanopsis javanica and C. argentea) are characteristic of mountainous forest in WestJava. These species were among tree species that experienced heavy logging during colonization.
Although the density and distribution of Schima walichii is lower than Quercus lineata, therelative dominance (based on measured basal area) of the former species is slightly higher thanthe latter. This indicates that, in general, the size of S. walichii trees in Mount Wayang is biggerthan that of Q. lineata. Among mature tree species, Podocarpus imbricatus is endemic to Java.P. imbricatus does not show a high dominance, and most of the individuals were found in theupper part of the mountain toward the peak (above 1,900 m altitude) but with low populationdensity. In the lower part of Mount Wayang, however, some individuals of this endemic specieswere found with a stem diameter >50 cm. The infrequent occurrence of this species is presum-ably due to logging activity in the past. Contrary to data obtained in the present study, a surveycarried out in Mount Gede-Pangrango National Park showed that P. imbricatus is one of thepredominant species besides S. walichii (Kusmana 1989). (Mount Gede-Pangrango NationalPark is located north of the present study site.) It is likely that much less intensive forestencroachment in Mount Gede-Pangrango National Park is among factors that cause thesignificant presence of P. imbricatus in this conservation area. This indicates that more strictforest protection has, to some extent, ensured the future of this endemic tree species as comparedwith that in Mount Wayang where forest encroachment is a major threat. In Mount Wayangprotected forest, P. imbricatus is among tree species in which its smaller diameter class (i.e.,sapling category) was infrequent. This makes the future of this endemic tree species vulnerable.

It
ti
I I .n I U)1 col
^ g ^ 31a0^gsQg' ij1 f
Uc 382 c ►– am c
1••••• i• • i • • •9041000 m 1 am-g^ m i 150-!1X0 m 1 t50-550m
120-30 1 21-0 1 ^a 1 1fF30
I ChfLosn Sill Loin I ClahLoae SIIbalm
I Cm nuii Cam m9 Fare) • Cores PI^nalm • Horns SerIen • Sw$ddenFIXest
1 lopp^q and 1 CalkaplstSae: j kraal j1 fast FIoA CI I Ai5I rood ytkrNq &Ot*q Use Plrf^m
HO I MkMi b HI I low I HI^I
tJTi1 SIO Danwpo 11 maplpbl I I & 1'r
I r ^
'1 i1i : J '4 1 •• c I
'iii h81t1•• •••• • • i • • • • • • • i ;
S^-550m 1 000-630 m 1 1 100 m 60^- m 1 100950 m
1 10-25 30-45 11 25-10 1 10-30 2610f–
1
Clay SINlom I Sloe Cllr ^ CLflom 11 - 1
I j Grasbn0 Trni oe,HOmtShcema^ls I Cmm wfaW ISwkldoe1
Ills TerxO1 I Ftv a an 1 I Poct-Snay Real Coop RoOm I WAIN Sara 1I i w I i
1 Won j ►W1 I Low I UGOImnbH0
1 1I+DP,. LI Cnd Ihapd I Uag,ta—Pac0gan llwk 1
Figure 13.2 East-West Transect of Barangay Haliap-Panubtuban (Modified from CECAP 1991; Xu and Ruscoe 1993).0

Spatial Aspects of Communi ty Structure in Mount Wayang Forest 51
Among the mature trees category found in Mount Wayang, some species of figs (Ficus spp.) arealso present but mostly with low dominance. In connection with biodiversity maintenance in theuppermost area of Citarum River Basin, conservation of this genus might be important becausethe genus is often considered as a keystone plant due to its important ecological function. Fromthe present study, there is no information regarding the use of fig species by local people.Despite that, animal poaching might affect the future existence of fig species in Mount Wayangbecause some of the animals, such as birds, that inhabit the forest are crucial for fig's seeddispersal.
For the trees category with a stem diameter of 10-35 cm (poles), Laportea stimulans is thedominant species (Appendix Table 3.2). In general this species is commonly found within thearea of below 1,800 m above sea level (asl). This species has minute hairs on the surface of itsleaves, which cause human skin to itch. Presumably that is why local people do not use thisspecies for any purpose. The other predominant species are Macropanax dispermum and Eugeniasp. 3, while Engelhardia spicata, which is the most dominant species among the mature treescategory, does not exhibit its dominance in the poles category. In this category two species of thegenus Podocarpus, namely P. imbricatus and P. neriifolius, are found but with low ImportanceValues. P. neriifolius in Mount Wayang can only be encountered in certain parts around themountain peak, and individuals with a stem diameter >35 cm are rare. Similarly, Schimawalichii, which is a predominant species in the mature trees category, does not show a highdominance value in the poles category.
The presence of many tree species in the poles category is generally not too dominant because oftheir natural development and human disturbance. In tropical forest, many tree species experi-ence high mortality. Apart from that, human exploitation contributes to the infrequent occurrenceof poles (and also saplings) in Mount Wayang, where local people usually cut down small treesof the pole and sapling categories rather than bigger trees. This fact is discouraging for biodiver-sity maintenance since the pole and sapling categories found in the present are considered asinsurance for forest sustainability in the future.
In general, the presence of saplings in Mount Wayang is notably infrequent. This can be seenfrom the fact that the majority of tree species in the sapling category have low values of densityas well as frequency. In the sapling category (stem diameter <10 cm), Eugenia sp. 3 is the mostdominant species, followed by two species of the genus Acer, namely A. laurinum and A. niveum(Appendix Table 3.3).
In the sapling category, Engelhardia spicata is not found in the plot, and this species is also veryinfrequently encountered outside the plots. The study in Mount Gede-Pangrango National Parkalso shows that among the 62 tree species belonging to the sapling category, the dominance of E.spicata is low. Similarly, the saplings of two species of Podocarpus found at Mount Wayang areonly observed outside the plots with a very low population and distribution. In Mount Gede-Pangrango, the saplings of two species of Podocarpus are not dominant as well.
In the shrubs (and tall herbs) group, Eupatorium odoratum is a very dominant species, followedby Chloranthus brachystachys (Appendix Table 3.4). E. odoratum is an exotic species, whichhas been invading the open areas at Mount Wayang and eventually dominating that area. Thisspecies is also found in the surrounding agricultural areas. One of the tall herbs that was notfound in the sample plots is Musa acuminata. In the rainy season, this wild banana species isusually observed in Mount Wayang. One of the possibilities as to why this banana species was
Biodiversity in the Ayangan-Ifugao Landscape 303
Identifying Biosocial Indicators of Biodiversity. Just as species diversity can be measuredquantitatively with the use of standard mathematical models, so can changes in the conditions ofbiodiversity be monitored and evaluated through the use of certain indicators. Note thatindicators are not given; they are created. The identification of meaningful indicators (whetherbiological, physical, or social) may require a long investigation of the interrelationship ofdifferent factors that may not obviously appear to be connected. The choice of indicators isattested by factors such as ease of comprehension, and availability and reliability of information.Difficulty in identifying useful indicators is related to the difficulty in understanding the conceptto be evaluated (e.g., the concept of biodiversity maintenance). Because utility of a given speciesis user-defined and highly subjective, these indicators may then be highly site-specific, meaningthat an indicator for Site A may not be an appropriate indicator for Site B.
Indicators can be identified from information collected in respondent interviews, as well as fromfield observations during Rapid Biodiversity Appraisal, which point to particular land uses orother conditions (e.g., site quality, soil fertility) that may be associated with biodiversity levels.The presence (or the absence) of a particular flora or fauna and particular biophysical conditionsor sociocultural activities is the first step to identify useful indicators.
Data Analysis. Analysis of data was carried out on the species, household, resource base, andlandscape levels. In the species level of analysis, species richness in terms of taxonomic diversitywas assessed by means of species count. A functional analysis (i.e., economic, social, ecologicalvalue or utility) was carried out using an ethnobotanical technique. In the household level ofanalysis, biodiversity as measured by species counts was assessed and compared among thedifferent household respondents; and household variables explaining differences in biodiversitylevels were identified (e.g., household demographics, multiplicity of resource bases).
In the resource base level of analysis, biodiversity as measured by species count was assessedand compared among different plots of the same resource base. Factors explaining thedifferences among plots were identified and assessed (e.g., site quality, tenurial status). Inaddition, plant indicators of biodiversity status were identified and assessed; functional analysis(i.e., economic, cultural, and ecological utility) of the resource base was also done in relation toits species content. In the landscape level of analysis, the traditional Ayangan agriculturalproduction was analyzed focusing on the factors affecting biodiversity levels at the level of eachland use and at the level of the entire landscape (e.g., indigenous soil and water conservationpractices, crop management techniques).
Analysis of Variance (ANOVA) and Correlation Analysis were carried out on the differentfactors affecting biodiversity maintenance using the Statistical Analysis Systems (SAS) program.
Results and Discussion
Analysis of Biodiversity at the Household Level
Table 13.2 gives a summary of significant factors affecting biodiversity at the household level.Using the household as the basic management unit, the study identified and investigated factorsthat influence the utilization, management, and consequent conservation or loss of biodiversity inHaliap-Panubtuban. Household biodiversity (as measured by taxonomic diversity) is the totalspecies count of all flora in all plots or resource bases managed by that household. From a list of

52 Parikesit, Fani Wiardi, and Djuniwarti
very infrequently found during the data collection (dry season) is human intervention. People usethis herbaceous plant for cattle feed, particularly during the dry season when forage is in shortsupply.
In the ground vegetation category (herbs, tree seedlings, and shrubs of <1 m high), the mostdominant species is Eupatorium riparium, followed by Elatostema sp. and Chloranthusbrachystachys (Appendix Table 3.5). Similar to E. odoratum, E. riparium is an exotic speciesthat normally grows by forming large mats in forest edges. The abundance of tree seedlingsfound in all sample plots are not high and, as mentioned, only 14 species out of the total 53 treespecies found in Mount Wayang have a seedling stage. Among those tree seedlings, Engelhardiaspicata and Acer niveum are the most dominant.
Horizontal Structure in Three Different Altitudinal Intervals. The analysis of vegetationstructure in Mount Wayang was also carried out for three altitudinal intervals (zones), that is,Zone I (1,660-1,830 m asl), Zone II (1,830-2,000 m asl), and Zone III (> 2,000 m asl). Speciescomposition as a whole and the horizontal structure of vegetation among the three zones are, tosome extent, different, except in the shrub and ground vegetation groups where the three zonesare dominated by the same group of species.
The mean density for each category in each zone is shown in Table 3.1. The mean density of themature tree and sapling categories increases from Zone I toward Zone III; but the mean densityfor the poles, shrubs, and ground vegetation categories are lower in the middle (Zone II). Thedifference in population structure of each diameter class category is presumably due to the effectof environmental factors and human disturbance. In the present study, measurement of theenvironmental factors is not carried out intensively; therefore, interpretation of the environ-mental effects on the species population structure would be too speculative.
Apart from natural mortality, the impact of human disturbance on Mount Wayang forest can beseen from the population structure of particular tree categories (e.g., in the poles category).Lower mean density in the pole category in the middle zone (II) is partly due to illegal cutting bylocal people. To escape from being caught by forest wardens, poachers incline not to cut treesfrom the lower part of the forest (Zone I); instead, they go farther into the middle zone to cuttrees, mostly poles and saplings. The presence of trails and illegally cultivated areas indicate thathuman disturbances were more intensive in the middle area (Zone II).
Table 3.1 Average individual density per plot for eachcategory/group in three altitudinal intervals (zone)
ZoneCategory/group I II III
Mature trees 4.4 6.3 8.9
Poles 6 3.7 4.3
Saplings 3.1 3.3 4
Shrubs 5.8 4.6 7.2
Ground vegetation 21.1 17.5 30.1

304 Mariliza V. Ticsay-Ruscoe
households of each barangay obtained from the Baran gay Council secretariats, 93 householdrespondents, or 31 percent of the population, were identified and interviewed regarding resourcemanagement. The factors that subsequently proved to influence resource management and theloss or maintenance of biodiversity included the following: household demographic character-istics (age, gender, marital status); household size or number of consumers in the household;number of producers in the household (to indicate labor force); consumer-producer ratio of thehousehold; sources of extra income (farm, nonfarm, off-farm); total number and total number oftypes of resource bases exploited by the household; inclusion of swiddens and homegardens inthe resource bases of the household; vegetable sufficiency of the household; and livestockintegration. The significance of any one of these factors may later be used as an indicator of highor low biodiversity within the household level using a Rapid Biodiversity Appraisal method-ology.
Table 13.2 Summary table of significant factors affecting mean species count at thehousehold level
Variable f-value Correlation coefficient (r) Probability (pr)
Age 0.11 °' -0.0046 0.90
Sex/gender 0.0 " -0.0038 0.97
Marital status 0.44 " -0.0861 0.64
Household size = C 0.03 "' 0.0006 0.973
No. producers = P 0.26 " 0.0115 0.905
C/P ratio 0.78 °' 0.1688 0.722
No. of resource base 19.29* 0.6475 0.001
No. type of resource base 5.60* 0.1106 0.005
Vegetable sufficiency 0.66 °' 0.0144 0.520
Extra income 2.13 " 0.1253 0.101
With swidden 3•93* 0.0804 0.023
With homegarden 0.12 °' 0.0013 0.735
With livestock 1.13 "' 0.0368 0.340
Area of landholdings 1.54 "' 0.0331 0.220
n.s. = Not significant.* = Significant at 1% level of significance.
Statistical analysis shows that the number of resource bases or production plots (value: 1-11)and number of types of resource bases (value: 1-6) accessible and managed by the household arehighly significant with respect to mean species count. Correlation analysis shows that there is norelation between household demographic characteristics, household size, and sources of extraincome. There is also no correlation between total size or area of all landholdings of the farmer(value: 0.25 to14 ha), although from field observations, farmers who "own" more land are morelikely to leave one or more parcels on fallow as natagwan. Abandoned or neglected land cansucceed to secondary forest growth or a woodlot, which may result in an increase in the numberof woody species (in old fallows) or graminaceous species (in new fallows).

Spatial Aspects of Communi ty Structure in Mount Wayang Forest 53
The extreme topographical condition of Mount Wayang is likely to be the main obstacle forpoachers to cut trees in the peak area, especially big trees. This may be one of the reasonsdisturbance in the uppermost zone (III) is relatively less intense compared with that in the lowerzones. Since saplings are much easier to cut and carry away, local people tend not to confinethemselves to a particular zone in getting trees from the sapling category. Nevertheless, illegalcutting is not the only factor that affect the density of the sapling category. Natural mortality alsoplays a crucial role in determining the abundance of sapling in Mount Wayang. Since no part ofthe forest in Mount Wayang is left undisturbed, it is difficult to undertake a comparison concern-ing the density of each tree category between disturbed and undisturbed areas within the forest inthis area. Studies conducted previously in relatively undisturbed forest in Mount Gede-Pangrango (1,600 m asl) by Yamada (1975, cited by Smiet 1992) showed that the tree densityper hectare with diameter at breast height 2210 cm is 427 individuals. But different results wereobtained by Yamada (1976, cited by Smiet 1992) from the same study site but at a higheraltitude (2,400 m asl and 3,000 m asl), where the tree density with the same diameter at breastheight is much larger, 1,516 individuals (2,400 m asl) and 3,826 individuals (3,000 m asl) perhectare. But in the present study, the tree density with the same diameter class (210 cm) isapproximately 1,040 individuals per hectare.
Although the mean individual density per plot for mature trees in Zone I is lower as comparedwith that in the other two zones, the total basal area per hectare in Zone I is higher, that is, 53.4m2 compared to 48.2 m2 (Zone II) and 52.3 m2 (Zone III). In general, tree size in Zone I is biggercompared with those in the other two zones.
As for species importance, in the mature trees category in Zone I Engelhardia spicata is the mostdominant species, followed by Macropanax dispermum. In the pole category, the most dominantspecies are Laportea stimulans and Macropanax dispermum; whereas in the sapling category themost dominant species are Eugenia sp. 3 and Ficus ribes. The shrub category is significantlydominated by Eupatorium odoratum, followed by Chloranthus brachystachys. These two speciesare also the most dominant species in the other two zones. In the lowest stratum (i.e., groundvegetation), Eupatorium riparium and Elatostema sp. are the most dominant species. In the othertwo zones these two species are also the most dominant, except that in Zone II there is a differentorder of dominance where in this middle zone Elatostema sp. is more dominant than E. riparium.
Different from that of Zone I, two species of Castanopsis, namely C. argentea and C. javanica,dominate the horizontal structure of the mature trees category in Zone II. In this middle zone,there are individuals of C. argentea with a diameter at breast height of more than 50 cm. Theseindividuals are likely among the remnants of heavy logging in the past. In the pole category,Eugenia sp. 3 and Laportea stimulans are the most dominant species, while the most dominantspecies among the sapling category is Lithocarpus sundaicus.
The most dominant species in Zone I is also found as the most dominant species in Zone III (i.e.,Engelhardia spicata, followed by Quercus lineata). This former species is also the mostdominant species in the pole category, followed by Acronychia pedunculata and Macropanaxdispermum; whereas in the sapling category, Eugenia sp. 3 is the most dominant.
Vertical Structure of Vegetation in Mount Wayang
A profile diagram showing the vertical structure of vegetation in Mount Wayang forest indicatesa small-scale spatial variation (Figure 3.1). In general, the stratification along the transect is not
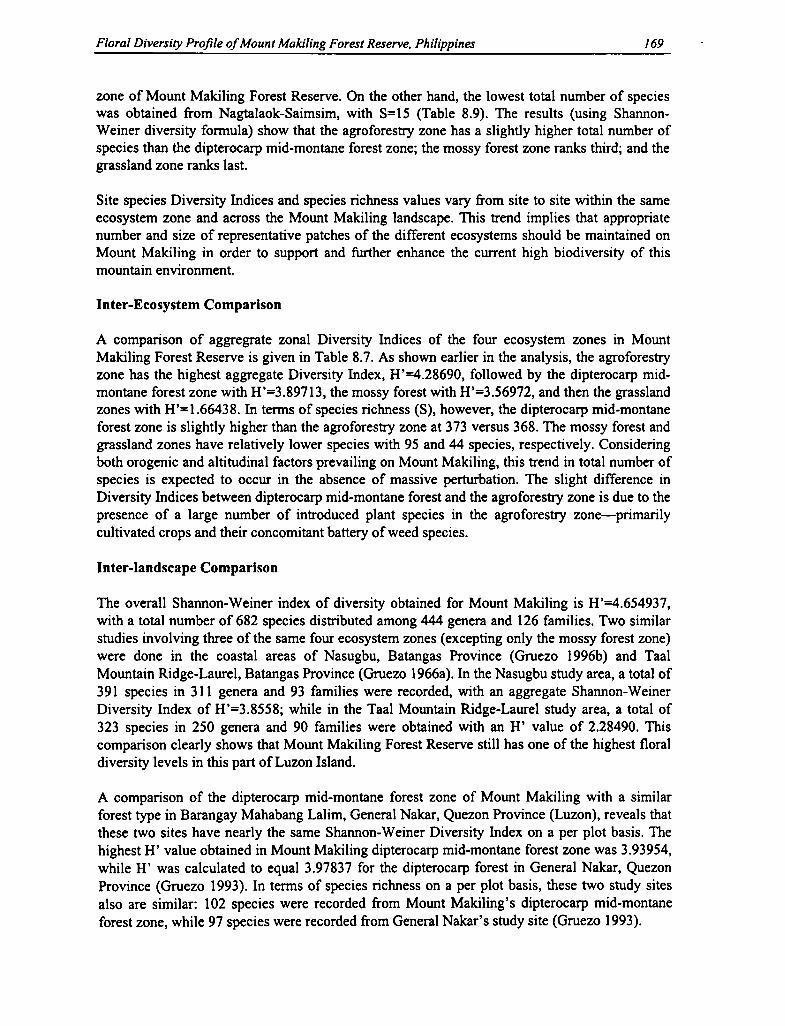
Biodiversity in the Ayangan-Ifugao Landscape 305
Household vegetable sufficiency is not significant. Cultivation of swiddens is negativelycorrelated to the mean species count of the household and is significant at a 5 percent level.Although the swidden as a resource base exhibits very high taxonomic diversity, analysis at thehousehold level shows that noncultivation of swiddens is associated with a higher mean speciescount for the household. Interviews suggest that a farmer who does not have a swidden plotcultivates more food crop on other land-use types by way of compensation. Similarly, althoughhomegardens as a resource base exhibit very high taxonomic diversity, statistical analysis at thehousehold level shows no significant correlation between the presence of a homegarden and themean species count of the household. There is no significant correlation between livestockintegration and mean species count at the household level, although interviews with householdrespondents indicate increased cultivation, when livestock are present, of feed and fodder cropssuch as sweet potato and other root crops, and a greater tolerance for some graminoid speciesthat are otherwise viewed as weeds but acquire value as fodder for livestock owners.
Analysis of Biodiversity at the Resource Base Level
A total of 323 plots of equal or similar size (A Z 0.5 ha) and varying land-use types, belonging to93 household respondents, were surveyed for species counts. A more complete understanding ofhow the resource bases differ from one another in terms of species content will give a clearerpicture of the analysis of biodiversity. The present analysis is done by type of resource base, aseach type differs in terms of physiography, land use, resource management objectives andstrategies, and focus species. Table 13.3 shows the general trend in mean species count of thedifferent resource bases.
Table 13.3 Mean species count for different resource bases
Resource base No. of observations (n) Mean species count
Woodlot 3 23.30(')
Coffee plantation 44 9.30(6)
Swidden 88 17.15')
Rice terrace 81 11.28www
Bean garden 42 14.14(4)
Homegarden 65 21.77(2)
Note: Numbers enclosed in parentheses indicate rank from highest tolowest in mean species count.
Biodiversity Indices for Baseline Data. Appendix Tables 13.1 to 13.6 show the biodiversityindices of each resource base on the Haliap-Panubtuban landscape. Table 13.4 summarizes thesebiodiversity indices for ease of comparison among the different resource bases. Table 13.5presents indices of similarity and dissimilarity between the different resource bases. Figures 13.3to 13.5 present vegetation maps and profiles of three resource bases, namely woodlot, swidden,and homegarden. These maps include information on plant associations, plant density, canopystructure, and tree architecture, as well as horizontal and vertical spatial distribution of specieswithin the site. Plant species found in the landscape are listed in Appendix Table 13.7. Appendix
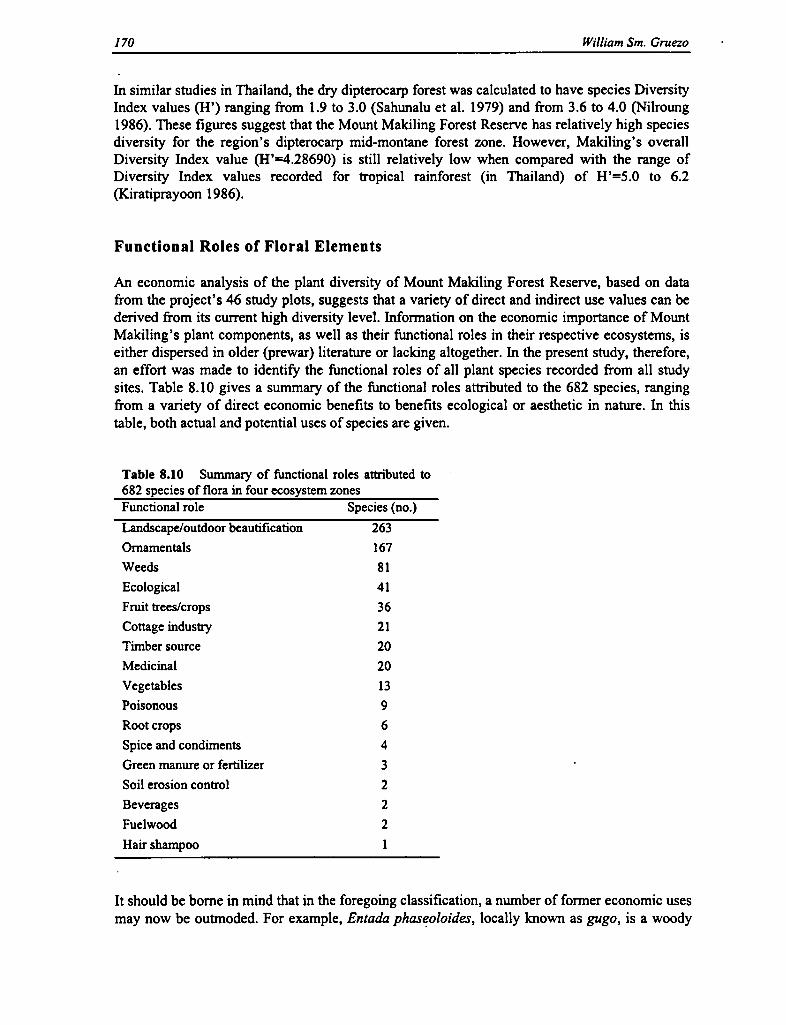
54 Parikesit, Fani Wiardi, and Djuniwarti
distinct, and discrete layers were not fixed at the same height. Only in certain parts can thediscrete layers of two strata be detected, that is, at the place where the canopy openings exhibitthe canopy gap (e.g., in the profile diagram it was shown at section 0-50 m of the transect). Thecanopy gap in Mount Wayang forest can be created clearly by the fall of old trees that sometimesdrag neighboring trees down and also as the result of tree cutting by local people. Canopyopenings may be seen, for example, in the top layer only (as seen at section 10-30 m of thetransect) as a result of treefall in the uppermost stratum. But in certain parts of the forest, middle-and lower-story openings may also be seen (section 70-80 m of the transect) due to eliminationof cover of some tree categories (from the young, up to maturity).
According to Backer and Bakhuizen (1965), in montane ever-wet forest there usually are fewemergent trees such as Altingia excelsa. In Mount Wayang forest, this tree species is planted in aplantation forest area but was not found in the sample plots in the secondary forest. The presenceof emergent trees, which generally is one of the characteristics of the tropical rainforest, is hardlyobserved in Mount Wayang. This is presumably due to intensive logging carried out in the past.Key informants in Taruma Jaya village—the closest village to the forest—stated that during Dutchcolonization, some tree species such as Castanopsis argentea, C. tungurrut, and Podocarpusimbricatus were heavily logged for timber. On the other hand, from the profile diagram, thepresence of one of the characteristic species of "seral vegetation" (stage of vegetation successionbefore reaching climax condition) in Mount Wayang, Engelhardia spicata, in the upper canopystratum is dominant, such as seen at section 10-60 m of the transect.
If the vegetation at Mount Wayang was arbitrarily divided into five height classes, then class A,which is the uppermost canopy, is occupied by trees of 15-25 m in height or more. Class B isgenerally occupied by trees categorized as poles of 5-15 m high. Class C consists of saplingswith 2-5 m in height. Class D is occupied by shrubs and seedlings of 1-2 m high whereEupatorium odoratum can be regarded as a matrix of the vegetation in this stratum. The lowestlayer (i.e., class E) is ground vegetation where herbs and seedlings of not more than 1 m high canbe found.
Stratum A consists of mature trees; some of them might reach more than 25 m high. Among treespecies that occupy this stratum are Engelhardia spicata, Quercus lineata, and Lithocarpussundaicus. These tree species grow to mature trees with relatively large canopy cover. At someplaces, as shown in the profile diagram at section 60 m of the transect, Class A sometimes cannotbe observed. Where stratum A is absent, the uppermost canopy is only 10-15 m high.
Stratum B is the stratum dominated by poles, consisting of various tree species such asMacropanax dispermum, Schima walichii, Castanopsis argentea, and Claoxylon polot. In thisstratum, some young trees are still growing to maturity, which later will occupy the uppermostcanopy. Among them is Engelhardia spicata.
Stratum C is a vegetation stratum dominated by saplings and tall shrubs. Species from thesapling category predominantly occupying this stratum are, among others, Homalanthus sp. andAcer niveum. The vegetation stratum at this height is discontinuous where at some places thisstratum is absent. In the profile diagram, this is shown at 0-20 m and 55-70 m of the transect.This discontinuity is presumably the result of tree-cutting activities, as indicated in the diagramby an abandoned sawmill (at 10 m of the transect).

306 Mariliza V. Ticsay-Ruscoe
Table 13.8 shows distribution by family of species found along the east-west transect acrossHaliap-Panubtuban.
Table 13.4 Biodiversity indices' for different resource bases
Number of Total number of Species Shannon-Weiner EvennessResource base species (S) individuals (N) richness (R) index (H') index (e)
Woodlot 22 (3) 234 (6) 1.44 (2) 3.33 (2) 2.48 (2)
Coffee 21 (4) 566 (4) 0.88 (3) 2.02 (6) 1.53 (6)
Swidden 32 (2) 1741 0.77 (4) 2.49 (4) 1.63 (s)
Rice/pondfield 9(6) 832 0.31(6) 2.03 (s) 2.14 (4)
Bean garden 18 1318 (2) 0.50 (5) 2.97 (3) 2.37 (3)
Homegarden 57 523 (n 2.49 " 4.64 2.64 ^')
Source: Derived from Appendix Tables 13.1 to 13.6.a. Numbers enclosed in parentheses indicate rank from highest to lowest value.
Table 13.5 Similarity (IS) and dissimilarity (DS) indices among the different resource bases
ISDS
(01)
Woodlot(02)
Coffee(03)
Swidden(04)
Terrace(05)
Garden(06)
Homegarden
(01) Woodlot - 27.91 3.70 3.20 0 12.5
(02) Coffee 72.09 - 7.55 6.67 25.64 10.13
(03) Swidden 96.30 92.45 - 7.30 12.00 11.11
(04) Terrace 96.80 93.33 92.70 - 11.11 1.49
(05) Garden 100.0 74.36 88.00 88.89 - 0
(06) Homegarden 87.50 89.87 88.89 98.51 100.0 -
The Woodlot (Pinusiu). Customarily, forest lands may be claimed and cleared (as declaration of"ownership") freely by any pioneering farmer, as long as the site has not been previously clearedand planted to coffee by someone else. Existing perennial vegetation is managed to provide thehousehold with a variety of products including fuelwood, timber, fruits, and other resources. Insome cases, the woodlot is planted to other tree crops (e.g., coffee, citrus, rattan, bamboo).Fuelwood can still be freely collected from a privately managed woodlot by any member of thecommunity, as long as timber species and coffee trees are not disturbed. In the case of otherforest products (e.g., honey), they c an only be harvested with permission from the owner.Landholdings visited during the study were identified and classified by the farmer respondentsthemselves. Of the total 323 plots inventoried belonging to the 93 household samples, only threeparcels were categorized as woodlot. (This sample is not sufficient to run statistical analyses ofany significant differences with other resource bases.)
The small number of woodlots in the study area is the result of a recent spontaneous conversionof many woodlots into market-oriented coffee and/or fruit (i.e., pomelo) tree plantations inresponse to market conditions. Second, maintenance of a woodlot by the farmer also is a function

Spatial Aspects of Community Structure in Mount Wayang Forest 55
Stratum D is a relatively dense vegetation layer in which shrub species are dominant. In general,the vegetation cover in this stratum is continuous and the border with the upper stratum (C) is notdistinct. The most dominant species almost covering the whole transect is Eupatorium odoratum.This shrub species grew almost in all plots, forming a dense stratum. Other dominant shrubspecies that also occupied this stratum is Chloranthus brachystachys. Apart from various shrubspecies, some tree seedlings such as Engelhardia spicata and Acer niveum could also beencountered in this stratum.
Stratum E is the vegetation stratum covering the forest floor dominated by Eupatorium ripariumand Elatostema sp. At places where the top canopy cover is not too dense, those two speciescovered almost the entire forest floor. Some tree seedlings are also found in some parts of thefloor vegetation, particularly those of Engelhardia spicata.
Floristic Diversity in Mount Wayang
Floristic Diversity in the Entire Forest Ecosystem
Although the short-term human disturbance impact on floristic diversity maintenance, in particu-lar, and the overall community structure, in general, is complex and difficult to assess quantita-tively, in a longer evolutionary period the foregoing factor is suspected to contribute indetermining floristic diversity in Mount Wayang. Illegal tree cutting practiced by local people,for example, caused gaps that give space for various species to grow. Apart from tree seedlings,the occurrence of gaps provides the opportunity for exotic species to occupy the open space andthen become predominant. Apart from human disturbance, temporal and spatial heterogeneities,biological interactions, and productivity are among major factors that affect the conditions ofbiodiversity and its maintenance (Rosenzweig and Abramsky 1993; Tilman and Pacala 1993).
The remnant forest in Mount Wayang is inhabited by numerous plant species, cryptogams aswell as phanerogams. Among phanerogams, herbs, shrubs, and tree species with differentdiameter classes occupy the forest floor up to the top canopy. From all sample quadrats, 106species (5 species were found outside the plot) from 43 families were found. This figureexcludes the diversity of cryptogam species found in Mount Wayang, except for some fernspecies. Among trees, the most important family is Urticaceae, which is represented by 9species. Other important families are, among others, Rubiaceae (7 species), Myrtaceae (6species), Fagaceae and Euphorbiaceae (each with 5 species). Among palm species found in thesample plots are Calamus spp. and Pinanga spp.
On the forest floor, 54 plant species consisting of herbs, low shrubs, and tree seedlings wereidentified (the total number of species on the forest floor is 38, if tree and palm seedlings areexcluded). Among the plant groups found in the forest vegetation at Mount Wayang, the shrubgroup had the lowest diversity, with only 17 species. But the total number of tree species foundin the seedling category up to mature trees (stem diameter >35 cm) was 53 species from 24families. This number is lower than that obtained by Kusmana (1989) from his survey in MountGede-Pangrango National Park (i.e., 68 species from 29 families).
The average number of species per plot in the ground vegetation group and mature trees categoryis higher than other categories (Table 3.2). Even though the total number of species in the polescategory is the second highest after ground vegetation, the average species number per plot of

Storey I. Kapok tree, Mahogany, Vitex sp., Pinus sp., avocado, starappleStorey I1. Santol, mango, jackfruit, Areca sp: (betel nut), bamboo, pomelo, coconutStorey Ill. Coffee, pineapple, rattan
1^►
Z^• ' 1 I0.1s m.
o ^- s,oe•I I 1
7. 7 (1 m • 1 1 1 I 1
I I. I 1 -1 kapdk treel
jac sfrult^
.e`"^ I I I ^^ I I I
I I I"^i ^ i I I II I I I I
1 I I I Ii I 1 I
mango+ I I ' I
1 I Areca+1 ^
Areca+Areca+banana+ ArecaI I I c amansi
Starapple+coconut+Areca+ +Jachfruit+jackfrulti-+poinelo+
Figure 13.3 Structure and composition of a woodlot in Haliap, Asipolo, Ifugao. I w0v

56 Parikesit, Fani Wiardi, and Djuniwarti
this pole category is lower compared with the average species number in the mature treescategory (i.e., 3.1 and 5). This indicates that the variability of species number in the polescategory among all sample plots is higher when compared to mature trees. It means that speciesdistribution in the pole category is more uneven compared with that of the mature trees category.
Table 3.2 Diversity measures of vegetation in Mount WayangTotal species Avg. species/ Diversity Evenness Dominance
Category/group (no.) plot (no.) Index Index Index
Mature trees 36 5 3.05 0.85 0.07
Poles 37 3.1 3.32 0.92 0.05
Saplings 32 2.5 3.17 0.92 0.05
Shrubs 17 2.5 1.93 0.68 0.24
Ground vegetation 54 5.4 2.59 0.65 0.15
Although the total number of species in the ground vegetation group is higher than that of othercategories/groups, the Shannon-Weiner's Diversity Index of this ground vegetation is lowercompared to the Diversity Index of the three diameter classes of trees. This lower DiversityIndex is due to significantly high dominance of certain species in the ground vegetation group,such as Eupatorium riparium and Elatostema sp. Lower species equitability among the groundvegetation species is shown by a lower Evenness Index and a higher Dominance Index (seeTable 3.2).
The Dominance Index is used to determine whether the structure of a community is onlydominated by one or a few species only or, on the contrary, there is no absolute speciesdominance. The table shows that the Dominance Index for the tree categories (from sapling up totrees with a stem diameter >35 cm) is lower compared to shrubs or floor vegetation.
A study conducted in Mount-Gede Pangrango National Park (Kusmana 1989) shows that theDiversity Index for trees (stem diameter <10 cm) is 3.59, which is higher than the DiversityIndex of the same category in Mount Wayang (3.17). Nevertheless, the results of both studiescannot be straightforwardly compared as the number of plots used in both studies is different.Considering the much smaller acreage of the remnant forest in Mount Wayang, the DiversityIndex values of the three tree categories still exhibit a relatively high degree of biodiversity.
Floristic Diversity in Three Different Altitudinal Intervals
To determine floristic diversity along the altitudinal gradient in Mount Wayang forest, diversitymeasures were carried out for the three altitudinal intervals—Zones I, H, and III (see Table 3.3).Since diversity, to some extent, is influenced by sample size being used (Whittaker 1972;Simberloff 1979; Magurran 1988), diversity measures among different altitudinal zones werecompared using the same number of plots for each zone.
In general, the floristic diversity at Mount Wayang, based on the number of species found inplots for each category, indicates a difference between Zones I and III, in which Zone III shows a
LEGEND:
S
+• t +
t + + +f. + + + t
f + + t +t t + t
+ t t
' t + vv
.► • -r + +v,vt t VVV*
+ t vvvvvPV??
w • ♦ t 4 d P vt vvv(
t • f + 4,v• t .+ + '
0p + + +3
Z
a
a
I
Camote
t♦+ Winged beans
Squash
E11 Mixed Crop
Onion. Garlicand Tomato
Mustard
Tree
a Taro
a Kadjos
L1t
I1
i aI
3
.Z7
r0Figure 13.4 Vegetation map of a habal in Sitio Li-cod, Barangay Haliap, Asipolo, Ifugao.

Spatial Aspects of Communi ty Structure in Mount Wayang Forest 57
higher diversity. The results of the Diversity Index calculation for each category/group indicate amore or less similar tendency. Based on the average number of species, however, the saplingcategory in Zone I is slightly higher than the other two upper zones. But the average number ofspecies per plot of the poles category in Zone II is the lowest compared with the other two zones.
Table 3.3 Diversity measures in three different altitudinal zonesParameters Category Zone I Zone II Zone III
Mature trees 2.34 2.69 2.65Poles 2.44 2.58 2.81
H' Saplings 2.45 2.41 2.54Shrubs 1.61 1.11 1.71Ground vegetation 1.75 2.55 2.50
Mature trees 0.89 0.91 0.90Poles 0.88 0.93 0.97
E Saplings 0.96 0.94 0.94Shrubs 0.78 0.57 0.78Ground vegetation 0.62 0.77 0.77
Mature trees 0.12 0.08 0.09Poles 0.12 0.10 0.06
D Saplings 0.10 0.10 0.10Shrubs 0.26 0.51 0.24Ground vegetation 0.27 0.14 0.13
Mature trees 14 19 19Poles 16 16 18
Total no. species Saplings 13 13 15Shrubs 8 7 9Ground vegetation 17 27 26
Mature trees 3.1 5.4 6.3Poles 3.3 2.7 3.3
Mean no. species/plot Saplings 2.6 2.4 2.4Shrubs 2.3 2 3.1Ground vegetation 4 5.9 6.3
a. H' = Shannon-Weiner's Diversity Index; E = Evenness Index; D = DominanceIndex.
From the lowermost zone (Zone I) toward the mountain peak, there is a tendency of decreasingspecies dominance (Table 3.3). The forest community in Zone III is unlikely to be dominated byone or two species only, but a more or less even distribution of trees can be observed. The moreeven distribution of individuals among encountered species in Zone III is assumed to indicate amore stable condition. By contrast, the dominance of certain shrub species in Zone II is moreprominent where only one or a few species are dominant as shown by the high occurrence ofEupatorium odoratum and Chloranthus brachystachys.
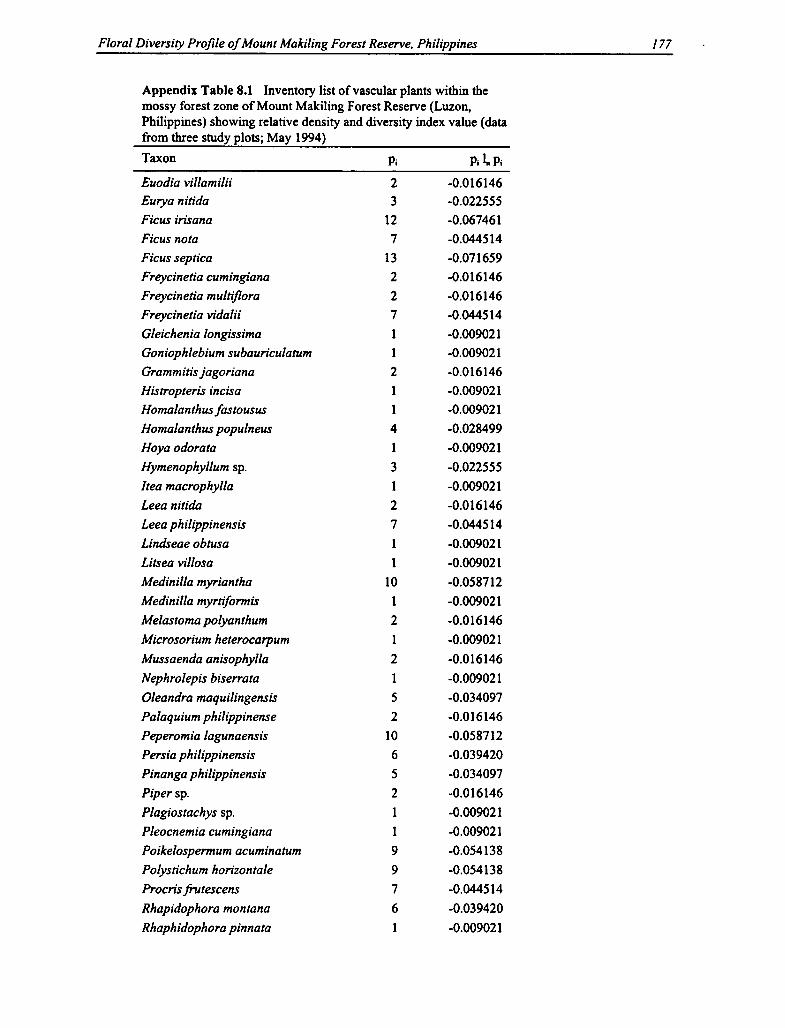
Tota1:0.25 haElevation:.660mas!
Al
Aacad
to
Figure 13.5 Structure and composition of a homegarden in Asipolo, Ifugao.
N
y Citrus Sp p .cMangoQ Christmas Flowerf Thevetia peruviana
CoconutBischcAia javanica
• Stone wallp Codiarium variegatum
(living fence)s Big Stone• Ipil-ipil0 Ainus sp.
Croton tigliumEggplantsTamarindus indicaJ adcfruit
9 SantdGuava
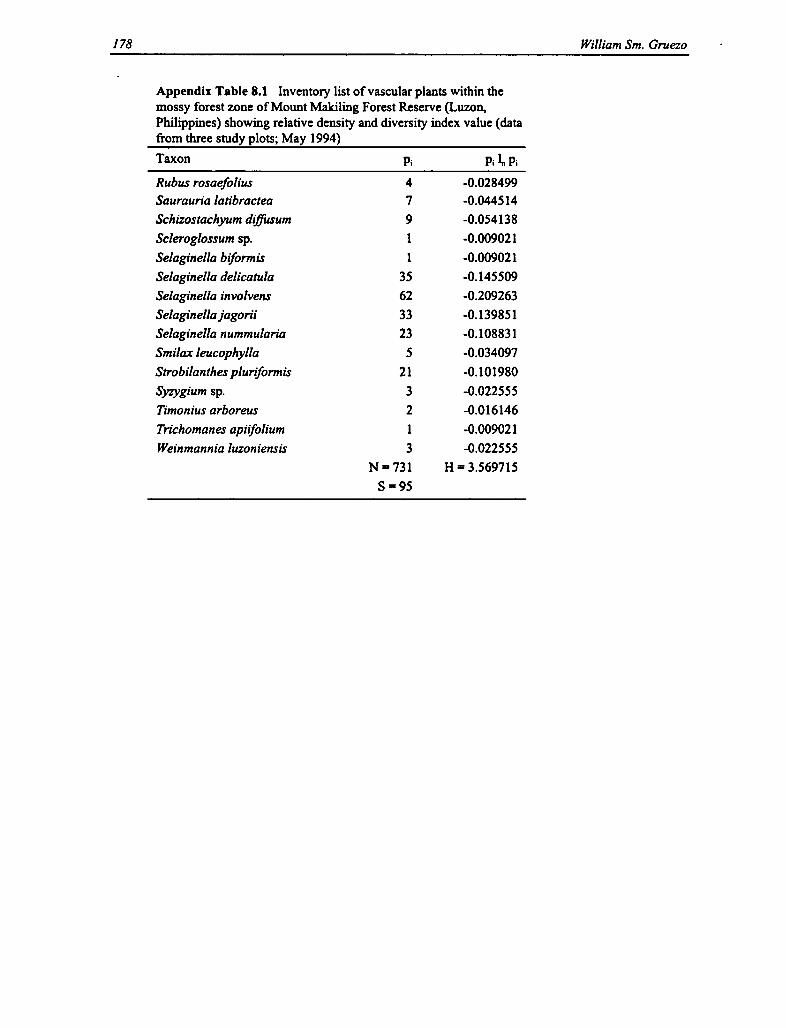
58 Parikesit, Fani Wiardi, and Djuniwarti
Floristic Variability at Different Spatial Scales (Floristic Similarityat Different Scales: Plots and Zones)
Species distribution of a particular category in Mount Wayang not only differs along altitudinalgradient, but within the same zone there is a difference between the northeastern and thesoutheastern parts of the mountain. In Zone III, for example, from all plots established along thetwo transects that were laid out in the northeastern part, it was found that most of the species areconcentrated in this part; a fewer number of species were found in plots in the other two transectsin the southern side of the mountain. For instance, in the sapling category, 16 species from a totalof 21 species were found in plots located in the northeastern part; whereas from plots in thesoutheastern part only 11 species were encountered. Similarly, the number of species in themature trees category found in the northeastern transect is higher than that in the two transectslocated in the southeastern part (i.e., 28 species and 20 species, respectively).
The environmental gradient and biotic interactions in the forest ecosystem of Mount Wayangcause variation in species distribution at the local as well as the zonal scale. To determine thedegree of species change among plots and along altitudinal gradient, species variability atdifferent scales was evaluated.
At the plot scale, results of the Similarity Index calculation showed that among all consideredtree categories and the other plant groups (shrubs and ground vegetation), the shrub groupexhibited lower variabilities (calculation was performed for 930 pairs of plots; 142 pairs or 15.3percent had a Similarity Index value of 50 percent or more). But the pole category had thehighest species variabilities compared with other categories (from 930 pairs of plots, only 9 pairsor approximately 1 percent had a Similarity Index value of 50 percent or more). This suggeststhat in general, species distribution in the shrub group is relatively more homogeneous comparedwith the other groups, especially in the pole category.
In general, the Similarity Index for each category in two compared zones is not too high—only65 percent maximum (Table 3.4). This generally low value is due to patchy distribution of mostof the species among the three zones in Mount Wayang. The result shows that two neighboringzones exhibit a greater Similarity Index value than two zones located apart (except in the saplingcategory between Zones II and III, and in the shrub group in which the Similarity Index valuebetween Zones I and II is slightly lower compared with the Similarity Index of the same groupbetween Zones I and III).
Table 3.4 Similarity Index (%) of each category/group between two zonesCompared zones
Category/group Zone I—Zone II Zone II—Zone III Zone I—Zone III
Mature trees 54 63 41
Poles 65 50 38
Saplings 52 46 47
Shrubs 47 64 48
Ground vegetation 43 49 38
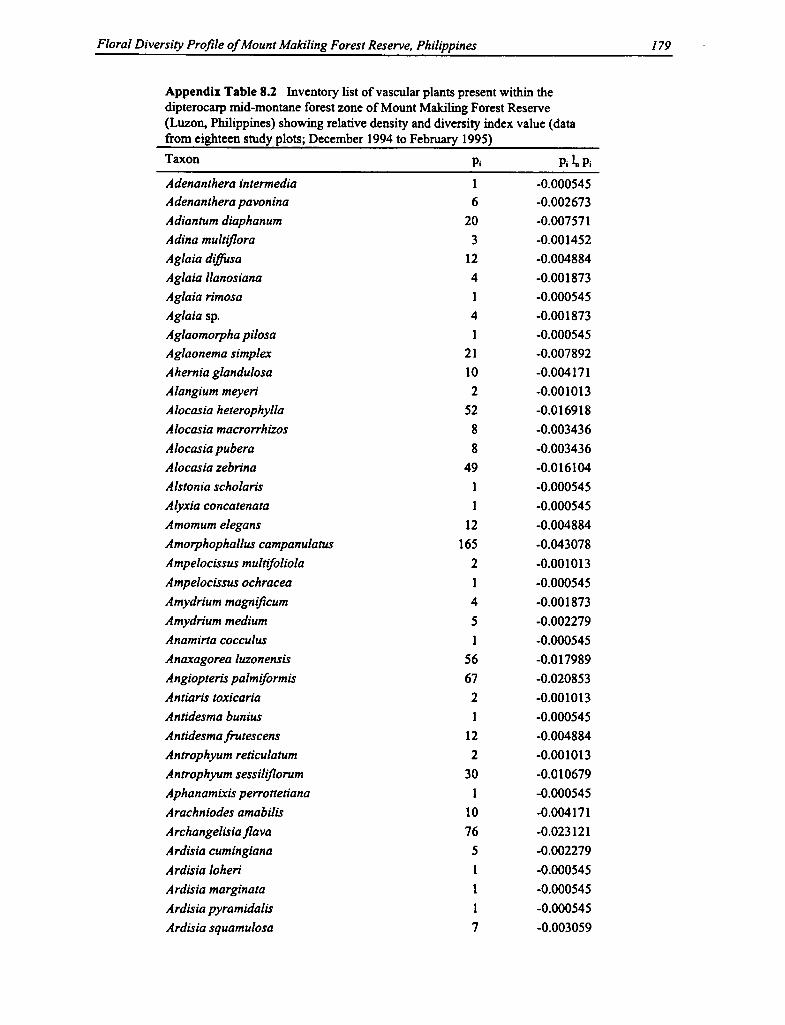
310 Mariliza V. Ticsay-Ruscoe
of the total area of his landholdings. Farmers with more land are more likely to leave a parcel asa woodlot, until the need arises for other land uses or until a more beneficial alternative land useis perceived.
Potentially, woodlots exhibit relatively high species richness (both in types and frequency ofspecies). Much of their biodiversity comes from the presence of originally wild perennials (fromthe original forest vegetation on the site) later enhanced by the planting of other tree speciesaccording to the household's preference or needs. Tree species comprise 37 percent of the totalnumber of species found in the woodlot and account for 80 percent of all the individual plantsfound therein. Grass, sedge, and fern species are scarce, however, due to the shading effect of themore or less closed canopy of the woodlot.
The Coffee Plantation (Nakopihan). Coffee was for some time the only cash crop of theprovince. It was introduced to Ifugao by the Americans in the late 1800s, and the town ofKiangan became the coffee production center of the province. Coffee plantations spreadthroughout Haliap-Panubtuban as an economic response to the local people's need for a crop thatcan be bartered for traded goods. Furthermore, the biophysical conditions of Kiangan in generaland Haliap-Panubtuan in particular are suitable to the agronomic requirements of this crop(Barton 1969; Dixon 1990; Manuta 1993). The high demand for coffee in the early years furtherencouraged the production of coffee in the area and resulted in the conversion of many woodlotsto coffee plantations. A relatively low Shannon-Weiner Index (H' =2.02) was calculated for thecoffee plantation, indicating low biodiversity level in the coffee plantation relative to the otherresource bases.
The Swidden (Inuma-an). Swiddening is a year-round activity of the Ayangan of Haliap-Panubtuban, starting with the selection of appropriate sites from either new forests or old fallowfields. Swiddens provide food and fodder for both the household and its livestock, andsometimes they provide cash from the surplus production of vegetables and other fruits. Swiddencrops vary from cereals and grains (i.e., rice and maize) to pulses, leafy vegetables, root crops(i.e., taro, sweet potato, cassava), bi-annuals (i.e., banana, papaya), and small trees (i.e., coffee,guava) grown in a three-year cycle.
The basic strategy of Ayangan swiddening is diversification of cultivated crops (both food andfeed crops), the maintenance and conservation of noncultigens perceived to be useful in one wayor another (i.e., food, medicine, fiber, erosion control), and maximum use of all space available.The success of this strategy is reflected in the high species count and number of individuals.Swidden produce is intended basically for household consumption so crops are chosen in theswiddens to satisfy household needs but with an eye toward the potential market value in case ofsurplus.
A farmer who wants to expand his resource bases will prepare available land initially for aswidden, even if he currently has one. Farmers also may enlarge the boundaries of an existingswidden by clearing the periphery and planting it to more or new food crops. Field observationsand interviews indicate that if the average Ayangan farmer can have only one type of resourcebase, he will cultivate a swidden plot, as this can provide the basic food (and feed) requirementsof the household plus offers the potential of surplus for cash sales. Thus, there are moreswiddens (in terms of number of plots) in Haliap-Panubtuban than any other resource base,which may be an indication of the Ayangan farmers' choice of swidden as a priority land use.

Spatial Aspects of Communi ty Structure in Mount Wayang Forest 59
Among all plots, three species (Ficus sp., Laportea stimulans, and Litsea sp.) in the mature treescategory are only confined to Zone I. In the poles category, four species (Macaranga javanica,Musaendafrondosa, Saurauia bracteosa, and Villebrunea rubescens) only are confined to ZoneI. As for the sapling category, Cinchona succirubra and Mithephora sp. can only be found in thelowermost zone.
From all sample plots in Zone II, in the mature trees category, five species (Eugenia cuprea,Gordonia excelsa, Ficus ribes, Eurya glabra, and Macaranga sp.) are found only in Zone II. Inthe poles category, besides the two last species, Ficus sp. is the other species that can only beencountered in this zone. Three tree species (Acronychia pedunculata, Cedrela sp., and Eugeniaclavimyrtus) are in the sapling category.
In the uppermost zone (III), a higher number of species in the mature trees category wererestricted to this zone. At least nine species of mature trees are found only in Zone III; amongthem are Podocarpus neriifolius, Acer niveum, Sloanea sigun, and Antidesma tetandrum. In thepoles category, the number of tree species found only in Zone III is even higher-14 species.
Calculation of the Similarity Index between two different diameter classes shows that tworespective diameter classes have a higher Similarity Index value compared with two irrespectiveclasses, except between seedlings and saplings (only 30 percent) (Table 3.5).
Table 3.5 Matrix of Similarity Index (%) between two categories of treesCategory/group Mature trees Poles Saplings Seedlings
Mature trees 100
Poles 77 100
Saplings 59 61 100
Seedlings 36 51 30 100
Forest Resources Utilization
Use of Forest Resources by Local People
Mount Wayang forest provides various "free natural resources" that fulfill particular people'snecessities. However, because Mount Wayang is a protected forest, harvests from the forest areillegal (poaching). But because the majority of the inhabitants living near the forest aresocioeconomically poor, pressure on the available resources cannot be avoided. This does notmean, however, that only poor people encroach the forest in Mount Wayang. In general, theforest resources being used by local people can be divided into the following categories:
Plant Resources. These are the resources most used by the people inhabiting areas aroundMount Wayang. Based on the plant parts being used, the resources can be further categorized asfollows:
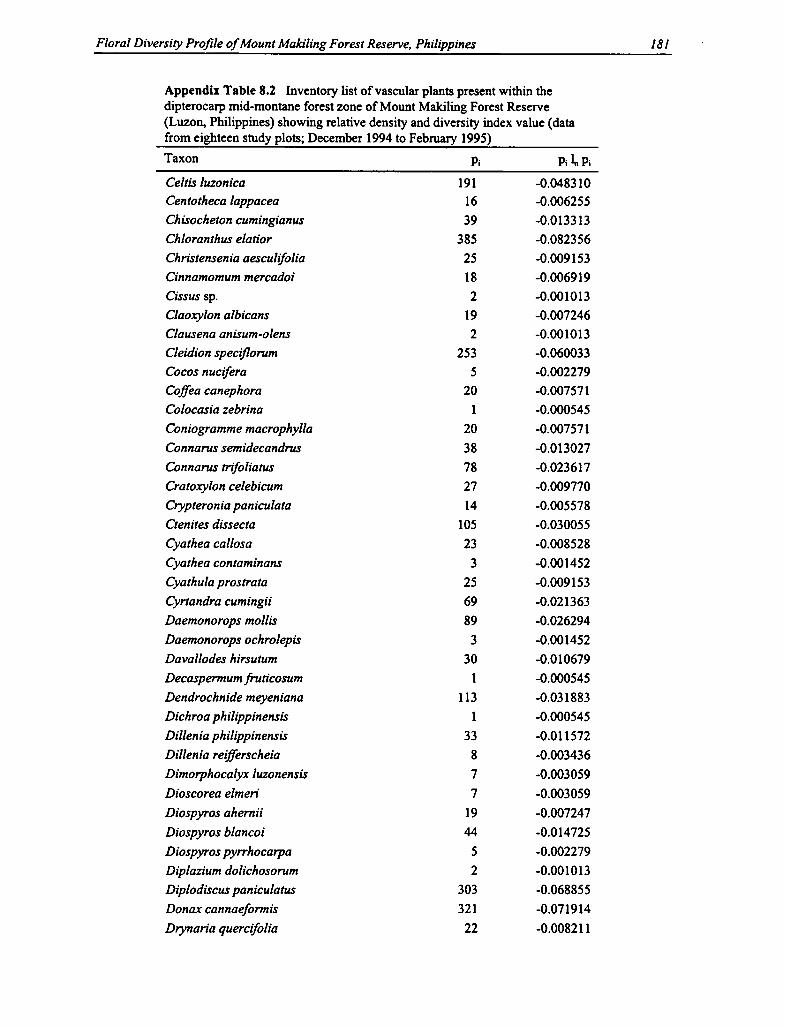
Biodiversity in the Ayangan-Ifugao Landscape 311
Species content of the swidden reflects high crop and weed diversity. Management practicesinclude traditional crop associations, minimal tillage for soil conservation, and enhanced fallow,which contribute to sustainable food production. Tree, shrub, and herbaceous species constitute75 percent of all types of species found in the swidden, although relative frequency ofindividuals of these species may be low, due to the predominance of legumes and other creepingvines (i.e., Ipomoea spp.) used as cover crop for soil protection.
The Rice Terraces (Padjow). The rice terraces have made the Ifugao people world famous. Thelevel terraces, carved out of steep slopes and reinforced by stone walls, maximize the use of landand water resources. These terraces are primarily planted to traditional varieties of irrigated rice.However, in contrast to rice terraces constructed by the neighboring Tuwali of Banaue, the riceterraces of the Ayangan of Asipolo are not as steep as they are wide, reflecting the differingphysiography of each area.
Except for one household respondent, all rice harvested from individual terraced fields is forhome consumption. Baseline data indicate that rice terraces have the lowest species count andSpecies Richness Index, and a Shannon-Weiner Biodiversity Index comparably low to the coffeeplantation. Biodiversity in the rice terraces is very low, due to the nature of the land use itself.Crop management calls for decreasing inter-species competition by eliminating weed species tomaximize yield of the primary crop (i.e., rice). Of significance, however, is the observation thatone or more varieties of rice are planted within the rice terraces, not as a mixed bag of seeds, butin separate subplots. The choice of varieties also is defined by end use (e.g., rice staple, ricewine, taste quality), as well as agronomic factors (e.g., differential grain maturity, resistance topests, drought tolerance).
The Ayangan farmer cultivates other crop and small tree species (e.g., maize, winged beans, taro,papaya) on the bunds of terraces and on any other available space, including on compost moundsin the field, primarily for home consumption. And although rice terraces are intensively managedto prevent rice-weed competition, certain self-sown or volunteer species (e.g., Nasturtiumindicum, Portulaca oleracea, Amaranthus spp.) are tolerated for economic reasons (i.e., they canbe eaten). This accounts for the presence of trees, shrubs, herbs, and vines in this resource base.Furthermore, as no chemical pesticides are used in pest management, fish and snails abound andare collected for home consumption.
The Ifugao generally value rice as a staple food. Therefore, the proper maintenance of riceterraces against excessive soil loss, and care of the communal forests and private woodlots forwater production for the rice terraces, contribute to the long-term productivity of these differentbut interacting resource bases in the Ifugao landscape.
The Bean Garden (Garden). Vegetable production has always been integral to the Ayanganproduction system. A variety of vegetable crops has always been planted in swiddens andhomegardens for home consumption and the surplus production sold at local markets. It was notuntil the mid-I970s that bean production was formally introduced by a government program andbecame popular in the Haliap-Panubtuban area (Bajracharya 1993). Before then, the Ayanganland use followed that of Conklin's description (1980).
In 1980, an additional land use referred to as "garden" became a popular agronomic activity insome municipalities in Ifugao after the Department of Agriculture introduced a programpromoting vegetable production. Initially, farmers experimented with beans or burik (Phaseolus

60 Parikesit, Fani Wiardi, and Djuniwarti
Fuelwood. The main energy for the inhabitants of Taruma Jaya village—the nearest village to theforest—is fuelwood. Approximately 82.5 percent of the interviewed households admitted thatuntil now, they still use wood as their main source of energy, especially for cooking, includingboiling water for cattle feed. Fifteen percent stated that in the past fuelwood was their mainenergy source, but not nowadays; and only 2.5 percent of the families explained that they neveruse wood for daily cooking.
The main reason for using fuelwood is economic. Some 63.6 percent of the families pointed outthat they use fuelwood because of their low income. The best way to acquire free energy sourcefor daily needs is to get fuelwood from the surrounding areas, particularly from the forest nearby.Compared with kerosene, fuelwood is relatively cheaper, considering the multiple functions ofthis traditional technology-using source of energy (i.e., for room heating and seed drying, andthus it cannot be replaced by kerosene).
Fuelwood collection by local inhabitants from Mount Wayang is very intensive and occursthroughout the year. The Taruma Jaya people, for example, rely heavily on wood for energy-98.5 percent stated that wood is needed to cook, to warm their bodies and their house, and to dryseeds. Only 1.5 percent of the interviewed families pointed out that there is no other function ofwood except for cooking.
The tree species mostly used by people are Eucalyptus alba, Quercus sp., Pinus merkusii,Castanopsis argentea, Schima walichii, and Engelhardia spicata. In addition, some shrubbyspecies are used, such as kirinyu (Eupatorium odoratum) and prickly lantana (Lantana camara).Most of those tree species are found in Mount Wayang forest, except for E. alba, which wasplanted by people on their land. Basically, the people's choice of species is based on the qualityof the wood to be burned, the amount of smoke produced, the length of burning, and theproduction of charcoals that can be used for ironing. In the past when wood was plentiful, peopleused to have preferences on the kind of fuelwood they wanted to acquire. Nowadays theavailability of good quality fuelwood is limited and people use any type of wood or even shrubs.In terms of size, people now collect or cut trees of any size, from sapling to big dead trees. Onthe other hand, the great abundance of shrub species make these species easier to find. People donot have to go farther into the forest only to get dry shrubby species. This kind of fuelwood iseasy to carry, although the quality of shrub species is not as good as tree species because shrubsbum easily and usually produce a great deal of smoke. Some respondents mentioned that actuallyall woody species can be used for fuelwood if they are dried, but the burning quality is not thesame.
In general people collect their fuelwood by themselves, either from the forest or from their land.The survey shows that approximately 66.7 percent of the family users get the wood themselves;21.2 percent of the respondents stated that sometimes they buy and also acquire the fuelwoodthemselves. But the rest (12.1 percent) always buy fuelwood from others. The price is Rp. 3,000(US$1.25) for 1 pikul (1 pikul consists of two bunches of fuelwood). From measurements under-taken in the field, I pikul is approximately equivalent to 50 kilograms. The amount of fuelwoodused by each family varies between I pikul and 6 pikuls per week, depending on the number offamily members, season, kind of species, and usage. The size of the chopped wood is about 40cm long, 10 cm wide, and 1 cm thick.
People usually obtain fuelwood around their homes-79.5 percent of the users stated that theycollect fuelwood from the forest (Mount Wayang), while 11.4 percent admitted that they collect

312 Mariliza V. Ticsay-Ruscoe
vulgaris) on any available land—a small portion of the swidden, on some drier spots in terracedfields, and in small plots in homegardens.
The conversion of swiddens and dry terraces to bean gardens was not entirely due to marketconditions. It can be attributed primarily to existing environmental conditions. In the early 1980swhen global climate changes have been felt (i.e., prolonged dry season resulting in drier riceterraces), farmers were forced to find an alternative crop, and Phaseolus vulgaris seemed to bethe answer. The farmers were attracted to its short growing season (three months per crop) and astrong growing market value.
As the cash and material needs of some farmers increased, bean gardening became more popular,and more farmers appropriated additional land for bean gardening. Several farmers in Haliaphave actually opted entirely for bean gardening as their source of livelihood, converting dryterraces and old swidden plots into large bean gardens. Bajracharya (1993) reported that themajority of the bean gardeners are young, single males who can devote more of their time tointensive cultivation of farmlands and who can take the greater risk inherent in producing asingle crop with fluctuating market value. The findings of his study did not entirely support thisconclusion, however.
Although gardens are cultivated mainly for the production of cash-crops, snap beans, andminimally for other vegetable crops (e.g., winged beans, eggplant) for home consumption,sometimes traditional rice varieties can be found planted on the borders of garden plots. Someuncultivated species are also tolerated (e.g., Amaranthus spp., Solanum nigrum, Nasturtiumindicum) and harvested for home consumption.
In terms of biodiversity indices, however, results indicate that although species counts are lowerin bean gardens compared to swiddens, the Shannon-Weiner Index in gardens is slightly higherthan swiddens due to the lower species-to-individual ratio found in bean gardens than inswiddens. Trees, shrubs, herbs, and graminoids contribute about two-thirds of the total numberof individuals while the main crop contributes only about one-third.
The Homegarden (Ngilig). The homegarden is defined locally as the area occupied by andsurrounding the house. Generally, it is planted mostly to ornamentals and a variety of vegetablesand clearly delineated by fruit trees (e.g., coffee and pomelo) and the Areca palm.
Ornamental species are generally planted in the homegarden, making up hedgerows and livingfences around the periphery of the front yard. Vegetable species are either planted intentionallyor casually (with seeds tossed out of the window) for home consumption. Fruit trees andparticularly the Areca palm are planted not only to provide fruits and nuts, but most importantlyto serve as living stakes or visible markers of landownership.
The homegarden also serves as a seed bank or repository of planting material and a nursery foracquisitions from other resource bases (e.g., orchids from the forests, seeds of fruits from themarket) and an experimental plot for new crop species. In effect, the homegarden is an extensionof the swidden for the production of food crops; an extension of the woodlot for fruit, fuelwood,and construction materials; for the environmental function of shade; and aesthetics.
It seems that all households will have a homegarden, as it is the area in the immediatesurrounding of the house, cultivated or maintained for the production of a variety of annuals and

Spatial Aspects of Communi ty Structure in Mount Wayang Forest 61
fuelwood from anywhere, from the forest (including from the plantation forest) or cinchonaplantation, or other places. Only 9.1 percent of the respondents stated that their fuelwoodoriginates from areas outside the forest, such as their homegarden.
Construction materials. The wood from the forest is also used for construction materials and tobuild cattle pen. Data obtained from interviews show that about 30 percent of the respondentsadmitted that they have once poached the forest to cut trees, apart from collecting fuelwood. Thediameter of the trees mostly used is 35 cm or less, but it is sometimes bigger.
Cattle feed (fodder). Other forest resources used by local people include forest fodder to feedcattle. Young leaves of certain tree species or various grasses and herbs are harvested from theforest to fulfill the great demand for fodder. Species such as Ficus spp., Macropanax dispermum,Boehmeria platyphylla, and Musa acuminata are among the most harvested plant species. In therainy season, however, people still can obtain fodder such as grasses and agricultural wastes(e.g., carrot leaves, cabbages, potato leaves, sweet potato leaves) from agricultural land in thevicinity. In the dry season, people must look for other sources to get sufficient cattle feed.Usually they use forest fodder, apart from forages obtained from agricultural land and fromhomegardens. According to Hamilton and King (1983), lopping twigs and branches to providefoliage as fodder for livestock is a widespread practice in developing countries. This activity willcause similar impact as in fuelwood collection and is usually associated with it.
Ornamental plants. Some wild plants are taken by people from the forest to be domesticated forornamental plants (e.g., kumpay—a species of fern—and several species of orchids). Some treespecies such as Eugenia sp. and Zanthoxylum sp. are harvested to make bonsai. The occurrenceof the latter species in Mount Wayang forest is very rare nowadays; none of the individuals ofthis species was found when this study was being carried out. In the past, plants extracted forbonsai materials was not only done by local people but also outsiders when bonsai was popular.The overharvesting of vegetation for ornamental plants that exceed natural regeneration leads tolocal extinction of many species such as experienced by Zanthoxylum sp. and certain species oforchids.
Animal Resources. Field observation and also from interviews with local people indicate thatapart from plant resources, certain wild animal species are also hunted (for subsistence) ortrapped (to be sold as pet animals). Among wild animals that have economic value because oftheir vocal abilities and beautiful feathers are various bird species such as Acridotheresjavanicus, Gallus gallus, Pycnonotus aurigaster, Lanius scach, Macopygia unchall, Geopeliastriata, Megalaima armillaris, and Zoothera citrina. During data collection, we met huntersaccompanied by dogs about to go hunting for wild pigs (Sus sucrofa). This species is regarded bylocal farmers as a pest for agricultural crops.
Other Resources. Prior to 1986, farmers were allowed to cultivate land within the plantationforest in the so-called tumpangsari program. But since then, this activity has been prohibitedbecause it was suspected that the tumpangsari program in the uppermost part of Citarum RiverBasin caused severe floods (Hardjono 1990). Nevertheless, at present some farmers stillencroach the forested area and use the open areas in the forest for agricultural land. Thosefarmers are not only the poor and landless; sometimes rich farmers also participate in illegal landcultivation in the forest. They cultivate various horticultural crops such as potatoes, carrots, andother vegetables.

Biodiversity in the Ayangan-Ifugao Landscape 313
perennials. However, results of the study show that 28 percent of the respondents did not actuallycultivate or maintain the surrounding area of their homesites, owing mostly to lack of land tenurewhere the houses are built. Unlike swidden plots, which may be "borrowed" and cultivatedwithout security of tenure, homeowners who do not own their homesites do not have themotivation to develop the homegarden, especially with perennial plants. At the most, thesehomeowners plant flowers and some spices such as chili peppers. Following the aforementioneddefinition of a homegarden, the area surrounding their residence is not considered a homegarden.
The homegarden exhibits the highest biodiversity not only in terms of taxonomic diversity but interms of the other standard measures of biodiversity. Its high biodiversity status may be due tothe fact that the homegarden has become a general "dumping" ground for everything andanything. Ornamentals are intentionally cultivated for their aesthetic value; some spices andvegetables (chili, tomato, eggplant, onion) are planted within the vicinity of the house for quickand easy access during meal times; trees are planted to provide not only fruits or fuelwood butshade in the garden. Trees and shrubs contribute about 68 percent of the total number of speciesand about 65 percent of all individuals found; herbs and other vines contribute about 45 percentof the total number of species or 52 percent of all individuals found; and graminoids contributeminimally.
In this case, the resource base with the least intensive cultural management (i.e., no weeding, noland preparation, no fertilizer application) but with the most frequent human visitation seems toyield the highest biodiversity. In contrast to Christanty's discussion (1990) of the ecosystemanalysis of a Javanese homegarden (1990) wherein "the effort of the owner to obtain maximumbenefits from the garden by planting it with many plant species" accounts for the highbiodiversity of the Javanese homegarden, the Ayangan household does not rely entirely onhomegarden produce for its basic needs for food, fodder, and fuelwood. For the Ayangan farmer,the homegarden is a supplementary source.
Factors Affecting Species Diversity in the Resource Bases
Table 13.6 presents a summary of the significant factors affecting mean species count in theresource base level. There is very high negative correlation between stoniness of site and meanspecies count; the more stony the site, the less is the species count. Stoniness indicatesworkability of the site or a high demand for labor. The farmer tends not to plant many crops onstony sites, if at all. Furthermore, crop suitability is highly dependent on site quality. It wasobserved that very stony plots are planted solely to Ipomoea batatas (with minimal tillage), notas a major crop (tubers are not harvested) but as a soil erosion measure.
Table 13.6 Summary table of significant factors affecting mean species count in the resource base levelF values
(1) (2) Coffee (3) (4) Rice (5) Bean (6)Variable Woodlot plantation Swidden terrace garden Homegarden
Tenure - - 0.0 n.s. 0.12 n.s. 1.78 n.s. 1.13 n.s.
Stoniness 2.08 n.s. 2.49 n.s. 8.99* 0.97 n.s. 0.18 n.s. 2.78 n.s.
Acquisition - 2.0 n.s. 0.55 n.s. 0.78 n.s. 0.84 n.s. 0.70 n.s.
n.s. = Not significant.* = Significant at 5% level

62 Parikesit, Fani Wiardi, and Djuniwarti
Some farmers admit that cultivating an open space in the forest provides them more benefitsbecause crop yields might be higher than that from agricultural land in the village. They arguethat forest soil is more fertile than agricultural land. Some farmers pointed out that their ownland is becoming more and more infertile due to inappropriate agricultural techniques beingpracticed for decades.
Farmers mentioned that even with lower inputs (fertilizer), as compared with that in agriculturalland in the village, soil in the forest area will give them higher crop yields. Apart from cashoutlay, they do not have to spend energy (personnel) to build terraces in sloping areas. Mostlikely, the practices of most farmers are not sound from a sustainable basis, which willconsequently cause serious problems for soil conservation. Furthermore, if agricultural activitiesare not managed properly, they will become a serious threat to the Citarum River.
Impacts of Forest Resources Useon Vegetation Development in Mount Wayang
Due to the limited acreage of Mount Wayang forest (i.e., less than 1,000 hectares), no forest partis left undisturbed. Evidence of human intervention can be encountered throughout the forestfrom the foot of the mountain and up to its peak. It is actually difficult to evaluate the impact ofhuman disturbance on species composition or even on species density in Mount Wayang, sincethere is no undisturbed forest cover that can be considered for comparison assessment.
The use of various resources found in Mount Wayang forest has, to some extent, caused animpact on the local environment, especially on the overall development of forest vegetation. Themost prominent impact of human disturbance (i.e., tree cutting) is on population structure, whicheventually affects the dynamics of vegetation as a whole. The loss of forest cover in some partsof Mount Wayang is prominent, particularly in the middle zone. As stated by Smiet (1992),forest degradation as a result of tree cutting is described as a process in which basal area andcanopy closure (at 20 m above the ground) are ultimately reduced, in spite of regrowth.Furthermore, Smiet pointed out that due to tree cutting, species composition and relative abun-dance change gradually, and ultimately one plant community replaces the other.
Guindon (1996) pointed out that limited acreage of protected areas, combined with increasinghuman demands for the land outside these areas, means that habitat fragments will play animportant role in maintaining biodiversity within the tropics. Despite a high degree of plantspecies diversity in Mount Wayang, most of the species have low individual density. Thescarcity of these species is likely due to limited regenerative capacity in which they are not ableto compensate the depletion of their population caused by overcutting. Engelhardia spicata, onthe other hand, dominate Mount Wayang forest because this tree species did not experiencesevere cutting. Nowadays, however, some inhabitants also cut this tree, particularly young treesfor fuelwood. But whether the infrequency of E. spicata saplings in Mount Wayang is due tocurrent felling or natural causes needs further investigation.
Even though the short-term impact of deforestation could be a loss of biological diversity, it islikely that the impact of forest resources exploitation on plant diversity is difficult to evaluatequantitatively if it were to be carried out in a short-term period. The impact of overexploitationon particular plant species, however, which formerly were found very common, such asZanthoxylum sp., Podocarpus imbricatus, and Castanopsis argentea, is prominent, as indicatedby the results of vegetation analysis in Mount Wayang and interviews with inhabitants of the

314 Mariliza V. Ticsay-Ruscoe
With respect to the effect of tenure, there is no statistically significant difference on meanspecies count in the different resource bases. From field observations, key informant interviews,as well as other studies in Haliap-Panubtuban (Manuta 1993), farmers who "own" land tend toplant more perennials (e.g., coffee, pomelo) and plant swidden areas to a variety of food cropsfor home consumption.
Likewise, the mean species count of the resource base. Acquisition may be through inheritance,purchase, rental, mortgage, pioneering, borrowing, or a gift. Although of no statisticalsignificance, inherited woodlots exhibit the highest mean species count. This could probably bedue to the length of time as a woodlot and the inherent high species diversity of this type of landuse.
Summary of Factors Affecting Biodiversity Management and Conservation in the AyanganSwidden-Based Production System in the Haliap-Panubtuban Landscape
Species composition and diversity in vegetative cover can be directly linked to the nature of theresource base and the patterns of land-use conversion, to especially the more intensifiedproduction of agricultural crops in the Haliap-Panubtuban landscape. The biophysical, sociocul-tural, economic, and institutional factors that influence land use conversion and consequentchanges in biodiversity levels in Haliap-Panubtuban were identified and are discussed in detailbelow.
Site Quality. Species composition and distribution (i.e., biodiversity) can differ significantly asinfluenced by varying elevation and topography of the land. For example, certain plant species(i.e., Pinus spp.) naturally grow at high elevations (e.g., 1,000 m asl) as in Barangay Haliap.Land use can vary considerably by elevation and topography. A biophysical slice of the Haliap-Panubtuban landscape shows that communal forests are found at the highest elevations, with therice terraces at the lower elevation and less steep slopes. Swiddens meanwhile are usuallylocated above the rice terraces in steeper slopes, while bean gardens are located on flat plains.Home settlements may vary slightly but are usually located in lower elevations on areas of flattertopography.
Soil fertility and acidity have a profound influence on crop productivity as both influence thetype, species, and varieties of crops to be planted. On areas of high soil fertility such as in anewly opened swidden, highly valued crops (i.e., upland rice) are favored for the initial planting.Less demanding crops or crops tolerant to low nutrient status such as sweet potato and cassavaare planted as soil fertility decreases through years of cultivation. The decline in soil fertility asperceived by the farmer is the primary reason for permitting the farm plot to lie in fallow.Stoniness of the site determines workability of the area and consequently determines cropsuitability. Furthermore, other soil physical characteristics such as structure, texture, andporosity determine moisture absorption and water availability and retention. Most of Haliap-Panubtuban is steep and rocky with limestone outcrops and is suitable for root crops that requireminimum tillage.
Weather and Climate. Rainfall and the prevailing temperature modify the vegetation of an area,as these highly affect the agricultural activities and cropping patterns. Successful introductionand domestication of new crops largely depend on climatic compatibility. In Haliap-Panubtuban,precipitation is a limiting factor to agricultural production. During the two-year duration of thestudy (July 1991—August 1993), the climatic conditions in the area (and the entire country) were

Spatial Aspects of Community Structure in Mount Wayang Forest 63
nearest village to the forest. Similar to the majority of species in tropical forests that are prone toextinction, the population of those three species is now decreasing from forest harvesting (use ofwood for construction materials and fuelwood, and extraction of certain species as ornamentalplants). The impact of tree cutting is aggravated by uneven distribution of the aforementionedspecies, as well as the majority of other species throughout the forest area. Consequently, furtherfragmentation may cause disappearance of the species from particular parts of the forest. This, inturn, will affect the future existence of the species in the entire forest.
The impact of excessive tree cutting for construction materials on vegetation structure may besubstantial, especially if the kind of wood preferred is scarce. Vegetation analysis carried out inMount Wayang secondary forest, and also the information given by some key informants,indicate that some species of trees that have good quality of wood are rarely found in MountWayang; whereas, in the past, species such as Podocarpus imbricatus and Castanopsis argenteawere very common in the forest. Further impact of tree cutting might be even greater, as thecanopy will be greatly reduced, the humus layer on the forest floor will be eroded, and ridges andfurrows will be created.
Other impacts of tree felling in Mount Wayang affect forest regeneration. As indicated frominterviews, local people mostly cut young trees to fulfill their needs for construction materialsand fuelwood. Cutting of sapling and pole categories will affect the future composition andstructure of Mount Wayang forest. Nevertheless, tree cutting is not the only cause that affectsforest regeneration; limited capacity for seedlings establishment for most of the species isanother important factor.
As for use of fuelwood and fodder foliage, Hamilton and King (1983) suggest that in watershedmanagement, focus has to be concentrated on two factors (i.e., restricting the intensity ofharvesting to long-term sustainable levels so that no conversion occurs and controlling the wayin which material is removed from the forest).
Human disturbance in Mount Wayang does not only affect the horizontal structure of vegetationbut also its vertical structure. Excessive logging in the past and continuing tree cutting practicedby local people have profound impact on the complexity of the forest's vertical structure. Insome parts of the forest, the reduction of stratification complexity is obvious. Multistoriedlayering has been converted into simpler layering.
The composition and structure of forest vegetation in Mount Wayang may also be influenced bylong-term hunting and trapping activities on certain wild animals. In Mount Wayang, manyspecies of plants such as Ficus spp. rely on certain wild animals (e.g., birds) for seed dispersal.Some of the trapped bird species are frugivores such as Dicaeum spp. (see Ch. 4, this volume).Therefore, the decrease in their population will also decrease the dispersion of seeds and theregeneration of certain tree species in Mount Wayang. As pointed out by Peters (1994), a largemajority of tropical trees rely exclusively on animals to transfer their pollen. On the other hand,disturbance of the vegetation would directly influence the life of all kinds of animals such asPrimates—one of them is Presbytis comata, an endemic species of West Java—and various birdspecies.
The long-term impact of forest encroachment is not only prominent for the future of the forestitself but also for the sustainability of the entire Citarum watershed. Loss of forest cover will

Biodiversity in the Ayangan-Ifugao Landscape 315
described by several respondents and key informants as "not normal." There was a prolonged dryseason in early 1992, resulting in crop failure of both irrigated and rainfed rice planted inOctober 1991 and February 1992, respectively. Furthermore, the normal April and May showersdid not come, delaying swidden cropping scheduled in late May to early June. The rains thatcame were severe with strong winds and torrential downpours that devastated a great deal of thenorthern parts of Luzon, including the province of Ifugao. The extended rainy season in 1993 hadset a record for the maximum number of typhoons in a single year in Philippine-recorded history(PAG-ASA Weather Report, Dec. 1993).
Hydrology and Access to Water Supply. Water is extremely important for both domestic andagricultural uses, particularly for wet rice terraces. Regular water supply is not entirelydependent on rainfall alone but also depends on conditions of watershed vegetation. The deephumus layer of undisturbed forest soils has a sponge effect, retaining rain water and graduallyreleasing it to feed streams and rivers. The drying up of springs and general water shortage dueto the aforementioned drought resulted in the drying up of rice terraces, particularly the upperterraces, which has been a primary factor in the conversion of pond fields to bean gardens.
Crop Characteristic. The choice of crops is highly use-defined. Certain crops are more favoredor valued due to their high productivity and low material (i.e., fertilizer subsidies) and laborrequirements. Other important considerations are better taste (as in some traditional ricevarieties), marketability (i.e., snap beans, coffee), multiple utility as feed or fodder (i.e., sweetpotato, maize), and environmental influences as a protective cover crop (e.g., camote). Certaincrops can therefore serve as good indicators of site quality (e.g., graminoids vs. perennials) andfarm family conditions such as market orientation (e.g., snap beans), tenurial security (e.g.,Areca palm, perennials), cropping stage within the life of the plot (e.g., first crop vs. secondcrop; rice vs. vegetables), household preference, and other land-use activities (rice vs. beans vs.fodder species). Specific plant indicators will be enumerated in later discussions.
Accessibility of the Farm. Distance of the farm from the farmer's home settlement is anotherimportant criterion in site selection for a farm plot. Most swiddens and pond fields are locatedwithin fifteen to thirty minutes of walking distance. Proximity to one's other plot(s) may also beimportant as this gives easy access to a farmer who may be cultivating two or more swiddens inaddition to a rice field, and who has to get to his/her home in time to prepare the family's meals.Most bean gardens are established near existing roads and trails to facilitate market transfers.
Traditional Cropping System. Even if the high market value for beans has attracted land-useconversion, it was also observed that many older farmers, who opted for intensive beancultivation for cash, revert to rice farming as soon as irrigation water becomes available with theonset of the rainy season. Some bean gardeners have also managed their gardens differently andhave developed slightly different cropping schemes that put less pressure on the soil. Accordingto key informants, planting the land with a crop other than rice (e.g., snap beans, mung bean)during its rest period helps the land to restore its fertility: the first crop planted in January is rice(a four-month crop); the second crop planted in June is beans (a three-month crop); and this maybe followed by a third crop of beans planted in September. The land may be left to lie in fallowuntil the year begins again with rice. The choice of beans as the alternative crop meanwhile isinfluenced by the market. Before beans became popular, rice was normally planted in theterraces or swiddens in January, with an option for a second rice crop in June or July. The otheroption was to leave the terraces fallow for the rest of the year and concentrate household labor to
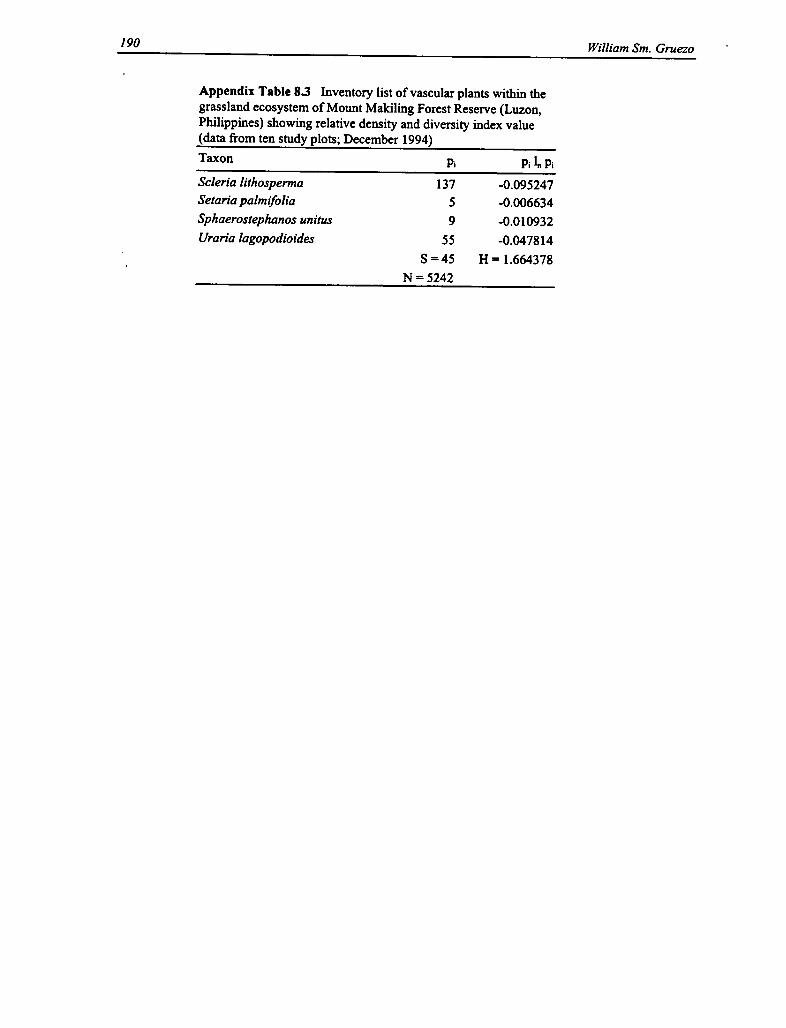
64 Parikesit, Fani Wiardi, and Djuniwarti
affect the ecological and economic functions of Citarum River Basin, which ultimately willaffect the livelihood of people that depend on the functioning of the basin.
Conclusion
The seral vegetation that can be seen today in Mount Wayang is partly a result of forestexploitation such as logging practiced in the past. Despite serious ongoing pressure from humanintervention, although less intensively, and considering that only half of the mountain wasstudied, the degree of floristic diversity in Mount Wayang is still relatively high (i.e., a total of106 species, in which 53 species are trees, were found in the sample plots). The dynamics ofbiodiversity in Mount Wayang reflect the influence of abiotic factors including spatial andtemporal variabilities and long-term human intervention. Nevertheless, the remnant natural forestin this area exhibits a great spatial variability, indicating that species distributions throughout thearea are not homogeneous. This heterogeneous species distribution might cause speciesextinction at the local level if forest encroachment as currently seen causes substantial forestfragmentation.
Given the short study period, the disturbances caused by humans on the community structure offorest vegetation in Mount Wayang were not easy to predict. However, the effects of disturbanceon tree population structure of a particular species could be observed. Natural phenomena suchas treefalls and human disturbance have resulted in spatial heterogeneity that have given theopportunity for various species to co-exist. This ultimately was followed by a high diversity ofplant species. The high degree of biodiversity in Mount Wayang indicates the magnitude ofpotential resources that may attract the inhabitants of the nearby village to encroach the forest.
Based on the altitudinal intervals, the inter-zone floristic diversity shows very slight differencesand, in general, the species diversity increases from the lower part toward the peak of themountain. It is likely that the intensity of human disturbance in Zone II is relatively higher.
In general the density of the four tree categories being studied is relatively low. This illustratesthat biodiversity management in Mount Wayang is not an easy task, considering serious pressurebeing imposed by local people on forest resources. The average individual density per plotdiffers slightly among altitudinal zones. Some factors such as spatial heterogeneity anddisturbance level are among responsible factors for this difference. Among tree categories, theaverage individual density of poles and saplings in the middle part of the forest—part of theforest where human disturbance is likely to be the most intense—is lower when compared withthe other categories/groups.
Current forest exploitation being practiced by local people is not on a sustainable basis. In treecutting, for example, people tend to cut poles or saplings, which are very important for the futureexistence of Mount Wayang forest. Strict forest protection and exclusion of people from theforest, however, will not ensure biodiversity maintenance in the future. Therefore, focus has tobe given to solving problems. For example, how can we diminish high dependency of localpeople on forest resources and strengthen institutional capabilities (including improvement ofhuman resources) of Perhutani as the managing agency? Biodiversity conservation in MountWayang will not prosper unless the interests of local people are taken into account. As pointedout by Lyon and Horwich (1996), traditional forest-protection strategies that emphasize humanexclusion are no longer effective in protecting and maintaining biodiversity in disturbed tropical
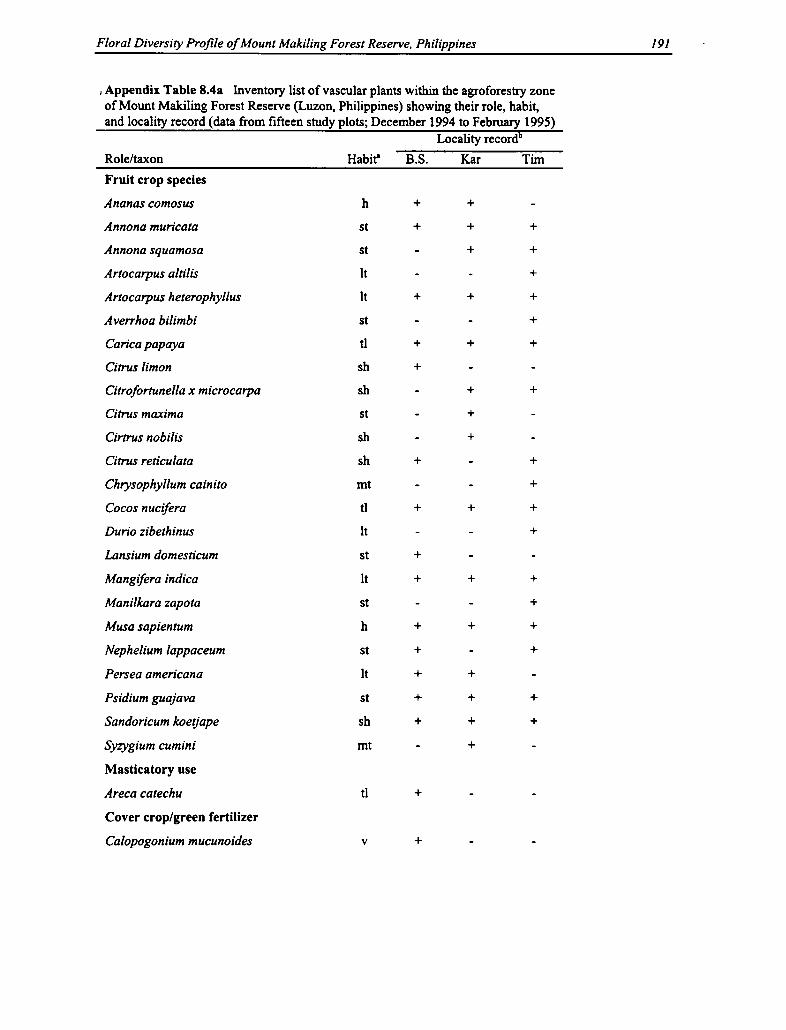
316 Mariliza V. Ticsay-Ruscoe
swiddening and other nonfarm or off-farm activities such as weaving and basketry or labor-hiring, which are alternative sources of cash.
The cropping system in Haliap-Panubtuban is the result of the farmer's perception of householdrequirements not only for food but social obligations, cultural rituals, and cash. The croppingsystem of the Ayangan of Haliap-Panubtuban is therefore "a mosaic of a variety of cropsincluding rice, maize, legumes, sweet potato, banana, papaya, betel nut, coffee, pomelo, rattan,and other food and tree crops" (Guy 1995). As the cash and material needs of the householdincrease, modifications in the traditional resource management systems are made to includemore income-generating activities.
Animal production is an important component of many traditional agricultural systems such asthat of the Ayangan-Ifugao. Not only does livestock provide draft power (e.g., carabao transportmarket produce; carabao-logging) and food products (milk, eggs, meat, hide), certain animals areimportant for Ayangan rituals. Dowries (fonong), thanksgiving feasts (falaong), and sometraditional rituals (funinalishong) require animal offerings to deities and spirits. Moreover, theAyangan's system of kinship is manifested in a ritual of meat-sharing (ipad). The importance oflivestock in the Ayangan way of life is reflected by the crops cultivated on their farm (i.e., sweetpotato, maize, cassava, and taro) not only for home consumption but, more importantly, foranimal feed. The most common livestock raised in the area is the native pig, which is arequirement in many sociocultural and religious celebrations and rituals. Chickens and ducks arealso used for ritual offerings and for home consumption. Cattle and carabaos are employed asdraft animals. Goats are increasingly becoming popular for meat, and dogs, which are the usualhouse pets, are also a delicacy in the Ifugao cuisine (i.e., kinilaw).
Population Pressure. Boserup (1965) noted that population pressure is a constant condition thatcompels communities to adopt fundamental changes in livelihood and technology. Dixon (1990)further noted that population growth is the key not only to the intensification of the existingcultivation methods but also to the transition to new, more intensive systems that includediversification into handicraft and trading. For most communities relying on swidden cultivation,the response to a need for more food or cash is to expand the area under cultivation. If land areais fixed, the fallow period is shortened and the land is cropped more frequently, eventuallychanging the whole cropping system. According to Malayang (1990), other responses topopulation pressure are along the lines of socio-demographic factors (i.e., through changes in thesocial relation of production-like tenurial arrangements; see discussion on tenure below).
Labor Availability and Material Inputs. Although cash-crop production is usually profitable, itis more expensive in terms of labor required annually. Aside from the expected increase inmaterial inputs (e.g., inorganic fertilizers and pesticides), this increased demand in labor is adeciding factor whether a household will convert from subsistence production in the swiddensand rice terraces to cash-crop production in the bean or vegetable garden. In many cases,farmers, especially swiddeners who are mostly women, do not convert, or if at all have tried onceand reverted to swiddening due to this increase in labor input in bean gardening.
For households who opted for bean gardening as the major farm activity, a significant drop incrop production for home consumption has been observed, resulting in a decrease in new forestopenings for swidden. At the same time, land allotted for bean production becomes intensivelyand continuously cultivated with the use of chemical inputs. Furthermore, it was observed that
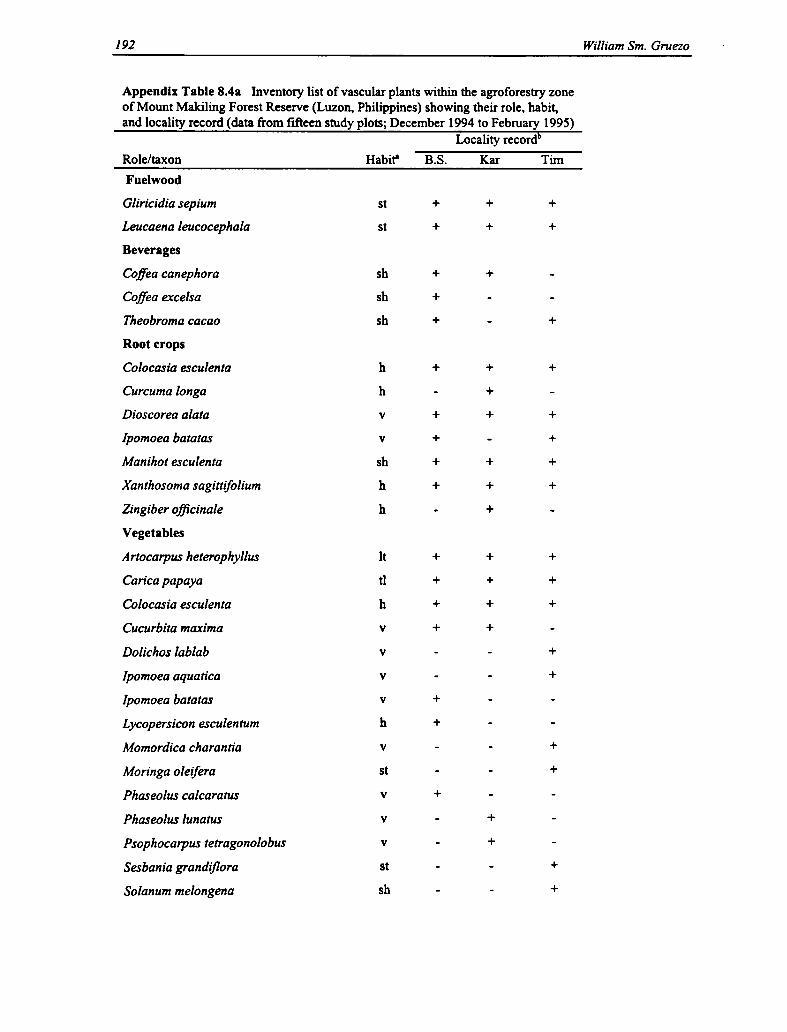
Spatial Aspects of Community Structure in Mount Wayang Forest 65
landscapes. McNeely et al. (1990) also stated that improving standards of managing species andprotected areas will only partly solve the problem of biodiversity conservation. The fundamentalproblems in biodiversity conservation lie beyond protected areas in sectors such as agriculture,mining, pollution, settlement patterns, capital flows, and other factors relating to the largerinternational economy.
References Cited
Backer, A., and R. C. Bakhuizen Van Den Brink, Jr. 1965. Flora of Java (spermatophytes only). Vol. 2,Angiospermae Families, 111-60. The Netherlands: N.V.P Noordhoff, Groningen.
Barik, S. K., H. N. Pandey, R. S. Tripathi, and P. Rao. 1992. Microenvironmental variability and speciesdiversity in treefall gaps in a sub-tropical broadleaved forest. Vegetatio 103:31-40.
Felfili, J. M. 1995. Diversity, structure, and dynamics of a gallery forest in central Brazil. Vegetatio 117:1-15.
Guindon, C. F. 1996. The importance of forest fragments to the maintenance of regional biodiversity inCosta Rica. In Forest patches in tropical landscapes, ed. J. Schelchas and R. Greenberg. Washington,D.C.: Island Press.
Hamilton, L. S., and P. N. King. 1983. Tropical forested watersheds: Hydrologic and soils response tomajor uses or conversions. Boulder: Westview Press.
Hardjono, J. 1990. The dilemma of commercial vegetable production in West Java. Project Working PaperSeries No. B-2. Institute of Social Studies, Bandung Research Project Office.
Kusmana, Cecep. 1989. Phytosociology of montane forest in Mount Gede-Pangrango, West Java. Studyreport. Fac. of Agriculture, Bogor Institute of Agriculture (in Indonesian).
Lyon, J., and R. H. Horwich. 1996. Modification of forest patches for wildlife protection and communityconservation in Belize. In Forest patches in tropical landscapes, ed. J. Schelchas and R. Greenberg.Washington, D.C.: Island Press.
Magurran, Anne E. 1988. Ecological diversity and its measurement. New Jersey: Princeton Univ. Press.
McNeely, Jeffrey A., Kenton R. Miller, Walter V. Reid, Russel A. Mittermeier, and Timothy B. Werner.1990. Conserving the world's biological diversity. IUCN, WRI, WWF-US, World Bank. Philadelphia, Pa.:Consolidated Business Forms.
Mueller-Dombois, Dieter, and Heinz Ellenberg. 1974. Aims and methods of vegetation ecology. Canada:John Wiley and Sons.
Peters, Charles M. 1994. Sustainable harvest of non-timber plant resources in tropical moist forest: Anecological primer. Biodiversity Support Programme. Landover, Md.: Corporate Press.
Riswan, S., and L. Hartanti. 1995. Human impacts on tropical forest dynamics. Vegetatio 121:41-52.
Rosenzweig, M. L., and Z. Abramsky. 1993. The maintenance of species richness in plant communities. InSpecies diversity in ecological communities: Historical and geographical perspectives, ed. R. E. Ricklefsand D. Schluter. Chicago: Univ. of Chicago Press.
Simberloff, D. S. 1979. Rarefaction as a distribution-free method of expressing and estimating diversity. InEcological diversity in theory and practice, ed. J. F. Grassle, G. P. Patil, W. K. Smith, and C. Taillie, 159-76. Fairland, Md.: International Cooperative Publishing House.
Smiet, A. C. 1992. Forest ecology on Java: Human impact and vegetation of montane forest. J. of TropicalEcology 8:129-52.

Biodiversity in the Ayangan-Ifugao Landscape 317
available space is planted to an assortment of subsistence food crops for daily home consumption(e.g., onion, mustard, eggplant), which would normally be planted in the swidden.
Land Tenure. Manuta (1993), in his study of tenurial arrangements and resource use manage-ment in Barangay Haliap, stated that with the increase in population and with the system ofproperty transfers throughout generations, migration to other areas has been the village responseas the topography of the area limits the expansion of agricultural land. Manuta (1993) indicatedthat security of tenure and differential access to key resources have a direct bearing on howresources are used and managed. A farmer who has more landholdings and/or bigger parcels canafford a longer fallow period because of the availability of space for plot and/or subplot rotation.He/she would leave it to regenerate naturally or plant perennials and abandon the plot anyway.The perennials would usually consist of fruit and timber species that can be of better use in thefuture.
Traditional Ifugao System of Primogeniture of Inheritance. This system prohibitsfragmentation of the family property, especially land. The eldest child inherits all the land, andthe younger children must find other employment, alternative sources of income (off-farm,nonfarm), or open new lands for themselves elsewhere. However, as tradition is being dismissedin succeeding generations, inheritance schemes are changing to allow the younger siblings toinherit some land from their parents, depending on their total number of landholdings. As a resultthe younger generation, even those who had chosen to find employment elsewhere, have comeback to Haliap and ventured into bean gardening. These modifications in inheritance scheme stilldoes not allow parcels to be fragmented. When currently cultivated land is claimed by the heir atthe time of marriage, parents open up new parcels, usually for swiddening, from landholdingsthat had meanwhile been neglected, abandoned, fallowed, or allowed to revert to forest growth,or from previously uncultivated forest. As there does not seem to be any more land available inthe communal forest of Haliap-Panubtuban for pioneering, the elders establish swiddens in oldwoodlots that almost resemble a secondary forest.
Traditional Beliefs and Perceptions. The traditional Ayangan believes in spirits - (both "good"and "bad") called finacheng and fifigiew that inhabit "holy" trees. These trees are usually large,old, and covered with creeping vines and lianas growing near springs and rivers. Village folksbelieve that these spirits can cast misfortune and cause illness when disturbed and angry, and forthis reason these "holy" trees are left undisturbed and in effect are "protected."
The tree species most revered as a holy tree is the balete tree (Ficus benjamina), which isobserved to be frequented by fireflies (alitaptap) at night. Other tree species pointed out includetuao (Bischofia javanica) and bangtinon (Toona calantas), which are actually highly priced fortheir timber. In some farm sites visited, several large trees of either species were identified. Theother tree species identified as "holy" is the fulala tree (Octomeles sumatrana). There are onlytwo fulala trees in the area—one in Sitio Binablayan, Haliap, and the other in Sitio Nuntiguing,Panubtuban. Both trees, over 30 meters high (and growing on the banks of stream tributaries ofthe Itum River), are covered with a variety of mosses, ferns, orchids, and other epiphytes.
Government Programs. In 1980, the Department of Agriculture, in its bid to intensifyagriculture through the introduction of new crops, launched a program promoting vegetableproduction called "Save the Terraces Programme." The program works on the premise thatgardening would be a good alternative to rice cultivation in Ifugao, considering the positive
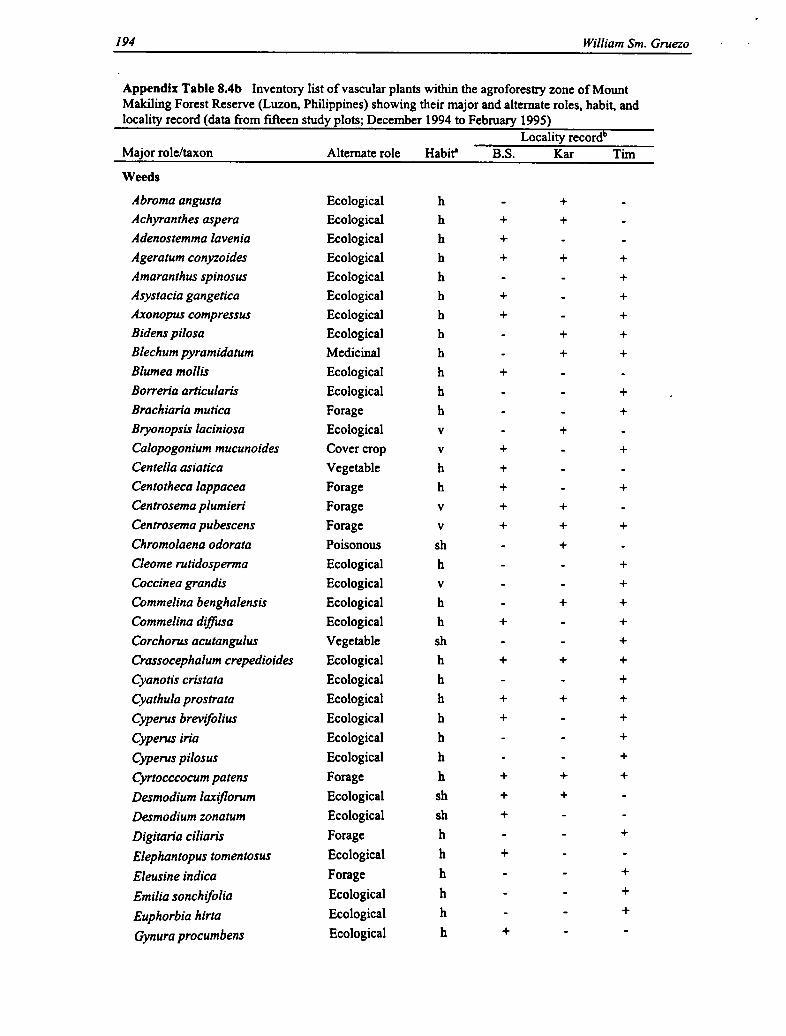
66 Parikesit, Fani Wiardi, and Djuniwarti
Stiles, F. G. 1988. Altitudinal movements of birds on the Caribbean slope of Costa Rica: Implications forconservation. In Tropical rainforest: Diversity and conservation, ed. F. Almeda and C. M. Pringle. SanFrancisco: California Academy of Sciences.
Sugandhy, A. 1995. Country paper on the implementation of biodiversity management in Indonesia. Papersubmitted to the Second Meeting of the Conference of the Parties to the Convention on BiologicalDiversity, 6-17 November, Jakarta.
Tilman, D., and S. Pacala. 1993. The maintenance of species richness in plant communities. In Speciesdiversity in ecological communities: Historical and geographical perspectives, ed. R. E. Ricklefs and D.Schluter. Chicago: Univ. of Chicago Press.
Whittaker, R. H. 1972. Evolution and measurement of species diversity. Taxon 21:213-51.
World Bank. 1994. Indonesia environment and development: Challenges for the future. World BankReport No. 12083-IND, Washington, D.C.

318 Mariliza V. Ticsay-Ruscoe
conditions for gardening (i.e., temperate climate conditions, sufficient water resources, and theamount of labor available).
Although the program was for the entire province of Ifugao, it was launched particularly in themunicipalities of Banaue and Kiangan. The residents of Kiangan (mostly Ayangan) were morereceptive to vegetable gardening than those of Banaue (mostly Tuwali) who were reluctant togrow vegetables in the terraces in the belief that paddies and rice cultivation are inseparable, andthat draining the paddies for gardening would destroy the harmony between paddies and theancestors who built them. Draining the terraces is considered taboo and, it is feared, may lead todisasters such as landslides.
Meanwhile, vegetable production is integral in the subsistence production system of the Ayanganof Kiangan, with the people being very keen on eating vegetables at every meal. This is veryapparent in the higher occurrence of malnutrition in Banaue as compared to Kiangan (UNICEFReport, n.d., cited by De Boef 1990). Vegetables are often cultivated in areas too steep or dry forthe construction of paddies and rice terraces, on terrace walls and/or dikes, and on compostmounds in rice paddies. Most often, flat to gently sloping grasslands or pasturelands were alsotransformed into vegetable gardens. The variety of vegetable crops planted in the gardensinclude crucifers, cucurbits, green amaranth, pulses, and tuber/root crops. Hence, by the time theDepartment of Agriculture promoted vegetable production, the people of Kiangan were alreadyexperienced in vegetable gardening and were ready for cultivating vegetables on a commercialscale. Soon Kiangan became a vegetable-producing area with many farmers growing snap beans(Phaseolus vulgaris) in monoculture.
The cultivation of snap beans and the conversion of paddies into bean gardens became evenmore attractive as the province has experienced prolonged drought, resulting in insufficient waterfor rice in the terraces, making them more suitable for vegetable cultivation.
External Market Forces. Bajracharya (1993), in her study on the influences of commercialagriculture on Ifugao culture, stated that the main indicator of participation in the cash economy(as used in other studies) is the market-oriented production of agricultural crops. The productionsystem in Haliap-Panubtuban has been observed to be a mixture of subsistence and market-oriented production, which is called "an economy in transition."
The major cash-crops in the area are snap beans, coffee, and pomelo. The spread of coffeeplantations in Ifugao, after introduction by the Americans, was an economic response to thepeople's need for a crop that can be bartered for other goods. The high demand for the crop in theearly years further encouraged production of coffee in the site. The slump in the coffee pricesduring the more recent years, however, has discouraged many farmers with the result that mostcoffee plantations have become overgrown with shrubs and vines. Many coffee plantations havebeen abandoned (natagwan) altogether or planted to other fruit tree crops such as pomelo, whichalso commands a high price in a strong market.
As earlier indicated, the latest cash-crop of Haliap-Panubtuban is snap beans (Phaseolus vulgarisvar. burik). Bajracharya (1993) had pieced together, through a series of key informantinterviews, the introduction and development of commercial bean production in the area and hadindicated the high market value of beans as its primary attraction for cultivation. It would becheaper and more convenient to buy rice for home consumption from one's income from beansthan planting rice in the pond field. Bean gardening has become so attractive that many pond
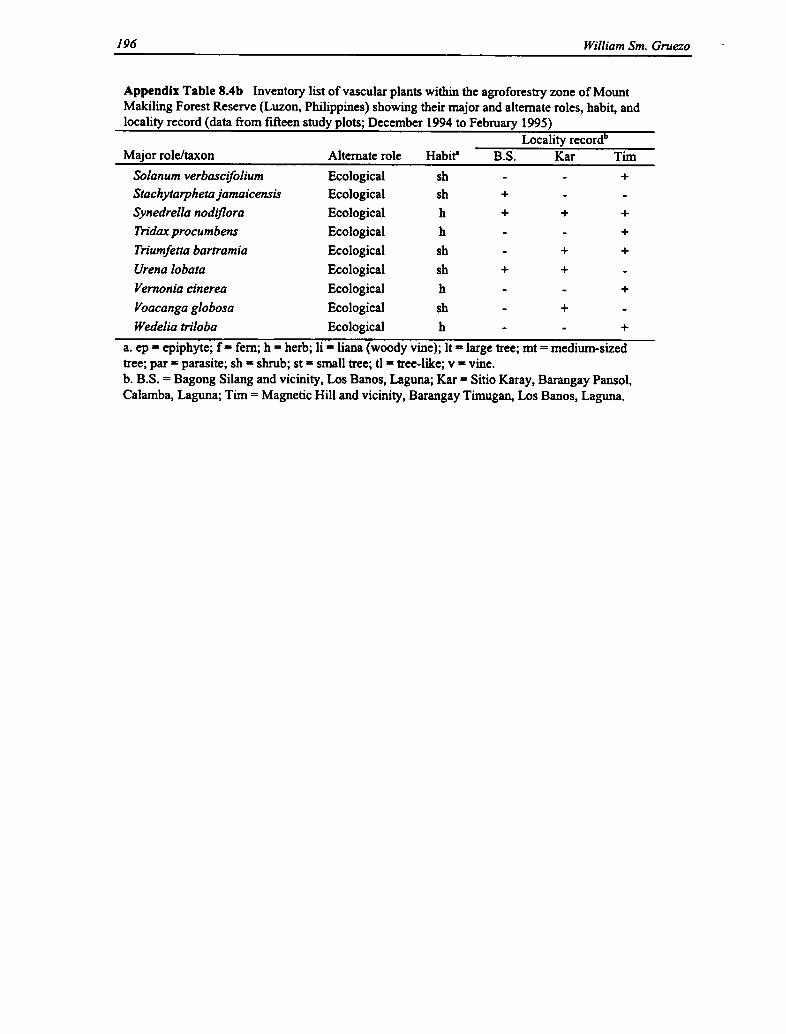
Spatial Aspects of Community Structure in Mount Wayang Forest 67
Appendix Table 3.1 Species' importance value (%) of mature trees category
No. Local name Scientific name Rel. Dom. Rel. Den. Rel. Freq. IV
1 Ki hujan Engelhardia spicata 24.62 15.60 12.26 52.47
2 Pasang beunyeur Quercus lineata 9.21 11.93 10.32 31.46
3 Puspa kembang Schima walichii 10.07 7.80 7.10 24.96
4 Cerem Macropanax dispermum 4.49 6.88 7.74 19.11
5 Pasang gebod Lithocarpus sundaicus 4.75 5.96 5.81 16.52
6 Hiur bodas Castanopsis javanica 5.86 4.13 5.16 15.15
7 Saninten Castanopsis argentea 5.56 4.13 4.52 14.20
8 Marengpeng Macarangajavanica 3.07 4.59 4.52 12.17
9 Ki jeruk Acronychia pedunculata 2.3 4.59 4.52 11.40
10 Kalimorot Castanopsis tungurrut 4.96 2.75 2.58 10.29
11 Gelam Eugenia sp. 1 2.25 3.21 2.58 8.04
12 Katulampa Elaeocarpus oxyperen 2.02 2.75 3.23 8.00
13 Ki teuas Species B 1.94 2.75 3.23 7.92
14 Mangprang Acer niveum 1.91 2.75 3.23 7.89
15 Ki lumlum Mastixia trichotoma 2.22 2.75 2.58 7.55
16 Jamuju Podocarpus imbricatus 3.66 1.83 1.94 7.43
17 Talingkup Claoxylon polo! 1.21 1.83 1.94 4.98
18 Jenghil Antidesma tetandrum 1.43 1.83 1.29 4.56
19 Huru bodas Acer laurinum 0.95 1.38 1.94 4.26
20 Manglid Manglietia glauca 0.77 0.92 1.29 2.98
21 Beunying Ficus fistulosa 0.39 0.92 1.29 2.60
22 Salam Eugenia sp. 5 0.38 0.92 1.29 2.59
23 Ki kacang Strombosia javanica 0.33 0.92 1.29 2.54
24 Suren Cedrela sp. 0.73 0.92 0.65 2.29
25 Kiara Ficus sp. 1.11 0.46 0.65 2.21
26 Ki tembaga Eugenia sp. 4 1 0.46 0.65 2.10
27 Ki hoe Eurya glabra 0.51 0.92 0.65 2.07
28 Walen Ficus ribes 0.43 0.46 0.65 1.53
29 Gelam Eugenia sp. 3 0.37 0.46 0.65 1.47
30 Kawoyang Pygeum sp. 0.31 0.46 0.65 1.41
31 Gelam Eugenia sp. 2 0.28 0.46 0.65 1.38
32 Pulus Laportea stimulans 0.2 0.46 0.65 1.30
33 Huru koneng Litsea sp. 2 0.2 0.46 0.65 1.30
34 Ki sapi Gordonia excelsa 0.18 0.46 0.65 1.28
35 Kirai Macaranga sp. 0.18 0.46 0.65 1.28
36 Tebe Sloanea sigun 0.16 0.46 0.65 1.26
Total 100 100 100 300
Notes: Rel. Dom. = Relative Dominance; Rel. Den. = Relative Density; Rel. Freq. = Relative Frequency;IV = Importance Value.
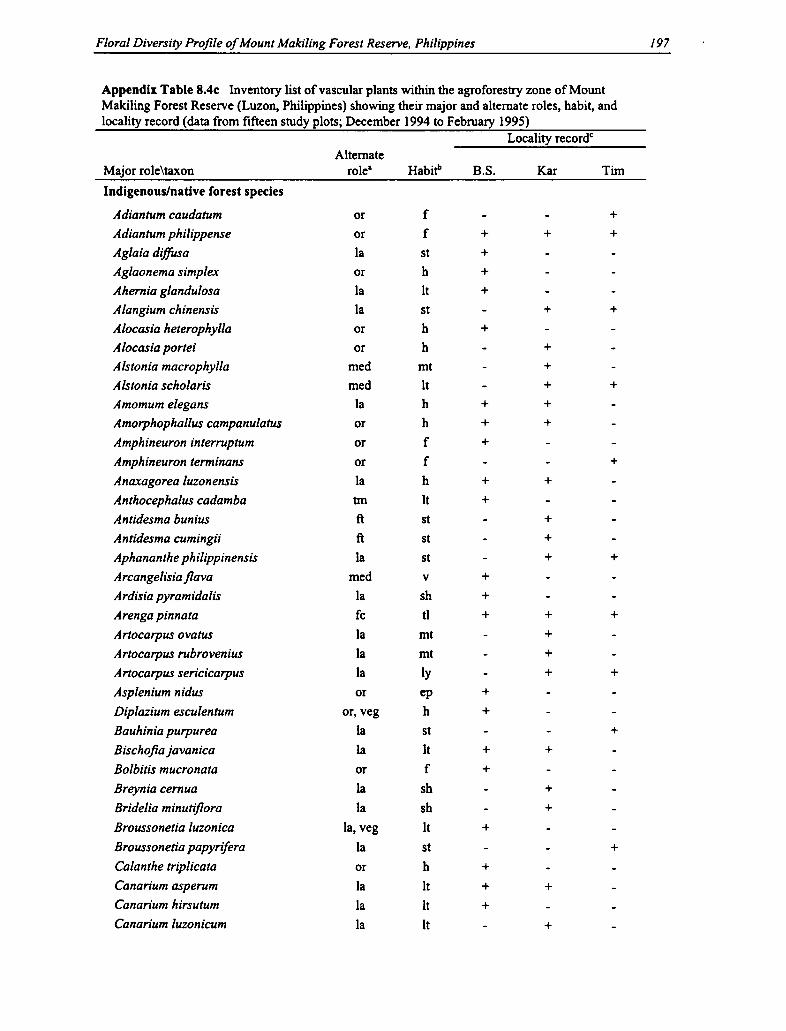
Biodiversity in the Ayangan-Ifugao Landscape 319
fields (especially in Haliap) have been intentionally drained for conversion to bean gardens.Price fluctuations in the bean market, however, have given most bean gardeners second thoughtsto convert back to the more traditional land uses.
Plant Indicators of Biodiversity
Aside from the physical and socioeconomic variables described and correlated in the previoussections, biological or plant indicators have also been identified mainly from respondentinterviews and field observations indicating certain activities on specific land uses, as well asother conditions (e.g., soil fertility status), that may further indicate biodiversity levels in thefarm or resource base level. The presence (not the absence) of each identified plant species in aresource base was tested for statistical significance with respect to the mean species count as thedependent variable (as the measure of the level of biodiversity) of that particular resource base. Itshould therefore be pointed out that the identified species may be an indicator of biodiversitylevel in one resource base but not in another. Furthermore, statistical correlation analysis onlyindicates significant differences in biodiversity levels, but does not indicate actual biodiversitylevels (i.e., low vs. high levels of biodiversity). Five species were identified as significantindicators, namely mom-ma or betel nut palm (Areca catechu); oshe or pigeon peas (Cajanuscajan); lagka or sweet potato (Ipomoea batatas); gulon or alang-alang grass (Imperatacylindrica); and lubfuan or pomelo (Citrus grandis).
Areca catechu (mom-ma; betel nut palm). Betel-nut chewing is a favorite activity among theIfugao people and is as popular, if not more popular, as smoking or chewing tobacco. The nut isan important item in rituals as an offering to the spirits who are believed to also enjoy chewingnut in the other world. The trunk of the Areca palm is considered by the local people to be animportant, hard, and long-lasting construction material; it does not rot even when wet and isknown to have inherent insecticidal properties. It is the preferred material for flooring inouthouses. From field observations, it was noted that Areca palms are planted in woodlots,coffee plantations, swiddens, and most especially in homegardens. It was gathered frominterviews that farmers who have a strong perception of security of tenure in their landholdingplant Areca palms to indicate ownership and mark boundaries of their property. The tree'slongevity and characteristic tall and erect trunk make it highly visible from a distance and, assuch, an excellent boundary marker. Furthermore, selected case studies indicate that farmers whoown land tend to plant a greater variety and more trees in their property for future use, henceresulting in higher biodiversity in the production plots. Statistical analysis shows that thepresence of Areca has positive correlation to mean species counts in swidden, rice terraces, beangardens, and homegardens.
Cajanus cajan (oshe; pigeon peas). The presence of pigeon peas (depending on its growth stage)indicates that the swidden is on its second cropping stage.- Statistical analysis shows positivecorrelation to mean species count in swidden, bean gardens, and homegardens. It is during thesecond cropping stage that farmers diversify plant production; the first cropping stage is usuallyfor upland rice production. It then follows that the second cropping stage is more diverse than thefirst.
Ipomoea batatas (lagka; sweet potato). Its presence in an expanse of cultivated land indicatesthat the land or plot is on its last stage of swidden cropping, which by now may have a greatvariety of food and fodder crops, as well as volunteer species. Statistical analysis shows positivecorrelation between the presence of Ipomoea batatas to mean species count in the swidden and

68 Parikesit, Fani Wiardi, and Djuniwarti
Appendix Table 3.2 Species' importance value (%) of poles category
No. Local name Scientific name Rel. Dom. Rel. Den. Rel. Freq. IV
I Pulus Laportea stimulans 7.99 12.95 6.19 27.12
2 Cerem Maacropanax dispermum 10.94 7.19 8.25 26.38
3 Salam Eugenia sp. 5 7.29 7.19 6.19 20.67
4 Ki hujan Engelhardia spicata 9.75 3.60 3.09 16.44
5 Pasang gebod Lithocarpus sundaicus 2.85 4.32 5.15 12.32
6 Ki kacang Strombosiajavanica 3.56 3.60 5.15 12.31
7 Hiurbodas Castanopsisjavanica 3.49 4.32 4.12 11.93
8 Pasang Beunyeur Quercus lineata 3.21 2.88 4.12 10.21
9 Mangprang Acer niveum 2.15 3.60 4.12 9.88
10 Walen Ficus ribes 2.78 2.88 4.12 9.78
11 Saninten Castanopsis argentea 3.09 3.60 3.09 9.78
12 Kijeruk Acronychia pedunculata 2.89 3.60 3.09 9.58
13 Huru koneng Litsea sp. 2 2.00 4.32 3.09 9.40
14 Manggong Omalanthus sp. 2.22 2.88 4.12 9.22
15 Hamirung Vernonia arborea 1.25 2.88 4.12 8.25
16 Ki putri Podocarpus neriifolius 3.18 2.16 2.06 7.40
17 Ki nangsi Villebrunea rubescens 2.02 2.16 3.09 7.28
18 Puspa Schima walichii 3.57 1.44 2.06 7.07
19 Jenghil Antidesma tetandrum 2.20 2.88 1.03 6.11
20 Ki hoe Eurya glabra 2.29 2.16 1.03 5.48
21 Talingkup Claoxylon polo: 1.68 1.44 2.06 5.18
22 Huru Leho Litsea sp. 3 1.60 1.44 2.06 5.10
23 Marengpeng Macarangajavanica 1.23 2.16 1.03 4.41
24 Ki Bako Ehretiajavanica 2.55 0.72 1.03 4.30
25 Ki lumlum Mastixia trichotoma 0.77 1.44 2.06 4.27
26 Beunying Ficusfistulosa 0.72 1.44 2.06 4.22
27 Tebe Sloanea sigun 2.41 0.72 1.03 4.16
28 Gelam Eugenia sp. 3 0.65 1.44 2.06 4.15
29 Jamuju Podocarpus imbricatus 2.27 0.72 1.03 4.02
30 Gelam Eugenia sp. 1 2.13 0.72 1.03 3.88
31 Manglid Manglietia glauca 1.37 1.44 1.03 3.84
32 Ki teuas Species B 1.30 0.72 1.03 3.05
33 Nusa indah Musaendafrondosa 0.55 1.44 1.03 3.02
34 Kiara Ficus sp. 0.51 1.44 1.03 2.98
35 Ganitri Elaeocarpus stipularis 0.83 0.72 1.03 2.58
36 Ki leho Saurauia bracteosa 0.35 0.72 1.03 2.10
37 Kiray Macaranga sp. 0.35 0.72 1.03 2.10
Total 100 100 100 300
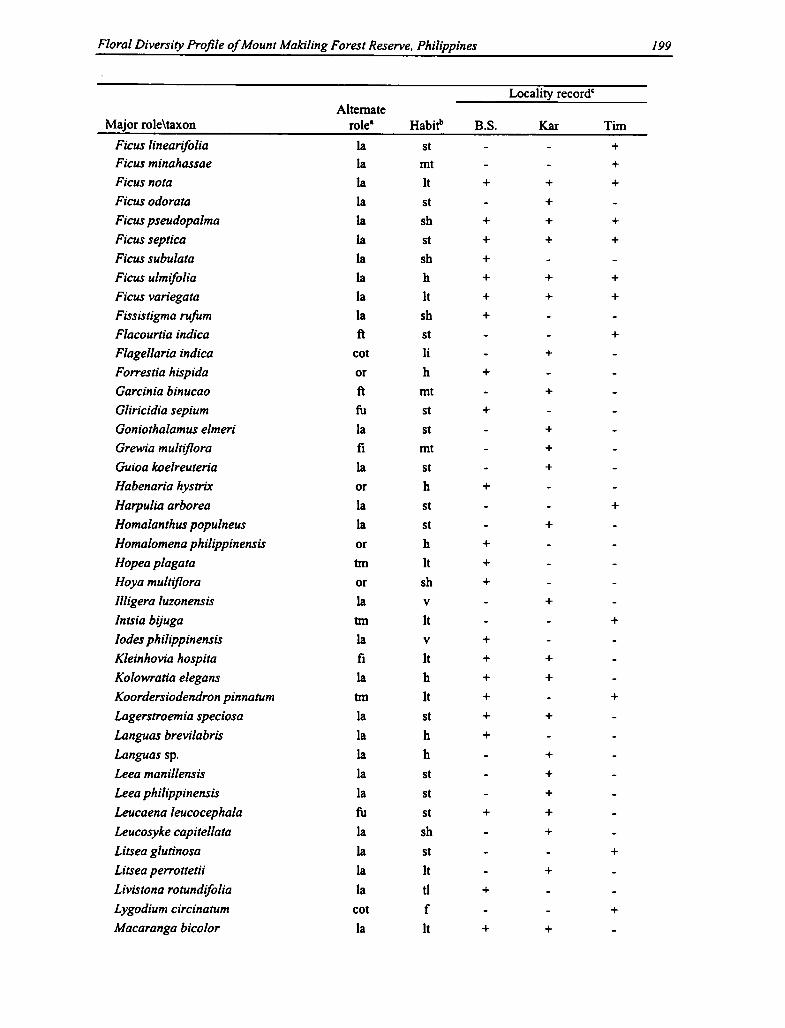
320 Mariliza V. Ticsay-Ruscoe
in the homegarden. From key informant interviews and selected case studies, Ipomoea sp. isplanted if one has livestock (i.e., pigs), indicating the need for feed. Along with sweet potato,other crops such as cassava and taro are planted in the swidden (and the homegarden) to providea variety of fodder crops for the livestock.
Imperata cylindrica (gulon; alang-alang grass). Its presence indicates that the area has beenextensively and repeatedly burned after intensive cultivation of food (swidden) and cash (garden)crops. Its presence has always been perceived as an indicator of decreasing soil fertility and asignal for permitting the plot to lie fallow. Statistical analysis indicates, however, that thepresence of Imperata is positively correlated to mean species count in the bean garden. Thiscould probably mean that the bean garden had been invaded by weed species (e.g., Imperata andothers) following the lack of intensive weed management. This condition could make the plothigh in species content than when Imperata is absent or weeded out. In swiddens, the invasion ofImperata signals the time to abandon the plot until such time when Miscanthus succeedsImperata.
Citrus grandis (lubfuan; pomelo). This tree favored for the high market price of its fruit isusually planted in privately owned and managed woodlots or homegardens. Its presence, like thatof Coffea spp., indicates tenure of the plot. Statistical analysis indicates positive correlation tomean species count in the swidden and bean garden. This may further indicate new conversionfrom old fallow to either swidden or bean garden and would therefore still contain someperennial species, especially fruit-bearing types.
Results of the study therefore indicate the usefulness of certain plant species to mark or indicatelevels of biodiversity (i.e., high vs. low) in the production plot or resource base directly, orindirectly by indicating other characteristics of the system such as tenure security, stage offallow, or cropping season that are also correlated to biodiversity levels of said system (i.e.,sociobiological or composite indicators).
Biodiversity as an Indicator of Sustainability: A Functional Analysis
Sustainability is whether the productive potential of a certain natural system will continue (for along time, at least several decades) under a particular management regime. Indicators ofsustainability have been suggested by a number of workers covering energy use, biologicalwealth, policy, institutions, society, and culture as attributes (Carpenter 1990). This study alsoaimed to present biodiversity (and its conservation) as an indicator of sustainability of theproductive potential of an indigenous agro- and natural ecosystem with the Ayangan of Haliap-Panubtuban as case study, focusing on the functions of biological diversity (i.e., ecological,economic, and sociocultural functions of plants).
Economic functions include the plant's role as food, feed, drink, medicine, fiber, timber, andother direct consumptive values; sociocultural functions include ritual and symbolic uses,religious significance, sports and recreation, ornamental and other aesthetic uses; and ecologicalfunctions are those that contribute to environmental integrity and ecological processes such assoil and water conservation, nutrient cycling, succession and biotic stability, seed dispersal,germination, and pollination, among others. The type of biodiversity (e.g., tree, shrub, herb, orgraminoid) retained or managed becomes an indicator of sustainability of the production systemat the landscape level.

Spatial Aspects of Community Structure in Mount Wayang Forest 69
Appendix Table 3.3 Species' importance value (%) of sapling category
No. Local name Scientific name Rel. Dom. Rel. Den. Rel. Freq. IV
1 Salam Eugenia sp. 5 13.96 11.71 10.26 35.93
2 Huru bodas Acer laurinum 6.94 6.31 7.69 20.94
3 Mangprang Acer niveum 5.29 6.31 6.41 18.01
4 Beunying Ficusfistulosa 5.35 7.21 5.13 17.69
5 Cerem Macropanax dispermum 6.18 4.50 6.41 17.10
6 Manggong bodas Omalanthus sp. 3.61 6.31 6.41 16.33
7 Pasang gebod Lithocarpus sundaicus 5.88 4.50 5.13 15.51
8 Huru gapung Litsea sp. 1 7.19 3.60 2.56 13.36
9 Ki kacang Strombosiajavanica 2.41 5.41 5.13 12.94
10 Pulus Laportea stimulans 5.40 4.50 2.56 12.46
11 Walen Ficus ribes 5.58 2.70 3.85 12.13
12 Hiur bodas Castanopsis javanica 3.98 2.70 3.85 10.52
13 Peer Ficus rostrata 1.54 6.31 2.56 10.41
14 Huru koneng Litsea sp. 2 2.37 3.60 3.85 9.82
15 Musaenda Musaenda frondosa 1.77 2.70 3.85 8.32
16 Hamirung Vernonia arborea 3.48 1.80 2.56 7.85
17 Jenghil Antidesma tetandrum 2.79 1.80 1.28 5.88
18 Ki kopi Canthium glabrum 1.12 2.70 1.28 5.10
19 Gelam Eugenia sp. 2 2.66 0.90 1.28 4.84
20 Marengpeng Macarangajavanica 0.43 1.80 2.56 4.79
21 Suren Cedrela sp. 2.10 0.90 1.28 4.29
22 Puspa kembang Schima walichii 1.61 0.90 1.28 3.79
23 Sauheun Mitrephora sp. 1.61 0.90 1.28 3.79
24 Jaranak Eugenia clavimyrtus 1.61 0.90 1.28 3.79
25 Ganitri Elaeocarpus stipularis 1.61 0.90 1.28 3.79
26 Huru batu Litsea sp. 1 0.66 1.80 1.28 3.74
27 Kawoyang Pyegum sp. 1.18 0.90 1.28 3.37
28 Ki jeruk Acronychia pedunculata 0.13 1.80 1.28 3.22
29 Ki lumlum Mastixia trichotoma 0.53 0.90 1.28 2.71
30 Sulibra Cinchona succirubra 0.30 0.90 1.28 2.48
31 Ki hoe Eurya glabra 0.30 0.90 1.28 2.48
32 Huru leho Litsea sp. 3 0.13 0.90 1.28 2.31
Total 100 100 100 300

Biodiversity in the Ayangan-Ifugao Landscape 321
The dependence of local residents on diverse biological resources is an important factorinfluencing biodiversity conservation. To the Ayangan of Haliap-Panubtuban, biodiversity andits conservation is highly use-defined. Ecological functions of a species may or may not beperceived by the farmer; but its perceived economic and/or sociocultural value may enhance itsmaintenance and conservation. Perceptions of the economic and cultural values, however, maybe influenced by other factors exogenous to the community and landscape, such as market anddevelopment interventions, which may result in a general change in personal values, attitudes,and general use definition.
Whether or not changes in perception have already occurred, a functional analysis of biodiversityis proposed using some examples from the results of the ethnobotanical survey (see Table 13.7).The analysis is to assess the conditions and trends in maintaining and/or conserving certainspecies of plants essential in sustaining the Ayangan-Ifugao production system in the Haliap-Panubtuban landscape.
Implications of the Analysis of Biodiversity in the Landscape Level
Multiple-Use Strategy: Spatial and Temporal Interrelationships in the Landscape. Thetraditional Ayangan production system is swidden-based, in the sense that all productiveactivities of the household (i.e., farm, off-farm, nonfarm) are in line with the swidden calendar. Italso follows a multiple-use strategy in managing natural resources, tapping several differenttypes of resource bases in the Haliap-Panubtuban landscape at the same time to produce anuninterrupted and mixed flow of products for the household for cash and subsistence needs. Thisstrategy is based on diversification of production through the creation of "patches" in thelandscape, which, when analyzed singularly, may appear specialized and monocultural, andgenerally low in biological diversity. Coffee plantations, rice terraces, and bean gardens are eachspecialized land uses (monocultures; focusing on one crop) but their integration with swiddens,woodlots, and homegardens into a larger unit of production (i.e., at the landscape) provides awider variety of resources and biological diversity for the household.
The Ayangan of Haliap-Panubtuban are a community in transition with a developing marketorientation. Land-use management depends not only on food security but other cash and materialneeds—priority of which is children's education and health care, and tends to rely on resourcebases (e.g., swidden, coffee plantations, and bean gardens) that could provide the highest returnsto invested labor and capital.
Diversification of resource bases and the resultant increase in biodiversity in the landscape levelworks as an effective buffer against market fluctuations and environmental changes and hazards(e.g., typhoons, earthquakes, and pest outbreaks) for the Ayangan farmer. Swidden produce hasprovided the household with security against pond-field damage and crop failure and against thesteady decline in coffee prices or ever-fluctuating market price for beans. Furthermore, thecultivation of fruit trees (i.e., pomelo) also provides additional products for the market. Notefurther that land-use conversion from rice terraces to bean garden or diversifying into anotherresource base was initially a response of the Ayangan farmer to environmental stress broughtabout by the prolonged drought in the region that caused crop failure in the rice terraces.
Management strategies for each resource base involve maximizing the use of available land. Thebunds of rice terraces and the margins or periphery of bean gardens are not left bare; they areplanted either with other domesticates or allowed to grow "desirable" (i.e., edible) weed 2 species.

70 Parikesit, Fani Wiardi, and Djuniwarti
Appendix Table 3.4 Species' importance value (%) of shrub group
No. Local name Scientific name Rel. Dom. Rel. Den. Rel. Freq. IV
1 Kirinyuh Eupatorium odoratum 69.41 36.70 25.97 132.08
2 Bubukuan hideung Chloranthus brachystachys 14.68 30.32 22.08 67.08
3 Harendong Cypholophus lutescens 1.08 5.32 6.49 12.89
4 Kokopian 2 Pychotria sp. 2 2.46 3.72 6.49 12.68
5 Totongoan Debregeasia longifolia 1.77 3.19 5.19 10.15
6 Tepus Alpinia sp. 2 1.23 3.19 5.19 9.62
7 Kokopian 1 Psychotria sp. 1 1.84 2.66 3.90 8.40
8 Bubukuan beureum Strobilanthes sp. 1 1.23 3.19 3.90 8.32
9 Poh-pohan Pilea melastomoides 0.92 2.13 3.90 6.95
10 Haramaian bulu Boehmeria platyphylla 0.54 1.60 2.60 4.73
11 Honje Alpinia sp. 1 1.15 2.13 1.30 4.58
12 Paku bagedor Acrophorus blumei 0.77 1.06 2.60 4.43
13 Sambukus Hydrangea longifolia 0.77 1.06 2.60 4.43
14 Paku sayur Asplenium caudatum 0.61 1.06 2.60 4.28
15 Howe cacing Calamusjavensis 0.54 1.06 2.60 4.20
16 Kokopian sp. 3 Psychotria sp. 3 0.77 1.06 1.30 3.13
17 Howe korod Calamus sp. 0.23 0.53 1.30 2.06
Total 100 100 100 300
Plant habit
Tree Source of good A holy treequality timber; forbuildingconstruction,furniture making,and woodcraft
Tree Fiber used for Distinct redbundling material color of fiberduring rice harvest used to make
traditional/ceremonialclothing
Tuber crop; Tuber as food and Staple food ofcreeping feed; leaves edible the "Camote-vine as green vegetable Eaters"
322 Mariliza V. Ticsay-Ruscoe
Table 13.7 Functional analysis of biodiversi ty in the species level
^peciesttamuy name
Bischoftajavanica
("tuao")Euphorbiaceae
Macaranga bicolor
("anablon")
Euphorbiaceae
Ipomoea batatas("lagka-lagka")Convolvulaceae
Perennial; deeprooted; serves ashost to severalepiphytic species;micro-habitats
Perennial; grows ina variety ofhabitats
Used as cover cropduring fallow ofswidden plots forsoil erosion control
Remarks
Common andnumerous; foundnot only inwoodlots andcoffee plantations,but in swiddensand homegardens
Although
occurring in thewild, sometimescultivated inwoodlots andfallow plots
Several varietiesare main-tained/planted in
the same farmdepending onfarmer's use; highgenetic diversity
Areca catechu Tall, erect("mom-ma") Palmae palm
PerennialMasticatory; nutsfor personal use andmarket sales; trunksmake durableconstructionmaterial
Betel nutchewing is notonly animportantleisure activity,but highlysignificant asritual offeringsto make "Peacewith theSpirits"
An A reca palmindicates humanoccupancy or
tenure of thatparticular site,which can furtherindicate some sortof management ofthe site
Tallcane/grass
Miscanthus sp.("nmo," "filao")Graminae
Ficus benjamina("balete") Moraceae
Cyatheacontaminans
("atibfang")Cyatheaceae
Long canes are usedas trellises forbeans; leaves fed to
cattle
Believed byfarmers toindicate
restored soil
fertili ty infallow plots
Trunk iscarved to makerice gods(icons)
Can successfullytake over Imperatacylindrica, anoxious weed
Perennial and deep
rooted; fruits eatenby birds and bats
Pioneer speciesafter a bum;resistant to termiteattack and dry rot;also used as bugrepellent againststink-bug rice pest
Commercializa-tion of runo canesindicates
diminishing grasscover ofgrasslands in thelandscape
Common but notlogged; host to avariety of vinesand epiphytes
Common andnumerous in thearea
Tree fern Trunk useful asconstructionmaterial
Tall tree Source of fuelwood A holy treewith believed to beadventitious inhabited byroots evil spirits
The steep and stony slopes in swiddens are planted with sweet potato. This practice may appeartoo intensive, but the choice of crops makes a difference in the s trategy. According to the localpeople, sweet potatoes, for instance, require good drainage for maximum tuber growth. At thesame time, its extensive root system and creeping vine and broad leaves provide good soil coveragainst surface erosion. Planting other domesticates on the bunds of terraces provides similar soil
Spatial Aspects of Community Structure in Mount Wayang Forest 71
Appendix Table 3.5 Species' importance value (%) of ground vegetation group
No. Local name Scientific name Rel. Dom. Rel. Den. Rel. Freq. IV
I Teklan Eupatorium riparium 23.85 28.76 10.24 62.85
2 Haharamaian Elatostema sp. 20.78 24.60 13.25 58.63
3 Bubukuan bodas Chloranthus brachystachys 7.77 4.70 7.83 20.31
4 Paku sayur Asplenium caudatum 6.55 3.76 6.02 16.34
5 Paku bagedor Acrophorus blumei 2.05 2.55 5.42 10.03
6 Jukut ilat Carex baccans 3.56 2.15 4.22 9.93
7 Poh-pohan Pilea melastomoides 3.35 2.96 3.61 9.92
8 Kirinyu Eupatorium odoratum 3.48 3.49 2.41 9.38
9 Harees Rubus moluccanus 2.13 1.61 5.42 9.16
10 Saroni Urtica sp. 2.07 2.55 3.61 8.24
11 Ki hujan Engelhardia spicata 1.35 2.82 3.01 7.18
12 Bubukuan alit Strobilanthes sp. 2 0.9 4.17 1.81 6.87
13 Begonia Begonia sp. 2.66 0.81 1.81 5.27
14 Cangkok Disporum chinense 1.23 0.67 1.81 3.71
15 Calincing leuweung Cardamine africana 1.43 1.34 0.60 3.38
16 Harendong Cypholophus lutescens 0.61 1.88 0.60 3.09
17 Kole bahe Pericampylus sp. 2 0.82 0.40 1.81 3.03
18 Cucuk Smilax zeylanica 0.41 0.94 1.20 2.56
19 Cocok bubu Pilea angulata 1.23 0.40 0.60 2.24
20 Mangprang Acer niveum 0.57 0.27 1.20 2.04
21 Ki bako Ehratiajavanica 0.25 0.54 1.20 1.99
22 Howe cacing Calamus sp. 1.23 0.13 0.60 1.97
23 Paku munding Christella dentata 0.2 0.54 1.20 1.94
24 Gihgil Dichroa sylvatica 0.37 0.27 1.20 1.84
25 jukut Fimbristylis sp. 0.82 0.40 0.60 1.83
26 Hahaseuman Species D (Cucurbitaceae) 0.33 0.27 1.20 1.80
27 Salam Eugenia sp. 5 0.33 0.27 1.20 1.80
28 Pasang gebod Lithocarpus sundaicus 1.02 0.13 0.60 1.76
29 Pulus Laportea stimulans 1.02 0.13 0.60 1.76
30 Hanjuang leuweung Trevesia sundaica 0.61 0.54 0.60 1.75
31 Ki leho Saurauia bracteosa 0.61 0.54 0.60 1.75
32 - Species C (Araceae) 0.82 0.27 0.60 1.69
33 Manggong bodas Omalanthus sp. 0.41 0.67 0.60 1.68
34 Jukut ibun Paspalum distichum 0.2 0.81 0.60 1.61
35 Ki teuas Species B 0.61 0.27 0.60 1.48
36 Bobontengan Bryonopsis laciniosa 0.2 0.67 0.60 1.47
37 Cerem Macropanaz dispermum 0.61 0.13 0.60 1.35
38 - Begonia robusta 0.41 0.27 0.60 1.28
39 Bingbin Pinanga sp. 0.41 0.13 0.60 1.15


72 Parikesit, Fani Wiardi, and Djuniwarti
No. Local name Scientific name Rel. Dom. Rel. Den. Rel. Freq. N40 - Blumea sp. 0.41 0.13 0.60 1.15
41 Kokopian Psychotria sp. 2 0.41 0.13 0.60 1.15
42 Totongoan Debregeasia longifolia 0.41 0.13 0.60 1.15
43 Jukut jampang Euleusine indica 0.08 0.27 0.60 0.95
44 Areuy gereng Pericampylus sp 1. 0.2 0.13 0.60 0.94
45 Rarajutan Amomum sp. 0.2 0.13 0.60 0.94
46 Pasang beureum Quercus lineata 0.2 0.13 0.60 0.94
47 Bengbe Cardamine sp. 0.12 0.13 0.60 0.86
48 Areuy buburut Tetrastigma laevigatum 0.12 0.13 0.60 0.86
49 Sintrong Erechtites valerianifolia 0.12 0.13 0.60 0.86
50 Kaliki mangkin Species A 0.12 0.13 0.60 0.86
51 Ki nangsi Villebrunea rubescens 0.12 0.13 0.60 0.86
52 Letah uncal Rubia cordifolia L 0.08 0.13 0.60 0.82
53 Ki kacang Strombosiajavanica 0.08 0.13 0.60 0.82
54 Babadotan Ageratum conyzoides 0.04 0.13 0.60 0.78
Total 100 100 100 300
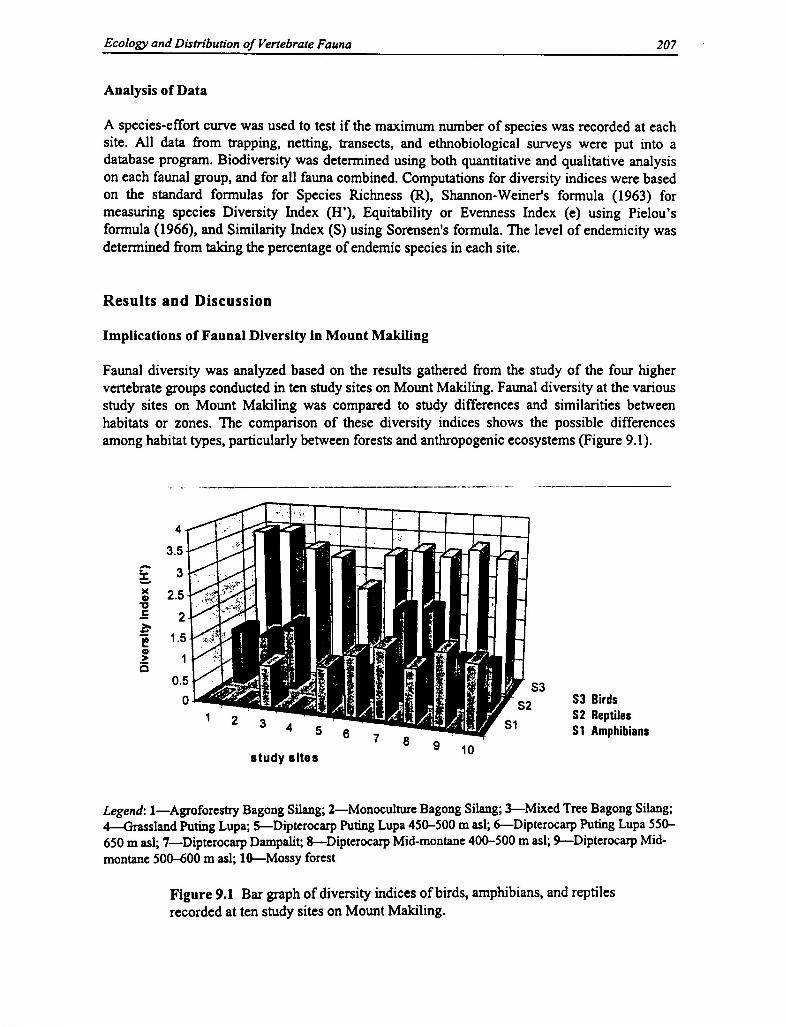
324 Mariliza V. Ticsay-Ruscoe
Ipomoea batatas) on sloping, stony, and production plots to be left for fallow to minimize soilerosion, as well as enhancing fallow by planting perennials (e.g., fruit and timber species); not tobe forgotten are the rice terraces that brought the Ifugao to fame; (2) the length of fallow periodafter swidden cropping is between five to fifteen years, allowing natural succession to proceedand soil fertility to increase; (3) external inputs of chemical fertilizers and pesticides are zero tominimum, with most farmers using only natural or compost materials to fertilize their productionplots (except in bean gardens); the abundance of edible snails in the pond fields and waterways isalso a useful indicator of the health of these resource bases; (4) labor distribution and decision-making processes involve family participation (in all ages and gender) in various farmingactivities; (5) food security (i.e., food availability and accessibility) for the household as a resultof the system's yield or productivity includes minimal surplus for cash sales to provide minimumcash requirements of the household; (6) water quantity and quality, although the site hasexperienced water stress in the more recent years, for which farmers blame on severe droughtand the 1991 earthquake; traditional farmers have reverted to previous land uses (i.e., riceterraces and swidden) as soon as water has become available in the rainy season; barring theeffects of the drought on water supply, trends in water quantity for agricultural use have notchanged drastically over the years as manifested by the high number of production plots thatrequire water (i.e., swidden [rainfed]; rice terraces [irrigated]); rivers continue to produceirrigation waters, with no respondent recalling them to ever dry-up; children and adults can stillbe observed bathing, swimming, or fishing in deeper portions of the rivers, indicating good waterquality; the availability of certain edible water plants, that is, Nasturtium officinale (watercress)on smaller waterways and edible snails in pond fields also indicate good water quality in the site;water supply for domestic use in the site has actually improved in the last four years as a resultof spring protection and impoundment structures built by community members with theassistance of various development organizations (e.g., CECAP); several sitios in Haliap andPanubtuban have piped water into residential homes. One does not need to boil water fordrinking, and reports of water-borne diseases are very low; the presence of bananas (Musa spp.)in most fallow plots, a plant that has a high water requirement, indicates that the area has amplewater for more agricultural activities.
However, although trends now show high biodiversity and sustainability levels in the presentproduction system, certain factors exogenous to the agroecosystem may bring about a decline inbiodiversity and, consequently, the sustainability of the production system. These may includemarket influences such as the high cash value of certain crops that may bring about extensiveland-use conversion to monocultural cropping (e.g., beans).
The loss of biodiversity at the household level as a result, for instance, of total conversion of allhousehold production plots into bean gardens may leave the farmer with no fall-back crop evenfor household consumption in case of a market crash, crop failure, or due to plant pest, disease,or natural hazards such as severe floods, drought, and typhoons. As pointed out earlier,commercial bean gardening is risky due to the unpredictable fluctuations in the market. A fall inthe market price of beans leaves the farmer deeper in financial debt. Livestock production (e.g.,pigs, chickens, goats, and ducks) will also be affected. With no fodder crops available, meat willbe scarce. The effect of the intensive use of chemical fertilizers and pesticides on the soil'schemo-physical conditions and micro-biota makes it difficult to revert to the original land useand cropping system. Soil loss will also be massive, as the total conversion of production plotsinto bean gardens will include the draining of rice pond fields and neglect of rock walls in theterraces (i.e., soil-water conservation measures). Intensive weeding of bean gardens leavesminimal ground cover, resulting in high surface and gully erosion. The fallow period will not be
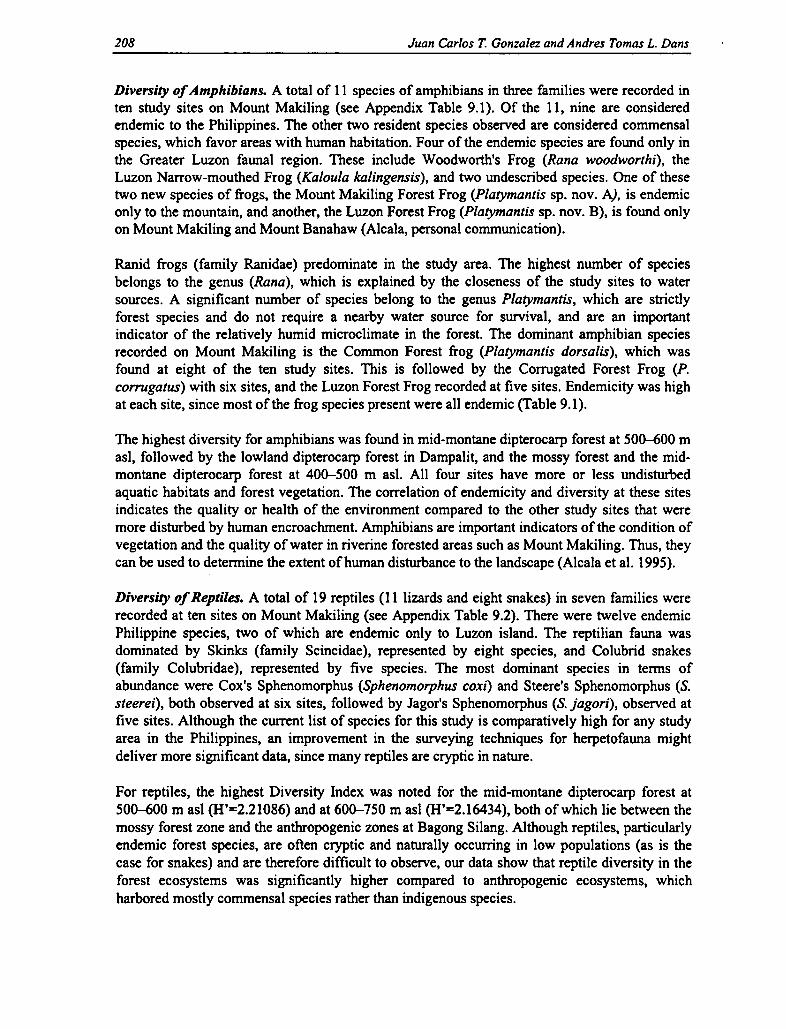
Chapter 4
Community Structure and Diversity of Faunain Upper Citarum River Basin, West Java, Indonesia
Tatang S. Erawan, Nani Djuangsih, Muhammad Muchtar,Harris Setiana, and Lucia S. Istanti
Introduction
Background
Over time, changes have occurred in the Upper Citarum River Basin, converting a tropical rain-forest ecosystem to a man-made ecosystem. The changes altered species composition, commu-nity structure, and diversity of both plants and animals.
According to Soemarwoto (1994), a village ecosystem consists of the subsystem of forest, talun,homegardens, and rice fields. Christanty (1985) stated that these subsystems function not only toconserve plant diversity but also are used by wild animals such as insects, reptiles, birds, andsmall mammals as a habitat. So, even though it was not planned, those subsystems have come toplay an important role in conserving the diversity of wild animals. Conservation of wild animalsand plants can be carried out not only in the original habitat in the forest (in-situ) but also outsidethe original habitat (ex-situ).
Indonesia, with only 1.3 percent of the earth surface area, is inhabited by 17 percent of theexisting bird species in the world and ranks fourth in their species diversity. Out of 1,519 speciesof birds in Indonesia, 28 percent is endemic (BAPPENAS 1993, cited by Sugandhy 1995). InJava and Bali, there are approximately 494 species, of which 368 species are residents and theremaining 126 species are visitors (migrants). Twenty-four species are endemic to Java and Bali,of which 16 are endemic to Java; I to Bali; and 7 to both of those islands.
The landscape condition where human activity is intensive is usually very dynamic. (A dynamicis a change in land use that turns into another type with a different composition and differentvegetation structures. The change over the vegetation covering will affect the existence of wildanimals such as birds, insects, and Squamata that live inside.) This could be seen in the ruralarea, including the surrounding forest, where farming activity is able to influence the entire localenvironmental condition (Soemarwoto and Soemarwoto 1984).
The vegetation condition in a settlement area cannot avoid human activities. As part of theecosystem, the existence of birds is influenced by and influences the surrounding environment.The vegetation condition is one of the external factors vital for the existence of birds becausevegetation is a place to live in, a food source, shelter, and for propagation. The more vegetationstructures become complex, the more bird species exist (MacArthur and MacArthur 1961). Onthe contrary, the birds present in an ecosystem could affect the composition and structure of anexisting vegetation. Many species of birds play important roles in the pollination process and indispersing plant seeds. If the existence of various bird species in an ecosystem is disturbed,development of vegetation in that place could be affected. Howe and Smallwood (1982) and
73
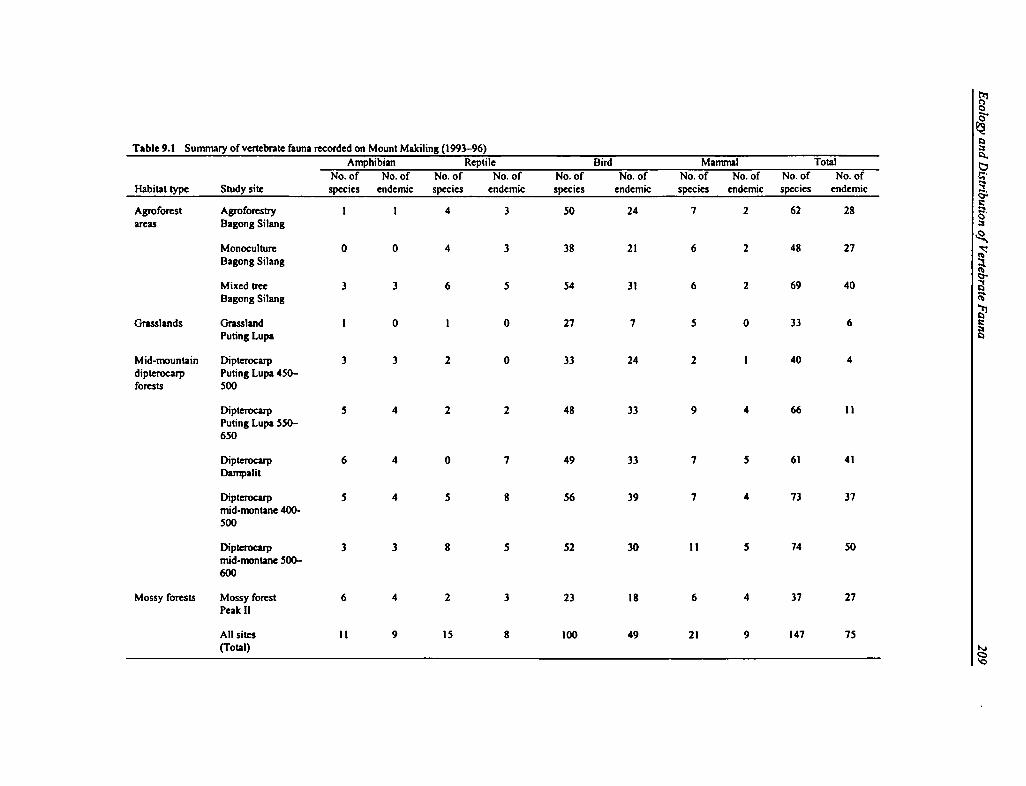
Biodiversity in the Ayangan-Ifugao Landscape 325
sufficient for the soil to rest and recover its natural fertility, as beans can be cropped three timesa year.
Labor distribution and decision-making will be lopsided, leaning toward the male members ofthe household, as the intensive agricultural labor—land preparation, pest management (chemicalspraying), and hauling produce to the market—required is perceived as the male's domain.
Aesthetically, changes (i.e., loss or modification) in biodiversity in the landscape such asmonoculture of any cash crop (e.g., beans, cabbage, petchay) will change the traditional beautyof the landscape—no trees, no rice terraces, no flower patches; only beans on trellises.
Other external variables such as improvement in the road infrastructure may also influence land-use conversion into bean gardening, as ease of transport of produce or market access will alsoimprove. This second factor may already be apparent. Most bean gardens are located inBaran gay Haliap, and Panubtuban farmers have expressed interest in bean gardening when theroad between Haliap and Panubtuban is improved.
Conclusion
Biodiversity has become a byword, and biodiversity studies have been proposed andimplemented in most types of ecosystems in most parts of the world even before the RioSummit. Most biodiversity studies, however, dwell on the conditions that bring about loss ofbiodiversity or the conservation of a rare, threatened, or endangered species. Biodiversitystudies, especially those whose main objective is conservation, have focused their attentionmainly on the nature of what is being conserved and have seldom considered the viewpoint ofthe conserver, or the conditions associated with the conserver's management strategies that mayresult in successful biodiversity maintenance.
Biodiversity studies make use of standard biodiversity indices such as Species Richness (R) andShannon-Weiner Index (H') that give numerical values on biodiversity levels. Although thesestandard measures give information on type and distribution of species present in a particular(sampling) area, these indices seldom explain the causes or factors affecting numerical valuessuch as, Why are these species present at all? Why in such quantity? Why in such associationwith other species? Why in such an area?
With the species as the central concept of biodiversity, studies should not only view speciesdiversity in terms of biology and/or taxonomy. The analysis of biodiversity indices in thedifferent hierarchical levels (i.e., species, farm/household, resource base, landscape) shouldconsider the economic, sociocultural, and, more importantly, the ecological value, functions, andcontributions of biodiversity.
Biodiversity may convey the same meaning as "nature," but the concept does not only refer tothe organism as a biological specimen. Information on species diversity should also be related tothe (organism's) habitat and other environmental conditions and features of the community.Biological diversity often coexists with human cultural diversity as the latter is built upon andlargely dependent on what the former has to offer (both material and philosophical). Studies onbiodiversity should therefore consider information on the human component (i.e., analysis ofhousehold characteristics [e.g., socio-demography; tenurial status] including resource manage-
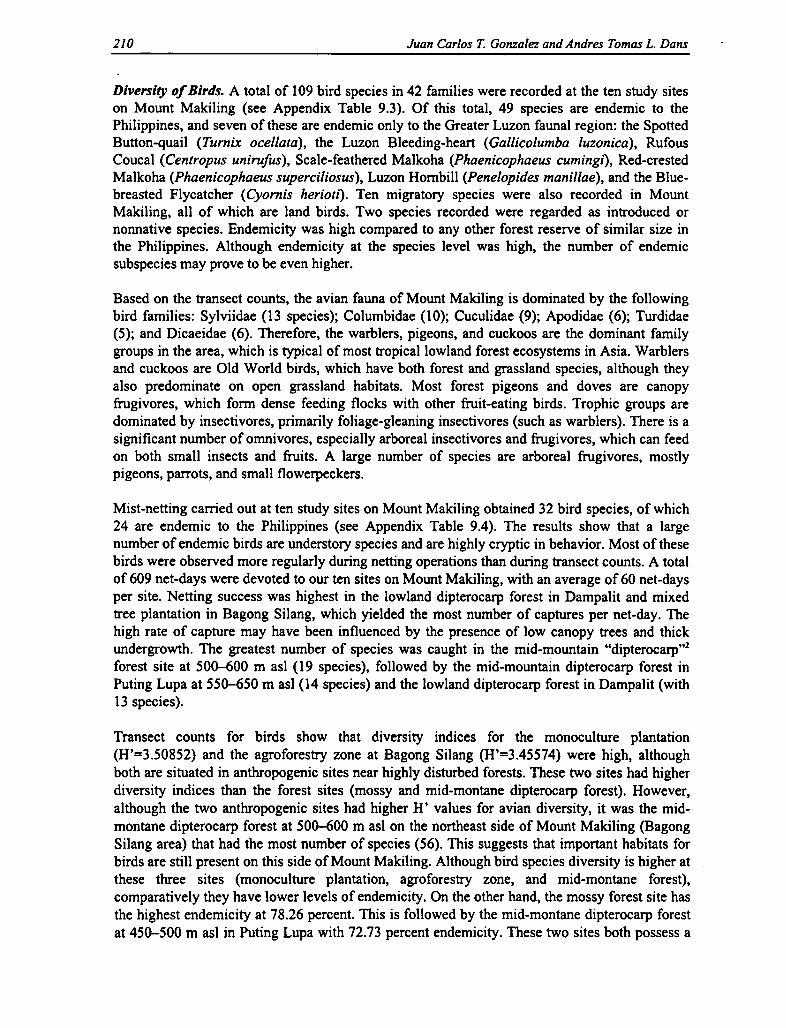
74 T. S. Era wan, N. Djuangsih, M. Muchtar, H. Setiana, and L. S. Istanti
Terborgh (1986) pointed out that many species in a tropical forest depend on a small suite offrugivores for dispersing their seed. Loss of these species, when forests are fragmented, mayadversely affect the long-term population viability of many tree species. Therefore, animal roles,such as both fruit-eating birds and pollinators, are very important in propagation and for thedynamics of vegetation in a place.
Birds have been successful in its spread throughout the earth from lowland to highland habitats.The extent of movement and traveling range of each bird species is different. Some species havea small, steady home range and spread gradually to occupy new habitats, whereas other specieshave a more extensive home range (MacKinnon 1990; Harper 1987, cited by Bienregard et al.1992). Species adaptable to their environment will increase in population, whereas species lessadaptable will move away or their population will decrease or even become extinct. The animalgroup that has this unique ecological behavior is often used in evaluating changes and the qualityof an environment (Furness, Greenwood, and Jarvis 1993).
In the terrestrial ecosystem's point of view, especially in relation to the food web, the study alsoassessed the diversity of insects (soil surface and flying insects). These taxa, it is believed, canbe used as potential indicators to evaluate land-use change (Soule and Kohm 1989; Noss 1990;Hanksworth and Richie 1993; Kremen et al. 1993; Samways 1994, cited by Stork and Samways1995). Apart from that, Squamata was studied also in evaluating the biodiversity condition in thestudy area with the assumption that this taxon has high sensitivity to ecological change.
The various spaces in the rural area of Upper Citarum River Basin, within certain limits, willgive various wild animals such as avifauna, insects, and Squamata a chance to live in them.Therefore, the natural extensive dynamic changes that have occurred in Upper Citarum RiverBasin during the past decades can influence the existence of those animals in this region. Thedecreasing of a land-use type, such as land converted into a cash-crop garden or a settlement, canaffect the condition of biodiversity that usually use the vegetation in this land as their habitat.Also, modem farming activities that use high energy input to increase production, such aspesticide usage, have affected the existence of certain species of wild animals in the rural area,particularly in cash-crop gardens. Apart from that, modem agricultural methods fragment naturalecosystems, and the subsequent increase in isolation typically results in changes in communitystructure and function, including disruption of the food web (Diamond and May 1981, cited byKruess and Tscharnthe 1994).
Objective
The aim of this research is to study the community structure and diversity of avifauna, insects(soil surface and flying insects), and terrestrial Squamata in the natural ecosystem of a protectedforest and in the man-made ecosystem of bamboo-tree gardens, homegardens, cash-crop gardens,and rice fields. Also, this research is to learn more about the influence of condition ofbiodiversity maintenance in the study area on the life of wild animals, and how much effort isput forth to conserve them. We hope that the results of this research will be used in evaluatingbiodiversity maintenance so that a better system of diversity maintenance will be developed inthe near future.
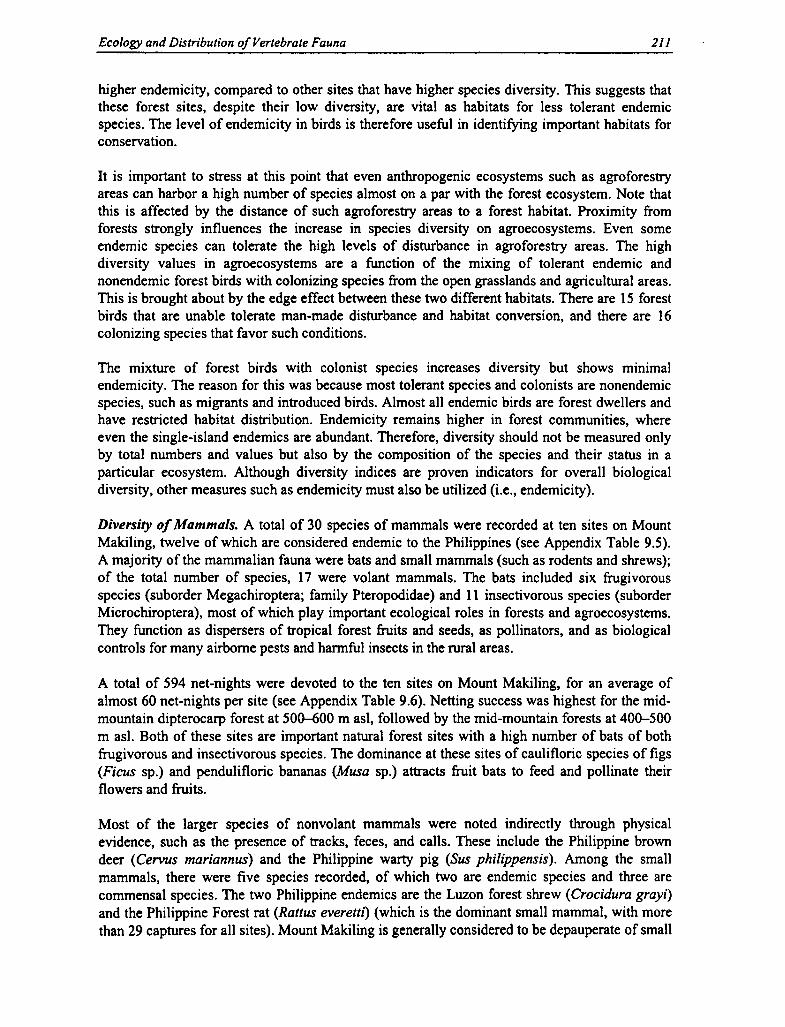
326 Mariliza V. Ticsay-Ruscoe
ment objectives [e.g., monocropping] and strategies [e.g., crop associations, soil and water con-servation measures, livestock integration]) that defines the actual and potential value (i.e.,aesthetic or economic) of these biological resources. Likewise, analysis of biodiversity in thefarm or resource base level can highlight the contributions of biodiversity on the structural (i.e.,site quality, degree of patchiness) and functional (e.g., impact on genetic erosion, impact onspecies endemism, endangerment and/or extinction) attributes of the landscape.
In the Haliap-Panubtuban landscape, the production system of the Ayangan can be sustainable ifbiodiversity is conserved in the crop production management strategies (i.e., indigenous andintegral traditional agroforestry and inter- or multiple-cropping systems) focusing on perennials,shrubs, and herbaceous species, which can reconcile the economic, social, and ecologicalrequirements of both the upland landscape and the upland farm family or household.
Notes
1. This land-use classification was similarly described by Conklin (1980) in his ethnographic atlas of theIfugao.2. A weed is a plant that is not valued where it is grown. It is an unwanted species mainly because itcompetes with the cultivated species.
References Cited
Altieri, Miguel, D. K. Letourneau, and J. R. Davis. 1983. Developing sustainable agroecosystems.Bioscience 33(1): 45-49.
Bajracharya, Edilyn. 1993. Vegetable in the terraces: Influences of commercial agriculture on Ifugaoculture, ecology, and landscape. Ph.D. diss., ongoing. Univ. of Hawaii, Honolulu.
Barton, R. 1969. Ifugao economics. American Archaeology and Ethnology 15(5): 385-446.
Boserup, Ester. 1965. The conditions of agricultural growth: The economics of agrarian change underpopulation pressure. London: Allen and Unwin.
Carpenter, R. A. 1990. Biophysical measurement of sustainable development. The Environmental Profes-sional 12:356-59.
Christanty, L. 1990. Home gardens in tropical Asia, with special reference to Indonesia. In Tropical homegardens, ed. Dalam K. Landauer and M. Brazil. Tokyo: The United Nations Univ.
Conklin, Harold. 1980. Ethnographic atlas of Ifugao. New Haven and London: Yale Univ. Press.
De Boef, Walter. 1990. Changing Ifugao agriculture: Vegetables as alternative to rice. Wageningen Univ.,The Netherlands.
Dixon, C. 1990. Rural development in the Third World. New Fetter Lane, London: Routledge.
Guy, Peter, ed. 1995. Agroecosystem analysis and rapid rural appraisal of selected sites in the CentralCordillera, Philippines. ERMP Report No. 15. Environment and Resource Management Project,Philippines.
Iskandar, Johan, and Rusydi Kotanegara. 1993. Methodology for biodiversity research. Paper presented atthe SUAN Biodiversity Methodology Workshop, October, Xishuangbanna, Yunnan, China.
Malayang, Ben S. 1990. Intensification and tenure security effects on the rate of forest clearance in uplandswiddening communities in the Philippines. Ph.D. diss., Department of Forestry and Resource Manage-ment, Univ. of California, Berkeley.
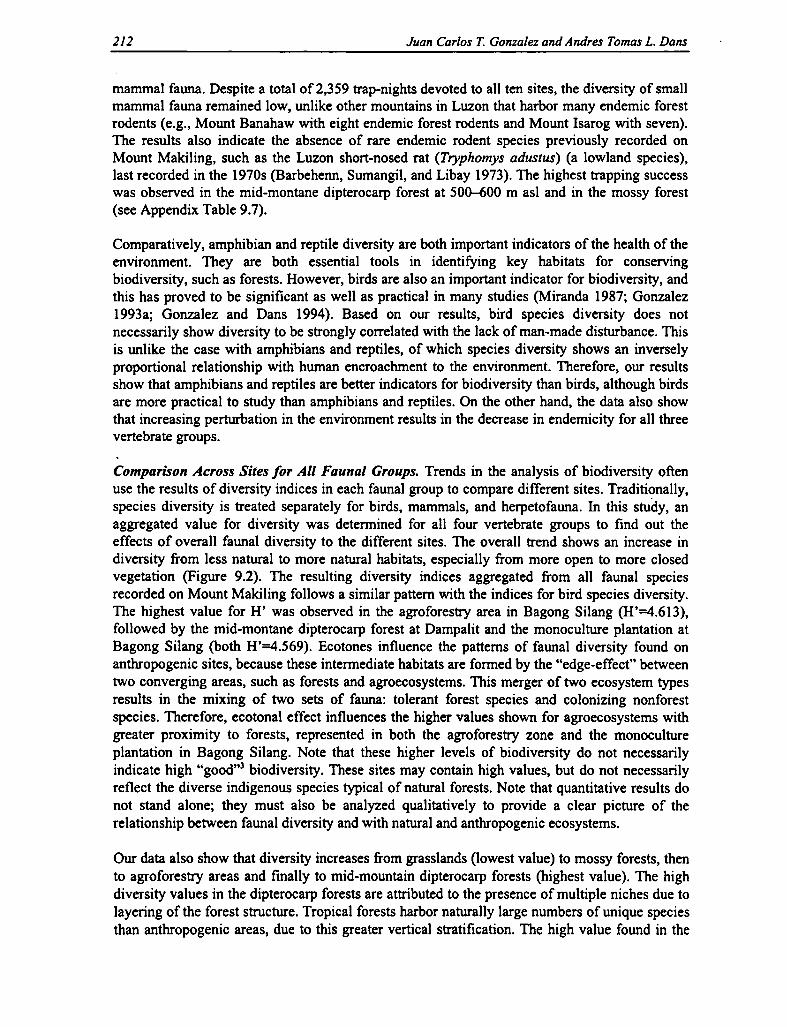
Faunal Diversity in Upper Citarum River Basin 75
Method
Survey Sites and Sampling Units. Three villages—Sukapura (1,250 m asl), Wangisagara (750 masl), and Ranca Kasumba (650 m asl)—were chosen for the study of avifauna, insects, andterrestrial Squamata in the man-made ecosystem with an assumption that they could representthe study area as a whole. An inventory of the land-use types was conducted in each village todetermine the appropriate sampling unit. The land-use types found were bamboo-tree gardens,homegardens, rice fields, and cash-crop gardens (only in Sukapura). Then inventory of the land-use type, landownership, and land area was done to make a table of frequency distribution byusing the Sturges method (Sudjana 1982). By looking at the proportion of 15 plots from everytype of land from each village, sampling units were randomly chosen. Besides the three villages,the natural ecosystem of Mount Wayang protected forest (2,160 m asl) was chosen as a studyarea. The number of sampling units in Mount Wayang is also 15, with each plot measuring 20 mx 20 m. Five were located at the foot of the mountain (Zone I, 1,660-1,830 m asl), another five atthe slope (Zone II, 1,831-2,000 m asl), and the last five at the top of the mountain (Zone III,>2,000 m asl).
Data Collection
Avifauna. The technique for data collection of avifauna is by point-count method (Bibby,Burgess, and Hill 1992), scan sampling, and ad libitum (Altmann 1974). Scan sampling meansthat a whole group of subjects is rapidly scanned or censused at regular intervals and thebehavior of each individual at that instant recorded. Ad libitum sampling means that nosystematic constraints are placed on what is recorded or when. The observation simply notesdown whatever is visible and seems relevant at that time. The point-count method is used toobtain data regarding composition and structure of the bird community in every land-use type.By this method, all species and number of individual birds that are seen and/or heard in- andoutside the specified radius are recorded. The radius of observation in the man-made ecosystemis 50 m, whereas in the natural forest, the radius is 25 m because of the denser vegetativestructure. The duration of time for every point or sampling unit is 20 minutes (van Helvoort1981). In this study, 15 points for every village in each land-use type were observed by oneresearcher.
Scan sampling and ad libitum methods were used to obtain data of the bird attractiveness to thevegetation structure in every community (which is referred to as a bird habitat) and its activities(Altman 1974). The recorded bird data include species numbers, individual numbers, andactivities of every species found in or have come into sampling units. Recorded bird activitiesinclude foraging, resting, such as perching and cleaning its body, and building nests. Everysampling unit was observed for three hours, from 6 A.M. to 9 A.M.
Soil Surface Insects. Data on soil surface insects were collected and included the number offamilies and individuals for each family found in every sampling unit. The techniques used indata collection were the pit-fall trap method for each soil surface insect (Neumann 1970). Eachtrap was located at a distance of 10 m for 24 hours. The collected insects were preserved in 4percent formalin solution for further identification on the family level.
Flying Insects. Data on flying insects were collected and included the number of families andindividuals for each family found in every sampling unit from 6 A.M. to 9 A.M. The techniqueused in data collection was the sweeping of a net on the surface of the soil or plant 1.5 m from
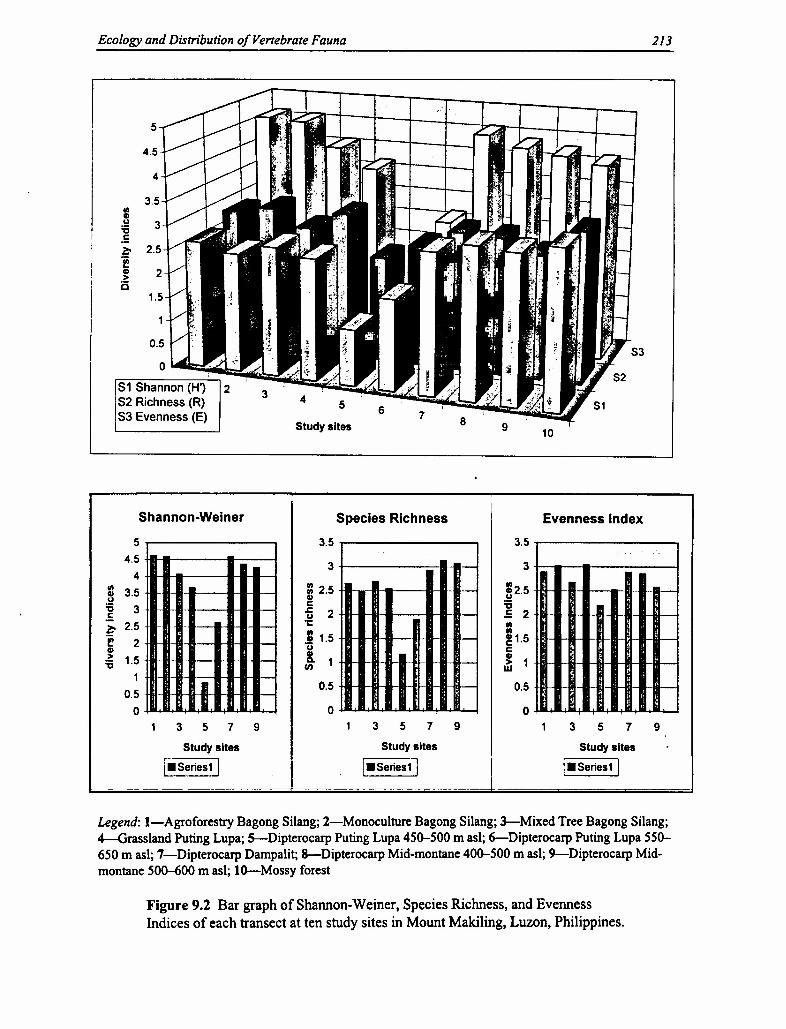
Biodiversity in the Ayangan-Ifugao Landscape 327
Manuta, Jesse. 1993. Tenurial arrangements and forest resource management in Haliap, Kiangan, Ifugao.M.Sc. thesis, Institute of Environmental Science and Management, Univ. of the Philippines at Los Banos,Laguna, Philippines.
Reijntjes, C., B. Haverkort, and A. Water-Bayers. 1992. Farming for the future: An introduction to lowinput and sustainable agriculture. Leiden, Holland: Macmillan.

76 T. S. Erawan, N. Djuangsih, M. Muchtar, H. Setiana, and L. S. Istanti
the ground, and following the direction of the spiral form. The sweeping activity depends on theland area and the environmental condition.
Terrestrial Squamata. Data were collected based on total census of the number of species and thenumber of individuals for each species found in every sampling unit. The technique used incollecting data is a modification of the quadrate method (Jaeger and Inger 1994) in which oneunit of land use was treated as a quadrate. Land-use type, which is used as a sampling unit, ismarked by a bamboo stick or plastic ribbon at every edge of the sampling unit. Sweeping activityis started from one edge of the sampling unit to the middle area. Litter or stone where usually theSquamata is hidden is removed carefully, and the number of species and individuals that can beseen during observation is recorded.
Data Analysis. The data analysis for the abundance and diversity measurement of avifauna,insects, and Squamata uses the same method. Species (family) composition was determined bythe list of species (family) found in each sampling unit. To determine the community structure,relative abundance (number of individuals of a species divided by total number of all individualsmultiplied by 100 percent) is counted. In order to discover the distribution of a species (ifneeded), relative density (the sum of sampling units in which the species were found is dividedby the total of sampling units multiplied by 100 percent) is determined. The Sorensen Index ofSimilarity is used to measure the similarity of species composition between land-use types in thestudy area. The community structure (and also the species composition) could be seen on thegraph prepared, based on the relative abundance value from each species.
The Shannon-Weiner Index, the Evenness Index, and the number of species were used to valuethe diversity of animals for each land-use type and to compare the diversity of animals indifferent land-use types.
Community Structure and Diversity of Faunain the Natural Protected Forest Ecosystem
Diversity Measures of Avifauna
Generally, bird species found in Mount Wayang are the forest mountain species. These speciesusually are less tolerant to human disturbance, even though several species could be found in aman-made habitat. In nature, different species have different tendencies to disperse and havedifferent-sized home ranges or territories (Harper 1987, cited by Bier egard et al. 1992). Duringour observation in Mount Wayang protected forest, we observed 110 bird species of 36 families.Thirty-eight of them were recorded in an observation sampling unit. Out of 110 species, 22 birdspecies are protected by Indonesian Law No. 5/1990 (Natural Resources and EcosystemConservation), and 12 bird species are endemic to the Java and Bali regions (Appendix Table4.1).
The dominant species (relative abundance/RA >5 percent) in Mount Wayang were Stachyrismelanothorax, Sitta azurea, Alcippe pyrrophtera, Pericrocotus miniatus, and Zosteropspalpebrosus (Appendix Table 4.1). The finding of these dominant species shows that thesespecies are relatively more adaptive to the conditions of Mount Wayang forest compared withother species. In the usage of forest space, each aforementioned species has a different pattern ofmovement between low and high forest strata. Stachyris melanothorax and Acippe pyrrophtera

328 Mariliza V. Ticsay-Ruscoe
Appendix Table 13.1 Biodiversity indices for a woodlotRelative
Plant Frequency frequency niSpecies name habit' (ni) (%) Log ni Log 10 in
Areca catechu T 69 29.49 1.84 126.88Ceiba pentandra * T 19 8.12 1.28 24.30Citrus grandis T 29 12.39 1.46 42.41Mangffera indica T 4 1.71 0.60 2.41Musa sapientum sT 7 2.99 0.84 5.92Artocarpus heterophyllus T 9 3.85 0.95 8.59Vitex parviora T 8 3.42 0.90 7.22Calamus merrilli V 2 0.85 0.30 0.60Persea americana* T 1 0.43 0.00 0.00Ananas
comosus* H 4 1.71 0.60 2.40Sauropus androsyrus sT 1 0.43 0.00 0.00Sweitenia sp. * T 1 0.43 0.00 0.00Pinus kesiya T 5 2.14 0.70 3.50Chrysophyllum caimito* T 3 1.28 0.48 1.43Sandoricum koe jape T 1 0.43 0.00 0.00Cassia spectabilis T 1 0.43 0.00 0.00Poutheria campechiana* T 2 0.85 0.30 0.60Bischofiajavanica T 1 0.43 0.00 0.00Diospyros sp. T 1 0.43 0.00 0.00Zingiber officinale H 40 17.09 1.60 64.08Cocos nucifera T 6 2.55 0.78 4.67Coffea
sp.* T 20 8.55 1.30 26.02
S = 22 Total N Total Log N Total= 234 100% = 2.37 = 321.03
Species Richness Shannon- EvennessR = 1.44 Weiner Index (e)
Index (H') = 2.482= 3.332
a. See Appendix Table 13.7 for abbreviation of habit.* Introduced species.
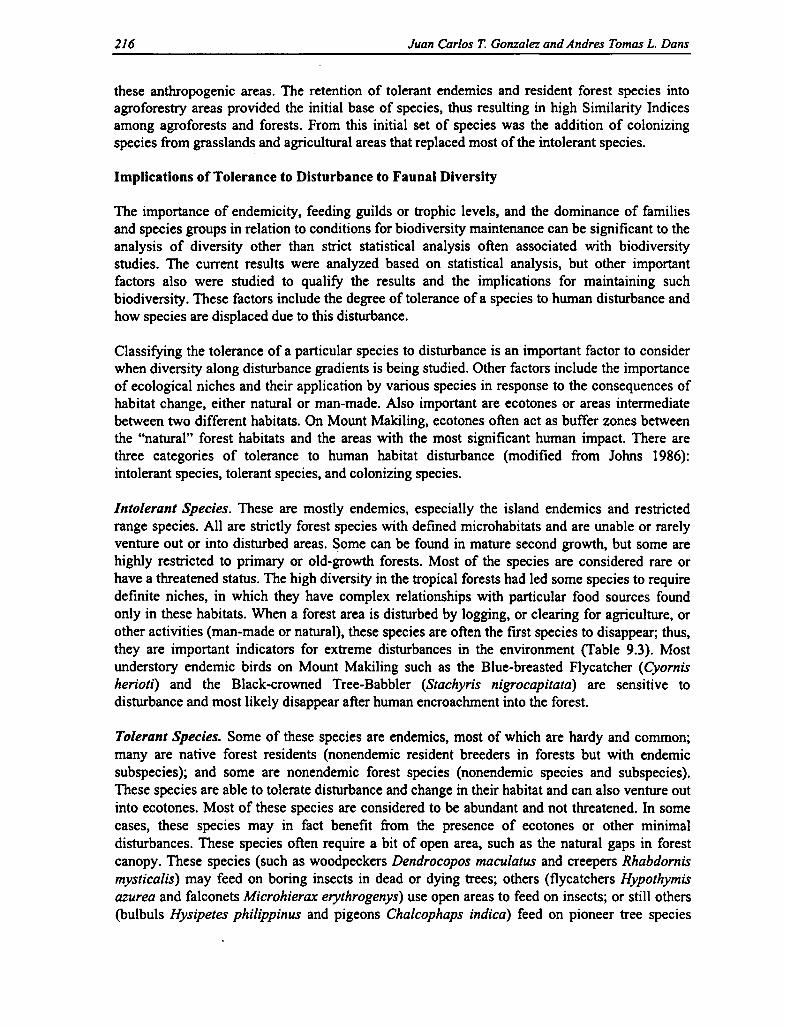
Faunal Diversity in Upper Citarum River Basin 77
are bird species that usually move in a group but sometimes join other species. Both horizontallyand vertically, A. pyrrophtera has a broader moving space where it usually moves on low andmiddle strata and is found dispersing in all zones of the mountain forest, whereas S.melanothorax tends to be shy and only moves on the low stratum of Mount Wayang forest.
Another species that has the most extended dispersion among the dominant species is Rhipiduraphoenicura. This species is found from the foot of and up to the peak of Mount Wayang.Sometimes this species flocks with other species (mixed-flock) and is often seen where the densevegetation covering and bushes are close to the ground surface (MacKinnon 1990).
Another dominant species is Sitta azurea, which moves alone or in pairs, and sometimes mixeswith other species to find meals, such as bugs, on the branches of large trees. This species, whichprefers large and dense trees, is more abundant closer to the peak (see Ch. 3, this volume).
One of the species from the Zosteropidae family is Zosterops palpebrosus, which is alsoincluded in the dominant group. This species usually moves in groups to find meals from a highstratum. Z palpebrosus is more tolerant to an environmental condition that has been changed.
These dominant species are insectivores, which often (but not always) are found moving togetherwith other species (mixed-species flocks of insectivorous birds), except for Pericocotus miniatusand Z palpebrosus. Other species that often move together in Mount Wayang are Rhipiduraphoenicura, Crocias albonotatus, Pomatorhinus montanus, and Pteruthius aenobarbus.According to Bourliere (1983), this phenomenon could be found in tropical forests as anindication of the existing association among species where the mixed-flock groups usuallyfollow army ants. At least two advantages in this association help the birds locate appropriatefood items and serve as an efficient way of finding areas of high food density in a patchyenvironment. The varied responses of insects on being disturbed, coupled with different andfairly specialized feeding techniques of the regular flock members, ensure benefits for all andavoid competition. The second is to gain protection from predators (which has not yet beensupported by actual observations). On the other hand, these obligate army-ant following birds arefar more susceptible to extinction in small reserves than are closely related species that requirefar smaller home ranges (Harper 1987, cited in Bierregard et al. 1992).
Other species that follow army ants in Mount Wayang are Naphotera epilepidota and Pnoepygapussila, which are not included as nondominant species. These two species are shy and usuallysurvive in closed bushlands (MacKinnon 1990). Another nondominant species found isErythrura hyperthra, one of the Ploceidae that is accustomed to living in humid forest and rarelyfound in the Western Java region (MacKinnon 1990). This species is rarely found in MountWayang forest because it has a narrow niche in consuming Graminae seeds, which are also rarein Mount Wayang.
Another species found in Mount Wayang is Oriolus chinesis (relative dominance of only 0.54percent). This bird species has a habit of living in a transition zone between a natural ecosystemand a rural ecosystem. This species, because of its beautiful feathers and voice, is a commercialbird species that is often hunted. Thus, this species is rarely found in Mount Wayang. Otherspecies often hunted and sold for their beautiful feathers and are not found to be dominant inMount Wayang are Megalaima armillaris, Brachypteryx leucophaeus, B. montana, andCiclidium diana. M. armillaris usually occupies a primary forest and its edge and is accustomedto eating insects and the fruit/seed of kiara (Ficus septica) and cerem (Ficus sp.). These last-

Biodiversity in the Ayangan-Ifugao Landscape 329
Appendix Table 13.2 Biodiversity indices for a coffee plantationRelative
Plant Frequency frequency niSpecies name habit' (ni) (%) Log ni Log 10 ni
Coffea sp. * T 78 13.78 1.89 147.58Erythrinia orientalis T 4 0.71 0.60 2.41Citrus grandis T 42 7.42 1.62 68.18Persea americana T 2 0.35 0.30 0.60Eleucine indica G 52 9.19 1.72 89.23Tiliaceae T 1 0.18 0 0Mikania cordata* V 20 3.53 1.30 26.02Cyperus sp. Sd 66 11.66 1.82 10.92Ficus septima sT 2 0.35 0.30 0.60Bischofiajavanica T 7 1.24 0.84 5.92Pteridium aquilinium F 23 4.06 1.36 31.32Helianthus sp. * S 74 13.07 1.87 138.32Piper sp. S 20 3.53 1.30 26.02Kolowratia elegans H 15 2.65 1.18 17.64Crassocephalum sp.* S 27 4.77 1.43 38.65Orchidaceae H 3 0.54 0.48 1.43Zingiber officinale H 14 2.47 1.15 16.05Cyathea sp. F 3 0.54 0.48 1.43Blumea balsaminijera S 41 7.24 1.61 66.12Areca catechu T 4 0.71 0.60 2.41Paspalum conjugatum G 68 12.01 1.83 124.61
S = 21 N = 566 Total = Log N = Total =100% 2.75 815.46
Species Richness Shannon- EvennessR = 0.88 Weiner Index Index
(H') = 2.02 (e) =1.53
a. See Appendix Table 13.7 for abbreviation of habit.* Introduced species.

78 T. S. Erawan, N. Djuangsih, M. Muchtar, H. Setiana, and L. S. Istanti
cited species are usually found on the forest floor and are rarely seen; however, they are easilyrecognizable by their voice. This species can easily be caught by the dozen for sale, resulting inoverhunting and, in turn, the extinction of certain species.
Diversity of Avifauna on Mount Wayang. Based on observations at Mount Wayang, 36 birdspecies of 15 families were found. The Diversity Index (Shannon-Weiner=H') is 3.18 and theEvenness Index is 0.89. Those values are not much different (except for the species number)from van Helvoort's observation of 1981 in other secondary forests at Pasir Jatiluhur, which isalso located on Citarum River Basin where 53 species with H' were found between 0.10 and3.29. The Similarity Index found that the population spread of these species in Mount Wayang iseven.
In Mount Wayang, Timaliidae is the largest family consisting of 8 species; next is Muscicapidaewith 6 species. Members of these species are included in the insectivore groups. The families ofCuculidae, Dicaeidae, Dicruridae, Plocediae, Capitonidae, Aegithalidae, and Sittidae have onespecies only. The list of bird species found in Mount Wayang is presented in Appendix Table4.1. The structure and classification in this checklist follows Peter's Sequence (Andrew 1992).
Of these 65 species, 9 are endemic in Java: Aethopyga eximia, Alcippe pyrrophtera, Crociasalbonotatus, Lophozosterops javanicus, Psaltria exilis, Rhipidura phoenicura, Arborophilajavanica, Garrulax rufifrons, and Tesia superciliaris. There are 4 endemic species in Java andBali: Megalaima armillaris, Stachyris melanothorax, Halcyon cyanoventris, and Paddaoryzivora. All endemic species are protected by Indonesian Law No. 5/1990. One other protectedspecies but not endemic is Arachnotera longirostra. Crocias albonotatus is included in the near-threatened category (IUCN). No data are available regarding the status of Napothera epilepidotaand Psaltria exilis, which are sedentary birds in Java and Bali and are cause for concern(MacKinnon 1990).
Most of the 36 species cited earlier are generally sedentary species; however, only Muscicapasibirica is migratory. This species propagates in Northeast Asia and the Himalaya, where inwinter it migrates to South China, Southeast Asia, Palawan, Kalimantan, and West Java(MacKinnon 1990). In West Java, one of the migration region is Mount Wayang. This visitingspecies shows the importance of this region as its temporary habitat and source for food.
In connection with the aspect of feeding guild, these insectivore birds are the most numerousspecies found in Mount Wayang forest. This indicates that the supply of insects as the food forthose species are abundant, thus supporting the existence of various bird species in MountWayang. The insectivorous bird species play an important role in the forest ecosystem. Theyhave significant influence on the population dynamics of many forest insects. Birds act as directmortality agents of insect pests and can also affect their prey indirectly through influencinginsect parasites and predators by spreading entomogenous pathogens or, in some cases, byaltering the microhabitat of the prey (Otvos 1979).
Eleven omnivorous species were found. These species, besides insect, eat fruit and/or honey. Thesufficient amount of these species shows the complexity of niche in Mount Wayang. Theomnivorous species is a group that has a wide niche capable of adapting to its environment. Ifthe environment changes, these omnivorous species will survive longer compared withspecialized species. The existence of these species in a tropical forest is needed because theyfunction as pollinators. A majority of tropical trees rely exclusively on animals. One of these

330 Mariliza V. Ticsay-Ruscoe
Appendix Table 133 Biodiversity indices for a swidden
Species namePlanthabit'
Frequency(ni)
Relativefrequency
(%) Log nini
Log 10 ni
Solanum melongena * S 122 7.00 2.09 254.98S. nigrum S 21 1.21 1.32 27.72Zea mays * H 6 0.34 0.78 4.68Lycopersicum esculentum * S 1 0.06 0.00 0.00Brassica integrifolia * H 48 2.76 1.68 80.64Psophocarpus sp. V 224 12.87 2.35 526.40Album cepa* H 40 2.30 1.60 64.00A. sativum * H 15 0.86 1.18 17.70Psidium guajava sT 27 1.55 1.43 38 61Coffea liberica * T 11 0.63 1.04 11.44Leucaena leueoeephala * T 2 0.11 0.30 0.60Colocasia esculenta H 108 6.20 2.03 219.24Capsicum frutescens * S 4 0.23 0.60 2.40Samanea saman T 1 0.06 0.00 0.00Cucurbita maxima V 5 0.29 0.70 3.50Manihot esculenta S 13 0.75 1.11 14.43Cajanus cajan S 63 3.62 1.80 113.40Musa sapientum sT 3 0.17 0.48 1.44Abelmoschus esculentus* S 1 0.06 0.00 0.00Phaselous lunatus V 7 0.40 0.84 5.88Phaseolus sp. V 5 0.29 0.70 3.50Crassocephalum sp. * S 5 0.29 0.70 3.50Pteridium aquilinium * F 3 0.17 0.48 1.44Cosmos caudatus* S 2 0.11 0.30 0.60Chromolaena odorata * S 2 0.11 0.30 0.60Cassia sp. T 1 0.06 0.00 0.00Abroma angusta sT 12 0.70 1.08 12.96Macaranga bicolor T 1 0.06 0.00 0.00Sechium edule* V 2 0.11 0.30 0.60Jpomoea batatas V 983 56.46 2.99 2939.17Carica papaya * sT 1 0.06 0.00 0.00Miscanthusforibundus tG 2 0.11 0.30 0.60
S = 32 Total N Total = Log N Total == 1,741 100% = 3.24 4,350.03
Species Richness Shannon- EvennessR = 0.77 Weiner Index (e)
Index (H') =1.63= 2.458
a. See Appendix Table 13.7 for abbreviation of habit.* Introduced species.
Faunal Diversity in Upper Citarum River Basin 79
animals is the bird, to transfer their pollen (Peters 1994). Among these species as pollinators arefrom Nectarinidae and Dicaeidae; however, species from the Dicaeidae family is noxious foragriculture (Dammerman 1929).
The frugivores (which feed on fruits and seeds) found in Mount Wayang were Lophozosteropsjavanicus, Zosterops montanus, Zosterops palpebrosus, and Megalaima armillaris. Ecologically,frugivores have an important role as agents of seed dispersal. These animals either remove fruitsdirectly from the tree or forage on fruits that have already fallen to the ground. However, duringhandling, transporting, or feeding on fruits, frugivores may destroy a large proportion of theseeds inside (Peters 1994). The carnivorous species found in Mount Wayang were Ictinaetusmalayensis and Falco mollucensis. Although these species are predators, ecologically they playan important role. Terborgh (1992, cited in Bierregard et al. 1992) has pointed out that the loss oflarge predators may have a destabilizing effect on populations of seed predators, which, in turn,may affect the composition of tree species in the forest.
Fragmentation in Mount Wayang is caused by human cutting, and changes in bird species arecaused by gardening. These existing bird species with their dispersal potential adapt themselvesto the changes in environment. Variation in abundance reflects areal divisions. A species thatdominates or is abundant in a certain zone is less abundant or even not found in another zone. Ifit is perceived based on its zone, there is a tendency in decreasing number of species and familyin Zones I to III, respectively, 24, 23, and 21 for species and 13, 10, and 8 for family (AppendixTable 4.2). Changes of species richness with altitude may be explained to a great extent by theassociated changes in vegetation and food resources (Bourliere 1983). Besides that, humanpresence with cutting, wood gathering, and especially hunting in Mount Wayang are suspected tocontribute to bird existence in this region.
Zone I. Zone I of Mount Wayang borders with a region where human intervention or activitiesare very high. They have caused a high spatial heterogeneity shown by the presence of varioustypes of vegetation such as tea garden, agricultural land, production forest, grass field, andbushes. The high heterogeneity provides various habitats for bird species. In Zone I, a dominantspecies found is Zosterops palpebrosus (RA 13 percent). This species is usually in groups whentraveling the strata above trees so the abundance values are large. This species is also found in acountry region, showing that this species has a high dispersal capacity and tends to be tolerant tothe degraded habitat (human environment). Another dominant species that has high dispersal isAethopyga eximia, which generally lives in a secondary, open-forest region where humanactivities are not high. This species is categorized as honey-consumer species. Around Zone I isan open area planted with blooming Calliandra callothyrsus, which attracts this species. Anotherhoney eater is Arachnotera longirostra, which is not dominant. According to MacKinnon (1990),this species is commonly found in a low-land forest; thus, in Mount Wayang this is not dominantand only found in Zone I.
As with Zosterops palpebrosus, Alcippe pyrrophtera and Stachyris melanothorax are usualspecies that move in groups, so they usually are dominant species. Besides its high abundance, A.pyrrophtera (RF 11.6 percent) is a high dispersal species found in most of the sampling units. A.pyrrophtera (RA 13.5 percent) is more dominant than S. melanothorax (RA 7.87 percent). Thisis because the movement space of this species is wider (i.e., from low to middle strata), whereasS. melanothorax is only found at low stratum. Twenty-four species that belong to 13 familieswith a value of H' 2.76 and Evenness Index of 0.87 were found in Zone I. Out of 24 species, 8are protected species. One of the protected species is Arachnotera longirostra, which is not

Biodiversity in the Ayangan-Ifugao Landscape 331
Appendix Table 13.4 Biodiversity indices for a terraced rice fieldRelative
Plant Frequency frequency niSpecies name habit' (ni) (%) Log ni Log 10 ni
Miscanthus floribundus tG 100 12.02 2.00 200.00Musa sapientum sT 12 1.44 1.08 12.96Vigna sesquipedalis* V 15 1.81 1.18 17.70Colocasia esculenta H 20 2.40 1.30 26.00Zingiber officinale H 20 2.40 1.30 26.00Jatropha curcas S 1 0.12 0.00 0.00Oryza sativa var. kumi-i G 150 18.03 2.18 327.00O. sativa var. IR-36 G 450 54.09 2.65 1192.50Psophocarpus sp. V 64 7.69 1.81 115.84
S = 9 Total Total = Log N TotalN = 832 100% =2.14 =1,918
Species Richness Shannon- EvennessR = 0.3125 Weiner Index (e)
Index (H') =2.14= 2.031
a. See Appendix Table 13.7 for abbreviation of habit.* Introduced species.

80 T. S. Erawan, N. Djuangsih, M. Muchtar, H. Setiana, and L. S. Istanti
dominant, while seven others are endemic. These five protected species are dominant in Zone I(with relative abundance >5 percent), while Arachnotera longirostra and Psaltria exilis are notdominant. Endemic species are still found in Zone I, and several of them have a low populationlevel so they are susceptible to extinction. Zone I is bordered with an agroecosystem region and aproduction forest affected by human management so the conservation of Mount Wayang iscrucial. Besides these endemic species in Zone I, a visitor species, Muscicapa sibirica, ispropagated in Northeast Asia and the Himalaya (MacKinnon 1990).
Oriolus chinensis, which is generally hunted and has a sufficient high economic value, wasfound in Zone I; however, this species was only found in one sampling unit. Hunting has resultedin population decrease of this species.
Zone II. Stachyris melanothorax (RA 19.3 percent) is a dominant species in Zone II. This speciesis shy and usually moves in the low, close forested stratum (MacKinnon 1990). In Zone II,human disturbance to the vegetation structure is higher than in Zones I and III. This is shown bythe low density and the large number of open regions caused by cutting by the local people in theMount Wayang area (see Ch. 3, this volume). The open region overgrown by bushes in this zonecauses Stachyris melanothorax (RA 19.3 percent) and Alcippe pyrrophtera (RA 6.14) to bedominant, because those species belong to the bush-bird species. S. melanothorax (RA 19.3percent) is found to be dominant because this species is often found in mixed-flock, traveling ingroups to find food together. Psaltria exilis (RA 5.26 percent) is also found to be dominant. Thisspecies, according to MacKinnon (1990), is a concern because no data are available. Zone IIcontains species (Pnoepyga pussila, Pteruthius flaviscapis, and Theprodornis gularis) with veryfew abundance (each RA is 0.88 percent), and they are not found in other zones. P. pussila liveson the ground of dense vegetation and is rarely found.
The number of total species in Zone II is 23 species. The value of Diversity Index (H') in Zone IIis 2.80. This H' value is quite similar with the other two zones. Of 23 species, 6 are endemic toJava and Bali, and 6 of them are protected. Stachyris melanothorax, Alcippe pyrophtera, andCrocias albonotatus are protected species found to be dominant in Zone II. According to IUCN,C. albonotatus is in the near-threatened category but is globally categorized as not threatened.
Zone III. Generally, the condition of the vegetation in Zone III is more intact compared withZones I and II, having less disturbance by human activity (see Ch. 3, this volume). In Zone III,Sitta azurea dominates with RA 18.3 percent and RF 9.37 percent. This species tends to like aregion with large trees where it can perch on tree branches and look for food such as insects.Other predominant species with RA <0.7 are Alcippe pyrrophtera (RA 11.3 percent),Lophozosterops javanicus (RA 8.45 percent), Crocias albonotatus (RA 7.04 percent), andSeicercus garmmiceps (RA 7.04 percent). These species have the habit of mixing together insearch for food, so they are found to be dominant.
The species number in Zone III is 21; it is the fewest compared with the other two zones. Thedecreasing number of these bird species caused the homogeneity of the vegetation near the peak,which means that fewer habitat types are available. The Diversity Index value is not far differentfrom other zones at 2.77 (Appendix Table 4.2), while the Evenness value is the highest at 0.91,meaning the individual dispersal of these species is almost even. The species Sitta azuria (RA18.3 percent), Alcippe pyrrophtera (RA 11.3 percent), Lophozosterops javanicus (RA 8.45percent), and Crocias albonotatus (RA 7.04 percent) are dominant species in Zone III.

332 Mariliza V Ticsay-Ruscoe
ADaendix Table 13.5 Biodiversitv indices for a bean garden
Species namePlanthabit'
Frequency(ni)
Relativefrequency
(%) Log nini
Log 10 ni
Oryza sativa var. kumi-i G 150 11.38 2.17 325.50Colocasia esculenta H 20 1.52 1.30 26.50Phaseolus vulgaris ("burik") V 500 37.94 2.70 1350.00Zea mays* H 52 3.95 1.72 89.44Monochoria vaginalis H 16 1.21 1.20 19.20Euphorbia hirta H 25 1.90 1.40 35.00Crassocephalum sp. * S 100 7.59 2.00 200.00Nasturtium indicum * H 32 2.43 1.51 48.32Ricinus sp. * S 4 0.30 0.60 2.40Cyperus hirta Sd 200 15.17 2.30 460.00Cosmos caudatus * S 2 0.15 0.30 0.60Miscanthus foribundus tG 10 0.76 1.00 10.00Portulaca sp. H 25 1.90 1.40 35.00Acalypha amentacea sT 1 0.08 0.00 0.00Paspalum conjugatum G 125 9.48 2.10 262.50Pteridium aquilinium * F 12 0.91 1.08 12.96Centella asiatica H 16 1.21 1.20 19.20Helianthus sp. * S 28 2.12 1.45 40.60
S = 18 Total Total = Log N TotalN = 1318 100% = 3.1199 =2,936.72
Species Richness Shannon- EvennessR = 0.495 Weiner Index (e)
Index (H') = 2.368= 2.972
a. See Appendix Table 13.7 for abbreviation of habit.* Introduced species.

Faunal Diversity in Upper Citarum River Basin 81
The similarity of species composition between zones shows high similarity (Sorensen's Index ofSimilarity of 60-77 percent). The high similarity between those zones shows that bird speciesfound among three zones is almost the same. The similarity of species composition betweenZones II and III shows the highest value followed by similarity of species composition betweenZones I and III, and the last is between Zones I and II (Appendix Table 4.2).
Diversity Measures of Flying Insects
The total number of flying insects found in the 15 sampling units was 1,424 individuals: 282individuals from the foot of the mountain (Zone I), 786 from the side (Zone II), and 356 from thetop of the mountain (Zone III). The number of the families identified was 61 belonging to eightorders. The flying insect order having the highest number of families was Diptera, with 19families; in addition, researchers found Coleoptera with 5 families, Hymenoptera with 4families, Hemiptera with 3 families, Lepidoptera with 3 families, Orthoptera with 2 families, andPhasmida with I family (Appendix Table 4.3).
The dominant flying insect families were Ichneumonidae (RA 15.87 percent; Hymenoptera),Simuliidae (RA 12.85 percent; Diptera), Cecidomyiidae (RA 12.01 percent; Diptera); Cynipidae(RA 9.06; Hymenoptera), and Tiphiidae (RA 7.37 percent; Hymenoptera). Those families werethe most distributed (RF >4 percent). Besides the families mentioned, Cicadellidae (RF 4.20percent; Homoptera), Chrysomelidae (RF 3.80 percent; Coleoptera), and Pyrrhocoridae could beobserved. They were also widely distributed, but with low abundance.
The relationship between families could not be detected yet. Specific and intensive surveys muststill be carried out to understand the association among the insects themselves, as well asbetween the insects and the plants. From the family characteristics known, the next descriptioncan be given. According to Borror, Triplehom, and Johnson (1992), Diptera (especiallyCecidomyiidae, Tephritidae, and Agromyzidae), Hymenopteran (Cynipidae, some Chalconidae,and some Tenthredinidae), and Coleoptera (certain Curculionidae, Suprestidae, andCerambycidae) are 3 orders known as gall-making insects. A gall is an abnormal growth on acertain part of a plant. It is built by the insect by injecting a certain chemical substance (usuallyin the breeding season). The gall then is inhabited by one or more insects. The gall can be foundon different parts of the plant, but each insect species creates only one specific gall on differentparts of a specific plant. Cynipidae, for instance, builds galls on Quercus sp. or Rosaceae.Cynipidae was one of the dominant insects in Mount Wayang forest, and this was supposed to becorrelated with the dominance and wide distribution of Quercus lineata. Among the members ofRosaceae, Smilax sp. and S. zeylanica were observed. The distribution of Smilax sp. was more orless even.
Ichneumonidae is a hyperparasite for Lepidoptera, Hemiptera, Coleoptera, and Hymenopteraincluding Braconidae. Another family, which is also a parasite for Braconidae, is Cynipidae(Borror, Triplehorn, and Johnson 1992). Both of these hyperparasites were predicted to depressthe population growth rate of Braconidae, so that this family was not dominant at MountWayang.
Zone I. The number of flying insects found in five sampling units was 282 individuals belongingto 35 families of six orders. The dominant flying insect communities at Zone I were more evenlydistributed compared to Zone II, but lower than that of Zone III. Besides Ichneumonidae (RA5.89) and the four families mentioned earlier, the other dominant families were Conopidae (RA

Biodiversity in the Ayangan-Ifugao Landscape
Appendix Table 13.6 Biodiversity indices for a homegardenRelative
Plant Frequency frequency niSpecies name habit' (ni) (%) Log ni Log 10 ni
Citrus grandis sT 48 9.18 1.68 80.70C. limon * sT 10 1.90 1.00 10.00C. reticulata sT 3 0.57 0.48 1.43C. microcarpa sT 4 0.77 0.60 2.40Saccharum officinale tG 4 0.77 0.60 2.40Cucurbita maxima V 1 0.18 0.00 0.00Momordica charantia V 2 0.38 0.30 0.60Solanum nigrum S 16 3.06 1.20 19.27Opuntia dillenia* H 5 0.96 0.70 3.50O. cylindrica * H 65 12.43 1.81 117.84Bougainvilea glabra* S 4 0.77 0.60 2.40Codiaeum variegatum * S 98 18.74 1.99 195.14Dracaena draco * S 3 0.57 0.48 1.43Euphorbia heterophylla S 9 1.72 0.95 8.59E. pulcherimma* S 2 0.38 0.30 0.60Tamarindus indicus T 1 0.18 0.00 0.00Cocos nucifera T 9 1.72 0.95 8.59Areca catechu T 2 0.38 0.30 0.60Thevetia peruviana * sT 3 0.57 0.48 1.43Delonix regia T 3 0.57 0.48 1.43Hibiscus mutabilis* S 2 0.38 0.30 0.60Rosa rugosa * S 13 2.49 1.11 14.48Belamcanda chinensis H 15 2.87 1.18 17.64Catharanthus roseus H 10 1.90 1.00 10.00Solanum melongena* S 16 3.06 1.20 19.27Dendrobium nobile H 2 0.38 0.30 0.60Sanseviera trifaciata H 16 3.06 1.20 19.27Euphorbia antiquorum S 2 0.38 0.30 0.60Allium tuberosum * H 9 1.72 0.95 8.59Mentha haplocalyx* H 5 0.96 0.70 3.50Allium cepa* H 3 0.57 0.48 1.43Sauropus androsyrus sT 2 0.38 0.30 0.60Mangifera indica T 4 0.77 0.60 2.40Artocarpus heterophyllus T 3 0.57 0.40 1.43Sandoricum koetjape T 4 0.77 0.60 2.40Ananas comosus* H 2 0.38 0.30 0.60Musa sapientum sT 2 0.38 0.00 0.60Asparagus of cinalis * V 1 0.18 0.90 0.00Bryophyllum pinnatum H 8 1.53 0.48 7.22Psidium guajava sT 3 0.57 0.00 1.43Lucuma nervosa sT 1 0.18 0.00 0.00Cordyline fruticosa S 1 0.18 1.32 0.00Amaryllis vittata H 21 4.02 0.70 27.77Widelia sp. S 5 0.96 0.30 3.50Datura metel S 2 0.38 0.00 0.60Annona muricata sT 1 0.18 0.84 0.00Alnus sp. sT 7 1.35 1.61 5.92Leucaena leucocephala * T 41 7.84 0.00 66.12
333

82 T. S. Erawan, N. Djuangsih, M. Muchtar, H. Setiana, and L. S. Istanti
1.26), Chrysomelidae (RA 1.12), Formicidae (RA 0.84), Calliphoridae (RA 0.77), Cicadellidae(RA 0.70), and Simuliidae (RA 0.70). The Diversity Index of the flying insects in Zone I was2.80 and the Evenness Index was 0.78.
Zone II. The number of individuals, families, and orders of flying insects detected in the fivesampling units of Zone II was 786, 50, and 7, respectively. The Diversity Index and EvennessIndex were 2.88 and 0.74, respectively.
The number of individuals, families, and orders of flying insects in Zone II was higher than thosein Zone I. Although the Evenness Index was lower than in Zone I, the Diversity Index washigher. Therefore, it could be stated that the flying insect diversity in Zone II was higher than inZone I.
The similarity of composition of families between Zones I and II was high (Similarity Index 66percent). The families of flying insects that dominated Zone II were Simuliidae, Ichneumonidae,and Cecidomyiidae. Simuliidae in Zone I occupied the second rank of dominance, afterIchneumonidae. In Zone II, Simuliidae is the highest and pushes Ichneumonidae to second rank.Cecidomyiidae moved from fourth rank in Zone Ito third rank in Zone II.
Some families found in Zone I were not detected in Zone II; on the other hand, some families notdetected in Zone I might be found in Zone II. However, all those were not dominant families (theabundance was very low). Families that dominated Zone I but were not found in Zone II wereCalliphoridae and Formicidae; whereas Dysticidae was not detected in Zone I, but was dominantin Zone II.
In sum then, community changes from Zones Ito II were (1) Calliphoridae and Formicidae werenot found, (2) Dysticidae was found and later became dominant, (3) increase of total abundance,(4) change in dominance rank among the dominant groups, and (5) an increase in the DiversityIndex and a decrease in the Evenness Index.
Zone III. The number of flying insects from five sampling units in Zone III was lower than inZone II but higher than in Zone I, namely 356 individuals belonging to 42 families of 8 orders.From the viewpoint of total abundance, the abundance in Zone III was clearly lower than in ZoneII. With regard to diversity, considering only the number of families, diversity in Zone III waslower than in Zone II. As Kottelat et al. (1993) stated, a higher level of taxon, in this case order,showed that the diversity of flying insects in Zone III was higher than in Zone II.
The higher diversity of flying insects in Zone I compared to Zone II was also shown by thehigher Diversity Index (2.97:2.88) and the Evenness Index (0.79:0.74). The Similarity Indexbetween Zones III and II was 0.65; and between Zones III and I, it was 0.66. Thus, the Similaritybetween the zone was high. The dominant families were also the same with only the dominanceranking being different.
The dominant families of Zone III were Dysticidae, Cecidomyiidae, Simuliidae, Ichneumonidae,Cynipide, Tiphiidae, Miridae, and Curculionidae. The influence of human disturbances on thevegetation was as follows: In Mount Wayang forest, the highest intensity of human disturbancewas at the side of the mountain (Zone II). At the foot, disturbances were relatively decreasedwhile the least disturbance was at the top of the mountain (Zone III). Thus, the level of change inthe vegetation structure due to disturbances was as follows: the least disturbance at the top (Zone

334 Mariliza V. Ticsay-Ruscoe
Appendix Table 13.6 Biodiversity indices for a homegardenRelative
Plant Frequency frequency niSpecies name habit' (ni) (%) Log ni Log 10 niBischofiajavanica T 1 0.18 0.30 0.00Lycopersicum esculentum* S 2 0.38 0.70 0.60Manihot esculenta S 5 0.96 0.30 3.50Coffea robusta* T 2 0.38 0.48 0.60Palmae sp. T 3 0.57 0.00 1.43Croton tiglium sT 1 0.18 0.30 0.00Euphorbia pterocali H 2 0.38 1.00 0.60Cactus sp. H 10 1.90 0.60 10.00Bixa sp. sT 4 0.77 0.00 2.40
S = 57 Total Total = Log N TotalN = 523 100% = 2.72 = 694.05
Species Richness Shannon- EvennessR=2.49 Weiner Index (e)
Index (H') = 2.64= 4.64
a. See Appendix Table 13.7 for abbreviation of habit.* Introduced species.

Faunal Diversity in Upper Citarum River Basin 83
III), relatively low disturbance at the foot (Zone I), and the highest disturbance at the side of themountain (Zone II). The impact of disturbances was, among others, a decrease in the number oftrees and an increase of the number of shrubs (see Ch. 3, this volume) at the side of themountain.
The impact of the disturbances on the flying insects community could be predicted to be thesame: top (Zone III), foot (Zone I), and side of the mountain (Zone II). The change in communitystructure and diversity of the flying insects from the top toward the foot of the mountain (Zone I)would decrease in total abundance, diversity, as well as the evenness. The dominant flyinginsects in Zone III (Dysticidae, Cecidomyiidae, Simuliidae, Cynipidae, Tiphiidae, Miriidae, andCurculionidae) would show a decrease, but Ichneumonidae, Chrysomelidae, Conopidae,Cicadellidae, Calliphoridae, and Formicidae would show an increase in their abundance. Achange in the rank of dominance would also occur. For instance, in Zone III the dominance rankof Ichneumonidae would be fourth; in Zone I, it would change to the most dominant, or first.
A change in the structure and diversity of flying insects from Zones I to II was as follows: anincrease in total abundance and diversity, but a decrease in the evenness. The abundance of thedominant families (Ichneumonidae, Simuliidae, Cecidomyiidae, Cynipidae, Tiphiidae,Chrysomelidae) in Zone I would increase, but Conopidae, Cicadellidae, Calliphoridae, andFormicidae would decrease.
A change in the rank among the dominant families could create a disaster if the ranking of themost dangerous group of insects became higher. An example in Indonesia was the explosion ofhama wereng (Nilavarvata lugens). Formerly, the dominance rank of N. lugens was lower thanwalang sangit, but as the abundance of walang sangit decreased due to pesticides, N. lugensreplaced walang sangit.
Diversity Measures of Soil Surface Insects
Research on the community structure of soil surface insects in protected tropical forestecosystems such as Mount Wayang in relation to vegetation condition was not a simple matter.The results were influenced by sampling and dynamics of the insects within space and timedimensions. Therefore, the results obtained possibly underestimate the real conditions of soilsurface insects in the study area.
Of all the pit-fall traps placed on Mount Wayang, one of them was filled with Termitidae insectswith about 18,000 individuals. Accidentally, the trap was put near a termite's nest/hole on MountWayang. The presence of termite nests in this tropical forest ecosystem was one of the specialcharacteristics of this ecosystem. In tropical forest, the role of termites is often considered moreimportant than earthworm because termites are the soil organisms most active in the physical andchemical reduction of plant remnants. Experts say that the existence of termite nests in a forestecosystem (in abundance) would affect the whole ecosystem. The nest is usually made of soilmaterial and the remnants of plants that could influence soil texture, water-holding capacity, andchemical characteristics of the soil in the area. Usually the fertility of the soil in the area of atermite nest is higher than other places because organic materials from different parts of theforest are gathered to build the nest.
Analysis of soil surface insects in Mount Wayang showed (if the trap filled with termites areexcluded from the analysis) that of 27 families captured, two were from the Collembola order
Biodiversity in the Ayangan-I,Jugao Landscape 335
Appendix Table 13.7 Plant species found in the Haliap-Panubtuban landscapeRef.No. Species Family Habit'
I Evodia meliaefolia (Hance) Benth Rutaceae T2 Aglaia sp. Meliaceae sT3 Bischofiajavanica Bl. Euphorbiaceae T4 Ficus septica Burm. f. (Hauili) Moraceae sT5 Asparagus setaceus Asparagaceae H6 Solanum biflorum Lour. Solanaceae S7 Dracaena fragrans Agavaceae S8 Opuntia dillenia' Cactaceae H9 Gerbera jamessonii Bolus ex Hook • Compositae H10 Catharanthus roseus (L.) G. Don Apocynaceae H11 Centella asiatica (L.) Urban Umbelliferae H12 Amaranthus lividus L. Amaranthaceae H13 Gomphrena celosoides Mart. Amaranthaceae H14 Artemisia vulgaris L. Compositae H15 Nasturtium indicum (L.) DC. • Cruciferae H16 Paspalum conjugatum Berg. Graminae/Poaceae G17 Schellolepis subauriculata(B1.)J.Sm. Polypodiaceae F18 Drynaria quercifolia (L.) J. Sm. Polypodiaceae F19 Drynariopsis heraclea (Kunze) Ching Polypodiaceae F20 Drymaria cordata (L.) Wield. ex R&S. Caryophyllaceae H21 Euphorbia hirta L. Euphorbiaceae H22 Ageratum conyzoides L. Compositae H23 Cynodon dactylon (L.) Pers. Graminae/Poaceae G24 Phyllanthus urinaria L. Euphorbiaceae H25 Pseudelephantopus spicatus C. Compositae H26 Jatropha curcas L. Euphorbiaceae S27 Iresine herbstii Hook. • Amaranthaceae H28 Christella arida (Don.) Holt. Thelypteridaceae F29 Maranta arundinacea L. Marantaceae H30 Nephrolepis biserrata (Sw.) Schott Davalliaceae F31 Adiantum sp. Sinopteridaceae F32 Bidens pilosa L. Compositae H33 Pothomorphe umbellata (L.) Miq. Piperaceae S34 Acalypha amentacea Roxb. Euphorbiaceae sT35 Urena lobata L. Malvaceae H36 Microsorium puntatum (L.) Copel Polypodiaceae F37 Datura candida Solanaceae S38 Euphorbia pulchemma Willd.' Euphorbiaceae S39 Leucaena leucocephala (Lmk.) De Wet• Mimosaceae T40 Elephantopus tomentosus Compositae H41 Hyptis brevipes Poir Labiatae H42 Hyptis rhomboidea Mart & Gal. Labiatae H43 Melastoma polyanthum Bl. Melastomataceae S44 Ageratina adinophora R.M. King & H. Rob Compositae H45 Bambusa vulgaris Schrad. Graminae/Poaceae T46 Kolowratia elegans Presl. Zingiberaceae H47 Gigantochloa Levis (Blco.) Metr. Graminae/Poaceae T48 Cyathea contaminans Copel Cyatheaceae F49 Artocarpus robrovenia Warb. Moraceae T50 Caryota rumphiana var. philippinensis Palmae T51 Pinus insularis End]. Pinaceae T52 Lygodium japonicum (Thunb.) Sw. Schizaeaceae F53 Pterocarpus indicus Willd. Papilionaceac T54 Neonauclea elmerii Merr. Rubiaceae T55 Calamus usitatus Bico. Palmae V56 Ceiba pentandra (L.) Gaertn. • Bombacaceae T57 Leucosyke capitellata (Poir.) Wedd. Urticaceae sT58 Pterocymbium tinctorium (Blco.) Merr. Sterculiaceae T59 Flacourtia indica (Bum. f.) Merr. Flacourtiaceae T60 Cassia spectabilis Papilionaceae T61 Dendrocalamus merrilianus (Elm.) Elm. Graminae/Poaceae T62 Samanea saman (Jacq.) Merr. Mimosaceae T63 Geodorum nutans (Presl.) Ames Orchidaceae H64 Cordyline fruticosa (L.) A. Chec. Agavaceae S
84 T. S. Erawan, N. Djuangsih, M. Muchtar, H. Setiana, and L. S. Istanti
consisting of two families—Entomobryidae and Hypogastruridae. These have the largestpopulation with RA 36.3 and 12.1 percent, respectively. The Collembola is a soil surface insectfound in every type of forest ecosystems in lowlands or highlands, usually in large populations.Healey (1967) stated that despite the magnitude of their abundance, Collembolas are of greatquantitative significance in soil communities either in terms of total energy flow or ofexploitable biomass. Nevertheless, Collembolas hold the most important role in remnantdecomposition on the forest's floor from the beginning of the process until the following phase,so this order is categorized as primary or secondary soil animals. Parikesit (1986) conducted astudy in a burned-over pine forest and in the remainder of the unburned Pinus merkusii plants ofNorth Sumatra. The results showed that Collembolas were a dominant order in terms ofabundance or its distribution in the unburned pine forest, followed by Hymenopteras, althoughwith population a lot less than Collembolas. A few months before at the burned pine forest studyarea, Hymenopteras were dominant as compared to Collembolas, which happened to startshowing its dominance (even though lower than Hymenopteras) at the burn site of the pine foresta year before the research was conducted. By comparing this research with that of MountWayang, we can conclude that Collembola and Hymenoptera are considered to be cosmopolitanbecause they can live in a wide diversity of ecosystems even under extreme conditions of humaninterference (e.g., forest fire or cutting). As Brown (1978) stated, Collembola is one group with ahigh tolerance to different environmental conditions (e.g., different structure and type of soil).
As for distribution, the group with the highest distribution found in all the traps placed (RF 11.3percent) was Entomobryidae, followed by Ichneumonidae and Gryllidae with RF 9.0 and 8.3percent, respectively. However, most of the other families captured (RF values less than 2percent) had no large distribution. Even with the largest distribution, the population ofIchneumonidae and Gryllidae was not high with an RA of only 7.4 percent (Ichneumonidae) and2.8 percent (Gryllidae). The Ichneumonidae is commonly found in tropical ecosystems butusually with only low population; however, in a temperate zone climate, Ichneumonidae is foundin large abundance of individuals. Townes (1972, cited by Owen 1983) stated that a highdiversity and low population of Ichneumonidae in the forest could be related to the fact that thisfamily is more niche-specific than host-specific. Some ecologists believe that Ichneumonidae hasan important ecological as well as economic role because the varieties of this group are parasitesto other insects, including insects categorized as forest or agricultural pests.
Analysis of community structure of soil surface insects conducted in altitudinal intervals showsthat of the 25 families found from the trap in Zone I, two dominant families were Collembolaswith RA 38.2 percent (Entomobryidae) and 16.2 percent (Hypogastruridae). Entomobryidae wasthe only family found in the trap in Zone II. Ichneumonidae, with a wider distribution thanHypogastruridae, had a lower RA of only 10.7 percent. In Zone I, Diptera was the order with themost members-9 families, but of all 9 families the individual distribution and density were nothigh. The Xylophagidae is the most dominant Diptera with RA 4.4 percent.
As in Zone I, the group found in Zone II with the most individuals was Entomobrydae (RA 36.4percent). However, Formicidae was another dominant group with RA 9.66 percent. From the dis-tribution side, there were 4 families (Formicidae, Ichneumonidae, Gryllidae, and Entomobrydae)with a high distribution and were always found in the trap placed in Zone II. Although Gryllidaehad relatively high distribution, the individual abundance was far lower than Entomobrydae orFormicidae.

336 Mariliza V. Ticsay-Ruscoe
65 Ananas comosus (L.) Merr. • Bromeliaceae H66 Diplazium esculentum (Retz.) Sw. Athyriaceae F67 Oroxylum indicum (L.) Vent. Bignoniaceae T68 Scleria scrobiculata Nees Cyperaceae Sd69 Rhaphidophora pinnata (L.f.) Schott Araceae H70 Litsea perrottetii (BI.) F: Vill. Lauraceae T71 Belvisia mucronata (Fee) Copel. Polypodiaceae F72 Macaranga bicolor Muell-Arg. Euphorbiaceae T73 Citrus hystrix DC. Rutaceae S74 Piper retrofractum Vahl Piperaceae H75 Poutheria campechiana • Sapotaceae T76 Melanolepis multiglandulosa Euphorbiaceae T77 Molineria capitulate (Lour.) Herb. Hypoxidaceae H78 Embelia philippinensis A. DC. Myrsinaceae S79 Ficus guyeri Elm. Moraceae T80 Ficus minahassae (Teysm & De Vr.) Miq. Moraceae T81 Coffea liberica (Bull. ex Hiem) Rubiaceae sT82 Trichoglottis rosea (Lindl.) Ames Orchidaceae H83 Thrixpermum sp. Orchidaceae H84 Schizostachyum lumampao (blco.) Merr. Graminae/Poaceae T85 Miscanthus sinensis Anders Graminae/Poaceae G86 Erythrina subumbrans (Hassk.) Men. Caesalpiniaceae T87 Palaqium luzoniense (F: Vill.) Vidal Sapotaceae T88 Macaranga tanarius (L.) M.A. Euphorbiaceae T89 Mezoneurum latisiliquum (Ca y.) Men. Caesalpiniaceae V90 Phyllanthus reticulatus Poir Euphorbiaceae S91 Liparis sp. Orchidaceae H92 Diplazium fractousum Copel. Athyriaceae F93 Mikania cordata (Burm.f.) B.L. Rob. • Compositae H94 Amorphophallus campanulatus Araceae H95 Stephania catasepala Diels Menispermaceae V96 Cratoxylon celebicum Bl. Guttiferae T97 Pollia secundifora (BI.) Back Commelinaceae H98 Microsorium punctatum (L.) Copel Polypodiaceae F99 Medenilla sp. (1) Melastomataceae S100 Leea philippinensis Merr. Leeaceae S101 Setaria palmifolia (Willd.) Stapf. Graminae/Poaceae G102 Aglaia llanosiana C. DC. Meliaceae T103 Pteris blumeana Agardh. Pteridaceae F104 Pteris ensiformis Burm. Pteridaceae F105 Ctenites dessecta (Forst.) Lellinger Aspediaceae F106 Pneumatopteris microloncha Holtt. Thelypteridaceae F107 Cyrtandra sp. Gesneriaceae S108 Crassocephalum crepidioides S. Moore • Compositae H109 Semicarpus cuneiformis C.B. Rob. Anacardiaceae S110 Litsea glutinosa (Lour.) C.B. Rob. Lauraceae T111 Aphanamixis cumingiana (C. DC.) Harms Meliaceae sT112 Donax cannaeformis (Forst. f.) K. Schum Marantaceae H113 Conyza albida Compositae H114 Saurauria latibractea Choisy Saurauriaceae T115 Aglaonema sp. Araceae H116 Piptirus arborescens (Link.) C.B. Rob. Urticaceae sT117 Costus speciosus (Koen.) J.E. Smith Zingiberaceae H118 Glochidion album (Blco.) Boerl. Euphorbiaceae S119 Jasminum bifarium Wall. Oleaceae S120 Antidesma bunius (L.) Spreng Euphorbiaceae T121 Capsicum frutescens L. • Solanaceae S122 Ficus subulata Bl. Moraceae S123 Buddleia asiatica Lour. Loganiaceae S124 Decringia polysperma (Roxb.) Moq. Amaranthaceae S125 Pteris tripartita Sw. Pteridaceae F126 Asplenium steerei Harr. Aspleniaceae F127 Asplenium caudatum Forst. Aspleniaceae F128 Callicarpa formosana Rolfe Verbenaceae S129 Breynia cemua (Poir.) M.A. Euphorbiaceae S130 Ficus nota (Blco.) Merr. Moraceae T131 Glochidion rubrum BI. Euphorbiaceae S

Faunal Diversity in Upper Citarum River Basin 85
As in the other two zones, the Entomobrydae was also dominant in Zone III, whether it was thepopulation or the distribution of the individuals with values of RA 34.8 and RF 11 percent.Another group that was not dominant (RA with only 4.06 percent) but had one of the highestdistribution (RF 11 percent) was Gryllidae. However, another Collembolas, Hypogastruridae,was found in Zone III.
Thirty-seven families of 11 orders of soil surface insects were found in the protected forest ofMount Wayang. The Diptera was the most diverse with 11 families, followed by Hymenopterawith 7 families. The Collembolas were the most dominant order in terms of individual abun-dance and distribution of its members (families) represented by 5 families. The other 4 orderswere only represented by I family. Overall, the rarity of the majority of soil surface insectsfound in the remnant forest of Mount Wayang is indicated by the fact that most of the familieswere only trapped once or twice.
From the total number of families trapped (37 families) in Mount Wayang, 25 families (from 9orders) were found in Zone I, and 10 out of 25 families were not found in the other two zones. Atthe order level, Protura and Hemiptera were the only groups found in this zone. Protura is a smallgroup in the class of insects and is usually found in small populations. In the spruce forest (Piceaabies) of West Germany, the numbers of varieties and population density of Protura wereassociated with vitality and development of mycorrhiza in the soil (Funke and Holzaptel 1991).Meanwhile, of the 11 families found in Mount Wayang, 9 of them were found in Zone II.
In Zone II, 20 families (from 10 orders) were captured in the pit-fall traps, and 3 of the families(Cygacidae, Cicadellidae, and Chessysepidae) were not found in the other two zones. TheDiptera was the most important and was represented by 5 families. Although the number offamilies in Zone II was the lowest compared to the other two zones, diversity in the highertaxonomy level—order level—was the highest with 10 orders. Pielou (in Magurran 1988) statedthat in intuitive terms, diversity will be higher in a community in which the species are dividedamong many genera as opposed to one where most species belong to the same genus. Based onPielou's statement, it could be said that actually, diversity (hierarchically) of soil surface insectsin Zone II is greater because variation of diversity in taxonomic levels above species or evenfamily shows that the diversity is higher.
In Zone III, 22 families of 8 orders were found in which 7 families were not found in the othertwo zones. The two most important orders found in this zone were Diptera and Hymenoptera,each represented by 6 families.
The variation of taxa from the insects group, especially soil surface insects in the forest, is veryhigh. Each taxon conducted complex interactions with other organisms (whether it is interactionbetween small animals or large ones with plants); thus, overall study relating to soil surfaceinsect diversity with vegetation condition is very difficult. However, in a study that focused on aspecific taxon in which the aspect studied in the habitat of the taxon and habitual aspect of thetaxon in interacting with other taxon, the forms of the association occurring could be easilydetected. One such association usually found in a tropical forest ecosystem is mutual associationbetween insects and plants. Mutual association will influence the diversity of the insect itself.The diversity of prey and its competitors in certain boundaries will also influence habitatdiversity with its plant composition. Owen (1983) stated that animals with a decomposition roleand secondary to nth order consumers in the terrestrial ecosystem usually were limited to theirfood availability. On the other hand, fluctuation of insect abundance in the tropical forest was the

Biodiversity in the Ayangan-Ifugao Landscape 337
132 1pomoea batatas (L.) L. Convolvulaceae H133 Phaseolus lunatus L. Papilionaceae V134 Sechium edule (Jacq.) Sw. Cucurbitaceae V135 Xanthosoma nigrum (Veil.) Mansf. Araceae H136 Colocasia esculenta (L.) Schott Araceae H137 Musa paradisiaca L. Musaceae H138 Manihot esculenta Crantz Euphorbiaceae S139 Solanum tuberosum L. • Solanaceae H140 Phaseolus vulgaris L. Papilionaceae H141 Psophocarpus tetragonolobus (L.) DC. Papilionaceae V142 Zingiber officinale Rosc. Zingiberaceae H143 Cajanus cajan (L.) Millsp. Papilionaceae S144 Carica papaya L. Caricaeeae H145 Vigna sesquipedalis Papilionaceae V146 Pteris vitata L. Pteridaceae F
147 Melochia umbellata (Houtt.) Stapf Sterculiaceae T148 Dioscorea bulbifera L. Dioscoreaceae V149 Dioscorea alata L. Dioscoreaceae V150 Dioscorea divaricata Blco. Dioscoreaceae V151 Bauhinia cumingiana (Bth.) F.-Vill. Caesalpiniaceae sT152 Stizolobium hassjoo Piper & Tracy Papilionaceae V153 Omalanthus giganteus Z. & M. Euphorbiaceae T154 Trichospermum laginerum (Blco.) Merr. Tiliaceae S155 Ficus botryocarpa Moraceae T156 Ampelocissus pauciflora Merr. Vitaceae V157 Pittosporum ramosii Merr. Pittosporaceae S158 Medenilla venusa BI. Melastomataceae S159 Rubus pectinellus Maxim Rosaceae V160 Pleomele angustifolia (Roxb.) N.E.
Br.*Agavaceae S
161 Schefflera banahaensis Merr. Araliaceae S162 Microsorium plukenetii (Presi.) Price Polypodiaceae F
163 Zizyphus cumingiana Merr. Rhamnaceac S164 Ficus elastic& Roxb. Moraceae T165 Coleus igolotorum Briq. Labiatae H166 Begonia hernandioides Merr. Begoniaceae H167 Begonia nigritarum Steud. Begoniaceae H168 Pterospermum diversifolium BI. Sterculiaceae T169 Dendrochnide meyeniana Urticaceae S170 Mallotus ricinoides (Pers.) Muell.-Arg. Euphorbiaceae sT171 Lunasia amara Blco. Rutaceac S172 Freycinetia multiflora Merr. Pandanaceae V173 Amydrium medium (Zoll.& Mor.) NicolsonAraceae H174 Palaqium philippinense (Perr.) C.B. Rob Sapotaceae F175 Sararanga philippinensis Merr. Pandanaceae T176 Aphananthe philippinensis Planch. Ulmaceae T177 Dioscorea luzonensis Schauer Dioscoreaceae V178 Sesamum indicum L. Pedaliaceae H179 Ficus ribes BI. Moraceae T180 Lygodium circinatum (Burm.) Sw. Schizaeaceae F
181 Viburnum luzonicum Rolfe Caprifoliaceae S182 Triumfetta bartramia L. Tiliaceae H183 Zea mays L. Graminae/Poaceae H184 Asclepias curassairea L. Asclepiadaceae H185 Blumea balsaminifera (L.) DC. Compositae S186 Psidium guajava L. Myrtaceae sT187 Desmodium heterocarpum DC. Papilionaceae S188 Chrysopogon aciculatus (Retz.) Trin. Graminae/Poaceae G189 Desmodium triflorum (L.) DC. Papilionaceae H190 Desmodium capitatum (Burm. f.) DC. Papilionaceae H191 Macaranga dipterocarpifolia Merr. Euphorbiaceae T192 Ficus ruficaulis Mere. Moraceae T193 Dalbergia ferruginea Roxb. Papilionaceae S194 Uncaria perrotteti (A. Rich.) Men. Rubiaceae S195 Lantana camara L. Verbenaceae S196 Wendlandia membranifolia Elm. Rubiaceae sT197 Saccharum spontaneum L. Graminae/Poaceae G198 Desmodium uncinatum DC. Papilionaceae H

86 T. S. Erawan, N. Djuangsih, M. Muchtar, H. Setiana, and L. S. Istanti
function of climate stability; the population of the insects will fluctuate together with the climatefluctuation in the forest, apart from the availability of the altitudinal intervals.
Diversity Measures of Terrestrial Squamata
The sampling units in Mount Wayang used for Squamata were the same as those used for birdsand insects, in which only two species of terrestrial Squamata were found—Lygosoma temminckiwith four individuals: one from Zone III, another from Zone II, and the others from Zone I; andMabuya multifasciata with two individuals from the top of the mountain (Zone III). M.multifasciata is the only species of terrestrial Squamata with the highest abundance in UpperCitarum River Basin. This animal was found in all sampling units, starting from the top ofMount Wayang until Ranca Kasumba, except on the slope (Zone II) and at the foot of themountain (Zone I), and from Wangisagara homegardens. Nevertheless, the abundance in MountWayang is very low. Lygosoma temmincki, which is usually found in highlands, had a very lowabundance. The altitude and the lower temperature were presumed to be the most influentialfactors affecting the diversity and abundance of the terrestrial Squamata in Mount Wayang. Asstated by Benton and Benton (1974) and Herse (1951, cited by Daru 1988), the diversity ofReptilia in tropical areas decreases along with inclination of the altitude. The number ofindividuals and the number of species of Squamata observed in Mount Wayang were low, notonly because the diversity and the abundance of the Squamata were low but due to the extremetopography and very thick vegetation.
With low numbers of species and its individuals in Mount Wayang or in villages, the dataobtained were not good enough to value the diversity of terrestrial Squamata in the upstream areaof the Citarum. In Mount Wayang there was an indication that M multifasciata, which domi-nates the top of the mountain with low abundance at the slope and foot of the mountain, isreplaced by a higher abundance of Lygosoma temmincki at the foot of the mountain than at theslope.
Community Structure and Diversity of Faunain the Man-made Ecosystem
Diversity Measures of Avifauna in the Rural Area
Generally, bird species that are found in the rural agricultural areas are species that are able toadapt to the environment managed by humans. The species variation is associated with vegeta-tion structure, where the more complex the structure of the vegetation structure, the more thevariation will be (MacArthur and MacArthur 1961). For example, besides feeding on food suchas fruit, seeds, flowers, and insects in bamboo gardens and homegardens, birds build nests inplants. A bamboo garden with a varied vegetative structure is the most attractive land-use typefor many bird species. A homegarden with a vegetative structure that is almost the same as abamboo garden is attractive to many bird species. However, the level of disturbance in home-gardens is much greater than that in bamboo gardens. Because rice fields usually consist of onestratum, which is monocultural, only a few birds favor this type of land use.
Diversity Measures of Avifauna in Sukapura (1,250 m asl). The number of bird species foundin Sukapura is 25. Two species, Nectarinia jugularis and Stachyris melanothorax, are protectedby Indonesian Law No. 5/1990. N. jugularis is protected because it functions as a pollinator,

338 Mariliza V. Ticsay-Ruscoe
199 Maesa denticulata Miq. Myrsinaceae S200 Uraria lagopodioedes (L.) Dcsv. Papilionaceae H201 Habenaria malintana (Blco.) Merr. Orchidaceae H202 Kalanchoe pinnata (Lmk.) Pers.) Crassulaceae H203 Piper arborescens Roxb. Piperaceae V204 Taeniophyllum compactum Ames Orchidaceae H205 Medenilla sp. (2) Melastomataceae S206 Chromolaena odorata • Compositae S207 Nephrolepsis biserrata Davalliaceae F208 Alstonia macrophylla Wall. Apocynaceae T209 Cleodendron macrostigium Schauer Verbenaceae sT210 Turpinia pomifera (Roxb.) DC. Styphyllaceae T211 Polyscias nodosa (B1.) Seem. Analiaceae T212 Mucuna pniriens (L.) DC. Papilionaceae V213 Neonauclea reticulata (Havil.) Merr. Rubiaceae T214 Asplenium nidus L. Aspleniaceae F215 Artocarpus ovatus Moraceae T216 Buchanania arborescens Bl. Anacardiaceae T217 Callicarpa candicans (Burm.f.) Hochr. Verbenaceae S218 Ficus benjamina L. Moraceae T219 Evodia confusa Merr. Rutaceae T220 Ficus pseudopalma (Blco.) Moraceae sT221 Neonauclea vidalli Elm. Rubiaceae T222 Bridelia glauca Bl. Euphorbiaceae S223 Schizostachyum dedsianum (Pilg.) Men. Graminae/Poaceae V224 Melanolepis multiglandulosa Euphorbiaceae T225 Zingiber sp. Zingiberaceae H226 Alangium chinense (Lour.) Rehder. Alangiaceae T227 Canarium hirsutum Wield. Burseraceae T228 Cymbidium sp. Orchidaceae H229 Dendrobium nobile Orchidaceae H230 Ophioglosum reticulatum L. Ophioglossaceae F231 Hemigraphis primulaefolia (Nees) F: Vill Acanthaceae H232 Kibatalia blancoi (Rolfe) Merr. Apocynaceae T233 Pyrrosia adnascens Polypodiaceae F234 Ficus angustissima Merr. Moraceae S235 Ageratina adenophora R.M. King & H. Rob Compositae H236 Poikelospermum suaveolens (Bl.) Merr. Urticaceae V237 Semicarpus gigantifolia Vid. Anacardiaceae T238 Tetrastigma loheri Gagnep. Vitaceae V239 Desmodium laxiflorum DC. Papilionaceae S240 Synedrella nodiflora (L.) Gaertn. Compositae H241 Amaranthus spinosus Amaranthaceae H242 Portulaca oleracea Portulacaceae H243 Eleucine indica (L.) Gaertn. Graminae/Poaceae G244 Areca catechu L. Arecaceae T245 Ipomoea albs L. Convolvulaceae V246 Coix lachrymayobi L. Graminae/Poaceae G247 Ficus variegata Bl. Moraceae T248 Musa textilis Musaceae H249 Angiopteris palmiformis (Cay .) C. Chr. Marattiaceae F250 lmperata cylindrica (L.) Beauv. Graminae/Poaceae G251 Lactuca dentata (Thunb.) C.B. Rob. Compositae H252 Digitaria ciliaris Graminae/Poaceae G253 Ficus gul Moraceae sT254 Schizmatoglattis calyptrata Zoll. & Mor Araceae H255 Rottboellia exaltata L.f. Graminae/Poaceae G256 Pagonatherum paniceum (Lam.) Hach. Graminae/Poaceae G257 Ludwigia octavalvis (Jacq.) Raven Onagraceae H258 Monochoria vaginalis (Burm.f.) Presl. Pontideriaceae H259 Echinochloa colona Graminae/Poaceae G260 Echinochloa crusgalli (L.) Beauv. Graminae/Poaceae G261 Lindemia crustace (L.) F.v.M. Scrophulariaceae H262 Eclipta alba Euphorbiaceae H263 Fimbristylis littoralis Cyperaceae Sd264 Lindemia anagallis Scrophulariaceae H265 Nanothelypteris bcdomei Thelypteridaceae F

Faunal Diversity in Upper Citarum River Basin 87
while S. melanothorax is protected because of its limited endemicity in Java and Bali. One otherbird species considered important is Motacilla cinerea, a migrant. This species, which breeds inNorth Asia, Europe, and North America, annually migrates to the south to Africa, India,Southeast Asia, the Philippines, and Indonesia via New Guinea and Australia. In Java and Bali,this species is a regular visitor and is generally found in certain places at all altitudes(MacKinnon 1990).
Several bird species found in Sukapura are caught and sold in bird markets because of theirvoices and beautiful plumage. Those species are Acridotheres javaniscus, Lanius schach,Megalaima haemacephala, Parus major, Pynnonotus aurigaster, and Sterptoplelia chinensis. Asa result of hunting, based on information from local people, the population of those species(except for Parus major) has declined.
In Sukapura the most dominant species in terms of abundance (RA 59.2 percent) and dispersal(RF 25.5 percent) is Zosterops palpebrosus. This species is usually found in groups and lives inthe peak tree strata, looking for food such as insects and tiny fruits. It is the most commonspecies found at all altitudes, both in natural and man-made environments. Other dominantspecies are Prinia familiaris, Passer montanus, and Lonchura leucogastroides. One species thatis very abundant but has a limited dispersal is Stachyris melanothorax. On the other hand,Dicaeum trochileum is not abundant but is widely dispersed.
Diversity of Avifauna in Wangisagara (750 m asl). The number of birds found in Wangisagarais 31. Out of 25 species, four species are the Nectarinidae. The members of this family play anecologically important role as pollinator agents. Another species, Halcycon cyanoventris, is anendemic species in Java and Bali. Motacilla cinerea, a migrant species found in Sukapura, is alsofound in Wangisagara.
The most dominant species in Wangisagara is Lonchura leucogastroides (RA 34.7 percent, RF15.4 percent), both in terms of abundance and dispersal. This species replaces Z palpebrosus,which has a lower abundance value; however, it still belongs to the dominant species if it werecompared with that in Sukapura. Another subdominant Lonchura is L. punctulata, where L.leucogastroides and L. punctulata are the seed eaters. These species were dominant becauseharvesting activities were conducted in the rice fields of Wangisagara. Other dominant speciesare Orthomus sepium and Priniafamiliaris; both of them are insectivores.
Diversity of Avifauna in Ranca Kasumba (650 m asl). The number of birds found in RancaKasumba is 31. Out of 24, five species are protected: Accipiter virgatus, Alcedo meninting,Halcyon smyrnensis, Nectarinia jugularis, and Rhipidura javanica. A. virgatus is a carnivorousspecies that has a wide cruising area and can be found in all altitudes. This species seeks preysuch as mice in bamboo gardens and rice fields, and chicks that run loose in homegardens. A.meninting and H. smyrnensis are piscivorous species found at the edge of Citarum River. R.javanica is found in open regions in the lowlands, while R. phoenicura is found in the highlandforests of Mount Wayang. Besides sedentary species, migrant species such as Clamatorjacobinus and Hirundo rustica are also found. C. jacobinus usually breeds in India, South China,and Southeast Asia, then migrate to the Philippines, Sulawesi, Kalimantan, Sumatra, and Java. H.rustica breeds in northern Asia and migrates to southern Asia, including Indonesia.
Wherever rice fields are being harvested in Wangisagara and Ranca Kasumba, seed-eater birds(L. leucogastroides, L. punctulata, and Passer montanus) are most dominant. The first two

Biodiversity in the Ayangan-Ifugao Landscape
266 lschynomene sensitiva Papilionaceae H267 Marsella crenata Presl. Marsellaceae F268 Azolla pinnata R. Br. • Azollaceae F269 Potamogeton perversus A. Benn. Potamogetobaceae H270 Cyperus difformis L. Cyperaceae Sd271 Scirpus supinus L. Cyperaceae Sd272 Bulbostylis barbata (Rottb.) Kunth Cyperaceae Sd273 Ammania baccifera L. Lythraceae H274 Isachne meliacea Roth. ex R&S Graminae/Poaceae G275 Sonchus arvensis L. Compositae H276 Hedyotis corymbosa (L.) Lamk. Rubiaceae H277 Panicum repens L. Graminae/Poaceae G278 Tithonia diversifolia (Hemsley) A. Gray Compositae S279 Rotala ramosior Lythraceae H280 Cyperus brevifolius Cyperaceae Sd281 Crotolaria incana L. Papilionaceae S282 Mimosa invisa Mart. ex Calla Mimosaceae H283 Phragmites australis Graminae/Poaceae G284 Pouzolzia zeylanica (L.) Benn. Urticaceae H285 Adiantum philippense L. Sinopteridaceae F286 Cyperus odoratus L. Cyperaceae Sd287 Ludwigia hyssopifolia (G. Don) Exel Onagraceae H288 Euphorbia prostata Euphorbiaceae H289 Cyperus pilosus Vahl Cyperaceae Sd290 Altemathera sessiles (L.) DC. Amaranthaceae H291 Vemonia cinerea (L.) Less Compositae H292 Hibiscus suratensis Malvaceae S293 Synedrilla nodiflora Compositae H294 Bambusa comuta Munro Graminae/Poaceae T295 Pipturus arborescens Urticaceae sT296 Abroma angusta (L.) L. Sterculiaceae sT297 Crinum asiaticum L. Amaryllidaceae H298 Ipomoea triloba Convolvulaceae V299 Dysoxylum arborescens (BI.) Miq. Meliaceae T300 Octomeles sumatrana Miq. Datiscaceae T301 Passiflora foetida L. Passifloraceae V302 Cassia occidentalis L. Caesalpiniaceae S303 Sida acuta Burm.f. Malvaceae S304 Clematis leschenaultiana DC. Ranunculaceae V305 Hoya camphorifolia Asclepiadaceae V306 Derris elliptica (Roxb.) Benth. Papilionaceae V307 Cosmos caudatus HBK • Compositae S308 Blechnum orientale L. Blechnaceae F309 Toona calantas Merr. & Rolfe Meliaceae T310 Triumfetta semitriloba Jacq. Tiliaceae S311 Galinsuga parviflora Cay . Compositae H312 Citrus maxima (Burm.) Merr. Rutaceae sT313 Coffea robusta • Rubiaceae sT314 Mangifera indica L. Anacardiaceae T315 Cucurbita maxima Cucurbitaceae V316 Amaranthus viridis Amaranthaceae H317 Piper interruptum Piperaceae V318 Piper sarcopodum Piperaceae V319 Alocasia zebrina Araceae H320 Elatostoma latifolia Urticaceae H321 Centotheca lifolia (Qsbeck) Trin. Graminae/Poaceae G322 Palaquium merrilli Dubard Sapotaceae T323 Sporobulus indicus (L.) R. Br. Graminae/Poaceae G324 Micromelon minutum Rutaceae S325 Trema orientalis Ulmaceae T326 Hoya obscura Asclepiadaceae V327 Pedilanthus tithymaloides (L.) Poit. Euphorbiaceae H328 Conyza parva Compositae H329 Medenilla sp. (3) Melastomataceae S330 Clethra lancifolia Turaz. Clethraceae T331 Astronia candolleana Apocynaceae T332 Lithocarpus sp. Fagaceae T
339

88 T. S. Erawan, N. Djuangsih, M Muchtar, H. Setiana, and L. S. Istanti
species are both abundant and widely dispersed. Other dominant species, which are also found inWangisagara, are Orthotomus sepium and Prinia familiaris.
The species Similarity among three rural areas shows a sufficient high species Similarity. It isshown by the value of Sorensen Index of Similarity of more than 50 percent. Bird species inWangisagara and Ranca Kasumba are almost identical compared with those in Sukapura, proba-bly because of the similar vegetation in Wangisagara and Ranca Kasumba and the proximity ofthese two villages.
Diversity Measures of Avifauna in Bamboo-tree Gardens. The vegetation layer structure inbamboo-tree gardens is usually complex, consisting of several strata and resembling a forest. Thevegetative structure in bamboo-tree gardens is one of the factors that attracts birds to select thesegardens as their habitats. Further, the intensity of human disturbance to the birds in talun issmaller compared to that in homegardens or farming land. Due to agricultural and industrialdevelopment in those villages, particularly Sukapura and Ranca Kasumba, the talun isdiminishing. This will affect species diversity in each of the rural areas.
Bamboo-tree gardens in the three village study sites are used by birds for food and rest, andnesting. During observation in bamboo-tree gardens, several bird species such as Lonchuraleucagostroides, L. punctulata, Prinia familiaris, and Zosterops palpebrosus were found eating,resting, and nesting.
Diversity Measures of Avifauna in Bamboo-tree Gardens of Sukapura. Zosterops palpebrosus(RA 71 percent and RF 40 percent) is the most numerous species and is often found in bamboo-tree gardens of Sukapura. This species of birds frequents the middle and top strata of vegetation.Our observations show that this species often visits blooming Callyandra calothyrsus trees,which are dominant trees in the middle stratum of bamboo-tree gardens in Sukapura. Otherspecies frequenting the top stratum are Cuculus merulinus and Streptopelia chinensis, both ofwhich are rarely found. However, S. chinensis is often hunted (for rearing) because of its singingability, and, as a result, this species is decreasing in Sukapura.
Other species found in bamboo-tree gardens of Sukapura are Stachyris melanothorax andOrthotomus sepium (RA >5 percent), both of which are insectivores. Prinia familiaris and O.sepium inhabit the low and high strata. S. melanothorax is a shy bird that moves in closed cover.In the forest, it is usually found in a low-to-high strata in bamboo (Poaceae). Because the lowstratum in the bamboo-tree gardens of Sukapura provide insufficient cover, Eupatorium ripariumis only found in bamboo-tree gardens quite a distance from settlements. This species is endemicin Java and Bali, so it is protected by law. Besides Stachyris melanothorax, Dicaeum trochileumand Ficedula hyperythra frequent bamboo-tree gardens and forests.
In Sukapura only 12 species were found (see Appendix Table 4.1). The Diversity Index (H') is1.5 and the Evenness value is 0.6. When compared with the bamboo-tree gardens ofWangisagara and Ranca Kasumba, those numbers are smaller. This is caused by a decline ofbamboo-tree gardens in Sukapura and conversion of bamboo-tree gardens to cash-crop gardens.The individual dispersal of Sukapura's species is not even. Out of 12 bird species, only onespecies (Stachyris melanothorax) is protected and endemic to Java and Bali. This species isdominant in the bamboo gardens of Sukapura.

340 Mariliza V. Ticsay-Ruscoe
333 Vemonia benguetensis Elm. Compositae T334 Elaeocarpus monocera Cay . Euphorbiaceae T335 Terminalia nitens Presl. Combretaceae T336 Ficus feskei Elm. Moraceae S337 Pometia pinnata Forst. Sapindaceae T338 Ahemia glandulosa Merr. Flacourtiaceae T339 Pterocymbium tinctorium Sterculiaceae T340 Shores contorts Dipterocarpaceae T341 Equisetum ramosissimum Desfont. Equisetaceae H342 Litchi philippinensis Radlk. Sapindaceae T343 Syzygium simile (Meer.) Merr. Myrtaceae T344 Saurauria bontocensis Merr. Saurauriaceae T345 Odontonema strictum Acanthaceae H346 Ficus obscura Moraceae T347 Barringtonia pterita Menr. Lecythidaceae T348 Cyrtandra sp. Gesneriaceae S349 Syzygium buxifolium Myrtaceae T350 Acer laurianum Aceraceae T351 Canarium bamesii Burseraceae T352 Hibiscus tiliaceus Malvaceae T353 Drymaria rigida Caryophyllaceae F354 Turpinia pomifera (Roxb.) DC. Styphyllaceac T355 Canarium asperum Burseraceae T356 Adenostema lavenia (L.) 0. Ktze. Compositae H357 Malvaviscus pilosus (Sw.) DC. Malvaceae S358 Cassia lavegata Caesalpiniaceae S359 Medenilla sp. (4) Melastomataceae S360 Strongylodon macrobotrys A. Gray Papilionaceae V361 Catimbium speciosum Zingiberaceae H362 Astronia cumingiana Vid. Melastomataceae T363 Astronia bicolor Merr Melastomataceae T364 Chingia ferox Thelypteridaceae F365 Trichosanthes quadriangulata A. Gray Cucurbitaceae V366 Oreocnide rubescens (Bl.) Miq. Urticaceae sT367 Astronia rolfei Vid. Melastomataceae T368 Desmodium sequax Papilionaceae S369 Impatiens loheri Hook. f. Balsaminaceae G370 Ficus benguetensis Men. Moraceae sT371 Elatostemoides manillensis Urticaceae S372 Alpinia sp. Zingiberaceae H373 Matthaea sancta BI. Monimiaceae S374 Myristica cagayanensis Men. Myristicaceae T375 Begonia oxysperma A. DC. Begoniaceac H376 Selaginella delicatula Selaginellaceae H377 Sphaerostephanos productus Holtt. Thelypteridaceae F378 Clerodendron macrostigrum Schauer Verbenaceae sT379 Macaranga grandiflora (Blco.) Merr. Euphorbiaceae sT380 Schizmatoglottis calytrata Zoll.& Mor Araceae H381 Cyathea loheri Christ. Cyatheaceae F382 Pleocnemia cumingiana Presl. Aspediaceae F383 Polygonum chinense L. Polygonaceae H384 Cleidion speciflorum (Burm.f.) Men. Euphorbiaceae T385 Litsea garciae Vid. Lauraceae T386 Amydrium magnificum Araceae V387 Schizostachyum cunanii Gamble Graminae/Poaceae V388 Eria robusta Orehidaceae H389 Sambucusjavanica Reinw. Caprifoliaceae S390 Dischidia hirsuta (BI.) Deene Aspleniaceae F391 Smilax leucophylla Bl. Smilacaceae V392 Rhynchoglossum obliquum BI. Gesneriaceae H393 Bulbophyllum sp. Orchidaceae H394 Bocrlagiodendron luzoniense Merr. Araliaceae sT395 Hydrocotyle sibthorpoides Lam. Umbelliferae H396 Astronia discolor Men. Melastomataceae T397 Neonauclea vidalii (Elm.) Men. Rubiaceae T398 Pncumatopteris laevis (Men.) Holtt. Thelypteridaceae F399 Alocasia heterophylla (presi.) Merr. Araceae H
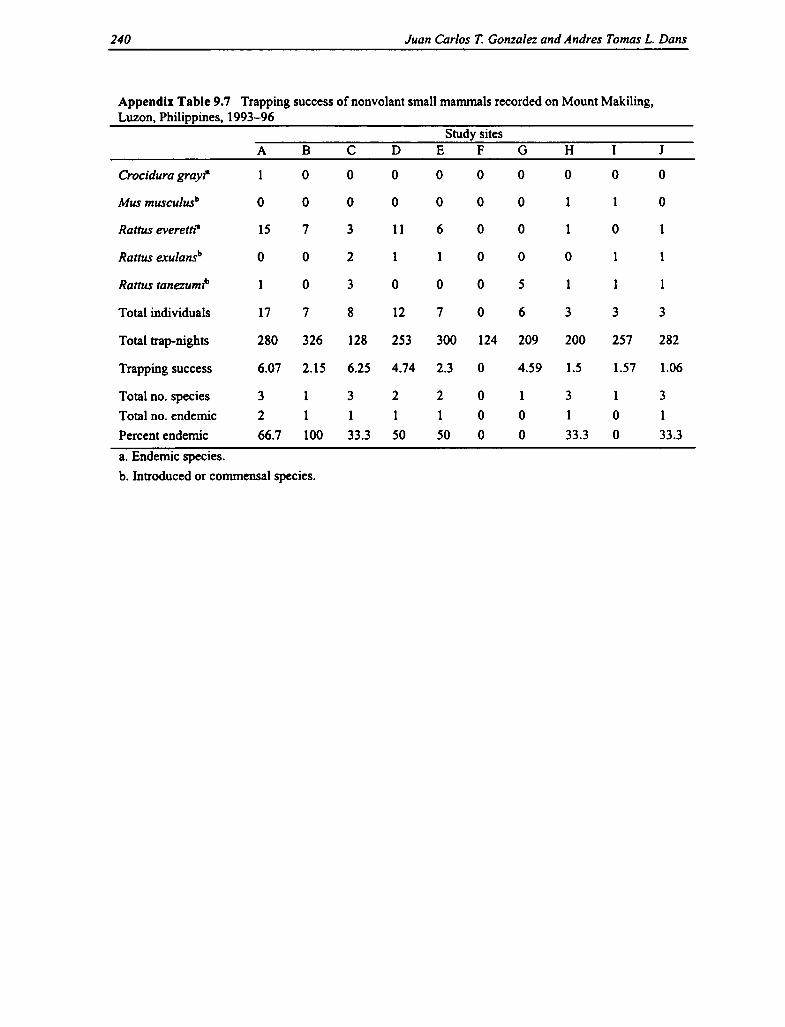
Faunal Diversity in Upper Citarum River Basin 89
The plant type often preferred by birds in talun is bamboo (Poaceae). Also, Callyandracalothyrsus is a tree type favored because of its closed structure, while Callyandra attracts birdsbecause of its flowers (particularly the flower-eater species and honey-sucker species such asZosterops palpebrosus and Nectarinia jugularis). Eucalyptus alba and Albizia montana are alsooften visited by birds. Fruit trees visited by several bird species are avocados (Persea americana)and jackfruit (Artocarpus heterophyllus).
Diversity Measures of Avifauna in Bamboo-tree Gardens of Wangisagara. In the bamboo-treegardens of Wangisagara, Lonchura leucogatroides is the most numerous and often encountered(RA 34.7 percent), followed by Othotomus sepium, Zosterops palpebrosus, O. sutorius, andNectarinia jugularis (RA more than 10 percent). L. leucogatroides, a seed eater, is often foundresting in bamboo-tree gardens. In Wangisagara, bamboo-tree gardens are located close to ricefields. L. leucogatroides usually eats rice; therefore, it is considered a pest by farmers. Thisspecies usually joins L. punctulata in large troops during harvest time. These species use thebamboo-tree gardens as perching/resting places, particularly in the middle and upper strata, andthen seek food in rice. Orthotomus sepium and O. sutorius are active species that explore allstrata from low to high, seeking insects, while Zorterops palpebrosus and Nectarinia are insectand nectar eaters that usually occupy the middle and high strata.
The number of species found are 20 out of 13 families. The value of Diversity Index (H') inbamboo-tree gardens of Wangisagara is 2.0 and Evenness Index is 0.70 (see Appendix Table4.2). This shows that the diversity of birds in bamboo-tree gardens in Wangisagara is relativelyhigher than in the two other villages. This is because bamboo-tree gardens in Wangisagara arerelatively good; its conversion rate from bamboo-tree gardens to other land-use types isrelatively low; and there is not as much fragmentation as occurs in Sukapura. Of the 20, twospecies are protected: Nectarinia jugularis and Halcyon cyanoventris. H. cyanoventris isunevenly distributed in Java and Bali. These species are piscivorous and watch for fish in theCitarum River while perched on nearby bamboo-tree gardens in Wangisagara.
Birds most often use the middle and upper plant strata. The plant type in the upper stratum mostoften visited by birds include bamboo (Poaceae) and ki teja (Cinnamomum inners). Fruit treesoften visited by birds are mangoes, jackfruit, sour mango, Eugenia aquea, and coconut. Sourmangoes and E. aquea were in bloom and bore fruits during the study period and, as a result,they attracted several bird species.
Diversity Measures of Avifauna in Bamboo-tree Gardens of Ranca Kasumba. Bird species mostoften found in the bamboo-tree gardens of Ranca Kasumba is Lonchura leucogastroides. As inWangisagara, this species is frequently found in bamboo-tree gardens where it rests after feedingin the rice fields during harvest times. Other species often found in talun are Prinia familiarisand Orthotomus sepium. Both of them are insectivores that search for food from low-to-highstrata. These two species have different habits: P. familiaris is used to moving alone, whereas O.sepium sometimes travels in small groups.
Seventeen species from 12 families were found in the bamboo-tree gardens of Ranca Kasumbawith Diversity and Evenness Indices of 1.75 and 0.62. These values show that the diversity ofbirds in bamboo-tree gardens of Ranca Kasumba is higher than in the bamboo-tree gardens ofSukapura but lower than those of Wangisagara. Although structure of the bamboo-tree gardens inRanca Kasumba is generally almost the same as that in Wangisagara, the intensity of disturbancein Ranca Kasumba is greater than in Wangisagara because of brick-making activities; whereas in
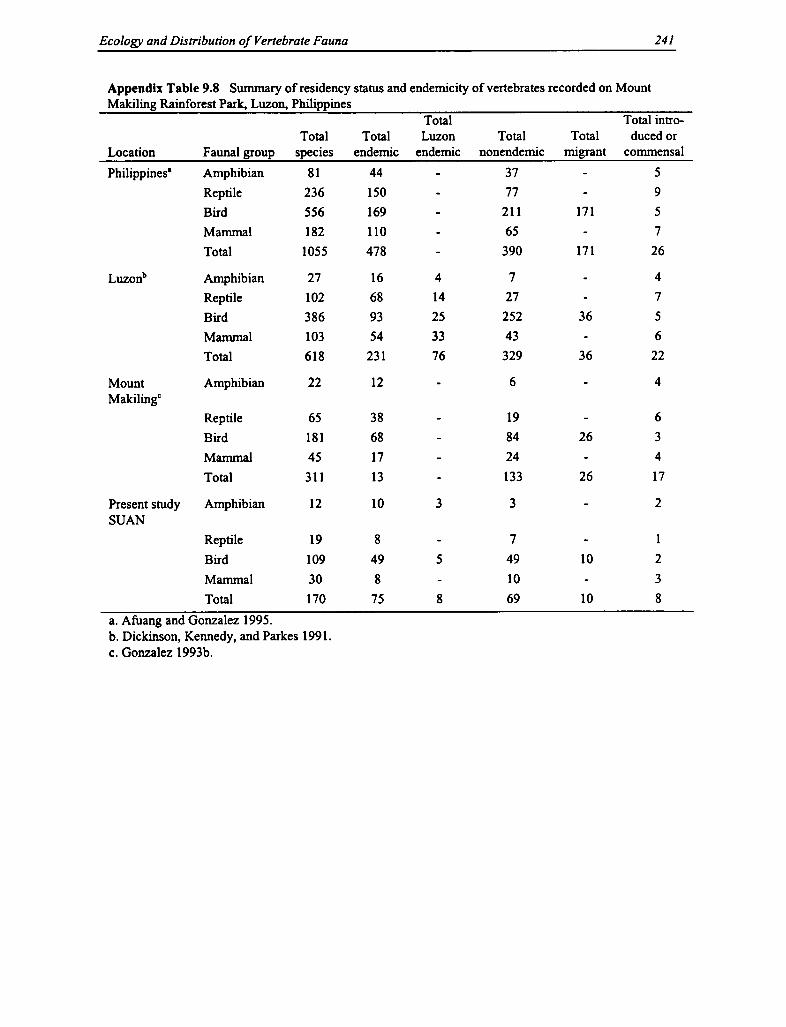
Biodiversity in the Ayangan-Ifugao Landscape
400 Coniogramme macrophylla (BI.) Hieron. Sinopteridaceae F401 Amomum propinquum Ridl. Zingiberaceac H402 Vittaria elongata Sw. Vittariaceae F403 Medenilla sp. (5) Melastomataceae S404 Cypholophus molloccanus (BI.) Miq. IJrticaceae S405 Cyathula prostata (L.) BI. Amaranthaceae H406 Rubus rosaefolius Sw. Rosaceae S407 Lomagramma pteroides J. Sm. Lomariopsidaceae F408 Tectaria crenata Cay . Aspediaceae F409 Shona polysperma Dipterocarpaceae T410 Pupalia lappacea (L.) Juss. Acanthaceae H411 Psychotria sp. Rubiaceae S412 Peperomia macrogregorii C. DC. Piperaceae H413 Davallia solida (Forst.) Sw. Davalliaceae F414 Agrostophyllum sp. Orchidaceae H415 Dendrobium sp. Orchidaceae H416 Homalomena philippinensis Engl. Araceae H417 Leca manillensis Walp. Leeaceae S418 Hoya odorata Asclepiadaceae S419 Freycinetia minahassae Pandanaceae V420 Cyrtandra cumingii CB Clarke Gesneriaceae S421 Lasianthus clementis Merr. Rubiaceae S422 Tectaria decurrens (Presl.) Copel. Aspediaceae F423 Pleopeltis longifolia (BI.) BI. Polypodiaceae F424 Alocasia pubera Schott Araceae H425 Goniothalamus longigistylus Merr. Polypodiaceae S426 Ischynanthus philippinensis Gesneriaceae H427 Diplazium cordifolium Athyriaceae F428 Nephrolepis falcata (Cay .) C. Chr. Davalliaceae F429 Dicranopteris linearis (Burm.) Anderw. Gleicheniaceae F430 Davallia denticulata Mett. ex Kuhn Davalliaceae F431 Helicia cumingiana Presl. Proteaceae T432 Oleandra neriiformis Cay . Davalliaceae F433 Schef lera odorata (Blco.) Merr.& Rolfe Araliaceae S434 Phytocrene blancoi (Azaolai) Merr. Icacinaceae V435 Pithecellobium clypeana Mimosaceae sT436 Freycinetia negrosensis Merr. Pandanaceae V437 Ardisia cur anii Merr. Myrsinaceae S438 Cyathea callosa Christ. Cyatheaceae F439 Engelhardia spicata Bl. Juglandaceae T440 Pteridium aquilinum (L.) Kuhn' Dennstaedtiaceae F441 Arachniodes amabilis (RI.) Tindale Dryopteridaceac F442 Aglaomorpha splendens Copel Polypodiaceae F443 Aglaomorpa meyeniana Schott. Polypodiaceae F444 Daemonorops mollis (Blco.) Merr. Palmae V445 Pinanga philippinensis Becc. Palmae T446 Syzygium malascens Myrtaceae T447 Medenilla trianae Men. Melastomataceae V448 Carex sp. Cyperaceae Sd449 Ficus aurantiaca Moraceae V450 Selaginella involvens Selaginellaceae H451 Pronephrium cuspidatum (Bl.) Christ. Thelypteridaceae F452 Gymnura procumbens (lour.) Men. Compositae H453 Solanum ferox L. Solanaceae S454 Microlepia speluncae (L.) Moore Dennstaedtiaceae F455 Nephrolepis cordifolia (L.) Presl. Davalliaceae F456 Plagiostachys philippinensis Ridl. Plagiogyriaceae H457 Eria philippinensis Ames Orchidaceae H458 Asplenium vittaeformis Cay . Aspleniaceae F459 Artocarpus sericicarpusiarrett Moraceae T460 Procris frutescens BI. Urticaceae S461 Schizostachyum deilsianum (Pilg.)Merr. Graminae/Poaceae V462 Psychotria diffusa Merr. Rubiaceae S463 Palaqium tenurispetioltum Merr. Sapotaceae T464 Litsea albayana Vid. Lauraceae T465 Mussaenda anisophylla Vid. Rubiaceae S466 Tarena sp. Rubiaceae S
341
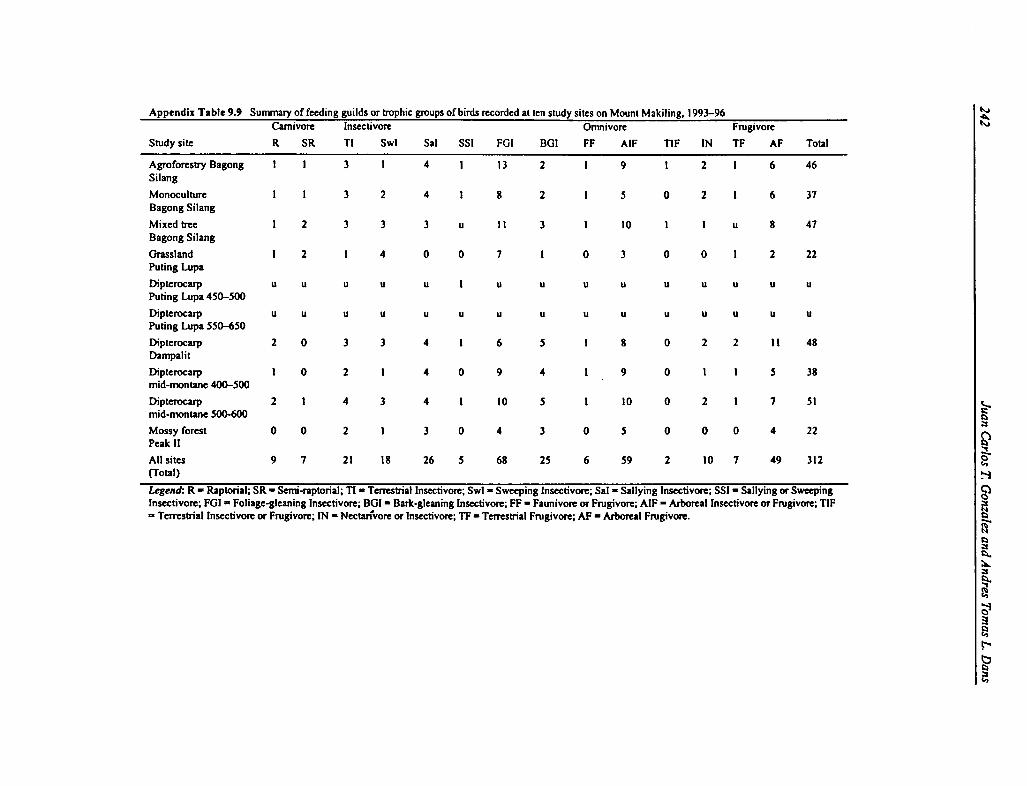
90 T. S. Erawan, N. Djuangsih, M. Muchtar, H. Setiana, and L. S. Istanti
Sukapura, the gardens have been fragmented (see Ch. 3, this volume). Besides, vegetable-farm-ing activities generally require more insecticides than in the rice fields of Ranca Kasumba thanin Wangisagara and Sukapura. Those activities could directly affect bird existence, as declaredby MacKinnon (1990). There are three protected bird species in the bamboo-tree gardens ofRanca Kasumba, but no endemic species. The protected species are Accipitter virgatus, Halyconsmyrnensis, and Nectarinia jugularis. A. virgatus is a carnivorous species that is found at allaltitudes. H. smyrnensis is more carnivorous than insectivorous, and it is found in the bamboo-tree gardens of Ranca Kasumba near Citarum River.
The plant strata most often visited by birds are stratum D, then strata E and C. As with the othertwo villages, bamboo is the most often visited type of vegetation. Mahoni, Ki honje, Selong, andLoa are also often visited by birds. Fruit trees often visited by birds are Mangifera indica, Parkiaspeciosa, and Eugenia. These trees attract pollinator insects, which, in turn, attract the insectiv-orous bird species.
Diversity Measures of Avifauna in Homegardens. Generally, the number of bird species foundin homegardens is smaller than the number that is found in bamboo gardens. This is a function ofthe higher level of human activity in homegardens, the smaller area of homegardens, and the factthat they often have a simpler vegetative structure of only 1-2 strata (as in Sukapura, wheremany homegardens are planted only with decorative and/or seasonal plants as opposed to eco-nomic perennials). Children play in homegardens and sometimes take eggs out of birds' nests. Inhomegardens, plant management is more intensive than in bamboo gardens. Comparativelyspeaking, Wangisagara homegardens have more species variety compared with those in RancaKasumba and Sukapura.
Homegardens are used by birds as places to eat and rest. They are also used as a place of shelterand for nesting, based on observation of nests such as Lonchura leucogastoides, L. punctulata,and Priniafamiliaris.
Diversity of Avifauna in Homegardens of Sukapura. The Zosterops palpebrous is often found inhomegardens of Sukapura and in bamboo-tree gardens where it visits Callyandra calothyrsus.The flower of this tree also attracts nectar eaters such as Dicaeum trochileum and Nectariniajugularis. D. trochileum is most dominant after Z. palpebrous. This species, besides nectar, eatsinsects and seeds. Porsch (cited by Dammerman 1929) stated that this bird species is a nuisanceto farmers' business because it eats and then spreads seeds of parasitic plants (Loranthaceae),which are parasites for fruit trees and cotton. N. jugularis is quite rare by comparison. N.jugularis is a protected species because it helps in pollination and plays a role in farming.
There are 8 species of 6 families in the homegardens of Sukapura. The variation index is 1.09,while the Evenness Index is 0.53. Of these 8 species, only 1 protected species (N. jugularis) wasfound.
The middle and upper strata are most often used by birds. The plant species in homegardensmost often visited are jackfruit, Euginea aquea, avocado, and Mangifera indica. These plantsattract birds because of their fruit and because of the insects attracted to the fruit. Besides thesetrees, blooming Callyandra species attracts attention from birds, particularly the honey suckersor the insectivores that feed on pollinator insects.

342 Mariliza V. Ticsay-Ruscoe
467 Meliosma loheri Merr. Sabiaceae T468 Elaphoglossum luzonicum Copel. Lomariopsidaceae F469 Dicyospermum vitiense Commelinaceae H470 Persea philippinensis Lauraceae T471 Epithema benthami CB. Clarke Gesneriaceae H472 Adenostemma lavenia (L.) Ktze. Compositae H473 Alangium chinense (Lour.) Rehder Alangiaceae T474 Citrus grandis Rutaceae sT475 Musa sapientum Musaceae sT476 Artocarpus heterophyllus Moraceae T477 Vitex parviflora Verbenaceae T478 Calamus merrilli Palmae V479 Persea americana' Lauraceae T480 Sauropus androsyrus Euphorbiaceae sT481 Sweitenia sp.' Meliaceae T482 Pinus kesiya Pinaceae T483 Chrysophyllum caimito* Sapotaceae T484 Sandoricum koetjape Meliaceae T485 Diospyros sp. Ebenaceae T486 Cocos nucifera Palmae T487 Erythrinia orientalis Papilionaceae T488 Ficus septima Moraceae sT489 Helianthus sp.' Compositae S490 Solanum melongena Solanaceae S491 Solanum nigrum Solanaceae S492 Lycopersicum esculentum' Solanaceae S493 Brassica integrifolia' Cruciferae S494 Allium ceps' Liliaceae/Alliaceae H495 Allium sativum' Liliaceae/Alliaceae H496 Abelmoschus esculentus' Malvaceae S497 Miscanthus floribundus' Graminae/Poaceae tG498 Vigna radiata Papilionaceae H499 Oryza sativa Graminae/Poaceae G500 Ricinus communis Euphorbiaceae S501 Cyperus hirta Cyperaceae Sd502 Citrus limon' Rutaceae sT503 Citrus reticulata Rutaceae sT504 Citrus microcarpa Rutaceae sT505 Saccharum officinale Graminae/Poaceae tG506 Momordica charantia Cucurbitaceae V507 Opuntia cylindrica' Cactaceae H508 Bougainvillea glabra' Nectaginaceae S509 Codiaeum variegatum' Euphorbiaceae S510 Dracaena draco' Agavaceae S511 Euphorbia heterophylla Euphorbiaceae S512 Euphorbia pulcherimma' Euphorbiaceae S513 Tamarindus indicus Mimosaceae T514 Thevetia peruviana' Apocynaceae sT515 Delonix regia' Caesalpiniaceae T516 Hibiscus mutabilis Malvaceae S517 Rosa rugosa' Rosaceae S518 Belamcanda chinensis Amaryllidaceae H519 Sanseviera trifaciata Agavaceae H520 Euphorbia antiquorum Euphorbiaceae S521 Allium tuberosum' Liliaceae/Alliaceae H522 Asparagus officinalis' Asparagaceae V523 Bryophyllum pinnatum Crassulaceae H524 Lucuma nervosa Sapotaceae sT525 Amaryllis vittata Amaryllidaceae H526 Wedelia sp.' Compositae S527 Datura metel Solanaceae S528 Annona muricata Anonaceac sT529 Alnus sp. Betulaceae sT530 Croton tiglium Euphorbiaceae sT531 Euphorbia pterocali Euphorbiaceae H
532 Bixa orellana Bixaceae sT533 Xanthosoma sagifolia Araceae H

Faunal Diversity in Upper Citarum River Basin 91
Diversity of Avifauna in Homegardens of Wangisagara. Lonchura leucogastroides is the speciescommonly found (Relative Dominance/RA 44.1 percent), then followed by Orthotomus sepiumand Passer montanus (RA >10 percent). L. leucogastroides and P. montanus are species thatbelong to Plocidea (families of seed eaters). During observation, both species were found nestingin homegardens. P. montanus also has a habit of making nests on roofs. Zosterops palpebrosusalso is numerous (RA 6.83 percent), but is not the most dominant species as in Sukapura.
The number of species found in homegardens of Wangisagara is higher than in the other twovillages at 12 species and 7 families. The Index Diversity is 1.83 and the Evenness Index is 0.74.Of 12 species, three are protected, and there are no endemic species. These protected species-Anthreptes malacensis, Arachnotera longirotra, and Nectarinia jugularis—are from theNectarinidae family of pollinator species.
The vegetation stratum in the homegardens of Wangisagara is often visited by birds in themiddle stratum. The upper stratum is rarely visited, because in this stratum the most dominantplant is coconuts. The plants most often visited by birds are fruit plants such as mango, jackfruit,Artocarpus polyphemal, Euginea aquiae, and Mangifera indica.
Diversity of Avifauna in Homegardens of Ranca Kasumba. Lonchura leugastroides, L.punctulata, and Passer montanus species belong to Ploicedae and are most often found in thehomegardens of Ranca Kasumba. These are all rice birds that use homegardens as a place to rest.P. montanus is the most familiar species by people, with its natural habitat being humansettlement; therefore, this species is dominant. Another dominant species is Priniafamiliaris, aninsect eater that seeks food from the low-to-high strata.
Nine species from four families were found in the homegardens of Ranca Kasumba. TheDiversity Index is 1.53 and the Evenness Index is 0.70 (Appendix Table 4.2). Of these ninespecies, only one species (Nectariniajugularis) is protected by law.
As with the other two villages, the middle and high strata are most often frequented by birds. Theplant most often visited by birds is the coconut tree (Cocos nucifera), followed by fruit trees suchas mango, sour mango, Pisidium guajava, Euginea aqueai, and jackfruit.
Generally, the species that frequent homegardens of these three villages are similar. The speciesin the homegardens of Wangisagara are almost identical with those of Ranca Kasumba. There isless similarity between Ranca Kasumba and Sukapura, compared with Wangisagara andSukapura.
Diversity Measures of Avifauna in Rice Fields. The rice field is the land use with the lowestspecies variation. This is because bamboo-tree gardens and homegardens have differentvegetative structure, but the rice fields have only one stratum and are dominated by a mono-culture. Comparing among the three villages, the rice fields of Wangisagara have the highestvariation.
Several birds whose existence ecologically depends on water are found in rice fields. Thesespecies are Bubulcus ibis, Prozana fusca, Ardeola speciosa (found only in the Ranca Kasumbarice fields), Gallirallus striatus (found only in Wangisagara), and Motacilla cinerea (found inWangisagara and Sukapura). M. cinerea is a migrant species. Rice fields are not only a place to

Biodiversity in the Ayangan-Ifugao Landscape 343
534 Themeda triandra Graminae/Poaceae tG535 Citronella sp. Graminae/Poaceae G536 Artocarpus communis Moraceae T537 Syzygiumjambos Myrtaceae sT538 Glycine max • Papilionaceae S539 Moringa oleifera Moringaceae sT540 Capsicum annuum• Solanaceae S541 Luffa cylindrica Cucurbitaceae V542 Cucurbita moschata Cucurbitaceae V543 Brassica pekinensis • Cruciferae H544 Brassica oleracea var. capitata • Cruciferae H545 Mentha haplocalyx • Verbenaceae H546 Arachis hypogaea• Papilionaceae S547 Cannabis sativa• Cannabinaceae S548 Nicotiana tabacum • Solanaceae S549 Melia dubia Meliaceae T550 Cratoxylum celebicum Guttiferae T551 Laportea sp. Urticaceae T552 Adenanthera pavonina Mimosaceae T553 Gliricidia sepium Papilionaceae sT554 Coleus blumei Labiatae H555 Pandanus pandan Pandanaceae H556 Gendarussa vulgari s Acanthaceae S
a. Habit: Type: Where found:T Tree W Weed Fo ForestsT Small Tree cC Cash Crop WI WoodlotH Herb; herbaceous fC Food Crop K Coffee PlantationS Shrub frT Fruit tree U SwiddenF Fern foT Forest tree Rt Rice TerraceG Grass 0 Ornamental BG Bean GardenSd Sedge HG HomegardenV Vine Tw Trail waysE Epiphyte Gl GrasslandtG Tall grass Hs Home Settlements
*Introduced species
92 T. S. Erawan, N. Djuangsih, M. Muchtar, H. Setiana, and L. S. Istanti
look for food, but also are used to build nests. A species that uses rice fields to nest is Cisticolajuncidis. During observation, two nests of this species were found in Ranca Kasumba.
Diversity of Avifauna in Rice Fields of Sukapura. Dominant species in Sukapura rice fields arePasser montanus, Lonchura leucogastroides, Prinia familiaris, Cisticola juncidis, and Zosteropspalpebrosus (RA >5 percent). The first three species are widely dispersed. This shows that thespecies found to be dominant are capable of adapting to rice-field habitats.
In the rice fields of Sukapura, six bird species from four families were found. The DiversityIndex is 1.55 and the Evenness Index is 0.86. This Diversity Index is low but the Evenness Indexis higher than other villages. The Diversity Index was affected by conditions during observation.The planting season for rice had just started so fields did not have much water. Besides, theacreage of rice fields in Sukapura is limited and is unevenly distributed (e.g., in Kampung Joglo).In the rice fields of Sukapura, no protected or endemic species was found; but one migrantspecies (Motacilla cinerea) was found.
Diversity of Avfauna in Rice Fields of Wangisagara. The species of birds found in Wangisagaraare generally the same as those in Sukapura, namely ordinary species of rice-field birds such asLonchura leucogastoides, L. punctulata, Cisticola juncidis, Prinia familiaris, and Passermontanus (RA >5 percent). Ploceidae or seed eaters are attracted to the rice-field habitat becauseduring harvest, the fields of Wangisagara provide them with food. Cisticola juncidis, aninsectivore, is also found to be dominant in Wangisagara, because it eats insects available on ricestems. Water birds such as Gallirallus striatus and Motacilla cinerea are also found in the ricefields of Wangisagara where they are hunted by the local people and eaten. M. cinerea is amigrant species.
Wangisagara rice fields have the highest number of species (13 species from eight families)compared with the other study sites. Therefore, the Diversity Index of birds in rice fields inWangisagara is 1.66 and the Evenness Index is 0.65. The Diversity Index is high, which isprobably related to the harvesting season during the observation. Only one protected bird(Nectariniajugularis) was found in the rice fields of Wangisagara.
Diversity of Avifauna in Rice Fields of Ranca Kasumba. As with the other two villages, thedominant species belong to the Ploceidae, namely seed eaters. These species are Lonchuraleucogastroides, Passer montanus, Citicolajuncidis, and L. punctulata. As in Wangisagara, alsofound in Ranca Kasumba are several species of water birds such as Ardeola speciosa, Bubulcusibis, and Porzona fusca. These species are commonly shot for personal consumption. Mirafrajavanica is sometimes captured and kept as a pet because of its beautiful voice.
The rice fields of Ranca Kasumba were also studied during the harvest season, as inWangisagara, and so a large number of species (10 species from six families) were observed.However, the Diversity Index of this species in Ranca Kasumba is the lowest compared with theother two villages at 1.38 with an Evenness Index of 0.60.
The species similarity between the rice fields of Wangisagara and Sukapura is the highest andthe least between Ranca Kasumba and Sukapura.
Diversity Measures of Avifauna in Cash-crop Gardens of Sukapura. Secondary crop gardensare only found in Sukapura. In these gardens, the most dominant species are insectivores (Prinia

344 Mariliza V. Ticsay-Ruscoe
Appendix Table 13.8 Distribution by family of species found along theeast-west transect across Haliap-Panubtuban
Family Species no. %
Acanthaceae 4 0.72Aceraceae 1 0.18Agavaceae 5 0.90Alangiaceae 2 0.36Amaranthaceae 8 1.44Amaryllidaceae 3 0.54Anacardiaceae 4 0.72Annonaceae 1 0.18Apocynaceae 5 0.90Araceae 14 2.53Araliaceae 4 0.72Arecaceae 1 0.18Asclepiadaceae 4 0.72Asparagaceae 2 0.36Aspediaceae 4 0.72Aspleniaceae 5 0.90Athyriaceae 3 0.54Azollaceae 1 0.18Balsaminaceae 1 0.18Betulaceae 1 0.18Begoniaceae 3 0.54Bignoniaceae 1 0.18Bixaceae 1 0.18Blechnaceae 1 0.18Bombacaceae 1 0.18Bromeliaceae 1 0.18Burseraceae 3 0.54Cactaceae 2 0.36Caesalpiniaceae 6 1.08Cannabinaceae 1 0.18Caprifoliaceae 2 0.36Caricaceae 1 0.18Caryophyllaceae 2 0.36Clethraceae 1 0.18Combretaceae 1 0.18Cornmelinaceae 2 0.36Compositae 28 5.05Convolvulaceae 3 0.54Crassulaceae 2 0.36Cruciferae 4 0.72Cucurbitaceae 6 1.08Cyatheaceae 3 0.54Cyperaceae 10 1.81Datiscaceae 1 0.18Davalliaceae 7 1.26Dennstaedtiaceae 2 0.36Dioscoreaceae 4 0.72Dipterocarpaceae 2 0.36Dryopteridaceae 1 0.18Ebenaceae 1 0.18Equisetaceae 1 0.18Euphorbiaceae 34 6.14Fagaceae 1 0.18Flacourtiaceae 2 0.36Gesneriaceae 6 1.08Gleicheniaceae 1 0.18

Faunal Diversity in Upper Citarum River Basin 93
familiaris and Motacilla cinerea). This is caused by the larger number of insects (e.g., comparedwith rice fields). P. familiaris is a common species and tolerant of changes; it usually is amigrant species and is found in groups. The next most dominant insectivores are Passermontanus, Lonchura leucogastroieds, and Zosterops palpebrosus. Although a vegetable gardenis technically maintained intensively by spraying insecticides, there will be insect species that aretolerant to insecticides and can furnish a large population for the insectivores. The secondarycrop gardens in Sukapura are much favored by birds. This is seen from the number of birdspecies (11) and Diversity Index of 2.07 and Evenness Index of 0.87. The high Diversity Index inthe secondary crop gardens compared with the rice fields and homegardens also may be affectedby the fact that these gardens are generally surrounded by bamboo-tree gardens.
Diversity Measures of Flying Insects in Various Land-use Types
Diversity Measures of Flying Insects in Bamboo-tree Gardens. From 45 units of bamboo-treegardens chosen from three villages (15 sampling units for each village), 5,810 individual flyinginsects were recorded, consisting of 66 families belonging to six orders. The number ofindividuals from bamboo-tree gardens of each village was Sukapura 2,490 (49 families);Wangisagara 2,401 (37 families); and Ranca Kasumba 919 (28 families).
The dominant flying insects in bamboo-tree gardens (RA >2.32 percent) were Culicidae,Simuliidae, Formicidae, Aleyrodidae, Ichneumonidae, Aphididae, Cicadellidae, Conopidae, andOtitidae.
In bamboo-tree gardens of Sukapura, those same families were also dominant, except forFormicidae, Drosophilidae, Cicadellidae, and Otitidae, which are decreasing to subdominant.The dominant flying insects in bamboo-tree gardens of Wangisagara were Culicidae, Simuliidae,Formicidae, and Drosophilidae. The other dominant flying insects became subdominant exceptfor Aleyrodidae, Ichneumoidae, and Conopidae, which were not dominant. In bamboo-treegardens of Sukapura, the dominant families were the same as those found in the bamboo-treegardens of Wangisagara, except for Drosophilidae. The other dominant families of bamboo-treegardens became subdominant, except for Aleyrodidae, Ichneumonidae, and Aphididae, whichwere not dominant.
The similarities among bamboo-tree gardens were Sukapura-Wangisagara 0.60, Sukapura-RancaKasumba 0.47, and Wangisagara-Ranca Kasumba 0.55. The Evenness Indices of bamboo-treegardens in the three villages were Sukapura 0.64, Wangisagara 0.46, and Ranca Kasumba 0.67.The Diversity Indices at the three bamboo-tree gardens were Sukapura 2.50, Wangisagara 1.68,and Ranca Kasumba 2.23. Based on the number of families and the Diversity Index, the flyinginsect diversity of bamboo-tree gardens of Sukapura was higher than that of Wangisagara, andthe diversity of bamboo-tree gardens of Wangisagara was higher than that of Ranca Kasumba(Appendix Table 4.3)
Diversity Measures of Flying Insects in Homegardens. From 45 homegardens chosen in threevillages (15 for each village), 2,289 individuals were recorded, belonging to 46 families.Individuals of flying insects recorded from homegardens were Sukapura 1,182 (31 families),Wangisagara 707 (29 families), and Ranca Kasumba 399 (24 families). The dominant families offlying insects (RA >4.54 percent) in homegardens were Simuliidae, Culicidae, Conopidae,Aleyrodidae, and Formicidae (Appendix Table 4.3).
345Biodiversity in the Ayangan-Ifugao Landscape
Graminae/Poaceae 33 5.96Guttiferae 2 0.36Hypoxidaceae 1 0.18Icacinaceae 1 0.18Juglandaceae 1 0.18Labiatae 5 0.90Lauraceae 6 1.08
Leeaceae 2 0.36Lecythidaceae 1 0.18Liliaceae 3 0.54Loganiaceae 1 0.18Lomariopsidaceae 2 0.36Lythraceae 2 0.36Malvaceae 7 1.26Marantaceae 2 0.36Marattiaceae 1 0.18
Marsellaceae 1 0.18
Melastomataceae 12 2.17Meliaceae 8 1.44Menispermaceae 2 0.36Mimosaceae 6 1.08
Monimiaceae 1 0.18
Moraceae 24 4.33Moringaceae 1 0.18
Musaceae 3 0.54Myrsinaceae 3 0.54Myristicaceae 1 0.18
Myrtaceae 5 0.90Nectaginaceae 1 0.18
Oleaceae 1 0.18
Onagraceae 2 0.36Ophioglossaceae 1 0.18
Orchidaceae 13 2.35Palmae 6 1.08
Pandanaceae 5 0.90Papilionaceae 26 4.69Passifloraceae 1 0.18
Pedaliaceae 1 1.08
Pinaceae 2 0.36Piperaceae 6 1.08
Pittosporaceae 1 0.18
Plagiogyriaceae 1 0.18Polygonaceae 1 0.18Polypodiaceae 12 2.17Pontideriaceae 1 0.18Portulacaceae 1 0.18
Potamogetobaceae 1 0.18Proteaceae 1 0.18Pteridaceae 4 0.72Ranunculaceae 1 0.18Rhamnaceae 1 0.18Rosaceae 3 0.54Rubiaceae 14 2.53Rutaceae 10 1.81Sabiaceae 1 0.18Sapindaceae 2 0.36Sapotaceae 7 1.26Saurauriaceae 2 0.36Selaginellaceae 2 0.36Schizaeaceae 2 0.36

94 T. S. Erawan, N. Djuangsih, M. Muchtar, H. Setiana, and L. S. Istanti
The Similarity Indices between homegardens were Sukapura-Wangisagara 0.60, Wangisagara-Ranca Kasumba 0.58, and Wangisagara-Ranca Kasumba 0.68. The ratio of the diversity of flyinginsects was as follows: Sukapura:Wangisagara:Ranca Kasumba = 2.19:2.07:1.81. The EvennessIndices were 0.64, 0.61, and 0.57, respectively. Based on the number of families and Evennessand Diversity Indices, the flying insect diversity in homegardens of Sukapura was the highest,followed by Wangisagara, then Ranca Kasumba.
Diversity Measures of Flying Insects in Cash-crop Gardens. Cash-crop gardens were onlyfound in Sukapura. From five cash-crop gardens, the number of flying insects recorded was8,248 individuals, belonging to 37 families. The dominant families in cash-crop gardens wereCulicidae (RA 60.65 percent) and Simuliidae (RA 32.26 percent). Both families were alsodominant in bamboo-tree gardens and homegardens with a different ranking.
Similarity between cash-crop and homegardens was 0.68, whereas it was 0.63 betweenhomegardens and bamboo-tree gardens. Thus, the families observed in homegardens and cash-crop gardens were more or less the same, compared to bamboo-tree gardens.
Based on abundance, cash-crop gardens showed the highest diversity (according to the numberof families), a diversity higher than homegardens but lower than bamboo-tree gardens.
Diversity Measures of Soil Surface Insects in Various Land-use Types
The existence of different types of land use in the villages studied will influence more or less thecommunity structure of soil surface insects (see Appendix Table 4.4). The differences in theintensity of land-use maintenance conducted by landowners also play an important role indetermining the community structure of soil surface insects. The usage of pesticides in cash-cropgardens, for example, will influence the abundance or diversity of the soil surface insects.Research in West Germany by Funke and Hozapfel (1991) showed that certain varieties ofpesticides can affect population degradation and activities of several soil insect groups, includinggroups that are usually found in large numbers such as Collembola and Hymenoptera. Becauseof this, several ecologists suggested that soil invertebrate animals (including insects) be used as abioindicator for long-term changes in soil processes. Soil invertebrate animals as a bioindicatorwere suggested because of their wide distribution, good response to disturbance, and highabundance.
Diversity Measures of Soil Surface Insects in Bamboo-tree Gardens. Structure analysis of soilsurface insects conducted in bamboo-tree gardens in three different study villages indicated thatthe dominant soil surface insects found in Mount Wayang forest, Collembola and Hymenoptera,are also the most dominant insects in the bamboo-tree gardens of the three villages. Thus, bothsoil surface insect groups are able to adapt to different environmental conditions. However, not asingle individual of the Termitidae (Order Isoptera), which is abundant on Mount Wayang, wasfound in the bamboo-tree gardens of the three villages. Furthermore, most of the soil surfaceinsect groups found in bamboo-tree gardens were of small populations and distribution.
In Sukapura bamboo-tree gardens, the family Formicidae of Hymenoptera was the mostdominant group of its population (RA 56.40 percent) or even in its distribution (RF 17.65percent), followed by Entomobrydae (RA 50.13 percent; RF 17.65 percent) and Isotomidae (RA32.40 percent; RF 14.12 percent). The last two families mentioned belong to the Collembolas,whereas members of the Diptera with the most diversified families showed no dominance in

346 Mariliza V. Ticsay-Ruscoe
Scrophulariaceae 2 0.36Sinopteridaceae 3 0.54Smilacaceae 1 0.18Solanaceae 11 1.99Sterculiaceae 5 0.90Styphyllaceae 2 0.36Thelypteridaceae 7 1.26Tiliaceae 3 0.54Ulmaceae 2 0.36Umbelliferae 2 0.36Urticaceae 12 2.17Verbenaceae 7 1.26Vitaceae 2 0.36Vittariaceae 1 0.18Zingiberaceae 7 1.26
Total F 131 S 554 RF = 100%
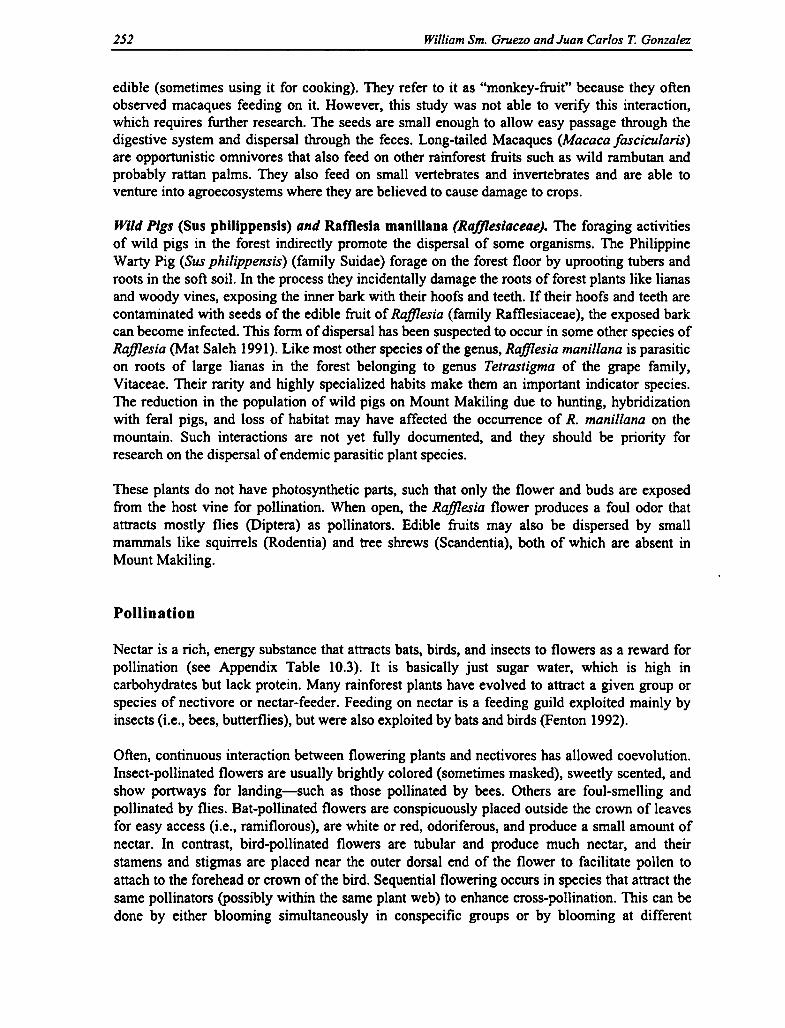
Faunal Diversity in Upper Citarum River Basin 95
even one of its families. The most dominant family of the Diptera, based on its population ordistribution, was Simulidae (RA 1.77 percent; RF 8.24 percent).
Both dominant orders found in the bamboo-tree gardens of Sukapura were also found inWangisagara. Formicidae was the most dominant based on its population with RA 37.94 percent,followed by two families of Collembolas, Hypogastruridae (RA 23.04 percent) andEntomobrydae (RA 27.10). From their distributions, the two families of Collembolas had aslightly higher distribution than that of the Formicidae.
The most dominant soil surface insect group found in the bamboo-tree gardens of RancaKasumba resembled those in Wangisagara. Formicidae was the most dominant on its distribution(RA 40.90 percent), followed by Hypogstruridae (RA 26.31 percent) and Entomobrydae (RA26.13 percent). The distribution of these three families in Ranca Kasumba gardens also resem-bled the distribution in the bamboo-tree gardens of Wangisagara.
Twenty-three families of 8 orders of the soil surface insects were found in bamboo-tree gardensof the three villages studied. The number of insects found here were much less than those foundin Mount Wayang forest. The Diptera was the most diversified with 9 families, followed byHymenoptera with 4 families. Collembolas were dominant in its distribution, represented by 4families, whereas other orders were only represented by 1-2 families each. Again, as in MountWayang protected forest, the rarity of the majority of soil surface insects found in bamboo-treegardens is indicated by the fact that most of the families are only taken once or twice during thesampling.
In bamboo-tree gardens of Sukapura, 20 families of 7 orders were captured, and the order withthe most members was Diptera with 7 families. Collembolas were represented with 4 families,Hymenoptera and Coleoptera with 3 families each. The only order found in bamboo-tree gardensof Sukapura was Lepidoptera and only one family (Sphingidae) was found from this order with avery small population. Soil surface insects in bamboo-tree gardens of Sukapura had a DiversityIndex of 1.51 and an Evenness Index of 0.30.
In bamboo-tree gardens of Wangisagara, 10 families of 7 orders were found. Although thediversity on order level was the same, the number of families found in bamboo-tree gardens ofWangisagara was far lower than those in bamboo-tree gardens of Sukapura. Families of Dipterain bamboo-tree gardens of Sukapura were the most abundant, but in Wangisagara only onefamily of this order was found (Culicidae). Meanwhile the most diversified order in bamboo-treegardens of Wangisagara was Collembolas with 3 families. Shannon-Weiner Diversity Index forsoil surface insects in bamboo-tree gardens of Wangisagara is 1.23 and the Evenness Index is0.54. If both these indices are compared with those from bamboo-tree gardens of Sukapura, itseems that although the Diversity Index in bamboo-tree gardens of Wangisagara is lower, theEvenness Index is slightly higher. This means that equitability of the soil surface insects ishigher than the ones in Sukapura. In Sukapura there are two dominant families (according toindividual density)—Formicidae and Entomobrydae; density for most of the other individuals islow.
In Ranca Kasumba, the number of families found were 10 from 4 orders. Compared with theother two villages, orders found in Ranca Kasumba were the lowest because each order wasrepresented by 3-4 families only. The Diversity Index in bamboo-tree gardens of RancaKasumba is slightly higher than that of Sukapura, which is 1.36. The Evenness Index of 0.59 is

0
• w
0
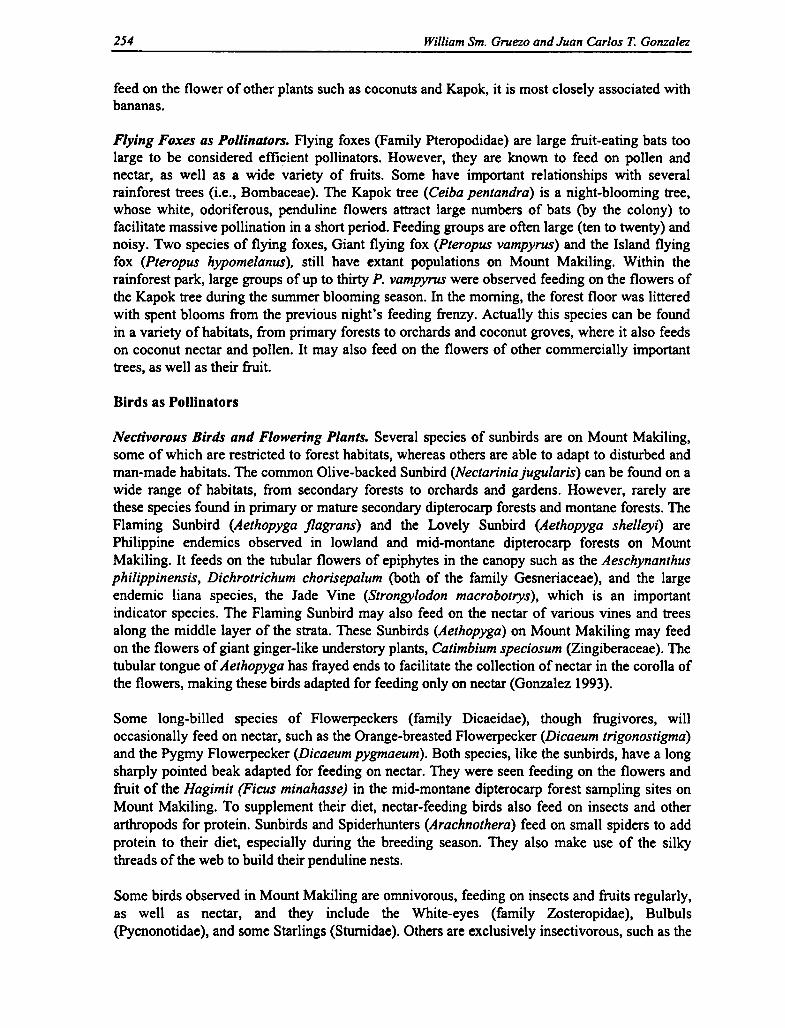
96 T S. Erawan, N. Djuangsih, M. Muchtar, H. Setiana, and L. S. Istanti
the highest among the villages studied, implying the distribution of flying insect species waseven at Ranca Kasumba.
Diversity Measures of Soil Surface Insects in Homegardens. Generally, the composition of soilsurface insects in homegardens of the three villages resembled the composition in bamboo-treegardens. Also, the dominant groups in homegardens are almost the same as those in bamboo-treegardens.
The composition of families in homegardens of Sukapura is almost the same as in the bamboo-tree gardens (i.e., Formicidae with RA 49.47 percent is the most dominant, followed byEntomobrydae and Hypogastruridae with RA 27.99 and 14.37 percent, respectively).Entomobrydae has a higher distribution of individuals than Formicidae because Entomobrydaewas always found in every sample taken in the homegardens of Sukapura.
In Wangisagara homegardens, two dominant groups of soil surface insects were Collembolas(Hypogastruridae and Entomobrydae with RA 46.53 and 29 percent, respectively). Both groupswere always found in Wangisagara homegardens. The third dominant group is Formicidae.
The most dominant soil surface insects found in Wangisagara homegardens (Hypogastruridae)were also found as the most ranked group in Ranca Kasumba homegardens with RA 42.68percent. The second and third dominant groups were Formicidae and Entomobrydae with RA26.02 and 20.92 percent, respectively. Considering their distributions, both members of theCollembolas—Hypogastruridae and Entomobrydae—had the largest individual distributions.Both of these families were always found in the samples of Ranca Kasumba homegardens.
Twenty-four families of 8 orders of soil surface insects were found in homegardens of the threevillages studied. The total number of insects was slightly higher than the ones captured inbamboo-tree gardens. The Diptera with the most diversity was represented with 8 familiesfollowed by Coleoptera and Collembola with 4 families. Other orders were only represented with1-2 families.
In Sukapura homegardens, 22 families of 8 orders were captured, and the order Diptera wasrepresented the most with 8 families. Coleoptera was represented by 4 families and Collembolawith 3 families. In Sukapura homegardens, two orders—Lepidoptera and Diplura—were foundwith only one family with a small population. However, not one order was found in the other twovillages. Diversity measures for soil surface insects in Sukapura homegardens were as follows:Shannon-Weiner Diversity Index 1.31 and Evenness Index 0.42.
In Wangisagara homegardens, 10 families of 6 orders were found. The number of the familieswas the same as the numbers found in bamboo-tree gardens of this village. The Shannon-WeinerDiversity Index of soil surface insects in Wangisagara homegardens is 1.10 and the EvennessIndex is 0.48. If both of the indices were compared with those in the other two villages, theDiversity Index in Wangisagara homegardens is the lowest. The Evenness Index is slightlyhigher if we compare it with the Evenness Index in Sukapura homegardens. It means thatequitability of soil surface insects in Wangisagara homegardens is higher than in Sukapura.
In Ranca Kasumba, 11 families were found from 4 orders. Compared with the findings in theother two villages, the number of orders found in Ranca Kasumba is the lowest. The number offamilies is higher than the ones in Wangisagara (4 families). Diversity Index of soil surface

Faunal Diversity in Upper Citarum River Basin 97
insects in Ranca Kasumba homegardens is the highest among the three villages, which is 1.46.The Evenness Index is also the highest, with 0.61 compared with the other two villages.
Diversity Measures of Soil Surface Insects in Cash-crop Gardens of Sukapura. One land-usetype found in Sukapura but not found in the other two villages was cash-crop gardens. Cash-crops or vegetables are the main commodity of Sukapura. Some inhabitants with their own landsusually convert bamboo-tree gardens to cash-crop gardens because they consider the latter to befinancially more advantageous. The change in type of land use led to the assumption that thecommunity structure of the soil surface insects in this village would be affected.
The analysis of data obtained from cash-crop gardens indicated that the dominant soil surfaceinsects resemble those in the other two types of land use in this village. The most dominantgroup was Hypogastruridae of Collembolla, followed by Formicidae and Entomobrydae. Severalexperts stated that the dominance of soil surface insects from the order Collembola in cash-cropgardens was caused by a decrease in their predator population (usually from the order Acarina),because of overuse of pesticides. Research in Australia indicated that one of the insects from theCollembolas, Sminthurus viridis, was a very harmful cash-crop pest (Anonymous 1994).
Seventeen families of 7 orders of soil surface insects were found in Sukapura cash-crop gardens.The total number of the families is lower than the numbers of bamboo-tree gardens orhomegardens in Sukapura. The diversity measures of Sukapura cash-crop gardens are as follows:Shannon-Weiner Diversity Index is 1.36 and the Evenness Index is 0.48.
Diversity Measures of Terrestrial Squamata in Man-made Ecosystem
Terrestrial Squamata has a higher diversity and abundance in the villages compared to that foundin Mount Wayang (see Appendix Table 4.5). In the villages of the 60 sampling units chosen fromthe three villages (bamboo-tree gardens, homegardens, and rice fields—each with 15 units foreach village; and Sukapura cash-crop gardens with 15 units), 279 individuals were captured fromseven species belonging to three families of two orders, Lacertilia (lizards) and Ophidia (snakes).From Lacertilia only one family was found with only one species, Mabuya multifasciata (gardenlizard). From the order Ophidia, there were two families—Colubridae with five species:Calamaria linnaei (ular tangkai), Rhabdophis subminiatus (ular picung), R. chrysargus (ularair), R. vittatus (ular kisik), and Sybinophis geminatus (ular kadut); and Xenopeltidae with onlyone species: Xenopeltis unicolor (ular linghas).
Not one of these species of terrestrial Squamata found in Mount Wayang forest and in thevillages were protected animals, or even endemic species. The species of snakes found belong tothe group Aglypha (van Hoesel 1959) in which the snake has no fang; therefore, none of them isconsidered to be poisonous snakes. Rhabdophis subminiatus (ular picung) is usually consideredto be dangerous only because of its red neck and its aggressiveness when disturbed. Xenopeltisunicolor (ular linghas) was considered by villagers as a fish predator. The only poisonous snakefound was Bungaurus candidus (ular belang), but it was found outside the sampling unit. Thissnake belongs to Elapidae, which is included in the Proteroglypha group. It has fangs in theanterior of the oral cavity, and the poison is usually a neurotoxin (van Hoesel 1959).
Other Squamata (arboreal Squamata) found in the study area were Calotes jubatus (chameleon),Gecko gecko (gecko), and three species of house lizards—Hemidactylus frenatus, Peropus
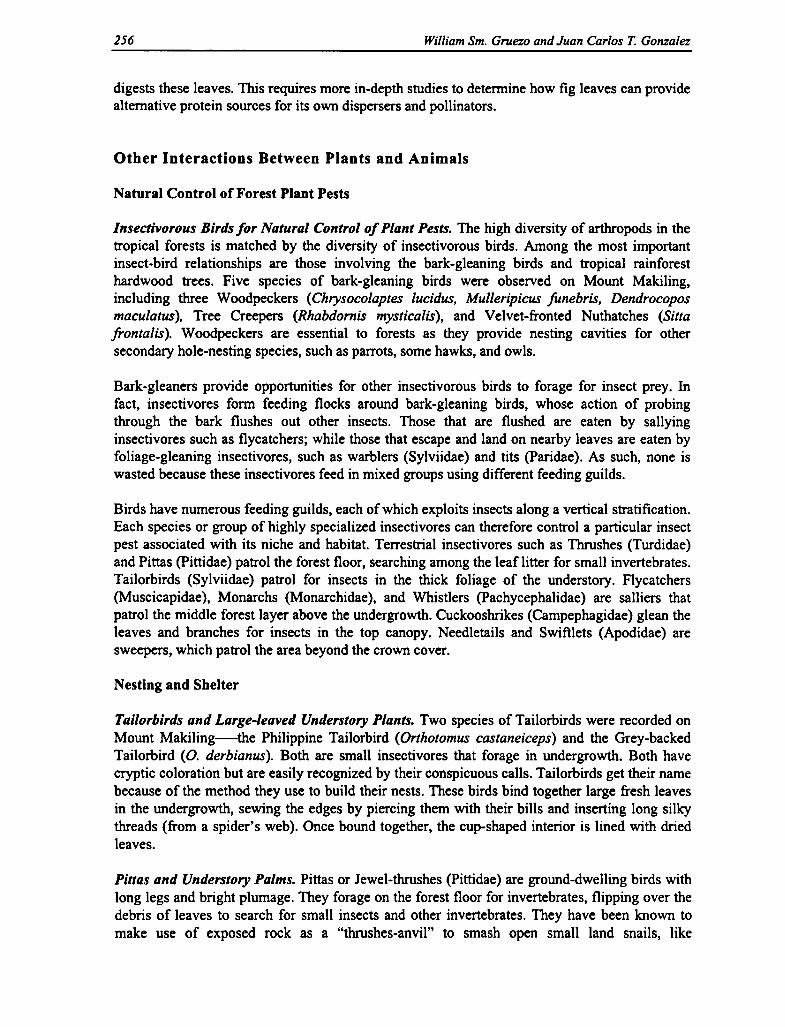
98 T. S. Erawan, N. Djuangsih, M Muchtar, H. Setiana, and L. S. Istanti
mutilatus, and Cosymbotus platyurus. The study did not include this group of animals becausethe collection of these animals should be specific and require different methods/techniques.
The diversity and abundance of terrestrial Squamata in the villages were low. From each type ofland use, 0-3 species of individuals were found. Mabuya multifasciata was the only high numberof individuals found (2-97 individuals per each type of land use), but it was not found inWangisagara homegardens. The assumption of why there was not a single individual wasbecause most of the Wangisagara homegardens had a hard-packed ground surface, which wasused for many different activities.
Terrestrial Squamata and reptilian species, especially snakes, generally found in living areas ofinhabitants and homegardens are considered dangerous. Thus, if snakes were seen, they wereimmediately killed or disposed of. Only house lizards, which could be found in every home,could live close to inhabitants.
Diversity of Terrestrial Squamata in Bamboo-tree Gardens. From 45 units of bamboo-treegardens (15 units per each village), 86 individuals of terrestrial Squamata were found, consistingof four species belonging to three families: 82 individuals of Mabuya multifasciata; 2 individualsof Rhabdophis chrysargus; and only a single individual of Rhabdophis subminiatus andXenopeltis unicolor.
Similarity Index for terrestrial Squamata in bamboo-tree gardens is 0.74 and the Evenness Indexis 0.17. The comparison between bamboo-tree gardens indicated similarity in the number ofspecies (i.e., two species each). The highest individuals were found in Ranca Kasumba bamboo-tree gardens (42 individuals), followed by Wangisagara (23 individuals), and Sukapura (21individuals) with the lowest. The Diversity Index and the Evenness Index are reversed. TheDiversity Index of terrestrial Squamata in Sukapura bamboo tree-gardens is the highest with0.31, followed by Wangisagara with 0.18, and Ranca Kasumba with 0.11. The Evenness Index ofterrestrial Squamata in bamboo-tree gardens of Sukapura is 0.45, Wangisagara 0.26, and RancaKasumba 0.16. The confusion in the values cited was caused by the low number of speciesfound, which was only two species. Furthermore, the Evenness caused the Diversity Index ofterrestrial Squamata in Sukapura bamboo-tree gardens to be higher than the Diversity Index ofterrestrial Squamata in Ranca Kasumba bamboo-tree gardens. Thus, the illustration obtained fordiversity of the terrestrial Squamata in the three villages is the same but different in itsabundance. As mentioned, it showed that Reptilia's abundance in the case (terrestrial Squamata)is higher in a lower site; terrestrial Squamata in Ranca Kasumba bamboo-trees gardens is higherthan in Wangisagara; and terrestrial Squamata in Wangisagara bamboo-tree gardens is higherthan in Sukapura in terms of abundance.
In bamboo-tree gardens, human intervention was relatively small compared with the other landuses. Hence, the altitudinal effect to the diversity as mentioned by Benton and Benton (1974) andHerse (1951, in Daru 1988) was not yet seen. The effects were seen on its abundance. TheSimilarity Index of terrestrial Squamata between bamboo-tree gardens is 50 percent. This isbecause of the presence of Mabuya multifasciata in all of the bamboo-tree gardens.
Diversity of Terrestrial Squamata in Homegardens. Fourteen individuals of terrestrialSquamata were found in 45 units of homegardens, consisting of species belonging to twofamilies: eight individuals of Scincidae (all Mabuya multifasciata); six individuals of Colubridae
Faunal Diversity in Upper Citarum River Basin 99
(two individuals of Rhabdophis subminiatus and four of R. Chrysargus). Diversity Index ofterrestrial Squamata in homegardens is 0.96 and Evenness Index is 0.87.
The diversity and abundance of terrestrial Squamata in homegardens are lower than in bamboo-tree gardens. It is affected by the higher level of human activities in homegardens than inbamboo-tree gardens. In Wangisagara homegardens, there was not even one terrestrial Squamatafound. In Sukapura homegardens, seven individuals were found with two species belonging totwo families: four individuals of M. multifasciata and three individuals of R. chrysargus. InRanca Kasumba homegardens, seven individuals were found from three species belonging to twofamilies: four individuals of M. multifasciata, two of Rhabdophis subminatus, and one of R.chrysargus.
Similarity Index of terrestrial Squamata species between Sukapura homegardens and RancaKasumba homegardens is 80 percent. M multifasciata and R. chrysargus were found in bothhomegardens, and R. subminatus was only found in Ranca Kasumba homegardens.
Diversity of Terrestrial Squamata in Rice Fields. The diversity of terrestrial Squamata in ricefields more or less is the same with those in homegardens. In addition, the diversity and thestructure of the plants were simpler. From 15 units of rice fields, 166 terrestrial Squamataindividuals belonged to three species (two families): Rhabdophis vittatus with three individualsand Sybinopsis geminatus with one individual. In Sukapura rice fields, there were 49 terrestrialSquamata, in which all of them were M. Multifasciata. From Wangisagara rice fields, there were100 terrestrial Squamata belonging to three species: M multifasciata with 97 individuals, R.vittatus with two individuals, and S. geminatus with one individual. In Ranca Kasumba ricefields, 17 terrestrial Squamata individuals were found belonging to two species: 16 were M.multifasciata and one R. vittatus.
Terrestrial Squamata in Wangisagara is the highest in its individuals and species numbers. Inabundance, terrestrial Squamata in Sukapura rice fields came second, but in species numbersRanca Kasumba rice fields came second after Wangisagara rice fields. Diversity Index ofterrestrial Squamata in Sukapura rice fields and also the Evenness Index is zero (because of onlyone species); Wangisagara rice fields is the same with Ranca Kasumba, which is 0.15. EvennessIndex of terrestrial Squamata in Wangisagara rice fields is 0.14; Ranca Kasumba rice fields is0.22. Thus, although with the same Diversity and Evenness Indices, terrestrial Squamata inRanca Kasumba rice fields is higher than in Wangisagara rice fields. From the number ofspecies, it is assumed that diversity of terrestrial Squamata in Wangisagara rice fields is higherthan in Ranca Kasumba and diversity of terrestrial Squamata in Ranca Kasumba rice fields islower than in Sukapura. The high diversity and abundance of terrestrial Squamata inWangisagara rice fields were lower than in Ranca Kasumba because human activities in RancaKasumba were higher; besides, the altitude of both places is below 1,000 m above sea level(boundary between lowland rainforest with upland rainforest).
Similarities of terrestrial Squamata between rice fields in all three villages are as follows:Sukapura-Wangisagara rice fields with 50 percent, Sukapura-Ranca Kasumba rice fields with 67percent, and Wangisagara-Ranca Kasumba rice fields with 80 percent.
Diversity of Terrestrial Squamata in Cash-crop Gardens. From 15 units of cash-crop gardens inSukapura, there were 13 terrestrial Squamata individuals belonging to two species (twofamilies): Calamaria linnaei with one individual and M. multifasciata with 12 individuals.

100 T. S. Erawan, N. Djuangsih, M. Muchtar, H. Setiana, and L. S. Istanti
Another species is Rhabdophis chrysargus. The number of individuals of terrestrial Squamata incash-crop gardens is second to bamboo-tree gardens. Similarity Index of terrestrial Squamatabetween cash-crop gardens and rice fields is 67 percent and with other land-use types is 50percent. M. multifasciata was found in all four types of land use in Sukapura; R. chrysargus wasfound in bamboo-tree gardens and homegardens, and C Linnaei was only found in cash-cropgardens.
The Diversity and Evenness Indices of terrestrial Squamata in cash-crop gardens are the lowestcompared to other types of land use in Sukapura, except for rice fields. The Diversity Index ofterrestrial Squamata in cash-crop gardens is 0.27 and Evenness Index is 0.34.
Conclusion
The dispersal of bird species on Mount Wayang and in the village study sites is different.Generally, dispersal of avifauna on Mount Wayang is nearly even, whereas the village study sitesare usually dominated by one or more specified species. Dominant species in rural areas wherehuman activities are high are usually species best able to adapt to the human environment.
The habitat on Mount Wayang has been fragmented by human activities such as tea plantations,forestry activities, and gardening. This fragmentation causes high heterogeneity, which, in turn,attracts diverse birds. Every species has its own preference in choosing its space. The dominantspecies at Mount Wayang are those that are able to adapt to the existing place. Zone II has thegreatest diversity of species compared with the other two zones. But in terms of species numberand family, Zone I has a higher number of species and family than Zones II and III because it is atransition zone between agricultural lands and forest lands.
In the village study sites, the most important factor influencing diversity of bird species is thetransformation of structure and the function of vegetation by humans during settlement andfarming. Fanning, associated with usage of pesticides in large amounts, affects diversity of birds.Wangisagara has the highest diversity of birds (as seen from the species number) compared withthe other two villages. This is because of vegetative structure, which is relatively more complexthan the other two villages. Sukapura and Ranca Kasumba have relatively more intensivefarming activities (crop gardens and rice fields), which result in less diversity of bird species. Inaddition, hunting on Mount Wayang and in the village areas directly impacts the number anddiversity of certain bird species.
Bamboo-tree gardens in the three villages are most favored by the bird species compared withhomegardens and rice fields. Whereas bamboo-tree gardens and homegardens almost have thesame vegetative structures, the human activities and the intensity of vegetation management inhomegardens are higher, and this affects the diversity of bird species. And in the rice fields, onlycertain bird species are attracted to the structure and characteristics of the plants. Based on thenumber of species of avifauna at these three land-use types—bamboo-tree gardens, home-gardens, and cash-crop gardens—Wangisagara is more attractive to various bird species.
Insectivores are the dominant group on Mount Wayang and in the village areas. This shows bothimportance of birds as insect predators and the large populations of insects in rural areas. Theyare followed by omnivorous species whose large numbers also demonstrate the presence of alarge niche for them. More specialized seed/fruit and carnivorous species are much less

Faunal Diversity in Upper Citarum River Basin 101
abundant. The omnivores and frugivores are useful for seed dispersal, and the carnivores help tocontrol the frugivores and the small mammals (such as mice) that become pests in the rice fieldsand the large populations of insects in the rural area.
In general, the most dominant groups of flying insects in Mount Wayang differ among the threezones. The diversity of flying insects in terms of family richness and total abundance in Zone IIare the highest. However, in terms of Diversity Index, Zone III is the highest compared to otherzones. The change of community structure and diversity of the flying insects from Zones III to Iis a decrease in total abundance and Diversity and Evenness Indices. Abundance of dominantfamilies at the top (Dystidae, Cecidomyiidae, Simuliidae, Cynipidae, Tiphiidae, Miriidae, andCurculionidae) decreased, but the abundance of Ichneumonidae, Chrysomelidae, Conopidae,Cicadelidae, Calliphoridae, and Formicidae increased. There was also a change of dominancerank. The Diversity and Evenness Indices of flying insects in the forest were higher than that inthe village study sites. It is shown that the diversity of flying insects in bamboo-tree gardens andhomegardens in Sukapura was higher than Ranca Kasumba. The composition of flying insects atSukapura cash-crop gardens was somewhat the same as those of homegardens.
As for soil surface insects, this study also found that the dominant groups in soil surface insectsin the land-use types of the three villages are the same (i.e., springtails and ant groups). On theother hand, the dominant groups of soil surface insects in Mount Wayang do not differsignificantly, although Zone II exhibits a lower diversity in terms of family richness.
References Cited
Altman, J. 1974. Observational study of behavior: Sampling methods. Behavior 49:227-67.
Andrew, P. 1992. The birds of Indonesia. Kukila Checklist No. 1, pp. 1-5. Indonesian OrnithologicalSociety, Jakarta.
Anonymous. 1994. Keanekaragaman hayati di Indonesia. Jakarta: Kantor Menteri Negara LingkunganHidup dan Konsorsium Nasional untuk Pelestarian Hutan dan Alam Indonesia.
Benton, W., and H. H. Benton. 1974. Encyclopedia Britannica. USA: Encyclopedia Britannica Inc.
Bibby, J. C., N. D. Burgess, and D. A. Hill. 1992. Bird census techniques. London: Academic Press.
Bierregard, R. 0., Jr., T. E. Lovejoy, V. Kapos, A. A. dos Santos, and R. W. Kutchings. 1992. The biolog-ical dynamics of tropical rainforest fragments: A prospective comparison of fragments and continuousforest. Bioscience 42(11): 859-66.
Borror, D. J., C. A. Triplehorn, and N. F. Johnson. 1992. Pengenalan Pelajaran Serangga (a translation).Yogyakarta: Gadjah Mada Univ. Press.
Bourliere, F. 1983. Animal species diversity in tropical forest. In Ecosystems of the world, ed. F. Golley,86-87. 14A: Tropical rainforest ecosystems. Amsterdam: Elsevier.
Brown, A. L. 1978. Ecology of soil organism. London: Heinemann Educational Books.
Christanty, L. 1985. Homegardens in tropical Asia, with special reference to Indonesia. In Tropicalhomegarden, ed. K. Laundauer and M. Brazil. Tokyo: The United Nations Univ.
Dammerman, K. W. 1929. The agricultural zoology of Malay Archipelago: The animal injurious andbeneficial to agriculture, horticulture, and forestry in Malay Peninsula. Amsterdam: The Dutch East Indiesand Philippines.

102 T. S. Erawan, N. Djuangsih, M. Muchtar, H. Setiana, and L. S. Istanti
Daru, Y. S. 1988. Amphibia dan Reptilia di daerah aliran sungai Cisangkuy Kabupaten Bandung, JawaBarat. Thesis. Institut Teknologi Bandung. Unpublished.
Funke, W., and M. R. Holzaptel. 1991. Animal coenoses in the "spruce forest" ecosystem (Protozoa,Metazoa invertebrates): Indicators of alterations in forest ecosystems. In Modern ecology: Basic andapplied aspects, ed. G. Esser and D. Overdick. Amsterdam: Elsevier.
Furness, R. W., J. J. D. Greenwood, and P. J. Jarvis. 1993. Can birds be used to monitor the environment?In Birds as monitors of environmental change, ed. R. W. Furness and J. J. D. Greenwood. London:Chapman and Hall.
Hanksworth, D. L., and J. M. Richie. 1993. Biodiversity and biosystematic priorities: Microorganisms andinvertebrates. CAB International, Wallingford.
Healey, I. N. 1967. The energy flow through a population of soil Colembola. Vol. 2, Secondaryproductivity in terrestrial ecosystems, ed. K. Petrusewicz, 695-708. Warsaw: Polish Academy of Science.
Howe, H., and J. Smallwood. 1982. Ecology of seed dispersal. Annual Review of Ecology and Systematics13:201-28.
Jaeger, R. G., and R. F. Inger. 1994. Quadrat sampling. In Measuring and monitoring biological diversitystandard methods for amphibians, ed. W. R. Heyer, M. A. Donelly, R. W. McDiamird, L. A. C. Hayek,and M. S. Foster, 97-102. Washington: Smithsonian Institution Press.
Kottelat, M., A. J. Whitten, S. N. Kartikasari, and S. Wirjoatmodjo. 1993. Freshwater fishes of WesternIndonesia and Sulawesi. Periplus Edition.
Kremen, C., R. K. Colwell, T. L. Erwin, D. D. Murphy, R. F. Noss, and M. A. Sanjayan. 1993. Terrestrialarthropod assemblages: Their use in conservation planning. Conservation Biology 7:796-808.
Kruess, A., and T. Tscharnthe. 1994. Habitat fragmentation, species loss, and biological control. Science24:1581-84.
Magurran, A. E. 1988. Ecological diversity and its measurement. New Jersey: Princeton Univ. Press.
MacArthur, R. H., and J. W. MacArthur. 1961. On bird species diversity. Ecology 42:594-98.
MacKinnon, J. 1990. Field guide to the birds ofJava and Bali. Yogyakarta: Gadjah Mada Univ. Press.
Mooney, H. A., J. Lubchenco, R. Dirzo, and O. E. Sala. 1995. Biodiversity and ecosystem functioning:Ecosystem analyses. In Global biodiversity assessment, ed. V. H. Heywood. Cambridge: Cambridge Univ.Press.
Neumann, V. 1970. Die sukzession der bodenfauna carabiden (coleopteral), diplopoden and isopoden inden aufarstungen des rheinischen braunkshlenreviers, mitteilgn. Dtsch. Bodenkundl. Gesellsch 10:214-16.
Noss, R. F. 1990. Indicators for monitoring biodiversity: A hierarchical approach. Conservation Biology4:355-64.
Otvos, I. S. 1979. The effect of insectivorous bird activities in forest ecosystems: An analysis. In The roleof insectivorous birds in forest ecosystems, ed. J. G. Dickson, R. N. Conner, and J. A. Jackson. New York:Academic Press.
Owen, D. F. 1983. The abundance of biomass of forest animals. In Ecosystems of the world, ed. F. Golley,93-100. 14A: Tropical rainforest ecosystems. Amsterdam: Elsevier.
Parikesit. 1986. The effects of forest fire on soil surface arthropods and understory vegetation (inIndonesian). Unpublished.
Peters, C. M. 1994. Sustainable harvest of non-timber plant resources in tropical moist forest: An ecolog-ical primer. Biodiversity Support Programme, Washington, D.C.
Soemarwoto, O. 1994. Ekologi, Lingkungan Hidup dan Pembangunan. Jakarta: P.T. Pradnya Paramita

Faunal Diversity in Upper Citarum River Basin 103
Soemarwoto, 0., and I. Soemarwoto. 1984. The Javanese rural ecosystem. In An introduction to humanecology research on agricultural systems in Southeast Asia, ed. A. T. Rambo and P. E. Sajise, 254-86.Philippines: University of the Philippines at Los Banos.
Soule, E., and K. A. Kohm, eds. 1989. Research priorities for conservation biology. Washington, D.C.:Island Press.
Stork, N. E., and M. J. Samways. 1995. Inventory and monitoring. In Global biodiversity assessment, ed.V. H. Heywood. Cambridge: Cambridge Univ. Press.
Sudjana. 1982. Metoda Statistika. Bandung: Tarsito.
Sugandhy, A., ed. 1995. Country paper on the implementation of biodiversity management in Indonesia.Paper submitted to the second meeting of the parties to the Convention on Biological Diversity. StateMinistry of Environment, Government of the Republic of Indonesia, Jakarta.
Terborgh, J. 1986. Community aspects of frugivory in tropical forests. In Frugivorous and seed dispersal,ed. A. Estrada and T. H. Fleming, 317-84. Dordrecht: Junk Publishers.
1992. Maintenance of diversity in tropical forests. Biotropica 24:283-92.
Van Helvoort, B. 1981. A study on bird population in the rural ecosystem of West Java, Indonesia: A semi-quantitative approach, 1-91. Nature Conservation, Dept. of Agriculture, Wageningen Univ., Wageningen.
Van Hoesel, J. K. P. 1959. Ophidia javanica. Bogor: Kementrian Pertanian, Lembaga Pusat PenyelidikanAlam (Kebun Raja Indonesia), Museum Zoologicum Bogoriense.

Appendix Table 4.1 List of bird species, food class, status, and its presence in each land-use type in Upper Citarum River Basin, West Java, IndonesiaFood Land-use type and location'
No. Family Scientific name Indonesian name English name class' Status' MW BGS RFS HGS BOW RFW HOW BGR RFR HGR CGS
• 1 Ardeidae Bubulcus ibis Kuntul kerbau Cattle Egret P CITES + +
'2 Ardeola speciosa Blekok sawah Javan Pond-heron P + +
3 Ixobrychus cinnamomeus Kokondangan Cinnamon Bittern P +•4 Accipitridae Accipiter virgatus Elang garis dagu Besra C P + +
5 Ictinaetus malayensis Black Eagle Black Eagle C P +
6 Falconidae Falco moluccensis Alap-alap sapi Spotted Kestrel C P +
7 Phasianidae Arborophilajavanica Puyuh gonggong Chestnut-bellied Partridge IF EJ +
8 Gallus gallus Ayam hutan merah Red Junglefowl IF +•9 Tumicidae Turn ix suscitator Puyuh tegalan loreng Barred Button-quail I +
• 10 Rallidae Gallirallus striatus Mandar padi Slaty-breasted Rail IF +
11 Porzanafusca Mata merah Ruddy-breasted Crake IF +
12 Glareolidae Glareola maldivarum Terik asia Oriental Pratincole PI
13 Columbidae Macropygia unchall Burung uncal Barred Cuckoo-dove F +• 14 Streptopelia chinensis Tekukur Spotted Dove F + + +
• 15 Geopelia striata Perkutut Zebra Dove F +
16 Cuculidae Clamator coromandus Bubutjambul Chestnut-winged Cuckoo I M
17 Cuculus saturatus Set gunggung Oriental Cuckoo I + + +
• 18 Cacomantis merulinus Wiwik kelabu Plaintive Cuckoo I +
'19 Cacomantis sepulcralis Burung uncuing Rusty-breasted Cuckoo 1
20 ZanclostomusJavaninu Bubut kembang Red-billed Malkoha I
21 Strigidae Otus lempiji Celepuk Collared Scopsowl CI
22 Apodidae Collocalia esculenta Walet sapi Glossy Swiftlet I + + + + + + + + + +
23 Apus affnis Kapinis Little Swift I + + + + + + + + + + +
24 Rhaphidura leucopygialis Kapinis pantat perak Silver-romped Swift I +
25 Alcedinidae Alcedo meninting Menintin Blue-eared Kingfisher P P +
26 Alcedo coerulescens Burung udang biru Small Blue Kingfisher P P +•27 Halcyon smyrnensis Cekakak dada putih White-throated Kingfisher P P +•28 Halcyon cyanoventris Cekakak gunung Javan Kingfisher P P,EJB + +
29 Halcyon ehloris Cekakak Collared Kingfisher P P +•30 Capitonidae Megalaima armillaris Tohtor Orange-fronted Barbet IF P,EJB +
31 Megalaima haemacephala Ungkut-ungkut Coppersmith Barbet IF +
32 Dendrocopus macei Caladi ulam Fulvous-breasted Woodpecker I +
104
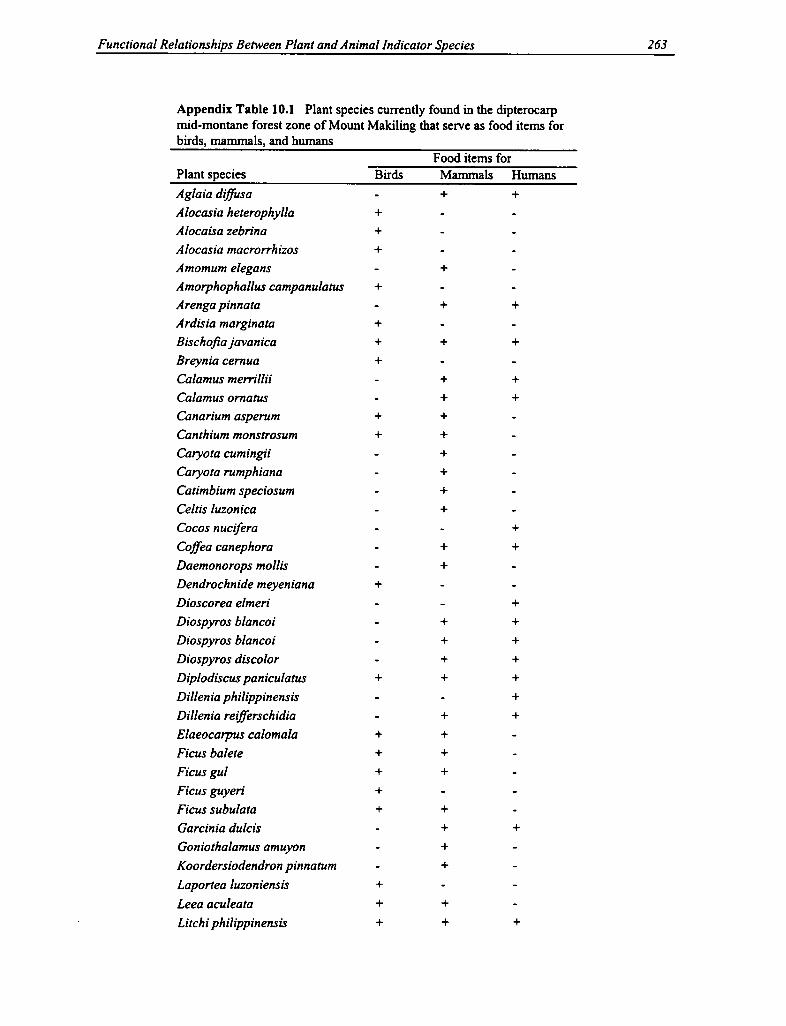
Appendix Table 4.1 List of bird species, foo d class, status, and its presence in each land-use type in Upper Citarum River Basin, West Java, IndonesiaFood Land-use type and location`
No. Family Scientific name Indonesian name English name class' Status' MW BGS RFS HGS BGW RFW HGW BGR RFR HGR CGS*33 Alaudidae Mirafrajavanica Branjangan Singing Bush-lark I +
34 Hirundinidae Hirundo rustica Layang-layang asia Barn Swallow I M + +
35 Hirundo striolata Layang-layang besar Striated Swallow I + + + + + + +
36 Motacillidae Dendronanthus indicus Entut leuncang hutan Forest Wagtail•37 Motacilla cinerea Entut leuncang Grey Wagtail I M + + +
38 Campephagidae Coracina larvata Kepodang ungu gunung Black-faced Cuckoo Shrike I +
*39 Pericrocolus miniatus Sepah gunung Sunda minivet I +
40 Hemipus hirundinaceus Jinjing teureup Black-winged I +Flycatcher Shrike
*41 Tephrodornis gularis Petulak Large Wood-shrike I +
42 Pycnonotidae Pycnonotus aurigaster Kutilang Sooty-headed Bulbul IF +
43 Pycnonotus bimaculatus Cicarante Orange-spotted Bulbul IF +•44 Pycnonotus goiavier Cerukcuk Yellow-vented Bulbul IF + +
*45 Chloropseidae Aegithina liphia Cipoh Common Lora I + + + +
46 Laniidae Lanius tigrinus Bentet loreng Tiger Shrike I +
47 Lanius schach Bentet Long-tailed Shrike I +•48 Turdidae Brachypteryx leucophrys Cingcoang merah Lesser Shortwing I +
*49 Brachypteryx montana Cingcoang alis putih White-browed Shortwing I +•50 Cinclidium diana Cingcoang biru Sunda Blue Robin I +
51 Enicurus leschenaulti Meninting besar White-crowned Forktail I +
52 Zoothera citrina Anis merah Orange-headed Thrush I +•53 Timaliidae Pomatorhinus montanus Burung kopi Chestnut-backed IF +
Scimitar-babbler
*54 Napothera epilepidota Berencet berkening Eye-browed Wren-Babbler I +
*55 Pnoepyga pusilla Berencet kecil Pygmi Wren-Babbler I +•56 Stachyris melanothorax Tepus pipi perak Pearl-checked Tree Babbler I P,EJB + +
57 Garrulax rufrfrons Burung kuda Rufous-fronted I P,EJ +Laughing Thrush
*58 Pteruthius flaviscapis Ciu besar White-browed Shrike-babbler IF +
*59 Pteruthius aenobarbus Ciu kecil Chestnut-fronted Shrike- IF +Babbler
•60 Alcippe pyrrhoptera Berencet wergan Javan Fulvetta I P,EJ +
*61 Crocias albonatatus Burung matahari Spotted Crocias I P,EJ +
105
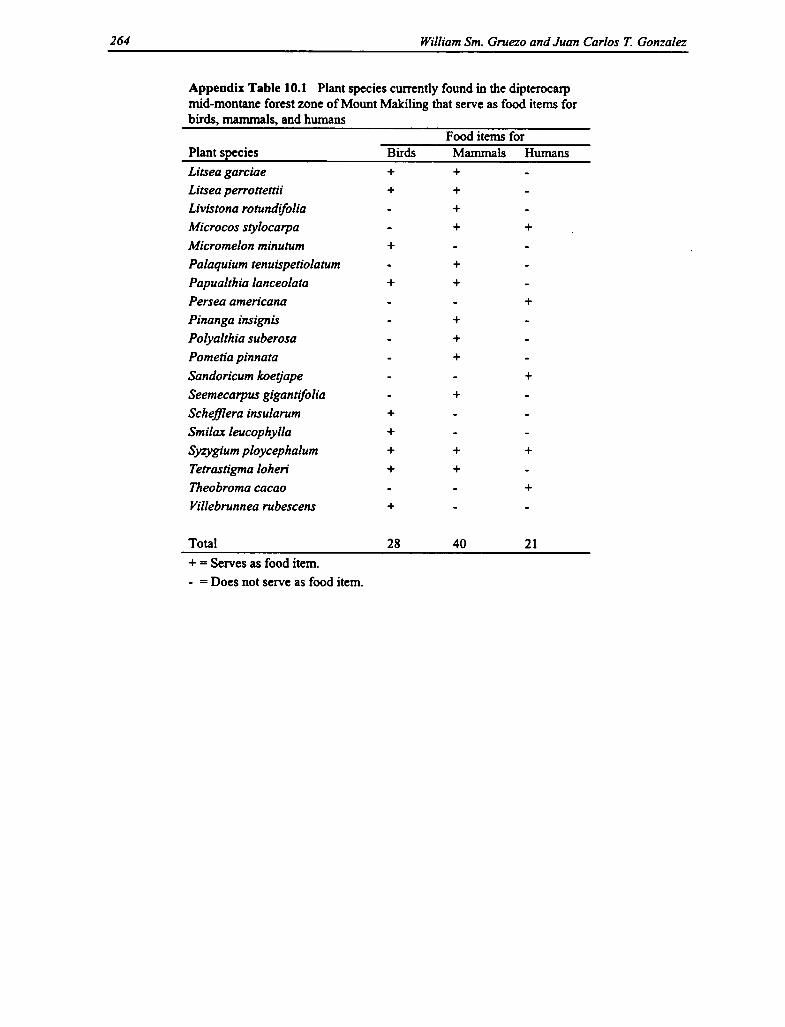
Appendix Table 4.1 List of bird species, food class, status, and its presence in each land-use type in Upper Citarum River Basin, West Java, IndonesiaFood Land-use type and location`
No. Family Scientific name Indonesian name English name class' Status' MW BGS RFS FIGS BGW RFW HGW BGR RFR HGR CGS
62 Sylviidae Tesia superciliaris Burung tikus Javan Tesia I El +
63 Megalurus palustris Bejuwit Striated Grassbird I +
'64 Cisticolajuncidis Cici padi Zitting Cisticola I + + + + +
'65 Prinia polychroa Perenjak coklat Brown Prinia I +
'66 Priniafamiliaris Perenjak sayap garis Bar-winged Prinia I + + + + + + + + + +
'67 Prinia faviventris Perenjak perut kuning Yellow-bellied Prinia I + +
'68 Prinia subflava Perenjak sisi merah Tawny-flanked Prinia I +
'69 Orthotomus cuculatus Cinenen gunung Mountain Tailorbird I +
'70 Orthotomus sutorius Cinenen biasa Common Tailorbird I + + + + +
'71 Orthotomus sepium Cinenen kelabu Ashy Tailorbird I + + + + + + + + +
'72 Phylloscopus trivirgatus Perenjak daun Mountain Leaf-warbler I + +•73 Seicercus grammiceps Perenjak sikatan sunda White-rumped Warbler I +
'74 Abroscopus superciliaris Perenjak kuning Yellow-bellied Warbler I +
'75 Muscicapidae Muscicapa sibirica Sikatan sisi gelap Dark-sided Flycatcher I M +
76 Muscicapa dauurica Bubik Asian Brown Flycatcher I +
'77 Eumyias indigo Ninon-ninon gunung Indigo Flycatcher I +
'78 Ficedula hyperythra Burung bodoh Snowy-browed Flycatcher I + +
79 Ficedula dumetoria Sikatan dada merah Rufous-chested Flycatcher I +
'80 Ficedula westermanni Sikatan belang Little Pied Flycatcher I +
'81 Cyornis banyumas Burung cacing Hill Blue Flycatcher I + +
'82 Culicicapa ceylonensis Sikatan kepala kelabu Grey-headed Flycatcher I +
'83 Rhipiduraphoenicura Kipasan merah Rufous-tailed Fantail I P,EJ +
84 Rhipidurajavanica Kipasan Pied Fantail I P
'85 Aegithalidae Psaltria exilis Cerecet Pygmi Tit I P,EJ + +
'86 Paridae Parus major Gelatik batu Great tit I + + + + + + +
'87 Sittidae Sitta azurea Caladi lumut Blue Nuthatch I +
88 Dicaeidae Dicaeum sanguinolentum Burung cabe gunung Javan Fire-breasted IF +Flowerpecker
'89 Dicaeum trochileum Burung cabe Scarlet-headed Flowerpecker IF + + + + + + +
'90 Nectariniidae Anthreptes malacensis Burung madu kelapa Brown-throated Sunbird IN P +•91 Nectariniajugularis Burung madu kuning Olive-backed Sunbird IN P + + + + + + +
•92 Aethopyga eximia Burung madu gunung White-flanked Sunbird IN P,EJ +
106
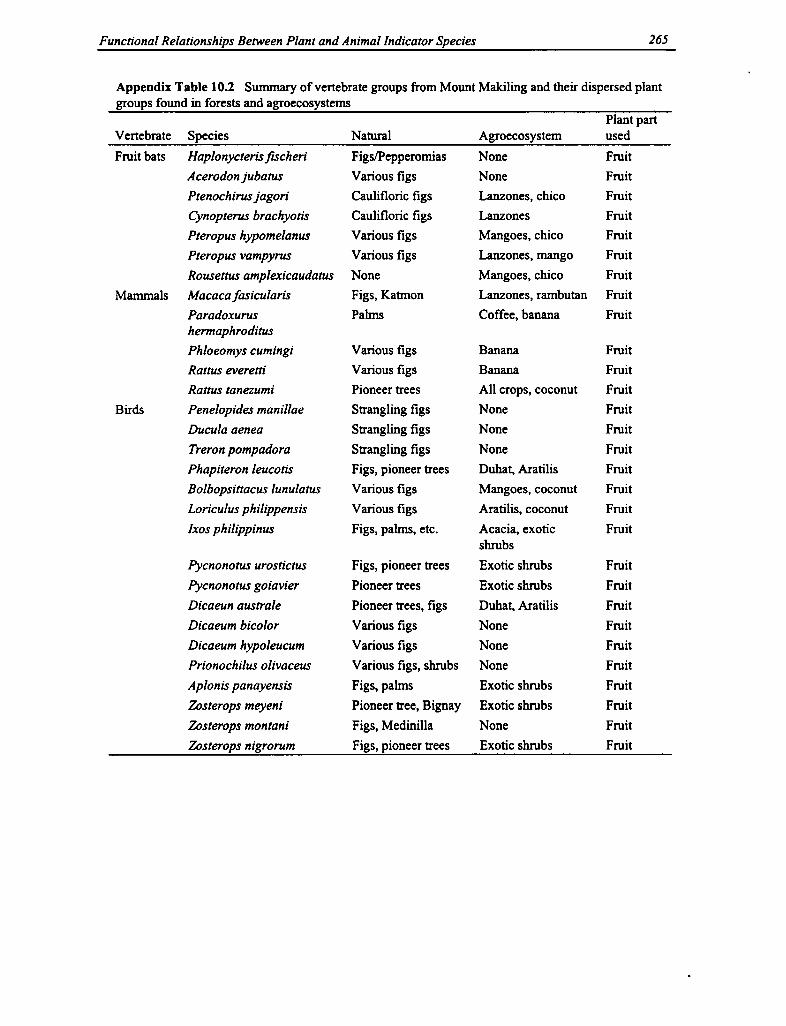
Appendix Table 4.1 List of bird species, food class, status, and its presence in each land-use type in Upper Citarum River Basin, West Java, IndonesiaFood Land-use type and location`
No. Family Scientific name Indonesian name English name class' Status' MW BGS RFS HGS BGW RFW HGW BGR RFR HGR CGS93 Aethopyga mystacalis Brg madu merah ekor Violet-tailed Sunbird IN P +
pjg•94 Arachnotera longirostra Burungjantung kecil Little Spiderhunter IN P + +•95 Zosteropidae Zosterops palpebrosus Burung kacamata biasa Oriental White-eye IF + + + + + + + + +•96 Zosterops montanus Kacamata gunung Mountain White-eye IF +
97 Lophozosteropsjavanicus Esenangka gunung Grey-throated Darkeye IF P,EJ +
*98 Ploceidae Erythrura hyperythra Bondol hijau dada Tawny-breasted Parrot-finch F + +merah
•99 Lonchura leucogastroides Bondol jawa Javan Munia F + + + + + + + + + +• 100 Lonchura punctulata Bondol dada sisik Scaly-breasted Munia F + + + + + +
101 Lonchura maja Bondol haji White-headed Munia F + + +
102 Padda oryzivora Gelatik Java Sparrow F EJB +
• 103 Passer montanus Burung gereja Tree Sparrow F + + + + + + + + +
104 Stumidae Aplonis panayensis Geri besar Asian Glossy Starling IF +
105 Acridotheres javanicus Jalak ungu White-vented Myna IF + +• 106 Oriolidae Oriolus chinensis Kepodang Black-naped Orioled IF +
107 Dicruridae Dicrurus macrocercus Srigunting hitam Black Drongo I +
108 Dicrurus leucophaeus Srigunting kelabu Ashy Drongo I +
• 109 Artamidae Artamus leucorynchus Burung buah/kekep White-breasted Wood IF + +Swallow
110 Corvidae Corvus enca Gagak hutan Slender-billed Crow IC +
a. C - Carnivorous; P = Piscivorous; I - Insectivorous; F - Frugivorous; IN - Insectivorous/Nectarivorous; IF = Insectivorous/Frugivorous.b. P - Protected; EJ - Endemic to Java; EJB - Endemic to Java and Bali; M - Migrant.c. MW = Mount Wayang; BG - Bamboo-tree garden; HG - Homegarden; RF - Rice field; CG = Cash-crop garden; S = Sukapura; W = Wangisagara; R - Ranca Kasumbad. Convention on International Trade in Endangered Species of Fauna and Flora.• = Recorded from sampling units.+ = Bird species found in specified land-use types.
107

Appendix Table 4.2 Diversity measurement of avifauna in Upper Citarum River Basin, West Java, Indonesia
Parameter
Mount WayangZone Zone Zone
I II 111
PointCount
BG
Sukapura
HG RF CG
PointCount
BG
Wangisagara
HG RF
PointCount
BG
Ranca Kasumba
HG RF
. PointCount
Number of sampling units 5 5 5 15 15 15 15 15 15 15 15 15 15
Abundance 89 114 71 172 191 75 29 185 258 329 161 498 336 431 135 387 507
Number of species 24 23 21 36 12 8 6 11 22 20 12 13 25 17 9 10 24
Number of family 13 10 8 16 9 6 4 8 17 13 7 8 15 12 4 6 15
Diversity Indices 2.76 2.8 2.77 3.18 1.5 1.1 1.6 2.1 2.33 2 1.8 1.7 2.36 1.8 1.5 1.4 2.1
Evenness Indices 0.87 0.89 0.91 0.89 0.6 0.5 0.9 0.9 0.75 0.7 0.7 0.7 0.73 0.6 0.7 0.6 0.66
Number of protected species 7 5 6 9 1 1 0 1 2 2 3 1 4 3 1 1 3
Number of endemic species 6 5 6 7 1 0 0 0 1 I 0 0 1 0 0 0 0
Number of carnivorous species 0 0 0 2 0 0 0 0 0 2 0 0 3 3 0 4 3
Number of insectivorous species 15 19 16 23 8 3 3 6 13 9 4 7 11 7 5 3 12
Number of frugivorous species I 0 0 0 2 2 0 2 3 4 3 3 6 4- 3 3 4
Number of omnivorous species 8 4 5 11 2 3 3 3 6 5 5 3 5 3 1 0 5
Number of principal economic 5 3 2 4 10 5 5 8 4 3species
Number of predominant market I 0 0 0 1 0 0 I 0 0species
Similarity between:Zone1 100 60 67Zone II 60 100 77Zone III 65 77 100
Sukapura 100 100 100 51 74 67 53 69 38Wangisagara 51 74 67 100 100 100 73 76 55Ranka Kasumba 53 69 38 73 76 55 100 100 100
Notes: Zone 1, 1660-1830 meters above sea level (ASL); Zone II, 1831-2000 m asl; Zone III, > 2000 m asl.BG = Bamboo-tree garden; HG = Homegarden; RP = Rice field; CG = Cash-crop garden.
108

Appendix Table 4.3 Diversity measurement of flying insects in Upper Citarum River Basin, West Java, IndonesiaCash-crop
Forest (Mount Wayang) Bamboo-tree garden Homegarden gardenZone 1(1660- Zone 11(1831- Zone III (>2000 Sukapura (1250 Wangisagara Ranca Kasumba1830 m asl) 2000 m asl) m asl) m asl) (750 m asl) (650 m asl) Sukapura Wangisagara Ranca Kasumba Sukapura
1. Number of 5 5 5 15 15 15 15 15 15 15sampling unit
2. Number of 282 786 356 2490 2401 919 1182 707 399 8248individual
3. Number of family 35 50 42 49 37 28 31 29 24 37
4. Number of order 6 7 8 9 9 8 10 8 7 8
5. Number of pest 7(20%) 9(18%) 7(16.67%) 10(20.41%) 5(13.51%) 6(21.43%) 6(19.36%) 4(13.79%) 6(25%) 3(8.11%)(fam., ind.) 120(42.55%) 284(36.13%) 86(24.16%) 242(9.7%) 416(17.33%) 326(35.47%) 325(27.5%) 190(26.87%) 27(56.89%) 2831(34.32%)
6. Number of bird's 0 2(4%) 4(9.52%) 2(4.08%) 4(10.81%) 2(7.14%) 1(3.23%) 3(10.35%) 1(4.17%) 5(13.51%)diet (fam.,ind.) 2(0.25%) 21(5.90%) 39(137%) 6(0.25%) 8(0.87%) 1(0.09%) 5(0.71%) 5(1.25%) 19(0.23%)
7. Number of bird's 7(20%) 9(18%) 8(19.05%) 17(34.69%) 18(48.65%) 12(42.86%) 13(41.94%) 14(48.28%) 11(45.83%) 15(40.54%)diet and pest (fam., ind.) 120(42.55%) 72(9.16%) 21(5.90%) 1364(54.78%) 1745(72.68%) 452(49.18%) 284(24.03%) 401(56.72%) 101(25.31%) 5131(62.21%)
8.Others (fam., ind.) 0 0 0 2(4.08%) 2(5.41%) 2(7.14%) 2(6.45%) 2(6.90%) 2(8.33%) 2(5.41%)101(4.06%) 134(5.58%) 54(5.86%) 54(437%) 76(10.75%) 57(14.29%) 117(1.42%)
9. Unknown (fam., ind.) 21(60%) 30(60%) 23(54.76%) 18(36.74%) 8(21.62%) 6(21.43%) 9(29.03%) 6(20.69%) 4(16.67%) 12(32.43 %)121(42.91%) 428(54.45%) 218(61%) 794(31.89%) 100(4.16%) 79(8.60%) 518(43.82%) 35(4.95%) 9(2.26%) 150(1.82%)
10. Diversity Index (H') 2.80 2.88 2.97 1.68 1.68 2.23 2.19 2.07 1.81 1.01
11. Evenness Index 0.78 0.74 0.79 0.64 0.46 0.67 0.64 0.61 0.57 0.28
12. Dominant families Ichneumonidae Simuliidae Dysticidae Culicidae Culicidae Culcidae Simuliidae Simuliidae Simuliidae CulicidaeSimuliidae Ichneumonidae Cecidomyiidae Simuliidae Simuliidae Simuliidae Culicidae Culicidae Culicidae SimuliidaeCecidomyiidae Cecidomyiidae Simuliidae Aleyrodidae Formicidae Formicidae Conopidae Conopidae ConopidaeCynipidae Ichneumonidae Ichneumonidae Drosophilidae Drosophilidae Aleyrodidae Aleyrodidae AleyrodidaeTriphiidae Cynipide Aphididae Formicidae Formicidae Formicidae
Tiphiidae ConopidaeMiridaeCurculionidae
109

Appendix Table 4.4 Diversity measurement of terrestrial insects in Upper Citanun River Basin, West Java, Indonesia
Forest (Mount Wayang) Bamboo-pee garden Homegarden Cash-crop garden
Zone I Zone I1 Zone III Sukapun Wangisagara Ranca Kasumba
Parameter (1660-1830 m asl) (1831-2000 m asl) (> 2000 m asI) (1250 m asl) (750 m asl) (650 m asl) Sukapura Wangisagara Ranca Kasumba Sukapun
I. Number of 5 5 5 IS 15 IS IS IS IS 1S
sampling unit
2. Number of 18272 445 345 2312 1701 1902 1447 1366 784 20
individual
3. Number of family 25 20 22 22 9 10 21 10 11 17
4. Number of order 9 10 8 7 6 4 8 6 3 7
S. Number of pest (fam., 1(4%) 1(0.5%) 1(4.55%) 7(22.71%) 4(27.27%) 3(30%) 7(20%) 6(4094) 5(27.27%) 4(0.04%)
ind.) 1(0.005%) 3(0.67%) 7(2.03%) 784(54.18%) 652(38.33%) 240(43.24%) 82(3.55%) 12(0.88%) 15(3.83%) 2(11.76%)
6. Number of bird's 7(28%) 8(40%) 11(50%) 11(27.27%) 5(18.18%) 6(10%) 10(40%) 7(30%) 7(27.27%) 11(52.94%)
diet (fam., ind.) 45(0.2%) 150(35.06%) 134(38.84%) 16(1.80%) 15(0.82%) 13(2.34%) 880(38.06%) 213(15.59%) 114(29.08%) 956(33.83%)
7. Number of bird's diet 1(4%) 1(0.5096) 1(4.55%) 0 0 1(10%) 0 0 0 0
and pest (fam., ind.) 29(0.16%) 37(832%) 13(3.77%) 7(1.26%)
8. Others (fam., id.) 4(16%) 4(20%) 3(13.64%) 7(31.82%), 3(27.2796) 3(40%) 9(25%) 4(30%) 5(36.36%) 6(33.29%)
161(0.88%) 205(46.07%) 180(52.17%) 628(43.40%) 1033(60.73%) 195(53.15%) 1247(53.94%) 1141(83.53%) 262(66.84%) 1853(65.57%)
9. Unknown (fam., ind.) 12(48%) 6(30%) 6(27.27%) 3(13.64%) 1(9.09%) 0 3(15%) 0 1(9.09%) 1(5.88%)
18037(42.91%) 44(9.88%) 15(4.35%) 13(0.21%) 1(0.06%) 103(4.46%) 1(0.26%) 15(0.53%)
10. Diversity Index (H') 1.1 2.3 2.3 1.31 1.23 1.36 1.51 1.1 1.46 1.36
11. Evenness Index 0.03 0.8 0.8 0.42 0.54 0.59 0.50 0.48 0.61 0.48
12. Dominant families Termitidae Entomobryidsae Entomobryidae Formicidae Formicidae Formicidae Formicidae Hypogastruridae Hypogastnuidae Hypogastru idae
Entomobryidae Formicidae Hypogatruridae Entomobryidae Entomobryidae Hypogastnnidae Entomobryidae Entomobryidae Entomobryidae Formicidae
Hypogatnuidae Ichneumonidae Isostomidae Hypogastnuidae Entomobryidae Hypogastnuidae Formicidae formicidae Entomobryidae
110
Appendix Table 4.5 Diversity measures of terrestrial Squamata in Upper Citarum River Basin, West Java, IndonesiaMountWayang Sukapura Wangisagara Ranca Kasumba Total
Bamboo- Cash- Bamboo Bamboo-tree Home- Rice crop tree Home- Rice tree Home- Rice Absolute Relative
Species Forest garden garden field garden garden garden field garden garden field abundance abundance
Calamaria linnaei 1 1 0.35Lygosoma temmincki 4 4 1.40Mabuya multijasciata 2 19 4 49 12 22 97 41 4 16 266 93.33Rhabdophis 1 2 3 1.05subminiatus
Rhabdophis 2 3 1 6 2.11chrysargus
Rhabdophis vittatus 2 1 3 1.05Sybinopsis geminatus 1 1 0.35Xenopeltis unicolor 1 1 0.35
Total number of 6 21 7 49 13 23 0 100 42 7 17 285 100individual
Total number of 2 2 2 1 2 2 0 3 2 3 2 8species
Total number of 1 2 2 1 2 2 0 3 2 2 2 3family
Diversity Index 0.64 0.31 0.68 0 0.27 0.18 0 0.15 0.11 0.96 0.15 0.36
Evenness Index 0.92 0.45 0.99 0 0.34 0.26 0 0.14 0.16 0.87 0.22 0.17
III
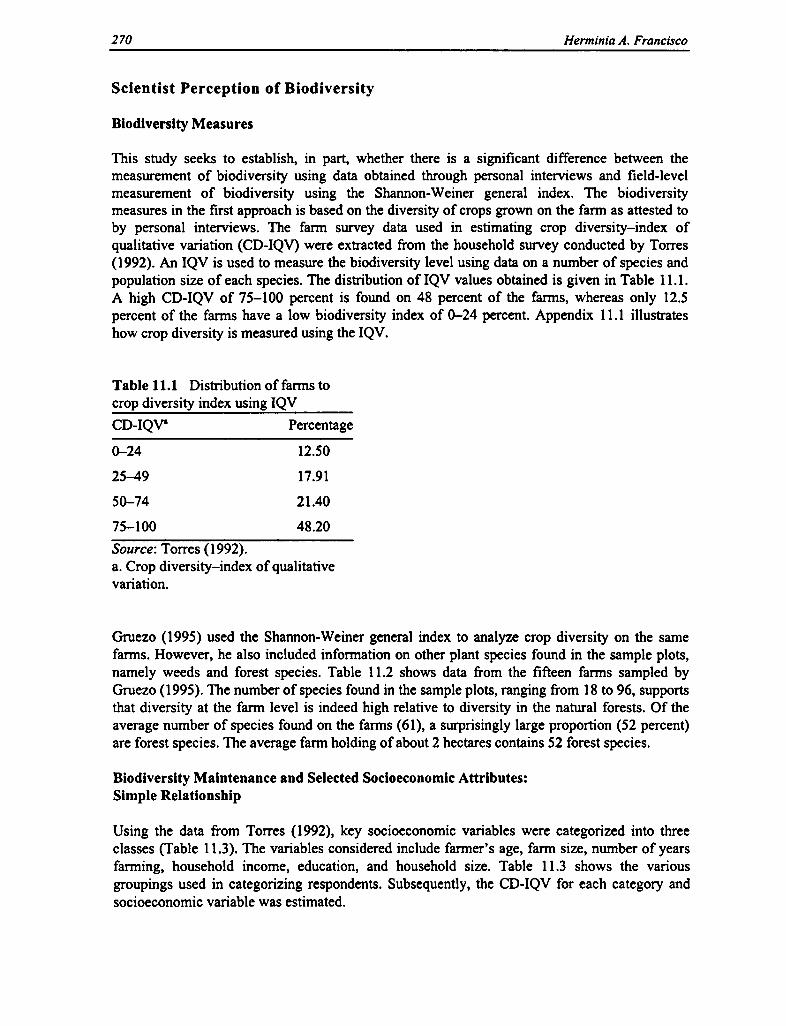
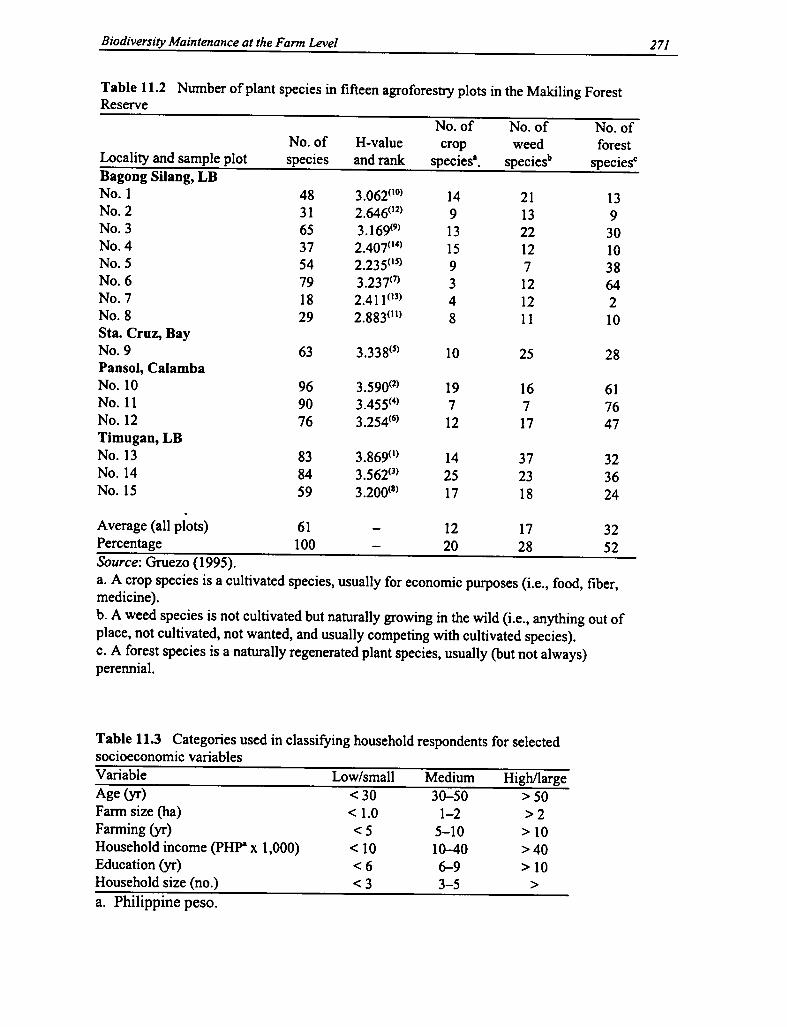
Chapter 5
The Dilemma of Dairy Cattle Projectin Upper Citarum River Basin
Budhi Gunawan, Oekan S. Abdoellah,and Erwin Purnawan
Introduction
Poverty alleviation in Indonesia has been conducted through several programs,' including thedairy cattle industry intended to increase the availability of animal protein in Indonesia and toimprove the socioeconomic status of the people and to develop small home industries. Dairyprojects, in many cases, are developed in upland villages due to its ideal climate for cattleraising. Some projects are located in villages close to the forest, which is probably not acoincidence. The government develops such projects in an attempt to take pressure off the forest.As commonly accepted, poverty is often accused as a factor behind forest encroachment.
Studies indicate that there are several benefits to such projects. They are believed to haveimproved the socioeconomic status of the cattle-raiser families, thus contributing to the effort ofalleviating people poverty. The program is also considered helpful in conserving foreignexchange by lessening milk imports (Datta and Harun 1978; Siagian 1988; Danuwijaya 1983,cited by Sumantri 1984) and in contributing to the national procurement of animal protein andproduct.
On the other hand, many problems also appear along with the successes. Especially in the uplandareas, the problem is complicated by lack of grazing land. In such areas, people tend to prefer tocultivate their own land with vegetables instead of using it as grazing land or planting it withgrass. In West Java, for instance, cultivation is being extended farther up the mountains everyyear as the landless endeavor to earn a living from the soil (Hardjono 1990). As a consequence,lack of grass plagues the cattle farmers. The forest becomes a major source of fodder for thecattle, and perhaps resulting in damaging pressure on the forest.2
This paper discusses development of a dairy cattle project in the Upper Citarum River Basin,West Java. It is a good case showing the role of the forest in subsidizing the project. It is also agood example of difficulties of planned interventions, which may have the opposite effects ofthose intended. It describes the impacts of a poorly designed project to the forest in particularand to the condition of biodiversity of the area in general. In this study, Taruma Jaya village,located in Upper Citarum River Basin at the foothills of Mount Wayang, was selected as thestudy site.
The study employed a combination of qualitative and quantitative approaches that included (1)interviews with key informants, purposely selected based on the objective of the interview; (2)the use of an interview guide and interviews with villagers in two subvillages of Taruma Jayavillage, randomly selected from a list of population; and (3) the use of an interview schedule in asocioeconomic survey. This survey was intended to reveal accessibility and the level of
113

114 Budhi Gunawan, Oekan S. Abdoellah, and Erwin Pu rnawan
Table 5.1 Dairy cattle population and growthNumber of dairy cattle
Year Indonesia West Java District of Bandung
1989 287,665 91,046 51,283
1990 293,878 104,580 61,271
1991 306,290 107,087 69,551
1992 312,226 108,218 73,871
1993 350,729 113,803 78,404
Sources: Directorate General of Livestock Service (1994);
Office of Statistics, Kabupaten (District) of Bandung (1995).
population pressure on the resources of Mount Wayang forest as well as the surroundingenvironment. The number of respondents was determined by applying the Lynch, Hollnsteiner,and Covar formula (1974). In addition, the use of rapid appraisal for biodiversity maintenance(Gunawan et al., this volume) was helpful in understanding the issues on dairy cattle develop-ment related to resource uses, qualitatively.
Development of Dairy Cattle in Indonesia
Development of dairy cattle raising in Indonesia, specifically in relation with poverty alleviation,began intensively in the third Pelita (Pembangunan Lima Tahun, or five-year development,1979-84) with the import of dairy cattle from New Zealand. Cattle were distributed to farmers ina credit scheme—one or two cows per farm family (Leman 1987).
In the late 1970s, the population of dairy cattle in Indonesia was about 90,000. Within twodecades the population had increased almost fourfold.' Statistical data indicate that in 1993 therewere 350,729 dairy cattle (Table 5.1). Considering the large area of Indonesia,' however, even atthis level, the dairy cattle population could be considered low. Moreover, it is not distributedevenly. In the province of West Java, in 1993, there were 113,803 dairy cattle. In the district ofBandung alone, the population of dairy cattle is almost a quarter of the total cows of Indonesia.The Kantor Statistik Kabupaten Bandung (1994) reports that in 1993, there were 78,404 dairycattle owned by farmers in the district of Bandung, West Java (Table 5.1).
The Taruma Jaya Village
Situated about 40 km southeast of Bandung municipality, Taruma Jaya village is located about1,500 meters above sea level in the northeast foothills of Mount Wayang, where the headwatersof Citarum River originates. Temperature of the area varies between 15°C and 19°C. An asphaltroad connects the village to the focal point of Majalaya subdistrict, a center of textile industrynorthwest of the village, and Pangalengan subdistrict, a center of dairy industry in southernBandung west of the village. Having accessibility to Majalaya, Bandung, and other cities, thevillagers can easily market their agricultural products. Likewise, trucks from Pangalengan canreach the village to take milk products from the farmers in this village.
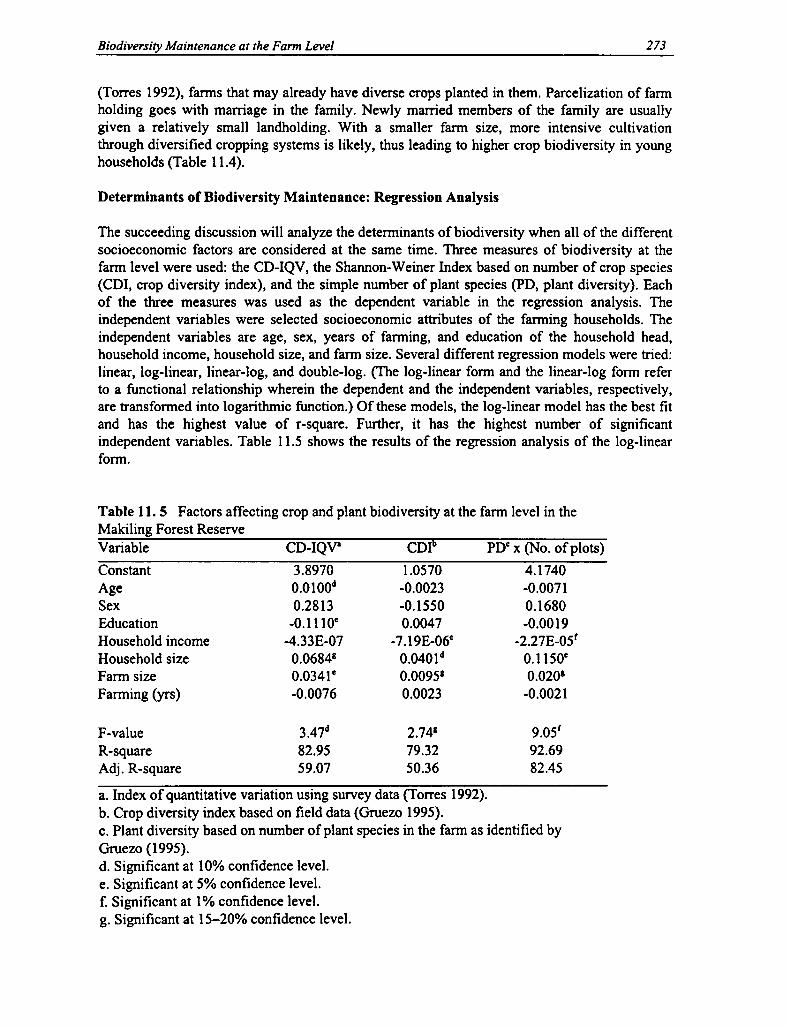
Dairy Cattle Project in Upper Citarum River Basin 115
The total area of Taruma Jaya village, administratively, is about 2,743 ha. The majority of thearea, however, lies in tea estates, belonging to a joint-venture company, and a state forest-1,580ha (57.6 percent) and 1,035 ha (37.7 percent), respectively. The rest lies in agricultural lands andsettlement areas that belong to the local people-89 ha (3.2 percent) and 17 ha (0.6 percent),respectively.
In 1993, the population of Taruma Jaya village was 10,463, consisting of 2,622 families. It hadincreased from 8,477 people in 1980. During this period (1980-93), the population growth ratewas 1.6 percent. The population density of the village was 400 persons per km2, which was lowerthan the population density of the entire Upper Citarum River Basin at 519 per km2 (World Bank1989) and much lower than the average population density of West Java province at 819 per km2.If population density is calculated on a basis of the ratio between population and lands ownedand accessible to the people, however, then the population density of Taruma Jaya is very high,at 9,900 persons per km2.
The out-migration rate of the village is unknown, but it appears to be very low. Likewise, thereare no figures on in-migration; but several years ago many people who had previously worked aslaborers at the tea estate, together with their families, moved into the village after they retired.Having no land in the village, many of them built houses on the riverbank of the Citarum, just500 to 1,000 meters away from its headwater. They also built cattle pens beside their houses.Occupation of such land is actually forbidden, but the settlers claimed to have permission fromthe officials of the forest agency.
The majority of families in Taruma Jaya rely on agricultural resources. However, most of thefamilies are landless. Our data survey indicates that only 29 percent of the households ownagricultural land. Accordingly, we can assume that only about 760 families own agriculturalland, with an average holding of less than 1,500 m 2 . (Our survey shows that 12.5 percent of therespondents own less than 1,000 m2; 6.3 percent own between 1,000 m 2 and 2,000 m2; 5 percentown between 2,000 m2 and 4,000 m2; and 5 percent own around 5,000 m2 or more.)
The majority of the landless families depend for their livelihood on working as farm laborers. Inthe past, some of them were sharecroppers for the landowners. Since commercial crops havecome to dominate the agricultural sector, the sharecropping system is no longer applied bypeople and a leasing system has now become the most common system in land cultivation.
Before 1987, the people of Taruma Jaya, especially those without land, planted vegetables inforest land under the tumpangsari programs coordinated by the forest agency. Our survey showsthat 52.5 percent of respondents claimed to have been involved in such programs, of whom 35percent were landless. Tumpangsari in the Upper Citarum River Basin has now been completelyprohibited due to its negative impact on the environment. It is said to cause erosion in theupstream area and flooding in the downstream area." Although the program is no longerimplemented, some villagers still plant vegetables in forest land but without the formalknowledge of the forest agency.'
Lack of landownership forces some of them to develop other sources of livelihood. Recently,some families have developed dairy cattle raising as a new, principal source of income.Unfortunately, there are no official figures showing the number of families who raise cattle; butour survey shows that 49 percent of the respondents raise dairy cattle, of whom 33.5 percent arelandless.
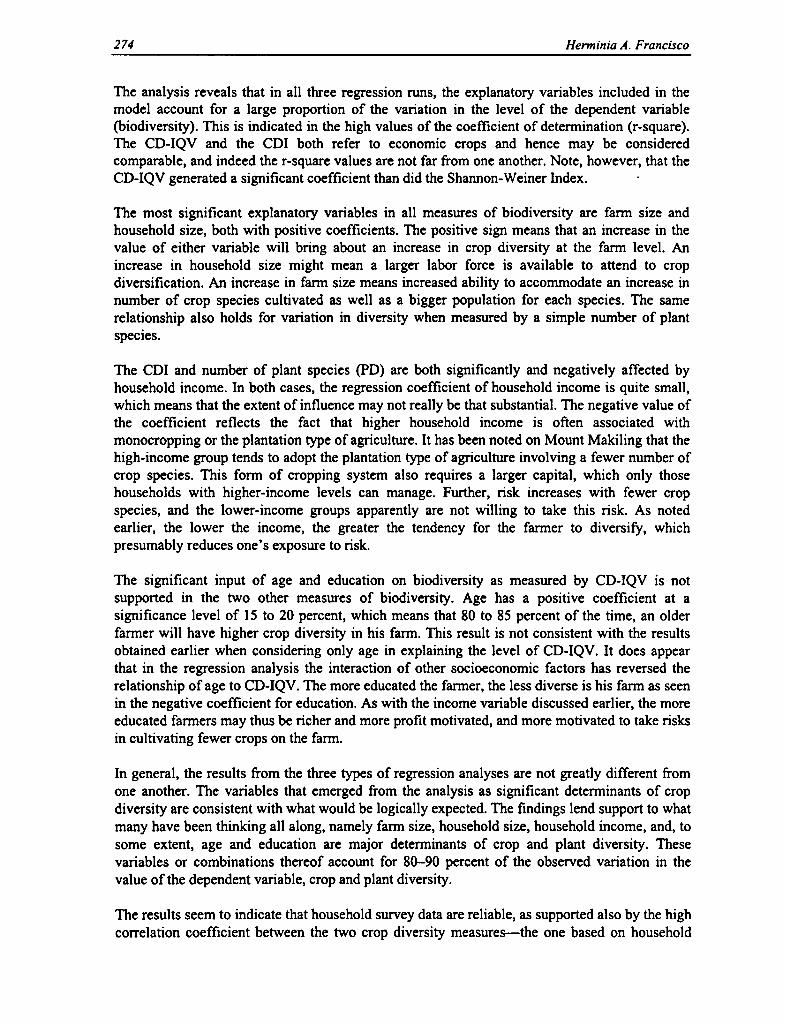
116 Budhi Gunawan, Oekan S. Abdoellah, and Erwin Purnawan
Dairy Cattle Project in Taruma Jaya
Raising of dairy cattle actually has long been done by a few people in Taruma Jaya. But it hasexpanded rapidly since the 1970s when the government started providing credit for dairy cattlethrough a program called Bantuan Presiden (Banpres), or Presidential Aid Program, which gavethe farmers dairy cattle in a credit package. e This program was continued under the managementof the Koperasi Peternak Bandung Selatan, KPBS (Southern Bandung Dairy FarmerCooperative) .9 The cattle were imported from Australia, the United States, and New Zealand.Dairy cattle from New Zealand were most favored by the farmers.
The KPBS covers twenty-one villages in three subdistricts, namely Pangalengan, Kertasari, andPacet. Organically, the KPBS is divided into several Komisariat Daerah (Komda), or regionalcommissariats, which include 223 groups of dairy cattle farmers. Membership of the KPBSincreased from 616 farmers in 1969 to 7,489 in 1991, while the number of cattle increased from2,608 in 1969 to 14,927 in 1991. In 1994, there were 21,000 dairy cattle.1°
The dairy cattle farmers in Taruma Jaya are grouped into eleven farmer groups under threekomda, namely Komda Goha, Komda Citawa, and Komda Kertasari. As mentioned earlier, thereare no total figures for cattle and cattle farmers for the village, but our survey shows that thereare 333 cattle farmers and 865 cattle in Komda Goha, which covers our study site. Similarnumbers of farmers and cattle can be assumed for Komda Citawa and Komda Kertasari, whichyields a figure of almost a thousand cattle farmers and two thousand cattle in Taruma Jayavillage.
The dairy cattle-raising program in Taruma Jaya is well received by the villagers. There areseveral reasons for the villagers to engage in this activity: (1) the suitable climate of Taruma Jayavillage for cattle raising, (2) accessibility of farmers to the forest area in Mount Wayang, whichprovides resources (e.g., fodder and fuelwood) required for cattle, (3) the majority of the peoplein Taruma Jaya are landless and, in the case of Taruma Jaya, raising dairy cattle requires a smallpiece of land for the cattle pen, (4) dairy cattle raising provides them a regular and relativelystable cash income, and (5) as members of the KPBS, all requirements, such as feed and medicaltreatment, for their cattle are guaranteed and supplied by the KPBS. In addition, the farmers canbuy their daily needs by credit from the KPBS.
The Nature of Dairy Cattle Raising
Raising dairy cattle requires a significant capital outlay for cattle, pens, and the cost ofoperations. For many people, this is difficult to afford, but the regular cash income generatedfrom milk production, among others, still attracts them to this activity.
Ownership System
There are two systems of cattle ownership in Taruma Jaya village. In the first, the owners raisethe cattle by themselves, and in the second, the nonowners raise someone else's cattle based on asharing system called ngagaduh. In the second type, the cattle owners provide capital for cattleand concentrate—a mixture of food consists of soy bean, corn, vitamin, etc.—while theircounterparts provide pens, grass, and labor to manage the cattle. All of the yields, milk and

Dairy Cattle Project in Upper Citarum River Basin 117
calves, are divided equally. Our survey data indicate that a little more than 10 percent raise cattlebased on this sharing system.
Economics of Dairy Cattle Raising
Initial Capital. In 1995, to raise a productive dairy cow, people had to spend aboutIDR1,500,000 to IDR2,000,000 (US$667 to US$887)" to buy a cow. It can be bought with cashor credit from the cooperative (KPBS). Recently, however, only those who already have at leasttwo cattle can apply for credit, based on the assumption that the farmer must have a source ofincome sufficient to pay the monthly installment before the new cow becomes productive. Thefarmers are charged 2.5 percent monthly interest, yielding a monthly installment of IDR50,000.Once the new cattle becomes productive (able to produce milk), the farmers are obliged to payIDR100,000 in monthly installments until the debt is totally paid.
Aside from the capital spent for the cattle, the farmer must spend money for cattle pens. Sincemost of the farmers make the pens by themselves and the wood required for this is taken fromthe forest, it is difficult to calculate the inputs. But they would have to spend about IDR100,000if they hire someone else to make the stable. Almost every year, they also have to spend aboutIDR15,000 to repair their pens.
Operational Cost and Profit. As indicated, the initial cost of cattle raising is somewhat high, butthe relatively stable price of milk and regular cash income still attract the villagers to engage inthis activity.
A dairy cow needs one pikul of grass (40-50 kg) and about 9 kg concentrate of corn, soy bean,vitamin, etc., per day. Therefore, in one month, one head of cattle consumes about 30 pikuls ofgrass and 270 kg (9 sacks) of feed. In addition, some farmers feed the cattle with about 3 kg ofsalt each month. Vaseline is also needed for milking, which totals 0.5 kg a month. In 1995, allthese requirements cost the farmers about IDR146,500 per month.
A productive cow, according to the farmers, is able to produce an average of 15 liters of milk perday.
12 Therefore, in one month about 450 liters of milk is produced by an average cow. In 1995,
the farmers sold the milk to the cooperative" for IDR560 per liter and obtained about1DR252,000 per month.
Thus, the farmers' monthly profit from one cow in 1995 was about IDR105,500. The actualprofit could be higher than this. Our field data indicate that the majority of the cattle farmerscollect grass by themselves, and thus nothing was spent for this. By so doing, the farmers' profitwas about IDR150,900 per month from a cow. With this income, to live above the poverty line"a family has to own 2-3 cattle (or raise 4-6 cattle in the sharing system). As indicated earlier,cattle farmers in Taruma Jaya own 2-3 cattle per family on the average.'S
Labor
Dairy cattle raising as practiced by Taruma Jaya people is actually a smallholder, household-based system. Labor is mostly provided by the family, including the male head of the household,his wife, and children. Members of the family are involved in all farming jobs, and by doing so,nothing is spent to hire outside labor. In some cases, however, especially among those who haverelatively large numbers of cattle, outside labor is also involved.
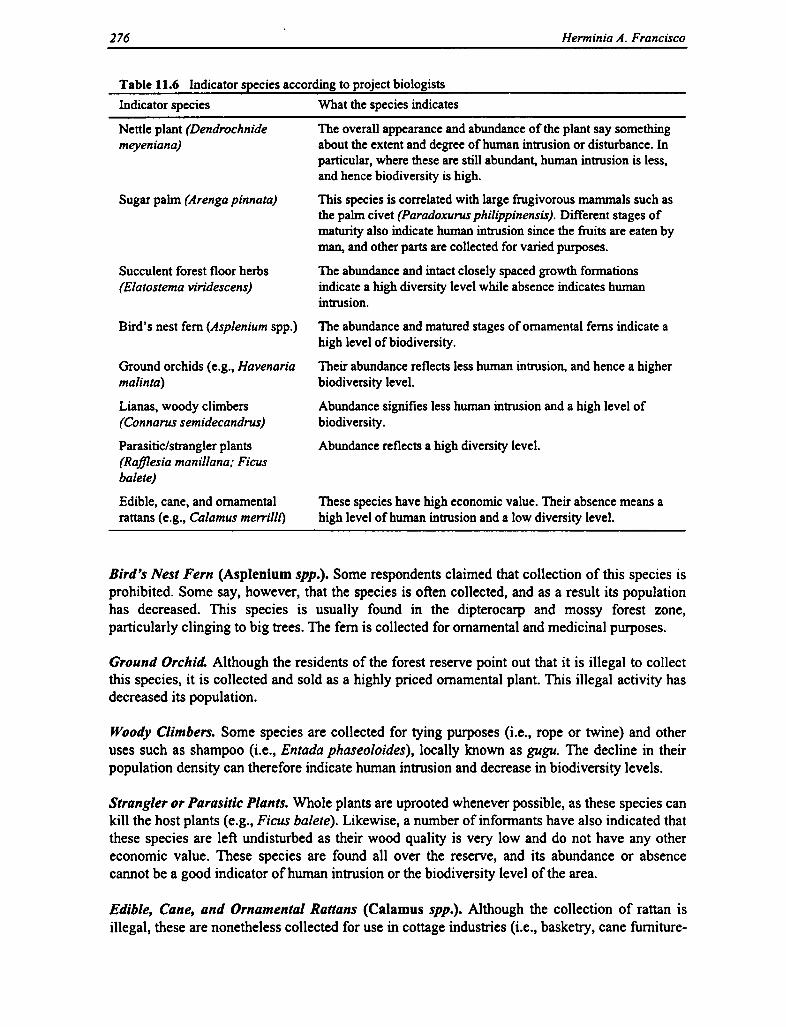
118 Budhi Gunawan, Oekan S. Abdoellah, and Erwin Pu rnawan
Taruma Jaya has no grazing land and, as indicated by our survey, only about one-fourth of thecattle owners plant grass. Therefore, the majority of the cattle owners have to collect grass,mostly in the state forest of Mount Wayang, in cash-crop fields, along the Citarum riverbanks,around the settlement areas, or even in the tea estates. Some cattle owners, in fact, do not collectgrass by themselves; they buy grass from a tukang ngarit (grass collector) on a regular basis.One pikul of grass (40-50 kg) costs IDR1,000 to IDRI,500. A grass collector is able to collect 2-3 pikuls of grass or more per day.
Cattle owners may also get grass from laborers hired on a monthly basis. The laborers are paidIDR75,000 to IDR80,000 per month. In return, they have to collect 2 pikuls of grass each day. Ifthe laborers do additional work, they may earn more income. In this regard, the laborers can earnabout IDR100,000 a month for 2 pikuls of grass daily and, in addition to this, they are obliged toclean the cattle pen and bathe the cattle. The laborers may also get IDR130,000 in compensationfor the daily activities of collecting 2 pikuls of grass, cleaning the cattle pen, bathing the cattle,milking, and carrying the milk to the collection center.
Constraints
In raising dairy cattle, the main problem hampering the cattle raisers in Taruma Jaya village islack of grass. It is experienced especially in the dry season. Theoretically, I hectare of land,which is intentionally planted with grass, can produce on average 100 tons of grass per year. Ifone head of dairy cattle needs 40-50 kg of grass per day, this amounts to 14.6-18.25 tons ofgrass per year. Thus, 1 hectare is actually able to support only 5-7 cattle. Using this calculation,more than 125 hectares of land planted with grass is required to fulfill only the grass needs of thedairy cattle in Komda Goha. Many more hectares would be required to support the dairy cattle inall of Taruma Jaya.
As a matter of fact, there is no grazing land in Taruma Jaya and even private lands are lacking.The 100 hectares belonging to the villagers is used for settlement, agriculture, and teacultivation. Thus, it is a big problem for farmers to feed their cattle if they rely only on theirland. Our survey data indicate that about one-fifth of the cattle owners own land planted withgrass, but the yield is still not enough to feed their cattle.
In the wet season, grass is relatively easy to find but not so in the dry season. When grassbecomes scarce, especially certain species of grass regarded as good for cattle, such as Eleusineindica and Paspalum distichum and including herbs such as Erechtites valerianifolia, the cattlefarmers must compete with one another to get it. We also observed that cattle owners or grasscollectors are forced to get grass from as far away as Bandung municipality where grass isregarded as a weed, not a source of food for cattle. Even so, for the majority, grass is stilllacking.
To deal with this, farmers use crop residues, 1 ' fodder from the forest, or plants that areintentionally grown for cattle food such as bananas (Musa sp.) and sweet potatoes (Ipomoeabatatas); vegetable waste from cash crops such as cabbages (Brassica oleraceae var. capitata),carrots (Daucus carota), or potatoes (Solanum tuberosum); and forest plants like wild bananas(Musa acuminata), Macropanax dispermum, Ficus fistulosa, F. ribes, Boehmeria platyphylla,and Bryonopsis laciniosa.

Dairy Cattle Project in Upper Citarum River Basin 119
Aside from the lack of grass, poor quality of milk, which is rejected by the cooperative, isanother problem hampering cattle raisers. It is a common phenomenon that dairy farmerssometimes get poor quality of milk due to poor milking techniques, low quality of food,"mastitis" disease among the cows, or poor sanitation." To avoid rejection of milk by thecooperative, some farmers "pasteurize" their milk by boiling it up to 60°C. This is believed tohave minimum effect on milk quality (e.g., fat content). Hence, they are still able to sell theirmilk for a relatively good price. The profit mentioned earlier is actually an optimistic figure ifthe cattle farmers do not undertake such a specific treatment to preserve their cattle milk.
Impacts of the Project
Dairy cattle raising is attractive to many people in Taruma Jaya for a number of differentreasons. Aside from the benefits that farmers can obtain, however, dairy farming in this villagehas created some negative impacts on both the physical and social environment. On the physicalside, it has caused pressure on the forest resource to be more intense while on the social side, ithas caused, for instance, a tendency of social disharmony among the villagers.
Pressure on the Forest Resource
The need for cattle feed and lack of land to produce themselves force farmers to collect grass inMount Wayang forest (and some also take it from Mount Bedil in the northwest, and MountWindu southeast of Mount Wayang). Since many farmers go to the forest to collect grass, it isdifficult to find, especially in the dry season. Therefore, the farmers substitute grass with treefodder. Our study of the floristic diversity of Mount Wayang showed that in the dry season somespecies (e.g., Musa acuminata) become difficult to find (see Parikesit, Djuniwarti, andHadikusumah, this volume). We suspect that this is related to the dairy farmers' gathering offorest fodder for their cattle.18
Some farmers formerly cooperated with the forest agency (Perum Perhutani) in planting grass inthe forest. In 1987, they paid to lease land from the forest agency, but the lease was terminated in1988 due to infringement by farmers who planted vegetable crops instead of grass. Somevillagers still plant grass and vegetables but with and without the knowledge of the forestagency. There is frequent collusion between the farmers and local officials of the forest agencyregarding cultivation of the forest land.19
Exploitation of forest resources for dairy cattle involves not only the taking of grass and forestfodder but also the cutting of trees for building materials and fuelwood. Interviews with thevillagers indicate that about one-half of the cattle farmers took wood from the forest to buildtheir stables. They also use fuelwood to preserve milk. Our survey indicates that one-third ofthem use fuelwood to preserve milk, one-third claim that they have never used fuelwood topreserve milk, and another one-third claim that they never use fuelwood to preserve milk.2°
When taking timber or fuelwood from Mount Wayang forest, the villagers prefer to take treesfrom the middle zone instead of at the peak or foothills. They argue that it is risky to take treesfrom the foothills, where officials of the forest agency often conduct patrols, and it is too far forthem to take trees from the peak area. The villagers are permitted to take fuelwood freely fromthe forest area only when they collect plants considered to be weedy species, such asChromolaema odorata, Lantana camara, or Brugmansia suaveolens.
120 Budhi Gunawan, Oekan S. Abdoellah, and Erwin Purnawan
The taking of wood from the forest is usually not one day's work. In the case of big trees, theywait several weeks or months, cutting the tree bit by bit, using the pieces for fuelwood, andletting the wind fell the tree. In this way, the officials of the forest agency cannot arrest them forfelling the tree.
In the past, certain tree species, such as (Lithocarpus sp.) and the endemic species of Jamuju(Podocarpus imbricatus), were preferred for building materials and even for fuelwood. However,there are now no specification for such preferences; the villagers perforce cut small trees fortimber for their stables and lop tree branches for fuelwood.
Our study of the floristic diversity of Mount Wayang forest (see Parikesit, Djuniwarti, andHadikusumah, this volume) found that in the middle zone between the peak and the foothills, theabundance of trees categorized as pole and sapling was relatively low and the structure conditionof the vegetation was generally more fragmented than in the other zones. The study related thisto villagers' strategy in cutting the trees and avoiding the forest guards, as mentioned earlier.
Social Disharmony
The dairy cattle project has had not only physical but also social impacts. An obvious impact onthe social aspect is the occurrence of social conflict among members of the community. Asdescribed earlier, grass is difficult to find, especially in the dry season. Thus, the cattle raiserssubstitute grass with forest tree fodder, crop residues, or herbaceous plants intentionally plantedas reserve cattle food. This, in certain conditions, causes disharmony in the community. It isoften reported that farmers have lost the grass they planted on their land or in the forest, or thattheir banana tree was stolen by other farmers. This often ends with conflict or threat of violenceby farmers against the accused thieves. To protect banana trees from being stolen, the ownersinsert needles into the trunk. This is actually dangerous to the cattle, but the farmers say that thenthey will know who stole the plants by observing the thieves'sick cattle.
Conflict among the community may also be latent. As mentioned earlier, some cattle owners,with the knowledge of forest guards, plant grass in forest lands. This may, in turn, motivate othercommunity members to plant vegetables in forest land, without the guards' knowledge.
Conclusion
The development of dairy cattle raising in Taruma Jaya village shows that it may be an answer tothe problem of poverty. Its ability to involve landless people has lessened dependency of thelandless on agricultural activities. The relatively stable income offered by this activity tends tomotivate people to involve themselves in this activity as much as possible.
Development of dairy raising in Taruma Jaya, however, might not have been possible withoutany "subsidy" from the forest. The location of the village close to Mount Wayang forest allowsthe cattle raisers to use the forest resources for their cattle. In this regard, the cattle project has infact turned out to be a good way of draining forest resources out of the forest, and this mayindicate an example of a linkage between nature and culture and also an unrecognized linkagebetween the two (Pandey and Singh 1984).

Dairy Cattle Project in Upper Citarum River Basin 121
Unfortunately, dairy cattle raising is disadvantageous in other aspects, such as its negativeimpacts on the environment. On the physical side, dairy raising has contributed to theencroachment and exploitation of forest resources, which in turn have affected the forest, andalso has caused pollution that might have further impacts on agricultural activities. On the socialside, the project has created resource-related tension and conflict among community members.
In general, this case study of dairy cattle raising in Taruma Jaya shows that in the short term it isable to promote poverty alleviation by creating an alternative source of income for landlessfamilies. In the long term, however, it creates negative impacts on the environment. The lack ofcontrol over its practices and the size of cattle population may marginalize both the physical andsocial environment. Forest resources, which are in effect subsidizing the cattle industry in thisarea, are diminishing and may not be able to continue to fulfill all the required needs and, in turn,the dairy cattle industry in this area may collapse.
Thus, considering the positive and negative impacts of the project, further development of dairyfarming in this area should take into account the carrying capacity of the land. Management ofland (Drinkwater 1991) and its maximization for grass planting should be conducted and thecattle population should be limited. Technological improvement is also required to preservegrass for use during the dry season.
Notes
1. Poverty among the population of Indonesia was a salient phenomenon in the 1960s. In the late 1960swhen the first Pembangunan Lima Tahun, Pelita (five-year development) began, an estimated 60 percentof the population lived under poverty line. Since then, the level of poverty has decreased significantly. In1996 only 14 percent (about 27 million people) of the population lived under poverty line (PidatoKenegaraan Presiden Republik Indonesia [State of the Nation Address], 16 August 1996).2. The potential impacts of cattle projects, detrimental to both physical and social environment, areillustrated by a (beef) cattle project in the Highlands of Papua New Guinea (Grossman 1984). The projectwas actually beneficial to the people in the short term but it turned out in the long term to be detrimental toboth environment and people. The cattle's population grew and exceeded the carrying capacity of the area,overgrazing occurred, and the project detrimentally affected the social organization of the community.3. The increase of dairy-cattle population was accompanied by an increase of milk production and increasein milk consumption of the people. The national production of milk in 1969 (Pelita I) was about 28,900tons, which increased to 72,200 tons in 1979 (Pelita III) and to 412,500 tons in 1993 (Pelita V).Meanwhile, the national per capita consumption of milk in 1969 was about 1.46 kg. It increased to 3.72 kgin 1979 and to 4.39 kg in 1993.4. Indonesia consists of twenty-seven provinces. Every province is divided into several districts.5. Tumpangsari program is a government program involving local people in the management of the forest.In this program, people are allowed to cultivate the forest land from one to three years, along with thereforestation program. In this regard, the cultivators are obliged to take care of the newly planted trees.6. An example of the problems caused is described as follows: In the dry season of 1986 the forest agencyallowed people to plant vegetables on the cleared land under the tumpangsari program, although most ofthe slopes exceeded 45 degrees. After several weeks of extremely heavy rain at the end of the wet season,water flowing down the slope carried off both cabbage plants and topsoil. In the downstream area, floodwaters caused a sudden flood that drowned five people (Hardjono 1990). Floods are actually not a newphenomenon for people in downstream areas. In the villages of Ranca Kasumba, Bojong Emas, and Sapan,among others, floods have been reported at least since the 1960s, but their impacts were not as severe asthe floods of the 1980s and 1990s. With regard to the linkages between upstream land use and downstreamflooding, however, Hamilton and King (1983) reveal that, in some cases, they are myths; but it is true that

122 Budhi Gunawan, Oekan S. Abdoellah, and Erwin Pu rnawan
on sloping land, removing the vegetative cover by clearing forest, cultivating the soil in planting orweeding, and taking off the crop in harvesting have resulted in soil erosion by water.7. Lack of forest agency personnel is the reason behind this. They cannot guard such a wide area of forest.But interviews with villagers also indicate that in some cases, they have been caught by forest guards andthen released after bribing the guards with part of their yields.8. Prior to the banpres program, only six farmers raised cattle.9. In Bandung district there are six cooperatives that organize dairy cattle farmers: KPBS in Pangalengansubdistrict, KPSBU in Lembang subdistrict, KUD Sinar Jaya in Ujung Berung subdistrict, and three othercooperatives in the subdistricts of Cisarua, Ciwidey, and Soreang. The KPBS serves three subdistricts:Pangalengan, Kertasari, and Pacet.10.To meet the increased demand for milk production, the KPBS plans to reorganize its organization byreducing its membership from about 8,000 to 5,000 and helping its members to raise up to 15 dairy cattleeach to obtain better profits. The cooperative calculates that the number of dairy cattle in the area coveredby the cooperative could be increased to 45,000 cattle (Pikiran Rakyat, 17 October 1996).11.US$1 is equal to IDR2,250.12.Within ten months, a productive dairy cow is milked for as long as seven months, every day. For twomonths before and one month after a calf is born, milking is suspended. A dairy cow is consideredunproductive after calving seven times.13. In some cases, the farmers sell milk directly to the consumers for a higher price. This is actually aninfringement to the agreement between the cooperative and the farmers. Except for grass, the cooperative isobliged to supply all requirements in dairy cattle raising. In return, the farmers are obliged to sell all oftheir milk to the cooperative.14. According to Sayogyo (1988), to live above poverty line, a person has to earn a minimum annualincome equivalent to 480 kg of rice. At the time of the study, 1 kg of rice cost IDR1,250 on average. Thus,a person had to earn an annual income of IDR600,000 to be above the poverty line. Assuming that theaverage household size in Taruma Jaya is 4.5, a family has to earn an annual income of at leastIDR2,720,000.15. The average cattle ownership of all KPBS members throughout southern Bandung is 3-4 cattle(Pikiran Rakyat, 17 October 1996).16.It is reported that in West Africa and parts of sub-Saharan Africa, up to 45 percent of the annual feedintake by the (beef) cattle population is from crop residues, and up to 80 percent during critical periods(Sanford 1989). In the study site, along with the increase of competition among cattle owners, there is atendency that the cattle owners, in order to get rights to use the residue from farm owners, assist farmowners to harvest their crops.17. Lack of land forces farmers to locate their cattle pens beside their houses. Farmers are also forced todiscard cattle dung directly into the creek or river because of lack of land to dump it before using it asorganic fertilizer. The cattle farmers actually understand the benefits of cattle dung for cooking or lighting,and even the cooperative had trained them in alternatives to dumping it into the river. Survey data indicatethat there is almost no one who used cattle dung as a source of biogas for cooking and lighting, and morethan one-half of the cattle farmers dispose of the waste directly into the river.18.Hamilton and King (1983) reveal that overharvesting of forest fodder may result in death of trees.19. According to Soule (1991), there are many reasons for the inability of states to enforce laws andimplement conservation policies, especially policies that require short-term sacrifices for the sake of long-term benefits.20. Dependency of the Taruma Jaya people on fuelwood is very high. Our survey data indicate that 82.5percent of the villagers use fuelwood for cooking. They claimed that fuelwood functions not only forcooking but also to keep their houses warm. They also said that they put seed crops above the hawu(traditional stove) to preserve them. Thus, they believe that fuelwood has more benefits for them thankerosene-55 percent of the respondents take fuelwood from the forest by themselves, 17.5 percent take itthemselves or buy it from fuelwood gatherers, and 10 percent buy only from fuelwood gatherers; 17.5percent of the respondents claimed that they do not use fuelwood. The average volume of fuelwood usedby the villagers varies between 1 and 6 pikuls of fuelwood a week, depending on the kind of wood and theuse to which it is put. Regarding the use of fuelwood, McNeely et al. (1995) reveal that in India, the

Dairy Cattle Project in Upper Citarum River Basin 123
fuelwood demand for baking bricks (to support the unceasing expansion of Calcutta) is leading to the slowdemise of the world's largest mangrove forest in the Sundarbans.
References Cited
Datta, M., and Harun. 1978. Laporan Penelitian Hijauan Makanan Ternak (Untuk Sapi Perah) (Report onthe study of livestock fodder.) Bandung, Indonesia: Fakultas Peternakan Universitas Padjadjaran (inIndonesian).
Directorate General of Livestock Service. 1994. Statistical book on livestock. Jakarta, Indonesia.
Drinkwater, Michael. 1991. Cows eat grass, don't they? Evaluating conflict over pastoral management inZimbabwe. In Bush base: Forest farm, culture, environment, and development, ed. Elisabeth Croll andDavid Parkin. London, New York: Routledge.
Grossman, Lawrence S. 1984. Peasants, subsistence ecology, and development in the Highlands of PapuaNew Guinea. New Jersey: Princeton Univ. Press.
Hamilton, Lawrence S., and Peter N. King. 1983. Tropical forested watersheds: Hydrologic and soilsresponse to major uses or conversions. Boulder: Westview Press.
Hardjono, Joan. 1990. The dilemma of commercial vegetable production in West Java. Project WorkingPaper Series No. B-2, West Java Rural Non-farm Sector Research Project, PSP-IPB, ISS, PPLH-ITB,Bandung, Indonesia.
Kantor Statistik Kabupaten Bandung. 1994. Kabupaten Bandung Dalam Angka (Statistic of District ofBandung) (in Indonesian).
Leman, Lina. 1987. Laporan Tinjauan Pola Peternakan land base dan non-land base Usaha Ternak Sapi(Report on analysis of land base and non-land base dairy cattle business). Bogor, Indonesia: Faperta InstitutPertanian Bogor (in Indonesian).
McNeely, J. A., M. Gadgil, C. Leveque, C. Padoch, and K. Redford. 1995. Human influences onbiodiversity. In Global biodiversity assessment, ed. V. H. Heywood, 710-821. Cambridge: CambridgeUniv. Press.
Pandey, Uma, and J. S. Singh. 1984. Energy-flow relationship between agro- and forest ecosystems incentral Himalaya. Environmental Conservation 11(1): 45-53.
Sanford, S. G. 1989. Crop residue/livestock relationship. In Soil, crop, and water management in theSudano-Sahelian zone: Proceedings of an international workshop (11-16 January). Niamey, Niger:ICRISAT Sahelian Center.
Sayogyo. 1988. Masalah Kemiskinan di Indonesia: Antara Teori dan Praktek (Poverty problem inIndonesia: From theoretical and practical perspectives). Mimbar Sosek Jurnal Sosial-Ekonomi Pertanian,no. 2:1-14 (in Indonesian).
Siagian, Sondang P. 1988. Proses Pengelolaan Pembangunan Nasional (Management process of nationaldevelopment). Jakarta, Indonesia: Gunung Agung (in Indonesian).
Soule, Michael E. 1991. Conservation: Tactics for a constant crisis. Science 253:744-50.
Sumantri, M. A. 1984. Petani Peternak Sapi Perah dan Pengembangannya (Dairy cattle farmer and itsdevelopment). Malang, Indonesia: Universitas Brawidjaya (in Indonesian).
World Bank. 1989. Indonesia: Forest, land, and water. Report No. 7822-IND.
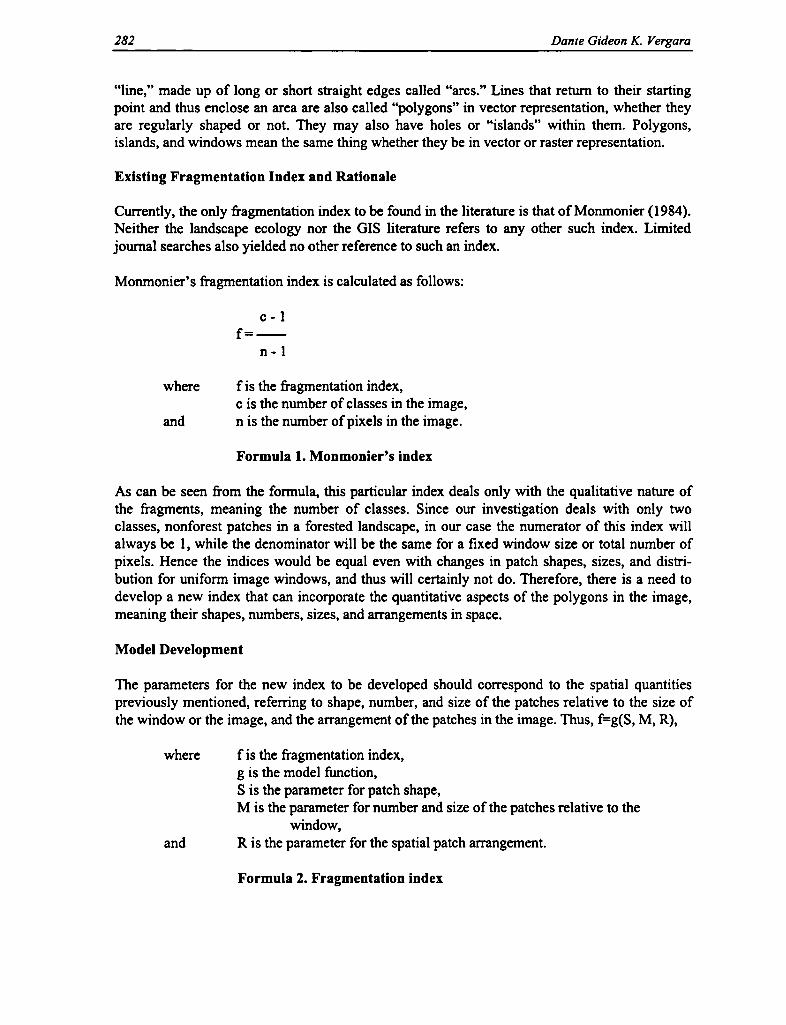
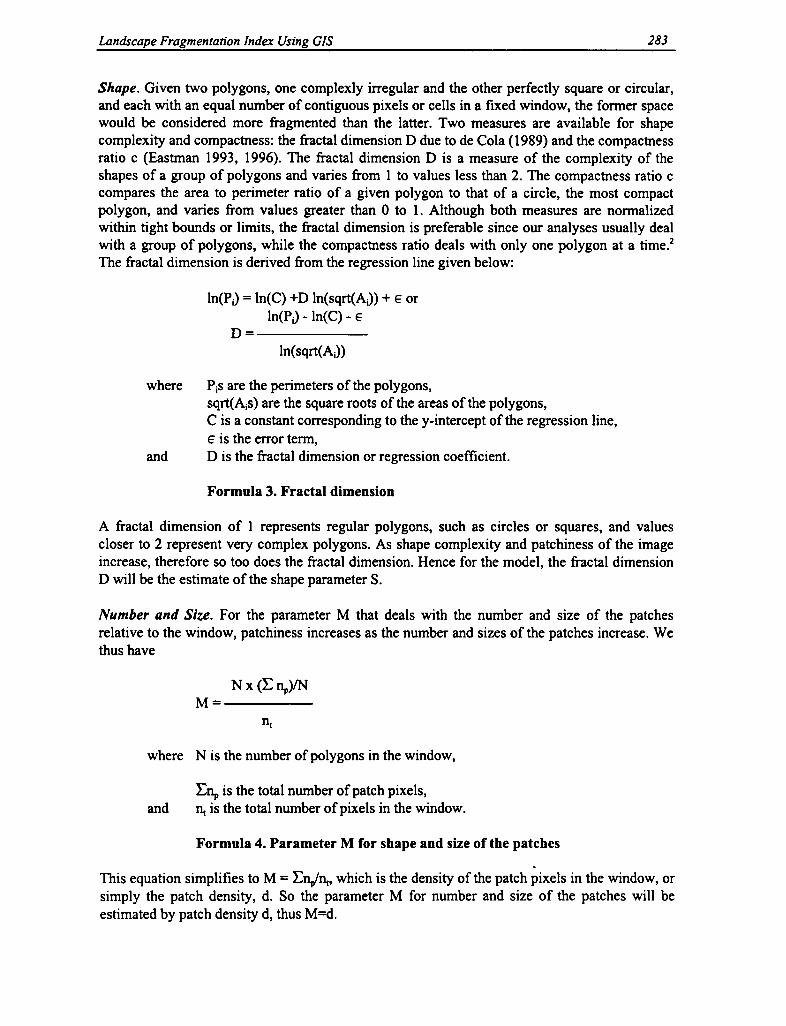
Chapter 6
Rapid Appraisal for Biodiversity Maintenance:An Alternative Approach for Assessing Biodiversity
Condition and Maintenance
Budhi Gunawan, Parikesit, Oekan S. Abdoellah,and Rusydi Kotanegara
Introduction
To understand the condition of biodiversity is usually costly and time consuming; however,useful and accurate information is necessary. Therefore, rapid and reliable research and evalua-tion techniques that are timely and cost effective must be devised (Shengji 1995). In this regard,several approaches or techniques that are assumed to be rapid and reliable have been developed.Such approaches, as recently reviewed (Anonymous 1996), include Gap Analysis, Rapid Ecolog-ical Assessment, Conservation Needs Assessment, Rapid Biodiversity Assessment, and RapidAssessment Program. In fact, some are not particularly rapid techniques.
The aforementioned approaches contribute to the understanding of biodiversity but, except forConservation Needs Assessment that takes into account social and political realities, all seem torelate only to the issue of biological diversity per se. In this regard, the question is, How do weconserve and safeguard biodiversity in natural ecosystems?
This paper describes an alternative technique for collecting research data—rapid appraisal forbiodiversity maintenance (RABM)—which focuses primarily on social perspectives to learnabout the maintenance of biodiversity conditions in specific areas. This is based on experience ofthe Institute of Ecology (IOE) research team in conducting the study of biodiversity conditionand maintenance in Upper Citarum River Basin, West Java.
Terminology and Principles of RABM
Rapid appraisal for biodiversity maintenance (RABM) is an approach developed and used tounderstand the biodiversity condition and maintenance of an area. It is not meant as a tool forstudying biodiversity per se, but rather as a tool for assessing factors that affect change in thebiodiversity condition—those that diminish biodiversity and those that contribute to its mainte-nance. In this context, maintenance is defined as biodiversity preservation in the sense of ecolog-ical as well as social factors. The word "maintenance" in this definition is given more emphasisconsidering that maintenance of biodiversity condition, especially in anthropogenic ecosystems,will significantly involve the role of human beings.' Thus, RABM tries to solve methodologicalproblems of a socioeconomic nature, which essentially derive from the weakness ofmethodologies for identifying and quantifying human impacts on biological diversity and aconsequent inability to meaningfully incorporate human impacts into an assessment of biologicaldiversity (Anonymous 1996).
125

126 Budhi Gunawan, Parikesit, Oekan S. Abdoellah, and Rusydi Kotanegara
As a tool, RABM is meant to contribute to the effort of understanding the maintenance ofbiodiversity condition. Specifically, it is developed to cope with the need of timely, relevant,accurate, and usable information regarding the maintenance of biodiversity condition. It can becarried out solely or in combination with both the standard and rapid bioecological methods.Thus, it is believed to be significant in the development and implementation of policiessupporting biodiversity conservation.
RABM has several similarities with Rapid Rural Appraisal (RRA); in fact, it is modified andderived from RRA2 and is combined with bioecological concepts. The principles and techniquesof RRA are comprehended and developed to comply with the needs of RABM, whereasbioecological concepts are used as key terms in understanding biodiversity. Some core principlesof RRA, which is relevant to RABM (Grandstaff, Grandstaff, and Lovelace 1987) and can beapplied in undertaking a study, are (1) interdisciplinary approach and team work, (2) exploratoryand highly iterative research, (3) rapid and progressive learning, (4) substantial use of indigenousknowledge, (5) triangulation, and (6) flexibility and use of conscious judgment.
Interdisciplinary Approach and Teamwork
Similar to RRA, RABM is an approach that will be useful if it is carried out by an interdis-ciplinary team. As defined, RABM is not meant as a tool for studying biodiversity per se, butrather as a tool for assessing factors that affect the biodiversity condition—those that diminishbiodiversity and those that contribute to its maintenance. Thus, RABM will be useful to becarried out by, for instance, biophysical scientists and social scientists since factors that affectthe biodiversity condition would include biophysical as well as social factors.
Exploratory and Highly Iterative Research
This principle implies that researchers should be ready to abandon old hypotheses and to formand explore new ones when evidence indicates the need to do so. Thus, the study is highlyiterative. The IOE research team experienced that they had to review their assumption, forinstance, about the low presence of and the association between a primate species locally calledSurili (Presbytis comata) and a tree species of Saninten (Castanopsis argentea) in the middle ofits study period. Since the information gathered from the field, which was supported by new-found literature, indicates that Saninten fruit is only a food preferred by this primate, theassumption was broadened to cover the habitat condition of the primate as a factor that effectedthe low presence of this animal (see Case 2 below).
Rapid and Progressive Learning
The third principle is that the study may be carried out rapidly. It is progressive learning, but themethod is not designed to produce the last word on a particular issue or a final solution togeneral problems. With regards to RABM, the method may provide insight about importantissues that affect the maintenance of biodiversity condition, requiring further study.
The IOE study indicates that some issues related to the maintenance of biodiversity conditioncan be revealed within less than a month; among others are land conversion and the dairy-cattleproject. Land conversion from bamboo-tree garden or rice field is a prominent issue in theuppermost area of Upper Citarum River Basin, which is caused by the expansion of cash-cropcultivation. This conversion is suspected to cause changes in biodiversity condition. Similarly,
Rapid Appraisal for Biodiversi ty Maintenance 127
the dairy-cattle project is another issue suspected of causing negative impacts on the waterquality of the Citarum River and contributing to higher pressure on forest resources.
Substantial Use of Indigenous Knowledge
Perception and understanding of the people in the study area about resource situations, use, andproblems are important to learn and comprehend in RABM. These may describe the process ofmaintenance of biodiversity condition involving local people. For example, erosion of thepeople's belief system about the sacred area would be valuable information in describing theincreasing exploitation of resources in the forest. Medicinal plants collected by local people canalso be used as indicators of the maintenance of biodiversity condition (for terms of indicators,see section entitled "Indicators of Biodiversity Condition and Maintenance" below).
Triangulation
The principle of triangulation applied in RABM implies that a combination of several techniquesis undertaken to obtain accurate information. The term "triangulation" is actually taken fromland surveying (Patton 1990). It is a technique to locate a position in the intersection of twolandmarks. In research, according to Denzin (1978, cited by Patton 1990), multiple methods ofobservation should be employed since no single method ever adequately solves the problem ofrival causal factors. The method is termed triangulation. Further, Denzin identified four basictypes of triangulation:
• Data triangulation: variety of data sources used in a study,• Investigator triangulation: several different researchers or evaluators involved in the study,• Theory triangulation: the use of multiple perspectives to interpret a single set of data, and,• Methodological triangulation: the use of multiple methods to study a single problem or
program.
The IOE study team was composed of several researchers whose backgrounds are biology,geography, and anthropology (investigator triangulation). The different disciplinary backgroundsallow a variety of perspectives in interpreting a single set of data (theory triangulation). Forinstance, land-use change of bamboo-tree gardens is biologically interpreted as causing impactson bird diversity; it could also be interpreted as a change in perception of the people about theirenvironment. To gather information related to such land-use changes, the team interviewedlandowners of a different age category and also conducted observations and documentation inthe field (data and method triangulation).
Flexibility and Use of Conscious Judgment
Flexibility means that RABM, as well as RRA, allows creativity and modification. Evaluation ofthe earlier information obtained by the team may determine the next strategy of data collection:time schedule and allocation, tools and techniques, and methodological combination.
The use of conscious judgment indicates that the researchers understand the kinds of data to becollected and techniques to be applied. The techniques chosen imply what degrees of precisionare required. In RABM we may interview people in some villages to get information abouthistorical dynamics of bird species—its presence and abundance but we cannot automatically

128 Budhi Gunawan, Parikesit, Oekan S. Abdoellah, and Rusydi Kotanegara
presume that it is quantitatively accurate and draw a graph indicating differences betweenvillages and areas.
Indicators of Biodiversity Condition and Maintenance
To assess biodiversity condition and maintenance, RABM looks for indicators' of biodiversitymaintenance whose presence indicates biodiversity preservation and whose diminution orabsence indicates biodiversity loss, and further assesses factors behind these. In assessing thedynamics of biodiversity condition and maintenance, in some cases association of the indicatorswith other living organisms or other phenomena is considered. For example, the palm civet(Paradoxurus hermaphroditus) and the sugar palm (Arenga pinnata) are assumed to have a closeassociation, in the sense that natural germination of sugar palm seeds can only occur after beingdigested by the palm civet.
In determining indicators of biodiversity maintenance, the following six criteria are useful(discussion with Percy E. Sajise and Michael R. Dove 1994): (1) pace of genetic erosion overtime, (2) presence of endemic species, (3) presence of extinct and endangered species, (4)presence of principal economic species, (5) market-oriented and monocropped species, and (6)habitat diversity. These, however, are not always applicable and some may not be found in thefield.
Pace of Genetic Erosion Over Time
The use of this criterion is intended to identify local indigenous resources, in terms of geneticlevel. Through interviews with people, the process of genetic erosion could be indicated by lossof (local native) varieties. There is a tendency in many places for local indigenous resources tobe replaced by introduced ones. On the one hand, for example, local varieties of rice orvegetables are disappearing and replaced by the new high-yielding varieties. Disappearance ofthese local indigenous resources can be interpreted as biodiversity loss for the local area.` On theother hand, people in some places tend to maintain and continue using their local resources forcertain reasons, thereby preserving biodiversity.
In the IOE study area of Upper Citarum River Basin, local varieties of rice were still planted bypeople in combination with the new high-yielding varieties in, as defined in the study, the zoneof transition area. In the area called the periphery—the area far from an economic growth center(cities)—local varieties of rice have been rarely planted by the people since cash-crop cultivationis more attractive to them. Whereas in the area defined as the center—the area that is close to aneconomic growth center—local varieties were no longer planted by the people. Governmentpolicies and economic considerations directly and indirectly have influenced the people not toplant local varieties. Regarding vegetable planting in the periphery area, the study noted thatmany former bamboo-tree gardens have been converted to cash-crops. This conversion indicatesnot only a phenomenon of disturbance on ecosystem diversity but also genetic loss due to thereduction of population size of certain species.
Presence of Endemic Species
Endemic species is another criterion to indicate maintenance and condition of biodiversity. Forexample, the biodiversity study of Upper Citarum River Basin included interviews with local

Rapid Appraisalfor Biodiversi ty Maintenance 129
people and observations of a rare threatened and endemic primate species, locally called Surili(Presbytis comata) in Mount Wayang. The interviews revealed that they do not intentionallyhunt this animal. Thus, the rare presence of this species may be associated with the degradedcondition of the vegetation in the Surili habitat. Vegetation structure might have been disturbedand consequently the home range of Surili has become wider since food required by this animalis lacking.'
Presence of Extinct and Endangered Species
Similar to the criterion of endemic species, extinct and endangered (threatened) species can beused as a criterion to determine the indicator of biodiversity maintenance. For example, in MountWayang, an endemic species of tree, the Jamuju (Podocarpus imbricatus), is found but itsabundance has decreased. Overcutting of this species was one of several factors that caused itsinfrequent occurrence. Thus, the Jamuju tree may become a valuable species for preservation.
The IOE study also discovered that the Otter (Cynogale bennettii and Amblonyx Cinerea) isinfrequently found in the Upper Citarum River Basin. Although this species is believed to be anamulet bearer, local people often kill this animal for causing negative impacts on fish cultivatedin their ponds, especially in the dry season when water in the Citarum River and the abundanceof fish are low.
Presence of Principal Economic Species
Although identification of principal economic species is noteworthy to show pressure on theresources, the IOE team experienced difficulty in identifying these species in the Upper CitarumRiver Basin. Nevertheless, in the past, a species tree locally called Kaliage (Zantoxilum sp.) washarvested for bonsai—a potted plant dwarfed by a special technique. It is now rarely found inMount Wayang. Certain birds can also be categorized into this criterion. Birds are hunted bypeople for subsistence but many are caught live to sell. For example, Treron vernans, a birdspecies, was hunted both for subsistence and for commercial purposes by people in the UpperCitarum River Basin . 6 That species of bird is now rare. Disappearance of this principal economicspecies can also be caused by a diminishing number of certain tree species such as Ficus spp.that was the habitat of various species of fauna of different taxa, for example, avifaunas andinsects (McNeely et al. 1995).
The presence of the sugar palm (Arenga pinnata) is believed to have correlation with thepresence of the palm civet (Paradoxurus hermaphrodithus). In Upper Citarum River Basin,many of the trees were chopped down, and the trunk content was used for palm flour. As aconsequence, people rarely see the civet around their kampongs, even in the area close to theforest. There was also information that people hunted (or killed) this animal to protect theirdomestic fowl such as chicken.
Market-oriented and Monocropped Species
Market demand is acknowledged as an important variable affecting patterns of productionamong the farmers. The IOE study in the Upper Citarum River Basin indicates that marketdemands have changed the orientation of many farmers in the upland area to cultivate market-oriented plants. Cash-crop cultivation has dominated agricultural activities in the study areacalled the periphery and has begun to extend into the zone of transition, resulting in land-use

130 Budhi Gunawan, Parikesit, Oekan S. Abdoellah, and Rusydi Kotanegara
change. Wet rice fields and bamboo-tree gardens are gradually converted to cash-crop fields(dryland agriculture). Further impact of this is the declining appearance or disappearance ofsome bird species such as Ardeola speciosa due to habitat loss.
Habitat Diversity
The last criterion used to determine the indicator is habitat diversity. With respect to theanthropogenic ecosystems, it is helpful in understanding the dynamics of the ecosystems and thefactors responsible for the changes. In this regard, it could be assumed that the more diverse theecosystems, the more diverse are the biological elements of the landscape (Foreman and Godron1986).
By using this criterion in the anthropogenic ecosystems, the IOE research team began their studywith land-use type identification prevailing in the study area and its dynamics. In a village that islocated in the periphery area, for instance, the team identified at least six types of land use (i.e.,homegarden, rice field, bamboo-tree garden, pond, tea plantation, and cash-crop field). Ricefield, pond, and bamboo-tree garden are dwindling in acreage and being converted tosettlement/homegarden and cash-crop garden, which are expanding in acreage. In the past, therewere actually sugarcane and coffee plantations, but these no longer exist in the area. Thisidentification of land-use types helped the team to further assess the impacts of the changes on,and describe the maintenance of, biodiversity conditions.
With regard to the six criteria mentioned, therefore, the indicators defined in this approachencompass the three levels of biodiversity assessment (WRI 1992): (1) level of genetic diver-sity, such as varieties of rice, (2) level of species diversity, for example, animal and plantspecies, and (3) level of ecosystem diversity, as in land-use type.
In the analysis, these three levels of biodiversity assessment are not analyzed separately. Theseshould be interpreted and analyzed integratively to describe the condition and maintenance ofbiodiversity. By doing this and by using the criteria for determining the indicators, someindicators of biodiversity condition and maintenance can be revealed, and both positive andnegative correlation among any of the three levels of biodiversity assessment could be shown. Inaddition, this can also indicate factors and processes responsible for the maintenance ofbiodiversity conditions.
A negative correlation among any of those three levels of biodiversity assessment might showpreservation or maintenance in one level and degradation or loss in another level. For instance,the IOE study indicates that, on the one hand, there is a tendency of enrichment in geneticdiversity (e.g., introduction of vegetable varieties), but it is compensated by impoverishment ofhabitat diversity; on the other hand, impoverishment of habitat diversity went along withimpoverishment of species diversity (e.g., bird species).° As mentioned earlier, for instance,bamboo-tree gardens are converted to cash-crop fields to get more income. In this regard, theintroduced cash-crops enrich the genetic varieties of crops, but it should be compensated with thedecrease in size of bamboo-tree gardens, which, in turn, cause disappearance of certain birdspecies from the area.
To begin field data collection, especially in an anthropogenic ecosystem, it is worthwhile to startwith land-use identification—the third hierarchical level of biodiversity assessment—as the entrypoint. Identification of land-use type is regarded as an important preliminary step in research and

Rapid Appraisal for Biodiversity Maintenance 131
is used to understand the historical dynamics of land-use change. The field study suggests thatunderstanding the dynamics of land use makes the finding of the indicators of biodiversitycondition and maintenance relatively easy. For example, in the study area called the center area,although the dominant land-use type is rice field, the study was not able to identify the presenceof a wetland bird species, Ardeola speciosa. It is now rarely found. In the past, many of this birdspecies were found in rice fields during the day and in bamboo-tree gardens at night. The teamargues that since red-brick making around bamboo-tree gardens has become a major economicactivity of the people in this area, this activity has disturbed the habitat of this bird.
Steps in Conducting RABM
Outlined below are several steps of research in conducting rapid appraisal for biodiversitymaintenance (RABM). These are based on experience of the IOE research team in conducting astudy of biodiversity condition and maintenance in Upper Citarum River Basin. They aregrouped into two general phases: preparation and fieldwork.
Preparation
The initial preparation phase is considered very important in conducting RABM. Lack of goodpreparation can lead to ineffective study and a waste of time and money. The preparation phaseconsists of four steps: team formation, collection of background secondary data, preliminary sitevisit, and training of field researchers.
Team Formation. RABM is an approach that proved most useful when conducted by aninterdisciplinary team. Different team members from different backgrounds of study added theirown unique perspectives, allowing for better understanding of the situation in a relatively shorttime.
Regarding team formation, the IOE formed an interdisciplinary team consisting of fourbiologists, a geographer, a human ecologist, and an anthropologist. The team was assisted byseven students from the biology department and three students from the anthropologydepartment, Padjadjaran University. The involvement of social scientists in the study is deemednecessary, since human intervention in the maintenance of biodiversity is seen to be a primaryfactor in biodiversity maintenance. Thus, social factors are as important to the study as thebiophysical factors (see Case 1).
CASE 1: The IOE team found that the heterogeneity of land-use types and variabilitywithin each land-use type, which now exist and are relatively well maintained inWangisagara village, can be interpreted biologically (by biologists) as a condition thatsupports the maintenance of the relatively high floristic and faunistic biodiversity of thearea. In this case, the social scientists learned to understand the relationship betweenmaintenance of variety of land use and the related floristic and faunistic components. Inreturn, biologists learned from the social scientists how the variety of land-use types inthe anthropogenic ecosystems can still exist. There are several social factors other thanbiophysical factors, such as edaphic factor, which are assumed to be responsible for themaintenance of such varieties of land-use types. One of several major social factors isthe perception of the people in this area about their environment, the cultural diversity.'People (landowners) in Wangisagara take care of their bamboo-tree gardens as well as

132 Budhi Gunawan, Parikesit, Oekan S. Abdoellah, and Rusydi Kotanegara
their rice fields. They intentionally plant their bamboo-tree gardens with perennial cropsand use the dike of the rice fields for annual crops and even perennial crops such ascoconut (Cocos nucifera) and Guava (Psidium guajava).
A similar case was found in Sukapura village. In understanding the rapid process ofland-use change in the village, in this case a bamboo-tree garden was converted to cash-crops, the biologists learned that it, in addition to the major factor of market demand, hasbeen intensified by an inheritance system that prevails in the community. Some casesindicate that once the inheritors received the land, they converted the land to cash-crops.Inversely, the anthropologist learned about the ecological impact of land conversion.
Collection of Secondary Data and Required Tools. Since prior knowledge of the study area isnecessary in RABM, the team collected available information, books, research reports, docu-ments, and the like, which were related to the study area and the topic of study from theinstitute's library and other places such as the university library and government offices. Mapsshowing topographical conditions and soil type, as well as aerial photos, were collected to gainknowledge of the physical conditions of the area.
The IOE team found that collecting secondary data and discussing these findings with otherresearchers were very beneficial, even after the study began. The experience of the IOE team isdescribed in Case 2.
CASE 2: Based on the preliminary scant information the team obtained before goinginto the field, the team asked local people about the association between an endemicspecies of Surili (Presbytis comata) and Saninten tree (Castanopsis argentea). Thepeople replied that it was true that Surili favored eating Saninten fruit. After a couple ofweeks in Sukapura and Taruma Jaya village, the team noted that this endemic species ofSurili was associated to the presence of the Saninten tree. The team then considered theSaninten fruit as Surili's main food. The team observed that the Saninten tree is veryscarce in Mount Wayang. Thus, it is not surprising that Surili was rarely found in MountWayang. The Saninten tree seemed to be a keystone species.
The team kept this association in mind and discussed it with a student who conducted aninvestigation on Surili's behavior in the National Park of Mount Halimun, West Java.They also learned more about this from reports written by two other scholars about Suriliin two nature reserves in West Java. Finally, they found that the presence of Surili isassociated not only with certain species but its habitat. Regarding this, the IOE study,which applied the standard method, suggested that the vegetation condition of Surili'shabitat in Mount Wayang is disturbed.
This case reminds the team not to address leading questions to the people; otherwise,they receive misinformation that may lead them to an inaccurate conclusion. Besides,this also indicates that sufficient preliminary information and knowledge about the studytopic will help the researchers develop an accurate conclusion.
Preliminary Visit. The IOE research team went to the proposed study site for a preliminary visitto get more personal insight into the area. Then, the final study sites were selected, and a guidefor data collecting by interviews was developed. Personal insight of each researcher about thestudy area is useful in determining study sites. The IOE team determined their study sites based
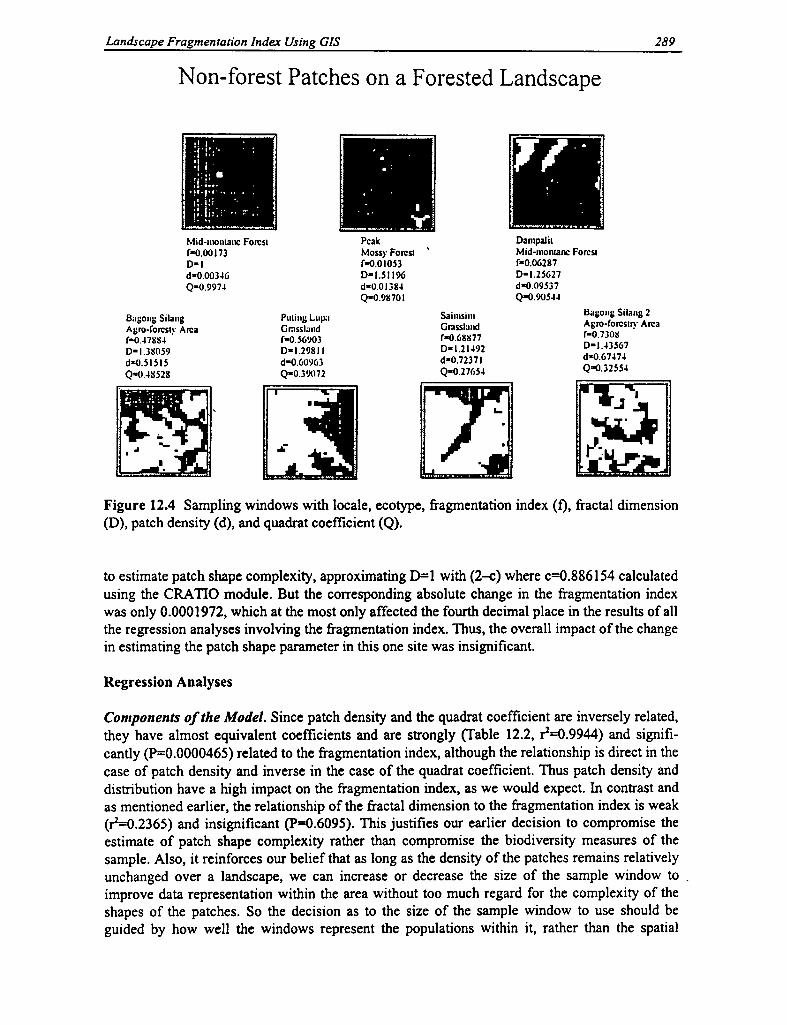
Rapid Appraisal for Biodiversi ty Maintenance 133
on, for instance, distance to the center of economic growth, altitudinal condition of the sites, anddemographic distribution. A preliminary visit is beneficial in developing an interview guide. Forinstance, the team developed questions regarding the variety of land-use types found in the studyarea.
Training. The IOE trained and prepared its team members to conduct RABM. Principles andtechniques adapted from RRA and the notion of indicators used to assess biodiversity conditionand maintenance were discussed. In this training, regular discussions, through what is callednight-meeting forums, were emphasized among the team members. The night-meeting forum isconsidered an important part of obtaining valid information in a relatively short time period.Training was carried out both in the office for two to three days and in the field when the teambegan the study. In the field, the team was trained to practice RABM in the first three days. Alltraining involved researchers and assistants.
Fieldwork
After the preparation phase, the field research phase began. This phase includes field orientation,interview and observation, and field discussion and report writing.
Field Orientation. Using the topographical maps and aerial photos, the team began theirfieldwork by acquainting themselves with the area being studied. Topographical maps werehelpful for discovering the administrative boundaries of the study area and the position andnames of villages; aerial photos provided an overview of the entire study area.
During the field-orientation phase, the team was guided by a local inhabitant (a village official)who knew the area and its history well. He assisted the team, especially the research assistants, ifabsolutely necessary because some people could not understand the questions addressed to themor they were rather suspicious of the interviewers in selecting and interviewing key informants.Sometimes the guide was also required for introducing the interviewers and explaining theirpurposes. However, during the interview itself, the village official stayed away, unless neededfor specific reasons. In many cases, people were reluctant to talk in the presence of a villageofficial.
Interview and Observation. After field orientation, the teams began their research by conductinginterviews, using an interview guide. In order to ensure the acquisition of good information, theresearch assistants, especially in the first two weeks, were intentionally grouped into pairs—onewhose background was biology and the other anthropology. At first, these pairs of interviewerswere changed daily to avoid too much of one interviewer's thoughts and ideas. However, due todifficulties in preparing daily reports and to ensure continuity in obtaining data, this pairing waschanged to once a week (Case 3). This technique is actually an adaptation to Hildebrand'smethod (see Chambers 1987).
CASE 3: In the first week of the IOE field study, the assistants were grouped into pairs,which were changed every day. The problems appeared when they wrote daily reports(every pair was required to write a daily report) after discussing the findings in the night-meeting forum. Often, information they got from the field was still incomplete, andbased on their discussion, additional information was required; but the pair had to bechanged the following day. This caused problems in data gathering and daily reportwriting.
134 Budhi Gunawan, Parikesit, Oekan S. Abdoellah, and Rusydi Kotanegara
The guide for data collection, prepared after the team's preliminary visit during the preparationphase, was used for interviews, and key informants were purposely selected with regard to theirspecific social categories and capabilities. Local bird gatherers who caught birds for market, forexample, were interviewed when the team needed to collect information about the diversity ofbird species and their abundance; elderly men were interviewed for collection of informationabout the history of the village, land-use change, and social institutions. For some interviews,tape recorders were used.
In order to validate the information collected, the principle of triangulation was implemented. Byapplying this principle, information gathered was cross-checked with other informants of thesame and/or different social categories. Information gathered from the farmers about the changein rice varieties was cross-checked with other farmers and/or middlemen and government offi-cials. Case 4 shows an example of contradictory information.
CASE 4: The conversion of rice field to cash-crop fields, other than market demand, ispresumably caused by dairy-cattle activity in the periphery area. The cattle farmersdiscard cow dung directly into the river. When the researchers asked some farmers whoused to plant rice, they replied that they converted their rice field due to low yield. Theyargued that it was caused by water that was polluted by cattle dung. This argument wasdenied by the cattle farmers who said that dairy-cattle raising did not affect the rice field.
With regard to eutrophication, the monitoring study of water quality in Saguling andCirata Dams, located in the middle of Citarum River Basin, shows that water quality ofCitarum River is very eutrophicated. Industrial, domestic, and agricultural wastes,including cattle farming, are dominant factors to this pollution (PPSDAL 1996).
On certain occasions, group interviews were undertaken. These tended to be forums ofdiscussion between the interviewers and the informants. There are several advantages to thiskind of interview. Ideas and information can be grasped more quickly since the informants canimmediately support or correct the information revealed by other informants. However, trying toconfirm data on sensitive issues, such as land (forest) encroachment or illegal tree cutting, mustbe avoided in the group interview. In this regard, individual interviews and observations are themost appropriate technique for confirming information obtained on these topics.
A camera is useful in documenting the changing phenomena. For instance, the team was able todocument the conversion of bamboo gardens into cash-crop fields with photographs. With regardto policy linkages, this documentation may help in presenting the last condition to decision-makers so they can immediately understand the maintenance of biodiversity condition of thearea.
Binocular is also useful for bird watching. In addition, pictures, shown during interviews, makequick identification of bird species possible. The experience of the IOE team indicates thatpeople were attracted to seeing colorful pictures and eager to respond to questions. The pictureshelped to easily remind the interviewee of the kinds of birds that still could be encountered in orhave disappeared from their village.
Field Discussion and Report Writing. Each pair of interviewers prepared materials based ontheir daily individual field notes, for discussion in the night-meeting forum held almost everyevening in the field and attended by all members of the research team. Every team member
Rapid Appraisal for Biodiversity Maintenance 135
presented his daily findings, which could then be validated, supported, or even countered byother interviewers' findings. When findings agreed, these were used for more detailed research.But, in contradictory findings, each team member had to repeat his/her study. The team's dailyfindings were evaluated in order to determine key indicators of biodiversity condition andmaintenance. In evaluating the night-meeting forum, the team's consensus was that it isnecessary to grasp the rapidly accumulating number of ideas being discovered and essential toavoid loss of data and miscommunication among team members.
Potential factors affecting biodiversity conditions were also discussed and evaluated. In theUpper Citarum River Basin study, the IOE team found several factors affecting biodiversitycondition and maintenance—such as biophysical factors (e.g., edaphic and climate), socioeco-nomic factors (e.g., market demand, landlessness, and tenurial system), and the related govern-ment policies and their implementation—to be interrelated. Market demand, for instance,influences the farmers to engage in vegetable production and, in many cases, to convert theirbamboo-tree garden for cash-crops. In this regard, preference of the farmers to plant marketablecrops led to the process of disadvantageous land-use change of the area; aside from the increasedrate of erosion, it affected diversity of the ecosystem!°
Market demand, in fact, does not usually cause negative effects. Replication of the IOE study inUpper Cimanuk River Basin indicates that market demand can also augment the preservation ofbiodiversity. People in Upper Cimanuk villages raise a local species of sheep due to its valuableprice. They also continue to cultivate local varieties of rice because of biophysical constraint andits high price as well.
Based on daily discussions, two reports were prepared by the team—a report on their dailyinterview notes and a report on notes of the night-meeting discussions. The interviewers' fieldnotes (raw notes) were also kept for reference whenever needed. For writing reports in the field,the use of a computer was helpful to the team.
Some Caveats in Using RABM
The understanding of biodiversity condition and maintenance will be inadequate unless thesocial condition related to the resource uses is learned. RABM, which focuses on social aspects,can be used as a tool to understand the condition of biodiversity maintenance. Nevertheless,there are some caveats to be considered.
• RABM is believed to be able to describe dynamics of the biodiversity condition andmaintenance in a relatively short time, but it may be misleading if applied carelessly.
• RABM is a collective work. The objectives of RABM would be achieved if it is conductednot by an individual but a team; thus, team members must be committed to conduct RABM.
• Cooperation and intensive discussion among team members are essential. Discussion withother scholars is also helpful. Literature study is another important task.
Notes
1. Globally, humans are now the dominant influence on biodiversity. It is also revealed that the currentdecline in biodiversity is largely the result of human activity and represents a serious threat to human
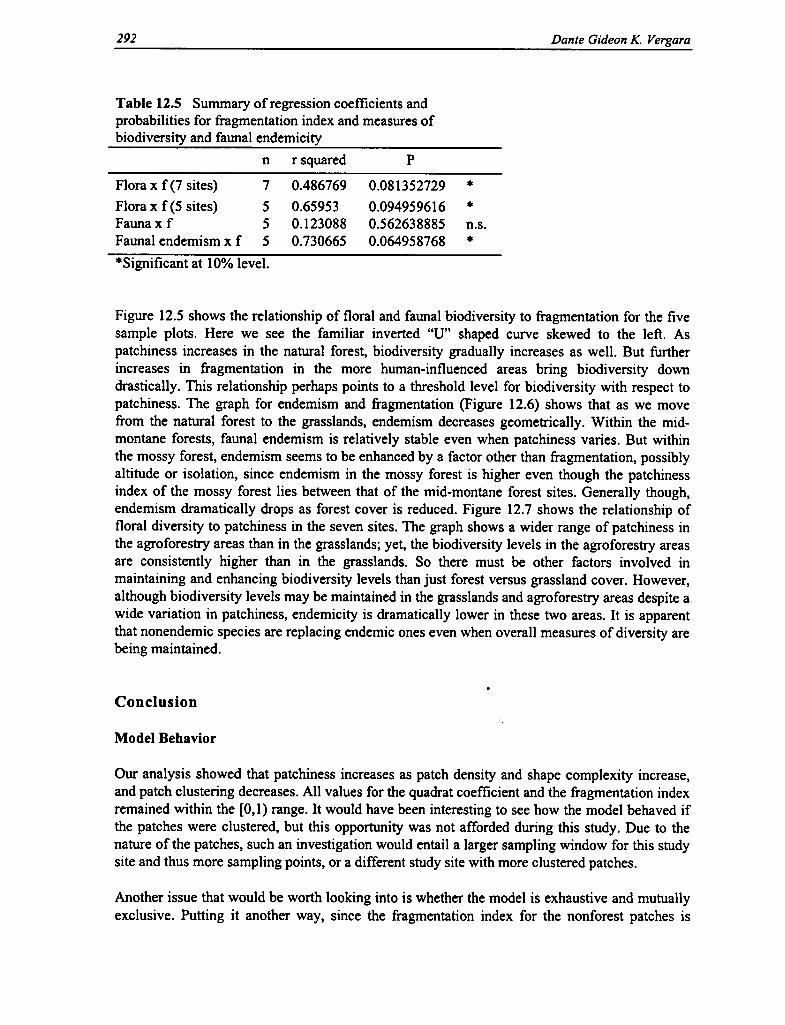
136 Budhi Gunawan, Parikesit, Oekan S. Abdoellah. and Rusydi Kotanegara
development (Heywood and Baste 1995; McNeely et al. 1995). Nevertheless, some argue that a fullunderstanding of the process that creates and maintains biological diversity is lacking (Anonymous 1996).2. For a detailed explanation of RRA, see Khon Kaen University (1987).3. The term "indicator" is defined slightly differently from the term of keystone (species) or indicators ofecological process, which connotes that some species are ecologically more important to their ecosystemthan are others, and these influence community structure (see Ray 1988; Norton 1988; Conway 1988;Terborgh 1986; Mooney et al. 1995). The term defined here includes not only keystone (species) but alsoothers (species) that may be nonkeystone (species). Another term revealed in Landres, Verner, and Thomas(1988) is that, based on Inhaber's definition, an indicator species is an organism whose characteristics areused as an index of attributes too difficult, inconvenient, or expensive to measure for other species orenvironmental conditions of interest. In general, indicators should be used when direct measurement isimpossible. Regarding human environmental relations, there are "keystone societies" responsible formaintaining the structure and dynamic of more diverse and species-rich ecosystems (Milleur 1994; Dove1993).4. As indicated by McNeely et al. (1995), the introduction of alien species may increase the speciesdiversity in that region. However, species introductions can be a major cause of extinction of nativespecies, and the global effect of increased rates of species introduction is overwhelmingly a net loss ofglobal species diversity.5. In the natural protected forest of Mount Halimun, West Java, three groups of Surili were found in anarea of about 11 hectares. This may indicate that vegetation condition of the forest in Mount Halimuncould be considered better than in Mount Wayang, particularly in association with food availability, forinstance, figs' fruit (pers. comm. with a student who was doing research on Surili 's behavior and its habitatin Mount Halimun).6. The use of air rifles that began to be popular in the 1970s fostered the decline of a number of birdspecies and their abundance.7. Soule (1991) reveals that there are about five levels of biospatial hierarchy: (1) whole systems at thelandscape or ecosystem level, (2) assemblages (association and communities), (3) species, (4) populations,and (5) genes (see also McNeely et al. 1990).8. Similar correlation is indicated by Westman (1985, cited by Landres, Verner, and Thomas 1988), whichshows that an increase in abundance of insensitive or tolerant species may provide information on habitatconditions. Considering this, however, Landres, Verner, and Thomas (1988) warn that the abundance ofcertain species should not be used as the only indicator of a change in habitat attributes.9. Nietschmann (1992, cited by Hyndman 1994) reveals that cultural diversity refers to "the variety ofhuman life ways, the social and ecological roles they perform, and the knowledge they contain." Similarly,McNeely et al. (1995) expose that the diversity of human societies is reflected in the perceptions peoplehave of their environment.10. Human impacts on habitats take two main forms: conversion from one habitat to another, andmodification of conditions within a habitat type (Meyer and Turner 1992, cited by McNeely et al. 1995).On sloping land, removing the vegetative cover by clearing, for instance, forest, cultivating the soil inplanting or weeding, and taking off the crop in harvesting have resulted in soil erosion by water (Hamiltonand King 1983).
References Cited
Anonymous. 1996. Assessment of biological diversity and methodologies for future assessment: Subsidiarybody on scientific, technical, and technological advice. Second meeting, 2-6 September, Montreal.
Chambers, Robert. 1987. Shortcut methods in social information gathering for rural development projects.In Proceedings of the 1985 International Conference on Rapid Rural Appraisal (Khon Kaen Univ.), 33-46. Rural Systems Research and Farming Systems Research Projects, Khon Kaen, Thailand.
Conway, William. 1988. Can technology aid species preservation? In Biodiversity, ed. E. O. Wilson, 263-68. Washington, D.C.: National Academy Press.

Rapid Appraisal for Biodiversity Maintenance 137
Dove, Michael R. 1993. Uncertainty, humility, and adaptation to the tropical forest: The agriculturalaugury of the Kantu. Ethnology 32(2): 145-67.
Foreman, R. T. T., and M. Godron. 1986. Landscape ecology. New York: Wiley and Sons.
Grandstaff, Somluckrat W., Terry B. Grandstaff, and George W. Lovelace. 1987. Summary report. InProceedings of the 1985 International Conference on Rapid Rural Appraisal (Khon Kaen Univ.), 3-31.Rural Systems Research and Farming Systems Research Projects, Khon Kaen, Thailand.
Hamilton, Lawrence S., and Peter N. King. 1983. Tropical forested watersheds: Hydrologic and soilsresponse to major uses or conversions. Boulder: Westview Press.
Heywood, V. H., and I. Baste. 1995. Introduction. In Global biodiversity assessment, ed. V. H. Heywood,1-19. Cambridge: Cambridge Univ. Press.
Hyndman, David. 1994. Commentary. Human Organization 53(3): 296-302.
Khon Kaen Universi ty. 1987. Proceedings of the 1985 International Conference on Rapid Rural Appraisal.Rural Systems Research and Farming Systems Research Projects, Khon Kaen, Thailand.
Landres, Peter B., Jared Verner, and Jack Ward Thomas. 1988. Ecological uses of vertebrata indicatorspecies: A critique. Conservation Biology 2(4): 316-28.
McNeely, J. A., M. Gadgil, C. Leveque, C. Padoch, and K. Redford. 1995. Human influences onbiodiversity. In Global biodiversity assessment, ed. V. H. Heywood, 710-821. Cambridge: CambridgeUniv. Press.
McNeely J. A.; Kenton R. Miller, Walter V. Reid, Russel A. Mittermeier, and Timothy B. Werner. 1990. InConserving the world's biological diversity. Gland, Switzerland: IUCN, WRI, CI, WWF-US, the WorldBank.
Milleur, Brien A. 1994. In search of "keystone societies." In Eating on the wild side, ed. Nina L. Etkin,259-79. Tucson and London: The Univ. of Arizona Press.
Mooney, H. A., J. Lubchenco, R. Dirzo, and 0. E. Sala. 1995. In Global biodiversity assessment, ed. V. H.Heywood, 273-325. Cambridge: Cambridge Univ. Press.
Norton, Bryan. 1988. Commodity, amenity, and morality. In Biodiversity, ed. 0. Wilson, 200-5.Washington, D.C.: National Academy Press.
Patton, Michael Quinn. 1990. Qualitative evaluation and research methods. Newbury Park: SagePublications.
PPSDAL. 1996. Laporan Pemantauan Kualitas Air Saguling and Cirata (Monitoring report on waterquality of Saguling and Cirata dams). Bandung, Indonesia: Pusat Penelitian Sumber Daya Alam danLingkungan (Institute of Ecology), Padjadjaran Univ. (in Indonesian).
Ray, G. Charleton. 1988. Ecological diversity in coastal zones and oceans. In Biodiversity, ed. E. 0.Wilson, 35-50. Washington, D.C.: National Academy Press.
Shengji, Pei. 1995. Rapid inventory for biodiversity studies in agroecosystems of Southeast Asia. InRegional study on biodiversity: Concepts, frameworks, and methods, ed. Pei Shengji and Percy Sajise,129-42. Kunming, China: Yunnan Univ. Press.
Soule, Michael E. 1991. Conservation: Tactics for a constant crisis. Science 253:744-50.
Terborgh, John. 1986. Keystone plant resources in the tropical forest. In Conservation biology: The scienceof scarcity and diversity, ed. Michael E. Soule, 330-44. Sunderland, Mass.: Sinauer Associates.
WRI (World Resources Institute). 1992. Global biodiversity strategy: Guidelines for action to save, study,and use Earth's biotic wealth sustainably and equitably.

III Philippines


Chapter 7
The Conditions of Biodiversity Maintenance in Asia:Philippine Studies
Percy E. Sajise and Mariliza V. Ticsay-Ruscoewith contributions from
Juan Carlos T. Gonzalez and William Sm. Gruezo
Background
The Philippines is considered as one of the high biodiversity areas in the world. It has a highendemicity of flora and fauna, many of which are endemic subspecies unique to each island, ofwhich there are more than 7,000 throughout the entire country. As a result of rapid rates ofdeforestation and rural transformation, this high biodiversity has declined rapidly, and today thePhilippines is considered as one of the "hot spots" of biodiversity in the world. The succeedingchapters describe the various studies and results of the Philippine portion of the study conductedfrom 1994 to 1996.
The two main study sites for this project were Mount Makiling in Laguna-Batangas province andHaliap-Panubtuban, Asipolo in Ifugao province, both on the island of Luzon. Two additionalsites were located in Subic Bay, Zambales province in Luzon and Mount Pangasugan in Baybay,Leyte province in the Visayas. The location of all sites is shown in Figure 7.1.
Selection of the study sites followed criteria that fit the objectives of this project. Three of theproject sites, namely Mount Makiling, Subic Bay, and Mount Pangasugan, are forest reserveswith a long history of human activities and encroachment leading toward transformation of theforest to other land-use systems. There is at these sites, therefore, a wide spectrum ofbiodiversity levels and a continuum of nature and society—all of which are requirements for thestudy. The fourth study site, Haliap-Panubtuban, Asipolo in Ifugao province, is a remote uplandforest area settled by ethnic cultural communities dominated by the Ayangan. The area has beensubjected to traditional subsistence land uses but is currently slowly being influenced bycommercial vegetable growing. All four study sites have varied levels of landscape patchiness. Asummary of the major features of all the study sites is shown in Table 7.1.
Other objectives of the project are to generate the appropriate methodologies, assess biodiversity,and determine its relationship with variables at several hierarchical levels, namely farm,ecosystem, and landscape. Methodologies for linking the results of the study to conservationpolicy and management are also an important concern in this study. The following is a summaryof the various methodologies applied in this study.
Farm Level
Biodiversity Measures. Two methods were used to measure biodiversity at the farm level: (1)standard indices of ecological biodiversity, namely the Shannon-Weiner Index, Menhinick Index
139

v
0
e
'I `
sE
a ^'
/ /r'Th / _
•
Y^AY. LEYTEd
e 5
ae
ao Co
N
140 Percy E. Sajise and Mariliza V. Ticsay-Ruscoe
n
KI ANGA(N. IFUGAO
SUB1C BAYS,
MORONG. BATAAN
MT. MAKILING. LOS BARDS
11 4Figure 7.1 The study sites in the Philippines.

Conditions of Biodiversi ty Maintenance: Philippine Studies 141
Table 7.1 Summary of the major features of the study sites for the PhilippinesStudy site Location Status Area (ha) Comments
Mount Makiling Laguna-Batangas Forest Reserve 4,244 There is a long history of humanprovince, Luzon (400-1000 m asl) encroachment into the forest reserve;island also used as a field laboratory of the
University of the Philippines at LosBanos.
Haliap-Panubtuban Asipolo, Ifugao Traditional 2,800 Dominated by Ayangan ethnicprovince, Luzon community in forest community along with four otherisland area ethnolinguistic tribes; varied
(800-1250 m asl) subsistence land-use systems; todayinfluenced by commercial vegetablegrowing.
Subic Bay Zambales province, Formerly an 9,856 Inhabited by ethnic group Aeta; as aLuzon island American Naval former naval reserve, the forest was
Reserve; currently well protected; currently there is rapidconverted into a transformation of the built-up areasDevelopment and some forest ecosystems for eco-Authority for tourism.commerce and eco-tourism(0-400 m asl)
Mount Pangasugan Baybay, Leyte Forest Reserve about 1,000 594 ha is a forest reserve serving asprovince, Visayas (0-930 m asl) field laboratory for the Visayas State
College of Agriculture; 40 ha arecultivated by shifting cultivators wholive outside the forest reserve; has along history of forest occupancy.
Note: m asl = Meters above sea level.
of Species Richness, and Pielou's Evenness Index (computed based on number of species andnumber of individuals per species, derived from plot sampling for floral species), and (2) a cropbiodiversity index derived from respondent recall (computed based on variations on kinds ofcrops and number). Correlations between biodiversity indices and biosocial factors werecalculated using simple regression and multiple regression analyses.
Rapid Biodiversity Appraisal (RBA). This methodology uses indicator species or surrogatemeasures to assess biodiversity. It is derived from quantitative correlation of selected sociobio-logical parameters with various measures of biodiversity levels. "Kitchen" and "market" surveysof household use of wild and cultivated plant species are also included in Rapid BiodiversityAppraisal. (This methodology is explained in greater detail below.)
Ecosystem Level
This makes use of the transect placement of sampling plots or plotless sampling points along anenvironmental gradient. Ecological indices similar to the farm level were used, but statisticalanalysis focused on cross-ecosystem quantitative relationships using Analysis of Variance(ANOVA). Rapid Biodiversity Appraisal was used here, too, using the participatory transectwalk and the "market" survey for floral and faunal diversity.
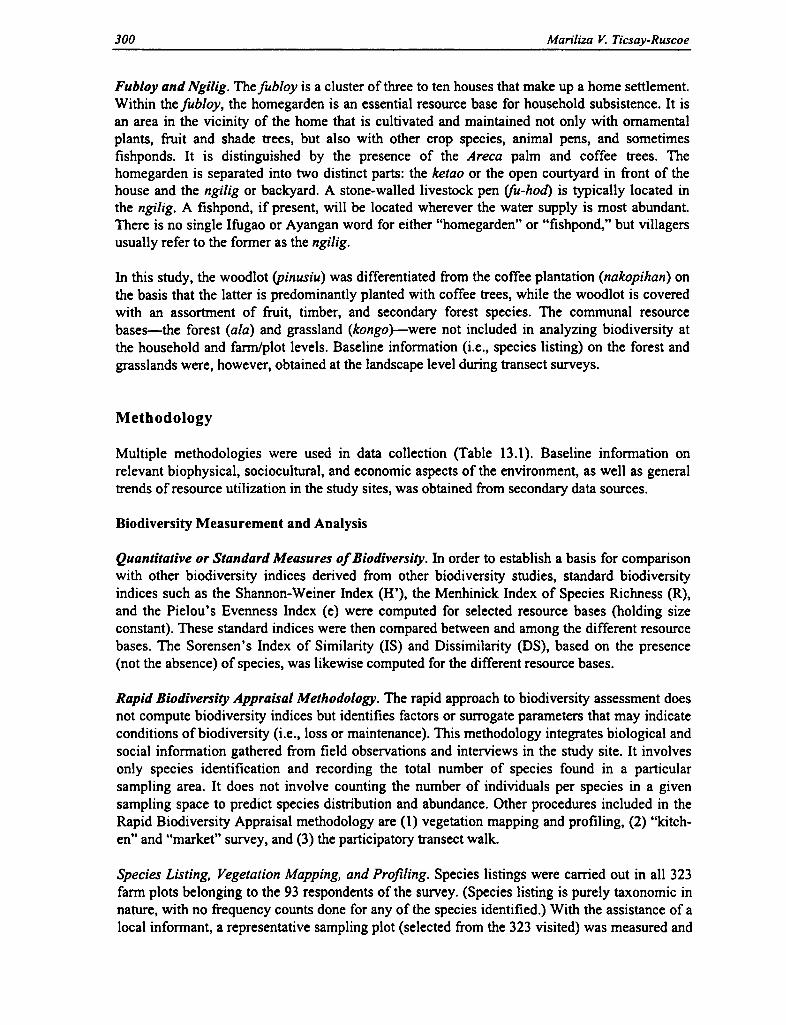
142 Percy E. Sajise and Mariliza V. Ticsay-Ruscoe
Table 7.2 Summary of methodologies used at different hierarchical levelsMethodologies used for
Level of analysis biodiversity assessment Statistical analysis used
Farm Biodiversity indices CorrelationIndex of qualitative variation Multiple regressionRapid Biodiversity Appraisal
Ecosystem Transect analysis with Correlationecological indices Multiple regressionRapid Biodiversity Appraisal Qualitative
Landscape Fragmentation level with the Regressioncorresponding ecologicalindices at the farm andecosystem levels
Landscape Level
Forest patchiness and fragmentation were calculated using a quantitative model, and these valueswere correlated with farm level and ecosystem level biodiversity indices. The software used forlandscape and fractal analysis was IDRISI, EXCEL, and SAS. A summary of the variousmethodologies for data gathering and quantitative analysis used in this study is shown in Table7.2.
The Study Area
Mount Makiling, Laguna-Batangas Province
Mount Makiling is an isolated, extinct volcanic cone located 65 kilometers southeast of Manila,on the south-central part of Luzon island (14°08' north longitude and 121°12' east latitude). Theposition of the crater is not readily visible, but its rim may be traced from individual peaks withworn, deep channels and steep slopes. The topography of the lower slopes may be described asbroad, radiating, well-drained ridges separated by narrow valleys. The mountain iscomparatively low, the highest peak reaches only 1,130 meters above sea level. Its volcanicorigins are evident in the many hot springs and fumaroles, such as the "Mudsprings" area, apopular tourist spot within the Makiling Forest Reserve. The reserve has an area of 4,244hectares, including portions of two provinces, Laguna and Batangas (Miranda 1987). It issituated in the southwestern Luzon volcanic plate, considered to be the "meeting point" betweentwo distinct faunal portions of northern and southern Luzon, from the tail end of the SierraMadre mountains of northeastern Luzon to the upper limit of the Bicol peninsula of southernLuzon (Figure 7.1)
Mount Makiling is one of the first national parks established in the Philippines. It was firstclassified as a forest reserve by the Bureau of Forestry as a field laboratory of the ForestrySchool in 1910 under Presidential Proclamation No. 106. It was later proclaimed a National Parkin 1933 (Proc. No. 552). In 1993, it was reclassified a forest reserve through Republic Act 6967.

Conditions of Biodiversi ty Maintenance: Philippine Studies 143
The special concern over the Makiling Forest Reserve stems from the fact that it is one of thefew remaining forest areas in the country with a relatively large portion of intact natural foreststand containing many diverse species of fauna and flora. Currently, the 4,244-hectare MakilingForest Reserve is under the jurisdiction of the Institute of Forest Conservation, University of thePhilippines at Los Banos (UPLB), which is the foremost forestry and agricultural school in thecountry. The natural setting afforded by reserve creates an effective learning environment forforestry and agroforestry practicum and training for students enrolled at the university. Thereserve is the university's natural laboratory for its research, extension, and instructionalprograms. Other special uses of varying economic, social, and educational importance includethe Makiling Botanical Garden, the UPLB Museum of Natural History, the National Arts Center,and the Jamboree Site of the Boy and Girl Scouts of the Philippines. This forest reserve alsofunctions as a vital watershed for the surrounding municipalities in the provinces of Laguna andBatangas. The watershed has a total area of 24,985 hectares and is divided into six hydrologicalzones encompassing the major rivers and their tributaries, all of which drain into Laguna Lake(WBL 1994).
The relatively stable climate (Type I) around the mountain is affected by the northeast monsooncoming from the Pacific Ocean. Type I climate has two pronounced seasons: wet from May toDecember and dry from January to April. Heavy rainfall occurs between July and Septemberwith a maximum of 20 to 40 centimeters (cm) per month and with an average annualprecipitation of 230 cm. A pronounced but not severe dry season occurs in March and April,which is most distinct on the western side of the mountain. Cloud cover around the peak reduceslight intensity and temperature on the upper altitudes. Relative humidity is comparatively highthroughout the year independent of rainfall, due to the mountain's proximity to the lake (Brown1919). The Batangas side of the mountain is relatively drier. Mean annual temperature at its baseranges from 27-30°C to 25°C or less inside the mountain's lush rainforests.
Pyroclastic and volcanic rocks cover the slopes of this dormant volcano, interbedded with shale,limestone, and tuff. Fault lines also occur in several areas. The soil is varied and includes fourseries or types, namely lipa, maculod clay, gulugod, and makiling. The pH of these soils rangesfrom 4.3 to 6.5 (Cruz 1991).
The vegetation type of Mount Makiling was orginally dipterocarp forest from 100 to 600 metersabove sea level. However, due to numerous anthropogenic disturbances (e.g., shifting cultivationor kaingin and illegal logging), much of the lowland forests has been lost. The introduction ofexotic trees for reforestation and for orchards on the lower slopes has further transformed thelowland forest below 300 meters to a mosaic of second growth, orchards, and grasslands orparang vegetation (Miranda 1987).
Historical records of human occupancy on Mount Makiling dates as far back as 1898, more thanten years before the University of the Philippines School of Agriculture was established. Thepopulation of these settlers increased during World War II, when families took refuge in themountain, opening large tracts of kaingin to survive. Most of these families remained and settledin the area, maintaining their farm lots after the war. Some occupants are the third or fourthgeneration of settlers, although most of the resident households came in the 1980s.
A recent census of land claimants (Dizon 1992) showed that there are 1,100 forest claimants inthe reserve, 25 percent of whom are residing within the reserve. The large number of landclaimants in the reserve poses a threat to the stability of the forest ecosystem. The big increase of

144 Percy E. Sajise and Mariliza V. Ticsay-Ruscoe
agricultural land from 528 hectares to around 1,900 hectares, according to the 1992 farminventory by the Institute of Forest Conservation, attests to the potential role played by migrantsin the rapid decimation of the forest in the Makiling Forest Reserve (Cruz, Francisco, and Torres1991).
The Makiling Forest Reserve is public land placed in trust under the jurisdiction of theUniversity of the Philippines at Los Banos. Several efforts were undertaken by the university toaddress the problem of illegal occupancy in the reserve. The solutions ranged from expulsion tocooperation. In the 1990s, the university entered into partnership with the local communities tojointly protect the remaining forest cover in the reserve. While encroachment into the reserve hasnot stopped altogether, there is a perception that the process has slowed down.
The threat still remains, however, coming mostly from population growth among current forestoccupants. Francisco, Mallion, and Sumalde (1992) show that this rate is quite high and isexpected to remain so, given the large percentage of young people in the reserve. Furthermore,the only remaining area left for possible expansion is brushland and, thereafter, the forest zone.
Location of Study Sites
The study sites cover approximately all vegetational types and elevational and disturbancegradients within the six hydrological zones of the Makiling watershed. Table 7.3 gives a descrip-tion and location of the study sites in the Makiling Forest Reserve.
Table 7.3 Description and location of study sites in Mount Makiling Forest Rese rveLandscape zone Description
Mossy forest 1,040 m asl; Peak 2
Dipterocarp mid-montane forest 550-700 m asl; NE-facing slope, above Mudspringsarea; UPLB side (HZ1)725-850 m asl; NW-facing slope; Puting Lupa,Calamba side (HZ3)600 m asl; SE-facing slope, above Mudsprings area(HZ1)700 m asl; N-facing slope, above National ArtsCenter, Los Banos (HZ2)
Grassland ecosystem 475-625 m asl; NW-facing slope, Puting Lupa,Calamba side (HZ3)700 m asl; S-facing slope, Nagtalaok-Saimsim, LosBanos
Agroforestry ecosystem 525-550 m asl; SE-facing slope, Bagong Silang, LosBanos (HZ5)230 m asl; SE-facing slope; Talahiban Bay(HZ5)700 m asl; N-facing slope; Karay, Pansol, Calamba(HZ3)350 m asl; N-facing slope; Magnetic Hill, Timugan,Los Banos (HZ2)
Note: HZ = Hydrological zone.
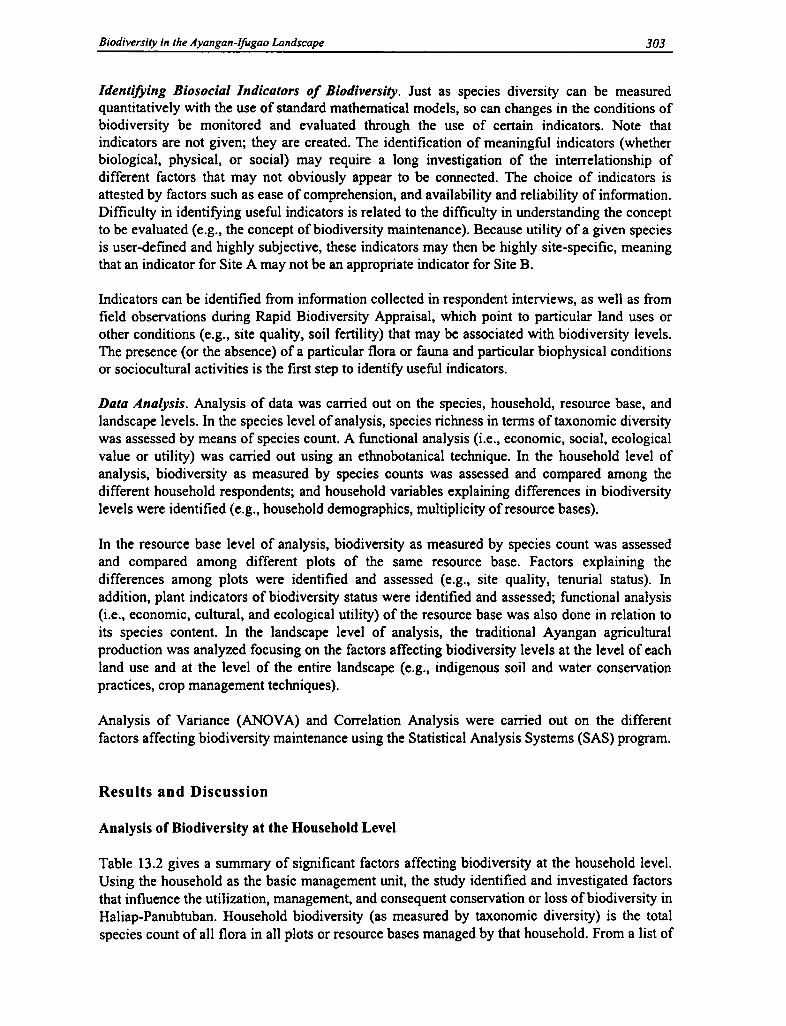
Conditions of Biodiversi ty Maintenance: Philippine Studies 145
Figure 7.2 Six hydrological zones (HZ) in the Makiling Forest Reserve: HZ1—Molawin-Maralas drainage area, 723 ha; HZ2—Dampalit, 770 ha; HZ3—Tigbi-Puting Lupa, 457 ha;HZ4—Sipit-Tanauan, 677 ha; HZ5—Cambantoc, 1,277 ha; HZ6—Maitim, 341 ha.
These study sites fall in numbered hydrological zones in the Makiling watershed. These zonesare (1) Molawin-Maralas, (2) Dampalit, (3) Tigbi-Puting Lupa, (4) Sipit-Tanauan, (5) Camban-toc, and (6) Maitim (Figure 7.2). Elevational gradients of the sites range from 350 meters up tothe second peak at 1,110 meters. The study sites also represent different types of habitat, namely(1) mossy forests, (2) dipterocarp mid-montane forests, (3) cogon grasslands, and (4) plantationsand agroforestry areas (Dans and Gonzalez 1994) (see Figure 12.2, Ch. 12, this volume).
The Mossy Forest. The mossy or cloud forest zone begins to manifest itself at an altitude of 900meters and has its peak development within the vicinity of the three prominent peaks of slightlyvarying heights (1,085, 1,090, and 1,109 meters). With the exception of the well-trodden accesstrail from the Mudsprings area to Peak 2, the mossy forest zone is apparently the least disturbedportion of Mount Makiling.
The Dipterocarp Mid-montane Forest. The dipterocarp mid-montane forest zone starts at anelevation of about 100 meters and has its upper boundary limit at 900 meters. At the latterelevation, this zone merges with the mossy forest.
The Grassland Ecosystem. Grasslands can be found in two separate elevational zones in MountMakiling (Table 7.3). The grasslands are dominated by tall Saccharum spontaneum (talahib) andImperata cylindrica (cogon) intermixed with secondary growth. Parts of these grasslands areabandoned agricultural areas.
The Agroecosystem. Agroecosystem is the cultivation of annuals (e.g., root crops) incombination with perennials (e.g., fruit trees and forest trees). Farms are generally developedthrough the kaingin system, which is carried out in cleared secondary growth stands. Plantation-based farms are also common in the area. They range from monoculture cultivation of citrus tobicultural cultivation of coffee and banana to higher complexes (multistory systems) with asmany as fifteen crops being cultivated at one time.
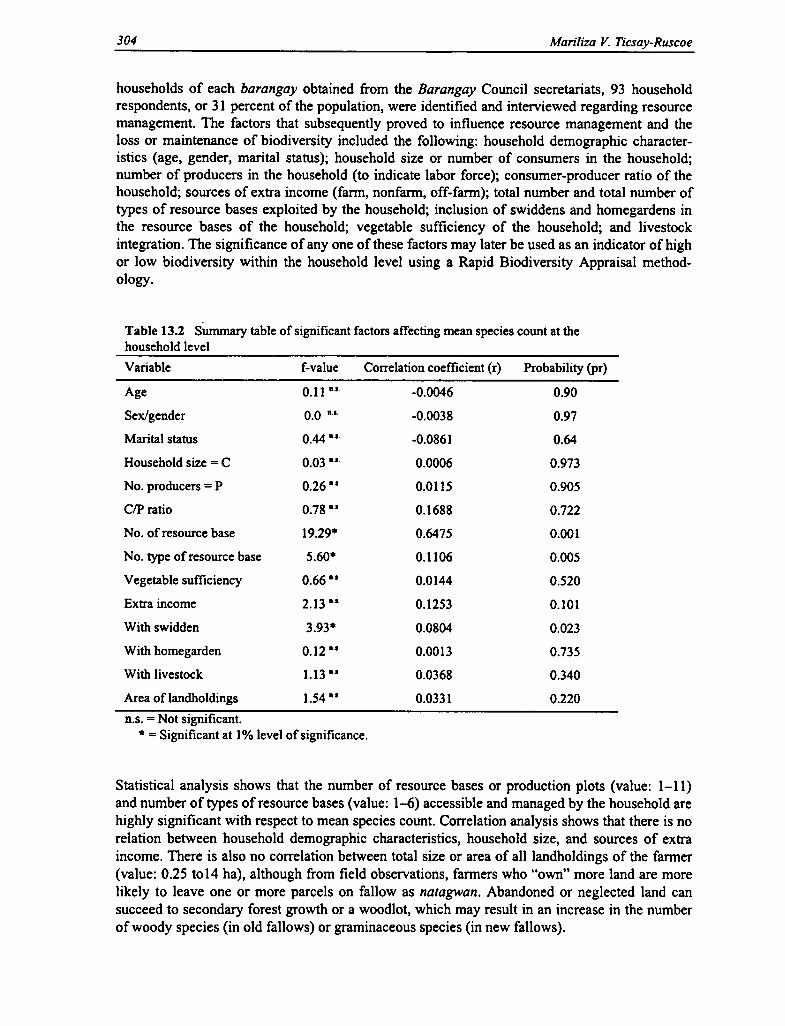
146 Percy E. Sajise and Mariliza V. Ticsay-Ruscoe
Sampling Methodologies for Biodiversity Profiling
Part 1. Vegetation/Floral Analysis
An extensive vegetation sampling was undertaken, consisting of recognition and description ofmajor plant associations, a detailed listing of their floristic composition (i.e., species identifica-tion), study of their relationships (i.e., what inter-/intra-specific relationships occur and why),and distribution mapping. In addition, a participatory ethnobotanical survey was undertaken withthe assistance of key informants, field guides, and community members, if any, to identify theeconomic, social, and other ecological functions of floral resources identified during the surveyand inventory. The procedure for a detailed vegetation analysis, with its corresponding statisticalanalysis, consists of the following steps:
• Segmentation of vegetation cover;• Selection of samples in recognized segments (i.e., if collected data are intended for statistical
analysis, samples may be located by probability sampling, simple random sampling,systematic sampling, and stratified random sampling);
• Choosing appropriate size and shape of plots (cf. species area curve);• Decision on what qualitative and quantitative information to record from observation or units
of sampling plots (e.g., species identification, importance values);• Locating and observing sampled plots in the field; and• Statistical analysis of observed data to obtain standard biodiversity indices (i.e., Species
Richness, Shannon-Weiner Index, Evenness, Index of Similarity/Dissimilarity).
Species Area Curve: Determination of Minimal Area for Plot/Quadrat Sampling. If method-ology involves sampling (either single or multiple plots), a minimal area representing thesmallest area that contains the characteristic species composition of the plant community shouldbe determined. For a quantitative vegetation sample to be representative of the species of acommunity, the sample plot should never be smaller than the minimal area. A species area curveindicates species richness in relation to increasing size of the area. From other studies (Mueller-Dombois and Allanberg 1974), commonly used sizes are for the tree layer, a 10 m x 10 m plot;for the undergrowth up to 3 m height, a 4 m x 4 m plot; and for herbs and grasses, a 1 m x 1 mplot.
Quadrat Sampling: Determine Species Density and Frequency. This consists of laying downquadrats of uniform shape (usually square) and size in selected areas of the vegetation. Thenumber of quadrats employed is up to the discretion of the researcher, although it should benoted that higher precision is achieved with the use of a larger number of sampled quadrats. Allspecies found within the quadrat were identified. Frequency of individuals per species was alsorecorded.
Point-Center Quarter Method (PCQM): Determine Stem Density (of Trees) Through the Mea-surement of Distance. This technique is based on the idea that the number of trees per unit areacan be calculated from the average distance between the trees. Sampling points are selected byprobability sampling. Quarters are established at the center of the sampling point by a crossformed by two lines. One is the compass direction and the other is a perpendicular line passingthrough the sampling point. The distance to the midpoint of any tree within 5 meters from thesampling point is measured in each quarter. An individual tree must not be measured twice.(Note that in effect, the sampling plot is circular with a 5-meter radius. This size is consistent

Conditions of Biodiversity Maintenance: Philippine Studies 147
with the one suggested by Mueller-Dombois and Allanberg [1974] for tree layer.) Theparameters to be obtained are species identification, density, diameter at breast height (dbh), andfrequency of individuals.
Line Transect-Circular Plot Method. This is generally employed for assessment of vegetationtypes and floristic components for Continuous Forest Inventory. A transect is established alongthe contour of the mountain and within each vegetation zone (i.e., forest, grassland, agroeco-system). Circular plots, each with a diameter of 40 meters are positioned equidistantly at 250 to500 meters apart. Each circular plot is divided into four quadrants using the four cardinaldirections: quadrant 1 (NE); quadrant 2 (SE); quadant 3 (NW); and quadrant 4 (SW). Specieslisting and plant measurements (viz, height, diameter at breast height, frequency) are made fromeach quadrant of each circular plot. Biodiversity indices (i.e., Shannon-Weiner Index) arecomputed to determine biodiversity levels. Interplot comparisons are made using the Index ofSimilarity. Herbarium specimens are collected or photographed for further verification and/orfuture reference.
Collection, Preparation, Classification, and Identification of Voucher Specimens. For anysampling methodology chosen, species identification may be hampered by variation within aspecies as well as in the different stages of growth. This calls for collection of sample materialrepresentative of the specimen. Proper labeling of all collected specimen is essential. Informationrequired includes (1) common or local name, (2) collection number and date of collection, (3)geographical location and its distribution, (4) ecological notes of its habitat, (5) important plant(or animal, as the case may be) notes, special features, and economic value, and (6) collector'sname.
The main objective of vegetation analysis through the different sampling methodologiesdescribed here is to identify and locate plant species for biodiversity conservation andsustainable use. Proper and correct scientific nomenclature and population estimates are notenough for the data to be useful. Enough qualitative data should be provided to indicateendemicity and conservation status (e.g., rare, threatened, endangered) and other biodiversityfunctions (i.e., economic, social, and ecological).
Rapid Biodiversity Appraisal (RBA) Methodology. Rapid Biodiversity Appraisal is an approachbeing developed not to compute biodiversity indices per se, but to assess factors or surrogateparameters that indicate biodiversity conditions (i.e., loss or maintenance). The "surrogate" is aquantity or combination of quantities used to obtain information about a "target" in lieu ofmeasuring the target more directly; the target is the entity about which information is desired.The basic premise is that there is a quantifiable link between surrogate measurements and thetarget entity. The target we are referring to in this paper is biological or species diversity. Thismethodology is being developed to cope with the needs for timely, relevant, usable, accurateinformation about the conditions of biodiversity, to use in developing and implementing policiesto support biodiversity maintenance (Iskandar and Kotanegara 1993). RBA methodologies aremost appropriate when time and resources to conduct biodiversity studies are limited.
Rapid Biodiversity Appraisal integrates biosocial information derived from the sampling area. Ittypically involves only species identification and a record of the total number of species found ina particular sampling area and does not rely on counting the individuals per species in a givensampling space to predict species distribution and abundance. RBA requires, therefore,
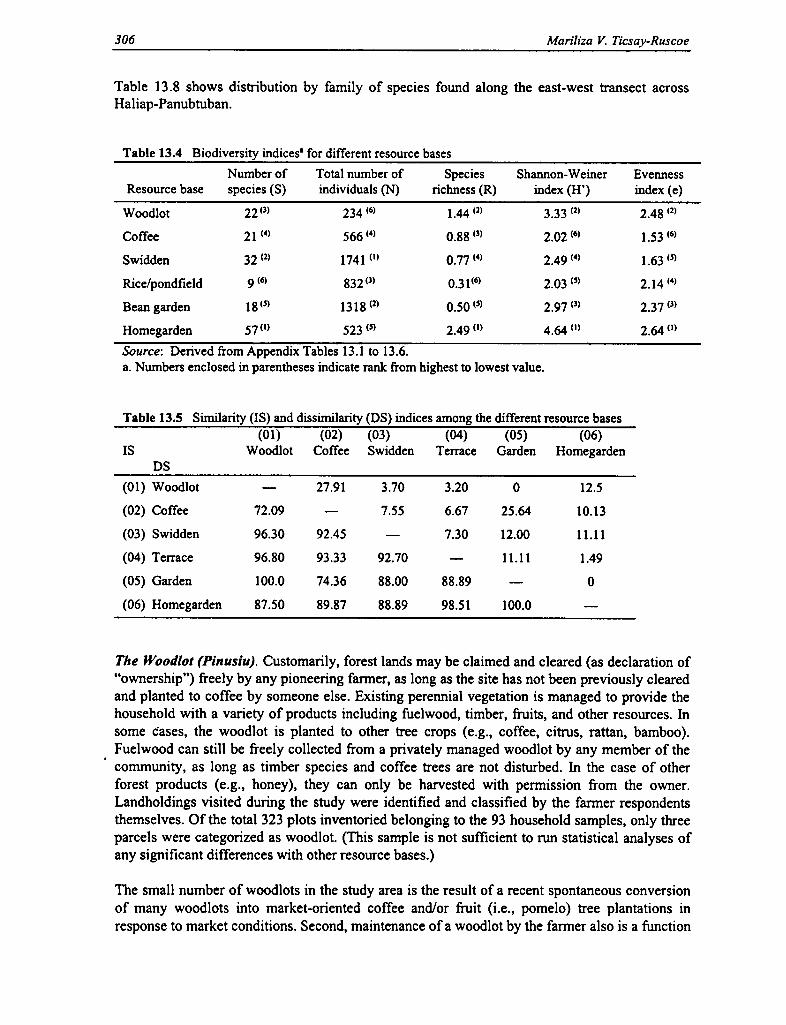
148 Percy E. Sajise and Mariliza V. Ticsay-Ruscoe
benchmark/baseline information on existing biodiversity levels (e.g., standard indices of repre-sentative sampling plots) for comparison.
Characteristics of Rapid Biodiversity Appraisal. Although the RBA approach to data gatheringand analysis of biodiversity borrows many of its tools and strategies from academic disciplinessuch as anthropology, rural sociology, ecology, and economics, important features distinguishRBA from straightforward academic research (Martin 1995). The main distinguishing elementsare as follows:
• Local people are full participants in the study rather than being merely the objects of theinvestigation. They take part in the design of the study, data collection and analysis, anddiscussions of how the results can be applied for the benefit of the community.
• There is an egalitarian relationship between locals and outsiders that avoids a hierarchical ortop-down approach.
• The approach is a cost-effective approach with research carried out in a short time, and itdoes require expensive equipment.
• It uses semi-structured interviews with a small group of local people or key informants (e.g.,persons with special knowledge about the area that can be used for a specific purpose).Measurements are qualitative rather than quantitative, and few statistical tools are used in theinterpretation of the results.
• Although the results of the study cannot be tested statistically due to lack of statisticalrandomness and representativeness, the validity of the results can be ascertained throughtriangulation. Triangulation is an iterative process involving (1) direct observation, (2)interviews with key informants, and (3) information from secondary sources.
Likewise, Rapid Biodiversity Appraisal has its disadvantages, most notably:
The methodology does not allow a deep working relationship to develop between theresearcher and the community.Time constraints leave little time to make voucher collections, transcribe local names, or talkto a wider range of informants.Short visits do not permit teaching local people the rigorous (ethnobotanical) methods thatwould allow them to manage resources more effectively in their community.
Initial Considerations: Planning for RBA. Before beginning any ecological profiling in a givenarea (e.g., a forest reserve), a multidisciplinary team composed of a forester/botanist/taxonomistor field biologist, social scientist/anthropologist or economist, an ecologist and a key informantwho can work together must first be formed. Existing floral and faunal surveys and inventoriesare then gathered, as well as other relevant socioeconomic and demographic data for any humancommunities. These data include climatic data, land-use maps, soil map, topographic maps,reports on forest use, and vegetation maps. Details such as the relative extent of the area, contourand slope direction and general topography, type of community (i.e., plant, animal, human), andhistory of the area are taken and recorded to gain a preliminary idea of the land, people, andconservation issues in the area.
Social acceptability of any study or development project is highly important if one is to expectsuccess and cooperation from the community. Initial entry to the community should therefore beconducted to make a positive impression. Before the actual fieldwork is to be done, the followingcan be done during the initial field reconnaissance: pay a courtesy call for a briefing of localcommunity leaders, request the assistance of local groups (e.g., non-governmental organiza-

Conditions of Biodiversity Maintenance: Philippine Studies 149
tions), make logistical arrangements for team (e.g., accommodations, on-site travel), and carryout initial identification of key informant.
Participatory Transect Walk: Belt Transect for Species Listing, Ethnobotanical Survey, andZonation (Rapid Biodiversity Appraisal Methodology). After outlining the desired transectprofile and delineating the landscape ecozones (e.g., forest, grassland, agroecosystem, humansettlement), a North-South or East-West Transect will be traversed with the assistance of a localguide and interpreter. A transect constitutes a form of systematic sampling wherein the samplesare arranged in a linear fashion. All plant species within 5 meters on either side of the transectline shall be identified and recorded whenever encountered. The occurrence of an individualspecies may be recorded several times depending on its location (in various ecozones) along thetransect. Recording the species whenever encountered is to identify indicator species for thedifferent ecozones or land uses occurring within the transect. Transects are useful for recordingchanges in the species composition of plant communities as a function of changes in soil types,topographies, elevation, and land uses.
Furthermore, the local name and the different economic, social, and ecological functions (e.g.,timber, food, medicine, fiber, ornamental) of each of the species encountered should be indicatedwith the assistance of a local guide. Plant habit classification (i.e., tree, herb, shrub, grass, sedge,vine, fern) should also be recorded per species. At the end of the transect walk, the length of thedistance covered is recorded.
Part 2. Faunal Survey and Inventory
Faunal data collection and cataloging can go hand-in-hand with the vegetation habitat analysis.Several ways of recording observations from the field are possible, and using a combination ofthe various methods enables the researcher to obtain the maximum data available. Different datacollection methods include:
• Ocular method: observation by visual contact or with the aid of optical equipment;• Audio method: observation by sound or with the use of sound-recording equipment;• Trapping/netting: capture specimens for hands-on identification and further analysis is one
of the best methods, although it requires time, energy, and equipment; it provides voucherspecimens, allows further data analysis, and facilitates the collection of data on even crypticspecies;
• Analysis of physical disturbance: based on evidence of the occurrence of an animal, such astracks, prints, fecal droppings;
• Ethnobiology: based on interviews of local residents or key informants from the area.
The main objective of the survey/inventory was to determine species diversity, richness,abundance, and density in the identified sites in the Makiling Forest Reserve for the four majorgroups of land vertebrates: amphibians, reptiles, birds, and mammals. The different indices andinformation derived from faunal analysis include (1) ecology and reproductive biology of speciesfound; (2) biometrics and other measurements; (3) residency and conservation status of eachspecies; (4) Species Effort Curve; and (5) species diversity, richness, abundance, and density ineach study site.
Information concerning ecological habits such as trophic groups, vertical distribution, andhabitat preference is important in the analysis of faunal diversity. Each species represents a
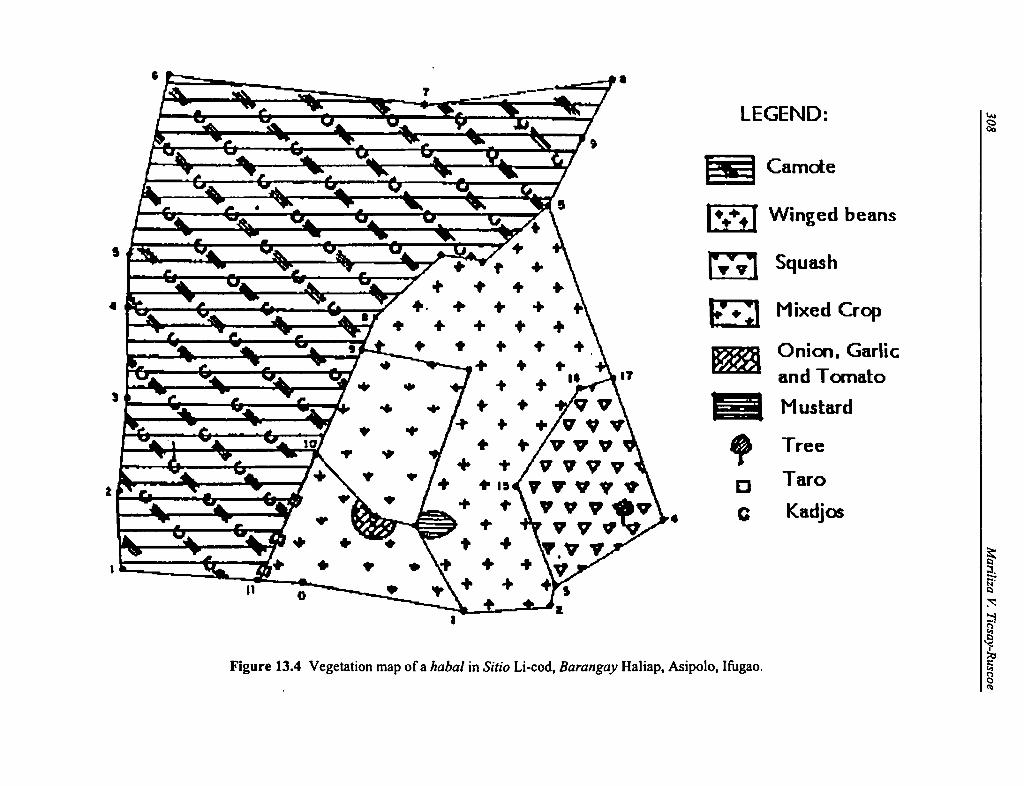
150 Percy E. Sajise and Mariliza V. Ticsay-Ruscoe
distinct functional relationship with its habitat. Species are classified based on their habits.Biometrics or body measurements are necessary to facilitate species identification includinginformation on sex, age, and health. Other necessary measurements include weight, reproductivecondition, and coloration.
Residency (i.e., endemicity) status of each species can be derived from existing literature.Endemic species are those found within a definite geographical location (e.g., Philippineendemic: found only in the Philippine Islands). Nonendemic species may include resident-breeding species (e.g., breeds in the Philippines, as well as in other neighboring countries),migratory species (i.e., species that leave their residence during the winter months), andintroduced species, which may be feral domesticates, escaped exotic species, or speciesintentionally released. Commensal species are those found in human habitation and areconsidered as household pests.
The conservation status (i.e., rare, endangered, extinct) of each species is found on the list ofthreatened fauna published by the International Union for the Conservation of Nature andNatural Resources (IUCN) and/or other listings of threatened Philippine fauna of otherconservation agencies such as Birdlife International (BLI).
A Species Effort Curve is determined by plotting the number of species found against the totalnumber of field days. This indicates whether enough data, representative of the site, have beencollected during species inventory; that no additional species are recorded after a number ofcollection days; and that sufficient effort was done to record all species in the site.
Species diversity was determined using the Shannon-Weiner Index, which assumes thatindividuals are randomly sampled from an "indefinitely large" population (Pielou 1975, as citedby Magurran 1988) and that all the species are represented in the sample. Species richness is ameasure of the number of species in a defined area and was determined by using the MenhinickIndex. It reflects the relationship between the total number of species recorded (S) and the totalnumber of individuals of all species (N). The abundance or density of a species is based on"importance value," which may further be based on frequency, dominance, and biomass of thatspecies in a given sampling unit.
Specific procedures of sampling methodologies used by the different project components (i.e.,flora, fauna, and socioeconomic) are discussed in detail in the following chapters.
References Cited
Brown, W. H. 1919. Vegetation of Philippine mountains. Bureau of Science, Manila.
Cruz, Rex Victor, H. A. Francisco, and C. S. Torres. 1991. Agroecosystem analysis of Makiling ForestReserve, Philippines. Environment and Resource Management Project Report, Vol 1. University of thePhilippines at Los Banos, Philippines.
Dans, A. T. L., and J. C. T. Gonzalez. 1994. Biodiversity study of Mount Makiling, Laguna Province,Luzon, Philippines (wildlife fauna component). In The conditions of biodiversity maintenance in Asia: Thepolicy linkages between environmental conservation and sustainable development, annual report 1994, ed.M. R. Dove and P. E. Sajise. Khon Kaen: Southeast Asian Universities Agroecosystem Network and East-West Center, Honolulu.
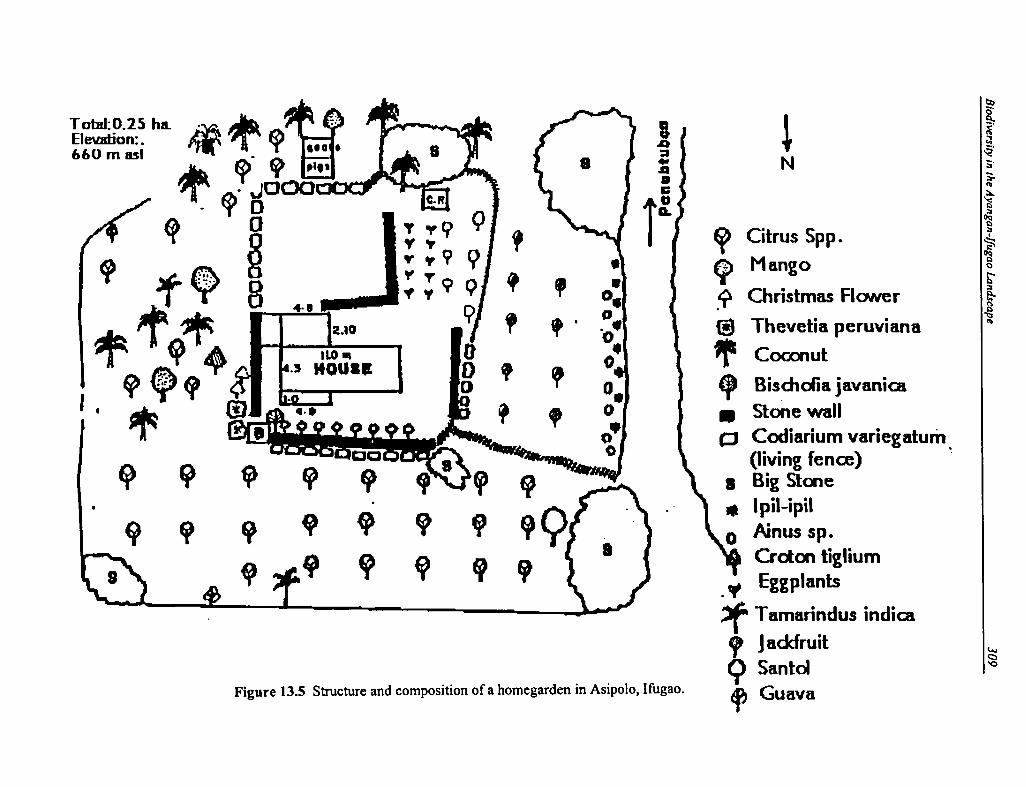
Conditions of Biodiversity Maintenance: Philippine Studies 151
Dizon, J. T. 1992. Socio-economic profile of farmers in the Makiling Forest Reserve. DAP-ERMP. UPLB,College, Laguna.
Francisco, H. A., F. K. Mallion, and Z. M. Sumalde. 1992. Economics of dominant forest-based croppingsystems in Mt. Makiling Forest Reserve: An integrative report. DAP-ERMP. UPLB, College, Laguna.
Iskandar, J., and R. Kotanegara. 1993. Methodology for biodiversity research. Paper presented at theSUAN Biodiversity Methodology Workshop, October, Xishuangbanna, China.
Magurran, Anne E. 1988. Ecological diversity and its measurement. New Jersey: Princeton Univ. Press.
Martin, Gary. 1995. Ethnobotany. A methods manual. WWF, UNESCO, Royal Botanic Garden, Kew.
Miranda, H. 1987. Bird species diversity as related to the vegetation structure of disturbed lowland forest inMt. Makiling. Master's thesis, University of the Philippines at Los Banos.
Mueller-Dombois, D., and H. Allanberg. 1974. Aims and methods of vegetation ecology. New York: JohnWiley and Sons.
Pielou, E. C. 1975. Ecological diversity. New York: John Wiley and Sons.
WBL (Wildlife Biology Laboratory). 1994. Educational tour of Mt. Makiling Forest Reserve. An informa-tion pamphlet for Viajes Filipinas educational tours.

Chapter 8
Floral Diversity Profile of Mount MakilingForest Reserve, Luzon, Philippines
William Sm. Gruezo
Introduction
The study of plants provides a logical starting point for an understanding of the complexities inecological relationships. The photosynthetic plant stands as an indispensable intermediate power-house between the inorganic and organic realms. Any plant formation over a considerable tractof land plays a vital role in maintaining the balance of atmospheric oxygen and carbon dioxide. Itis also important in regulating the water regime and all essential biogeochemical cycles of anyarea. Another key function of vegetation is its scenic and aesthetic role. Much that we valuevisually in the landscape is the result of a subtle blend of topography and the physiognomicstructure of vegetation, regardless of whether occurring naturally or as a result of man's effort.Our aesthetic appreciation of these landscape elements inculcates in us the indispensable primaryrole of plants in the maintenance of the overall integrity, productivity, stability, andsustainability of terrestrial ecosystems.
In Mount Makiling Forest Reserve, the mossy forest zone begins at an altitude of 900 m and hasits greatest development within the vicinity of the reserve's three highest peaks (with heights of1,085, 1,090, and 1,109 m). With the exception of the well-trodden access trail from theMudsprings area to Peak 2, the mossy forest zone is apparently the least disturbed portion ofMount Makiling in terms of its floristic components. The dipterocarp mid-montane forest zoneof Mount Makiling starts at an elevation of about 100 m and reaches its upper limit at 900 mwhere it merges with the mossy or cloud forest. With the exception of the poorly maintainedaccess road from the University of the Philippines at Los Banos (UPLB) College of Forestrycampus, the northwest aspect of Mount Makiling is little disturbed compared with the otherslopes where grasslands, shifting cultivation, and agroforestry areas are found. From the vicinityof the College of Forestry to the Mudsprings area, the dipterocarp forest in certain sites hassubstantially recovered its natural vegetation structure. This is in part attributed to the gentlernorthern slope and abundance of rain on this side of the mountain owing to its proximity toLaguna Lake. Therefore, it is quite timely to study the different factors responsible for therelatively rapid restoration of the dipterocarp forest at this site and to examine the influence thatthis zone has on the adjacent ecosystems.
The dipterocarp mid-montane forest zone of Mount Makiling has been the most botanicallyexplored zone of this mountain; yet, no quantitative floral diversity measurement was ever done.Whatever inventories of its floristic components have been done are scattered in a number ofseparate and unrelated publications. Nevertheless, a conservative inventory of the flora of MountMakiling and the vicinity determines its composition to be as follows: 949 genera, 2,038 species,19 subspecies, 167 varieties, and several forms and cultivars of ferns and flowering plantsbelonging to some 225 families (Pancho 1983). There is no record of any comprehensive attemptto determine the levels of floral diversity that exist in the various vegetative zones of this
153

154 William Sm. Gruezo
biologically important mountain. Moreover, the factors responsible for the maintenance of itshigh floral diversity level have never been examined in relation to socioeconomic and otherfactors that affect mountain environment.
Therefore, the present study has the following objectives: (1) to determine the levels of floraldiversity in the mossy forest, dipterocarp mid-montane forest, grassland, and agroforestry zonesof Mount Makiling; (2) to determine the economic, functional, and ecological roles of the floralelements of both the natural and human-influenced ecosystems; and (3) to determine the factorsresponsible for the maintenance of floral diversity.
Methodology
Within the mossy forest zone (1,040 m elevation) of Mount Makiling (Peak 2), three circularplots each with a diameter of 10 m were established on the western, southern, and northernslopes. Each circular plot was divided into 4 quadrants using the four cardinal directions:Quadrant I (NE), Quadrant 2 (SE), Quadrant 3 (NW), and Quadrant 4 (SW). An inventory of allplants and measurement of relevant parameters (see below) was carried out, proceeding fromQuadrant 1 through Quadrant 4 of each plot.
In the dipterocarp mid-montane forest zone (300-900 m elevation), a line transect-circular plottechnique of plant inventory was employed. A line transect was established within the zone, anda series of circular plots (each with a diameter of 40 m) was established along the transect. Thedistance between the sample plots varied from 150 to 200 m. Each plot was divided into fourquadrants in the same way as just described for the mossy forest zone. A total of 18 sample plotswere established and measured. These 18 study plots were distributed among four locations asfollows: (1) Mudsprings Side A (5 plots), (2) Puting Lupa (3 plots), (3) Mudsprings Side B (6plots), and (4) above the National Arts Center (4 plots).
Two locations were chosen for the grassland zone: Puting Lupa, Calamba, and Sitio Nagtalaok-Saimsim, Los Banos. A line transect was established in these zones, but square sample plots,each measuring 4 m by 4 m, were established in lieu of the 40-m diameter circular plots used inthe dipterocarp mid-montane zone. Each square plot was also divided into four quadrants in thesame manner as the circular plots. Due to the relatively small size of the grassland zone, thedistance between plots varied from just 20 to 100 m. Ten sample plots were established: fourplots in Puting Lupa and six plots in Sitio Nagtalaok-Saimsim.
For the agroforestry zone, three localities were chosen: (1) Barangay Bagong Silang, Los Banos;(2) Sitio Karay, Barangay Pansol, Calamba, and (3) Magnetic Hill, Barangay Timugan, LosBanos. These localities all have swidden fields situated between 350 and 750 m elevation. Theselection of swidden fields to be studied was based on a list of farmers recommended by theproject's economist, Dr. Hermie A. Francisco. A total of fifteen swidden farms were sampled:nine farms in Bagong Silang area, and three farms each in Sitio Karay and Timugan sites. Onecircular plot (c. 1/8 hectare) was established for each swidden field, positioned in the middle ofthe farm. The size of the sampled swidden fields ranged from 2 to 5 hectares.
In all, 46 study plots were established within the boundaries of the Mount Makiling ForestReserve, distributed among four landscape zones (Table 8.1). For each of these sample plots,vegetation parameters such as habit, frequency, height, diameter at breast height (of plants 10 cm

Floral Diversity Profile of Mount Makiling Forest Reserve, Philippines 155
Table 8.1 Number and location of study plots for floral diversi ty assessment
Ecosystem zone Plots (no.) LocationA. Mossy Forest 3 Peak 2; 1040 m elevation
Subtotal 3
B. Dipterocarp mid-montane 5 NE-facing slope, above Mudsprings area;forests 550-700 m elevation
3 NW-facing slope, Puting Lupa, Calamba;725-850 m elevation
6 SE-facing slope, above Mudsprings area,Los Banos; 600 m elevation
4 N-facing slope, above National ArtsCenter, Los Banos; 700 m elevation
Subtotal 18
C. Grassland ecosystem 4 NW-facing slope, Puting Lupa, Calamba;475-625 m elevation
6 S-facing slope, Nagtalaok-Saimsim, LosBanos; 700 m elevation
Subtotal 10
D. Agroforestry ecosystem 8 SE-facing slope; Bagong Silang, LosBanos; 525-550 m elevation
1 SE-facing slope, Talahiban Bay; 230 melevation
3 N-facing slope; Karay, Pansol, Calamba;700 m elevation
3 N-facing slope, Magnetic Hill, Timugan,Los Banos; 350 m elevation
Subtotal 15Total no. of plots: 46
or more in girth) were measured, except for the grassland zone where species identity andnumber of individuals per species (pg were the only parameters measured. Diversity levels werecalculated using the Shannon-Weiner diversity (H') formula. Intra- and inter-zonal comparisonswere carried out by using Shannon-Weiner Diversity Index (H'), as well as the Similarity Index(SI) and a measure of species richness (S). Photo documentation of study sites and significantfloristic elements was also carried out, in conjunction with preparation of standard herbariumspecimens' for all taxa studied.
Floral Diversity Profile
Species Diversity in the Mossy Forest Zone
Generally, the mossy forest zone of Mount Makiling includes all areas above the 900 m altitudeand includes three prominent peaks of this mountain, labeled as Peaks 1, 2, and 3 (with referenceto their relative proximity to UPLB [Pancho 1983]). Peak 2, with an elevation of 1,090 m, is themost accessible portion of the mossy forest zone, due to the presence of a well laid-out foot trail

156 William Sm. Gruezo
system that starts from the end of the rough road connecting the university campus and theMudsprings area.
The mossy forest zone is characterized by the presence of a dense growth of epiphyticbryophytes (liverworts and mosses) on the crooked, moist trunks of dwarfed trees. The moreprominent tree species present in the mossy forest zone are Elaeocarpus argenteus, Perseaphilippinensis, Litsea villosa, Clethra lancifolia, Sauraria latibractea, and Astronia candolleana,among others. These trees average about 5 m in height. In addition, the forest floor of the mossyforest zone is typically covered with a dense growth of herbaceous plants such as Elatostemaviridescens, E. lagunense, Coleus igolotorum, and a number of Selaginella species (e.g., S.biformis, S. delicatula, S. involvens, S. jagorii, and S. nummularia), among others.
Three species of tree ferns (Cyathea callosa, C. contaminans, and C. loheri) are also common,together with a number of ferns and flowering plant epiphytes such as Asplenium cymbifolium, A.polyodon, A. tenerum, Belvisia mucronata, B. platyrhynchos, Crypsinus lagunense, Oleandramaquilingensis, Aeschynanthus philippinensis, Dichrotrichum chorisepalum, Begonia aequata,Freycinetia vidalii, F. cumingiana, F. multiflora, Medinilla myriantha, M. myrtiformis,Peperomia lagunaensis, and Hoya odorata, among others. Two species of palms, one climbing(Calamus dimorphocanthus) and one erect (Pinanga philippinensis), extend their distributionrange up to the summit area of Mount Makiling.
Appendix Table 8.1 provides a list of vascular plants currently growing within the mossy forestzone of Peak 2. Table 8.2 shows species Diversity Indices for the Mount Makiling mossy forestzone of H' =3.56972, with a total of 95 species distributed in 73 genera and 48 families. Thewest-facing aspect (Plot 1) of Peak 2 yielded the highest number of species (S=65) and thehighest Diversity Index (H'=3.98915), while the south-facing slope (Plot 2) had the secondhighest number of species (S=57) but had the lowest Diversity Index (H' =2.72585) among thethree sample plots. The 57 species recorded from Plot 2 are distributed among 47 genera and 35families, while the 46 species found in Plot 3 are distributed among 37 genera and 28 families.
Table 8.2 Species Diversity Indices in the mossy forest zone'
Plot no. N S Rank H' value Rank
1 179 65 1 3.98915 1
2 458 57 2 2.72585 3
3 94 46 3 3.57976 2
Total 731 95b - 3.56972 -a. For a complete inventory of plants, see Appendix Table 8.1.b. Many species occurred in more than one plot.
Interplot comparison reveals that Plots 2 and 3 had the lowest Similarity Index at SI=2.91percent, followed by Plots I and 3 at SI=5.41 percent, and Plots I and 2 at SI= 10.66 percent.These values indicate that each aspect of the mossy forest zone harbors a high number of plantspecies uniquely adapted to that particular microhabitat. For example, 23 species are recordedonly from Plot 1, and 14 and 11 species are unique to Plots 2 and 3, respectively. Oneconservation-related implication of this finding is that in order to maximize species diversity in

Floral Diversity Profile of Mount Makiling Forest Reserve, Philippines 157
the mossy forest zone, all aspects of the summit area of Peaks 1, 2, and 3 should be treatedequally as critical habitats of endemic and indigenous plants.
Species Diversity In the Dipterocarp Mid-montane Forest Zone
The dipterocarp forest ranges from 100 to 500 m in elevation. It is known as the "High Forest"due to the historic dominance of very tall, timber-producing species belonging to the familyDipterocarpaceae. This forest type exhibits some state of deciduousness, particularly during thedry season. The dipterocarp forest persists today beyond the periphery of two distinct enclaves ofgrasslands, several large abandoned agricultural clearings, and sporadically scattered more-or-less permanent farms.
Above 500 m elevation, another zone begins marked by the presence of tree species belonging tofamilies other than Dipterocarpaceae, such as Myrtaceae, Sapotaceae, Dilleniaceae, Moraceae,Saurauriaceae, Annonaceae, Sterculiaceae, and Tiliaceae, among others. Two distinct layers areformed by these trees: the upper ("A") story is composed of large trees reaching a height of 25-35 m, while the lower ("B") story has shrubs and trees that grow as high as 10 m. This forestzone extends up to 900 m elevation in the Mount Makiling Forest Reserve, and it has beenclassified as mid-montane forest, or simply rainforest. Little is done with the foregoingdistinction between the dipterocarp and mid-montane forest zones in this study as no cleardemarcation between the two could be made on the ground due to rarity of the dipterocarps.Instead, the two vegetation types have been combined to form what is referred to here as the"dipterocarp mid-montane" forest zone. It should be noted that except for a small patch ofdipterocarp-dominated secondary forest directly above the National Arts Center (Los Banos,Laguna), the other localities originally classified as dipterocarp forests, or said to be part of thedipterocarp zone of Mount Makiling Forest Reserve, are shown in this study to be depauperate ofdipterocarp species. At present, the most dominant tree species on these sites is Diplodiscuspaniculatus of the family Tiliaceae, locally known as balobo. Its abundance in this zone isattributed to the fact that its fruits are eaten by birds and mammals, and to a lesser degree byhumans. Its seeds are thus widely and effectively distributed by these dispersal agents.
Based on the data obtained from the study's 18 sample plots, the dipterocarp mid-montane forestzone of Mount Makiling Forest Reserve comprises 373 species distributed among 236 generaand 95 families. Although this ecosystem zone has the highest number of species of any zonestudied on the mountain, its Diversity Index ranked second to that of the agroforestry zone, withan aggregate index value of H' =3.89713 and a range of H'=2.19730 to 3.93594 (Table 8.3). Ofthe 373 species recorded, 64 are endemics and 309 species are native or indigenous. Oneintroduced timber species, large-leafed mahogany (Swietenia macrophylla), is now successfullygrowing wild in nearly pure stands in isolated spots within this zone. The relative plant density inthe dipterocarp mid-montane forest zone ranges from 142 to 2,824 individuals per study plot(area=0.8 hectare), and the plot species richness value ranges from 38 to 102. Appendix Table8.2 gives an inventory of vascular plants in the dipterocarp mid-montane forest zone based onthe 18 study plots, including the zone's aggregate Diversity Index.
In its well-structured forest canopy, the dipterocarp mid-montane forest zone harbors a uniquearray of plants such as Strongylodon macrobotrys, known commercially as jade vine (familyPapilionaceae); Medinilla magnifica, locally called kapa-kapa (family Melastomataceae);Rafflesia manillana (family Rafflesiaceae)—a root of Cissus sp., a woody vine of the
158 William Sm. Gruezo
Table 8.3 Species diversity indices in the dipterocarp mid-montane forest zone'Site/plot no. Code N S Rank H' value Rank
I. Mudsprings Side A1 DIP14 394 87 4 3.92652 22 DIP15 142 40 14 3.07778 83 DIP16 267 52 11 3.40236 44 DIP17 442 38 15 2.43126 155 DIP18 332 45 13 2.78695 12
Mudsprings Side A DIP14-18 1577 143 - 3.65083 -
II. Puting Lupa, Calamba, Laguna1 DIP19 647 77 8 3.24920 62 DIP20 926 74 9 2.61172 133 D1P21 281 46 12 3.09627 7
Puting Lupa DIP19-21 1854 129 - 3.21201 -
III. Mudsprings Side B1 DIP22 1511 86 5 2.92675 102 DIP23 2824 87 4 2.92516 113 DIP24 1417 85 6 2.93595 94 DIP25 1756 95 2 2.38292 175 DIP26 1468 68 10 2.19730 186 D1P27 1098 93 3 3.37687 5
Mudsprings Side B DIP22-27 10074 225 - 3.33879 -
IV. Above National Arts Center (NAC), Los Banos1 DIP28 834 102 1 3.93594 12 D1P29 846 87 4 3.57346 33 DIP30 1285 78 7 2.43068 164 DIP31 1494 93 3 2.55406 14NAC DIP28-31 4460 194 B 3.73695 -
Dipterocarp mid- DIP14-31 17965 373 - 3.89713montane forest zone
a. For inventory list of plants, see Appendix Table 8.2; total number of study plots, 18.
family Vitaceae (grape family); and Dillenia reifferschidia (family Dilleniaceae). The first threespecies are now officially listed among the 72 highly endangered plants of the Philippines (Tan,Fernando, and Rojo 1986; Gruezo 1990).
A number of climbing palms or rattans and lianas 2 characteristically grow among the trunks andbranches of the tall and medium-sized trees that compose the "A" and `B" forest canopy layers.
Floral Diversity Profile of Mount Makiling Forest Reserve, Philippines 159
The ground layer is occupied by ferns, fern allies (lower vascular plants closely related to ferns),herbs, and shrubs' that typically grow on moist, litter-rich forest soils.
In addition, a number of epiphytes drape the branches and trunks of trees, such as bird's nestferns (Asplenium cuneatum, A. excisum, A. nidus, A. pellucidum, A. vittaefolium) and orchids(Eria philippinensis, Plochoglottis copelandii, and Phalaenopsis amabilis). The last-namedspecies represents a rare find in the Mount Makiling Forest as this orchid is erroneouslyclassified by many local orchid collectors as "extinct in the wild." Another component of thedipterocarp mid-montane forest are the parasitic plants normally found growing on trunks andbranches of towering trees. The most conspicuous ones are the strangler figs such as Ficus baleteand F. subulata (family Moraceae) that attack the huge, overmature trees of the "A" forestcanopy layer.
Species Diversity in the Grassland Zone
Puting Lupa, Calamba, Laguna. In the grassland zone of Puting Lupa, talahib (Saccharumspontaneum) dominates on ridge slopes and shallow depressions. Small patches of cogon(Imperata cylindrica) are found on ridge tops and along the trail leading to the dipterocarp mid-montane forest zone. Appendix Table 8.3 provides an inventory of plants in the grassland zone,together with the species Diversity Index. A comparison of Diversity Index values (using theShannon-Weiner formula) and species richness (S) values for the four plots is shown in Table8.4.
Table 8.4 Species Diversity Indices in the grassland ecosystem zone'
Site/plot number N S Rank H' value Rank
I. Puting Lupa, Calamba, Laguna1 1225 20 1 1.09166 82 1018 5 7 0.76196 103 501 12 3 1.23555 64 1007 14 2 1.25633 4
Summary 3751 34 A 1.35662 -
II. Nagtalaok-Saimsim, Bagong Silang, Los Banos1 338 8 4 1.11767 72 244 5 7 1.31415 2
3 235 8 4 1.58039 14 238 7 5 1.24991 55 187 8 4 1.29449 36 249 6 6 0.81207 9
Summary 1491 15 B 1.34965 -
Grassland ecosystem 5242 44 - 1.66438 -
a. For inventory list of plants, see Appendix Table 8.3; total number of study plots, 10.

160 William Sm. Gruezo
Plot 1 had the highest species richness (S), with 20 species, while Plot 2 had the lowest numberof species with just 5. Plots 3 and 4 had 12 and 14 species, respectively. Using the Shannon-Weiner index of biodiversity (H'), Plot 4 had the highest value (H' = 1.25633), while Plot 2 hadthe lowest index value (H' =0.76196). Plots 3 and I had H' values of 1.23555 and 1.09167,respectively. These results suggest that in order to conserve biodiversity in the grassland zone,there is a need to conserve multiple grassland areas similar to that of the mossy forest.
In addition to the two common grass species found in this zone (Saccharum spontaneum andImperata cylindrica), two other species of grasses were frequently noted, namely Apluda muticaand Pennisetum purpureum. The latter species was purposefully introduced into this site forherbage production and has become naturalized. It is worth recording here that three species ofground orchids, namely Geodorum nutans, Habenaria malintana, and Nervilia discolor, werefound growing between culms of grasses and in association with a few broad-leafed species,such as Calopogonium mucunoides, Desmodium triflorum, Knoxia corymbosa, Urarialagopodioides, Elephantopus scaber, Pseudelephantopus spicatus, and Ichnocarpus volubilis. Atotal of 34 species distributed among 31 genera and 15 families were recorded from this portionof the grassland ecosystem in Puting Lupa. This locality had an overall Diversity Index value ofH'= 1.35662 (Table 8.4).
Nagtalaok-Saimsim, Los Banos, Laguna. The grassland zone in Sitio Nagtalaok-Saimsim(Bagong Silang, Los Banos) is composed of only 15 species and had a Diversity Index ofH'= 1.34965. The dominant grass species in this grassland portion of Mount Makiling is talahib(Saccharum spontaneum), while cogon (Imperata cylindrica) is apparently absent. However,four other grass species are variously associated with talahib, a fern, and a few broad-leafedplants. The four grass species are Pennisetum purpureum, Rottboellia exaltata, Setariapalmifolia, and Paspalum conjugatum, while the few broad-leafed species present in thisgrassland ecosystem are Ficus ulmifolia, Lantana camara, Hewittia sublobata, Ichnocarpusvolubilis, Melothria indica, Paederiafoetida, Pericampylus glaucus, and Pueraria phaseoloides.With the exception of the first two species, the rest are vines or lianas often using the stem oftalahib as trellis. A single fern, Sphaerostephanos unitus, is also found growing in this zone.
Table 8.4 shows a comparison of species Diversity Index among six study plots and between thetwo localities in the Mount Makiling Forest Reserve where grassland ecosystems are present.Among the six study plots, the highest Diversity Index was obtained in Plot 3 with H'=1.58039,while the lowest Diversity Index of H' =0.81207 was seen in Plot 6. Plot 3 contained 8 species,while Plot 6 had 6 species.
Diversity Levels in the Agroforestry Zone
The agroforestry zone in the Mount Makiling Forest Reserve is largely a mosaic of the followingtypes (Table 8.5): (1) coconut plantations intercropped with coffee, bananas, and othercommercial fruit trees (Plots AGR32, 34, 36, 38-40); (2) citrus orchards bounded by second-growth forests (Plot AGR35); (3) citrus orchards enclosed by large tracts of coconut plantations(Plot AGR33); (4) old coffee plantations (partly abandoned) adjacent or swamped by maturesecondary forests (Plot AGR37); (5) mixed-fruit plantations with aroids, pineapple, andvegetables (Plots AGR36, 44, 45), and (6) newly opened swidden fields abutting maturesecondary forests (Plots AGR41-43). Because of the nature of this category, different sites orlocalities classified as agroforestry areas exhibited different levels of floral diversity (Table 8.5).The highest and lowest Diversity Indices, however, were obtained from intercropped coconut

Floral Diversity Profile of Mount Makiling Forest Reserve, Philippines 161
Table 8.5 Species diversity indices in the agroforestry zone'Site/plot number Code N S Rank H' value RankI. Bagong Silang, Los Banos
1 AGR32 1152 48 11 3.03852 10
2 AGR33 738 32 13 2.72409 13
3 AGR34 1056 65 7 3.17212 9
4 AGR35 1327 37 12 2.79448 12
5 AGR36 2705 54 10 2.45358 14
6 AGR37 1991 79 5 3.22453 7
7 AGR38 405 18 15 2.41104 15
8 AGR39 466 29 14 2.88390 11
9 AGR40 1309 63 8 3.33868 5
Summary
II. Karay, Calamba, Laguna
1
2
3
AGR32-40 11149 222 - 3.80569 -
AGR41 1300 96 1 3.59015 2
AGR42 1114 90 2 3.45564 4
AGR43 1353 76 6 3.25375 6
Summary AGR41-43 3767 176 - 3.94030 -
III. Magnetic Hill, Timugan, Los Banos
1 AGR44 943 83 3 3.86998 1
2 AGR45 1184 82 4 3.53976 3
3 AGR46 531 59 9 3.20049 8
Summary AGR44-46 2658 159 - 4.14000 -
Overall summary AGR32-46 17574 368 - 4.28690
a. For inventory list of plants, see Appendix Table 8.4; total number of study plots, 15.
plantations, with H' values of 3.33868 (Plot AGR40) and 2.41104 (Plot AGR38), respectively(Table 8.5). In terms of species number, the two highest were obtained from study plots in Karaywith S=96 (Plot AGR41) and S=90 (Plot AGR42), respectively, with the lowest number ofspecies obtained from Bagong Silang with S= 15. The very high total number of species obtainedfrom Karay is attributed to the fact that these sites are newly opened swidden fields that are veryclose to the natural forests. In these two study plots, the total number of forest species recordedwas also relatively high, 50 and 72, for Plots AGR41 and 42, respectively. In addition, one ofthese two sites exhibited very high ratios of crop to forest species and weed to forest species(Table 8.6).
Thirty-five crop species, 53 weed species, and 140 forest species were recorded from the studyplots established in Bagong Silang and vicinity, while 29 crop species, 33 weed species, and 114
162 William Sm. Gruezo
Table 8.6 Comparison of plant diversity levels in fifteen study plots established within the agroforestry zoneaccording to functional roles; shown also are numbers of families, genera, and species recorded for each study plot
Number/ratio' NumberSample Crop Weed Forestplot code' species species species Families Genera Species H' value Rank
AGR32 14 21 13 28 46 48 3.06213 10l C:2W I C:IF I W:2F
AGR33 9 13 9 23 30 31 2.64645 132C:3W I C:IF 3W:2F
AGR34 13 22 30 35 58 65 3.16962 9I C:2W I C:2F 2W:3F
AGR35 15 12 10 22 35 37 2.40759 123C:2W 3C:2F I W:1F
AGR36 9 7 38 32 51 54 2.23536 14
I C:1 W I C:4F 1 W:5F
AGR37 3 12 64 44 74 79 3.23752 7I C:4W 1 C:21F I W:5F
AGR38 4 13 1 12 18 18 2.41104 15I C:3W 4C:1F 4W:IF
AGR39 8 11 10 19 27 29 2.88390 114C:5W I C:IF 1 W:IF
AGR40 10 25 28 33 60 60 3.33868 52C:5W 1 C:3F I W:IF
AGR41 24 22 50 50 88 96 3.59015 21 C:1W 1 C:2F I W:IF
AGR42 7 11 72 53 84 90 3.45564 4I C:2W I C:IOF I W:IOF
AGR43 12 22 42 45 67 76 3.22537 6I C:2W I C:4F I W:2F
AGR44 15 40 28 40 76 83 3.86998 1I C:3W I C:2F 4W:3F
AGR45 26 26 30 36 74 82 3.53976 3I C:IW I C:1F 1 W:1F
AGR46 15 19 25 48 46 59 3.20049 83C:4W 3C:5F 4W:5F
a. For exact location of study plots, see Table 8.1.b. C = crop species; W = weed species; F = forest species.

Floral Diversity Profile of Mount Makiling Forest Reserve, Philippines 163
forest species were obtained from Karay. The study sites in the vicinity of Magnetic Hill,Timugan, had a total of 35 crop species (10 annuals and 25 perennials), 62 weed species, and 62forest species (Appendix Tables 8.4a—c).
Comparative Analysis of Diversity Levels
Intra-zonal Comparison
Mossy Forest Zone. The level of floral diversity in this zone is highest in the east-facing slope(Plot 1) both in terms of Shannon-Weiner index (H' =3.98915) and species richness (S =65). Thisportion of Peak 2 is adjacent to a cliff; hence, it is not commonly frequented by visitors, and thevegetation therefore remains relatively undisturbed. On the other hand, the north-facing slope(Plot 3) had slightly lower Diversity Index value (H'=3.57976) and species richness (S =46) thanthe east-facing slope (Plot 1). This slight decrease in diversity may be attributed to humanactivity. Small stands of rattans, which are being harvested from time to time by the local people,are still present up to this elevation. In the process, undergrowth plants are intentionally cut tomake trails for easy transport of rattan canes, as well as other ornamental plants such as bird'snest ferns, orchids, and medinillas.
The lowest species Diversity Index value was recorded from the south-facing slope (Plot 2) ofPeak 2 with H'=2.72585. However, this site had the second highest total number of species,S=57. The relatively low Diversity Index value might be attributed to frequent human incursionsto this side of Peak 2, mainly from nature-trekking activity of local tourists as well as thosegathering minor forest products, such as rattans and ornamental plants (orchids and bird's nestferns).
Overall, the floral diversity of Mount Makiling Peak 2 ranked third of four ecosystem zones withH'=3.56972 and total number of species, S =95. Of these 95 species, 27 species are consideredunique to the summit area of Mount Makiling. These are Coleus igolotorum, Medinillamyriantha, M. myrtiformis, Mussaenda anisophylla, Elaeocarpus argenteus, Aeschynanthusphilippinensis, Clethra lancifolia, Weinmmania luzoniensis, Angiopteris cartilagedens, Alpiniahaenkei, Asplenium cymbifolium, Araiostegia hymenophylloides, Belvisia platyrhynchos,Calanthe lyroglossa, Crypsinus lagunense, Dichrotrichum chorisepalum, Elaphoglossumluzonicum, Euodia villamilii, Eurya nitida, Gleichenia longissima, Grammitis jagoriana,Goniophlebium subauriculatum, Ilea macrophylla, Leea nitida, Polystichum horizontale,Trichomanes apiifolium, and Rubus rosaefolius. All these plants are either endemic orindigenous to Mount Makiling as well as to the entire Philippines.
Dipterocarp Mid-montane Forest Zone. Among 15 study plots established within thedipterocarp mid-montane zone, the highest floral diversity level was obtained from one of fourstudy plots located immediately above the National Arts Center, Los Banos, Laguna. This site(Plot Code D1P28; Table 8.3) had a Shannon-Weiner index value of H' =3.93594. The same plothad the highest number of species, with S = 102. The second highest Diversity Index value wasobtained from the first study plot established in the vicinity of Mudsprings Side A, withH'=3.92652 and species richness of S =87. This was followed by another site (Plot Code DIP29)above the National Arts Center, with H' =3.57346 and S=87. On the other hand, the lowest

164 William Sm. Gruezo
Diversity Index value was observed from the vicinity of Mudsprings Side B with H'=2.19730and S=68 (Table 8.3).
Comparison of four study localities shows that the dipterocarp mid-montane forest above theNational Arts Center had the highest aggregate site Diversity Index value, H'=3.73695, andsecond highest total number of species, S=194. This was followed by Mudsprings Side A with asite aggregate Diversity Index value of H' =3.65083 and S=143. Mudsprings Side B ranked third,with H'=3.33879 and S value of 225, which was the highest total number of species among fourstudy localities. The dipterocarp mid-montane forest in Puting Lupa (Calamba, Laguna)apparently had the lowest site aggregate index value, H'=3.21201, as well as total number ofspecies, S=129 (Table 8.3).
No dipterocarp species was found in the Puting Lupa site, while Mudsprings Side A had twospecies, Parashorea malaanonan (N=3) and Shorea contorta (N=3). On the other hand,Mudsprings Side B had only one species, Shorea contorta (N=1). The highest density record fordipterocarp species was from the vicinity of the National Arts Center where two species werefound, Parashorea malaanonan with N=215 and Shorea contorta with N=35. The zoneaggregate Shannon-Weiner index value for dipterocarp mid-montane forest zone wasH'=3.89713, with a total of 373 species (Table 8.3). In terms of Diversity Index value, thedipterocarp mid-montane forest zone ranked second among the four ecosystem zones and first interms of total number of species, as well as species abundance (Table 8.7).
Table 8.7 Inter-ecosystem zone comparison of species diversity in MountMakiling Forest Reserve, Luzon, PhilippinesEcosystemzone N S Rank H' value RankMossy zone 731 95 3 3.56972 3
Grassland 5242 44 4 1.66438 4zone
Dipterocarp 17965 374 1 3.89713 2mid-montaneforest zone
Agroforestry 17574 368 2 4.28690 1zone
Overall 41512 682 - 4.65500 -
As for species composition, there are three endangered plant species unique to the dipterocarpmid-montane forest zone, namely Strongylodon macrobotrys (jade vine), Medinilla magnifica(kapa-kapa), and Rafflesia manillana, a parasitic plant on roots of a woody vine—Cissus sp. offamily Vitaceae. All three taxa have Mount Makiling Forest Reserve as their type locality.
Grassland Zone. In Mount Makiling Forest Reserve, there are only two localities wheregrassland ecosystem is found—in Puting Lupa, Calamba, and Sitio Nagtalaok-Saimsim, BagongSilang, Los Banos. In both localities, it is apparent that maintenance of grassland ecosystem is

Floral Diversity Profile of Mount Makiling Forest Reserve, Philippines 165
primarily influenced by human activity that often culminates in occurrence of wildfire. Thisbeing the case, these two grassland sites are anthropogenic in origin and nature.
Vegetation analysis of these two localities indicates that the grassland in Puting Lupa isdominated by Imperata cylindrica, while the Nagtalaok-Saimsim grassland is dominated bySaccharum spontaneum. In the latter locality, however, I. cylindrica is completely absentwhereas in the former, S. spontaneum is present in certain low-lying portions as well as inmoderately sloping areas where secondary forests are present on the upper slopes.
In terms of floral species diversity, Puting Lupa grassland had a slightly higher Shannon-Weinerindex value than Nagtalaok-Saimsim grassland, H' = 1.35662 versus H'= 1.34965. As for totalnumber of species, the Puting Lupa grassland area had more than twice the number of speciespresent in the Nagtalaok-Saimsim area (i.e., 34 versus 15). Within each locality, however,variation in species number per plot was more pronounced in Puting Lupa grassland, with arange of 5 to 20. In Nagtalaok-Saimsim grassland, the number of species per plot ranged from 5to 8. The data also show that on a per plot basis, the highest Diversity Index value of H'=1.58039was obtained from a study plot (Plot Code GRS10) in Nagtalaok-Saimsim grassland area, whilethe lowest Shannon-Weiner index value was from a study plot (Plot Code GRS5) situated inPuting Lupa grassland area (Table 8.4). This finding suggests that the grassland zone in MountMakiling Forest Reserve is dynamically heterogeneous with regard to species number andcomposition. In general, the grassland zone in Mount Makiling Forest Reserve had the lowestzone aggregate Diversity Index (H'=1.66438) and total number of species (S =44) among the fourecosystem zones (Table 8.7).
Agroforestry Zone. A total of 367 species in 290 genera of plants were recorded from 15 studyplots established within the agroforestry zone of Mount Makiling Forest Reserve. This total canbe broken down into 45 crop species (18 annuals and 27 perennials, ratio of 1:1.5), 79 weedspecies, and 243 forest species (Appendix Tables 8.4a—c). The crop species component of theagroforestry zone can be further classified into 24 fruit tree species, 15 vegetable species, 7 root-crop species, 4 ornamental or landscape species, 3 species for beverage, 3 condiment/spicespecies, 3 species for soil erosion control, 2 species each as fuelwood and construction material,and one species each for masticatory use, cover crop, dye plant, and herbal medicine use(Appendix Tables 8.4a—c). Apparently, the ratio of crop to forest species is 1:5; crop to weedspecies, 2:3; and weed to forest species, 1:3 (Table 8.6). The overall ratio of crop to weed toforest species is 2.3:10, while the ratio of introduced species (crop and weed species) toindigenous species is 1:2 (Table 8.8). These ratios may serve as an initial guide in designingplanting combinations for specific site characteristics that would bring about conditions formaintaining high biodiversity.
Extended analysis of the weed component of the agroforestry zone reveals that many specieshave some positive alternative uses. Examples of these alternative functions are (1) source ofherbage/forage materials (14 species; see Appendix Table 8.4a for examples), (2) vegetables(i.e., Centella asiatica and Corchorus acutangulus), (3) cover crop or green fertilizer (e.g.,Calopogonium mucunoides, Pueraria phaseoloides, P. triloba), (4) edible fruit (Physalisangulata), and (5) herbal medicine (Peperomia pellucida). Undoubtedly, the rest of the otherspecies have some ecological functions such as sources of nectar for insects, birds, andmammals; fruits and seeds for frugivores; as habitats and sources of food for the myriads of

166 William Sm. Gruezo
Table 8.8 Comparison of native and introduced plant diversity levels in fifteen study plots in the agroforestry zone;shown also are numbers of families, genera, and species
Number/ratio Number
Sample Native Introducedplot code' species species Ratiob Families Genera Species H' value Rank
AGR32 13 35 1:2.7 28 46 48 3.06213 10
AGR33 9 22 1:2.4 23 30 31 2.64645 13
AGR34 30 35 1:1 35 58 65 3.16962 9
AGR35 10 27 1:2.3 22 35 37 2.40759 12
AGR36 38 16 1:0.4 32 51 54 2.23536 14
AGR37 64 15 1:0.2 44 74 79 3.23752 7
AGR38 1 17 1:17 12 18 18 2.41104 15
AGR39 10 19 1:1.9 19 27 29 2.88390 11
AGR40 28 35 1:1.3 33 60 60 3.33868 5
AGR41 50 46 1:0.9 50 88 96 3.59015 2
AGR42 72 18 1:0.3 53 84 90 3.45564 4
AGR43 42 34 1:0.8 45 67 76 3.225375 6
AGR44 28 55 1:2 40 76 83 3.86998 1
AGR45 30 52 1:1.7 36 74 82 3.53976 3
AGR46 25 34 1:1.4 48 46 59 3.20049 8
a. For exact location of study plots, see Table 8.1.b. Ratio of native species to introduced species (= crop species + weed species).
Floral Diversity Profile of Mount Makiling Forest Reserve, Philippines 167
insects that are common to both swidden fields and nearby natural secondary forests; and for soilerosion control (Appendix Table 8.4c).
A number of forest species present in the agroforestry zone of Mount Makiling Forest Reservehave other equally useful functions such as (1) source of edible fruits—Arenga pinnata (sugarpalm), Antidesma bunius, Diplodiscus paniculatus, Dillenia philippinensis, Kolowratia elegans,Diospyros blancoi, Syzygium polycephaloides, Terminalia microcarpa; (2) vegetables-Athyrium esculentum, Broussonetia luzonica, Parkia timorensis; (3) pulp and fibers—Ceibapentandra, Gmelina arborea, Anthocephalus cadamba; (4) ornamental or landscape plants-Alocasia heterophylla, A. portei, Aglaonema simplex, Adiantum philippense, Ardisiapyramidalis, Asplenium nidus, Bauhinia purpurea, Calanthe triplicata, Caryota cumingii,Caryota rumphiana var. philippinensis, Homalomena philippinensis, Lagerstroemia speciosa,and Livistona rotundifolia, among others (Appendix Table 8.4a).
Many forest species present in the agroforestry zone serve as pioneer species in ecologicalsuccession such as Homalanthus populneus, Macaranga tanarius, M bicolor, M grandifolia, M.hispida, Melanolepis multiglandulosa (all members of family Euphorbiaceae); Ficus septica, F.nota, F. variegata, F. guyeri, F. ulmifolia, Alangium chinensis, Alstonia macrophylla, A.scholaris, Trema orientalis, Cleidion speciflorum, Breynia cernua, Bridelia minutiflora, Colonaserratifolia, Illigera luzonensis, Kleinhovia hospita, Macrothelypteris polypodioides, Mallotusphilippensis, Phyllanthus reticulatus, Schizostachyum diffusum, and Semecarpus cuneiformis,among others.
A few saplings and/or seedlings of two species belonging to the prime timber-producing family,the Dipterocarpaceae, are also present: Hopea plagata and Shorea contorta. Other non-dipterocarp timber species are now quite common in the fringes of the agroforestry zone, whichare obviously becoming more dominant than dipterocarps. Examples of these species areBischofiajavanica, Canarium asperum, C. hirsutum, C. luzonicum, Celtis luzonica, Diplodiscuspaniculatus, Dracontomelon dao, Elaeocarpus calomala, Intsia bijuga, Litsea perrottetii,Pterospermum diversifolium, Pterocymbium tinctorium, Strombosia philippinensis, Toonacalantas, Turpinia pomifera, and Zizyphus talanai.
In addition to these indigenous forest species, four introduced or naturalized species are foundgrowing within the agroforestry zone, namely Ceiba pentandra, Gmelina arborea, Swieteniamacrophylla, and Spathodea campanulata. The first two species are a good source of fiber forpaper manufacture, while the third is for commercial timber, and the last is used as a landscapeplant. With its large, bright orange-red flowers clearly visible from a distance, and easilypropagated by cutting, the last-named species is also used as live boundary markers for swiddenfields as well as the perimeter of Mount Makiling Forest Reserve.
The range of Diversity Index for the agroforestry zone was from H'=2.41104 to 3.86998. Theformer value was obtained from a citrus orchard surrounded by large tracts of coconutplantations, while the latter was recorded from a mixed fruit-tree plantation with aroids,pineapples, and vegetables. The aggregate Diversity Index for this zone was H' =4.28690 andwas the highest among four ecosystem zones of Mount Makiling Forest Reserve. In terms oftotal number of species (S), the agroforestry zone ranked second to dipterocarp mid-montaneforest zone, with S=367, and a range of 18-96 species per study plot. Species abundance wasalso comparatively high, with a range from 405 to 2,705 individuals per study plot (Table 8.5).
168 William Sm. Gruezo
Inter-site Comparison
A summary of inter-site comparison of species diversity in Mount Makiling Forest Reserve isshown in Table 8.9. In this comparison involving 10 study sites, the mossy forest zone (MountMakiling Peak 2) was taken as one site, with grassland, agroforestry, and dipterocarp mid-montane forest being represented by 2, 3, and 4 study sites, respectively.
Table 8.9 Inter-site comparison of species diversityZone/site N S Rank H' value Rank
1.Mossy zone 731 95 8 3.56972 6
2. Grassland zonea. Puting Lupa,
Calamba, Laguna 3751 34 9 1.35662 9
b. Nagtalaok-Saimsim,Bagong Silang,Los Banos 1491 15 10 1.34965 10
3. Dipterocarp mid-montaneforest zonea. Mudsprings Side A 1577 143 6 3.65083 5
b. Puting Lupa, Calamba 1854 129 7 3.21201 8
c. Mudsprings Side B 10074 225 1 3.33879 7
d. Above NationalArts Center (NAC),Los Banos 4460 194 3 3.73695 4
4. Agroforestry zonea. Bagong Silang, Los Banos 11149 222 2 3.80569 3b. Karay, Calamba 3767 176 4 3.94030 2c. Magnetic Hill,
Timugan, Los Banos 2658 159 5 4.14000 1
Note: Total number of study sites, 10.
On a per site basis, the first three sites with the highest species Diversity Indices were all situatedwithin the agroforestry zone, namely (1) Timugan, H'=4.1400; (2) Karay, H'=3.94030, and (3)Bagong Silang, H'=3.80569. The fourth and fifth highest-ranked sites were located within thedipterocarp mid-montane forest zone (i.e, the site above the National Arts Center, H'=3.73695,and Mudsprings Side A, with H'=3.65083). The mossy forest zone ranked sixth, withH'=3.56972. This particular Diversity Index value was slightly higher than the two other studysites situated within the dipterocarp mid-montane forest zone (Table 8.9). As shown earlier, thetwo grassland sites had the lowest Diversity Indices among all study sites (Table 8.7).
The four highest total number of species per site were obtained from (1) Mudsprings Side B, (2)Bagong Silang and vicinity, (3) the study site above National Arts Center, and (4) Karay, with225, 222, 194, and 176 species, respectively. Two of these four sites were situated within thedipterocarp mid-montane forest zone (1 and 3) and the other two (2 and 4) in the agroforestry

Floral Diversity Profile of Mount Makiling Forest Reserve, Philippines 169
zone of Mount Makiling Forest Reserve. On the other hand, the lowest total number of specieswas obtained from Nagtalaok-Saimsim, with S =15 (Table 8.9). The results (using Shannon-Weiner diversity formula) show that the agroforestry zone has a slightly higher total number ofspecies than the dipterocarp mid-montane forest zone; the mossy forest zone ranks third; and thegrassland zone ranks last.
Site species Diversity Indices and species richness values vary from site to site within the sameecosystem zone and across the Mount Makiling landscape. This trend implies that appropriatenumber and size of representative patches of the different ecosystems should be maintained onMount Makiling in order to support and further enhance the current high biodiversity of thismountain environment.
Inter-Ecosystem Comparison
A comparison of aggregrate zonal Diversity Indices of the four ecosystem zones in MountMakiling Forest Reserve is given in Table 8.7. As shown earlier in the analysis, the agroforestryzone has the highest aggregate Diversity Index, H' =4.28690, followed by the dipterocarp mid-montane forest zone with H' =3.89713, the mossy forest with H'=3.56972, and then the grasslandzones with H'=1.66438. In terms of species richness (S), however, the dipterocarp mid-montaneforest zone is slightly higher than the agroforestry zone at 373 versus 368. The mossy forest andgrassland zones have relatively lower species with 95 and 44 species, respectively. Consideringboth orogenic and altitudinal factors prevailing on Mount Makiling, this trend in total number ofspecies is expected to occur in the absence of massive perturbation. The slight difference inDiversity Indices between dipterocarp mid-montane forest and the agroforestry zone is due to thepresence of a large number of introduced plant species in the agroforestry zone—primarilycultivated crops and their concomitant battery of weed species.
Inter-landscape Comparison
The overall Shannon-Weiner index of diversity obtained for Mount Makiling is H'=4.654937,with a total number of 682 species distributed among 444 genera and 126 families. Two similarstudies involving three of the same four ecosystem zones (excepting only the mossy forest zone)were done in the coastal areas of Nasugbu, Batangas Province (Gruezo 1996b) and TaalMountain Ridge-Laurel, Batangas Province (Gruezo 1966a). In the Nasugbu study area, a total of391 species in 311 genera and 93 families were recorded, with an aggregate Shannon-WeinerDiversity Index of H'=3.8558; while in the Taal Mountain Ridge-Laurel study area, a total of323 species in 250 genera and 90 families were obtained with an H' value of 2.28490. Thiscomparison clearly shows that Mount Makiling Forest Reserve still has one of the highest floraldiversity levels in this part of Luzon Island.
A comparison of the dipterocarp mid-montane forest zone of Mount Makiling with a similarforest type in Barangay Mahabang Lalim, General Nakar, Quezon Province (Luzon), reveals thatthese two sites have nearly the same Shannon-Weiner Diversity Index on a per plot basis. Thehighest H' value obtained in Mount Makiling dipterocarp mid-montane forest zone was 3.93954,while H' was calculated to equal 3.97837 for the dipterocarp forest in General Nakar, QuezonProvince (Gruezo 1993). In terms of species richness on a per plot basis, these two study sitesalso are similar: 102 species were recorded from Mount Makiling's dipterocarp mid-montaneforest zone, while 97 species were recorded from General Nakar's study site (Gruezo 1993).

170 William Sm. Gruezo
In similar studies in Thailand, the dry dipterocarp forest was calculated to have species DiversityIndex values (H') ranging from 1.9 to 3.0 (Sahunalu et al. 1979) and from 3.6 to 4.0 (Nilroung1986). These figures suggest that the Mount Makiling Forest Reserve has relatively high speciesdiversity for the region's dipterocarp mid-montane forest zone. However, Makiling's overallDiversity Index value (H'=4.28690) is still relatively low when compared with the range ofDiversity Index values recorded for tropical rainforest (in Thailand) of H'=5.0 to 6.2(Kiratiprayoon 1986).
Functional Roles of Floral Elements
An economic analysis of the plant diversity of Mount Makiling Forest Reserve, based on datafrom the project's 46 study plots, suggests that a variety of direct and indirect use values can bederived from its current high diversity level. Information on the economic importance of MountMakiling's plant components, as well as their functional roles in their respective ecosystems, iseither dispersed in older (prewar) literature or lacking altogether. In the present study, therefore,an effort was made to identify the functional roles of all plant species recorded from all studysites. Table 8.10 gives a summary of the functional roles attributed to the 682 species, rangingfrom a variety of direct economic benefits to benefits ecological or aesthetic in nature. In thistable, both actual and potential uses of species are given.
Table 8.10 Summary of functional roles attributed to682 species of flora in four ecosystem zonesFunctional role Species (no.)
Landscape/outdoor beautification 263Ornamentals 167Weeds 81Ecological 41Fruit trees/crops 36Cottage industry 21Timber source 20Medicinal 20Vegetables 13Poisonous 9Root crops 6Spice and condiments 4Green manure or fertilizer 3Soil erosion control 2Beverages 2Fuelwood 2Hair shampoo 1
It should be borne in mind that in the foregoing classification, a number of former economic usesmay now be outmoded. For example, Entada phaseoloides, locally known as gugo, is a woody

Floral Diversity Profile of Mount Makiling Forest Reserve, Philippines 171
vine whose bark was traditionally used as a source of shampoo. With the availability of modemshampoo in the market, the diminished gathering of this minor forest product has led to anincrease in the natural population. Recently, the sudden surge in demand locally andinternationally for herbal shampoo has led to renewed threat to this species. A similar caseinvolves toxic plants that are now classified as botanical pesticides such as Derris elliptica, D.philippinensis, and Chromolaena odorata. The two species of Derris are also used as fish poisonby local people so there is now some competition in harvesting of this species between localpeople and commercial companies. In the case of C. odorata, if its potential as a botanicalpesticide is borne out, then a completely new pattern of plant use will emerge and the marginallands on which it grows will develop.
Only about 110 species (16 percent) of the total number of species recorded in this study arebeing regularly or seasonally harvested by local swiddeners or residents. Apparently localswiddeners rely heavily on a few major crops (e.g., coconut, citrus, langsat, rambutan, coffee,bananas, aroids) for their income.
Indicator Species of Mount Makiling Biodiversity
Another outcome of this study is the recognition that some floral components can be used asindicator species in conducting rapid biodiversity assessment. Indicator species refers to "specieswhose status provides information on the overall condition of the ecosystem and of other speciesin that ecosystem" (Heywood 1995). The status of indicator species reflects the changes in thebiotic and abiotic conditions as well as species and community composition of ecosystems.
The selection of indicator species (whether keystone, functional, ecological, or economic) mustinclude field validation (through interview of local residents). Two of the criteria used inselection should be (1) occurrence of the species over a wide altitudinal range or a variety ofecosystems, and (2) the opposite situation where the species has a very limited occurrence, hasunique habitat requirements, or shares a similar morphological structure with other unrelatedspecies within the ecosystem. Below are some indicator species found in the Mount MakilingForest.
The nettle plant (Dendrochnide meyeniana) directly correlates with biodiversity across MountMakiling's landscape, except in the grassland zone. The aspects of this species that are valuablein gauging biodiversity status include stature and stage of maturity, and the abundance of matureplants in each ecosystem zone. The extent and degree of human intrusion can be discerned fromthe overall appearance and abundance of this species in the community.
The sugar palm (Arenga pinnata), like the nettle plant, has a direct correlation with biodiversityon Mount Makiling's landscape, especially in the dipterocarp mid-montane and agroforestryzones. It is correlated with the population density of large frugivorous animals like the palmcivet (Paradoxurus hermaphroditus subsp. philippinensis). Abundance of fruit-bearing plantsindicates less human intrusion of the ecosystem, while lack of fruiting plants and presence ofimmature plants indicate frequent collection of leaf midribs for broom-making by residents.
The succulent forest floor herbs such as Elatostema viridescens and E. lagunense have directcorrelation with biodiversity in all ecosystems, except in grasslands. Their abundance and
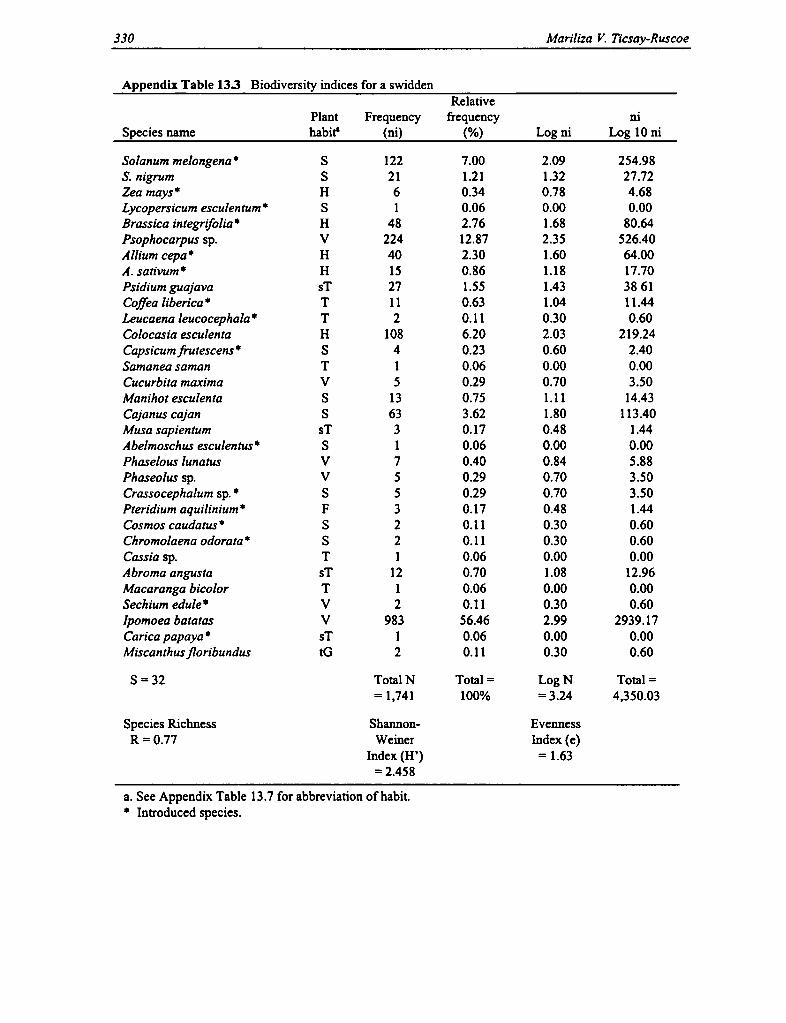
172 William Sm. Gruezo
closely spaced growth formations directly indicate no disturbance and indirectly denote highdiversity level.
The abundance and maturity of bird's nest ferns' (Asplenium nidus, A. cymbffolium, A. acne, A.cuneatum, A. excisum, A. pellucidum, A. polyodon, A. tenerum, and A. vittaefolium) directlycorrelate with absence of human disturbance; hence, they may indicate a high level ofbiodiversity, particularly in the mossy forest where these plants are easily collected due to shortstature of their substrate trees.
The ground orchids (e.g., Calanthe lyroglossa, C. triplicata, Geodorum nutans, Corymborchisconfusa, Habenaria malintana, H. hystrix) have direct correlation with biodiversity, particularlyin the dipterocarp mid-montane forest, mossy forest, and perhaps also in the grassland zone. Thepresence of abundant population signifies less human intrusion and, consequently, higher levelsof biodiversity.
The abundance and maturity of vines and woody climbers' (e.g., Dioscorea alata, D. elmeri,Connarus semidecandrus, Archangelisia ,lava, Anamirta cocculus, Cissus sp., Strongylodonmacrobotrys, and Entada phaseoloides) signify an intact multi-level forest canopy and higherbiodiversity. This is because these plants require large forest trees as trellis so that they can reachthe crown layer for more sunlight.
The usefulness of stranglers and parasitic plants (Ficus balete, F. subulata, F. concinna,Rafflesia manillana, Amyema sp., Taxillus estipitatus) as keystone species lies in the fact thatthese species play a major role in maintaining ecosystem structure and integrity. The manyspecies of Ficus (stranglers or not) and mistletoes provide a year-round supply of fruits to birdsand mammals. In return, these wildlife species ensure the perpetuation and maintenance of figsand mistletoe species on the exposed portions of forest canopy. The presence of rare parasiticplants like Rafflesia manillana indicates a high level of biodiversity because even a slightperturbation in forest dynamics results in the loss of its host. The high host specificity of thisparasitic plant makes it a sensitive measure of plant association. This is because its viny host, inturn, depends on the presence of many large forest trees for its proper growth and existence.
Edible and ornamental rattans (Calamus blancoi, C. merrillii, C. dimorphocanthus, C. discolor,C. ornatus, C. usitatus, Daemonorops mollis, and D. ochrolepis) are very similar to the woodyvines, or lianas, and may be classified as indicator species. Based on data from the 46 studyplots, the density of rattan on Mount Makiling is 173 individuals per hectare. This low rattandensity suggests that the rate of extraction is relatively high. Consequently, there is also a highdegree of destruction of their forest habitats, resulting in loss of biodiversity. They are preferredto woody vines as raw material for cottage industries (rattan furniture, baskets, backpacks, homedecors).
Conclusion
Assessment of floral diversity in Mount Makiling Forest Reserve (Luzon, Philippines) at thespecies and ecosystem levels reveals that this forest reserve is currently composed of four majorecosystems, namely (1) the mossy forest zone (900-1,109 m altitude); (2) the dipterocarp mid-montane forest zone (100-900 m altitude); (3) the grassland zone (in two sites only—PutingLupa, Calamba, Laguna, 475-625 m altitude and Nagtalaok-Saimsim, Los Banos, 700 m

Floral Diversity Profile of Mount Makiling Forest Reserve, Philippines 173
altitude); and (4) the agroforestry zone (300-750 m altitude). Comparison of floral diversity inthese four zones shows that the agroforestry zone has the highest diversity value (using theShannon-Weiner formula) with H'=4.28690, followed by the dipterocarp mid-montane forestzone with H'=3.89713, then by the mossy forest zone with H' =3.56972, and the grassland zonewith H'= 1.66438. In terms of species richness (S), the highest number of species was recordedfrom the dipterocarp mid-montane forest zone with S=373, followed by the agroforestry zonewith S=368, then by the mossy forest zone with S=95, and then by the grassland zone with S=44.
The agroforestry zone of Mount Makiling Forest Reserve is composed of six agroforestry types,namely (1) coconut plantations intercropped with coffee, bananas, and other commercial fruittrees; (2) citrus orchards bounded by young second-growth forests; (3) citrus orchards boundedby large coconut plantations; (4) old coffee plantations (partly abandoned) succeeding to maturesecondary forests; (5) fruit plantations mixed with aroids, pineapples, and vegetables, and (6)newly opened swidden fields bounded by mature secondary forest. Among these types, thehighest diversity was found on the fruit and vegetable plantations and in newly opened swiddenfields. The factors responsible for this diversity pattern are proximity to markets and/oraccessibility of swidden farms to wholesale buyers in the former case, while proximity to maturesecondary forests that serve as instant source of forest species propagules apply in the latter.
From the 46 study plots established throughout the four ecosystem zones of Mount Makiling, atotal of 682 species in 444 genera and 126 families were recorded. This total is estimated torepresent about 70 percent of all indigenous and endemic species previously recorded from thisbiologically significant mountain.
The continued use of the term "dipterocarp forest" for the area between 100 and 500 m altitudeon Mount Makiling is a misnomer. The assumed existence of a dipterocarp zone is not supportedby the field data. Instead, this zone is now dominated by Diplodiscus paniculatus, commonlyknown as balobo (family Tiliaceae), in association with other non-dipterocarp trees. It istherefore recommended that this zone be designated as "balobo forest" zone, until such time asthe dominance of dipterocarp species is restored.
A functional analysis of the 682 plant species recorded from the 46 study plots on MountMakiling reveals that 263 species are good for landscape purpose, 21 for cottage industry, 167ornamentals, 81 weeds, 36 fruit trees/crops, 20 timber source, 20 medicinal, 13 vegetables, 6 rootcrops, 4 spices and condiments, 3 green manure or organic fertilizer, 2 beverages, 2 fuelwood, 9poisonous, 1 hair-shampoo source, and 41 species with various ecological functions. For specieswith direct market value, it is estimated that only 110 species (16 percent) of the 682 species arebeing regularly or seasonally harvested by local swiddeners or residents. In short, 84 percent ofcurrent floral diversity of Mount Makiling Forest Reserve are collectively performing variousecological functions ranging from prevention of soil erosion, microclimate buffer zone,enhancement of rapid decomposition and maintenance of closed nutrient cycles, reservoir ofgenetic information, and sanctuary of wildlife, among others.
In addition, this study shows that diversity values should be closely examined for their actualspecies contents in order to fully understand which ecosystem zone or landscape pattern trulyexpresses the highest diversity level not only in terms of numeric index value but, moreimportantly, in terms of cultural, economic, and ecological values. The numeric index ofdiversity may be the same, but the functional diversity levels may certainly differ from one

174 William Sm. Gruezo
ecosystem or landscape zone to another. In the case of Mount Makiling Forest Reserve, its highfunctional diversity is partly attributed to the complexity of habits that its various plants have.The present set of data shows that Mount Makiling Forest Reserve has 40 species of large trees,134 medium-sized trees, 84 small trees, 14 tree-like plants (e.g., pandanus, erect palms), 65shrubs, 107 herbs, 53 lianas, 54 vines, 95 ferns and fern allies, 21 grasses, 13 epiphytes, and 3parasitic plant species. Finally, with a comprehensive updated knowledge of floral diversity inMount Makiling Forest Reserve, more site-specific conservation strategies and a workablemaster plan can be designed that both incorporate biological and anthropogenic dimensions.
Notes
1.These herbarium (voucher) materials are now deposited at the Botanical Herbarium (CAHUP), Museumof Natural History, University of the Philippines at Los Banos, College, Laguna.2. Some examples of rattans and lianas are as follows: (1) rattans—Calamus blancoi, C. dimorphocanthus,C. discolor, C. merrillii, C. ornatus, C. usitatus, Daemonorops molllis, and D. ochrolepis; and (2) lianas-Connarus semidecandrus, C. trifoliatus, Tetracera scandens, Entada phaseoloides, Ampelocissusmultifoliola, A. ochracea, Alyxia concatenata, Archangelisia ,/lava, Cayratia trifolia, Flagellaria indica,Rourea minor, Tetrastigma loheri, Tinospor cumingiana, Freycinetia warburgii, F. negrosensis, F. vidalii,F. reticulata, Unearia philippinensis, U. velutina.3. Some examples of these ground-dwelling plants are Adiantum diaphanum, Aglaomorpha pilosa, Bolbitisrhizophylla, B. sinuata, Tectaria dissects, Davallodes hirsutum, Diplazium dolichosorum, Lindsaeamerrillii, Macrothelypteris polypodioides, Microsorium alternifolium, M. heterocarpum, M longissium, M.punctatum, Pleocnemia cumingiana, P. macrodonta, Pneumatopteris laevis, P. microloncha, Pterisexcelsa, P. pellucida, Tectaria crenata, T. grandifolila, T. hilocarpa, Selaginella cupressina, S. delicatula,S. fagellifera, S. involvens, S. jagori, Alocasia heterophylla, A. zebrina, Begonia cumingii, B.hernandioides, Donax cannaeformis, Elatostema lagunense, E. podophyllum, E. viridiscens, Forrestiahispida, Globba marantina, Habenaria hystrix, H. malintana, Homalomena philippinensis, Mapaniacuspidata, Pollia secundi,Jlora, Zingiber zerumbet, Mussaenda philippica, Ardisia loheri, A. marginata, A.pyramidalis, A. squamulosa, Camellia lanceolata, Ficus septica, F. guyeri, Leucosyke capitellata, Pipturusarborescens, Strobilanthes pachys, and S. pluriformis.4. The bird's nest ferns are also a good ecological indicator as they only occupy moist habitats on trunksand branches of tall trees in the dipterocarp mid-montane forest zone or in the mossy forest zone.5. Although these species belong to different families, they are considered to.belong to the same functionalgroup because they fulfill the same function and possess the same morphological structure within theecosystem. Three of these woody vine species (Strongylodon macrobotrys, Entada phaseoloides, andDioscorea alata) can function also as economic indicators because of the high market value attached tothem by local gatherers.
References Cited
Gruezo, W. Sm. 1990. Endangered plants of the Philippines. Life Today 46(8): 16-18.
1993. Flora and vegetation of the National Power Corporation Hydroelectric Power Plant Projectarea in Barangay Mahabang Lalim, General Nakar, Quezon Province. In Environmental prime movers ofAsia Environmental Impact Assessment Study Report, Manila.
1996a. Flora and vegetation of the Fil-Estate Laurel Mountain Ridge/Taal Lakeside ResortDevelopment Project (Laurel, Batangas Province, Philippines). Sarmiento Research and DevelopmentCorporation, Environmental Impact Assessment Report, Manila.
I996b. Flora and vegetation of the Fil-Estate Resort Development Project area (Nasugbu,Batangas Province, Philippines). Sarmiento Research and Development Corporation, EnvironmentalImpact Assessment Report, Manila.

175 Floral Diversity Profile of Mount Makiling Forest Reserve, Philippines
Heywood, V. H. 1995. Global biodiversity assessment. Cambridge: Univ. of Cambridge Press.
Kiratiprayoon, S. 1986. Comparative study on the structure of the rattan-bearing tropical rainforest. M.Sc.thesis, Kasertsart Univ. (in Thai).
Nilroung, S. 1986. Structural characteristics, rate of gap formation, and turnover rate in dry dipterocarpforest at Sakaerat. M.Sc. thesis, Kasertsart Univ. (in Thai).
Pancho, J. V. 1983. Flora of Mt. Makiling and vicinity. Kalikasan, The Philippine Journal of Biology,Supplement 1 (Manila).
Sahunalu, P., M. Chamreanpruk, B. Puriyakorn, P. Dhamnamonda, W. Suwannapin, and B. Prachaiyo.1979. Structure of three forest types in the Prom Basin, Chaiyamphum Province. For. Res. Bulletin, No.63, Faculty of Forestry, Kasertsart Univ. (in Thai).
Tan, B. C., E. S. Fernando, and J. P. Rojo. 1986. An updated list of endangered Philippine plants. Taiwania3(2): 1-5.

176 William Sm. Gruezo
Appendix Table 8.1 Inventory list of vascular plants within themossy forest zone of Mount Makiling Forest Rese rve (Luzon,Philippines) showing relative density and diversity index value (datafrom three study plots; May 1994)Taxon p; p; l^ p;
Aeschynanthus philippinensis 9 -0.054138Agrostophyllum 1 -0.009021Alocasia heterophylla 4 -0.028499Alpinia haenki 1 -0.009021Angiopteris cartilagedens 2 -0.016146Angiopteris palmiformis 1 -0.009021Appendicula sp. 1 -0.009021Araiostegia hymenophylloides 11 -0.063149Ardisia sp. 1 -0.009021Argostema timorensis 3 -0.022555Asplenium cymbifolium 10 -0.058712Asplenium polyodon 1 -0.009021Asplenium tenerum 1 -0.009021Astronia candolleana 8 -0.049411Astronia discolor 4 -0.028499Astronia ro fei 1 -0.009021Begonia aequata 2 -0.016146Belvisia mucronata 3 -0.022555Belvisia platyrhynchos 4 -0.028499Bulbophyllum sp. 1 -0.009021Calamus dimorphocanthus 11 -0.063149Calanthe lyroglossa 1 -0.009021Calanthe triplicata 3 -0.022555Clethra lancifolia 5 -0.034097Coleus igolotorum 6 -0.039420Crypsinus lagunense 3 -0.022555Cyathea callosa 5 -0.034097Cyathea contaminans 1 -0.009021Cyathea loheri 1 -0.009021Cyrtandra cumingii 4 -0.028499Dendrochilum sp. 1 -0.009021Dendrochnide meyeniana 15 -0.079748Dichotrichum chorisepalum 3 -0.022555Dichron philippinensis 6 -0.039420
Diplaziumfractuosum 1 -0.009021
Elaeocarpus argenteus 7 -0.044514
Elaphoglossum luzonicum 8 -0.049411
Elatostema lagunaense 81 -0.243772
Elatostema viridescens 130 -0.307106
Eria philippinensis 5 -0.034097

Floral Diversity Profile of Mount Makiling Forest Reserve, Philippines 177
Appendix Table 8.1 Inventory list of vascular plants within themossy forest zone of Mount Makiling Forest Reserve (Luzon,Philippines) showing relative density and diversity index value (datafrom three study plots; May 1994)
Taxon PA P; i PA
Euodia villamilii 2 -0.016146Eurya nitida 3 -0.022555Ficus irisana 12 -0.067461Ficus nota 7 -0.044514
Ficus septica 13 -0.071659
Freycinetia cumingiana 2 -0.016146
Freycinetia multiflora 2 -0.016146
Freycinetia vidalii 7 -0.044514Gleichenia longissima 1 -0.009021
Goniophlebium subauriculatum 1 -0.009021
Grammitis jagoriana 2 -0.016146
Histropteris incisa 1 -0.009021Homalanthusfastousus 1 -0.009021
Homalanthus populneus 4 -0.028499
Hoya odorata 1 -0.009021
Hymenophyllum sp. 3 -0.022555
Itea macrophylla 1 -0.009021
Leea nitida 2 -0.016146
Leea philippinensis 7 -0.044514
Lindseae obtusa 1 -0.009021
Litsea villosa 1 -0.009021
Medinilla myriantha 10 -0.058712
Medinilla myrtiformis 1 -0.009021
Melastoma polyanthum 2 -0.016146
Microsorium heterocarpum 1 -0.009021
Mussaenda anisophylla 2 -0.016146
Nephrolepis biserrata 1 -0.009021
Oleandra maquilingensis 5 -0.034097
Palaquium philippinense 2 -0.016146
Peperomia lagunaensis 10 -0.058712
Persia philippinensis 6 -0.039420
Pinanga philippinensis 5 -0.034097
Piper sp. 2 -0.016146
Plagiostachys sp. 1 -0.009021
Pleocnemia cumingiana 1 -0.009021
Poikelospermum acuminatum 9 -0.054138
Polystichum horizontale 9 -0.054138
Procris frutescens 7 -0.044514
Rhapidophora montana 6 -0.039420
Rhaphidophora pinnata 1 -0.009021

178 William Sm. Gruezo
Appendix Table 8.1 Inventory list of vascular plants within themossy forest zone of Mount Makiling Forest Reserve (Luzon,Philippines) showing relative density and diversity index value (datafrom three study plots; May 1994)
Taxon p; p; l„ p;
Rubus rosaefolius 4 -0.028499Saurauria latibractea 7 -0.044514Schizostachyum diffusum 9 -0.054138Scleroglossum sp. 1 -0.009021Selaginella biformis 1 -0.009021Selaginella delicatula 35 -0.145509Selaginella involvens 62 -0.209263Selaginellajagorii 33 -0.139851Selaginella nummularia 23 -0.108831Smilax leucophylla 5 -0.034097Strobilanthes pluriformis 21 -0.101980Syrygium sp. 3 -0.022555Timonius arboreus 2 -0.016146Trichomanes apiifolium 1 -0.009021Weinmannia luzoniensis 3 -0.022555
N = 731 H=3.569715S=95

Floral Diversity Profile of Mount Makiling Forest Reserve, Philippines
Appendix Table 8.2 Inventory list of vascular plants present within thedipterocarp mid-montane forest zone of Mount Makiling Forest Reserve(Luzon, Philippines) showing relative density and diversity index value (datafrom eighteen study plots; December 1994 to February 1995)Taxon p; p; In p;
Adenanthera intermedia 1 -0.000545Adenanthera pavonina 6 -0.002673Adiantum diaphanum 20 -0.007571Adina multiflora 3 -0.001452Aglaia dt&sa 12 -0.004884Aglaia lianosiana 4 -0.001873Aglaia rimosa 1 -0.000545Aglaia sp. 4 -0.001873Aglaomorpha pilosa 1 -0.000545Aglaonema simplex 21 -0.007892Ahernia glandulosa 10 -0.004171Alangium meyeri 2 -0.001013Alocasia heterophylla 52 -0.016918Alocasia macrorrhizos 8 -0.003436Alocasia pubera 8 -0.003436Alocasia zebrina 49 -0.016104Alstonia scholaris 1 -0.000545Alyxia concatenata 1 -0.000545Amomum elegans 12 -0.004884Amorphophallus campanulatus 165 -0.043078Ampelocissus multifoliola 2 -0.001013Ampelocissus ochracea 1 -0.000545Amydrium magnifcum 4 -0.001873Amydrium medium 5 -0.002279Anamirta cocculus 1 -0.000545Anaxagorea luzonensis 56 -0.017989Angiopteris palmiformis 67 -0.020853Antiaris toxicaria 2 -0.001013Antidesma bunius 1 -0.000545Antidesmafrutescens 12 -0.004884Antrophyum reticulatum 2 -0.001013Antrophyum sessiliflorum 30 -0.010679Aphanamixis perrottetiana 1 -0.000545Arachniodes amabilis 10 -0.004171Archangelisiaflava 76 -0.023121Ardisia cumingiana 5 -0.002279Ardisia loheri 1 -0.000545Ardisia marginata 1 -0.000545Ardisia pyramidalis 1 -0.000545Ardisia squamulosa 7 -0.003059
179

180 William Sm. Gruezo
Appendix Table 8.2 Inventory list of vascular plants present within thedipterocarp mid-montane forest zone of Mount Makiling Forest Reserve(Luzon, Philippines) showing relative density and diversity index value (datafrom eighteen study plots; December 1994 to February 1995)Taxon p; p; In p;
Ardisia sp. 1 -0.000545Arenga pinnata 412 -0.086578Arthropteris beckleri 11 -0.004530Artocarpus rubrovenia 1 -0.000545Artocarpus sericicarpus 1 -0.000545Asplenium affine 81 -0.024355Asplenium cuneatum 24 -0.008841Asplenium excisum 71 -0.021869Asplenium nidus 36 -0.012450Asplenium pellucidum 1 -0.000545Asplenium vittaeforme 6 -0.002673Astronia candolleana 9 -0.003807Astronia cumingiana 34 -0.011866Astronia discolor 20 -0.007571Astronia rolfei 2 -0.001013Bauhinia cumingiana var. integrifolia 11 -0.004530Begonia aequata 2 -0.001013Begonia cumingii 1 -0.000545Begonia hernandioides 4 -0.001873Bischofiajavanica 10 -0.004171Bolbitis heteroclita 390 -0.083146Bolbitis rhizophylla 129 -0.035446Bolbitis sinuata 171 -0.044304Breynia cernua 3 -0.001452Buchanania arborescens 3 -0.001452Calamus blancoi 3 -0.001452Calamus dimorphocanthus 56 -0.017987Calamus discolor 9 -0.003807Calamus merrillii 356 -0.077705Calamus ornatus 469 -0.095173Calamus usitatus 1 -0.000545Calophyllum kunstleri 2 -0.001013Camelia lanceolata 59 -0.018781Canarium asperum 36 -0.012450Canarium hirsutum 5 -0.002279Canthium monstrosum 1 -0.000545Caryota cumingii 420 -0.087809Caryota rumphiana sp. 12 -0.004884Catimbium speciosum 17 -0.006589Cayratia trifolia 4 -0.001873
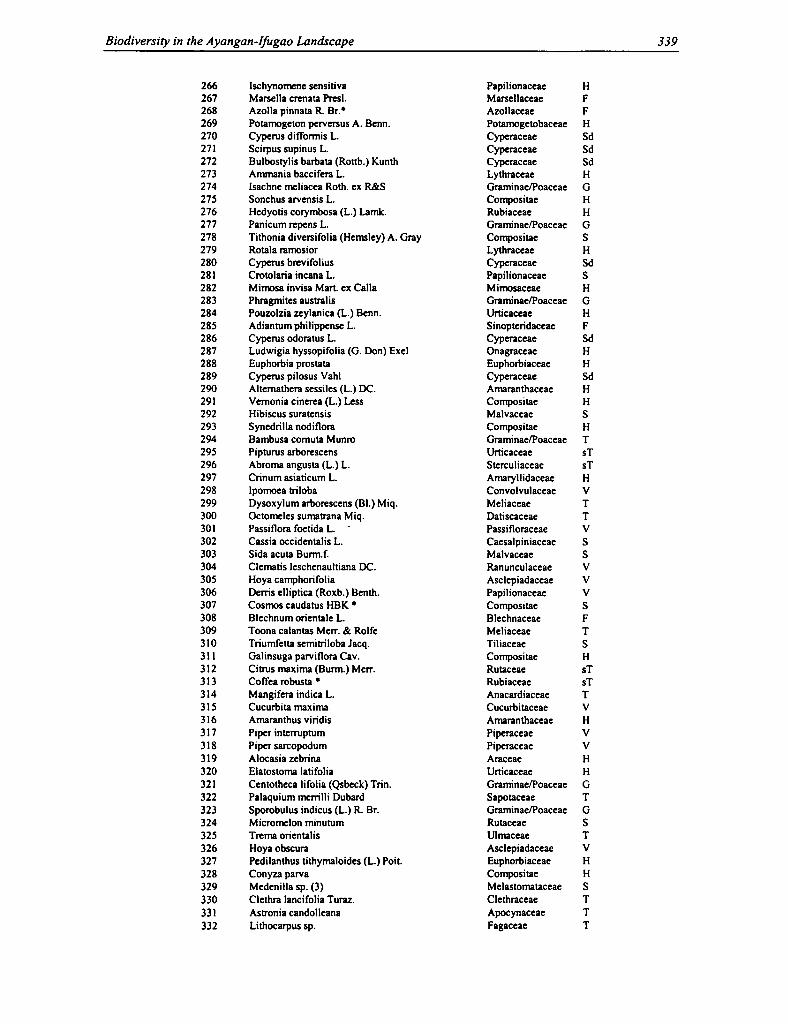
Floral Diversity Profile of Mount Makiling Forest Reserve, Philippines 181
Appendix Table 8.2 Inventory list of vascular plants present within thedipterocarp mid-montane forest zone of Mount Makiling Forest Reserve(Luzon, Philippines) showing relative density and diversity index value (datafrom eighteen study plots; December 1994 to February 1995)Taxon p; p; In p;
Celtis luzonica 191 -0.048310Centotheca lappacea 16 -0.006255Chisocheton cumingianus 39 -0.013313Chloranthus elatior 385 -0.082356Christensenia aesculifolia 25 -0.009153Cinnamomum mercadoi 18 -0.006919Cissus sp. 2 -0.001013Claoxylon albicans 19 -0.007246Clausena anisum-olens 2 -0.001013Cleidion speciorum 253 -0.060033Cocos nucifera 5 -0.002279Coffea canephora 20 -0.007571Colocasia zebrina 1 -0.000545Coniogramme macrophylla 20 -0.007571Connarus semidecandrus 38 -0.013027Connarus trifoliatus 78 -0.023617Cratoxylon celebicum 27 -0.009770Crypteronia paniculata 14 -0.005578Ctenites dissecta 105 -0.030055Cyathea callosa 23 -0.008528Cyathea contaminans 3 -0.001452Cyathula prostrate 25 -0.009153Cyrtandra cumingii 69 -0.021363Daemonorops mollis 89 -0.026294Daemonorops ochrolepis 3 -0.001452Davallodes hirsutum 30 -0.010679Decaspermumfruticosum 1 -0.000545Dendrochnide meyeniana 113 -0.031883Dichroa philippinensis 1 -0.000545Dillenia philippinensis 33 -0.011572Dillenia reifjerseheia 8 -0.003436Dimorphocalyx luzonensis 7 -0.003059Dioscorea elmeri 7 -0.003059Diospyros ahernii 19 -0.007247Diospyros blancoi 44 -0.014725Diospyros pyrrhocarpa 5 -0.002279Diplazium dolichosorum 2 -0.001013Diplodiscus paniculatus 303 -0.068855Donax cannaeformis 321 -0.071914Drynaria quercffolia 22 -0.008211

182 William Sm. Gruezo
Appendix Table 8.2 Inventory list of vascular plants present within thedipterocarp mid-montane forest zone of Mount Makiling Forest Reserve(Luzon, Philippines) showing relative density and diversity index value (datafrom eighteen study plots; December 1994 to February 1995)Taxon p; p; l^ p;
Dryopteris amabilis 10 -0.004171Drypetes bordenii 2 -0.001013Dysoxylon arborescens 15 -0.005918Dysoxylon grandifolium 26 -0.009462Dysoxylon sp. 1 -0.000545
Elaeocarpus calomala 20 -0.007571Elatostema lagunense 1997 -0.244195Elatostema podophyllum 27 -0.009770Elatostema viridescens 3587 -0.321684Eleaocarpus monocera 1 -0.000545Entada phaseoloides 6 -0.002673Eria philippinensis 1 -0.000545Ervatamia pandacaqui 3 -0.001452Erythrophalum scandens 8 -0.003436Euodia confusa 2 -0.001013Euodia meliaefolia 1 -0.000545Euonymosjavanicus 21 -0.007892Euphoria didyma 1 -0.000545Ficus ampelos 3 -0.001452Ficus aurantiaca 2 -0.001013Ficus balete 4 -0.001873Ficus benjamina 1 -0.000545Ficus botryocarpa 18 -0.006919Ficus botryocarpa var. lancifolia 1 -0.000545Ficus botryocarpa var. linearifolia 4 -0.001873Ficusfistulosa 17 -0.006589Ficus gul 24 -0.008841
Ficus guyeri 6 -0.002673Ficus irisana 1 -0.000545Ficus minahassae 5 -0.002279Ficus now 21 -0.007892Ficus odorata 1 -0.000545
Ficus ruficaulis 3 -0.001452Ficus septica 2 -0.001013Ficus subulata 143 -0.038473
Ficus variegata var. syncomoroides 10 -0.004171
Ficus variegata 12 -0.004884
Flagellaria indica 1 -0.000545
Forrestia hispida var. philippinensis 64 -0.020083
Forrestia hispida 1 -0.000545

Floral Diversity Profile of Mount Makiling Forest Reserve, Philippines 183
Appendix Table 8.2 Invento ry list of vascular plants present within thedipterocarp mid-montane forest zone of Mount Makiling Forest Rese rve(Luzon, Philippines) showing rela tive density and diversity index value (datafrom eighteen study plots; December 1994 to February 1995)
Taxon p; p; l^ p;
Freycinetia cumingiana 1 -0.000545Freycinetia multiflora 46 -0.015280Freycinetia negrosensis 7 -0.003059Freycinetia vidalii 15 -0.005918Freycinetia warburgii 6 -0.002673Garcinia dives 1 -0.000545Garcinia dulcis 8 -0.003436Garcinia macgregorii 3 -0.001452Garugafloribunda 1 -0.000545Globba marantina 5 -0.002279Glochidion rubrum 1 -0.000545Gnema glomerata 1 -0.000545Gnetum indicum 2 -0.001013Goniothalamus amuyon 28 -0.010075Goniothalamus elmeri 2 -0.001013Goniothalamus sp. 1 -0.000545Gonocaryum calleryanum 8 -0.003436Gymnacranthera paniculata 2 -0.001013Habenaria hystrix 1 -0.000545Habenaria sp. 25 -0.009153Harpulia arborea 1 -0.000545Homalium bracteatum 1 -0.000545Homalomena philippinensis 535 -0.104645Horsfieldia merrillii 16 -0.006255Ichnocarpus volubilis 2 -0.001013Itea macrophylla 1 -0.000545Ixora longistipula 1 -0.000545Kibatalia gitingensis 2 -0.001013Knema glomerata 10 -0.004171Koordersiodendron pinnatum 7 -0.003059Lansium domesticum 1 -0.000545Laportea luzonensis 62 -0.019565Lasianthus copelandii 1 -0.000545Leea aculeata 6 -0.002673
Leea philippinensis 8 -0.003436Leea philippinensis var. paucijlora 2 -0.001013Leucosyke capitellata 2 -0.001013Lindsaea merrillii 3 -0.001452Litchi philippinensis 4 -0.001873Lithocarpus solerianus 1 -0.000545

184 William Sm. Gruezo
Appendix Table 8.2 Inventory list of vascular plants present within thedipterocarp mid-montane forest zone of Mount Makiling Forest Reserve(Luzon, Philippines) showing relative density and diversity index value (datafrom eighteen study plots; December 1994 to February 1995)Taxon p1 P.
I P.
Lithocarpus sp. 5 -0.002279Litsea garciae 74 -0.022622Litsea perrottettii 5 -0.002279Livistona rotundffolia 3 -0.001452Lygodium merrillii 14 -0.005577Macaranga bicolor 9 -0.003807Macaranga grandifolia 10 -0.004171Macrothelypteris polypodioides 1 -0.000545Maesa denticulata 3 -0.001452Mapania cuspidata 1 -0.000545Marattia pellucida 2 -0.001013Mastixia philippinensis 2 -0.001013Matthaea sancta 20 -0.007571Melanolepis multiglandulosa 1 -0.000545Melochia umbellata 7 -0.003059Meonauclea vidalii 2 -0.001013Microcos stylocarpa 59 -0.018781Micromelon minutum 9 -0.003807Microsorium alternifolium 4 -0.001873Microsorium heterocarpum 4 -0.001873Microsorium longissimum 67 -0.020853Microsorium punctatum 6 -0.002673Mikania cordata 50 -0.016377Mimosups parvifolia 1 -0.000545Mischocarpus fuscescens 2 -0.001013Molinaria capitulata 2 -0.001013Musa acuminata 25 -0.009153Mycetiajavanica 15 -0.005918Myristica cagayanensis 1 -0.000545Myristica elliptica 3 -0.001452Myristica nitida 1 -0.000545
Nauclea elmeri 5 -0.002279
Neolitsea villosa 19 -0.007246
Neonauclea bartlingii 8 -0.003436
Neonauclea vidalii 23 -0.008527
Nephelium ramboutan-oke 13 -0.005233
Nephrolepis biserrata 21 -0.007892
Ormosia calavensis 4 -0.001872
Ormosia sp. 1 -0.000545
Pahudia rhomboidea 14 -0.005578
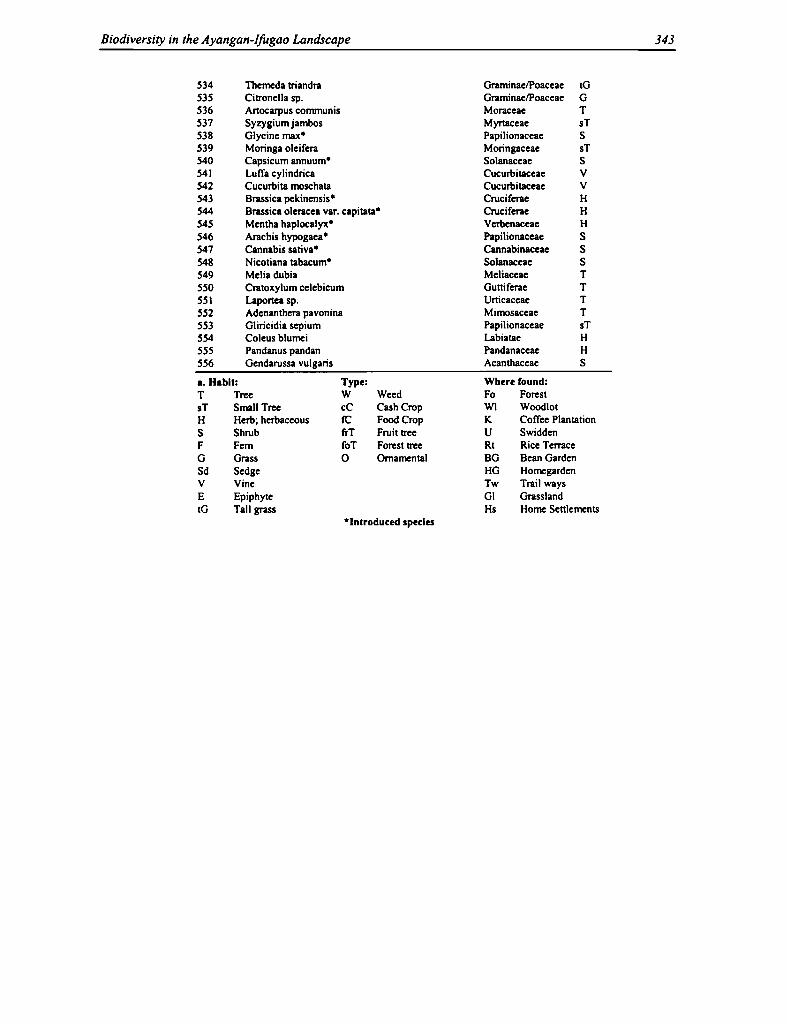
Floral Diversity Profile of Mount Makiling Forest Reserve, Philippines 185
Appendix Table 8.2 Inventory list of vascular plants present within thedipterocarp mid-montane forest zone of Mount Makiling Forest Reserve(Luzon, Philippines) showing relative density and diversity index value (datafrom eighteen study plots; December 1994 to February 1995)
Taxon p; p; 'TI p;
Palaquium budardii 12 -0.004883Palaquium philippense 123 -0.034124Palaquium tenuispetiolatum 25 -0.009153Palaquium sp. 1 -0.000545Pandanus loherianus 18 -0.006919Pandanus luzonensis 6 -0.002673Papualthia lanceolata 11 -0.004530Parartocarpus venenosus 3 -0.001452Parashorea malaanonan 218 -0.053535Parthenocissus heterophylla 1 -0.000545Paspalum conjugatum 18 -0.006919Pavetta luzoniensis 3 -0.001452Persea americana 2 -0.001013Persea philippinensis 7 -0.003059Phacelophrynium interruptum 160 -0.042046Phalaenopsis amabilis 1 -0.000545Phanera integrifolia 1 -0.000545Phanera sp. 1 -0.000545Photoidium lobbianum 1 -0.000545Phronephrium rhombeum 3 -0.001452Phrynium philippinense 8 -0.003436Phytocrene blancoi 2 -0.001013Pinanga insignis 150 -0.039957Pinanga philippinensis 4 -0.001872Piper arborescens 33 -0.011572Piper baccatum 6 -0.002673Piper interruptum 7 -0.003059Piper retrofactum 6 -0.002673Piper sarcopodum 1 -0.000545Pipturus arborescens 2 -0.001013Pisonia umbellifera 2 -0.001013Pithecellobium scutferum 2 -0.001013Planchonia spectabilis 39 -0.013313Pleocnemia cumingiana 4 -0.001873Pleocnemia macrodonta 129 -0.035446Plochoglottis copelandii 35 -0.012159Pneumatopteris laevis 138 -0.037401Pneumatopteris microloncha 5 -0.002279Poikilospermum acuminatum 13 -0.005233Poikilospermum suaveolens 3 -0.001452

186 William Sm. Gruezo
Appendix Table 8.2 Inventory list of vascular plants present within thedipterocarp mid-montane forest zone of Mount Makiling Forest Rese rve(Luzon, Philippines) showing relative density and diversi ty index value (datafrom eighteen study plots; December 1994 to Februa ry 1995)Taxon p; p,
In p^
Pollia secundiora 93 -0.027248Polyalthia(lava 18 -0.006919Polyalthia suberosa 34 -0.011866Polyscias nodosa 4 -0.001873Pometia pinnata 16 -0.006255Pothoidium lobbianum 12 -0.004884Pothomorphe umbellata 1 -0.000545Poutheria micrantha 8 -0.003436Procrisfrutescens 7 -0.003059Pronephrium asperum 5 -0.002279Pronephrium cuspidatum 39 -0.013313Pronephrium rhombeum 3 -0.001452Psomiocarpa apiifolia 6 -0.002673Psychotria luconiensis 1 -0.000545Psychotria membranacea 1 -0.000545Psychotria membranifolia 4 -0.001873Pteris blumeana 8 -0.003436Pteris excelsa 5 -0.002279Pteris pellueida 3 -0.001452Pterocymbium tinctorium 42 -0.014164Pterospermum niveum 7 -0.003059Pycnarrhena manillensis 6 -0.002673Radermachera pinnata 1 -0.000545Rafflesia manillana 31 -0.010978Rhaphidophora copelandii 1 -0.000545Rhaphidophora monticola 2 -0.001013Rhaphidophora pinnata 8 -0.003436Rollinia mucosa 51 -0.016648Rourea minor 60 -0.019043
Sandoricum koe jape 1 -0.000545Sandoricum vidalii 1 -0.000545Sapium luzonicum 2 -0.001013Saurauria latibractea 15 -0.005918
Schefflera insularum 9 -0.003807
Schismatoglottis calyptrata 75 -0.022872
Schizostachyum dielsianum 34 -0.011866
Schizostachyum drum 140 -0.037831
Scindapsus hederaceus 19 -0.007246
Selaginella biformis 67 -0.020853
Selaginella cupressina 227 -0.055233