Embed Size (px)
Citation preview

The composition of bat milk; a chemical analysis
Item Type text; Thesis-Reproduction (electronic)
Authors Huibregtse, William Henry, 1936-
Publisher The University of Arizona.
Rights Copyright © is held by the author. Digital access to this materialis made possible by the University Libraries, University of Arizona.Further transmission, reproduction or presentation (such aspublic display or performance) of protected items is prohibitedexcept with permission of the author.
Download date 16/05/2018 20:44:20
Link to Item http://hdl.handle.net/10150/319468

THE COMPOSITION OF BAT MILK: A CHEMICAL ANALYSIS
byWilliam Ho Huibregtse
A Thesis Submitted to the Faculty of the DEPARTMENT OF ZOOLOGY
In Partial Fulfillment of the Requirements For the Degree of Ma s t e r of sc ie nc e
In the Graduate College The University of Arizona
1 9 6 3

STATEMENT BY AUTHOR
This thesis has heen submitted in partial fulfillment of requirements for an advanced degree at The University of Arizona and is deposited in The University Library to be made available to borrowers under rules of the Library,
Brief quotations from this thesis are allowable without Special permission, provided that accurate acknowledgment of source is made. Requests for permission for extended quotation from or reproduction of this manuscript in whole or in part may be granted by the head of the major department or the Dean of the Graduate College when in their judgment the proposed use of the material is in the interests of scholarship. In all other instances, however, permission must be obtained from the author.
APPROVAL BY THESIS DIRECTOR
This thesis has been approved on the date shownbelow:
# J ° McCaulejy / DateAssociate Professor of Zoology

TABLE OF CONTENTS
PageACKNOWLEDGMENT « , o . p o o 0 , 0 . o > o , o . o © © © © , © © © © ©
INTRODUCTION © © © © © © © - © © - © © © © - © © © © © © © © 1MATERIALS AND METHODS © . © . © / © - © © © © © , © © © © © © © © 3
RESULTS © © © © © o - © O ' © © © © © © ' © ' o © © ©» © © © © © 9DI.SdXSSI )N" 0 - 0 - 0 © © . © 0 0 © © . o © © © © © © © © © o © 23
. SUMMARY AND CONCLUSIONS© © © © © © © © © © © © © © © © 29LITERATURE CITED © © ©, © © © © © © © © - © © © © © © © © 32LIST OF TABLES
Table 1 © - © © © © © © © © © © © © © © © © © 10Table 2 ©. © - © - © © ©•© © © © © © © © © © © © 11Table 3 © © © © © © © © ©, © © © © © © © © @ 12Tab le 4 © © . © ©.© © © © © © © © © © © © © © 14Table 5 © © © ©.© ©,© © © © © © © © © © © © ISTable S © © © © © © © © © © © © © © © © © © 22
LIST OF FIGURESF igun"- e 1 ©. ©-©.©.©. ©*,© - © .©. © © © © © © - © © © 13Fxgure 2 © © © © © - © © © © © © - © © ©. © © © © ISFigxtxe 3 © © © o © © - © © © © © © © © © © © © 19Pxg'ax’e 4 ©. ©. © o © @ © © © © © © © o © - © © © 20
ill
ACKNOWLEDGMENT
Sincere gratitude is expressed to all faculty and fellow graduate students of the Department of Zoology who assisted in many ways in this studyo I am especially grate ful to Dr0 Wo Jo McCauley under whose guidance this study was made and to Dr= W« -H 0 Brown of the Department of Dairy Science for his aid and consultation„

INTRODUCTION
Considerable interest has been generated in the composition of previously unstudied mammalian milks in an attempt to better define phylogenetic relationships. The absence of lactose in the milk of the California Sea Lion, Zalophus californianus (Pilson and Kelly, 1962) might help to set Pinnipedia apart from the Carnivora which have lactose present in their milk (Evans, 1959). One recent study by Sowls et a j L . , (1961) on the composition of the milk of the collared peccary, Tayassu tajacu, indicated distinct differences when compared to domestic sow milk. Electrophoretic analyses of the milk proteins of a variety of mammals representing forty species and eight orders was
conducted (Sloan et al.*# 1961). Sloan and his co-workers have made a distinction between three electrophoretic patterns of casein* First, a ‘primitive* pattern having a single peak corresponding to cow cl -casein and appearing among some rodents, lagomorphs and marsupials. The second type has a prominent, slow-moving peak corresponding to cow
-casein and a faster-moving fraction which adsorbs greatly
1

2to the paper. This latter type is supposed to be 'more advanced1 and is found in some carnivores and primates.The third, and 'most advanced* pattern found in Bos and most other mammals has a slow-moving jB -casein peak and a faster-moving <x -casein peak. In addition. Bos shows a third component, y'-casein which is very slow-moving and not prominent in other artiodactyls. These representative patterns are illustrated in Figure 2, page 18.
Representative species from two different families of bats which utilize distinctly different types of food were selected for this study: Leptonvcteris nivalis ofthe family Phyllostomatidae, a pollen and nectar feeding bat (Beatty, 1955), and Tadarida brasiliensis of the family Molossidae, an insectivorous bat (Ross, 1961).
Since the two species are separable on a nutritional basis, differences in the composition of the milks may be due to dietary differences. Following the definition of dietary influences, other biochemical similarities
in the milks may be attributable to familial relationships.
There has been no previously published analysis of the milk of any member of the Order Chiroptera.

MATERIALS AND METHODS
Leptonycteris nivalis and Tadarida brasiliensis are both fairly large bats and readily available in maternity colonies near Tucson* Arizona„ Female b, nivalis were collected from a. maternity colony located in Colossal Cave, Vail^ Arizonao The animals were collected in hand nets inside a: tunnel entrance to the bat room of the cave after the tunnel had been barricaded» The collections were made between 25 May, 1962 and 23 June, 1962„ The post partum lactating animals were retained for milking. The collections were made between the hours of 11100 PvEh, and 2?00 A«MP. after the animals had been feeding and were returning to the cave o Female T. braslliensis were taken from a maternity colony under a railroad bridge 4.5 miles south of Continental, Arizona, between 10 July, 1962 and 13 July, 1962. They
were taken in hand nets in the early morning hours after the return from feeding *■
Several rather elaborate devices have been devised for collecting milk from small laboratory animals (Coxand Mueller, 1937; Mueller, 1939; Kahler, 1941—2? Temple
,3

and Ron.# 1937) * but the complexity of most of these methods
compared with the small amount of sampling necessary in this study made a simpler means more practical„ After some trial
and error in attempting to obtain milk from lactating mice^ and after being advised that manual expression following injection of oxytocic hormone (Pitocin^ Parke-Davis) facilitated obtaining milk from Microtus pennsvIvanicus (R=, E» Sloan personal communication)* the following method was decided upon
The animals were anesthetized lightly.with sodium nembutal (1/20 dilution of 3/4 gn/mg) 10 to 15 hours after capture, it was determined that approximately 0=1 milliliter of the nembutal would lightly anesthetize h, nivalis while
approximately 0 = 03 to 0P05 milliliter was used for T= brasiliensis» This was admihistered simultaneously with an injection of less than 0=1 milliliter Pitocin (parke- Davis), The mammaries were bathed with warm water before milking and were gently pressed with thumb and index finger to extrude the milk in droplets# These droplets were drawn into a hemoeytometer pipette = The samples from several animals were pooled and transferred to a weighed vial# Since the maximum amount of milk obtained from any one animal did

not exceed 0.3 milliliter^ pooling of the samples was
necessary6 The pooled samples ranged in weight from 0.3 to 0=8 gram. To aid in the preservation of samples a small drop of 10% formalin was added and the vials refrigerated
(Official Methods of Analysis of the A=Q,A.CM 1950) * In most cases bovine milk samples were analyzed previous to the hat milk and compared With known results to insure proper technique. Where desirable the bovine milk was also analyzed as a simultaneous control.
The pH of each sample was determined on a Beckmen model g pH meter immediately following milking 9
The density of the milk samples was determined by the use of micro-pipettes (corrected for water volumes).The density of the samples was determined by four trials with a control sample Of bovine milk. All measurements were made at 220G and weighed on a Sartorius—Werke balance
within 30 seconds, after removal from a constant temperature bath (Niederl and Niederl, 1942)*
Total solids ahd ash content were determined on Whole milk samples following the procedure Outlined by Official Methods of Analysis, A*0&A%#* (9th Edition? 1960) with some modifications. A portion of each sample was

6weighed in a porcelain crucible, The crucible was previously heated in an oven at lOQoc and cooled in a desiccator o The weight of the samples ranged from 0-2 g to 0,5 g for chiropteran milk and 1,0 g for the bovine control , for ash determination the residue was ignited in an electric muffle furnace at a temperature not exceeding
550°C for approximately 8 hours and again cooled in a
desiccator and weighed, The percentages of total solids and the ash content were calculated,
The determination of percent lactose followed the method used by Mailer and Boulet .(1959) „ The colorimeter used was the Bausch and Lomb Spectronic 20 with a wave
length setting of 490 * A standard curve was plottedfor each trial and the percent lactose was read from this curve,
Percent protein was determined following the Micro- Kj eldahl procedure of Ma and 2uazaga (1942)# The distillate was titrated with 0,018 H HCi to the disappearance of the blue-green color,
In addition fo the bovine milk samples as controls*, a sample of ammonium sulfate was analyzed and the experimental results compared With the calculated amount of nitrogen

present„ This method for determining nitrogen was selected as superior to other techniques for Micro-Kjeldahl determination for the following reasons: 1» It allows a directtitration of the distillate, eliminating any back titration,2„ The standard solutions are limited to hydrochloric acid only. 3. The mixed indicator gives a sharper end
point (Ma and Zuazaga, 1941$.The samples used in electrophoretic analyses of
-proteins and chromatographic analyses of sugars were pre
pared from single whole milk samples. The method of preparation followed that used by Sowls _et aT. (1961$. The sample of whole milk was centrifuged and the upper fat layer was removed. The casein protein fraction was precipitated out of solution by adding 0.1 N acetic acid to a pH of approximately 4.5 = The casein was removed by centrifugation and washed several times with water. It was then freeze-dried and weighed =
The solution remaining after casein removal was dialyzed exhaustively against water at a reduced temperature (5-10oC$ to remove the sugars. The dialyzed portion contained the soluble whey proteins which were freeze-dried , and weighed. The dialysate was retained for chromatographic analysis of sugars and was deionized using the

Baird and Tatlock Model 300 desalting apparatus„For electrophoresis the freeze-dried proteins
Were dissolved to apprOximately 5,0% solutions (8,0% Solutions suggested by R« Sloan* 1962, were not feasible with the small samples used)* The electrophoretic studies were carried out using a Spinco Model R apparatus« Caseins were run in veronal buffer at pH 8*6* ionic Strength 0.05 for 16 hours at 5 B0QC. 'Whey proteins were done in veronal buffer at pH 8 „6# ionic strength 0,075
for 16 hours at room temperature. A prepared sample of bovine casein or whey was used as a control on each run by comparison to established patterns, The whey dialysate was subjected to descending paper chromatography using a sol
vent of ethyl acetate* pyridine and water in the ratio 512|7* The solvent front was allowed to move beyond the paper to facilitate separation and* after drying* the chromatogram was sprayed with a mixture of aniline and an n-butanol solution of phthalic acid, %i.e chromatogram was developed in a drying oven at 105oC for 5 minutes (McFarren* et alo 1951), An ultraviolet light was used to scan the

RESULTS
In the following section the experimental results have been tabulated in a comparative manner to show the simi
larities and differences between the milks of brasillensls and L„ nivalis. The results of the bovine milk sample controls are included in most of the tables and figures„ Table
6* page 22 is a summary of the chemical and physical properties determined in this study and compared with other results«,
The pS determinations made on the bat milk samples are summarized in table 1* As indicated^ the pH of the
milk from nivalis was higher than that of JT, brasiliensis although both were acidic *
The results of the specific gravity for density)
determinations of Whole milk samples are tabulated in table 2» It is evident. from table 3 that milk of T, bras i liens is
shows a Significantly higher percent total solids than the milk of either I**- nivalis or Bos,
The standard curve in Figure 1? page 13 is a com
posite of the curves plotted for lactose determinations*
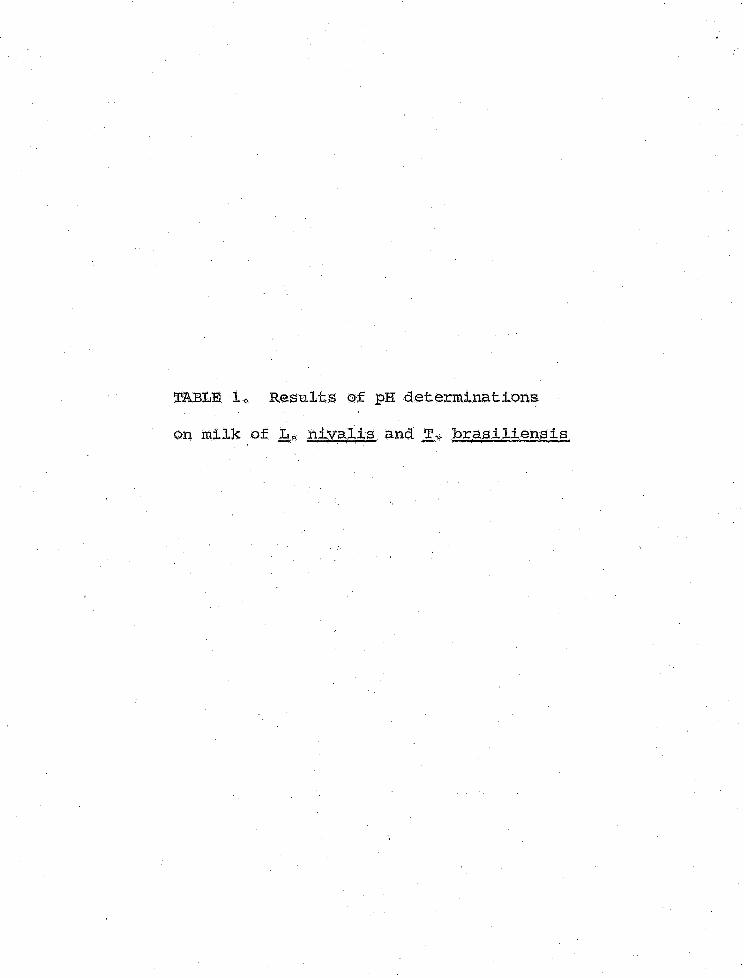
TABLE. 1, Results of pH determinations
On milk of L 0 nivalis and JE# brasi liens is

10
7,0 6.9 6.8 6.7
6.6 6.5 6.4 6.3 6.2
I,, nivalis6.85 (6.75 - 6.95) A.D. = 0.06
jr. brasiliensis6.32 (6.24 - 6.39) A.D. = 0,04

QBStiS 2:* Results of specific gravity determinations, on milks of Bos /
niva l is and d?& br a s i liens is c Ai D ? == average deviation of mean,.
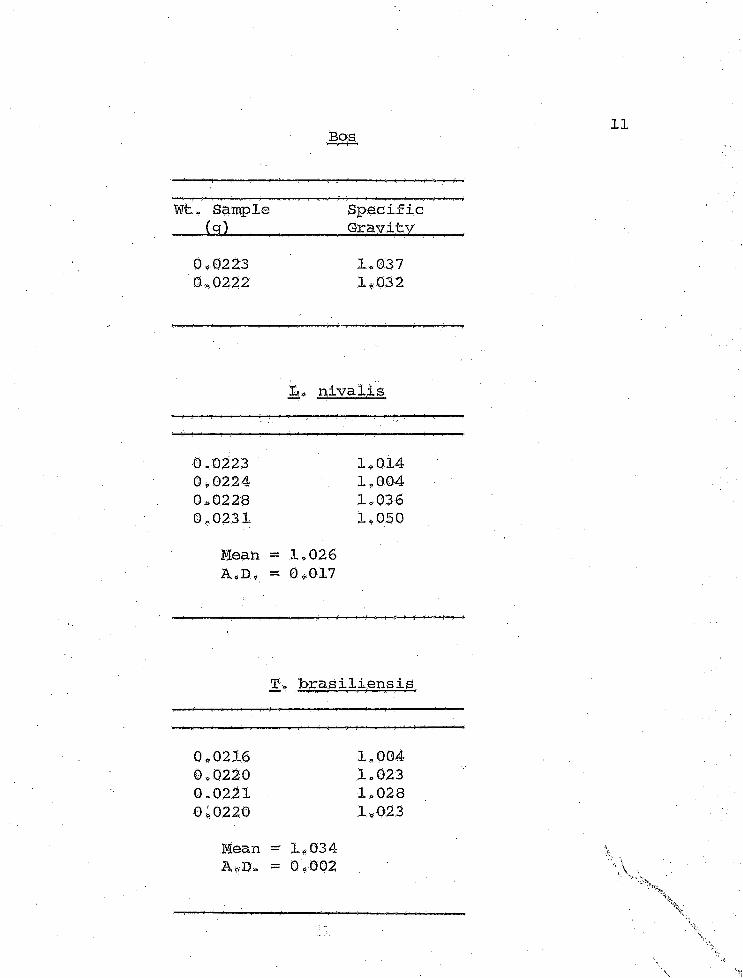
11Boa
Wt, Sample m :..
0,0223 1.037S<0222 1,032
h*
0,0223 1,0140,0224 1,0040,0228 1,0360.0231 1.050
Mean = 1,026A.D, = l3,017
braslliensia
0,0210 1.0040,0220 1.0230.0221 1.0280:0220 1.023
Mean “ 1,034 “ 0,002
‘TABLE 3 o Percent total solids and

12
W t . Sample % Total %(g) Solids Ash
L. nivalis 0 »3 949 12.1 0.63
brasiliensis 0.2851 0 *1915
29.739.0 0.73
1*4576 ■ . 12 s 3 . 0 .67BoS
0*5570 10.5 0.66
FIGURE 1» Lactose standard curve-
Bausch and Lomb Spectronic 20 feve length = 490 millimicrons Standard lactose = 0-005 mg/ml.

1310090 O Lact ose S t a n d a r d (ml.)
80
70 0.5
60
40<orh-Oo
30
202 4 6 8 100
% LACTOSE
TABLE 4. Percent lactose (above) and standard curve (below) » Values given are averages for percent transmission (%T): determined and for percent lactose (%L) as read from plotted
standard curve. A.D. = average deviation
from mean.

14
BosXl o
nivalis. . ». T obrasiliensis
Sample Number 5 5 6Mean % T 59 =3 47.6 59.9A = Do 2.98 2.50 3.378
Mean % L .4.48 5.39 3 .70AoDo 0.42 0.47 o 0 oo
Standard Curve(ml S L)j oo 0.5 1.0 1.5 2.0
SampleNumber 4 4 4 2 4
Mean % T 100 69.7 51.6 33.2 23.7
AoDo 4.07 2.75 1.95 1.62

15The mean values and average deviations for the plotted points are given in table 4* page 14 together with a summary of the lactose percentages*
In determining percent protein the Miero-Kj eldahl technique of Kfe and Zuazaga (1941) as previously described
was used* The results are given in table 5* page 16„
Calculations percentages were made following volumetric determinations by the formulae?
Wto Nitrogen (mg) = ml acid r normality acidx equiv,, wt * Nitrogen
m T i S f f :(n,g)=% Protein == % Total N x 6,38
The errors Involved in the determinations include weighing a small sample^ titration to a visible end point# and columetric standardization of the acid* There are errors also in the calculations due to the assumption that the percent nitrogen in protein Is relatively constant (usually 15 „38%) * A five percent error may be assumed due to non-
These errors can he minimized by carrying out other determinations# a procedure not allowable in this

TABLE 5„ Micro-Kjeldahl determination of
nitrogen and caldulated percent protein.
Mean values are given for Bos milk samples* (% protein determined using the factor 6,38)

NOoSamples
Wt,.Sample
CglNitrogen
(mg)Nitrogen
(%)Protein
(%)A,D,
Bos8 0,506 2,425 0,480 3,057 0,082
Tobrasiliensis 0,2621 4,321 ; 1,65 10,53
2 0,2870 5,235 1,82 11,61
L-nivalis1 . . 0,3169 2,171 0,685 4,37 -
Wt,Sample
(g);
CalculatedNitrogen■ (mg) : _
Determined Nitrogen
(mg): ... .%
Error
Ammonium0.206 4.3672 % 4.3365 0.47
Sulfate. 0,013 2.7772 2.6117 0.59

17case due to the limited size and number of samples» To help insure minimum error in technique two controls were used o These controls consisted of analytical determination of nitrogen from known samples of ammonium sulfate a.nd simultaneous analyses of bovine milk samples,, I feel that the significance is of comparative rather than absolute values and since the same error is inherent in all determinations and is not of an experimental nature* it may be ignored«
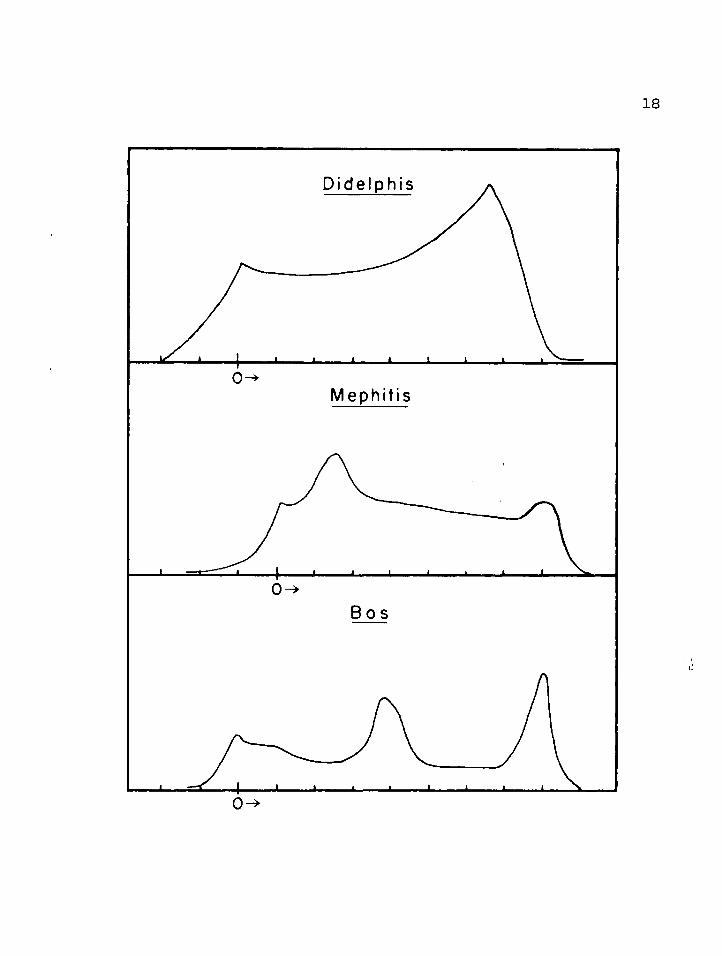
In examining the electrophoretic patterns of milk one should bear in mind that each peak may possibly represent a group of proteins rather than a single one. For some animal species these peaks have been identified for specific protein groups while for others a comparison is made with the known protein groups on the basis of migratory rate. .The casein patterns are shown in figure 3 and the whey protein patterns in figure 4 0 Figure 2 shows for comparison three general types of casein proteins given in the literature (Sloan eh ale* 1961)v
The casein patterns of To brasiliensis and Lo nivalis show all three components of bovine casein quite distinctly*

FIGURE 2 * Casein, electrophoreticpatterns. Units in cm.
1„ Didelphis? ‘primitive8 pattern2, Heph.itis; ‘more advanced6 pattern 3 o Bps; "most advanced” pattern
(from Sloan et al., 1961)
18
D i d e l p h i s
Mephitis
B o s
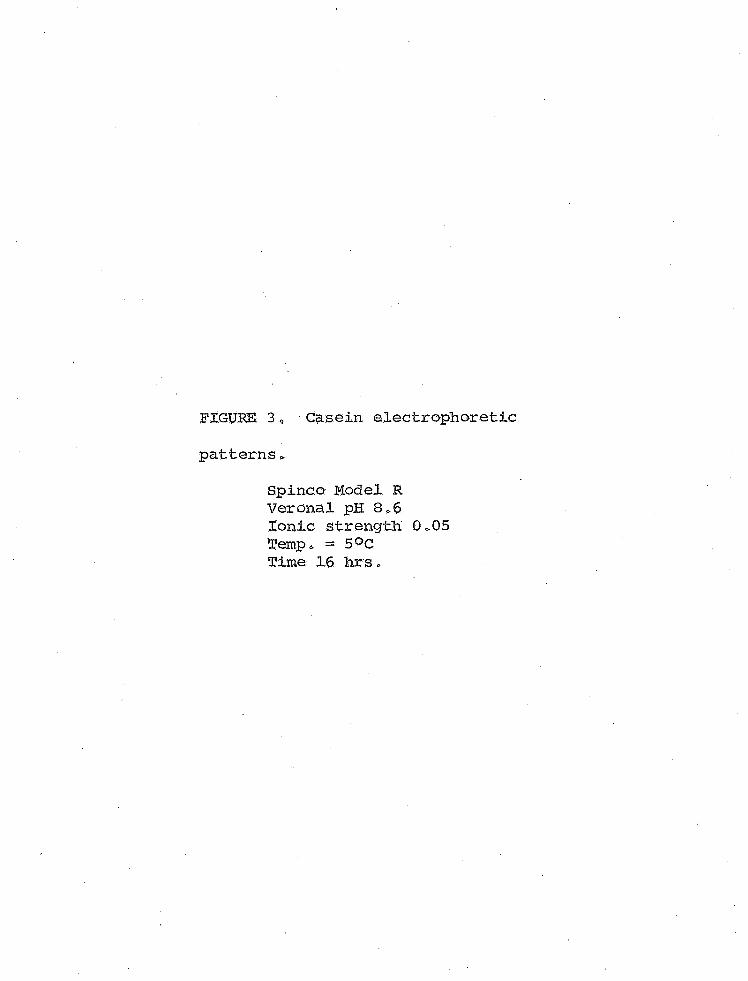
FIGURE 3 * Casein electrophoretic
patterns»Spinco Model R Veronal pH 8,6 Ionic strength 0,05 Temp, — 5°C Time 16. hrs,

19
B o s
0->
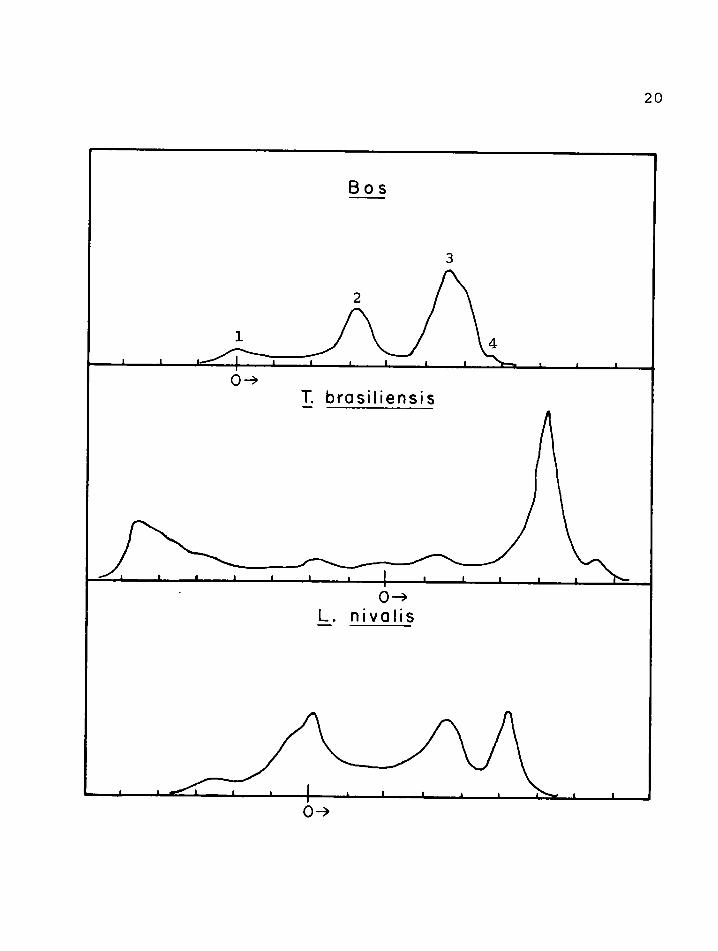
FIGURE 4» Paper electrophoreticpatterns - whey protein.
Spineo Model R Veronal pH 8,6 Ionic strength 0,075 Temp, =* 25°C Time 16 hrs,
Boss . •1, = immune globulins2, = a-lactalbumin3, = b—lactoglobu1in4, = bovine blood
serum albumin
20
B o s
T. bras i l i ens is
0~>L. n i v a l i s
0->
21Both show a pronounced bovine ft -casein component and, in addition, brasiliensis displays a rather complex
pattern of the slowest-moving and fastest-moving fractions.Chromatographic runs were made on the whey dialy
sate to determine the presence of lactose or other sugar components. It had been suggested (R. E. Sloan, 1962, personal communication) that possibly other sugars such as glucose, galactose or various polysaccharides of pentoses are present in the milk of primitive theria. The results of the chromatography confirmed the presence of lactose but did not demonstrate the presence of glucose or galactose (which were run as known control samples), nor were any other spots present for which there were no control samples.
Table 6 is a summary of the chemical and physical properties of bat and cow milk as determined in this study (columns C,D, and E) compared to similar results of other
studies (columns A and B).
TABLE 6„ Summary and comparison of properties of milks oLines A and B from Cox and Mueller (1937).*From Davies, W. L. (1939)„

SpecificGravity
(°G)% . ' % % % .................
Protein Carbo- Total Ash pH hydrate Solids
At> Rattus lo047 (250): 11.47 2.83 31.7 1.5 6,6B, M m li03l (25°)- 3.42 4.75 12.7* 0.75 6*7
Co Bos 1.034 (220), 3 .06 4.48 11.4 0.66 CM .«=>
Do L„ nivalis 1.026 (220) 4.37 5.39 12.1 0.63 6.8E. To brasiliensis 1.034 (22°)? 11.07 3.70 34.4 0.73 6.3
tvtv

DISCUSSION
Ihe pH and the specific gravity•of the milks analysed in this study indicated no significant differences* The specific gravity of the bovine controls compared favorably with known values and were only slightly higher , than values for bat milk9
The results obtained from lactose determinations Showed a significantly higher percent lactose for L* nivalis*
a pollen and nectar feeder# than for T* brasiliensis* an insect feeding bat„ The lactose determined for the bovine samples compare favorably with known values and show a Significantly higher percent lactose than To brasiliensis *A direct relationship is implicated here between the amount of dietary carbohydrate and the percent lactose found in the milk of these species * A closet examination of other species of bats would be necessary, in order to establish
such a dietary correlation but the implied relationship is interesting„
The colorimetric method and the difficulties inherent
23
' 24in reading the percent lactose from a plotted standard
curve may have contributed in part to the observed margin of error between trials*
brasiliensis milk showed a significantly higher percent, total solids and percent protein than the same values obtained for 1* nivalis or Bos. Whether or not this difference can be attributed to diet was not determinable in this
study*%be high percent of total solids in T. braslliensis
milk may appear to contradict the results of the specific gravity determinations t but it has been pointed out by . Jenness and Patton (1959) that a high protein content may be accompanied in milk by a correspondingly high fat content„
Assuming this to be the situation# the one would tend to offset the other in specific gravity determinations of
whole milk samples *The high percent protein determined in T* brasi1iensis
milk confirms the value obtained for total solids in the milk of this species* As was previously mentioned, the percent protein values are a relative measure based upon the total nitrogen content of Whole milk simples „ It was
2 5 '
evident from observing the weight of the freeze-dried
proteins that the greater percentage of this protein is
casein although no determinations were specifically made for casein-
Casein is defined as the acid^precipitab1e fraction of whole milk and is a phospho-protein with ester-linked ionisabie phosphate groupings» The rate of casein migration in an electrophoretic system has been correlated directly to the number of ionizable phosphate groups (jenness and Patton, 1959)4
The import of the work by Sloan and his group (1961) is the correlation made between milk protein patterns and the degree of , primitiveness’1 of origin for any order
of mammals, These investigators designate a protein as *primitive* because it is found in an animal whose immediate ancestors, based on morphological data> are believed
to have appeared relatively early.in mammalian history„
f ^Primitive6, as referred to by Sloan Is interpreted to mean the degree of 6recentness* of origin of any living mammalian stock. Designating any one order of animals as primitive or advanced is purely hypothetical, and at best, can be applied to only one character in a single line of descent; or to the relative degree of specialisation of any one character in animals at the same level9

26Hie assumption, that a protein has remained the same, or even relatively so* since the first appear nee of a. line giving rise to any animal* is not necessarily valid simply because morphological characters have remained essentially unchanged.
In the light of what has been postulated for correlating the electrophoretic patterns of milk proteins with the phylogenetic origins of mammals one would expect the patterns of the milk proteins of Ghiroptera to correspond to the “most primitive * patterns determined since they are, apparently,, descendents of relatively early appearing mammals, the insectivores* The present
study, however* shows that this is not the case in at least two species of bats in different families* The casein '
electrophoretic patterns of braslliensis and „L». nivalis do, in fact, Represent Sloan1s ‘most advanced* casein pattern, showing three peaks which greatly resemble the bovine casein
electrophoretic peaks«The electrophoretic whey protein patterns seem
to be even less valid as phylogenetic criteria since they
are influenced so profoundly by blood serum proteins and by the animal‘s lactation stage (Sloan et al., 1961)»

27%be whey protein patterns of the two bats examined appear to be distinctly different/ but it must be remembered that these are pooled samples from various undetermined lacta^ tion stages. It is of interest to note the electrophoreti— cally positive component in the two bat whey protein patterns (i»e># the fraction moving to the left)„ This fraction has appeared in some perissodactyls and carnivores, and is possi~ bly the basic enzyme lysozyme (Sloan et al., 1961).
When Comparing the electrophoretic milk protein patterns, it is only possible to indicate general similarities within a given group of mammals. That similarities occur between groups (The Orders Artiodactyla, Jferissodadfcylat Carnivora, and Primates), or that differences occur among the same group (the Rodertia, ScivrusNeotoma, and Cavla) has previously been pointed out (Sloan et. al., 1961).". The present study has added additional discrepancies, the sum of which indicates that further biochemical Studies are both necessary and desirable in order to better define the phylogenetic significance of this character. In this regard the Order Chiroptera may present an ideal study group. They show a distinct group specialization, they are an old group
phylogenetically and demonstrate considerable species radiation

into various ecological niches„ This latter factor may he especially important when considering this group1s nutritional diversity.

SUMMARY AND CONCLUSIONS
Milk from two species of bats, Leptonvcteris nivalis, Family Phyllostomatidae and ladarida brasiliens is* Family Molossidae, known to utilize different types of food * was analyzed for the following chemical and physical properties| 1. Specific gravity 2. pH. 3 „ Total solidand ash content„ 4. Percent lactose. 5. Percent totalnitrogen and protein„ 6. Electrophoretic properties of casein and whey proteins * 7„ Qualitative chromatographic determination of sugar.
Although several new facts were determined in this Study# more questions have been posed than have been
answer ed *An analysis of the data presented above indicates
that the two species of bats examined differ considerably in the composition of their milk? 1* L» nivalis, a pollen and nectar feeding bat* has a higher percentage of milk
sugar than does T. brasiliensls< which feeds on insects for than Bos which is a herbivore)= 2. I. brasiliensis

30on the other hand has a much greater protein content than does L= nivalis (or than Bos which is similar in this regard to JCjo nivalis) * In order to relate these differences to diet, it would be necessary to examine milk of other bats which have similar diets and of those which have different
diets. 'The only sugar detected in paper chromatographic
analysis was lactose, but the controls were not stringent enough to exclude all possibility of other sugars being present.
The physical properties measured in this study, pH and density, remained similar despite the wide varia
tions in milk compos it1on, From the density and percent protein determined for brasiliensis milk it is postulated that milk of this species would have a relatively high percent composition of fat*
The electrophoretic patterns of casein and whey protein provide a convenient analytical tool for some highly
important milk components |important dietetically and perhaps
phylogenetica1ly)* However t because of the complexities
inherent in the analytical method and in phylogenetic concepts*
the interpretation of results remains vague * To ascribe a

' ■ 31degree of "primitiveness# fc@ any specific electrophoretic pattern can only foe done in a most general and qualified way„ As determined^, the casein patterns of nivalis and T,. brasiliensis show no obvious resemblance to those of marsupials or of 'more primitive1 patterns found in Mustela, Mephitis„ Procyon, and Homo.

LITERATURE U H E D
Beattyy
Cox, W ?
Davies,f
Evans, ]
Horwitz,
Jenness,
Kahier.»
Ma* T» i
Marier,
Lee J5> 1955, Autecology of Leptonvcteris nivalis * Ph<,D« Thesis » University of Arizona9
and A» J1. Mueller, 1937% Composition of MilkFrom Stock Rats and Apparatus for Milking Small Laboratory Animals. Journal of Nutrition 134249^ 26.1* ■ - , ■'
W, L$. 1939» The Chemistry of Milk* D, VanNostrand Co,^ Inc*# New York.). Elizabeth, 1959, Milk Composition of MammalsWhose Milk is not Normally Used for Human Consumption* Dairy Science Abstracts 21:(7),277-288,W P (chrm. and ed,) Offidial Methods of Analysis of the Association of Official Agricultural Chemists, i960* Washington, D, G, (9th Edition).R* and S, Patton, 1959, Principles of Dairy Chemistry, John Wiley and Sbns* 'Inc*# New York,H. 1941—42. Apparatus for Milking Mice* Journal of the National cancer Institute# 2:457-458 *
and G, Zuazaga, 1941# Micro—Kj eldahl Determination of Nitrogen# Indusfriai and Engineering Chemistry (Analytical Edition) 14*280-J * R. and Mb Boulet„ 1959 * Direct Analysis ofLactose in Milk and Serum* Journal of Dairy Science 42s1390»
32

33McEarren, Eo F», Kathleen Brand and H„ R, Rutkowski„ 1951,
Quantitative Determination of Sugars on FilterAnalytical Chemistry 23 s1146*
Muellers A„ 1939* Modified Apparatus for MilkingSmall laboratory Animals % lournal of laboratory and clinical Medicine 24i425-427«
Miederlj, J 9 B, and V, Niederlo 1942» Microraetbodg of Quantitative Organic Analysis*. John Wiley and Sons* I n c N e w York. y
Pilson, M# E. Qv and A« L= Kelly. 1962. Compositionof the Milk from Zalophus californianus, The California Sea Eton. Science 13 5 s104 ?
Ross, Anthony* 1961. Notes on Food Habits of Bats Journal of Mammalogy 42si.
Sloans Ro E^ 1962. Personal Communication*Sloan, R* E** R» Jenness, A. L. Kenyon, and Edna A* Regehr.
1961. Comparative Biochemical Studies of Milks «1% Electrophoref io Analysis of Milk Proteins * Comparative Biochemistry and Physiology 4:47-62.
Sowls, L* :K*y V. R. Smith* R* Jenness, R. E, Sloan, Edna Regehr* 1961* Chemical Composition and Physical Properties of the Milk of the Collared Peccary. Journal of Mammalogy 42:2? 245-251.
Temple, P. L. and S. X* Kon. 1937. Simple Apparatus forMilking Small Laboratory Animals Biochemical Journal 31:2197-2198.