Embed Size (px)
Citation preview
The Composition Matters: Capital Inflowsand Liquidity Crunch During a GlobalEconomic Crisis
Hui TongIMF
Shang-Jin WeiColumbia University, Tsinghua, NBER, and CEPR
This article studies whether the volume and composition of capital flows affect the degreeof credit crunch during the 2007–2009 crisis. Using data on 3,823 firms in 24 emergingcountries, we find that, on average, the decline in stock prices was more severe for firmsthat are intrinsically more dependent on external finance for working capital. Interestingly,while the volume of capital flows per se has no significant effect, the composition mat-ters a lot. In particular, greater dependence on non-FDI capital inflows before the crisisworsens the credit crunch during the crisis, while exposure to FDI alleviates the liquidityconstraint. (JELF30, G20, G30)
Financialglobalization, in theory, can bring capital, knowledge, and disciplineto a country, thereby improving efficiency and productivity. The empirical lit-erature, however, does not produce clear-cut results. This has generated a largebody of work that has been reviewed in several survey articles (Stulz 2005;Henry 2007;Kose, Prasad, Rogoff, and Wei 2003, 2009, and2010; andRodrikand Subramanian 2009). One channel through which exposure to financialglobalization may carry a downside is increased vulnerability to a financialcrisis. This is thought to be especially relevant if the composition of capitalinflows is skewed toward non-FDI types such as bank lending and portfolioflows (Wei 2001and2006;Levchenko and Mauro 2007) since internationalbank lending, and to some smaller extent portfolio flows, are more likely to bereversed than FDI in the event of a crisis.
We thank Anusha Chari, Stijn Claessens, Enrica Detragiache, Todd Gormley, David Romer, Heather Tookes,an anonymous referee, the editor (Matthew Spiegel), and seminar participants at the IMF, HKMA, Universityof Illinois at Chicago, the 16th Mitsui Finance Symposium at University of Michigan, the Yale/RFS FinancialCrisis Conference, and the Twelfth Conference of the ECB-CFS Research Network for helpful comments, andZeynep Aksoy, John Klopfer, and Jane Yoo for excellent research assistance. The views in the article are thoseof the authors, and do not necessarily reflect those of the IMF. Send correspondence to Hui Tong, ResearchDepartment, International Monetary Fund, 700 19th St.NW, Washington, D.C. 20431; E-mail: [email protected];Shang-Jin Wei, Graduate School of Business, Columbia University, 619 Uris Hall, 3022 Broadway, New York,NY 10027; telephone: (212) 854-9139. E-mail: [email protected]; Webpage: www.nber.org/∼wei.
c© The Author 2010. Published by Oxford University Press on behalf of The Society for Financial Studies.All rights reserved. For Permissions, please e-mail: [email protected]:10.1093/rfs/hhq078 Advance Access publication September 26, 2010
at Mem
orial Univ. of N
ewfoundland on A
ugust 4, 2014http://rfs.oxfordjournals.org/
Dow
nloaded from
TheReview of Financial Studies / v 24 n 6 2011
This article aims to test whether the severity of an emerging marketeconomy’s credit crunch during the 2008–2009 global financial crisis is sys-tematically linked to the volume and the composition of its pre-crisis interna-tional capital inflows. The crisis originated in developed countries and spreadto emerging markets through several channels, including a reversal of globalcapital flows. It differs from most previous crises that are emphasized in theexisting literature, which tend to be home-grown debt crises or balance-of-payments problems. Because the crisis started in the financial sector, it is notself-evident that non-financial firms suffered from a liquidity crunch. For ex-ample,Bates, Kahle, and Stulz(2009) noted that non-financial firms in theUnited States held an abundance of cash prior to the crisis.Chari, Christiano,and Kehoe(2008) rejected the idea of a sharp decline in either bank lend-ing to non-financial firms or commercial paper issuance by non-financial firmsduring the financial crisis. The European Central Bank in March 2009 (ECBMonthly Bulletin) summarized its judgment on the topic by stating that “Thereis no clear evidence to date that supply constraints have cut off access tocredit.”
Nonetheless, there are reasons to think that a financial crisis in developedcountries could generate a liquidity crunch for non-financial firms in an emerg-ing market economy even if these firms do not borrow directly from foreignbanks. The liquidity of a domestic banking sector is partially supported bydomestic banks’ borrowing from foreign banks. In principle, when foreignlending retrenches, as it is prone to do in a global crisis, domestic banks maybe forced to cut down lending to domestic non-financial firms. This createsa channel that links the liquidity crunch experienced by non-financial firmsin a country to the country’s prior exposure to foreign lending. In compari-son, if FDI flows are less cyclical, then a liquidity crunch in a host countryshould be less linked to its FDI exposure. Foreign portfolio flows are likelyto be in between FDI and bank lending in terms of reversibility during a cri-sis. These possibilities have important economic and policy implications, andshould therefore be subject to thorough empirical testing.
We use data on 3,823 manufacturing firms in 24 countries, and explorecross-firm as well as cross-country variations in stock price responses to thecrisis. The basic idea is this: Changes in aggregate economic indicators andaggregate stock prices potentially reflect a multitude of factors, making it dif-ficult to identify the severity of a credit crunch. However, if a credit crunchexists, it should be reflected in the relative stock price movement of thosemanufacturing firms that rely disproportionately on external financing for in-vestment and working capital, versus those firms that do not. To preview themain results, we find clear evidence of a worsening credit crunch in emergingmarket economies in 2008. Relative to those firms whose intrinsic dependenceon external finance for working capital(DEF WK) is in the bottom quartile,those firms whoseDEF WK is in the top quartile experienced a greater declinein their stock prices by at least nine percentage points during the same period.
2024
at Mem
orial Univ. of N
ewfoundland on A
ugust 4, 2014http://rfs.oxfordjournals.org/
Dow
nloaded from

TheComposition Matters: Capital Inflows and Liquidity Crunch During a Global Economic Crisis
While the average effects are statistically significant, they are not quantitativelyoverwhelming when compared to the extent of the total fall in stock prices.
This paves the way for the central part of the article: the role of country-level exposure to financial globalization in the transmission of the supply-of-finance shock. We zoom in on pre-crisis exposure to international capital flowsin particular, and interact it with firms’ sensitivity to external financing. Wefind that the total volume of pre-crisis capital inflows is not systematicallyrelated to the severity of the credit crunch, but the composition of the capitalinflows matters in an important way. In particular, a large pre-crisis exposureto non-FDI capital inflows tends to be associated with a more severe creditcrunch during the crisis, but pre-crisis exposure to FDI does not worsen a creditcrunch. This provides fresh evidence for the idea in the literature that differenttypes of capital flows bring different benefits and costs to recipient countries.
This article is linked to two sets of literature. The first is on credit crunches(e.g.,Bernanke and Lown 1991; Borensztein and Lee 2002; Kroszner, Laeven,and Klingebiel 2007;Claessens, Kose, and Terrones 2008; Dell’Ariccia,Detragiache, and Rajan 2008). A small but growing literature has investigatedthe origin and consequences of the recent crisis, includingDell’Ariccia, Igan,and Laeven(2008), Mian and Sufi (2008), Reinhart and Rogoff(2008),Greenlaw, Hatzius, Kashyap, and Shin(2008),Almeida et al.(2009),Ehrmann,Fratzscher, and Mehl(2009), andEichengreen et al.(2009). None of these pa-pers, however, examines the role of the composition of capital flows in thetransmission of the crisis.
The second literature to which this article is related studies the benefits andcosts of financial globalization. A subset of the literature investigates possi-bly different effects of the composition of capital flows for economic growthor vulnerability to balance of payments crises. The views diverge. On the onehand, some regard FDI as more stable and thus less likely to trigger a financialcrisis than portfolio financial flows and bank loans (e.g.,Berg, Borensztein,and Pattillo 2004). On the other hand, others doubt the relative destabiliz-ing properties of bank lending and portfolio flows (e.g.,Claessens, Dooley,and Warner 1995). In a more recent paper,Levchenko and Mauro(2007) findmixed evidence: While FDI is less volatile than other types of capital flowsas measured by coefficient of variation, different types of capital flows do notseem to differ significantly in persistence, pro-cyclicality, or responsiveness toU.S. interest rates. For emerging market economies, the current global crisisis different from a usual balance-of-payments crisis or a home-grown finan-cial crisis, which were the subjects of virtually all previous papers on financialcrises. Thus, while none of the previous papers studies if and how the extent ofa liquidity crunch experienced by non-financial firms across countries is linkedto a country’s pattern of capital flows, the current crisis provides an opportunityto do so.
The article proceeds as follows. Section1 presents our key specification,construction of key variables, and sources of data. Section 2 discusses the main
2025
at Mem
orial Univ. of N
ewfoundland on A
ugust 4, 2014http://rfs.oxfordjournals.org/
Dow
nloaded from
TheReview of Financial Studies / v 24 n 6 2011
empirical results and a slew of robustness checks and extensions. Section2offers concluding remarks.
1. Specification and Key Variables
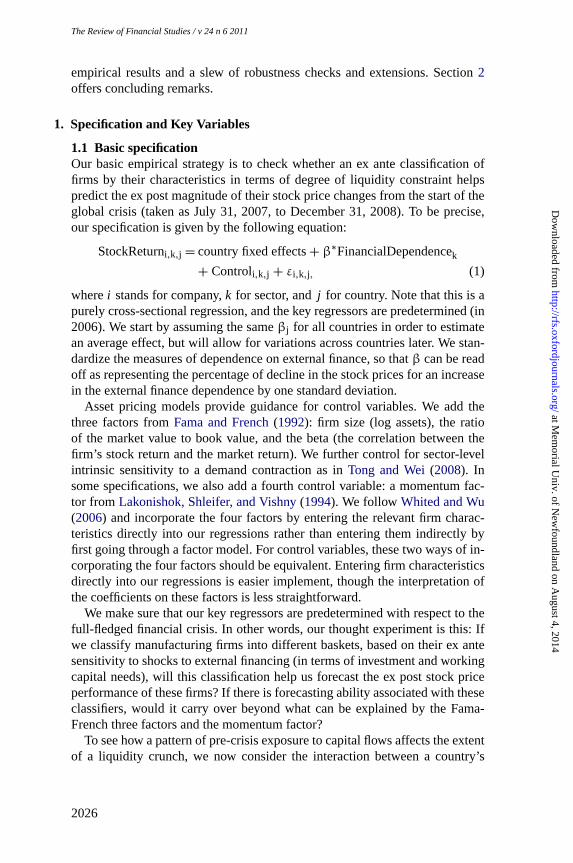
1.1 Basic specificationOur basic empirical strategy is to check whether an ex ante classification offirms by their characteristics in terms of degree of liquidity constraint helpspredict the ex post magnitude of their stock price changes from the start of theglobal crisis (taken as July 31, 2007, to December 31, 2008). To be precise,our specification is given by the following equation:
StockReturni,k,j = countryfixed effects+ β∗FinancialDependencek
+ Controli,k,j + εi,k,j, (1)
wherei standsfor company,k for sector, andj for country. Note that this is apurely cross-sectional regression, and the key regressors are predetermined (in2006). We start by assuming the sameβj for all countries in order to estimatean average effect, but will allow for variations across countries later. We stan-dardize the measures of dependence on external finance, so thatβ can be readoff as representing the percentage of decline in the stock prices for an increasein the external finance dependence by one standard deviation.
Asset pricing models provide guidance for control variables. We add thethree factors fromFama and French(1992): firm size (log assets), the ratioof the market value to book value, and the beta (the correlation between thefirm’s stock return and the market return). We further control for sector-levelintrinsic sensitivity to a demand contraction as inTong and Wei(2008). Insome specifications, we also add a fourth control variable: a momentum fac-tor from Lakonishok, Shleifer, and Vishny(1994). We followWhited and Wu(2006) and incorporate the four factors by entering the relevant firm charac-teristics directly into our regressions rather than entering them indirectly byfirst going through a factor model. For control variables, these two ways of in-corporating the four factors should be equivalent. Entering firm characteristicsdirectly into our regressions is easier implement, though the interpretation ofthe coefficients on these factors is less straightforward.
We make sure that our key regressors are predetermined with respect to thefull-fledged financial crisis. In other words, our thought experiment is this: Ifwe classify manufacturing firms into different baskets, based on their ex antesensitivity to shocks to external financing (in terms of investment and workingcapital needs), will this classification help us forecast the ex post stock priceperformance of these firms? If there is forecasting ability associated with theseclassifiers, would it carry over beyond what can be explained by the Fama-French three factors and the momentum factor?
To see how a pattern of pre-crisis exposure to capital flows affects the extentof a liquidity crunch, we now consider the interaction between a country’s
2026
at Mem
orial Univ. of N
ewfoundland on A
ugust 4, 2014http://rfs.oxfordjournals.org/
Dow
nloaded from

TheComposition Matters: Capital Inflows and Liquidity Crunch During a Global Economic Crisis
Table 1Average change in log stock prices from 7/31/07 to 12/31/08 for manufacturing firms in 24 emergingeconomies
Country Obs # Median Mean Std Dev Min Max
Argentina 28 −16.8 −31.6 56.0 −138.6 47.2Brazil 90 −51.9 −56.3 70.7 −307.6 80.2Chile 47 −26.2 −28.2 49.0 −164.5 87.6China 893 −89.2 −89.1 51.3 −361.5 209.5Colombia 8 −16.5 −43.0 102.3 −268.9 67.3Czech Republic 5 −9.5 −22.1 30.0 −66.9 2.6Egypt 27 −36.4 −27.9 45.5 −99.9 107.3Hong Kong 322 −112.2 −122.7 76.1 −454.7 119.3Hungary 12 −84.9 −72.8 41.2 −124.6 0.1India 516 −71.6 −73.5 57.5 −244.0 221.9Indonesia 112 −39.9 −45.1 77.3 −321.6 225.8Israel 61 −117.2 −120.6 100.8 −462.8 18.6Korea (South) 624 −79.3 −89.5 77.1 −709.5 120.2Malaysia 418 −53.2 −64.0 64.3 −366.1 60.5Mexico 38 −22.9 −34.4 62.9 −174.2 81.8Pakistan 66 −57.0 −60.5 70.2 −209.4 144.1Peru 19 −39.5 −39.8 61.4 −141.9 89.6Philippines 32 −61.4 −69.4 69.4 −213.9 31.2Poland 84 −148.0 −147.2 77.8 −534.2 13.3Russian Federation 24 −143.7 −129.4 65.2 −216.5 18.8Singapore 242 −110.3 −111.3 75.1 −352.8 152.4South Africa 57 −39.5 −47.6 62.1 −259.0 83.6Thailand 214 −34.7 −42.9 54.2 −214.7 71.8Turkey 120 −87.0 −82.2 59.2 −243.5 174.2
patternof financial integration and its manufacturing firms’ dependence onexternal financing. In other words,
βj = β1 + β2 Patternof CapitalFlowj, (2)
wherethe Patternof CapitalFlow experienced in countryj is measured byeither the total volume of pre-crisis capital inflows, or the composition of cap-ital inflows (FDI vs. non-FDI). The slope coefficient,β2, then captures theextent to which the severity of a credit crunch depends on patterns of capitalinflows.
1.2 Key data1.2.1 Percentage change in stock price.The stock price index is retrievedfrom Datastream, which adjusts for dividends and capital actions such as stocksplits and reverse splits. Table1 presents the log difference of stock prices formanufacturing firms in 24 emerging countries over the period from the endof July 2007 to the end of December 2008.1 (Manufacturing sectors are thosewith U.S. SIC 3-digit codes ranging from 200 to 399). The log difference of
1 December31, 2008, was the latest data point available when the article was completed.
2027
at Mem
orial Univ. of N
ewfoundland on A
ugust 4, 2014http://rfs.oxfordjournals.org/
Dow
nloaded from

TheReview of Financial Studies / v 24 n 6 2011
thestock price index was 81.8% on average, with a standard deviation as largeas 66.7%. It shows significant variation both across sectors within a countryand across countries, with Poland and Russia experiencing the largest declinein stock prices and Mexico and Thailand the smallest.
1.2.2 Financial dependence indexes.We develop two measures of intrinsicdependence for financing:
1. Intrinsic dependence on external financing for investment(DEF INV).We construct a sector-level approximation of a firm’s intrinsic demand on ex-ternal financing for capital investment following a methodology inRajan andZingales(1998):
Dependence on external finance for investment
= capital expenditures− cashflowcapitalexpenditures , (3)
where Cash flow= cash flow from operations+ decreases in inventories+decreases in receivables+ increases in payables. All the numbers are basedon U.S. firms, which are judged to be least likely to suffer from finan-cing constraints (during a normal time) relative to firms in other countries.While the originalRajan and Zingales(1998) paper covers only 40 (mainlySIC 2-digit) sectors, we expand the coverage to around 250 SIC 3-digitsectors.
To calculate the demand for external financing of U.S. firms, we take thefollowing steps. First, every firm in the Compustat is sorted into one of theSIC 3-digit sectors. Second, we calculate the ratio of dependence on externalfinancing for each firm from 1990 to 2006. Third, we calculate the sector-level median from firm ratios for each SIC 3-digit sector that contains at leastfive firms, and the median value is then chosen to be the index of demandfor external financing in that sector. Conceptually, the Rajan-Zingales (RZ)index aims to identify sector-level features (i.e., which sectors are naturallymore dependent on external financing for their business operation). It ignoresthe question of which firms within a sector are more liquidity constrained.What the RZ index measures could be regarded as a “technical feature” ofa sector, almost like a part of the production function. To capture the eco-nomic concept of the percentage of capital expenditure that has to be fin-anced by external funding, we winsorize the RZ index to range between0 and 1.
2. Intrinsic dependence on external financing for working capital(DEF WK).Besides the capital needed for investment, working capital is required for afirm to operate and to satisfy both short-term debt payment and ongoing op-erational expenses. Firms may use lines of credit, term loans, or commercialpaper to cover such needs. Firms may also use trade credit (implicit borrow-ing from either upstream suppliers by delaying payments for inputs or down-stream customers by collecting payments before delivery of output) to finance
2028
at Mem
orial Univ. of N
ewfoundland on A
ugust 4, 2014http://rfs.oxfordjournals.org/
Dow
nloaded from

TheComposition Matters: Capital Inflows and Liquidity Crunch During a Global Economic Crisis
theneed for working capital. If a liquidity crunch makes it difficult for a firmto raise funds for working capital that is distinct from external financing forlong-term investment, we would like to capture that. If there is an unexpectedliquidity crunch for working capital, those industries that depend intrinsicallymore on external financing for working capital should experience a larger de-cline of stock prices.
We construct a sector-level measure of intrinsic need for external financ-ing for working capital using the notion of “cash conversion cycle,” whichis “commonly used in financial analysis to measure the liquidity position of afirm” (Raddatz 2006). The cycle measures the time elapsed from the moment afirm pays for its inputs to the moment it receives payment for the goods it sells.We assume that dependence on external financing for working capital is dueto purely technological reasons, such as the length of time in the productionprocess and the mode of operation. For U.S. firms during a non-crisis period,when the supply of financing is as abundant as in any country, the relative val-ues of the cash conversion cycle across sectors reflect relative true needs forexternal financing for working capital. Specifically,2
Cashconversion cycle= 365∗(
inventories− accountpayables
costof goods sold
+account receivables
total sales
). (4)
The cash conversion cycle is used as a measure of dependence on externalfinancing byRaddatz(2006),Kroszner, Laeven, and Klingebiel(2007), andBraun and Raddatz(2008). We construct the index as follows: First, for eachU.S. firm during 1990–2006, we calculate the cash conversion cycle based onthe annual data from Compustat. Second, we define the sector-level value ofthe index (for each SIC 3-digit sector) as the median across all firms in thesector. We assume that the same index applies to all other countries. Across all3-digit sectors, the median and mean values of the index are 87 and 89 days,respectively, with a standard deviation of 29 days.
In the literature, another way to measure dependence on external financingfor working capital is the ratio of inventories to sales (Raddatz 2006). An in-spection of the definition of the cash conversion cycle reveals that the ratio ofinventories/sales is a component of the former. The cash conversion cycle is es-sentially the ratio of inventories to sales net of trade credit that a firm extendsto its upstream suppliers and downstream customers. Since the cash conver-sion cycle is more general, we favor this measure. Moreover, since a drying-upof trade credit is a form of tightening of the supply of external financing that
2 Inventories, accounts receivable, and accounts payable are year-end numbers, while costs of goods and sales areaggregated over the year. We multiply the ratio by 365, i.e., the number of days in a year.
2029
at Mem
orial Univ. of N
ewfoundland on A
ugust 4, 2014http://rfs.oxfordjournals.org/
Dow
nloaded from
TheReview of Financial Studies / v 24 n 6 2011
appearsto be an important feature of the 2007–2009 global crisis, the cash con-version cycle seems particularly appropriate for a study on the global crisis.
1.2.3 Control variables and summary statistics. In some subsequent anal-yses, we add other variables meant to control for risks, such as the three factorsfrom the Fama-French (1992) model, which are firm size (as measured by thelog of book assets), market asset to book asset ratio, and beta from the datasetsof Worldscope and Datastream. The firm-level market beta is based on the cor-relation between monthly firm stock price and the country-level market indexover the past five years. We also include a measure of the momentum factor;that is, the stock return for the firm from January 31, 2007, to June 30, 2007.
In our model, we use the domestic beta.Griffin (2002) finds that domesticfactor models perform better in explaining time-series variations in returns andhave lower pricing errors than the world factor model. Moreover, the additionof foreign factors to domestic models leads to less accurate in-sample and out-of-sample pricing. Hence, “practical applications of the three-factor model. . .are best performed on a country-specific basis.”
Another regressor is an index of a firm’s sensitivity to a contraction in con-sumer demand.Tong and Wei(2008) propose such an index at the sector levelbased on the stock price reactions of the firms in that sector to the September11, 2001, terrorist attack. To construct the index, we first compute the changein log stock price for each U.S. firm from September 10, 2001, to September28, 2001. We then look at the mean of the log stock price change for each3-digit SIC sector, and use it to measure the sector-level demand sensitivity.Excluding financial sector firms, we are left with 361 three-digit-level sectorsin total.
This index reflects the sensitivity of a firm’s stock price to an unexpectedshock in consumer demand, and it is not contaminated by a firm’s sensitivityto liquidity shocks or other factors. We verify that there was a big downwardshift in expected aggregate demand, as reflected by a downward adjustment inthe consensus forecast of subsequent U.S. GDP growth in the aftermath of theshock at the same time. Because the Federal Reserve took timely and decisiveactions, it may be argued that the effect of the 9/11 shock on firms’ financialconstraints was small or at most short lived. In the 2001 episode, both the levelof the real interest rate and the TED spread (risk premium), after initial spikes,quickly returned to a level only moderately higher than the pre-9/11 level. Thissuggests that the market regarded the Federal Reserve’s actions in the first fewdays following the attack as sufficient to restore the market’s desired level ofliquidity. We therefore conclude that the cumulative stock price change fromSeptember 10 to 28, 2001, is unlikely to also reflect firms’ reactions to a dete-rioration of credit availability. (In contrast, the subprime crisis news is associ-ated with a much greater increase in the TED spread.) Additional details canbe found inTong and Wei(2008).
2030
at Mem
orial Univ. of N
ewfoundland on A
ugust 4, 2014http://rfs.oxfordjournals.org/
Dow
nloaded from

TheComposition Matters: Capital Inflows and Liquidity Crunch During a Global Economic Crisis
Table 2aSummary statistics
Variables Obs# Median Mean Std. Dev. Min. Max.
StockReturn 3823 −77.8 −81.8 66.7 −347.2 55.4DEF INV 3796 0.2 0.2 0.3 0.0 1.0DEF WK 3823 86.8 88.5 28.5 22.3 169.2Demand sensitivity 3819 1.4 1.5 0.7 −1.1 4.3Company size 3823 14.5 15.0 2.7 9.0 25.1Market/book 3823 1.5 2.4 2.8 0.3 23.6Beta 3778 0.64 0.71 0.65 −1.42 3.45Momentum 3823 20.77 26.45 37.54 −178.39 331.42
DEF INV denotes dependence on external financing for investment, andDEF WK denotes dependence on ex-ternal financing for working capital. Summary statistics are based on listed manufacturing firms in 24 emergingeconomies. Change in stock prices is from July 31, 2007, to Dec 31, 2008. All other variables are measured atthe end of 2006.
Table 2bCorrelation of variables
Stock return DEF INV DEF WK Demand sensitivity Firm size Market/bookBeta
DEF INV −0.05DEF WK −0.11 0.09Demand sensitivity −0.15 0.05 0.10Firm size 0.07 0.01 −0.08 −0.04Market/book −0.06 0.05 0.03 −0.03 −0.04Beta −0.16 0.02 0.03 0.08 0.01 0.02Momentum −0.15 0.06 0.02 0.04 0.01 −0.05 −0.10
Table2a reports the summary statistics of the key variables. Table2b re-ports pairwise correlations among the variables. In the following regression,we standardizeDEF INV and DEF WK (so the standard deviation is one byconstruction). As a result, the regression coefficients on these variables di-rectly measure the percentage change in the stock prices from an increase inthe dependence on external financing by one standard deviation. We can alsocompare the relative magnitudes of the two indexes more easily.
2. Empirical Analysis
2.1 The extent of financial constraintWe examine percentage changes in stock prices (or, more precisely, differencein the log of stock price) from July 31, 2007, to December 31, 2008, for man-ufacturing firms in 24 emerging countries. In Column 1 of Table3, the depen-dence on external financing for investment(DEF INV) is the only regressor,and it has a negative but statistically insignificant coefficient. In Column 2,with the dependence on external financing for working capital(DEF WK) asthe only regressor, its coefficient is also negative, and significant at the 5%level. In Column 3, we putDEF INV andDEF WK together in the regression,and find thatDEF WK maintains its earlier magnitude and sign. This is not
2031
at Mem
orial Univ. of N
ewfoundland on A
ugust 4, 2014http://rfs.oxfordjournals.org/
Dow
nloaded from

TheReview of Financial Studies / v 24 n 6 2011
Table 3The average effect of liquidity crunch across countries
1 2 3 4 5 6 7
DEF INV −0.841 −0.533 0.109 0.283 −0.029 0.167[2.915] [2.407] [2.330] [2.083] [1.980] [2.080]
DEF WK −5.446** −5.369** −4.844** −4.303** −4.740*** −4.532**[2.188] [2.251] [2.157] [1.904] [1.782] [1.801]
Beta*Market Return 0.326*** 0.310*** 0.303*** 0.310***[0.044] [0.044] [0.043] [0.044]
Firm size 1.622 1.295 2.643** 2.842**[1.078] [1.078] [1.093] [1.090]
Market/Book −1.166* −1.250* −0.973 −0.885[0.672] [0.669] [0.666] [0.676]
Momentum −0.145*** −0.144*** −0.132*** −0.128***[0.040] [0.040] [0.040] [0.041]
Demand Sensitivity −9.350*** −8.876*** −8.735***[2.062] [2.059] [2.204]
Leverage −35.44*** −36.89***[4.453] [4.605]
Trade sensitivity −3.052[2.331]
Observations 3796 3823 3796 3751 3747 3743 3576R-squared 0.14 0.144 0.145 0.175 0.184 0.198 0.191Country fixed effects Yes Yes Yes Yes Yes Yes Yes
Thedependent variable is the change in log stock prices from July 31, 2007, to December 31, 2008. Standarderrors, clustered at the sector level, are in brackets. ***, **, and * denote statistically significant at the 1%, 5%,and 10% levels, respectively.
surprising,as the correlation between the two indexes is low (only 0.04). Thatis, they appear to capture different needs for external financing.
Columns 1 to 3 of Table3 show that the fall in stock prices is statisticallylarger for sectors with a higher dependence on external financing for workingcapital. What about the economic significance? An increase in dependence onexternal financing for working capital(DEF WK) from the 25th to the 75th
percentileleads to an additional decline in the stock price by 9.3 percentagepoints.
The difference in the significance levels betweenDEF WK and DEF INVcan be interpreted in two ways. First, it is possible thatDEF WK is a bettermeasure of a firm’s intrinsic dependence on external financing thanDEF INV.Indeed,Fisman and Love(2007) suggest thatDEF INV may capture sector-specific shocks, though it is less likely to be the case here sinceDEF INV ispredetermined (measured with pre-crisis data and based on U.S. firms’ actualuse of external financing). Second, to the extent that the two measures capturedifferent aspects of a firm’s dependence on external financing, the statisticalresults suggest that the contraction of credit supply and widespread concernamong financial institutions about counterparty risk have inflicted dispropor-tionate pain on those firms that are heavily dependent on external financing forworking capital.
In Column 4 in Table3, we add beta as a control variable. The coefficient onthe “beta*market return” variable is positive and significant. This is intuitive,
2032
at Mem
orial Univ. of N
ewfoundland on A
ugust 4, 2014http://rfs.oxfordjournals.org/
Dow
nloaded from
TheComposition Matters: Capital Inflows and Liquidity Crunch During a Global Economic Crisis
asit says that firms with a smaller beta experience a smaller reduction in theirstock prices during the market downturn, other things being equal. We alsoadd, as controls, firm size and market-to-book ratio from the Fama-Frenchmodel, as well as the momentum factor (stock return from January 31 to June30, 2007). The firm size variable is positive, as larger firms may have betteraccess to credit even in times of crisis. Firms with a high market-to-book ra-tio experience a greater decline in price. Adding these factors slightly reducesthe magnitude ofDEF WK, suggesting that part of the financial constraint onDEF WK is correlated with firm-level risk factors, as described by the Fama-French model.
In Column 5 in Table3, we control for a sector’s intrinsic sensitivity toaggregate demand. This is significantly negative, verifying that a demand con-traction is one reason for the deteriorating performance of manufacturing firms.In Column 6, we further control for firms’ pre-crisis leverage. We find thatleveraged firms suffered greater stock price declines during this crisis, proba-bly due to the difficulty of rolling over debt in an environment of tight finan-cial supply. In the last two columns, we continue to find a significant effect ofDEF WK but not ofDEF INV.
Since a global recession could affect a firm’s earnings directly through re-duced exports, we further examine if the firm-level sensitivity to trade plays asignificant role during the crisis. We employ a two-step procedure to constructa measure of sensitivity to trade. First, a firm’s annual stock return is regressedonto a constant and the annual percentage change in the country’s exports inthe relevant 3-digit sector from 1992 to 2006. Second, the coefficient on theexports variable is used to proxy the trade sensitivity of the firm. By addingthis variable to the regressions in Table3 (Column 7), the sample size shrinksby around 4.5%. In any case, the trade-sensitivity index does not turn out to bestatistically significant. When we reclassify the negative values of trade sensi-tivity as zeros to reduce potential noises in the proxy, we obtain a negative butstill insignificant coefficient (with a coefficient of−3.05 and a standard errorof 2.33; see the last column of Table3). Importantly, adding trade sensitivitydoes not alter the earlier results forDEF WK.
2.2 The role of pre-crisis exposure to international financingSo far we have documented the tightening of financial constraints, on average,across countries. We now turn to the central part of the analysis by examiningwhether the cross-country variation in the severity of a credit crunch is relatedto a country’s pre-crisis exposure to international capital flows.
International capital flows increased rapidly from 2002, peaking in 2007.Since 2008, however, world capital inflows have declined sharply, by 44% inabsolute dollar amount relative to the peak in 2007. As a result, emerging mar-kets have experienced a “systemic sudden stop,” a capital account reversal witha systemic and largely exogenous origin, as defined byCalvo, Izquierdo, andMejia (2008).
2033
at Mem
orial Univ. of N
ewfoundland on A
ugust 4, 2014http://rfs.oxfordjournals.org/
Dow
nloaded from

TheReview of Financial Studies / v 24 n 6 2011
Table 4Pre-crisis exposure to capital inflows (% of GDP; averaged from 2002 to 2006)
Country Total Inflow FDI FPI ForeignLoans
Argentina 1.00 2.29 −3.21 1.92Brazil 2.11 2.26 0.11 −0.26Chile 8.41 5.61 1.43 1.38China 5.13 3.11 0.78 1.24Colombia 4.08 4.22 0.16 −0.31Czech 5.77 6.24 −2.76 2.30Egypt 4.17 3.95 0.57 −0.35HK 24.31 15.53 −6.42 15.20Hungary 11.31 5.02 2.05 4.24India 3.68 1.16 1.08 1.44Indonesia 1.48 0.96 1.34 −0.82Israel 8.23 3.93 3.53 0.78Korea 4.19 0.72 1.56 1.91Malaysia 20.07 3.05 22.73 −5.71Mexico 2.96 2.96 −0.13 0.13Pakistan 0.53 1.36 0.13 −0.96Peru 3.62 3.06 1.92 −1.36Philippines −1.70 1.55 0.29 −3.54Poland 6.95 3.68 2.58 0.70Russia 6.22 2.03 0.79 3.41Singapore 30.45 14.11 3.89 12.46South Africa 5.48 0.95 3.02 1.51Thailand 2.99 3.77 1.59 −2.37Turkey 6.55 1.52 1.90 3.13Standard Deviation 7.63 3.69 5.02 4.41
Capitalflow reversals could bring catastrophic economic results. For exam-ple, they could disrupt liquidity supply available to firms and raise the foreigndebt burden of firms due to currency depreciation. In the previous literature,there was some weak evidence that the output loss incurred by a capital flowreversal is more severe for emerging markets that are more integrated with theglobal financial market (seeKose, Prasad, Rogoff, and Wei 2009). Most suchevidence is based on country-level data. In this article, we combine firm-levelfinancial data with country-level capital flows to study whether and how a cap-ital flow reversal affects firms’ access to external financing.
To measure a country’s pre-crisis exposure to foreign capital, we adopt ade facto measure: the country’s annual inflow of capital over GDP averagedfrom 2002 to 2006. (We will use an alternative measure based on actual policyrestrictions in a robustness check.) Table4 presents the pre-crisis exposure. Wecan see that emerging markets on average enjoy a significant inflow of capitalfrom 2002 to 2006, although this is still smaller than in a typical developedcountry.
We multiply the volume of capital inflow by the two indexes of financialconstraints(DEF INV and DEF WK), respectively, and add these interactionterms to the econometric model. We separate emerging markets from devel-oped countries, as the literature has documented an asymmetric effect of finan-cial integration on these two groups of countries (Kose, Prasad, Rogoff, andWei 2009). We focus on emerging markets in our baseline case.
2034
at Mem
orial Univ. of N
ewfoundland on A
ugust 4, 2014http://rfs.oxfordjournals.org/
Dow
nloaded from
TheComposition Matters: Capital Inflows and Liquidity Crunch During a Global Economic Crisis
Table 5Role of pre-crisis exposure to capital inflows in emerging economies (volume effect)
1 2 3
DEF INV −1.284 −0.724[2.969] [2.646]
DEF INV*Inflow 0.0956 0.129 0.167[0.143] [0.132] [0.123]
DEF WK −3.761 −1.761[2.696] [2.465]
DEF WK*Inflow −0.173 −0.272* −0.295*[0.183] [0.163] [0.167]
Beta*market Index 0.312*** 0.285***[0.044] [0.043]
Firm size 1.281 1.317[1.072] [1.136]
Market/Book −1.285* −1.404**[0.669] [0.680]
Momentum −0.145*** −0.144***[0.040] [0.042]
Demand Sensitivity −9.425***[2.068]
Countryfixed effects Yes Yes YesIndustry fixed effects No No YesObservations 3796 3747 3747R-squared 0.145 0.185 0.239
Thedependent variable is the change in log stock prices from July 31, 2007, to December 31, 2008.DEF INVdenotes dependence on external financing for long-term investment;DEF WK denotes dependence on externalfinancing for working capital. Standard errors, clustered at the sector level, are in brackets. ***, **, and * denotestatistically significant at the 1%, 5%, and 10% levels, respectively.
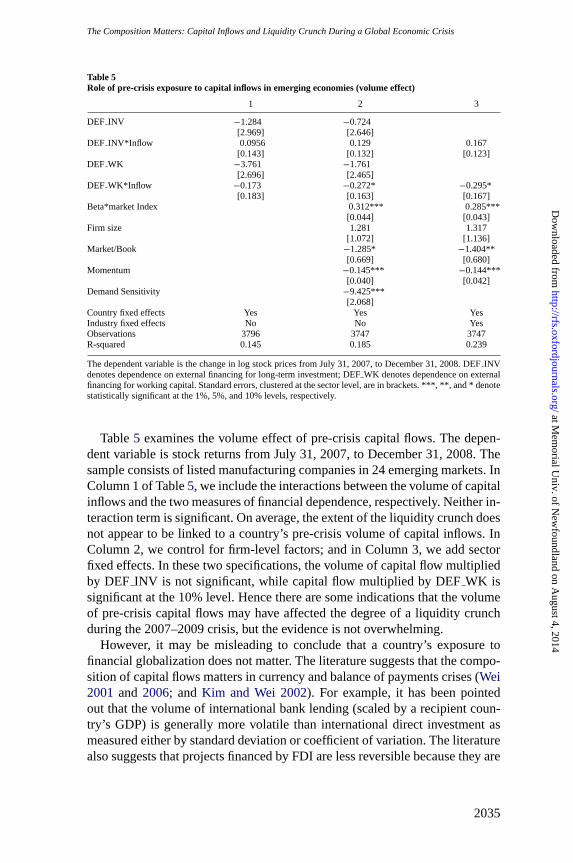
Table5 examines the volume effect of pre-crisis capital flows. The depen-dent variable is stock returns from July 31, 2007, to December 31, 2008. Thesample consists of listed manufacturing companies in 24 emerging markets. InColumn 1 of Table5, we include the interactions between the volume of capitalinflows and the two measures of financial dependence, respectively. Neither in-teraction term is significant. On average, the extent of the liquidity crunch doesnot appear to be linked to a country’s pre-crisis volume of capital inflows. InColumn 2, we control for firm-level factors; and in Column 3, we add sectorfixed effects. In these two specifications, the volume of capital flow multipliedby DEF INV is not significant, while capital flow multiplied byDEF WK issignificant at the 10% level. Hence there are some indications that the volumeof pre-crisis capital flows may have affected the degree of a liquidity crunchduring the 2007–2009 crisis, but the evidence is not overwhelming.
However, it may be misleading to conclude that a country’s exposure tofinancial globalization does not matter. The literature suggests that the compo-sition of capital flows matters in currency and balance of payments crises (Wei2001 and 2006; andKim and Wei 2002). For example, it has been pointedout that the volume of international bank lending (scaled by a recipient coun-try’s GDP) is generally more volatile than international direct investment asmeasured either by standard deviation or coefficient of variation. The literaturealso suggests that projects financed by FDI are less reversible because they are
2035
at Mem
orial Univ. of N
ewfoundland on A
ugust 4, 2014http://rfs.oxfordjournals.org/
Dow
nloaded from

The Review of Financial Studies / v 24 n 6 2011
Figure 1Capital flows to emerging market economies (in billion US$)The sample includes 24 emerging economies listed in Table4. Source: IMF’s World Economic Outlook database.
more difficult to liquidate than projects financed by other types of internationalcapital (Goldstein and Razin 2006; andGoldstein, Razin, and Tong 2010). The2007–2009 crisis provides a fresh opportunity to examine the connection be-tween a liquidity crunch and the composition of capital flows. Hence we sep-arate capital inflows into three components: foreign direct investment (FDI),foreign portfolio investment (FPI), and foreign loans (FL). This breakdownfollows the definition in the IMF’s International Financial Statistics dataset.
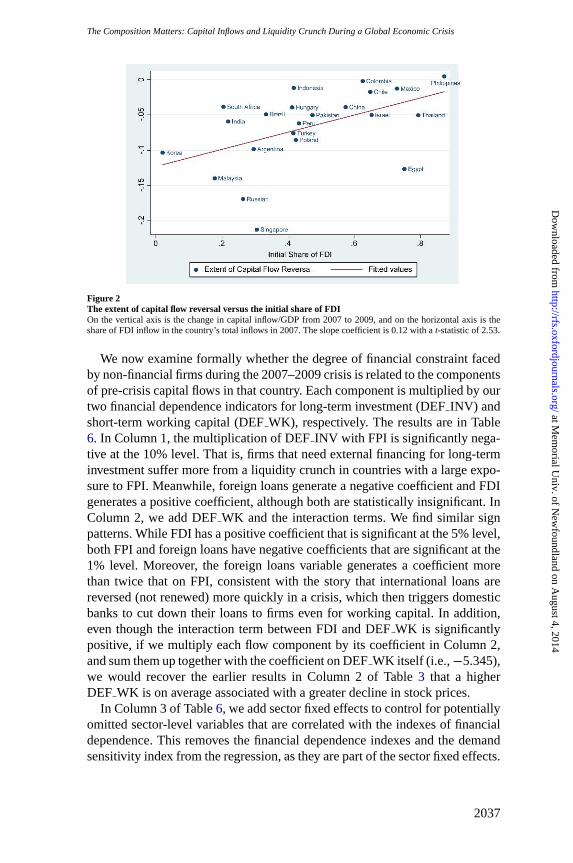
Figure 1 traces the different components of international capital inflowsfrom 1999 to 2009 for the economies in our sample, with the data from theIMF’s World Economic Outlook database. While all three components rose inthe years leading up to the crisis and exhibited a reversal during the crisis, thereare still visible differences among them. In particular, both the rise and the fallare the sharpest for international bank loans. In contrast, international directinvestment (FDI) is comparatively stable. While the pre-crisis rise of FDI wasmore gradual than international bank loans, the reversal by FDI started only in2008 and has been relatively mild. Does this translate into differential capitalreversal at the country level? Figure2 plots the reversal of total capital inflowsfrom 2007 to 2009 at the country level against the initial share of FDI in totalcapital inflows (in 2007). Indeed, a higher pre-crisis FDI share in capital inflowis associated with a smaller magnitude of capital reversal during the crisis. Ofcourse, this is only suggestive evidence that the composition of capital inflowsmay matter for a country’s fortune during a crisis.
2036
at Mem
orial Univ. of N
ewfoundland on A
ugust 4, 2014http://rfs.oxfordjournals.org/
Dow
nloaded from
The Composition Matters: Capital Inflows and Liquidity Crunch During a Global Economic Crisis
Figure 2The extent of capital flow reversal versus the initial share of FDIOn the vertical axis is the change in capital inflow/GDP from 2007 to 2009, and on the horizontal axis is theshare of FDI inflow in the country’s total inflows in 2007. The slope coefficient is 0.12 with at-statistic of 2.53.
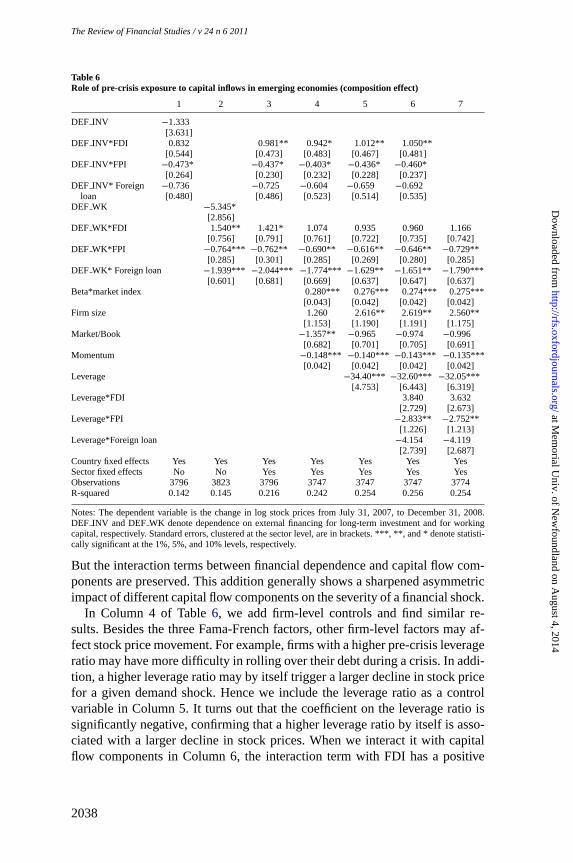
We now examine formally whether the degree of financial constraint facedby non-financial firms during the 2007–2009 crisis is related to the componentsof pre-crisis capital flows in that country. Each component is multiplied by ourtwo financial dependence indicators for long-term investment(DEF INV) andshort-term working capital(DEF WK), respectively. The results are in Table6. In Column 1, the multiplication ofDEF INV with FPI is significantly nega-tive at the 10% level. That is, firms that need external financing for long-terminvestment suffer more from a liquidity crunch in countries with a large expo-sure to FPI. Meanwhile, foreign loans generate a negative coefficient and FDIgenerates a positive coefficient, although both are statistically insignificant. InColumn 2, we addDEF WK and the interaction terms. We find similar signpatterns. While FDI has a positive coefficient that is significant at the 5% level,both FPI and foreign loans have negative coefficients that are significant at the1% level. Moreover, the foreign loans variable generates a coefficient morethan twice that on FPI, consistent with the story that international loans arereversed (not renewed) more quickly in a crisis, which then triggers domesticbanks to cut down their loans to firms even for working capital. In addition,even though the interaction term between FDI andDEF WK is significantlypositive, if we multiply each flow component by its coefficient in Column 2,and sum them up together with the coefficient onDEF WK itself (i.e.,−5.345),we would recover the earlier results in Column 2 of Table3 that a higherDEF WK is on average associated with a greater decline in stock prices.
In Column 3 of Table6, we add sector fixed effects to control for potentiallyomitted sector-level variables that are correlated with the indexes of financialdependence. This removes the financial dependence indexes and the demandsensitivity index from the regression, as they are part of the sector fixed effects.
2037
at Mem
orial Univ. of N
ewfoundland on A
ugust 4, 2014http://rfs.oxfordjournals.org/
Dow
nloaded from
TheReview of Financial Studies / v 24 n 6 2011
Table 6Role of pre-crisis exposure to capital inflows in emerging economies (composition effect)
1 2 3 4 5 6 7
DEF INV −1.333[3.631]
DEF INV*FDI 0.832 0.981** 0.942* 1.012** 1.050**[0.544] [0.473] [0.483] [0.467] [0.481]
DEF INV*FPI −0.473* −0.437* −0.403* −0.436* −0.460*[0.264] [0.230] [0.232] [0.228] [0.237]
DEF INV* Foreign −0.736 −0.725 −0.604 −0.659 −0.692loan [0.480] [0.486] [0.523] [0.514] [0.535]
DEF WK −5.345*[2.856]
DEF WK*FDI 1.540** 1.421* 1.074 0.935 0.960 1.166[0.756] [0.791] [0.761] [0.722] [0.735] [0.742]
DEF WK*FPI −0.764*** −0.762** −0.690** −0.616** −0.646** −0.729**[0.285] [0.301] [0.285] [0.269] [0.280] [0.285]
DEF WK* Foreign loan −1.939*** −2.044*** −1.774*** −1.629** −1.651** −1.790***[0.601] [0.681] [0.669] [0.637] [0.647] [0.637]
Beta*market index 0.280*** 0.276*** 0.274*** 0.275***[0.043] [0.042] [0.042] [0.042]
Firm size 1.260 2.616** 2.619** 2.560**[1.153] [1.190] [1.191] [1.175]
Market/Book −1.357** −0.965 −0.974 −0.996[0.682] [0.701] [0.705] [0.691]
Momentum −0.148*** −0.140*** −0.143*** −0.135***[0.042] [0.042] [0.042] [0.042]
Leverage −34.40*** −32.60*** −32.05***[4.753] [6.443] [6.319]
Leverage*FDI 3.840 3.632[2.729] [2.673]
Leverage*FPI −2.833** −2.752**[1.226] [1.213]
Leverage*Foreign loan −4.154 −4.119[2.739] [2.687]
Country fixed effects Yes Yes Yes Yes Yes Yes YesSector fixed effects No No Yes Yes Yes Yes YesObservations 3796 3823 3796 3747 3747 3747 3774R-squared 0.142 0.145 0.216 0.242 0.254 0.256 0.254
Notes:The dependent variable is the change in log stock prices from July 31, 2007, to December 31, 2008.DEF INV and DEF WK denote dependence on external financing for long-term investment and for workingcapital, respectively. Standard errors, clustered at the sector level, are in brackets. ***, **, and * denote statisti-cally significant at the 1%, 5%, and 10% levels, respectively.
But the interaction terms between financial dependence and capital flow com-ponents are preserved. This addition generally shows a sharpened asymmetricimpact of different capital flow components on the severity of a financial shock.
In Column 4 of Table6, we add firm-level controls and find similar re-sults. Besides the three Fama-French factors, other firm-level factors may af-fect stock price movement. For example, firms with a higher pre-crisis leverageratio may have more difficulty in rolling over their debt during a crisis. In addi-tion, a higher leverage ratio may by itself trigger a larger decline in stock pricefor a given demand shock. Hence we include the leverage ratio as a controlvariable in Column 5. It turns out that the coefficient on the leverage ratio issignificantly negative, confirming that a higher leverage ratio by itself is asso-ciated with a larger decline in stock prices. When we interact it with capitalflow components in Column 6, the interaction term with FDI has a positive
2038
at Mem
orial Univ. of N
ewfoundland on A
ugust 4, 2014http://rfs.oxfordjournals.org/
Dow
nloaded from

TheComposition Matters: Capital Inflows and Liquidity Crunch During a Global Economic Crisis
coefficient, and those with foreign portfolio and foreign bank loans are neg-ative. Interestingly, it does not affect the results for our financial constraintindicators(DEF INV andDEF WK).
Since the dependence on external financing for long-term investment is notsignificant by itself (column 1 of Table6), we also implement a regressionthat drops all terms involvingDEF INV, and report the result in Column 7 ofTable6. The qualitative results onDEF WK are the same. In particular, firmsin countries with a greater pre-crisis reliance on portfolio inflows and foreignbank loans experience greater liquidity constraints during the crisis. The pointestimates for the interaction terms involvingDEF WK are somewhat largerthan when theDEF INV terms are in the regression.
The estimates are economically significant. For example, an increase in thereliance on foreign loans before the crisis by one standard deviation (4.41)would generate an extra decline in stock prices by 19.4 percentage points(=4.41*1.79*2.46). (The calculation uses the estimated coefficient ofDEPWK*Foreign Loan in Column 7 of Table6 (−1.79) and the average value ofthe standardizedDEP WK (=2.46).) Since the standard deviation of the ac-tual change in log stock prices across countries during the sample period was66 percentage points, the cross-country variation in the pre-crisis reliance onforeign loans could account for about 30% of the cross-country variations inthe declines in stock prices. Similarly, an increase in the pre-crisis reliance onforeign portfolio capital by one standard deviation (5.02) would generate anextra fall in stock prices by 9.0% (=5.02*0.729*2.46), or about another 14%of the cross-country variations in the declines in stock prices.
It is important to note that, for capital flows to affect a liquidity crunch, itis not necessary for manufacturing firms to borrow directly from internationalbanks or to raise funds directly from the international capital market. In a studyof the effect of capital controls on liquidity constraints in Chile,Forbes(2007)notes that borrowing by domestic banks from international banks and capi-tal markets is enough to forge a connection between liquidity constraints ondomestic manufacturing firms and a country’s exposure to international cap-ital flows. In particular, firm-level financial constraints could be affected bythe global financial market, “whether the small firms received capital inflowsdirectly, or whether they borrowed from banks (which experienced a length-ening of their maturities and attempted to match the maturities of their assetsand liabilities).” In Figure3, we plot the extent of the decline in banking stockprices in a country during the crisis against the country’s pre-crisis volume ofborrowing from international banks. The two are clearly related. Banks fareless well during the crisis in a country that relied relatively more on interna-tional bank loans before the crisis. Korea also offers another demonstrationof an indirect but significant linkage between domestic firms and internationalfinancial markets. Before the crisis, Korean banks had developed a reliance onwholesale financing from the international capital market. Once the crisis hit,they suffered significantly when sources of foreign financing dried up. This
2039
at Mem
orial Univ. of N
ewfoundland on A
ugust 4, 2014http://rfs.oxfordjournals.org/
Dow
nloaded from

The Review of Financial Studies / v 24 n 6 2011
Figure 3Change in log banking stock prices vs. pre-crisis international bank loans (conditional scatter plot)On the vertical axis is the change in log bank-sector stock price from July 1, 2007, to December 31, 2008. Onthe horizontal axis is the pre-crisis inflow of loans/GDP averaged over 2002–2006. This partial scatter plot isconditioned on pre-crisis foreign direct investments and portfolio investments over GDP. The slope coefficientis –6.38 with a standard error of 3.24. Source: IMF’s WEO database and Datastream.
induced them to cut down loans to domestic firms. According to an HSBC re-port on September 9, 2008, “Korean banks’ high reliance on wholesale fundingis transmitting higher funding costs from global credit markets into the lever-aged Korean economy” (seeMahendran 2008).
The effect of pre-crisis exposure to FDI on the financial constraint is worthnoting. In normal times, having an internal capital market is considered astrength of multinational firms. This is shown byAguiar and Gopinath(2005)andDesai, Foley, and Forbes(2008). Multinational firms use their relativelystrong financial position to alleviate financial constraints in the foreign sub-sidiaries that they invest in. In a time of financial crisis, this is more of an openquestion since multinational firms could be in financial difficulties themselves.Indeed, the news about the financial difficulties faced by GM and Chrysler in2009 points to this possibility. On the other hand, since many manufacturingfirms in the U.S. had a high level of cash reserves just before the crisis (accord-ing toBates, Kahle, and Stulz 2009), those firms that engage in FDI, which tendto be larger than average, may still be in a better position to weather a financialshock than other firms, especially firms in developing countries. The evidencehere suggests that the internal capital market of multinational firms may verywell be tapped in places where foreign subsidiaries experience financial diffi-culties and could not obtain financing from the host-country financial system.
The estimated effect of pre-crisis exposure to foreign portfolio inflows onfinancial constraint is also sensible. The withdrawal of international portfolio
2040
at Mem
orial Univ. of N
ewfoundland on A
ugust 4, 2014http://rfs.oxfordjournals.org/
Dow
nloaded from
TheComposition Matters: Capital Inflows and Liquidity Crunch During a Global Economic Crisis
capital makes it more costly for firms to roll over their debt. For firms thatwish to use seasoned stock offerings to raise new capital, the cost of capitalalso rises when less international capital is available to support the market. Ineither case, when international portfolio flows retreat, the extent of financialconstraint experienced by firms in the recipient countries tightens.
2.3 Robustness tests and extensionsWe have included country fixed effects to control for the impacts of country-level variables on average stock prices. We now examine whether some othercountry-level variables, besides capital flows, may also affect stock pricesthrough the channel of firm financial dependence. One prominent suspect isthe degree of domestic financial development (Prasad, Rajan, and Subramanian2007). As a robustness check, we interact the country’s level of domestic finan-cial development with the sector’s financial dependence. We measure domes-tic financial development by the ratio of private credit over GDP at the end of2006. (The correlation between financial development and the average capitalinflow is 0.54 in our sample of emerging economies.) The interaction betweena country’s domestic financial development and sector-level financial depen-dence is not significant for eitherDEF INV or DEF WK (see Column 1 ofTable7). Moreover, adding domestic financial development does not alter theresults for capital flows. In Column 2 of Table7, we experiment with a secondproxy of domestic financial development: the sum of private credit and stockmarket capitalization over DP at the end of 2006. Again, this does not changeour key results regarding the role of capital flows.
The composition of capital flows is known to vary systematically with acountry’s quality of institutions (Wei 2001and2006;Faria and Mauro 2009).As another robustness check, we have added an interaction term between in-stitutional quality and dependence on external financing. We measure institu-tional quality in two ways. First, we take the simple average of six institutionalindicators (voice and accountability, political stability and absence of violence,government effectiveness, regulatory quality, rule of law, and control of cor-ruption) in 2007, drawn from the World Bank’s Governance Indicator dataset.The interaction term is not statistically significant. The coefficients on the in-teraction terms between the capital flow components and the dependence onexternal financing are not affected (Column 3 of Table7). Second, since insti-tutional quality and income level are highly correlated across countries, we alsouse per-capita income in 2007 as a second proxy for a country’s institutionalquality. The interaction term is not statistically significant either (Column 4 ofTable7). This addition does not alter the inferences on the interactions betweenthe capital flow composition andDEP WK.
In all regressions, we measure pre-crisis capital inflows over the period2002–2006. As robustness checks, we test two variations of this measure.First, we extend the pre-crisis window to include 2007. In this case, the results
2041
at Mem
orial Univ. of N
ewfoundland on A
ugust 4, 2014http://rfs.oxfordjournals.org/
Dow
nloaded from

TheReview of Financial Studies / v 24 n 6 2011
Table 7Role of pre-crisis exposure to capital inflows (robustness checks)
Financial Financial Capital Flow DeDevelopment Development Institution Institution from 02 Jure
1 2 1 2 to 07 Openness
DEF INV*FDI 0.984* 1.123** 0.721 0.932** 1.217** 6.103***[0.501] [0.519] [0.549] [0.463] [0.509] [2.285]
DEF INV*FPI −0.408* −0.386 −0.127 −0.309 −0.449** −2.543[0.239] [0.247] [0.336] [0.230] [0.178] [2.185]
DEF INV* Foreign loan −0.615 −0.530 0.0966 −0.371 −0.599* −2.492[0.517] [0.567] [0.834] [0.517] [0.357] [3.385]
DEF WK*FDI 1.292 1.419* 1.065 0.983 1.128 −0.0122[0.786] [0.805] [0.734] [0.729] [0.768] [3.101]
DEF WK*FPI −0.611** −0.605** −0.726** −0.720*** −0.534** −5.194*[0.297] [0.297] [0.279] [0.262] [0.249] [3.146]
DEF WK* Foreign loan −1.743** −1.603** −1.906** −1.872*** −1.159** 2.937[0.669] [0.681] [0.755] [0.652] [0.489] [3.367]
Beta*market index 0.279*** 0.280*** 0.276*** 0.276*** 0.281*** 0.285***[0.0426] [0.042] [0.042] [0.0423] [0.0427] [0.0433]
Firm Size 1.264 1.225 2.581** 2.612** 1.249 1.217[1.168] [1.163] [1.185] [1.178] [1.147] [1.127]
Market/Book −1.361** −1.357** −0.958 −0.956 −1.358** −1.333*[0.678] [0.681] [0.698] [0.709] [0.680] [0.685]
Momentum −0.148*** −0.149*** −0.140*** −0.140*** −0.148*** −0.146***[0.042] [0.042] [0.042] [0.0417] [0.0418] [0.0422]
FinDev*DEF INV −0.0087 −0.010[0.035] [0.014]
FinDev*DEF WK −0.066 −0.020[0.043] [0.015]
Institution*DEF INV −3.371 −1.057[3.306] [1.241]
Institution*DEPWK 1.036 1.087[3.172] [1.454]
Country fixed effects Yes Yes Yes Yes Yes YesSector fixed effects Yes Yes Yes Yes Yes YesObservations 3747 3747 3747 3747 3747 3747R-squared 0.243 0.243 0.255 0.255 0.242 0.24
Thedependent variable is the change in log stock prices from July 31, 2007, to December 31, 2008.DEF INVdenotes dependence on external financing for long-term investment;DEF WK denotes dependence on externalfinancing for working capital. Financial Development 1= domesticprivate credit over GDP, while FinancialDevelopment 2= (domesticprivate credit+ market capitalization)/GDP. Institution 1 is the simple average ofsix institutional indicators (Voice and Accountability, Political Stability and Absence of Violence, GovernmentEffectiveness, Regulatory Quality, Rule of Law, and Control of Corruption) in 2007, drawn from the WorldBank’s Governance Indicator dataset. Institution 2 is the log of GDP per capita in U.S. dollar terms in 2007.Standard errors, clustered at the sector level, are in brackets. ***, **, and * denote statistically significant at the1%, 5%, and 10% levels, respectively.
becomestronger (Column 5 of Table7). The multiplication ofDEF INV withFDI is positive and significant at the 1% level, with a larger magnitude thanits counterpart in Table6. FPI is still significantly negative at the 1% level,while foreign loan moves from insignificantly negative in Table6 to signifi-cantly negative at the 5% level. Hence, by using a slightly longer window, thecontrast between the effects of FDI and non-FDI flows on financial constraintsbecomes more pronounced.
2.4 A de jure measure of exposure to financial globalizationSo far, we measure exposure to financial globalization by a country’s de facto,or realized, capital flows. The realized volume of capital flows may not reflect
2042
at Mem
orial Univ. of N
ewfoundland on A
ugust 4, 2014http://rfs.oxfordjournals.org/
Dow
nloaded from

TheComposition Matters: Capital Inflows and Liquidity Crunch During a Global Economic Crisis
government policies. As an extension, we use a de jure measure based on acountry’s actual policies as recorded in the IMF’s Annual Report on ExchangeArrangements and Exchange Restrictions (AREAER). A country’s policies oncross-border capital flows are classified by the IMF into about 100 categories,covering FDI, portfolio flows, bank lending, and others. We use the policiesin 2006 to construct three separate indicators of de jure openness for inwardFDI, inward FPI (purchase of local shares and bonds by nonresidents), andforeign loans (commercial and financial credit from nonresidents to residents),respectively. The de jure indicators are listed in Appendix Table1. The de jureclassification and the de facto classification (based on realized inflows) are pos-itively correlated but far from perfectly, with correlation coefficients of 0.38,0.25, and 0.37, respectively, for direct investment, portfolio investment, andforeign loans. This means that the de jure index can potentially provide an in-formative and independent check on the connection between the compositionof capital flows and a liquidity crunch. The regression results are in the lastcolumn of Table7. ForDEF INV, we find that pre-crisis FDI openness signifi-cantly alleviates financial constraint during this crisis; forDEF WK, pre-crisisopenness to FPI significantly worsens the financial constraint during the crisis.Between the de facto and the de jure measures, we put more weight on the defacto measure, as different types of policy restrictions may not have the sameintensity but de facto measures automatically assign more weight to more im-portant policy restrictions (seeKose et al. 2003for a discussion on de factoversus de jure measures).
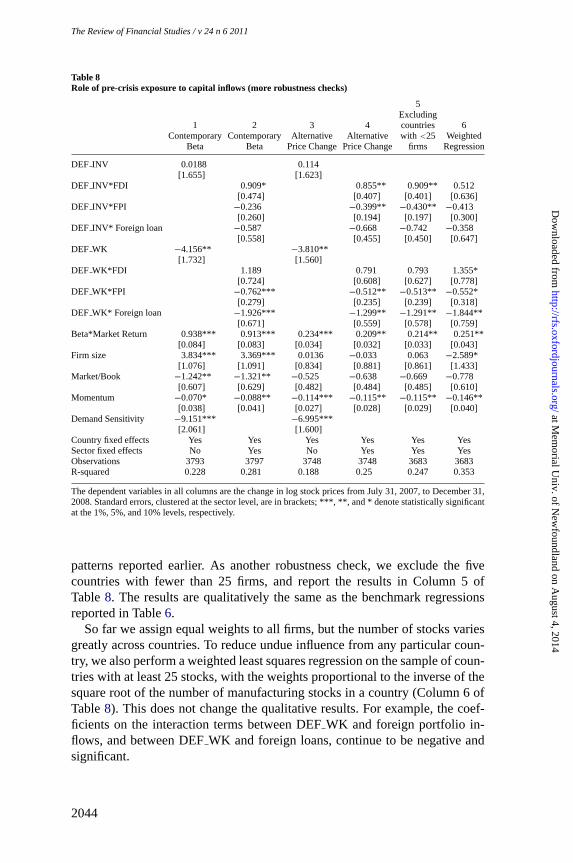
2.5 Contemporaneous betas and other robustness checksWe have used pre-crisis beta based on monthly stock returns from 2002 to2006. The advantage of constructing the beta measure based on the recent pastis that the regressor is then predetermined. A potential disadvantage is thatit may miss some time-varying aspect of the risk. As a robustness check, weconstruct a contemporaneous measure using a market model and weekly stockreturn data from July 31, 2007, to December 31, 2008. We then multiply thecontemporaneous beta by the local market return during this period as a controlvariable in our model. We first check if it affects the average liquidity crunchacross countries (Column 1 of Table8). The beta variable has a significantcoefficient close to 0.93 with at-stat of 11.42. This is not surprising given howthe beta is calculated. It is important to note that the new measure does notalter our earlier results. In particular,DEF WK still has a significant coefficientof −4.156. In Column 2 of Table8, we find that the new measure does notalter the results on the composition of capital flows either. In particular, thecoefficients on the interaction terms betweenDEF WK and pre-crisis portfolioinflows, and betweenDEF WK and pre-crisis foreign loan, are still negativeand statistically significant.
In Columns 3–4 of Table8, we define the left-hand-side variable as [Pk,dec08−Pk,july07]/(1/2)[Pk,dec08+Pk,july07]. This leads to no change in the qualitative
2043
at Mem
orial Univ. of N
ewfoundland on A
ugust 4, 2014http://rfs.oxfordjournals.org/
Dow
nloaded from
TheReview of Financial Studies / v 24 n 6 2011
Table 8Role of pre-crisis exposure to capital inflows (more robustness checks)
5Excluding
1 2 3 4 countries 6Contemporary Contemporary Alternative Alternative with<25 Weighted
Beta Beta Price Change Price Change firms Regression
DEF INV 0.0188 0.114[1.655] [1.623]
DEF INV*FDI 0.909* 0.855** 0.909** 0.512[0.474] [0.407] [0.401] [0.636]
DEF INV*FPI −0.236 −0.399** −0.430** −0.413[0.260] [0.194] [0.197] [0.300]
DEF INV* Foreign loan −0.587 −0.668 −0.742 −0.358[0.558] [0.455] [0.450] [0.647]
DEF WK −4.156** −3.810**[1.732] [1.560]
DEF WK*FDI 1.189 0.791 0.793 1.355*[0.724] [0.608] [0.627] [0.778]
DEF WK*FPI −0.762*** −0.512** −0.513** −0.552*[0.279] [0.235] [0.239] [0.318]
DEF WK* Foreign loan −1.926*** −1.299** −1.291** −1.844**[0.671] [0.559] [0.578] [0.759]
Beta*Market Return 0.938*** 0.913*** 0.234*** 0.209** 0.214** 0.251**[0.084] [0.083] [0.034] [0.032] [0.033] [0.043]
Firm size 3.834*** 3.369*** 0.0136 −0.033 0.063 −2.589*[1.076] [1.091] [0.834] [0.881] [0.861] [1.433]
Market/Book −1.242** −1.321** −0.525 −0.638 −0.669 −0.778[0.607] [0.629] [0.482] [0.484] [0.485] [0.610]
Momentum −0.070* −0.088** −0.114*** −0.115** −0.115** −0.146**[0.038] [0.041] [0.027] [0.028] [0.029] [0.040]
Demand Sensitivity −9.151*** −6.995***[2.061] [1.600]
Country fixed effects Yes Yes Yes Yes Yes YesSector fixed effects No Yes No Yes Yes YesObservations 3793 3797 3748 3748 3683 3683R-squared 0.228 0.281 0.188 0.25 0.247 0.353
Thedependent variables in all columns are the change in log stock prices from July 31, 2007, to December 31,2008. Standard errors, clustered at the sector level, are in brackets; ***, **, and * denote statistically significantat the 1%, 5%, and 10% levels, respectively.
patternsreported earlier. As another robustness check, we exclude the fivecountries with fewer than 25 firms, and report the results in Column 5 ofTable8. The results are qualitatively the same as the benchmark regressionsreported in Table6.
So far we assign equal weights to all firms, but the number of stocks variesgreatly across countries. To reduce undue influence from any particular coun-try, we also perform a weighted least squares regression on the sample of coun-tries with at least 25 stocks, with the weights proportional to the inverse of thesquare root of the number of manufacturing stocks in a country (Column 6 ofTable8). This does not change the qualitative results. For example, the coef-ficients on the interaction terms betweenDEF WK and foreign portfolio in-flows, and betweenDEF WK and foreign loans, continue to be negative andsignificant.
2044
at Mem
orial Univ. of N
ewfoundland on A
ugust 4, 2014http://rfs.oxfordjournals.org/
Dow
nloaded from

TheComposition Matters: Capital Inflows and Liquidity Crunch During a Global Economic Crisis
Table 9Role of pre-crisis exposure to capital inflows in emerging economies (non-financial firms)
1 2 3 4 5 6 7
DEF INV −3.299 −2.065[3.096] [2.638]
DEF INV*FDI 0.415 0.404 0.794** 0.774** 0.871** 0.885**[0.432] [0.418] [0.373] [0.361] [0.352] [0.351]
DEF INV*FPI −0.370** −0.335** −0.450*** −0.406** −0.426*** −0.475***[0.144] [0.166] [0.159] [0.160] [0.162] [0.179]
DEF INV* Foreign loan−0.368 −0.328 −0.736* −0.640 −0.716* −0.731*[0.390] [0.419] [0.382] [0.391] [0.384] [0.386]
DEF WK −4.100** −3.458**[1.997] [1.591]
DEF WK*FDI 0.853* 0.525 0.859** 0.628 0.533 0.535[0.450] [0.397] [0.430] [0.415] [0.402] [0.407]
DEF WK*FPI −0.215 −0.176 −0.215 −0.171 −0.134 −0.119[0.181] [0.152] [0.160] [0.158] [0.154] [0.167]
DEF WK* Foreign loan −0.780* −0.576 −0.826** −0.671* −0.567 −0.561[0.435] [0.391] [0.403] [0.398] [0.385] [0.392]
Beta*market index 0.297*** 0.274*** 0.272*** 0.269***[0.033] [0.031] [0.031] [0.031]
size 2.237*** 1.922** 3.354*** 3.375***[0.842] [0.887] [0.906] [0.900]
Market/Book −1.293*** −1.381*** −0.966** −1.005**[0.429] [0.437] [0.446] [0.446]
Momentum −0.213*** −0.201*** −0.187*** −0.187***[0.0284] [0.029] [0.030] [0.0297]
Leverage −34.64*** −31.22***[4.104] [5.568]
Leverage*FDI 2.002[2.200]
Leverage*FPI −2.307**[0.924]
Leverage*Foreign loan −2.117[2.138]
DemandSensitivity −5.280***[1.516]
Countryfixed effects Yes Yes Yes Yes Yes Yes YesSector fixed effects No No No Yes Yes Yes YesObservations 5997 6030 5917 5997 5917 5917 5917R-squared 0.13 0.127 0.176 0.201 0.235 0.248 0.25
Thedependent variable is the change in log stock prices from July 31, 2007, to December 31, 2008.DEF INVdenotes dependence on external financing for long-term investment;DEF WK denotes dependence on externalfinancing for working capital. Standard errors, clustered at the sector level, are in brackets. ***, **, and * denotestatistically significant at the 1%, 5%, and 10% levels, respectively.
We have focused on manufacturing firms thus far. We now expand the sam-ple to all non-financial firms. While this change results in approximately a50% expansion of the regression sample, the sign patterns of the coefficientsare broadly the same, although the significance levels are somewhat weaker(Table 9). This could reflect the possibility that the dependence on externalfinancing is not as well defined for service and agricultural firms.
As another extension, we investigate the possibility that capital flows affectstock prices through aggregate demand. Hence, we include an interaction ofdemand sensitivity with capital flows. We use two proxies for demand sen-sitivity: (1) a sector’s degree of pro-cyclicality from the FTSE/JSE Global
2045
at Mem
orial Univ. of N
ewfoundland on A
ugust 4, 2014http://rfs.oxfordjournals.org/
Dow
nloaded from
TheReview of Financial Studies / v 24 n 6 2011
ClassificationSystem; and (2) a sector-level demand sensitivity index fromTong and Wei(2008). The FTSE system classifies sectors into resources, basicindustries, general industrials, cyclical consumer goods, non-cyclical consumergoods, cyclical services, non-cyclical services, utilities, financials, and infor-mation technology. We construct a dummy that equals one if a manufacturingfirm belongs to cyclical consumer goods or services, and interact the dummywith capital flows. In the specification with sector and country fixed effects, thepro-cyclicality dummy interacting with FDI inflow renders a significantly pos-itive coefficient, while its interactions with FPI and loans render an insignifi-cantly negative coefficient. More importantly, the results on financial constraintindicators(DEF INV and DEF WP) are not affected. Alternatively, when weapply the demand sensitivity index fromTong and Wei(2008), its multiplica-tions with capital flow components do not turn out to be significant. Again, theresults on financial constraint indicators are not affected (results not reportedto save space).
Finally, asFisman and Love(2007) suggest, the Rajan-Zingales index of ex-ternal financial dependence may partly reflect cross-sector differences in globalgrowth opportunities. To reduce potential measurement bias inDEF INV, wecontrol for shocks to global opportunity directly over the period from 1990to 2006, which is the sample period we use to constructDEF INV. FollowingFisman and Love(2007), we first calculate the real annual growth rate for eachU.S. firm in the Compustat dataset, then take the SIC 3-digit-sector median ofthe firm-level growth rates as the growth potential for that sector (labeled asUSGrowth). The correlation between USGrowth and the Rajan-Zingales indexis 0.30 for the 120 manufacturing sectors. We winsorize USGrowth at the 1%level and interact it with capital flow components (FDI, FPI, and foreign loans).It turns out that the growth opportunity variable and its interactions with cap-ital flow components are not significant (withp-values larger than 0.4). Mostimportantly, they do not affect the earlier results on the interactions involv-ing DEF INV and DEF WK. That is, a liquidity crunch experienced by firmsis more serious for firms that depend on external financing for capital invest-ment, especially in countries with a high exposure to foreign loans before thecrisis (results not reported for brevity).
2.6 A placebo testAll the robustness tests above are designed to see if the key results survivewhen we add variations to the basic specification, the variable definitions, orthe sample. We now perform a placebo test by looking at a non-crisis period.In particular, we examine whether capital flows from 2002 to 2005 affect stockprices from January 1, 2006, to June 30, 2007. If the composition of capitalflows generates vulnerability for the recipient country only in a time of cri-sis, then the patterns reported earlier would not be repeated in the placebotest.
2046
at Mem
orial Univ. of N
ewfoundland on A
ugust 4, 2014http://rfs.oxfordjournals.org/
Dow
nloaded from
TheComposition Matters: Capital Inflows and Liquidity Crunch During a Global Economic Crisis
Table 10Placebo test (stock returns from Jan 1, 06, to June 30, 07)
1 2 3 4
DEF INV −0.0408 −1.525 −2.008[1.346] [1.414] [1.491]
DEF INV*Inflow Volume 0.216[0.150]
DEF INV*FDI 0.883* 0.688[0.479] [0.458]
DEF INV*FPI −0.0552 −0.117[0.351] [0.339]
DEF INV* Foreign loan −0.662 −0.287[0.698] [0.720]
DEF WK −1.790 −1.199 −1.884[1.727] [2.215] [2.472]
DEF WK*Inflow Volume −0.084[0.173]
DEF WK*FDI 0.351 0.494[0.624] [0.591]
DEF WK*FPI −0.324 −0.028[0.257] [0.229]
DEF WK* Foreign loan −0.442 −0.345[0.643] [0.596]
Beta*market index 0.143** 0.141** 0.143** 0.133**[0.0603] [0.0599] [0.0600] [0.057]
Size 3.274*** 3.250*** 3.202*** 2.812***[1.063] [1.060] [1.047] [1.003]
Market/Book 1.735*** 1.723*** 1.756*** 1.791***[0.552] [0.556] [0.554] [0.535]
Leverage −18.33***[6.256]
Leverage*FDI 3.785[20.40]
Leverage*FPI 2.079[11.62]
Leverage*Foreign loan 19.61[24.26]
Demand Sensitivity 0.0694 0.0835 0.065[3.661] [3.676] [3.670]
Country fixed effects Yes Yes Yes YesSector fixed effects No No No YesObservations 3693 3693 3693 3693R-squared 0.302 0.302 0.303 0.361
Thedependent variables in all columns are the change in log stock prices from January 1, 2006, to July 31, 2007.Standard errors, clustered at the sector level, are in brackets; ***, **, and * denote statistically significant at the1%, 5%, and 10% levels, respectively.
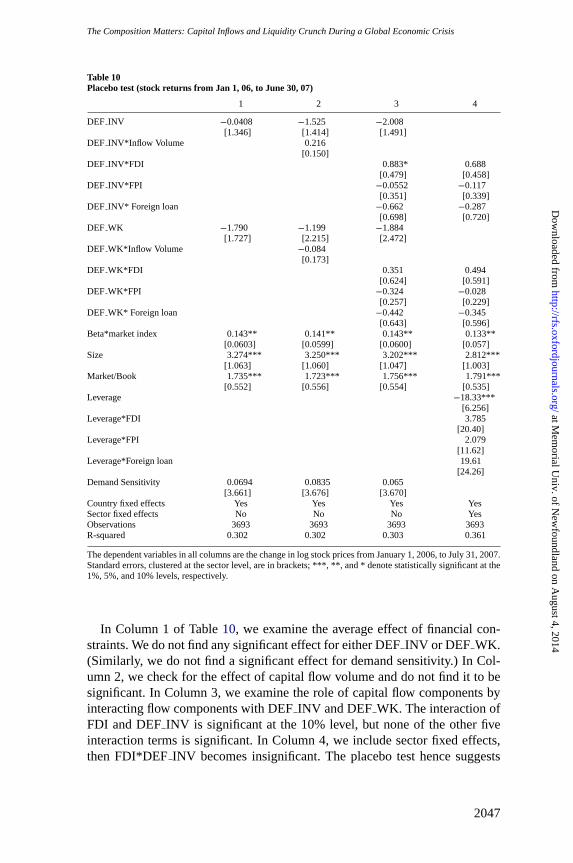
In Column 1 of Table10, we examine the average effect of financial con-straints. We do not find any significant effect for eitherDEF INV or DEF WK.(Similarly, we do not find a significant effect for demand sensitivity.) In Col-umn 2, we check for the effect of capital flow volume and do not find it to besignificant. In Column 3, we examine the role of capital flow components byinteracting flow components withDEF INV andDEF WK. The interaction ofFDI andDEF INV is significant at the 10% level, but none of the other fiveinteraction terms is significant. In Column 4, we include sector fixed effects,thenFDI*DEF INV becomes insignificant. The placebo test hence suggests
2047
at Mem
orial Univ. of N
ewfoundland on A
ugust 4, 2014http://rfs.oxfordjournals.org/
Dow
nloaded from

TheReview of Financial Studies / v 24 n 6 2011
that the key pattern in our baseline case is a feature of the crisis but not ageneral feature of the normal times.
2.7 The Lehman Brothers bankruptcy as an event studyThe collapse of Lehman Brothers without a government bailout on September15, 2008, came as a surprise to many, but has been regarded as a watershedevent (as least ex post) that may have aggravated the global financial panic andtightened global liquidity. This means that the Lehman collapse could serve asan event study allowing us to investigate the research questions of this articlefrom another angle.
We check the relative movement in stock prices in the short period from thelast trading day before the Lehman bankruptcy filing (Friday, September 12)to the day after the collapse (September 16) and pay special attention to anyrole played by the patterns in a country’s pre-crisis capital flows. We estimatethe same model as before, except for the now much narrower time window.The results are presented in Table11. In the last column with sector fixed ef-fects and firm-level controls, we find that the interaction of pre-crisis FDI withDEF INV is significantly positive at the 1% level, while the interactions of pre-crisis non-FDI flows withDEF INV are negative. Moreover, the interactionsof FPI and foreign loans withDEF WK also generate significantly negativecoefficients. These patterns confirm our earlier findings that FDI may alleviatethe financial constraints, while pre-crisis reliance on non-FDI may tighten theconstraints during a crisis.
3. Conclusion
In this article, we propose a methodological framework to study the effect ofcapital flows on liquidity constraints and the role of the composition of pre-crisis capital inflows in the liquidity crunch. To investigate the presence of aliquidity constraint, we ask the question: If we classify manufacturing firmsinto different baskets, based on their ex ante sensitivity to shocks to externalfinancing (in terms of investment and working capital needs), would this clas-sification help us forecast the ex post stock price performance of these firms?To investigate the role of capital inflows, we embed both country-level capitalflows, and their interactions with sector-level dependence on external financ-ing, into the regression framework.
If we just include total volumes of capital inflows, we do not find a con-nection between a country’s exposure to capital flows and the extent of theliquidity crunch experienced by its manufacturing firms. However, this masksan important compositional effect. FDI and non-FDI flows have very differenteffects that may offset each other in the aggregate. When we disaggregate cap-ital flows into three types (FDI, foreign portfolio flows, and foreign loans), adifferent but consistent pattern emerges. Liquidity shocks are more severe for
2048
at Mem
orial Univ. of N
ewfoundland on A
ugust 4, 2014http://rfs.oxfordjournals.org/
Dow
nloaded from

TheComposition Matters: Capital Inflows and Liquidity Crunch During a Global Economic Crisis
Table 11Stock returns around the Lehman Brothers bankruptcy
1 2 3 4 5 6
DEF INV −0.026 −0.032 −0.049[0.181] [0.174] [0.116]
DEF INV*FDI 0.097** 0.082** 0.085** 0.0920*** 0.096***[0.037] [0.033] [0.033] [0.034] [0.035]
DEF INV*FPI −0.042* −0.034 −0.020 −0.020 −0.022[0.023] [0.024] [0.027] [0.029] [0.032]
DEF INV* Foreign loan −0.074* −0.053 −0.052 −0.058 −0.066[0.039] [0.037] [0.043] [0.045] [0.049]
DEF WK −0.062 −0.044 0.104[0.175] [0.178] [0.158]
DEF WK*FDI 0.099* 0.081 0.057 0.050 0.065[0.052] [0.052] [0.049] [0.053] [0.054]
DEF WK*FPI −0.045 −0.039 −0.040* −0.044* −0.057**[0.027] [0.025] [0.024] [0.026] [0.028]
DEF WK* Foreign loan −0.130** −0.118** −0.101* −0.097 −0.123*[0.059] [0.057] [0.056] [0.061] [0.065]
Beta*market index 0.498*** 0.485*** 0.472***[0.028] [0.030] [0.032]
Firm size 0.370*** 0.367*** 0.405***[0.069] [0.074] [0.076]
Market/Book −0.005 0.005 0.007[0.026] [0.032] [0.033]
Leverage −1.424** −1.596**[0.632] [0.620]
Leverage*FDI 0.201 0.187[0.185] [0.197]
Leverage*FPI −0.055 −0.051[0.090] [0.092]
Leverage*Foreign loan −0.258 −0.250[0.192] [0.204]
Demand Sensitivity −0.0945[0.107]
Sectorfixed effects No No No No Yes YesObservations 3775 3802 3775 3771 3771 3644R-squared 0.151 0.15 0.152 0.227 0.252 0.252
Thedependent variable is the changes in log stock prices from September 12 to 16, 2008. ***, **, and * denotep-values less than 1%, 5%, and 10%, respectively. Standard errors are clustered at the sector level. Column 6replicates Column 5 except that it excludes stocks with fewer than a total of five days of trading in July andAugust 2008.
emerging economies that have a higher pre-crisis exposure to foreign portfolioinvestments and foreign loans, but are less severe for countries that have ahigher pre-crisis exposure to foreign direct investments. This empirical pat-tern suggests that one should not lump together different capital flows whenone wishes to understand the connection between capital flows and a liquiditycrunch in a crisis.
It is important to point out that the current article is not meant to be acomprehensive assessment of the welfare effects of the composition of capitalflows. To do that, several additional pieces of information need to be examined,including how different forms of capital flows affect liquidity constraints andgrowth rates during a tranquil time. This would be a fruitful topic for futureresearch.
2049
at Mem
orial Univ. of N
ewfoundland on A
ugust 4, 2014http://rfs.oxfordjournals.org/
Dow
nloaded from

TheReview of Financial Studies / v 24 n 6 2011
Appendix Table 1De jure financial openness in 2006
Country Stocks Bonds Commercial Credit Financial credit FDI
Argentina 0 0 1 0 0Brazil 0 1 1 1 0Chile 1 1 1 1 1China 0 0 0 0 0Colombia 0 0 0 0 0Czech 0 1 1 1 0Egypt 1 1 1 1 0HK 1 1 1 1 1Hungary 1 1 1 1 1India 0 0 0 0 0Indonesia 0 0 0 1 0Israel 1 1 1 1 1Korea 1 1 1 1 0Malaysia 1 1 0 0 0Mexico 0 1 1 0 0Pakistan 1 1 1 1 0Peru 1 1 1 1 1Philippines 1 0 0 0 1Poland 1 0 1 0 0Russia 0 0 1 0 0Singapore 1 1 1 1 1South Africa 1 1 1 0 1Thailand 0 0 0 1 1Turkey 1 1 0 0 1
Source:The IMF’s Annual Report on Exchange Arrangements and Exchange Restrictions in 2006.
ReferencesAguiar, M., and G. Gopinath. 2005. Fire-sale Foreign Direct Investment and Liquidity Crises.Review of Eco-nomics and Statistics87:439–52.
Almeida, H., M. Campello, B. Laranjeira, and S. Weisbenner. 2009. Corporate Debt Maturity and the RealEffects of the 2007 Credit Crisis. NBER Working Paper 14990.
Bates, T. W., K. M. Kahle, and R. M. Stulz. 2009. Why Do U.S. Firms Hold So Much More Cash Than TheyUsed To?Journal of Finance64:985–2021.
Braun, M., and C. Raddatz. 2008. The Politics of Financial Development: Evidence from Trade Liberalization.Journal of Finance63:1469–508.
Berg, A., E. Borensztein, and C. Pattillo. 2004. Assessing Early Warning Systems: How Have They Worked inPractice? IMF Working Paper 04/52.
Bernanke, B. S. 2008. Semiannual Monetary Policy Report to the Congress, February 27.http://www.federalreserve.gov/newsevents/testimony/bernanke20080227a.htm.
Bernanke, B. S., and C. S. Lown. 1991. The Credit Crunch. Brookings Papers on Economic Activity 2:205–47.
Borensztein, E., and J.-W. Lee. 2002. Financial Crisis and Credit Crunch in Korea: Evidence from Firm-levelData.Journal of Monetary Economics49:853–75.
Calvo, G. A., A. Izquierdo, and L.-F. Mejia. 2008. Systemic Sudden Stops: The Relevance of Balance-sheetEffects and Financial Integration. NBER Working Paper 14026.
Claessens, S., M. P. Dooley, and A. Warner. 1995. Portfolio Capital Flows: Hot or Cold?World Bank EconomicReview9:153–74.
Chari, V. V., L. J. Christiano, and P. J. Kehoe. 2008. Facts and Myths about the Financial Crisis of 2008. FederalReserve Bank of Minneapolis Working Paper 666.
2050
at Mem
orial Univ. of N
ewfoundland on A
ugust 4, 2014http://rfs.oxfordjournals.org/
Dow
nloaded from

TheComposition Matters: Capital Inflows and Liquidity Crunch During a Global Economic Crisis
Claessens, S., A. M. Kose, and M. Terrones. 2008. What Happens During Recessions, Crunches, and Busts?IMF Working Paper 08/274.
Dell’Ariccia, G., E. Detragiache, and R. Rajan. 2008. The Real Effect of Banking Crises.Journal of FinancialIntermediation17:89–112.
Dell’Ariccia, G., D. Igan, and L. Laeven. 2008. Credit Booms and Lending Standards: Evidence from the Sub-prime Mortgage Market. CEPR Discussion Papers 6683.
Desai, M., F. Foley, and K. Forbes. 2008. Financial Constraints and Growth: Multinational and Local FirmResponses to Currency Depreciations.Review of Financial Studies21:2857–88.
Eichengreen, B., A. Mody, M. Nedeljkovic, and L. Sarno. 2009. How the Subprime Crisis Went Global: Evidencefrom Bank Credit Default Swap Spreads. NBER Working Paper No. 14904.
Ehrmann, M., M. Fratzscher, and A. Mehl. 2009. What Has Made the Current Financial Crisis Truly Global.ECB Working Paper, 20 May.
Fama, E. F., and K. R. French. 1992. The Cross-section of Expected Stock Returns.Journal of Finance47:427–65.
Faria, A., and P. Mauro. 2009. Institutions and the External Capital Structure of Countries.Journal of Interna-tional Money and Finance28:367–91.
Fisman, R., and I. Love. 2007. Financial Dependence and Growth Revisited.Journal of the European EconomicAssociation5:470–79.
Forbes, K. J. 2007. One Cost of the Chilean Capital Controls: Increased Financial Constraints for Smaller TradedFirms.Journal of International Economics71:294–323.
Goldstein, I., and A. Razin. 2006. An Information-based Tradeoff between Foreign Direct Investment and For-eign Portfolio Investment.Journal of International Economics70:271–95.
Goldstein, I., A. Razin, and H. Tong. 2010. Liquidity, Institutional Quality, and the Composition of InternationalEquity Flows. NBER Working Paper 15727.
Greenlaw, D., J. Hatzius, A. K. Kashyap, and H. S. Shin. 2008. Leveraged Losses: Lessons from the MortgageMarket Meltdown. Draft paper prepared for U.S. Monetary Policy Forum Conference ReportNo. 2.
Griffin, J. 2002. Are the Fama and French Factors Global or Country-Specific?Review of Financial Studies15:783–803.
Henry, P. 2007. Capital Account Liberalization: Theory, Evidence, and Speculation.Journal of Economic Liter-ature45:887–935.
Kim, W., and S.-J. Wei. 2002. Foreign Portfolio Investors Before and During a Crisis.Journal of InternationalEconomics56:77–96.
Kose, A. M., E. Prasad, K. Rogoff, and S.-J. Wei. 2003. Effects of Financial Globalization on DevelopingCountries: Some Evidence. IMF Occasional Paper 220.
. 2009. Financial Globalization: A Reappraisal.IMF Staff Paper56:8–62.
. 2010. Financial Globalization and Economic Policies. In D. Rodrik and M. Rosenzweig (eds.),Hand-book of Development Economics, Vol. 5, pp. 4283–62. The Netherlands: North-Holland.
Kroszner, R., L. Laeven, and D. Klingebiel. 2007. Banking Crises, Financial Dependence, and Growth.Journalof Financial Economics84:187–228.
Lakonishok, J., A. Shleifer, and R. W. Vishny. 1994. Contrarian Investment, Extrapolation and Risk.Journal ofFinance49:1541–78.
Levchenko, A. A., and P. Mauro. 2007. Do Some Forms of Financial Flows Help Protect Against Sudden Stops?World Bank Economic Review21:389–411.
2051
at Mem
orial Univ. of N
ewfoundland on A
ugust 4, 2014http://rfs.oxfordjournals.org/
Dow
nloaded from

TheReview of Financial Studies / v 24 n 6 2011
Mahendran, D. 2008. Korean Banks: Increasing Costs to the Economy.HSBC Report(September 9).http://www.rgemonitor.com/457?clusterid=2263.
Mian, A., and A. Sufi. 2008. The Consequences of Mortgage Credit Expansion: Evidence from the 2007 Mort-gage Default Crisis. NBER Working Paper No. 13936.
Prasad, E. S., R. G. Rajan, and A. Subramanian. 2007. Foreign Capital and Economic Growth. NBER WorkingPaper No. 13619.
Raddatz, C. 2006. Liquidity Needs and Vulnerability to Financial Underdevelopment.Journal of Financial Eco-nomics80:677–722.
Rajan, R., and L. Zingales. 1998. Financial Dependence and Growth.American Economic Review88:559–86.
Reinhart, C., and K. Rogoff. 2008. Is the 2007 U.S. Sub-prime Financial Crisis So Different? An InternationalHistorical Comparison. NBER Working Paper No. 13761.
Rodrik, D., and A. Subramanian. 2009. Why Did Financial Globalizations Disappoint?IMF Staff Paper56:112–38.
Stulz, R. M. 2005. The Limits of Financial Globalization.Journal of Finance60:1595–638.
Tong, H., and S.-J. Wei. 2008. Real Effects of the Subprime Mortgage Crisis: Is It a Demand or a Finance Shock?NBER Working Paper No.14205 and IMF Working Paper 08/186.
Wei, S.-J. 2001. Domestic Crony Capitalism and International Fickle Capital: Is There a Connection?Interna-tional Finance4:15–45.
. 2006. Connecting Two Views on Financial Globalization: Can We Make Further Progress?Journal ofJapanese and International Economics20:459–81.
Wei, S.-J., and Y. Wu. 2002. Negative Alchemy? Corruption, Composition of Capital Flows, and CurrencyCrises. In S. Edwards and J. Frankel (eds.),Preventing Currency Crises in Emerging Markets, pp. 461–501,Chicago: University of Chicago Press.
Whited, T., and G. Wu. 2006. Financial Constraints Risk.Review of Financial Studies19:531–59.
2052
at Mem
orial Univ. of N
ewfoundland on A
ugust 4, 2014http://rfs.oxfordjournals.org/
Dow
nloaded from