Embed Size (px)
Citation preview

The complete genome sequence of a Neandertal from the Altai Mountains
CitationPrüfer, K., F. Racimo, N. Patterson, F. Jay, S. Sankararaman, S. Sawyer, A. Heinze, et al. 2014. “The complete genome sequence of a Neandertal from the Altai Mountains.” Nature 505 (7481): 43-49. doi:10.1038/nature12886. http://dx.doi.org/10.1038/nature12886.
Published Versiondoi:10.1038/nature12886
Permanent linkhttp://nrs.harvard.edu/urn-3:HUL.InstRepos:12717373
Terms of UseThis article was downloaded from Harvard University’s DASH repository, and is made available under the terms and conditions applicable to Other Posted Material, as set forth at http://nrs.harvard.edu/urn-3:HUL.InstRepos:dash.current.terms-of-use#LAA
Share Your StoryThe Harvard community has made this article openly available.Please share how this access benefits you. Submit a story .
Accessibility

The complete genome sequence of a Neandertal from the AltaiMountains
Kay Prüfer1, Fernando Racimo2, Nick Patterson3, Flora Jay2, Sriram Sankararaman3,Susanna Sawyer1, Anja Heinze1, Gabriel Renaud1, Peter H. Sudmant5, Cesare de Filippo1,Heng Li3, Swapan Mallick3,4, Michael Dannemann1, Qiaomei Fu1,16, Martin Kircher1,5,Martin Kuhlwilm1, Michael Lachmann1, Matthias Meyer1, Matthias Ongyerth1, MichaelSiebauer1, Christoph Theunert1, Arti Tandon3,4, Priya Moorjani4, Joseph Pickrell4, JamesC. Mullikin6, Samuel H. Vohr7, Richard E. Green7, Ines Hellmann, Philip L. F. Johnson9,Hélène Blanche10, Howard Cann10, Jacob O. Kitzman5, Jay Shendure5, Evan E. Eichler5,11,Ed S. Lein12, Trygve E. Bakken12, Liubov V. Golovanova13, Vladimir B. Doronichev13,Michael V. Shunkov14, Anatoli P. Derevianko14, Bence Viola15, Montgomery Slatkin2,*,David Reich3,4,*, Janet Kelso1, and Svante Pääbo1,*
1Department of Evolutionary Genetics, Max Planck Institute for Evolutionary Anthropology,Leipzig 04103, Germany
2Department of Integrative Biology, University of California, Berkeley, California 94720-3140,USA
3Broad Institute of MIT and Harvard, Cambridge, Massachusetts 02142, USA
4Department of Genetics, Harvard Medical School, Boston, Massachusetts 02115, USA
5Howard Hughes Medical Institute, Department of Genome Sciences, University of Washington,Seattle, Washington 98195, USA
6Genome Technology Branch and NIH Intramural Sequencing Center, National Human GenomeResearch Institute, National Institutes of Health, Bethesda, Maryland 20892, USA
7Department of Biomolecular Engineering, University of California, Santa Cruz 95064, USA
8Ludwig-Maximilians-Universität München, Martinsried 82152, Munich, Germany
Users may view, print, copy, download and text and data- mine the content in such documents, for the purposes of academic research,subject always to the full Conditions of use: http://www.nature.com/authors/editorial_policies/license.html#terms*Correspondence to: Montgomery Slatkin, David Reich and Svante Pääbo.
ContributionsS.Saw., A.H. and Q.F. performed the experiments; K.P., F.R., N.P., F.J., S.San., S.Saw., A.H., G.R., P.H.S., C.dF., M.D., Q.F., M.Ki.,M.Ku., M.L., M.M., M.O., M.Si., C.T., H.L., S.M., A.T., P.M., J.P., J.C.M., S.H.V., R.E.G., I.H., P.L.F.J., J.O.K., J.S., E.E.E., E.S.L.,T.E.B., M.Sl., D.R., J.K., and S.P. analysed genetic data; L.V.G., V.B.D., M.V.S., A.P.D. and B.V. analyzed archaeological andanthropological data; H.B. and H.C. provided samples and reagents; K.P., J.K. and S.P. wrote and edited the manuscript with inputfrom all authors.
Competing financial interestsThe authors declare no competing financial interests.
Accession codesAll sequence data have been submitted to the European Nucleotide Archive (ENA) and are available under the following accessions:Altai Neandertal: ERP002097, Mezmaiskaya Neandertal: ERP002447. The data from the 25 present-day human genomes and 13experimentally phased present-day genomes are available as a public dataset from http://aws.amazon.com/datasets/ and from http://cdna.eva.mpg.de/neandertal/altai/.
NIH Public AccessAuthor ManuscriptNature. Author manuscript; available in PMC 2014 July 02.
Published in final edited form as:Nature. 2014 January 2; 505(7481): 43–49. doi:10.1038/nature12886.
NIH
-PA
Author M
anuscriptN
IH-P
A A
uthor Manuscript
NIH
-PA
Author M
anuscript

9Department of Biology, Emory University, Atlanta, Georgia 30322, USA
10Fondation Jean Dausset, Centre d’Étude du Polymorphisme Humain (CEPH), Paris, France
11Howard Hughes Medical Institute, Seattle, WA 98195, USA
12Allen Institute for Brain Science, Seattle, Washington 98103, USA
13ANO Laboratory of Prehistory 14 Linia 3-11, St. Petersburg, 1990 34, Russia
14Palaeolithic Department, Institute of Archaeology and Ethnography, Russian Academy ofSciences, Siberian Branch, 630090 Novosibirsk, Russia
15Department of Human Evolution, Max Planck Institute for Evolutionary Anthropology, Leipzig04103, Germany
16Key Laboratory of Vertebrate Evolution and Human Origins of Chinese Academy of Sciences,Institute of Vertebrate Paleontology and Paleoanthropology, Chinese Academy of Sciences,Beijing 100044, China
Abstract
We present a high-quality genome sequence of a Neandertal woman from Siberia. We show that
her parents were related at the level of half siblings and that mating among close relatives was
common among her recent ancestors. We also sequenced the genome of a Neandertal from the
Caucasus to low coverage. An analysis of the relationships and population history of available
archaic genomes and 25 present-day human genomes shows that several gene flow events
occurred among Neandertals, Denisovans and early modern humans, possibly including gene flow
into Denisovans from an unknown archaic group. Thus, interbreeding, albeit of low magnitude,
occurred among many hominin groups in the Late Pleistocene. In addition, the high quality
Neandertal genome allows us to establish a definitive list of substitutions that became fixed in
modern humans after their separation from the ancestors of Neandertals and Denisovans.
In 2008, a hominin finger phalanx was discovered during excavation in the east gallery of
Denisova Cave in the Altai Mountains. From this bone, a genome sequence was determined
to ~30-fold coverage1. Its analysis showed that it came from a previously unknown group of
archaic humans related to Neandertals which we named “Denisovans”2. Thus, at least two
distinct human groups, Neandertals and the related Denisovans, inhabited Eurasia when
anatomically modern humans emerged from Africa. In 2010, another hominin bone, this
time a proximal toe phalanx (Fig. 1a), was recovered in the East Gallery of Denisova Cave3.
Layer 11, where both the finger and the toe phalanx were found, is thought to be at least
50,000 years old. The finger was found in sublayer 11.2, which has an absolute date of
50,300 ± 2200 years (OxA-V-2359-16), while the toe derives from the lowest sublayer 11.4,
and may thus be older than the finger (Supplementary Information (SI) 1, 2a). The phalanx
comes from the fourth or the fifth toe of an adult individual and its morphological traits link
it with both Neandertals and modern humans3.
Prüfer et al. Page 2
Nature. Author manuscript; available in PMC 2014 July 02.
NIH
-PA
Author M
anuscriptN
IH-P
A A
uthor Manuscript
NIH
-PA
Author M
anuscript

Genome sequencing
In initial experiments to determine if DNA was preserved in the toe phalanx, we extracted
and sequenced random DNA fragments. This revealed that about 70% of the DNA
fragments present in the specimen aligned to the human genome. Initial inspection of the
fragments with similarity to the mitochondrial (mt) genome suggested that its mtDNA was
closely related to Neandertal mtDNAs. We therefore assembled the full mitochondrial
sequence by aligning DNA fragments to a complete Neandertal mitochondrial genome4 (SI
2b). A phylogenetic tree (Fig. 2a) shows that the toe phalanx mtDNA shares a common
ancestor with six previously published Neandertal mtDNAs5 to the exclusion of present-day
humans and the Denisova finger phalanx. Among Neandertal mtDNAs, the toe mtDNA is
most closely related to the mtDNA from infant 1 from Mezmaiskaya Cave in the Caucasus6.
We generated four DNA libraries using a recently published protocol that is particularly
efficient in retrieving DNA from ancient samples1,7. These libraries, together with one
library prepared using a previous protocol8, were treated with uracil-DNA-glycosylase to
remove uracil residues, a common miscoding lesion in ancient DNA that results from the
deamination of cytosine9–11 (SI 5a). In total, these five DNA libraries provided 52-fold
sequence coverage of the genome. We estimated present-day human DNA contamination in
the libraries with four complementary approaches (SI 5) using mtDNA and nuclear DNA
and conclude that present-day human contamination among the DNA fragments sequenced
is around 1%. After genotype calling, which is designed to be insensitive to low levels of
error, we expect that the inferred genome sequence is largely free from contamination.
Relationship to other hominins
We compared the toe phalanx genome to the Denisovan genome1, the draft Neandertal
genome of 1.3-fold coverage determined from three individuals from Vindija Cave,
Croatia12, the genome of a Neandertal infant estimated to be 60,000 to 70,000 years old13
from Mezmaiskaya Cave in the Caucasus that we sequenced to 0.5-fold genomic coverage
(SI 1; Fig. 1b) as well as 25 genomes of present-day humans: 11 previously sequenced to
between 24- and 31- fold coverage1 (“Panel A”), and 14 sequenced to between 35- and 42-
fold coverage for this study (“Panel B”). We used pooled fosmid sequencing to resolve the
sequences of the two chromosomes carried by 13 of these individuals14 (SI 4).
A neighbor-joining tree (Fig. 2b) based on transversions, i.e. purine-pyrimidine differences,
among 7 present-day humans and the low-coverage Mezmaiskaya and Vindija genomes
corrected for errors (SI 6a), shows that the toe phalanx nuclear genome forms a clade with
the genomes of Neandertals. The average DNA sequence divergence between the toe
phalanx genome and the Mezmaiskaya and Vindija Neandertal genomes is approximately a
third of that between the Neandertal and Denisova genomes. We conclude that the
individual from whom the toe phalanx derives is a Neandertal. In what follows we refer to it
as the “Altai Neandertal”.
Prüfer et al. Page 3
Nature. Author manuscript; available in PMC 2014 July 02.
NIH
-PA
Author M
anuscriptN
IH-P
A A
uthor Manuscript
NIH
-PA
Author M
anuscript

Branch Shortening
The length of the branches leading from the common ancestor shared with chimpanzee to
the high-coverage Altai Neandertal and Denisovan genomes are 1.02% (range: 0.99–1.05%)
and 0.81% (range: 0.77–0.84%) shorter, respectively, than the branches to the present-day
human genomes (Table 1; SI 6b). This is expected because the archaic genomes ceased
accumulating substitutions at the death of the individual tens of thousands of years ago. We
previously estimated the shortening of the Denisovan lineage to be 1.16% (range: 1.13–
1.27%)1. The fact that using present-day human genomes of higher quality and more
stringent quality filtering reduces the estimate by about a third shows that at present,
estimates of lineage lengths are unstable, probably due to differences in the error rates
among the genomes used. Nevertheless, the fact that the Neandertal lineage is about 20%
shorter than the Denisovan lineage suggests that the Neandertal toe phalanx is older than the
Denisovan finger phalanx, consistent with the stratigraphy of the cave.
Population split times
Fig. 2b reflects the average divergence between DNA sequences. The times at which the
ancestral populations of archaic and modern humans separated are by necessity younger. We
used two approaches to estimate these population split times (SI 12). We caution that for
these and other age estimates we rely on dates for the divergence of human and chimpanzee
DNA sequences that in turn depend on the human mutation rate, which is currently
controversial. In the text we present estimates based on a mutation rate of 0.5 x 10⁻⁹/bp/
year, estimated from comparisons of the genomes of parents and children15–19. In Table 1
we also present estimates based on a rate of 1.0 x 10⁻⁹/bp/year derived from the fossil
record which was used in previous studies of archaic genomes1,2,12. We also caution that the
split times are at the best approximate because the models of population history used are
likely to be inaccurate.
We first estimated population split times by extending the pairwise sequentially Markovian
coalescent model (PSMC) to estimate the distribution of coalescence times between single
chromosomes where one comes from one and one from another population20,21 (SI 12).
Using sub-Saharan African genomes that were experimentally phased (SI 14) and segments
of the archaic genomes where the two chromosomes within an individual are closely related
we estimate the population split time between modern humans on the one hand, and
Neandertals and Denisovans on the other, to between 553,000 and 589,000 years, and the
split time between Neandertals and Denisovans to 381,000 years (SI 12).
In a second approach we counted how often randomly chosen alleles in an individual from
one population are derived (i.e. different from the apes) at positions where both the derived
and ancestral alleles are seen in an individual from a second population1,12. Such derived
alleles will be less frequent the older the population separation time is because more derived
alleles in the second population will then be due to mutations that occurred after the split.
Using this approach, and the demographic history inferred from the PSMC (SI 12), we
estimate the population split of Neandertals and Denisovans from modern humans to
Prüfer et al. Page 4
Nature. Author manuscript; available in PMC 2014 July 02.
NIH
-PA
Author M
anuscriptN
IH-P
A A
uthor Manuscript
NIH
-PA
Author M
anuscript
550,000–765,000 years, and the split time of Neandertals and Denisovans to 445,000–
473,000 years.
Inbreeding
We noticed that the Altai Neandertal genome contains several long runs of homozygosity,
suggesting that her parents were closely related (Fig. 3a). To estimate the extent of their
relatedness, we scanned the genome for 1Mb regions where most non-overlapping 50-kb-
windows were devoid of heterozygous sites and merged adjacent regions (SI 10). The
Neandertal genome has 20 such regions longer than 10cM whereas the Denisovan genome
has one. We performed simulations of inbreeding scenarios that can result in regions of this
number and length, and find that the inbreeding coefficient is 1/8, indicating that the parents
were as closely related as half-siblings. Since the Altai individuals is a female (SI 5) and the
X chromosome also has long runs of homozygosity, we can exclude parental relationships
where none or only one of the two X chromosomes was inherited from closely-related
common ancestor(s), i.e. scenarios that include two successive males in the pedigree. We
conclude that the parents of this Neandertal individual were either half-siblings who had a
mother in common, double first cousins, an uncle and a niece, an aunt and a nephew, a
grandfather and a granddaughter, or a grandmother and a grandson (Fig. 3b).
To investigate whether mating between closely related individuals may have been typical of
the Altai Neandertal population, we examined the distribution of runs of homozygosity
between 2.5 and 10 cM in length. After removing the runs expected from recent inbreeding,
the Altai Neandertal genome still contains more runs than the Denisovan genome (P < 2.2 ×
10−16), and both archaic genomes contain more than the Karitiana, a present-day population
known to have a small effective size22 (Fig. 3c; SI 10). The sequencing of additional
Neandertal genomes to high quality will address whether breeding among close relatives
was common also among Neandertals in other geographic areas.
Heterozygosity and population size
The Neandertal autosomal genome carries 1.7–1.8 heterozygous sites per 10,000 bp (SI 9).
This is 84% of the number of heterozygous sites in the Denisovan genome, 22–30% of that
in present-day non-African genomes, and 16–18% of that in present-day African genomes
(Extended Data Fig. 1). When regions of homozygosity longer than 2.5cM stemming from
recent as well as long-term inbreeding in the Neandertal are removed, 2.1–2.2 sites per
10,000 are heterozygous, similar to what is observed in the Denisovan genome. Thus,
heterozygosity in Neandertals as well as Denisovans appears to have been lower than in
present-day humans and is among the lowest measured for any organism23.
The demographic history of the population can be reconstructed from the distribution of the
times since the most recent common ancestor of the two copies of the genome that a single
person carries. We use the PSMC20 to infer changes in the size of the Neandertal population
over time and compare this to inferences from the Denisovan and present-day human
genomes (Fig. 4) (SI 12). All genomes analyzed show evidence of a reduction in population
size that occurred sometime before 1.0 million years ago. Subsequently, the population
ancestral to present-day humans increased in size while the Altai and Denisovan ancestral
Prüfer et al. Page 5
Nature. Author manuscript; available in PMC 2014 July 02.
NIH
-PA
Author M
anuscriptN
IH-P
A A
uthor Manuscript
NIH
-PA
Author M
anuscript

populations decreased further in size. It is thus clear that the demographic histories of both
archaic populations differ drastically from that of present-day humans.
Neandertal gene flow into modern humans
We have previously shown that Neandertals contributed parts of their genomes to present-
day populations outside Africa12 and that Denisovans contributed to the genomes of present-
day populations in Oceania2,24 (used here to refer Australia, Melanesia and the Philippines).
Using the high-coverage Neandertal genome in conjunction with the two other Neandertal
genomes, we now estimate that the proportion of Neandertal-derived DNA in people outside
Africa is 1.5–2.1% (SI 14; Extended Data Table 1). Second, we find that the Neandertal-
derived DNA in all non-Africans is more closely related to the Mezmaiskaya Neandertal
from the Caucasus than it is to either the Neandertal from Siberia (Extended Data Table 2;
SI 14) (Z-score range: 4.0–6.4) or to the Vindija Neandertals from Croatia12 (Z-score range:
1.7–3.9). These results cannot be explained by present-day human contamination in the
Mezmaiskaya Neandertal data, as a contamination level on the order of 2.0–5.4% would be
needed to account for the excess relatedness to the Mezmaiskaya Neandertal while the
contamination in the Mezmaiskaya data is estimated to be 0–1.1% (SI 5a).
Denisovan gene flow in mainland Asia
We used the two high-coverage archaic genomes and a hidden Markov model (HMM) to
identify regions of specifically Neandertal and specifically Denisovan ancestry in 13
experimentally phased present-day human genomes1,14 (SI 4; SI 13). In the Sardinian and
French genomes from Europe we find genomic regions of Neandertal origin and few or no
regions of Denisovan origin. In contrast, in the Han Chinese, the Dai in southern China, and
the Karitiana and Mixe in the Americas, we find, in addition to regions of Neandertal origin,
regions that are consistent with being of Denisovan origin (Z-score = 4.3 excess relative to
the Europeans) (SI 13), in agreement with previous analysis based on low-coverage archaic
genomes25. These regions are also more closely related to the Denisova genome than the
few regions identified in Europeans (SI 13). We estimate that the Denisovan contribution to
mainland Asian and Native American populations is ~0.2% and thus about 25 times smaller
than the Denisovan contribution to populations in Papua New Guinea and Australia. The
failure to detect any larger Denisovan contribution in the genome of a 40,000-year-old
modern human from the Beijing area26 suggests that any Denisovan contribution to modern
humans in mainland Asia was always quantitatively small. In fact, we cannot, at the
moment, exclude that the Denisovan contribution to people across mainland Asia is due to
gene flow from ancestors of present-day people in Oceania after they mixed with
Denisovans. We also note that in addition to this Denisovan contribution, the genomes of the
populations in Asia and America appear to contain more regions of Neandertal origin than
populations in Europe1,27 (SI 13, SI 14).
Archaic population differentiation
To estimate how closely related the archaic populations that contributed DNA to present-day
humans were to the archaic individuals from which high-coverage genomes have been
determined, we compared the regions of Neandertal and Denisovan ancestry in present-day
Prüfer et al. Page 6
Nature. Author manuscript; available in PMC 2014 July 02.
NIH
-PA
Author M
anuscriptN
IH-P
A A
uthor Manuscript
NIH
-PA
Author M
anuscript

human genomes identified by an HMM to the sequenced archaic genomes (SI 13). We find
that the DNA sequence divergence in the regions that are most similar between the Altai
Neandertal genome and the Neandertals that contributed DNA to present-day Eurasians is
~1.35% of the human-chimpanzee divergence, while the regions with the smallest sequence
divergence between the Denisovan genome and the Denisovans that contributed DNA to
present-day Papuans and Australians is ~3.18%. Regions of similarly low divergence are
also identified by a window-based comparison (Fig. 5).
We estimate the population split time between the introgressing Neandertal and the Altai
Neandertal genome to 77,000–114,000 years ago, and the split time between the
introgressing Denisovan and the Denisovan genome to 276,000–403,000 years ago (SI 13)
(Table 1). This is consistent with the Denisovan population being larger, more diverse
and/or more subdivided than Neandertal populations, and with the idea that Denisovans may
have populated a wide geographical area. It is also in agreement with the low diversity
among Neandertal nuclear2 and mitochondrial5 genomes.
Neandertal gene flow into Denisovans
If gene flow occurred between Neandertals and Denisovans, we would expect that regions of
the genome where the divergence between Denisovan and Neandertal haplotypes is low
would carry many differences between the two haplotypes of the individual who harbors the
introgressed genetic material. This is because this individual carries two haplotypes that
have accumulated differences independently in the two populations. In contrast, in the
absence of gene flow, regions of low divergence between a Neandertal and a Denisovan
haplotype are not expected to have particularly elevated diversity (SI 15).
We plotted the number of differences between the Neandertal genome and the closest
inferred DNA sequences in the Denisovan genome against Denisovan heterozygosity (Fig.
6). We find that Denisovan heterozygosity is increased in regions where the Neandertal and
one Denisovan allele are close, indicating that gene flow from Neandertals into Denisovans
occurred, and estimate that a minimum of 0.5% of the Denisovan genome was contributed
by Neandertals. The Denisovan genome shares more derived alleles with the Altai
Neandertal genome than with the Croatian or Caucasus Neandertal genomes (Z-score range:
5.6–10.2) (Extended Data Table 2; SI 15), suggesting that the gene flow into Denisovans
came from a Neandertal population more related to the Altai Neandertal than to the other
two Neandertals. In the reciprocal analysis, we find no corresponding increase in Neandertal
heterozygosity.
Particularly strong signals of Neandertal gene flow into Denisovans are found in the human
leucocyte antigen (HLA) region and the CRISP gene cluster on chromosome 6 (Extended
Data Fig. 2), where we find many segments for which one of the Denisova haplotypes and
the Altai Neandertal share a common ancestor within a few tens of thousands of years before
the death of the Altai individual (SI 15). This suggests the possibility that introgressed
Neandertal alleles may have contributed to the Denisovan functional variation at the HLA
and the CRISP cluster, which are involved in immunity and sperm function, respectively.
Prüfer et al. Page 7
Nature. Author manuscript; available in PMC 2014 July 02.
NIH
-PA
Author M
anuscriptN
IH-P
A A
uthor Manuscript
NIH
-PA
Author M
anuscript

This is interesting since it has been suggested that HLA alleles from Neandertals and
Denisovans have been of functional relevance in modern humans28.
Unknown archaic gene flow into Denisovan
Since the ancestors of both Neandertals and Denisovans left Africa before the emergence of
modern humans, one might expect present-day Africans to share equal proportions of
derived alleles with these two archaic groups. However, we find that African genomes share
about 7% more derived alleles with the Neandertal genome than with the Denisova genome
(Z = 11.6 to 13.0; Extended Data Table 2; SI 16a) and that this is particularly the case for
derived alleles that are fixed in Africans, of which 13–16% more are shared with the
Neandertal than with the Denisovan genome (Fig. 7).
We tested three non-mutually exclusive scenarios that could explain these observations.
First, gene flow from the ancestor of Neandertals after the split from Denisovans into the
ancestors of all present-day humans would result in more sharing of derived alleles between
present-day Africans and Neandertals. However, because gene flow contributes alleles at
low frequency the sharing of derived alleles with Neandertals would grow weaker with
higher African derived allele frequency (SI 16a), whereas we observe the opposite (Fig. 7).
Second, gene flow from the ancestors of present-day humans to Neandertals after their split
from Denisovans would also result in more sharing of derived alleles. However, the amount
of allele frequency change (genetic drift) that has occurred in present-day Africans since the
split from Neandertals is too small to explain the extent of sharing of derived alleles fixed in
Africans (SI 16a). Third, we considered a scenario where Denisovans received gene flow
from a hominin whose ancestors diverged deeply from the lineage leading to Neandertals,
Denisovans and present-day humans. We find that this scenario is consistent with the data,
as also suggested by others29, and estimate that 2.7–5.8% (jackknife 95% confidence
interval) of the Denisova genome comes from this putative archaic hominin which diverged
from the other hominins 0.9–1.4 million years ago (SI 16a). An approximate Bayesian
computation30 again supports the third scenario (SI 16b) and estimates that 0.5–8% of the
Denisovan genome comes from an unknown hominin which split from other hominins 1.1
and 4 million years ago.
We caution that these analyses make several simplifying assumptions. Despite these
limitations we show that the Denisova genome harbors a component that derives from a
population that lived prior to the separation of Neandertals, Denisovans and modern
humans. This component may be present due to gene flow, or to a more complex population
history such as ancient population structure maintaining a larger proportion of ancestral
alleles in the ancestors of Denisovans over hundreds of thousands of years.
The putative admixture into Denisovans from an unknown archaic group raises the
possibility that the apparent Denisovan contribution to the genomes of Papuans and
Australians could originate from admixture with the same unknown archaic population
instead of with Denisovans. However, we tested this hypothesis and found that the archaic
component in the genomes of people in Papua New Guinea and Australia comes from a
group related to the Denisovans and not from an unknown archaic hominin (SI 17).
Prüfer et al. Page 8
Nature. Author manuscript; available in PMC 2014 July 02.
NIH
-PA
Author M
anuscriptN
IH-P
A A
uthor Manuscript
NIH
-PA
Author M
anuscript

Copy number differences
The high-quality archaic genomes allow us to identify genetic changes that may have been
relevant for putative biological traits that set modern humans apart from archaic humans. To
identify genomic regions that have changed in copy number during hominin evolution, we
used the variation of coverage along the two archaic genomes and 25 present-day human
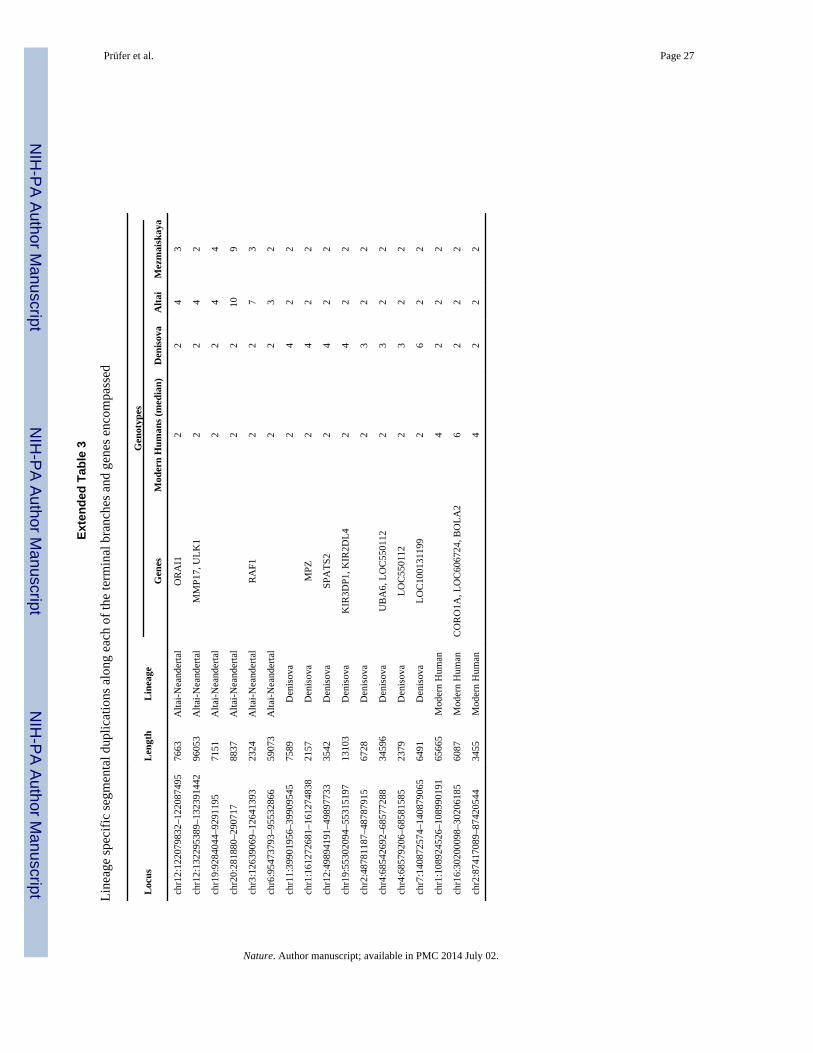
genomes (SI 8). We find three regions that have been duplicated only on the modern human
lineage (Extended Data Table 3). One region overlaps BOLA2, which occurs as a single
copy per haploid genome in the archaic genomes but has two to five copies in all but one of
675 present-day humans analyzed, and which is near a microdeletion associated with
developmental delay, intellectual disability and autism31.
Catalog of modern human changes
We compiled a genome-wide catalog of sites where all or nearly all of 1,094 present-day
humans32 carry the same nucleotide but differ from the Neandertal, Denisovan and great ape
genomes (SI 18). In the regions of the genome to which short fragments can be mapped,
there are 31,389 such single nucleotide substitutions and 4,113 short insertions and deletions
(indels) shared by all present-day humans analyzed, and a further 105,757 substitutions and
3,900 indels shared by 90% of present-day humans. This list of simple DNA sequence
changes that distinguish modern humans from our nearest extinct relatives is thus
comparatively small. For example, it contains only 96 fixed amino acid substitutions in a
total of 87 proteins and in the order of three thousand fixed changes that potentially
influence gene expression in present-day humans (SI 18).
Because the manner in which modern and archaic humans may have differed in aspects of
their cognition is particularly interesting, we focused on the expression in the developing
human brain of transcripts encoding the 87 proteins with fixed amino acid changes (SI 20).
In comparison to a control set of transcripts that carry 108 silent substitutions fixed in
present-day humans, there is a tendency for genes carrying fixed amino acid changes to be
expressed in the ventricular zone of the developing neocortex (P=0.06, corrected for
multiple testing). Out of the five genes which are expressed in the proliferative layers
(ventricular and subventricular zones combined) during mid-fetal development (CASC5,
KIF18A, TKTL1, SPAG5, VCAM1), three (CASC5, KIF18A, SPAG5) are associated with the
kinetochore of the mitotic spindle. This may be interesting since the orientation of the
mitotic cleavage plane in neural precursor cells during cortex development is thought to
influence the fate of the daughter cells and the number of neurons generated (see e.g. ref.33).
Another of these five genes, VCAM1, is essential for maintenance of neural stem cells in the
adult subventricular zone34.
Another way to prioritize changes in the catalog for functional studies is to identify those
that show signs of having risen to high frequency rapidly since they may have been affected
by positive selection. We implemented an HMM to scan the genome for regions where the
Neandertal and Denisovan genomes fall outside of the variation of present-day humans (SI
19a). We ranked these regions, which cover less than 100Mb of the genome, according to
genetic length, because regions that rose rapidly to fixation are expected to be longer as they
Prüfer et al. Page 9
Nature. Author manuscript; available in PMC 2014 July 02.
NIH
-PA
Author M
anuscriptN
IH-P
A A
uthor Manuscript
NIH
-PA
Author M
anuscript

have been less affected by recombination events. A set of 63 regions likely to have been
affected by positive selection were identified (S19.3). They contain 2,123 substitutions and
61 indels that are fixed or of high-frequency (>90%) in modern humans (SI 19b). They
include, for example, the gene RB1CC1 (also called FIP200) which encodes a transcription
factor which, like VCAM1, is essential for maintenance of neuronal stem cells in the adult
subventricular zone35. In present-day humans, but not Neandertals and Denisovans,
RB1CC1 carries a substitution inferred to change an amino acid in the encoded protein as
well as a substitution that affects a conserved site in a motif that occur across the genome36.
Functional investigations will be necessary to clarify whether these and other such changes
affect any phenotypes in present-day humans.
Discussion
We present evidence for three to five cases of interbreeding among four distinct hominin
populations (Fig. 8). Clearly the real population history is likely to have been even more
complex. For example, most cases of gene flow are likely to have occurred intermittently,
often in both directions and across a geographic range. Thus, combinations of gene flow
among different groups and substructured populations may have yielded the patterns
detected rather than the discrete events considered here. Nevertheless, our analyses show
that hominin groups met and had offspring on many occasions in the Late Pleistocene, but
that the extent of gene flow between the groups was generally low.
We note that the observation that the Neandertal DNA sequences in non-Africans share
more derived alleles with the Neandertal from the Caucasus than with Neandertals from
either Croatia or the Altai indicates that the archaic gene flow into non-Africans occurred at
a time when Neandertal populations had separated from each other. We also note that the
introgressed Neandertal DNA sequences suggest a population split from the Altai
Neandertal between 77,000 and 114,000 years ago (SI 13), well after ~230,000 years ago
when Neandertal features appear in the fossil record37. These and other results38,39 show
that the allele sharing between Neanderthals and non-African populations is due to recent
admixture rather than ancient population subdivision, an alternative which we and others
previously considered possible12,40.
The evidence suggestive of gene flow into Denisovans from an unknown hominin is
interesting. The estimated age of 0.9 to 4 million years for the population split of this
unknown hominin from the modern human lineage is compatible with that it contributed its
mtDNA to Denisovans since the Denisovan mtDNA diverged from the mtDNA of the other
hominins about 0.7–1.3 million years ago41. The estimated population split time is also
compatible with the possibility that this unknown hominin was what is known from the
fossil record as Homo erectus. This group started to spread out of Africa around 1.8 million
years ago42, but Asian and African H. erectus populations may have become finally
separated only about one million years ago43. However, further work is necessary to
establish if and how this gene flow event occurred.
Prüfer et al. Page 10
Nature. Author manuscript; available in PMC 2014 July 02.
NIH
-PA
Author M
anuscriptN
IH-P
A A
uthor Manuscript
NIH
-PA
Author M
anuscript

Methods
Sequences were generated on the Illumina HiSeq 2500 and base-calling was carried out
using Ibis44. Reads were merged and adapter trimmed as described1 and mapped to the
human reference genome using BWA (version: 0.5.10). Genotyping was carried out using
GATK (version 1.3). We restrict analyses to regions of the genome that are non-repetitive
(excluding tandem repeats), unique (requiring at least 50%, or all, overlapping 35-mers
covering a position to map uniquely, allowing for one mismatch), and fall within the central
95% of the coverage distribution corrected for GC bias (SI 5b). The supplementary
information describes the details of data processing and other analyses.
Supplementary Material
Refer to Web version on PubMed Central for supplementary material.
Acknowledgments
We thank Michael Hammer, Cheryl Winkler and William Klitz for sharing DNA samples, Wieland Huttner and hisgroup, Benjamin Peter, Joshua G. Schraiber and Melinda A. Yang for helpful discussions, and Alexandra Lewisand Ruolan Qiu for technical assistance. NP and DR are grateful for the chance to discuss these results with PeterWaddell who independently found evidence of a deeply diverged hominin admixing into the Denisova genome. DRand NP were supported by NSF grant #1032255 and NIH grant GM100233; JS by grant HG006283 from theNational Genome Research Institute (NHGRI); SS by a post-doctoral fellowship from the Harvard UniversityScience of the Human Past Program; FJ and MS in part by a grant from the NIH (R01-GM40282); PHS by anHHMI International Student Fellowship. We thank the team at the NIH Intramural Sequencing Center, and AliceYoung in particular, for generating some of the sequence reported here. This research was supported in part by thePaul G. Allen Family Foundation. Major funding support came from the Presidential Innovation Fund of the MaxPlanck Society.
References
1. Meyer M, et al. A high-coverage genome sequence from an archaic Denisovan individual. Science.2012; 338:222–226.10.1126/science.1224344 [PubMed: 22936568]
2. Reich D, et al. Genetic history of an archaic hominin group from Denisova Cave in Siberia. Nature.2010; 468:1053–1060.10.1038/nature09710 [PubMed: 21179161]
3. Mednikova MB. A proximal pedal phalanx of a paleolithic hominin from Denisova cave, Altai.Archaeology Ethnology & Anthropology of Eurasia. 2011; 39:129–138. http://dx.doi.org/10.1016/j.aeae.2011.06.017.
4. Green RE, et al. A complete Neandertal mitochondrial genome sequence determined by high-throughput sequencing. Cell. 2008; 134:416–426.10.1016/j.cell.2008.06.021 [PubMed: 18692465]
5. Briggs AW, et al. Targeted retrieval and analysis of five Neandertal mtDNA genomes. Science.2009; 325:318–321.10.1126/science.1174462 [PubMed: 19608918]
6. Golovanova LV, Hoffecker JF, Kharitonov VM, Romanova GP. Mezmaiskaya cave: A Neanderthaloccupation in the Northern Caucasus. Curr Anthropol. 1999; 40:77–86.10.1086/515805
7. Gansauge MT, Meyer M. Single-stranded DNA library preparation for the sequencing of ancient ordamaged DNA. Nature protocols. 2013; 8:737–748.10.1038/nprot.2013.038
8. Kircher M. Analysis of high-throughput ancient DNA sequencing data. Methods Mol Biol. 2012;840:197–228.10.1007/978-1-61779-516-9_23 [PubMed: 22237537]
9. Briggs AW, et al. Patterns of damage in genomic DNA sequences from a Neandertal. Proceedingsof the National Academy of Sciences of the United States of America. 2007; 104:14616–14621.10.1073/pnas.0704665104 [PubMed: 17715061]
10. Briggs AW, et al. Removal of deaminated cytosines and detection of in vivo methylation in ancientDNA. Nucleic acids research. 2010; 38:e87.10.1093/nar/gkp1163 [PubMed: 20028723]
Prüfer et al. Page 11
Nature. Author manuscript; available in PMC 2014 July 02.
NIH
-PA
Author M
anuscriptN
IH-P
A A
uthor Manuscript
NIH
-PA
Author M
anuscript

11. Hofreiter M, Jaenicke V, Serre D, von Haeseler A, Paabo S. DNA sequences from multipleamplifications reveal artifacts induced by cytosine deamination in ancient DNA. Nucleic acidsresearch. 2001; 29:4793–4799. [PubMed: 11726688]
12. Green RE, et al. A draft sequence of the Neandertal genome. Science. 2010; 328:710–722.10.1126/science.1188021 [PubMed: 20448178]
13. Skinner AR, et al. ESR dating at Mezmaiskaya Cave, Russia. Appl Radiat Isotopes. 2005; 62:219–224.10.1016/j.apradiso.2004.08.008
14. Kitzman JO, et al. Haplotype-resolved genome sequencing of a Gujarati Indian individual. Naturebiotechnology. 2011; 29:59–63.10.1038/nbt.1740
15. Abecasis GR, et al. A map of human genome variation from population-scale sequencing. Nature.2010; 467:1061–1073.10.1038/nature09534 [PubMed: 20981092]
16. Awadalla P, et al. Direct measure of the de novo mutation rate in autism and schizophreniacohorts. American journal of human genetics. 2010; 87:316–324.10.1016/j.ajhg.2010.07.019[PubMed: 20797689]
17. Roach JC, et al. Analysis of genetic inheritance in a family quartet by whole-genome sequencing.Science. 2010; 328:636–639.10.1126/science.1186802 [PubMed: 20220176]
18. Kong A, et al. Rate of de novo mutations and the importance of father’s age to disease risk. Nature.2012; 488:471–475.10.1038/nature11396 [PubMed: 22914163]
19. Campbell CD, et al. Estimating the human mutation rate using autozygosity in a founderpopulation. Nature genetics. 2012; 44:1277–1281.10.1038/ng.2418 [PubMed: 23001126]
20. Li H, Durbin R. Inference of human population history from individual whole-genome sequences.Nature. 2011; 475:493–496.10.1038/nature10231 [PubMed: 21753753]
21. Prado-Martinez J, et al. Great ape genetic diversity and population history. Nature. 201310.1038/nature12228
22. Kirin M, et al. Genomic runs of homozygosity record population history and consanguinity. PloSone. 2010; 5:e13996.10.1371/journal.pone.0013996 [PubMed: 21085596]
23. Leffler EM, et al. Revisiting an old riddle: what determines genetic diversity levels within species?PLoS biology. 2012; 10:e1001388.10.1371/journal.pbio.1001388 [PubMed: 22984349]
24. Reich D, et al. Denisova admixture and the first modern human dispersals into Southeast Asia andOceania. American journal of human genetics. 2011; 89:516–528.10.1016/j.ajhg.2011.09.005[PubMed: 21944045]
25. Skoglund P, Jakobsson M. Archaic human ancestry in East Asia. Proceedings of the NationalAcademy of Sciences of the United States of America. 2011; 108:18301–18306.10.1073/pnas.1108181108 [PubMed: 22042846]
26. Fu Q, et al. DNA analysis of an early modern human from Tianyuan Cave, China. Proceedings ofthe National Academy of Sciences of the United States of America. 2013; 110:2223–2227.10.1073/pnas.1221359110 [PubMed: 23341637]
27. Wall JD, et al. Higher levels of neanderthal ancestry in East aSians than in Europeans. Genetics.2013; 194:199–209.10.1534/genetics.112.148213 [PubMed: 23410836]
28. Abi-Rached L, et al. The shaping of modern human immune systems by multiregional admixturewith archaic humans. Science. 2011; 334:89–94.10.1126/science.1209202 [PubMed: 21868630]
29. Waddell, PJ.; Tan, X. New g%AIC, g%AICc, g%BIC, and Power Divergence Fit Statistics ExposeMating between Modern Humans, Neanderthals and other Archaics. 2012. arXiv:1212.6820
30. Wegmann D, Leuenberger C, Neuenschwander S, Excoffier L. ABCtoolbox: a versatile toolkit forapproximate Bayesian computations. BMC bioinformatics. 2010;11:116.10.1186/1471-2105-11-116 [PubMed: 20202215]
31. Kumar RA, et al. Recurrent 16p11.2 microdeletions in autism. Human molecular genetics. 2008;17:628–638.10.1093/hmg/ddm376 [PubMed: 18156158]
32. Abecasis GR, et al. An integrated map of genetic variation from 1,092 human genomes. Nature.2012; 491:56–65.10.1038/nature11632 [PubMed: 23128226]
33. Fietz SA, Huttner WB. Cortical progenitor expansion, self-renewal and neurogenesis-a polarizedperspective. Current opinion in neurobiology. 2011; 21:23–35.10.1016/j.conb.2010.10.002[PubMed: 21036598]
Prüfer et al. Page 12
Nature. Author manuscript; available in PMC 2014 July 02.
NIH
-PA
Author M
anuscriptN
IH-P
A A
uthor Manuscript
NIH
-PA
Author M
anuscript

34. Kokovay E, et al. VCAM1 is essential to maintain the structure of the SVZ niche and acts as anenvironmental sensor to regulate SVZ lineage progression. Cell stem cell. 2012; 11:220–230.10.1016/j.stem.2012.06.016 [PubMed: 22862947]
35. Wang C, Liang CC, Bian ZC, Zhu Y, Guan JL. FIP200 is required for maintenance anddifferentiation of postnatal neural stem cells. Nature neuroscience. 2013; 16:532–542.10.1038/nn.3365
36. Rios D, et al. A database and API for variation, dense genotyping and resequencing data. BMCbioinformatics. 2010; 11:238.10.1186/1471-2105-11-238 [PubMed: 20459810]
37. Hublin JJ. Out of Africa: modern human origins special feature: the origin of Neandertals.Proceedings of the National Academy of Sciences of the United States of America. 2009;106:16022–16027.10.1073/pnas.0904119106 [PubMed: 19805257]
38. Sankararaman S, Patterson N, Li H, Paabo S, Reich D. The date of interbreeding betweenNeandertals and modern humans. PLoS genetics. 2012; 8:e1002947.10.1371/journal.pgen.1002947 [PubMed: 23055938]
39. Yang MA, Malaspinas AS, Durand EY, Slatkin M. Ancient structure in Africa unlikely to explainNeanderthal and non-African genetic similarity. Molecular biology and evolution. 2012; 29:2987–2995.10.1093/molbev/mss117 [PubMed: 22513287]
40. Eriksson A, Manica A. Effect of ancient population structure on the degree of polymorphismshared between modern human populations and ancient hominins. Proceedings of the NationalAcademy of Sciences of the United States of America. 2012; 109:13956–13960.10.1073/pnas.1200567109 [PubMed: 22893688]
41. Krause J, et al. The complete mitochondrial DNA genome of an unknown hominin from southernSiberia. Nature. 2010; 464:894–897.10.1038/nature08976 [PubMed: 20336068]
42. Gabunia L, et al. Dmanisi and dispersal. Evol Anthropol. 2001; 10:158–170.10.1002/Evan.1030
43. Asfaw B, et al. Remains of Homo erectus from bouri, Middle Awash, Ethiopia. Nature. 2002;416:317–320.10.1038/416317a [PubMed: 11907576]
44. Kircher M, Stenzel U, Kelso J. Improved base calling for the Illumina Genome Analyzer usingmachine learning strategies. Genome biology. 2009; 10:R83.10.1186/gb-2009-10-8-r83 [PubMed:19682367]
45. Langergraber KE, et al. Generation times in wild chimpanzees and gorillas suggest earlierdivergence times in great ape and human evolution. Proceedings of the National Academy ofSciences of the United States of America. 2012; 109:15716–15721.10.1073/pnas.1211740109[PubMed: 22891323]
46. Scally A, Durbin R. Revising the human mutation rate: implications for understanding humanevolution. Nature reviews. Genetics. 2012; 13:745–753.10.1038/nrg3295
Prüfer et al. Page 13
Nature. Author manuscript; available in PMC 2014 July 02.
NIH
-PA
Author M
anuscriptN
IH-P
A A
uthor Manuscript
NIH
-PA
Author M
anuscript

Figure 1. Toe phalanx and location of Neandertal samples for which genome-wide data areavailablea, The toe phalanx found in the East Gallery of Denisova Cave in 2010. Left: dorsal view;
Right: left view. b, Map of Eurasia showing the location of Vindija cave, Mezmaiskaya cave
and Denisova cave.
Prüfer et al. Page 14
Nature. Author manuscript; available in PMC 2014 July 02.
NIH
-PA
Author M
anuscriptN
IH-P
A A
uthor Manuscript
NIH
-PA
Author M
anuscript

Figure 2. Phylogenetic relationships of the Altai Neandertala, Bayesian tree of mitochondrial sequences of the toe phalanx, the Denisovan finger
phalanx, six Neandertals, and five present-day humans. Posterior probabilities are given for
branches whose support is less than one (SI 2b). b, Neighbor-joining tree based on
autosomal transversion differences among the toe phalanx, four Neandertals, the Denisova
genome, and seven present-day human individuals. Bootstrap values are shown for branches
supported by less than 100% of 1,000 bootstrap replicates (SI 6).
Prüfer et al. Page 15
Nature. Author manuscript; available in PMC 2014 July 02.
NIH
-PA
Author M
anuscriptN
IH-P
A A
uthor Manuscript
NIH
-PA
Author M
anuscript

Figure 3. Indications of inbreeding in the Altai Neandertal individuala, Time since the most recent common ancestor in log-scale for the two alleles of a French,
the Denisovan and the Altai Neandertal individual (SI 12) along 40 Mb of chromosome 21.
b, Pedigrees showing four possible scenarios of parental relatedness for the Altai Neandertal
(i.e. the child at the bottom of each pedigree). Two additional scenarios can be derived by
switching the sex of the parents for the panels marked with an asterisk. c, Fraction of the
genome in runs of homozygosity between 2.5 and 10cM in length for Altai Neandertal,
Denisovan and the three present-day human individuals with the largest fractions (grey
bars). The fractions for the Altai Neandertal (bottom four bars) are reduced by the fraction
expected from the four inbreeding scenarios in a.
Prüfer et al. Page 16
Nature. Author manuscript; available in PMC 2014 July 02.
NIH
-PA
Author M
anuscriptN
IH-P
A A
uthor Manuscript
NIH
-PA
Author M
anuscript

Figure 4. Inference of population size change over timeThe y-axis specifies a number proportional to the population size Ne. The x-axis specifies
time in units of divergence per base pair (along the top in years for mutation rates of 0.5 ×
10−9 to 1.0 × 10⁻⁹ per site per year). The analysis assumes that the Neandertal and Denisova
remains are of the same age, whereas archaeological evidence and the branch shortening
suggest that the Neandertal bone is older than the Denisovan bone. However, because the
exact difference in ages is not known, it is not possible to determine whether the reduction in
population size experienced by both archaic groups (but not by modern humans) coincided
in time.
Prüfer et al. Page 17
Nature. Author manuscript; available in PMC 2014 July 02.
NIH
-PA
Author M
anuscriptN
IH-P
A A
uthor Manuscript
NIH
-PA
Author M
anuscript

Figure 5. Relatedness of introgressing archaic and sequenced archaic samplesDivergence of phased present-day human genomes to archaic genomes in windows of size
0.01cM with a minimum of 25,000 analysed bases. Windows are sorted by sequence
divergence measured on the archaic side of the tree (SI 13) and the y-axis reports the
divergence relative to human-chimpanzee divergence for cumulative fractions of the sorted
windows over the entire genomes. Regions of low divergence between non-Africans and
Neandertals (a) and between Oceanians and Denisovans (b) indicate gene flow between
these groups and the relative divergences between the introgressing archaic and sequenced
archaic samples.
Prüfer et al. Page 18
Nature. Author manuscript; available in PMC 2014 July 02.
NIH
-PA
Author M
anuscriptN
IH-P
A A
uthor Manuscript
NIH
-PA
Author M
anuscript

Figure 6. Neandertal gene flow into Siberian DenisovansDivergence in 0.01cM sized windows with at least 50kb analyzed bases between a “test”-
archaic genome and effectively haploid regions of the other archaic genome archaic plotted
against the most recent-common ancestor of the two alleles of the “test”-archaic. The plot
shows 50 equally sized bins of windows for the “test”-archaic Denisovan against the
effectively haploid Neandertal (red) and for the “test”-archaic Altai Neandertal against the
effectively haploid Denisovan (blue). Divergence is given as percentage of human-
chimpanzee divergence. Windows that show a close relationship between the effective
haploid Altai Neandertal and the closest inferred Denisovan haplotype show a deep
divergence to the second Denisovan haplotype, indicating gene flow from Neandertal into
Denisovan.
Prüfer et al. Page 19
Nature. Author manuscript; available in PMC 2014 July 02.
NIH
-PA
Author M
anuscriptN
IH-P
A A
uthor Manuscript
NIH
-PA
Author M
anuscript

Figure 7. Altai and Denisovan allele sharing with Africans stratified by African allele frequencyThe plot shows the D-statistic of the form D(Neandertal, Denisova; Africa, Chimpanzee)
binned by derived allele count in 10 deeply sequenced African genomes. Error-bars
represent ± 1 standard error. High-frequency and fixed derived alleles in Africa are more
often shared with the Neandertal than with Denisovan genome.
Prüfer et al. Page 20
Nature. Author manuscript; available in PMC 2014 July 02.
NIH
-PA
Author M
anuscriptN
IH-P
A A
uthor Manuscript
NIH
-PA
Author M
anuscript

Figure 8. A possible model of gene flow events in the late PleistoceneThe direction and estimated magnitude of inferred gene flow events are shown. Branch
lengths and ages gene flows are not drawn to scale. The dashed line indicates that it is
uncertain if Denisovan gene flow into modern humans occurred once or more times. D.I.
denotes the introgressing Denisovan, N.I. the introgressing Neandertal. Note that the age of
the archaic genomes precludes detection of gene-flow from modern humans into the archaic
hominins.
Prüfer et al. Page 21
Nature. Author manuscript; available in PMC 2014 July 02.
NIH
-PA
Author M
anuscriptN
IH-P
A A
uthor Manuscript
NIH
-PA
Author M
anuscript

Extended Data Figure 1.Heterozygosity estimates for the Altai Neandertal individual, the Denisovan individual, non-
Africans and Africans.
The bars for the latter two give the range of heterozygosity observed among 15 non-African
and 10 African individuals, respectively (SI 9).
Prüfer et al. Page 22
Nature. Author manuscript; available in PMC 2014 July 02.
NIH
-PA
Author M
anuscriptN
IH-P
A A
uthor Manuscript
NIH
-PA
Author M
anuscript

Extended Data Figure 2.Neandertal-introgressed loci in Denisova
Divergence of the Altai Neandertal to the most closely related Denisovan haplotype in
windows of at least 200kb on chromosome 6. Divergence is given as percentage of human-
chimpanzee divergence and bars represent ± 1 standard error.
Prüfer et al. Page 23
Nature. Author manuscript; available in PMC 2014 July 02.
NIH
-PA
Author M
anuscriptN
IH-P
A A
uthor Manuscript
NIH
-PA
Author M
anuscript

NIH
-PA
Author M
anuscriptN
IH-P
A A
uthor Manuscript
NIH
-PA
Author M
anuscript
Prüfer et al. Page 24
Table 1
Dating for Branch Shortening and Population Splits
EventAs % of human-chimp
divergence
Absolute datecalibration #1 in kya(μ= 1 × 10⁻⁹/bp/year)
Absolute datecalibration #2 in kya
(μ= 0.5 × 10⁻⁹/bp/year) Supplement
Altai Neandertal Branch Shortening 0.99% – 1.05% 64–68 129–136 SI 6b
Denisova Branch Shortening 0.77% – 0.84% 50–54 100–109 SI 6b
San-West African split 0.66% – 1.00% 43–65 86–130 SI 12
Introgressing Neandertal – Altai split 0.58% – 0.88% 38–57 77–114 SI 13
Introgressing Denisovan – Denisovansplit
2.12% – 3.10% 138–202 276–403 SI 13
Neandertal-Denisova split* 2.93% – 3.64% 190–236 381–473 SI 12
Archaic-African split* 4.23% – 5.89% 275–383 550–765 SI 12
Unknown archaic split 7.90% – 31.12% 450–2027 900–4054 SI 16a,b
This table gives date ranges for two calibrations. The first assumes human-chimpanzee divergence of 6.5 million years and 1.30% for human-
chimp divergence, or a mutation rate of 1 x 10⁻⁹/bp/year1,2,12. The second is based on direct measurement of per generation mutation
rates 15–17, corresponding to a mutation rate of 0.5 × 10⁻⁹/bp/year or 13 million years ago for human-chimpanzee divergence, and may fit better
with some aspects of the fossil record45,46. Intervals give the range of values over tested human genomes for branch shortening; lowest andhighest estimate for two or three methods for San-West African, Neandertal-Denisova, Neandertal-African and Denisova-African split; jackknifeconfidence interval over introgressed chunks for the Introgressing-Archaic - Archaic splits; and a union of the jackknife confidence interval in SI16a and the 95% highest posterior density in SI 16b for the unknown-archaic split.
*The indicated values are corrected for branch shortening where relevant as described in the supplementary notes.
Nature. Author manuscript; available in PMC 2014 July 02.

NIH
-PA
Author M
anuscriptN
IH-P
A A
uthor Manuscript
NIH
-PA
Author M
anuscript
Prüfer et al. Page 25
Ext
end
ed T
able
1
Nea
nder
tal a
nces
try
estim
ate
Oth
er N
eand
erta
l = M
ezm
aisk
aya
Oth
er N
eand
erta
l = V
indi
ja
Pan
el A
Pan
el B
Pan
el A
Pan
el B
âSt
d. E
rr.
âSt
d. E
rr.
âSt
d. E
rr.
âSt
d. E
rr.
Fren
ch0.
020
0.00
30.
019
0.00
30.
016
0.00
20.
017
0.00
2
Sard
inia
n0.
019
0.00
20.
017
0.00
30.
018
0.00
20.
018
0.00
2
Han
0.02
20.
003
0.01
80.
003
0.02
30.
002
0.01
90.
002
Dai
0.01
90.
003
0.01
60.
003
0.01
90.
002
0.01
60.
002
Kar
itian
a0.
020
0.00
30.
019
0.00
30.
018
0.00
20.
019
0.00
2
Mix
e-
-0.
018
0.00
3-
-0.
017
0.00
2
Nature. Author manuscript; available in PMC 2014 July 02.

NIH
-PA
Author M
anuscriptN
IH-P
A A
uthor Manuscript
NIH
-PA
Author M
anuscript
Prüfer et al. Page 26
Ext
end
ed T
able
2
Sele
cted
“D
-sta
tistic
s” s
uppo
rtin
g in
fere
nces
abo
ut g
ene
flow
s
Stat
isti
cD
ZIn
terp
reta
tion
D(F
renc
h, D
inka
; Alta
i, C
him
p)5.
4%9.
2SI
14:
Nea
nder
tals
sha
re m
ore
deri
ved
alle
les
with
non
-Afr
ican
s th
an w
ith A
fric
ans.
D(H
an, D
inka
; Alta
i, C
him
p)7.
3%11
.4
D(H
an, P
apua
n; D
enis
ova,
Chi
mp)
−7.
0%−
9.5
SI 1
4: D
enis
ovan
s sh
are
mor
e de
rive
d al
lele
s w
ith O
cean
ian
popu
latio
ns th
an w
ith o
ther
non
Afr
ican
s.
D(H
an, A
ustr
alia
n; D
enis
ova,
Chi
mp)
−7.
7%−
10.7
D(A
ltai,
Mez
mai
skay
a; F
renc
h, D
inka
)−
16.4
%−
5.8
SI 1
4: T
he a
rcha
ic m
ater
ial i
n no
n-A
fric
ans
falls
with
in la
te N
eand
erta
l var
iatio
n: N
on-A
fric
ans
shar
e m
ore
alle
les
with
som
eN
eand
erta
ls (
Mez
mai
skay
a/V
indi
ja)
than
oth
ers
(Alta
i).
D(A
ltai,
Vin
dija
; Fre
nch,
Din
ka)
−7.
0%−
4.3
D(A
ltai,
Mez
mai
skay
a; D
enis
ova,
Chi
mp)
13.2
%5.
9SI
15:
Gen
e fl
ow b
etw
een
Alta
i rel
ated
Nea
nder
tals
and
Den
isov
ans
(Den
isov
ans
shar
e m
ore
deri
ved
alle
les
with
Alta
i tha
n w
ithM
ezm
aisk
aya)
D(A
ltai,
Vin
dija
; Den
isov
a, C
him
p)7.
9%5.
6
D(A
ltai,
Den
isov
a; 1
2 A
fric
ans,
Chi
mp)
7.0%
11.6
SI 1
6: U
nkno
wn
arch
aic
gene
flo
w in
toD
enis
ova:
Afr
ican
s sh
are
mor
e de
rive
d al
lele
s w
ith A
ltai t
han
with
Den
isov
a, a
sig
nal t
hat
stre
ngth
ens
for
fixe
d de
rive
d al
lele
sD
(Alta
i, D
enis
ova;
12
Afr
ican
s Fi
xed,
Chi
mp)
13.4
%10
.0
Nature. Author manuscript; available in PMC 2014 July 02.
NIH
-PA
Author M
anuscriptN
IH-P
A A
uthor Manuscript
NIH
-PA
Author M
anuscript
Prüfer et al. Page 27
Ext
end
ed T
able
3
Lin
eage
spe
cifi
c se
gmen
tal d
uplic
atio
ns a
long
eac
h of
the
term
inal
bra
nche
s an
d ge
nes
enco
mpa
ssed
Loc
usL
engt
hL
inea
geG
enot
ypes
Gen
esM
oder
n H
uman
s (m
edia
n)D
enis
ova
Alt
aiM
ezm
aisk
aya
chr1
2:12
2079
832–
1220
8749
576
63A
ltai-
Nea
nder
tal
OR
AI1
22
43
chr1
2:13
2295
389–
1323
9144
296
053
Alta
i-N
eand
erta
lM
MP1
7, U
LK
12
24
2
chr1
9:92
8404
4–92
9119
571
51A
ltai-
Nea
nder
tal
22
44
chr2
0:28
1880
–290
717
8837
Alta
i-N
eand
erta
l2
210
9
chr3
:126
3906
9–12
6413
9323
24A
ltai-
Nea
nder
tal
RA
F12
27
3
chr6
:954
7379
3–95
5328
6659
073
Alta
i-N
eand
erta
l2
23
2
chr1
1:39
9019
56–3
9909
545
7589
Den
isov
a2
42
2
chr1
:161
2726
81–1
6127
4838
2157
Den
isov
aM
PZ2
42
2
chr1
2:49
8941
91–4
9897
733
3542
Den
isov
aSP
AT
S22
42
2
chr1
9:55
3020
94–5
5315
197
1310
3D
enis
ova
KIR
3DP1
, KIR
2DL
42
42
2
chr2
:487
8118
7–48
7879
1567
28D
enis
ova
23
22
chr4
:685
4269
2–68
5772
8834
596
Den
isov
aU
BA
6, L
OC
5501
122
32
2
chr4
:685
7920
6–68
5815
8523
79D
enis
ova
LO
C55
0112
23
22
chr7
:140
8725
74–1
4087
9065
6491
Den
isov
aL
OC
1001
3119
92
62
2
chr1
:108
9245
26–1
0899
0191
6566
5M
oder
n H
uman
42
22
chr1
6:30
2000
98–3
0206
185
6087
Mod
ern
Hum
anC
OR
O1A
, LO
C60
6724
, BO
LA
26
22
2
chr2
:874
1708
9–87
4205
4434
55M
oder
n H
uman
42
22
Nature. Author manuscript; available in PMC 2014 July 02.