Embed Size (px)
Citation preview
1Freshwater Crisis
The Coming Freshwater Crisis is Already HereDon Hinrichsen and Henrylito Tacio
Don Hinrichsen is an award-winning writer and former journalist who is based in Europeand the United States. He currently works as a writer/media consultant for the UN system.He has also written five books over the past decade on topics ranging from coastalresources to an atlas of the environment. Henrylito D. Tacio is a multi-awarded Filipinojournalist who specializes on reporting on science and technology, environment, andagriculture. Tacio currently works as information officer of the Asian Rural Life DevelopmentFoundation.
Introduction
Fresh Water Is A Critical Resource IssueFresh water is emerging as the most critical resource issue facing humanity. While
the supply of fresh water is limited, both the world’s population and demand for theresource continues to expand rapidly. As Janet Abramovitz has written: “Today, we withdrawwater far faster than it can be recharged—unsustainably mining what was once a renewableresource” (Abramovitz, 1996). Abramovitz estimates that the amount of fresh waterwithdrawn for human uses has risen nearly 40-fold in the past 300 years, with over halfof the increase coming since 1950 (Abramovitz, 1996).
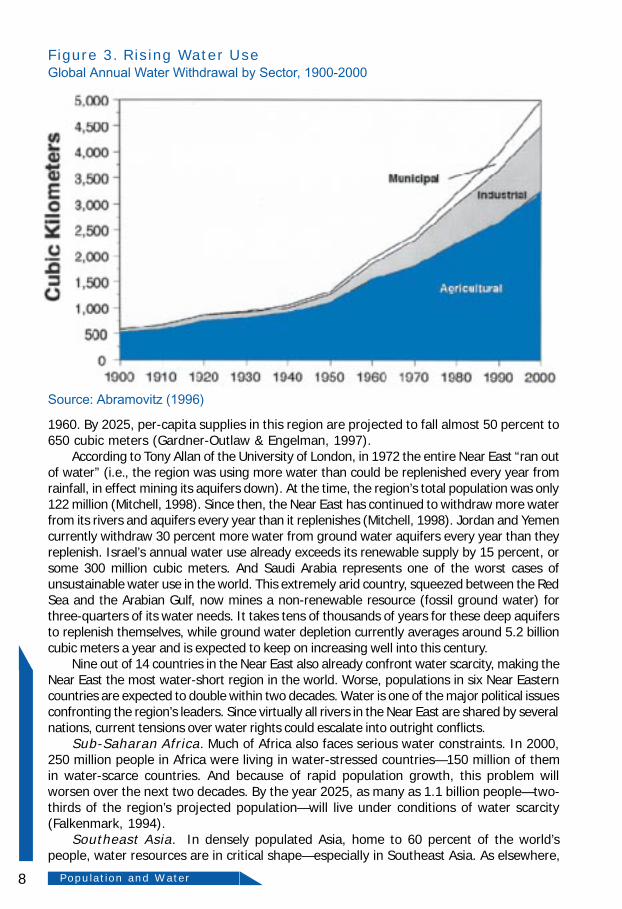
The world’s rapid population growth over the last century has been a major factor inincreasing global water usage. But demand for water is also rising because of urbanization,economic development, and improved living standards. Between 1900 and 1995, forexample, global water withdrawals increased by over six times—more than double therate of population growth (Gleick, 1998). In developing countries, water withdrawals arerising more rapidly—by four percent to eight percent a year for the past decade—alsobecause of rapid population growth and increasing demand per capita (Marcoux, 1994).Moreover, increasing pollution is shrinking the supply of fresh water even further. In manycountries, lakes and rivers are used as receptacles for an assortment of wastes—includinguntreated or partially treated municipal sewage, industrial poisons, and harmful chemicalsthat leach into surface and ground water during agricultural activities.
Caught between (a) finite and increasingly polluted water supplies, and (b) rapidlyrising demand from population growth and development, many developing countriesface difficult and uneasy choices. As the World Bank has warned, lack of water is likely tobe the major factor limiting economic development in the decades to come (Serageldin,1995).
Population and Fresh WaterPopulation and water resources are closely connected. The availability of fresh water
limits how many people an area can support, while population growth, urbanization, andmigration all affect the availability and quality of water resources. Population growthincreases demand for water for food production, household consumption, and industrialuses. At some point, however, this increased demand becomes overuse, leading to depletionand pollution of surface and groundwater supplies that can cause chronic water shortages.Scarce and degraded water supplies also often cause critical health problems. Pollutedwater, water shortages, and unsanitary living conditions kill over 12 million people a year(WHO, 1997) and cause a great deal of illness such as cholera, hepatitis A, amoebicdysentery, schistosomiasis, and dengue and malaria fevers. And this increasing competitionfor limited water supplies also causes social and political tensions. River basins and other
2 Population and Water
water bodies do not respect national borders: one country’s use of upstream water oftenremoves that water from use by downstream countries. There remains a real risk acrossthe globe of escalating tension and perhaps conflict over access to freshwater supplies.
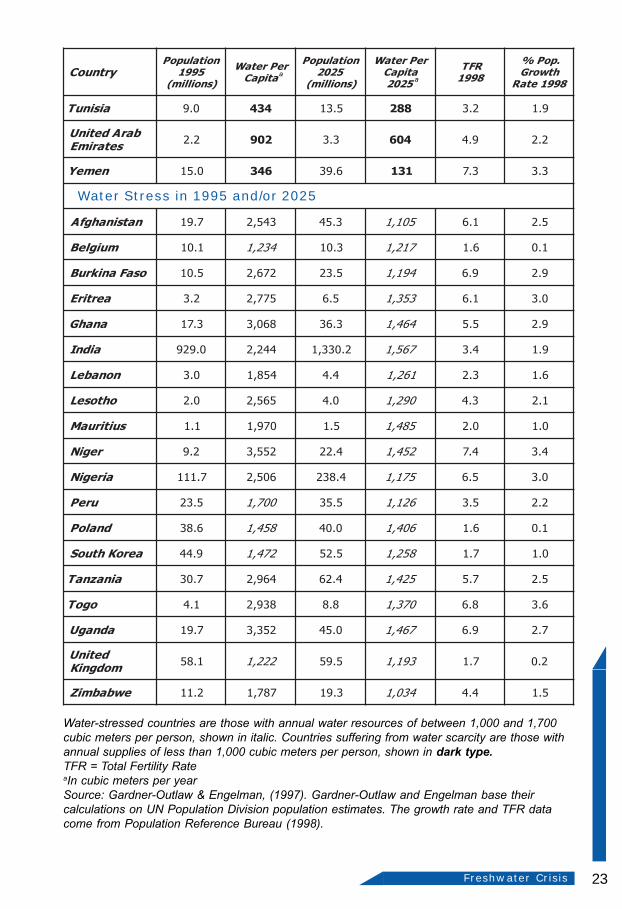
Slowing population growth, conserving water. In less than 30 years, 50countries could face serious water shortages, affecting more than 3.3 billion people—40percent of the projected global population (Gardner-Outlaw & Engleman, 1997). Theworld, especially water-scarce countries (those with less than 1,000 cubic meters perperson per year) that are afflicted with rapid population growth, must slow the growth indemand for water by slowing population growth as soon as possible. Family-planningservices will empower millions of couples to space and limit their births if they so desire.
At the same time, the world’s “water profligacy” must end as soon as possible.Throughout the world, enormous amounts of water are wasted due to inappropriateagricultural subsidies, inefficient irrigation systems, imprudent pricing of municipal water,poor watershed management, pollution, and other practices. The world can no longerafford to waste its precious supplies of fresh water.
Freshwater Availability and Us
While 70 percent of the earth’s surface is water, only three percent of it is freshwater—and almost all of that three percent is inaccessible for human use (Lean &Hinrichsen, 1994; Lefort, 1996). About three-quarters of all fresh water on earth is lockedaway in the form of ice caps and glaciers located in polar areas far from most humanhabitation. In all, only about 0.01 percent of the world’s total water supply is consideredavailable for human use on a regular basis. If the world’s freshwater supply amounted tothe contents of a bathtub, the amount easily accessible to humanity would fill a thimble.
Nevertheless, even this thimble full of water is, in theory, enough to sustain anestimated 20 billion people. But in reality, only a small amount of the freshwater supply isreliable enough to be considered accessible year after year. Globally, 505,000 cubickilometers of renewable fresh water shifts from the sea to the land every year as rain orsnow via the hydrological cycle; but only 47,000 cubic kilometers per year can be consideredaccessible for human use (Gleick, 2000).
Freshwater DistributionThe world’s available fresh water supply is also distributed extremely unevenly around
the globe. About three-quarters of global annual rainfall comes down in areas containingless than one-third of the world’s population. More than half the global runoff occurs inAsia (31 percent) and South America (25 percent). Runoff is defined as water originatingas precipitation on land that then runs off the land into rivers, streams, and lakes, eventuallyreaching the ocean, inland seas, or aquifers. That portion of the runoff that can be usedyear after year by human beings is known as stable runoff (Hinrichsen, Robey & Upadhyay,1998). While North America has the most fresh water available (at over 19,000 cubicmeters per capita as estimated in 1990), Asia has only 4,700 cubic meters of fresh waterper capita (Population Reference Bureau, 1998). This disparity is a function both ofdifferences in population density and available water resources.
About 80 percent of the world’s water runoff is concentrated in northern and equatorialzones, which have relatively small populations. The Amazon Basin alone, a vast regionwith less than 10 million people, accounts for 20 percent of the global average runoffeach year. In Africa, the Congo River and its tributaries account for 30 percent of theentire continent’s annual runoff; but the Congo’s area contains only 10 percent of Africa’spopulation. Even more dramatic water disparities hold at the country level—ranging from46,000 cubic meters per person in Brazil (much of it accounted for by the sparsely-

3Freshwater Crisis
populated Amazon River Basin) to only 75 cubic meters per person in Kuwait (Gardner-Outlaw & Engelman, 1997). There are also striking differences in water availability withincountries. In Mexico, for instance, less than 10 percent of the land area provides morethan half of the national rainwater runoff every year. Despite the fact that 90 percent ofMexico is chronically water-short and arid, its total per capita water availability in 1990was over 4,000 cubic meters. Such a figure is grossly misleading as a measure of actual
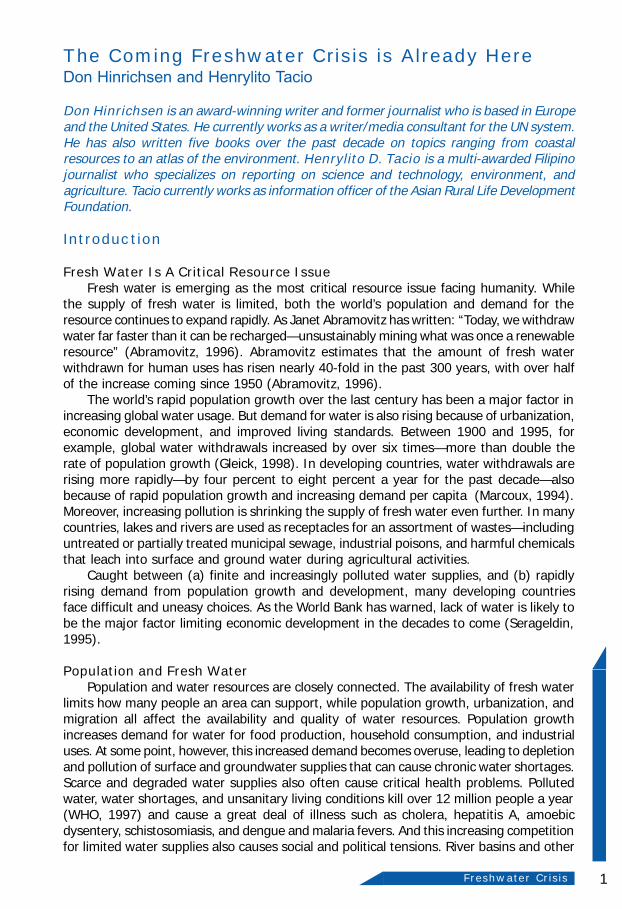
Map 1. The Philippines
Source: The Times Atlas of the World (1999)

4 Population and Water
water availability for most Mexicans.In addition, freshwater supplies throughout much of the developing world comes in
the form of seasonal rains. Because rains often run off too quickly for efficient use (asduring Asia’s monsoons), some developing countries can use no more than 20 percent oftheir potentially available water resources. India, for instance, gets 90 percent of itsrainfall during the summer monsoon season.
Altering Natural Supply SystemsDams. As water-short societies have done for centuries, many countries attempt (a)
to move water from where it occurs in nature to where people want it, and (b) to storewater for future use. Dams have emerged over the last 50 years as the major strategy forsuch alteration. There are some 40,000 dams worldwide that are higher than 15 meters.India, for example, has come to rely increasingly on dams and impoundments to meet itswater needs. By the year 2000, the Indian government had built over 4,000 large damsto store water from the monsoon season for use during the dry season (World Commissionon Dams, 2000). But although dams insure a steady water supply, they often imperilaquatic ecosystems by disrupting flood cycles, blocking river channels, and altering waterflows in rivers, floodplains, deltas, and other natural wetlands. In India, deforestation inwatersheds has caused massive siltation of water reservoirs and reduced the lifespan ofmany hydroelectric dams and irrigation schemes.
Desalination. Some countries have so little fresh water available that they mustresort to the costly conversion of sea water into fresh water. Without desalination, theArab states of the Persian Gulf could not support a number anywhere close to theircurrent populations. Without desalination, 40 Saudis would have to share the same amount
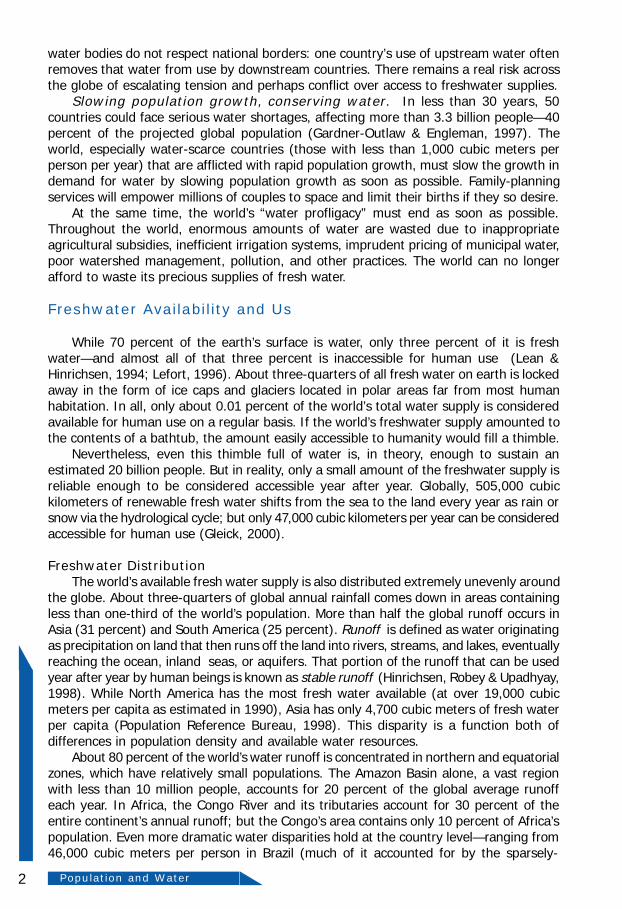
Figure 1. Links Between Population and Fresh Water
Population DynamicsGrowth - Migration - DensityDistribution - Urbanization
Morbidity - Mortality
Water UseAgriculture - Industry
Household UseSanitation & Waste Disposal
Hydroelectricity - Fish Farming
Human OutcomesFood Shortage - Water-related Illness
Social & Political InstabilityConflicts Over Water
Slowed Economic GrowthPopulation Displacement
Environmental OutcomesDepletion of Surface & GroundwaterWater Pollution - Land Degradation
Ecosystem DegradationDeclining Fisheries
Disruptions to the Hydrological Cycle
Source: IUCN et al. (1996)
5Freshwater Crisis
of water that is available to one Malaysian (about 14,000 cubic meters per year) (Gardner-Outlaw & Engelman, 1997). And Bahrain has virtually no fresh water at all; its populationdepends completely on desalination of seawater from the Gulf.
At present, desalination is far too expensive and impractical for widespread use.Despite falling prices—the costs of desalination are down to US$1.00-to-$1.60 per cubicmeter—the technology is highly energy intensive and beyond the reach of most poorwater-short countries, not to mention land-locked countries. Three oil-rich Arab states—Saudi Arabia, Kuwait, and the United Arab Emirates—accounted for close to half theworld’s 1993 desalination capacity (Gleick, 2000). These countries are, in effect, turningoil into water.
How Water is UsedPeople use water for agriculture, industry, and domestic (municipal) purposes. As
population grows, requirements for basic personal use rise proportionately. Rising livingstandards, which bring such amenities as running water to homes, dramatically increaseper capita water consumption. Increasing agricultural and industrial water consumptionalso reflects changing living standards. Agriculture dominates global water use, accountingfor 69 percent of all annual withdrawals. Industry accounts for about 23 percent, followedby municipal (domestic) consumption at 8 percent (Engelman & LeRoy, 1993; EuropeanSchoolbooks, 1994).
But global averages conceal important regional and national differences in the waywater is used. In Asia, for example, a higher percentage of water withdrawal (86 percent)goes for agriculture, while industry accounts for 8 percent and domestic use just 6 percent.(India uses 90 percent of all water withdrawals for agricultural purposes). In Africa, 88percent of water withdrawals go for agriculture, 7 percent for domestic purposes, and 5percent for industry. In contrast, most of Europe’s water use (54 percent) is for industry,while agriculture accounts for 33 percent and domestic use 13 percent (EuropeanSchoolbooks, 1994). As these regional statistics suggest, developing countries devotemost of their water supplies to agriculture.
A Future of Scarcity
Years of rapid population growth and increasing per capita consumption have squeezedthe world’s freshwater resources. As global population has grown to nearly 6.1 billiontoday (and continues to grow by about 78 million people each year), the demand for freshwater in some areas exceeds nature’s capacity to provide it. A growing number of countriesare expected to face water shortages in the near future—shortages that will be fueled byproblems both on the demand side (notably rapid population growth) and on the supply side(mainly inadequate water supplies and poor policies).
Declining Water Availability Per CapitaThere is no more water on earth now than there was 2,000 years ago, when the
population was less than 3 percent of its current size. Fresh water’s per capita availability,which has been falling for centuries, has been dropping more precipitously in recentyears as the globe’s population growth has exploded. Unsurprisingly, the availability offresh water has also fallen, from 17,000 cubic meters per person in 1950 to 7,044 cubicmeters in 2000 (World Resources, 2000). The supply of fresh water per capita is one-third lower now than it was as recently as 1970, a direct result of the nearly 2 billionpeople added to the planet since.
While population growth rates are slowing in most developing countries, absolutenumbers of people added each year remain near historic highs. As a result of projected
6 Population and Water
population growth, global per capita availability of fresh water is likely to be no more than5,100 cubic meters in the year 2025 (Gardner-Outlaw & Engelman, 1997). China andIndia, the world’s first and second most populous countries, respectively, provide examplesof how even modest population growth rates can translate into large absolute numbersbecause of an already-enormous population base. China’s population growth rate in 2000was only 0.9 percent—but, with China’s total population at over 1.2 billion, even this smallgrowth rate translates into an additional 12 million people each year. Similarly, India’spopulation growth rate of about 1.8 percent means that about 18 million people a yearwill be added to its current population of one billion. The world’s annual population growthof 78 million a year (as of 2000) implies an increased demand for fresh water on the orderof 64 billion cubic meters a year—an amount equivalent to the entire annual flow rate of theRhine River, assuming countries continue to withdraw water at current rates (Clarke, 1991).And, as noted above, rapid population growth not only makes it increasingly difficult toprovide adequate supplies of fresh water; it can also strain resources for proper sanitation,housing, health care, education, employment, and food supplies.
Rising Demand for Fresh WaterBut as rapid population growth shrinks per-capita water availability, per-capita water
demand is rising as countries develop economically. Global withdrawals of water havegrown dramatically because of factors such as (a) the growth of industrial uses, (b) risingdemand for domestic purposes, and (c) increasing reliance on irrigation to produce food.
As countries develop, water use soars. Consider the United States: while the averageAmerican in 1900 withdrew just 10 cubic meters of water a year for personal and householduse, that figure had jumped by 1994 to an average of over 200 cubic meters a year(European Schoolbooks, 1994). Why? A century ago, most Americans used well water orpublic standpipes. Running water was largely unavailable to households except in bigcities, while most people lived in rural areas. Today, of course, virtually every American—rural or urban—has running water.
But developing regions today still use far less water per capita than do developedregions. In Africa, for example, annual water withdrawals average only 17 cubic metersof water per capita; in Asia, the figure is 31 cubic meters (Clarke, 1991). Household usein developing countries is especially scarce. Water use by either developing-countryagriculture or developed-country households far exceeds household water use in manydeveloping countries—reflecting the difficulty many people have in obtaining clean waterfor personal use. Most people in developing countries get their water from a publicstandpipe, a community well, rivers and lakes, or rain collected from roof runoff. Runningwater is still a rare commodity in developing rural areas.
This pattern is changing dramatically, however, as developing countries becomepredominately urban and individual households gain access to piped water through citywater systems. As cities grow ever larger, their demand for water increases substantially.Such demand growth is putting tremendous pressure on urban water supply systems,most of which are totally inadequate to meet such demand.
Between 1950 and 1980, for instance, Latin American cities such as Bogota, MexicoCity, Sao Paulo, and Managua tripled and even quadrupled their populations. Some Africancities (such as Nairobi, Dar es Salaam, Lagos, and Kinshasa) grew sevenfold. This explosivegrowth, the result of a rural exodus, is making the world predominately urban. In the1990s, Third World cities have had to cope with around 60 million new arrivals every year(UNCHS, 2001).
7Freshwater Crisis
The Era of Water ShortagesHydrologists consider a country to be under water stress when its annual water supplies
drop to between 1,000 and 1,700 cubic meters per person. In turn, countries face waterscarcity when their annual water supplies drop below 1,000 cubic meters per person. Oncea country enters the water-scarce category, it faces severe constraints on food production,economic development, and protection of natural ecosystems.
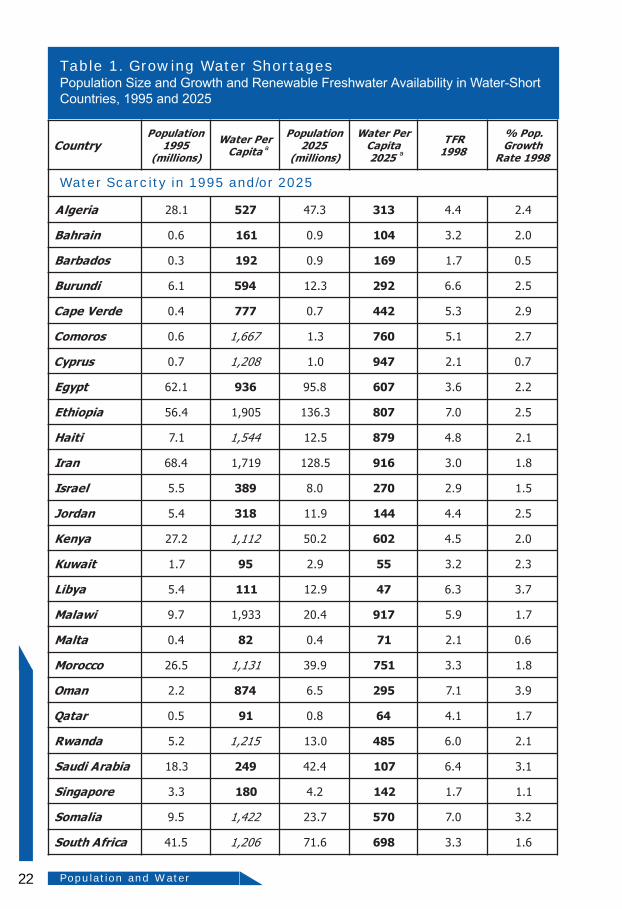
More and more countries are facing water stress and scarcity as their populationsgrow, urbanization accelerates, and water consumption increases. Thirty-one countries(with a combined population of close to half a billion) faced water stress or scarcity as of1995. The number of people estimated to live in water-short countries increased bynearly 125 million between 1990 and 1995 (see Table 1).
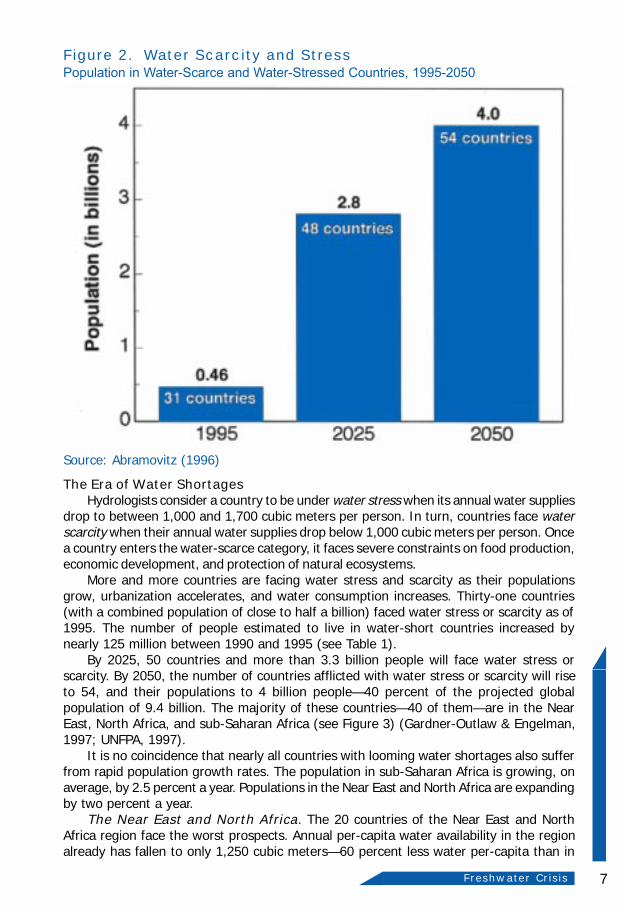
By 2025, 50 countries and more than 3.3 billion people will face water stress orscarcity. By 2050, the number of countries afflicted with water stress or scarcity will riseto 54, and their populations to 4 billion people—40 percent of the projected globalpopulation of 9.4 billion. The majority of these countries—40 of them—are in the NearEast, North Africa, and sub-Saharan Africa (see Figure 3) (Gardner-Outlaw & Engelman,1997; UNFPA, 1997).
It is no coincidence that nearly all countries with looming water shortages also sufferfrom rapid population growth rates. The population in sub-Saharan Africa is growing, onaverage, by 2.5 percent a year. Populations in the Near East and North Africa are expandingby two percent a year.
The Near East and North Africa. The 20 countries of the Near East and NorthAfrica region face the worst prospects. Annual per-capita water availability in the regionalready has fallen to only 1,250 cubic meters—60 percent less water per-capita than in
Figure 2. Water Scarcity and StressPopulation in Water-Scarce and Water-Stressed Countries, 1995-2050
Source: Abramovitz (1996)
8 Population and Water
1960. By 2025, per-capita supplies in this region are projected to fall almost 50 percent to650 cubic meters (Gardner-Outlaw & Engelman, 1997).
According to Tony Allan of the University of London, in 1972 the entire Near East “ran outof water” (i.e., the region was using more water than could be replenished every year fromrainfall, in effect mining its aquifers down). At the time, the region’s total population was only122 million (Mitchell, 1998). Since then, the Near East has continued to withdraw more waterfrom its rivers and aquifers every year than it replenishes (Mitchell, 1998). Jordan and Yemencurrently withdraw 30 percent more water from ground water aquifers every year than theyreplenish. Israel’s annual water use already exceeds its renewable supply by 15 percent, orsome 300 million cubic meters. And Saudi Arabia represents one of the worst cases ofunsustainable water use in the world. This extremely arid country, squeezed between the RedSea and the Arabian Gulf, now mines a non-renewable resource (fossil ground water) forthree-quarters of its water needs. It takes tens of thousands of years for these deep aquifersto replenish themselves, while ground water depletion currently averages around 5.2 billioncubic meters a year and is expected to keep on increasing well into this century.
Nine out of 14 countries in the Near East also already confront water scarcity, making theNear East the most water-short region in the world. Worse, populations in six Near Easterncountries are expected to double within two decades. Water is one of the major political issuesconfronting the region’s leaders. Since virtually all rivers in the Near East are shared by severalnations, current tensions over water rights could escalate into outright conflicts.
Sub-Saharan Africa. Much of Africa also faces serious water constraints. In 2000,250 million people in Africa were living in water-stressed countries—150 million of themin water-scarce countries. And because of rapid population growth, this problem willworsen over the next two decades. By the year 2025, as many as 1.1 billion people—two-thirds of the region’s projected population—will live under conditions of water scarcity(Falkenmark, 1994).
Southeast Asia. In densely populated Asia, home to 60 percent of the world’speople, water resources are in critical shape—especially in Southeast Asia. As elsewhere,
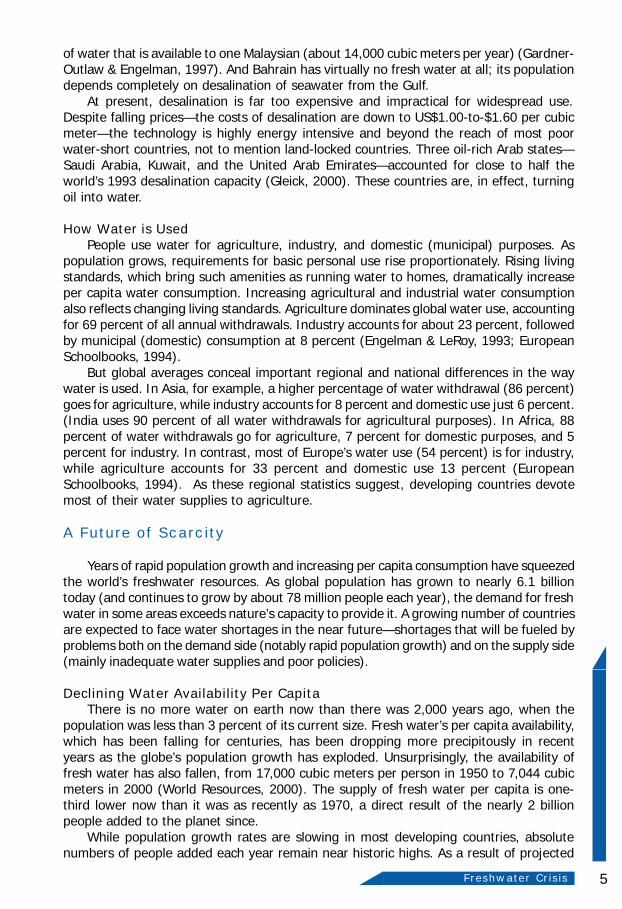
Source: Abramovitz (1996)
Figure 3. Rising Water UseGlobal Annual Water Withdrawal by Sector, 1900-2000

9Freshwater Crisis
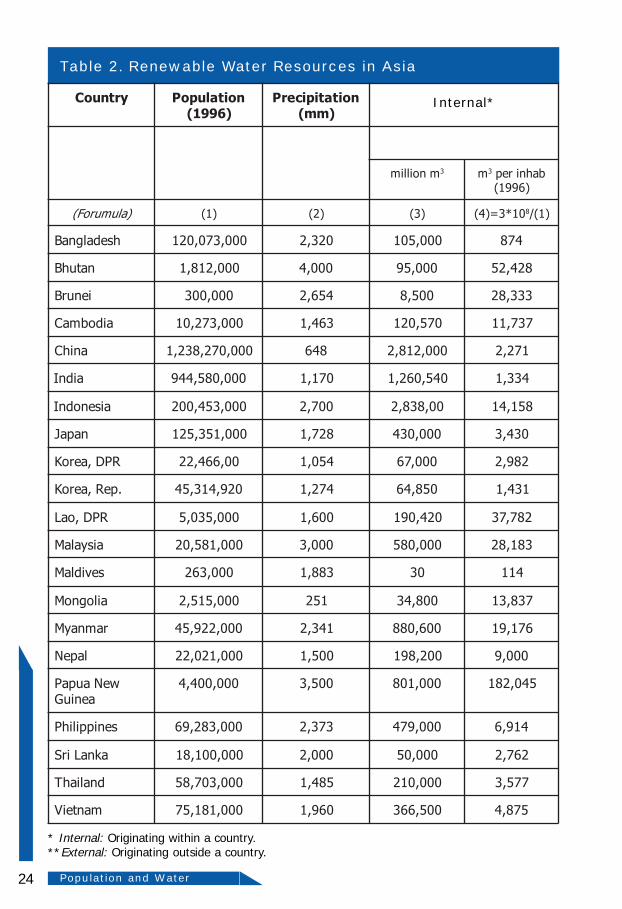
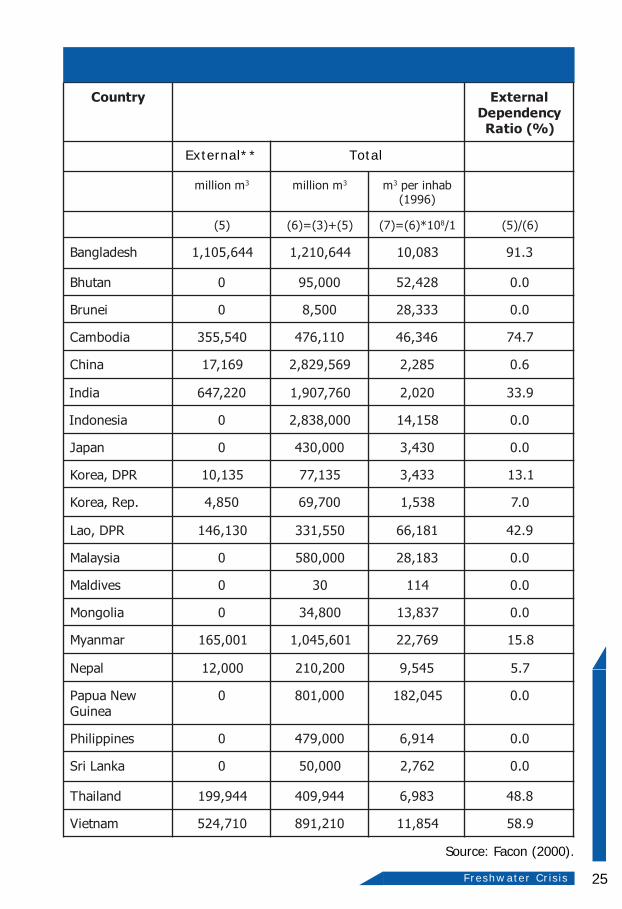
the booming population has intensified water usage. In Vietnam, for instance, increasingpopulation has reduced per capita water volume: from 14,520 cubic meters in 1945 toonly 4,840 cubic meters in 2000. Experts contend that, although Asia is relatively well-endowed with water resources, many of the continent’s countries will in the near futureexperience water shortages for all or part of the year (Asian Development Bank, 1999).Currently, Asia’s per capita water resources are only slightly above half the world’s aver-age. In terms of water resources per person, the groups of the Indian subcontinent,Eastern Asia, and the Far East have the lowest figures, while Southeast Asia has muchmore water per person than the world average (see Table 2) (Facon, 2000).
But total water availability is a grossly misleading statistic, and some Asian countriesare already feeling the thirst. In Malaysia, for instance, rapid population growth and abetter standard of living over the last three decades have resulted in a heavy demand forwater (Malaysian Water Partnership, 2000). The problem of population growth is feltparticularly in urban areas because of rural-urban migration and the rapid urbanization ofsurrounding countrysides. The exponential growth in the world’s urban population hasstretched many governments’ ability to provide the infrastructure and service needs aswell as the necessary environmental conditions for a better living.
The Kuala Lumpur-based Malaysian Water Partnership asserts that the increaseddemand for a limited and diminishing supply of clean water in Malaysia has led to compe-tition for water there—and that the country’s continued economic growth will magnifythis problem even more acutely (Malaysian Water Partnership, 2000). In addition, as thereadily-available portion of Malaysia’s water resources has already been developed foruse in practically all regions of the country experiencing high-water demand, future wa-ter-resources development there will require the construction of more storage dams.Such dams are costly, both financially and environmentally.
This recent development worries Singapore, which imports water from neighboringcountries (particularly Malaysia). Since attaining its independence in 1963, Singapore hasseen its water consumption increased 10-fold. The Philippines is also a major consumerof water (see Box 1). Faucet water flows from the Philippine city of Cebu average 19hours daily, and Metro Manila average 17—high numbers compared with six hours inIndonesia’s Bandung or New Dehli’s mere four hours. Region-wide, the average number ofhours of water supplied per day is only 11.4 hours.
In Asia as a whole, competition among water users is also increasing. Almost 84 per-cent of the water withdrawal in the region is used for agricultural purposes, compared to71 percent for the world. The Indian subcontinent (92 percent) and Eastern Asia (77percent) have the world’s highest level of regional water withdrawal for agriculture (WorldResources Report, 1998). The two regions together represent about 82 percent of thetotal irrigated area in Asia.
More and more water is demanded from all sectors. In Malaysia, for instance, theannual water demand for the domestic and industrial sectors has been expanding at therate of 12 percent due to the rapid population increase and the rapid growth of indus-tries. By 2020, the domestic and industrial sectors are expected to be the main waterusers in the country (Malaysian Water Partnership, 2000). This is also true in Thailand,the Philippines, and other Asian countries.
As noted above, global water demand is increasing for various reasons such as popu-lation growth and expansion of industrial and municipal services. At the same time, inrecent years, many areas face water shortage for some economic activities (especiallyagriculture) as well as domestic water during their dry season.
Water problems within countries. Regions and states of many large countries(such as India, China, and the United States) could also join the water-stressed category.Already, 19 major Indian cities face chronic water shortages, and India as a whole is

10 Population and Water
expected to enter the water-stressed category by 2030 (Gardner-Outlaw & Engelman, 1997).China, which has 22 percent of the world’s population but only seven percent of all freshwaterrunoff, will be just above the 1,700 cubic meters per capita line that designates “water-stress.” And United States groundwater reserves are also being depleted in many areas.According to researchers David and Marcia Pimentel, the United States’ “mammothgroundwater aquifers are being mined at an alarming rate” (Pimentel et al., 1997). Theamount of ground water withdrawn in the United States is currently 25 percent greater thanits replenishment rate. The western half of the country is depleting groundwater aquifers ateven faster rates in some areas (such as parts of the huge Ogalalla aquifer that lies underparts of six states).
Box 1. Water Crisis: The Case of the Philippines
The Philippines is a country where diarrhea remains a leading killer of children,where water-borne diseases are more common than sanitary toilets, and where
farmers cannot water their own crops. Experts prescribed one possible solution tothese problems: access to potable water for all 80 million residents of the country. Ifthe Philippine government could only supply its population with sufficient and cleanwater, it could trigger a chain reaction of major successes in improving the country’shealth and well-being (Gorecho, 1998, p. 21).
But the stark reality is that clean and accessible water remains an elusive com-modity for the Philippines. In the 1950s, according to Dr. Rafael D. Guerrero III,executive director of the Philippine Council for Aquatic and Marine Research andDevelopment, the Philippines had as much as 9,600 cubic meters of clean water perperson. Four decades later, the citizens must make do with little more than a third ofthat volume—3,300 cubic meters of water per capita (Rafael Guerrero, personalcommunication, 2000). “The image of a water-rich Philippines is a mirage,” declaresGregory C. Ira, former head of the Water Equity in the Lifescape and LandscapeStudy (WELLS) of the International Institute of Rural Reconstruction (Gregory C. Ira,personal communication, 2000). “There is a water crisis in the Philippines, one of thewettest countries of Southeast Asia.”
The water crisis is more transparent in metro Manila, home to more than 10million people. Residents of the middle-class Better Living Subdivision on the south-ern flank of the metropolis consider themselves lucky to have water from the Metro-politan Waterworks and Sewerage System (MWSS), touted as the “first modern watersystem in Asia.” No matter that the water flows from their faucets for just a fewhours per day, and only every other day (Maniquis, 1996). Up until the mid-1980s,residents had to make do with water from pump wells and delivery services. Thewater still had to be boiled for drinking. Residents often drove to work with cartrunks full of water containers to be filled.
For people in the lower-income neighborhoods around the subdivision who donot have service from MWSS, pushcart vendors are still the main source of water.And they pay the vendors much more for water than their neighbors in Better Livingpay for water from the faucet. The situation is even worse in Manila’s poor Tondodistrict, where residents in one area have to take a boat ride just to get water(Maniquis, 1996).
For poor people in Manila, the price of water is exorbitant. For example, watercosts the family of Winnie Madera, a resident of Cainta, Metro Manila, US$20 permonth—or 7 percent of the couple’s total income of US$300 (Asian DevelopmentBank, 1999). Madera used to pay US$12.50 per month for a metered piped supply
11Freshwater Crisis
from a deep tubewell operated by a private contractor. However, the supply was onlyfor one hour twice a day. She paid another US$7.50 per month for drinking waterpurchased by the container from another contractor. The source was purported to befrom the concessionaire’s piped supply. In 1999, however, there was trouble withboth sources of water at the same time. The deep tubewell closed down due to pumpproblems. Diarrhea and typhoid broke out in Madera’s neighborhood, and one of hersons had to be hospitalized.
In areas where water still springs in the Philippines, that water is often pollutedand contaminated. The country’s water is supplied by rainfall along with rivers, lakes,springs, and groundwater. But changing weather patterns worldwide have affectedthe Philippines as well: rainfall is growing scarcer, and what falls is collected or wastedin watersheds with balding forests. As a result, there has been a dramatic drop offrom 30 to 50 percent in the country’s available stable water resources in the pastthree decades (Rafael Guerrero, personal communication, 2000).
A recent report released by the Philippines Department of Environment and NaturalResources (DENR) said that 90 percent of the 99 watershed areas in the country are“hydrologically critical”(Langit, 1996) due to their degraded physical condition. Mas-sive destruction of the once-productive forested watersheds by illegal loggers anduncontrolled land use from mining, overgrazing, agricultural expansion, and industri-alization have contributed to water depletion (Environmental Management Bureau,1996).
Worse, excessive soil erosion is hastening the destruction of watershed areas.The DENR report stated that 36 of the country’s 75 provinces are severely affected bysoil erosion. Two provinces—Cebu and Batangas—have lost more than 80 percent oftheir topsoil to erosion. In Luzon, the four major basins (Bicol, Magat, Pampanga,and Agno) are in critical condition due to acute soil erosion and sedimentation (PublicAffairs Staff, Manila Department of Environment and Natural Resources, personalcommunication, 1998).
River pollution also contributes to the country’s current water problem. AnotherDENR report classifies 37 of the 418 rivers in the Philippines as polluted, while therest are slightly polluted. Eleven rivers are considered “biologically dead.” Fifty-twopercent of the country’s water pollution load is attributable to domestic wastes, whileindustry accounts for 48 percent.
There is more bad news. Water levels in the Philippines’ major freshwater sourceshave been dropping at the rate of 50 percent over the past 20 years. Excessivepumping of ground water has caused water depletion and consequent decline inwater levels (Tacio, 1994). In less than 20 years, water levels in wells have droppedfrom an average of 20 meters below land surface to more than 120 meters in someareas, particularly in the industrialized areas of Paranaque and Taguig (both in metroManila). As a result, wells that used to yield one to two cubic meters per minute cannow barely produce more than 0.3 cubic meters per minute.
The problem confronting the country’s water supply will also dry up agriculture,which accounts for 86 percent of the country’s total water use. During the 1997-1998El Nino climate phenomenon, water ordinarily used to irrigate farmlands in Candaba,Pampanga was diverted for household use, resulting in the destruction of 17,000hectares of rice land.
The forthcoming water crisis in the Philippines will likewise cause industry togrind to a halt. Commercial and industrial users consume up to eight percent of the
(continued on page 12)
12 Population and Water
Competition for Scarce Water SuppliesIn developed and developing countries alike, fierce competition among water users is
rising as people demand more and more from limited water resources. Tensions areparticularly severe in places that face population pressures, rapid urbanization, and urgentdevelopment needs.
A number of developed, water-short countries—including Belgium, the United Kingdom,Poland, and Singapore—have faced tensions over water. The western United States haswitnessed tension between (a) farmers with irrigation needs, and (b) urban areas withmunicipal demands. San Diego, California is a classic case, but the city negotiated alandmark deal with vegetable growers in the Imperial Valley. The farmers now conservewater and sell the surplus to the city (Purdum, 1997).
China is already practising what many water experts call the “zero-sum game” ofwater management. The zero sum game—when authorities increase water supply to oneuser by taking it away from another—involves both competing areas and competingtypes of use, as when cities compete with farmers or when human needs compete withthose of ecosystems. China’s freshwater supplies have been estimated to be capable ofsupporting 650 million people sustainably—only half of the country’s current population of
national water supply. Only the balance of six percent remains for domestic or mu-nicipal use. But that relatively smaller portion carries with it heavier implications forthe country’s health (Department of Environment and Natural Resources, 1998).
Currently, only 63 percent of the country’s total population has access to safewater. Almost 30 percent of households in the Philippines do not have sanitary toilets.This gives rise to a host of health problems, from waterborne diseases to the persis-tence of diarrhea as a leading killer of children in the country (Environmental Man-agement Bureau, 1996). In November 2000, 1,500 people were brought to overflow-ing hospitals and clinics in Zamboanga City after drinking water contaminated withrota virus and E. coli. Two children were reported dead (Agence France Presse, 2000).
What is the government of the Philippines doing to solve the problem of watershortage? In 1974, it created the National Water Resources Board (NWRB), an au-thoritative national organization that coordinates and integrates all activities in waterresources development and management. It has also passed several water laws andregulations and created various organizations to oversee particular bodies of waterlike the Laguna Lake Development Authority (LLDA) and the Agno River Basin Devel-opment Commission. Likewise, the government foresees that, by 2025, “water ofsufficient quantity and acceptable quality are in place for all stakeholders with provi-sions for water-related disasters so as to meet present and future needs” (NationalWater Resources Board, 2000, page 12). During the national consultation on water-sector mapping and visioning, participants forwarded this vision: “By the year 2025,water resources in the Philippines are being used efficiently, allocated equitably andmanaged sustainably” (National Water Resources Board, 2000, page 12).
Meanwhile, at the home of Rosa Andal in the poverty-stricken Sapu Masla villagein the southern part of Mindanao, there is no water: the tap has long been dry. Shemust get up in the dark of night and, laden with plastic pails, walk for three kilome-ters to fetch water from a river. “Nobody does anything,” Andal laments. “Politicianscome, make promises, take votes and go. What else can the government claim to dowhen it cannot even provide a glass of clean drinking water for my children?” (RosaAndal, personal communication, 2000)
(continued from page 11)

13Freshwater Crisis
1.2 billion (Qu Geping, personal communication, 1993). Across northern and central Chinasome 300 major cities, including Beijing, face critical shortages. There is simply not enoughwater to meet the competing needs of the country’s cities, industries, and agriculture.China has depleted underground aquifers and dammed, diverted, and drained surface waters.The water table under China’s capital has dropped by roughly two meters a year for the lastdecade. One-third of the wells dried up because the pipes no longer reach the shrinkingaquifer (Brown & Halweil, 1998). As the influx of China’s rural farm workers seeking urbanjobs grows ever larger, Beijing’s water shortages are expected to worsen. The governmentis planning a huge aqueduct that will ferry water from the Danjiangkou Reservoir in HenanProvince to Beijing, across 1,300 kilometers of heavily farmed agricultural land—land thatalso needs the water for food production.
China’s Yellow River is a classic case of the zero-sum game in operation. The river isso over-subscribed that, for an average of 70 days a year for the past decade, its watershave dried up before reaching the Bohai Sea. In 1995, this dry period lasted for 122 days.In May 1996, one of the few years when farming villages near the river’s mouth couldtake water to feed their crops, the government told them not to touch a drop. Instead, allof the water went to a state-owned oil field further downstream, bypassing hundreds ofparched farms and factories along a 400- kilometer stretch of the river (Tyler, 1996).
India faces similar strains over water. In the last few years, India’s states havebecome embroiled in disputes over water rights and dams that might provide more waterfor one state at the expense of another. According to Mohan Katarki, a lawyer whorepresented the Indian state of Karnataka in a dispute with its neighboring state AndhraPradesh: “Water disputes, if not attended to, will become a major headache for thestability of Indian society” (Patel, 1997, p. 12). Karnataka and Andhra Pradesh are arguingin court over the height of a dam on the Krishna River. Andhra Pradesh, which liesdownstream of the dam, claims that the dam’s top five meters could rob it of water thatit is entitled to under a 1976 water tribunal decision. Karnataka counters that the extraheight will be used for generating power, not for irrigation (Patel, 1997).
Regional tensions. Regional tensions over limited water supplies are an emergingissue in nearly all water-short areas. For example, 54 of Africa’s rivers are shared by twoor more countries, and the region has one-third of the world’s major international riverbasins. The Nile, Zambezi, Niger, and Volta River Basins all have the potential to igniteserious disputes.
The Aral Sea Basin is already beset by mounting international tensions over limitedsupplies of water. Turkmenistan, Uzbekistan, Kazakstan, Kyrgyzstan, and Tajikistan dependon the waters of the Amu Darya and Syr Darya Rivers for their very survival. But thesecountries find themselves increasingly at odds over the division of the rivers’ waters. Thewater demands of all five nations are sparking disputes. Kyrgyz and Uzbeks disagree overwater and land in the fertile Fergana Valley, while Kyrgyz and Tajiks argue over theallocation of irrigation water from the Syr Darya. In addition, Turkmens and Uzbeks cannotagree on the distribution of irrigation and drainage water from the Amu Darya (Postel,1996b). Worse, in most years neither the Syr Darya nor the Amu Darya reaches the AralSea. The flow of both rivers, wholly diverted to feed water-intensive crops such as cottonand rice, now disappears in the desert about 100 kilometers from their former deltas.
Many other rivers are also becoming flash points for interstate disputes. The ColoradoRiver, which flows through the southwestern United States and fed the explosive growthof Phoenix and other southwestern desert cities, is now so depleted from constantlyescalating irrigation and urban demands that its waters no longer reach the Gulf ofCalifornia. Instead, it trickles out somewhere in the desert south of the U.S.-Mexicanborder, and is now a constant source of bickering between the United States and itsdownstream neighbor (Postel, 1996b).
14 Population and Water
Ecosystems and Pollution
In 1996, the world’s human population used an estimated 54 percent of all the freshwater contained in rivers, lakes, and aquifers (Postel et al., 1996). This percentage isconservatively projected (merely using population growth estimates) to climb to at least70 percent by 2025. The figure will be more if per capita consumption continues to rise(Postel et al., 1996). By the year 2025, when the world is expected to have about eightbillion people, more than 70 percent of all accessible fresh water could be used by humanity(Postel et al., 1996).
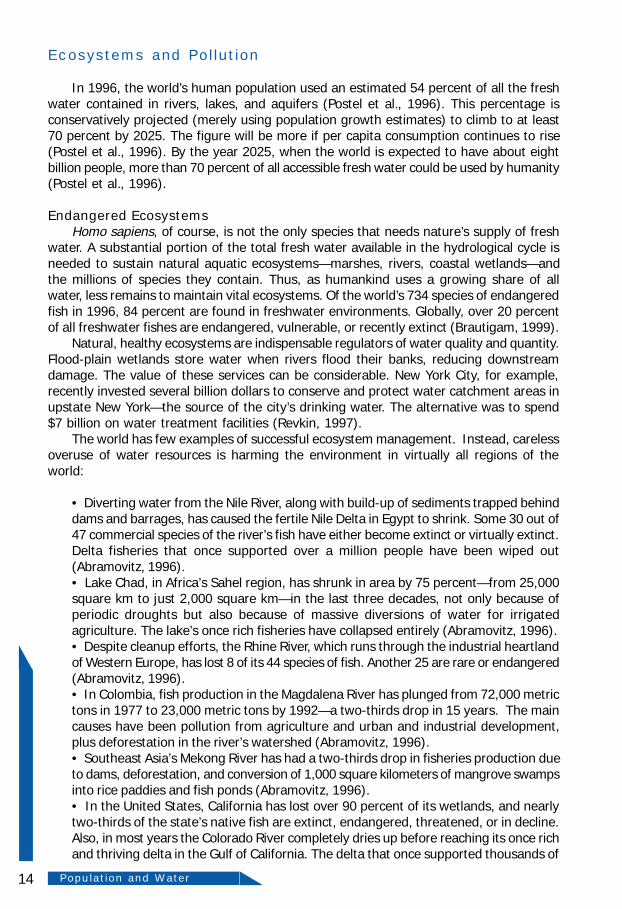
Endangered EcosystemsHomo sapiens, of course, is not the only species that needs nature’s supply of fresh
water. A substantial portion of the total fresh water available in the hydrological cycle isneeded to sustain natural aquatic ecosystems—marshes, rivers, coastal wetlands—andthe millions of species they contain. Thus, as humankind uses a growing share of allwater, less remains to maintain vital ecosystems. Of the world’s 734 species of endangeredfish in 1996, 84 percent are found in freshwater environments. Globally, over 20 percentof all freshwater fishes are endangered, vulnerable, or recently extinct (Brautigam, 1999).
Natural, healthy ecosystems are indispensable regulators of water quality and quantity.Flood-plain wetlands store water when rivers flood their banks, reducing downstreamdamage. The value of these services can be considerable. New York City, for example,recently invested several billion dollars to conserve and protect water catchment areas inupstate New York—the source of the city’s drinking water. The alternative was to spend$7 billion on water treatment facilities (Revkin, 1997).
The world has few examples of successful ecosystem management. Instead, carelessoveruse of water resources is harming the environment in virtually all regions of theworld:
• Diverting water from the Nile River, along with build-up of sediments trapped behinddams and barrages, has caused the fertile Nile Delta in Egypt to shrink. Some 30 out of47 commercial species of the river’s fish have either become extinct or virtually extinct.Delta fisheries that once supported over a million people have been wiped out(Abramovitz, 1996).• Lake Chad, in Africa’s Sahel region, has shrunk in area by 75 percent—from 25,000square km to just 2,000 square km—in the last three decades, not only because ofperiodic droughts but also because of massive diversions of water for irrigatedagriculture. The lake’s once rich fisheries have collapsed entirely (Abramovitz, 1996).• Despite cleanup efforts, the Rhine River, which runs through the industrial heartlandof Western Europe, has lost 8 of its 44 species of fish. Another 25 are rare or endangered(Abramovitz, 1996).• In Colombia, fish production in the Magdalena River has plunged from 72,000 metrictons in 1977 to 23,000 metric tons by 1992—a two-thirds drop in 15 years. The maincauses have been pollution from agriculture and urban and industrial development,plus deforestation in the river’s watershed (Abramovitz, 1996).• Southeast Asia’s Mekong River has had a two-thirds drop in fisheries production dueto dams, deforestation, and conversion of 1,000 square kilometers of mangrove swampsinto rice paddies and fish ponds (Abramovitz, 1996).• In the United States, California has lost over 90 percent of its wetlands, and nearlytwo-thirds of the state’s native fish are extinct, endangered, threatened, or in decline.Also, in most years the Colorado River completely dries up before reaching its once richand thriving delta in the Gulf of California. The delta that once supported thousands of
15Freshwater Crisis
wetland species of plants and animals is now desiccated and dead (Postel, 1997).
Water PollutionWater pollution has become a major problem for both developed and developing
countries. When coupled with the enormous quantities of water withdrawn for humanuse, water pollution has reduced the capacity of waterways to assimilate or flush pollutantsfrom the hydrological system.
Water engineers like to say that “the solution to pollution is dilution.” In today’s worldof mounting pollution, this saying has taken on new and frightening connotations. Roughly450 cubic km of wastewater are discharged globally into rivers, streams, and lakes everyyear. Another 6,000 cubic km of clean water are needed to dilute and transport this dirtywater before it can be used again (Shiklomanov, 1997). This amount equals about two-thirds of the world’s total available runoff. Hydrologist M. I. L’Vovich has estimated that,if current trends continue, the world’s entire stable river flow would soon be needed forpollutant transport and dilution (FAO, 1990).
Industrialized countries. Industrialized countries in Europe and North Americaface enormous water pollution problems. Over 90 percent of Europe’s rivers have elevatednitrate concentrations, mostly from agrochemicals; and five percent have concentrations200 times greater than background levels found in unpolluted rivers (WHO, 1992). Overhalf of Europe’s lakes are eutrophied, the result of a glut of nutrients from agriculture andmunicipalities (WHO, 1992). Excess nutrients stimulate the growth of algae, which robthe water of oxygen when they die and decay. This process—known as eutrophication—has become one of the most serious problems affecting freshwater and near-shore marineenvironments.
Groundwater pollution in Europe is also worsening. Within 50 years, some 60,000square km of groundwater aquifers in Western and Central Europe are likely to becontaminated with poisons from pesticides and fertilizers (Niemczynowicz, 1996). OfHungary’s 1,600 well-fields tapping groundwater, 600 of them are contaminated, mostlywith agricultural chemicals (Havas-Szilagyi, 1998). In the Czech Republic, 70 percent ofall surface waters are heavily polluted, mostly with municipal and industrial wastes (Nash,1993). A full 30 percent of the country’s rivers are so fouled with pollutants that they canno longer sustain fish. And in the United States, 40 percent of all surface waters are unfitfor bathing or fishing, while 48 percent of all lakes are eutrophied (EPA, 1994; WHO,1997).
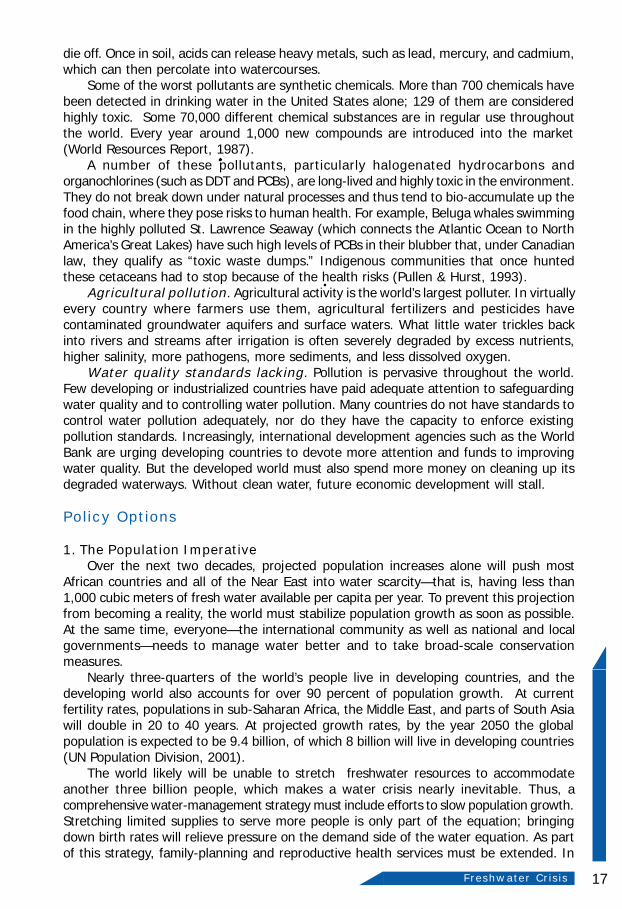
Developing countries. Pollution is a vexing problem wherever populations aregrowing rapidly, development demands are great, and governments cannot afford toinvest in proper sanitation and waste treatment facilities. In developing countries onaverage, 90 to 95 percent of all domestic sewage and 75 percent of all industrial waste onaverage is discharged into surface waters without any treatment whatsoever (Carty,1991).
Consider the following examples:
• All of India’s 14 major rivers are badly polluted. Together they transport 50 millioncubic meters of untreated sewage into India’s coastal waters every year. India’s capital,New Delhi, dumps 200 million liters of raw sewage and 20 million liters of industrialwastes into the Yamuna River every day as it passes through the city on its way tothe Ganges (Harrison, 1992).• Thailand and Malaysia have such heavy water pollution that their rivers often contain30 to 100 times more pathogens, heavy metals, and poisons from industry andagriculture than government standards permit (Niemczynowicz, 1996).• Fully 80 percent of China’s 50,000 km of major rivers are so filled with pollution and

16 Population and Water
sediment that they can no longer support fish life. In 1992, China’s industries discharged36 billion metric tons of untreated or partially treated effluents into rivers, streams,and coastal waters. In 1986, sections of the Liao River, which flows through a heavilyindustrialized part of northern China, died as a result of the over one billion tons ofindustrial wastes dumped into it. Nearly every aquatic organism within one hundredkm died (Hinrichsen, 1998).• The Tiete River, which passes through Greater Sao Paulo, Brazil, receives 300 metrictons of untreated effluents from 1,200 industries every day. The river contains highconcentrations of heavy metals, such as lead and cadmium. The city also dumpssome 1,000 metric tons of sewage a day into its waters. Only 12 percent of thesewage receives any treatment (WHO, 1992).• The Tunjuelito River, a tributary of the Bogota River, is nearly biologically dead fromall the industrial wastes from tanneries and petrochemical industries flushed into it asit passes through Bogota, Colombia.
Industrial and municipal pollutants. Recent decades have seen an enormousincrease in pollution of many kinds from industry and municipalities. Industrial pollutants(such as wastes from chemical plants) are often dumped directly into waterways. Oilsand salts are washed off city streets, while others (such as heavy metals andorganochlorines) are leached from municipal and industrial dumpsites.
Secondary pollutants such as sulfur dioxide and oxides of nitrogen combine in theatmosphere to form acid rain, with pervasive effects on both freshwater and terrestrialecosystems. Acid rain lowers the pH of rivers and streams. Unless buffered by calcium(i.e., limestone), acidified waters cause many acid-sensitive fish, like salmon and trout, to
In developing countries on average, 90-95 percent of all domestic sewage and 75 percent ofall industrial waste is discharged into surface waters without any treatment whatsoever.
17Freshwater Crisis
die off. Once in soil, acids can release heavy metals, such as lead, mercury, and cadmium,which can then percolate into watercourses.
Some of the worst pollutants are synthetic chemicals. More than 700 chemicals havebeen detected in drinking water in the United States alone; 129 of them are consideredhighly toxic. Some 70,000 different chemical substances are in regular use throughoutthe world. Every year around 1,000 new compounds are introduced into the market(World Resources Report, 1987).
A number of these pollutants, particularly halogenated hydrocarbons andorganochlorines (such as DDT and PCBs), are long-lived and highly toxic in the environment.They do not break down under natural processes and thus tend to bio-accumulate up thefood chain, where they pose risks to human health. For example, Beluga whales swimmingin the highly polluted St. Lawrence Seaway (which connects the Atlantic Ocean to NorthAmerica’s Great Lakes) have such high levels of PCBs in their blubber that, under Canadianlaw, they qualify as “toxic waste dumps.” Indigenous communities that once huntedthese cetaceans had to stop because of the health risks (Pullen & Hurst, 1993).
Agricultural pollution. Agricultural activity is the world’s largest polluter. In virtuallyevery country where farmers use them, agricultural fertilizers and pesticides havecontaminated groundwater aquifers and surface waters. What little water trickles backinto rivers and streams after irrigation is often severely degraded by excess nutrients,higher salinity, more pathogens, more sediments, and less dissolved oxygen.
Water quality standards lacking. Pollution is pervasive throughout the world.Few developing or industrialized countries have paid adequate attention to safeguardingwater quality and to controlling water pollution. Many countries do not have standards tocontrol water pollution adequately, nor do they have the capacity to enforce existingpollution standards. Increasingly, international development agencies such as the WorldBank are urging developing countries to devote more attention and funds to improvingwater quality. But the developed world must also spend more money on cleaning up itsdegraded waterways. Without clean water, future economic development will stall.
Policy Options
1. The Population ImperativeOver the next two decades, projected population increases alone will push most
African countries and all of the Near East into water scarcity—that is, having less than1,000 cubic meters of fresh water available per capita per year. To prevent this projectionfrom becoming a reality, the world must stabilize population growth as soon as possible.At the same time, everyone—the international community as well as national and localgovernments—needs to manage water better and to take broad-scale conservationmeasures.
Nearly three-quarters of the world’s people live in developing countries, and thedeveloping world also accounts for over 90 percent of population growth. At currentfertility rates, populations in sub-Saharan Africa, the Middle East, and parts of South Asiawill double in 20 to 40 years. At projected growth rates, by the year 2050 the globalpopulation is expected to be 9.4 billion, of which 8 billion will live in developing countries(UN Population Division, 2001).
The world likely will be unable to stretch freshwater resources to accommodateanother three billion people, which makes a water crisis nearly inevitable. Thus, acomprehensive water-management strategy must include efforts to slow population growth.Stretching limited supplies to serve more people is only part of the equation; bringingdown birth rates will relieve pressure on the demand side of the water equation. As partof this strategy, family-planning and reproductive health services must be extended. In
18 Population and Water
the developing world, at least 100 million married women (and millions more unmarriedwomen) who want to plan, limit, or space their births do not currently use contraception.This unmet need would account for about one-third of the projected population increasein developing countries over the next half century. Thus, providing family-planning servicesto these women should be an urgent concern.
Providing better reproductive health care will also help improve people’s ability tomanage limited supplies of water. Studies have found that a person’s ability to managenatural resources, particularly water and land, depends in part on his or her level ofeducation and overall health status (Robey et al., 1992).
In much of the developing world, where piped water is unavailable, women andfemale children usually have the job of fetching water. UNICEF estimates that they spend40 billion hours a year fetching water, which often requires walking half a kilometer ormore to the nearest source of fresh water (UNICEF, 1997). Giving women more choicesabout childbearing, improving education, and providing opportunities to participate indevelopment conveys many benefits, including improved household hygiene. But no amountof education can compensate for lack of adequate clean water supplies.
2. The Need For New PoliciesWithout better policies for managing scarce water resources, the prospect of conflict
becomes greater. As Swedish hydrologist Malin Falkenmark has admonished: “We haveto stop living as if we had unlimited water supplies and start recognizing that we mustdeal with serious water constraints” (Falkenmark, 1991). In Falkenmark’s view, the relevantquestion to ask about water is not how much water do we need and from where do weget it, but rather how much water there is and how can we best benefit from it.
Ismail Serageldin, vice president for environmentally sustainable development at theWorld Bank, cites four principal policy failures underscoring the world’s general inabilityto manage water supplies sustainably (Serageldin, 1995):
• First, water management is “fragmented among sectors and institutions.”Governments make few efforts to develop an integrated response to watermanagement. Instead, too many ministries and agencies continue to hold their fingerson the tap, with no one coordinating sectoral water policies. Worse, issues of waterquality and health often go unaddressed since they do not fall within the mandate ofany one government entity.• Second, there is a “heavy dependence on centralized administration to develop,operate and maintain water systems.” In many countries, agencies charged withmanaging water supplies are often overextended and lack the technical competenceneeded for the tasks confronting them. At the same time, governments do not involvestakeholders in setting water policies and regulating use. Water projects often do notmeet consumers’ needs.• Third, most countries “do not treat water as an economic good.” It is not valuedproperly, and many heavy water-users (such as farmers) do not pay for the amountof water they use. Instead, they rely on government subsidies and often wasteenormous quantities of water by growing water-intensive crops in areas better suitedto dryland farming. Unfortunately, governments find it easier to develop new watersupplies than compel users of large water quantities to pay for the water they actuallyuse.• Fourth, and perhaps most serious, current water-management policies neglect tolink the quality of water to human health, the environment, and the quality of life.Water resources are degraded nearly everywhere. In Poland, for instance, three-quarters of the country’s river water is too polluted even for industrial use. In India,
19Freshwater Crisis
a country highly dependent on irrigated agriculture for food supplies, farmers haveabandoned more than four million hectares of high quality land because of salinizationand waterlogging.
The world’s failure to manage water adequately has spilled over into land and coastalmanagement, affecting many other economic sectors and disrupting natural ecosystemfunctions on a massive scale.
The world needs nothing less than a Blue Revolution—a more comprehensive approachto water management that takes account of the needs of various users and apportionswater accordingly. But water needs to be managed sustainably for the benefit of all, nottreated solely as a free commodity. Water must be regarded and managed as a vitalresource basic for all development. In short, we need water managers to take the broadperspective. Managing supplies without regard for reducing demand will simply aggravatethe trends described above and result in a deepening water crisis, ultimately affectingeveryone and everything on this blue planet.
References
Abramovitz, Janet. (1996, March). Imperiled waters, impoverished future: The decline of freshwa-ter ecosystems (Worldwatch Paper No. 128). Washington, DC: Worldwatch Institute.
Agence France Presse. (2000, November 23). Sun Star Davao, page 5.
Asian Development Bank (1999). “Water in the 21st century.” Asian Development Bank AnnualReport 1999. Manila, Philippines: Asian Development Bank.
Brautigam, A. (1999). “The freshwater biodiversity crisis.” World Conservation 30 (2), 4-5.
Brown, L. & Halweil, B. (1998). “China’s water shortage could shake world food security.” Worldwatch11 (4), 10-21.
Carty, W. (1991). “Towards an urban world.” Earthwatch 43, 2-4.
Clarke, R. (1991). Water: The international crisis. Cambridge, Massachusetts: MIT Press.
Darmon, A. (1996). “The makings of a water crisis.” UNESCO Sources 84, 12-13.
Department of Environment and Natural Resources. (1998). Water watch. Manila: Department ofEnvironmental and Natural Resources.
Engelman, Robert & LeRoy, P. (1993). Sustaining water: Population and the future of renewablewater supplies. Washington DC: Population Action International.
Engelman, Robert & LeRoy, P. (1995). Sustaining water: An update. Washington DC: PopulationAction International.
Environmental Management Bureau. (1996). Philippine environmental quality report (1990-1995).Manila: Department of Environment and Natural Resources.
Environmental Protection Agency. (1995). The quality of our nation’s water: 1994. Washington DC:Environmental Protection Agency.
European Schoolbooks. (1994). The battle for water: Earth’s most precious resource. Cheltenham,United Kingdom.
20 Population and Water
Facon, Thierry. (2000). Rice production and water management in Asia: Some issues for the future.Food and Agriculture Organization, Bangkok, Thailand.
Falkenmark, Malin. (1990). “Population growth and water supplies: An emerging crisis.” People 17(1), 18-20.
Falkenmark, Malin. (1991). “Rapid population growth and water scarcity: The predicament oftomorrow’s Africa.” In K. Davis & M. Bernstam (Eds.), Resources, environment and population:Present knowledge and future options (pages 81-94). New York: Oxford University Press.
Falkenmark, Malin. (1994). “Population, environment and development: A water perspective.” InPopulation, environment and development: Proceedings of the United Nations Expert GroupMeeting on Population, Environment and Development (pages 99-116). New York: UnitedNations.
Falkenmark, Malin & Lundqvist, Jan. (1997). Comprehensive assessment of the freshwater re-sources of the world: World freshwater problems call for a new realism. Stockholm: StockholmEnvironment Institute.
Gardner-Outlaw, Thomas & Engelman, Robert. (1997). Sustaining water, easing scarcity: A secondupdate. Washington DC: Population Action International.
Gleick, Peter. (1993). “An introduction to global fresh water issues.” In Peter Gleick (Ed.), Water incrisis (pages 3-12). New York: Oxford University Press.
Gleick, Peter. (2000). The world’s water 2000-2001. Washington, DC: Island Press.
Gorecho, Dennis. (1998, January 10). “Water: RP’s future is dry and dirty.” Today, A21.
Harrison, P. (1992). The third revolution: Environment, population and a sustainable world. Lon-don: I.B. Tauris.
Havas-Szilagyi, E. (1998). “National groundwater protection program in Hungary.” Presented atthe International Conference of Water and Sustainable Development, Paris, March 19-21.Authors.
Hinrichsen, D. (1998). Coastal waters of the world: Trends, threats and strategies. Washington,DC: Island Press.
Langit, Richel. (1996, April 29). “Rich, poor both cry out, ‘Tubig!’” The Manila Times, A4.
Lefort, R. (1996). “Down to the last drop.” UNESCO Sources 84, 7.
Malaysian Water Partnership. (2000). Malaysia: National water vision to action—The way forward.Paper presented at the FAO-ESCAP Technical Cooperation Project on World Water Vision,Bangkok, Thailand. Authors.
Maniquis, Estrella. (1996). “Water policy in Manila.” The IDRC Reports. Ontario, Canada: Interna-tional Development Research Center.
Marcoux, A. (1994). Population and water resources. Rome: FAO.
Mitchell, J. (1998, January-February). “Before the next doubling.” Worldwatch Magazine, 20-27.
“Most rivers in the world are polluted.” (1999). Washington DC: Inter-Press Service Wire Service.

21Freshwater Crisis
Nash, L. (1993). “Water quality and health.” In Peter Gleick (Ed.), Water in crisis. New York: OxfordUniversity Press.
National Water Resources Board. (2000). Case study on the formulation of national water vision.Paper presented at the FAO-ESCAP Technical Cooperation Project on World Water Vision,Bangkok, Thailand.
Niemczynowicz, J. (1996). “Wasted waters.” UNESCO Sources, No. 84.
Patel, T. (1997, April 26). “India faces chaos over water rights.” New Scientist, 12.
Pimentel, David; Houser, J.; Preiss, E.; White, O.; Fang, H.; Mesnick, L.; Barsky, T.; Tariche, S.;Schrick, J.; & Alpert, S. (1997). “Water resources: Agriculture, the environment and society.”BioScience 46 (2), 97-105.
Population Reference Bureau. (1998). Population and environment dynamics [Wall Chart]. Wash-ington, DC: Population Reference Bureau.
Postel, Sandra. (1996a). Dividing the waters: Food security, ecosystem health and the new politicsof scarcity (Worldwatch paper No. 132). Washington, DC: Worldwatch Institute.
Postel, Sandra. (1996b). “Sharing the rivers.” People & the Planet 5 (3), 6-9.
Postel, Sandra. (1997). Last oasis: Facing water scarcity. New York: WW Norton & Co.
Postel, Sandra. (1999). Pillar of sand: Can the irrigation miracle last? New York: WW Norton & Co.
Postel, Sandra; Daily, G.; & Ehrlich, Paul. (1996). “Human appropriation of renewable freshwater.”Science 271 (5250), 785-788.
Pullen, S. and Hurst, P. (1993). Marine pollution prevention. WWF background report. Gland, Swit-zerland: WWF.
Purdum, Todd. ( 1997, December 19). “U.S. acts to meet water needs in the West.” New YorkTimes, A10.
Revkin, A. (1997, August 31 ). “Billion dollar plan to clean New York City water at its source.” NewYork Times, A1, A28.
Robey, B.; Rutstein, S.O.; Morris, L.; and Blackburn, R. (1992). “The reproductive revolution: Newsurvey findings.” Population Reports Series M, No. 11. Baltimore: Johns Hopkins UniveristySchool of Public Health.
Serageldin, I. (1995). Toward sustainable management of water resources. Washington, DC: WorldBank.
Shikolomanov, I.A. (1997). Assessment of water resources and water availability in the world.Stockholm: Stockholm Environment Institute.
Tacio, Elena. (1994, March 27). “The great thirst.” Manila Chronicle, A13.
Tyler, P. (1996, May 23). “China’s fickle rivers: Dry farms, needy industry bring a water crisis.” NewYork Times, A10.
(References continued on page 26)
22 Population and Water
yrtnuoCnoitalupoP
5991)snoillim(
rePretaWatipaC
noitalupoP5202)snoillim(
rePretaWatipaC5202
RFT8991
.poP%htworG8991etaR
aireglA 1.82 725 3.74 313 4.4 4.2
niarhaB 6.0 161 9.0 401 2.3 0.2
sodabraB 3.0 291 9.0 961 7.1 5.0
idnuruB 1.6 495 3.21 292 6.6 5.2
edreVepaC 4.0 777 7.0 244 3.5 9.2
soromoC 6.0 766,1 3.1 067 1.5 7.2
surpyC 7.0 802,1 0.1 749 1.2 7.0
tpygE 1.26 639 8.59 706 6.3 2.2
aipoihtE 4.65 509,1 3.631 708 0.7 5.2
itiaH 1.7 445,1 5.21 978 8.4 1.2
narI 4.86 917,1 5.821 619 0.3 8.1
learsI 5.5 983 0.8 072 9.2 5.1
nadroJ 4.5 813 9.11 441 4.4 5.2
ayneK 2.72 211,1 2.05 206 5.4 0.2
tiawuK 7.1 59 9.2 55 2.3 3.2
aybiL 4.5 111 9.21 74 3.6 7.3
iwalaM 7.9 339,1 4.02 719 9.5 7.1
atlaM 4.0 28 4.0 17 1.2 6.0
occoroM 5.62 131,1 9.93 157 3.3 8.1
namO 2.2 478 5.6 592 1.7 9.3
rataQ 5.0 19 8.0 46 1.4 7.1
adnawR 2.5 512,1 0.31 584 0.6 1.2
aibarAiduaS 3.81 942 4.24 701 4.6 1.3
eropagniS 3.3 081 2.4 241 7.1 1.1
ailamoS 5.9 224,1 7.32 075 0.7 2.3
acirfAhtuoS 5.14 602,1 6.17 896 3.3 6.1
Table 1. Growing Water ShortagesPopulation Size and Growth and Renewable Freshwater Availability in Water-ShortCountries, 1995 and 2025
Water Scarcity in 1995 and/or 2025
aa
23Freshwater Crisis
Water-stressed countries are those with annual water resources of between 1,000 and 1,700cubic meters per person, shown in italic. Countries suffering from water scarcity are those withannual supplies of less than 1,000 cubic meters per person, shown in dark type.TFR = Total Fertility RateaIn cubic meters per yearSource: Gardner-Outlaw & Engelman, (1997). Gardner-Outlaw and Engelman base theircalculations on UN Population Division population estimates. The growth rate and TFR datacome from Population Reference Bureau (1998).
yrtnuoCnoitalupoP
5991)snoillim(
rePretaWatipaC
noitalupoP5202)snoillim(
rePretaWatipaC5202
RFT8991
.poP%htworG8991etaR
aisinuT 0.9 434 5.31 882 2.3 9.1
barAdetinUsetarimE 2.2 209 3.3 406 9.4 2.2
nemeY 0.51 643 6.93 131 3.7 3.3
natsinahgfA 7.91 345,2 3.54 501,1 1.6 5.2
muigleB 1.01 432,1 3.01 712,1 6.1 1.0
osaFanikruB 5.01 276,2 5.32 491,1 9.6 9.2
aertirE 2.3 577,2 5.6 353,1 1.6 0.3
anahG 3.71 860,3 3.63 464,1 5.5 9.2
aidnI 0.929 442,2 2.033,1 765,1 4.3 9.1
nonabeL 0.3 458,1 4.4 162,1 3.2 6.1
ohtoseL 0.2 565,2 0.4 092,1 3.4 1.2
suitiruaM 1.1 079,1 5.1 584,1 0.2 0.1
regiN 2.9 255,3 4.22 254,1 4.7 4.3
airegiN 7.111 605,2 4.832 571,1 5.6 0.3
ureP 5.32 007,1 5.53 621,1 5.3 2.2
dnaloP 6.83 854,1 0.04 604,1 6.1 1.0
aeroKhtuoS 9.44 274,1 5.25 852,1 7.1 0.1
ainaznaT 7.03 469,2 4.26 524,1 7.5 5.2
ogoT 1.4 839,2 8.8 073,1 8.6 6.3
adnagU 7.91 253,3 0.54 764,1 9.6 7.2
detinUmodgniK 1.85 222,1 5.95 391,1 7.1 2.0
ewbabmiZ 2.11 787,1 3.91 430,1 4.4 5.1
Water Stress in 1995 and/or 2025
aa
24 Population and Water
yrtnuoC noitalupoP)6991(
noitatipicerP)mm(
mnoillim 3 m3 bahnirep)6991(
)alumuroF( )1( )2( )3( 01*3=)4( 8 )1(/
hsedalgnaB 000,370,021 023,2 000,501 478
natuhB 000,218,1 000,4 000,59 824,25
ienurB 000,003 456,2 005,8 333,82
aidobmaC 000,372,01 364,1 075,021 737,11
anihC 000,072,832,1 846 000,218,2 172,2
aidnI 000,085,449 071,1 045,062,1 433,1
aisenodnI 000,354,002 007,2 00,838,2 851,41
napaJ 000,153,521 827,1 000,034 034,3
RPD,aeroK 00,664,22 450,1 000,76 289,2
.peR,aeroK 029,413,54 472,1 058,46 134,1
RPD,oaL 000,530,5 006,1 024,091 287,73
aisyalaM 000,185,02 000,3 000,085 381,82
sevidlaM 000,362 388,1 03 411
ailognoM 000,515,2 152 008,43 738,31
ramnayM 000,229,54 143,2 006,088 671,91
lapeN 000,120,22 005,1 002,891 000,9
weNaupaPaeniuG
000,004,4 005,3 000,108 540,281
senippilihP 000,382,96 373,2 000,974 419,6
aknaLirS 000,001,81 000,2 000,05 267,2
dnaliahT 000,307,85 584,1 000,012 775,3
manteiV 000,181,57 069,1 005,663 578,4
Table 2. Renewable Water Resources in Asia
* Internal: Originating within a country.**External: Originating outside a country.
Internal*
25Freshwater Crisis
Source: Facon (2000).
yrtnuoC lanretxEycnednepeD)%(oitaR
mnoillim 3 mnoillim 3 m3 bahnirep)6991(
)5( )5(+)3(=)6( 01*)6(=)7( 8 1/ )6(/)5(
hsedalgnaB 446,501,1 446,012,1 380,01 3.19
natuhB 0 000,59 824,25 0.0
ienurB 0 005,8 333,82 0.0
aidobmaC 045,553 011,674 643,64 7.47
anihC 961,71 965,928,2 582,2 6.0
aidnI 022,746 067,709,1 020,2 9.33
aisenodnI 0 000,838,2 851,41 0.0
napaJ 0 000,034 034,3 0.0
RPD,aeroK 531,01 531,77 334,3 1.31
.peR,aeroK 058,4 007,96 835,1 0.7
RPD,oaL 031,641 055,133 181,66 9.24
aisyalaM 0 000,085 381,82 0.0
sevidlaM 0 03 411 0.0
ailognoM 0 008,43 738,31 0.0
ramnayM 100,561 106,540,1 967,22 8.51
lapeN 000,21 002,012 545,9 7.5
weNaupaPaeniuG
0 000,108 540,281 0.0
senippilihP 0 000,974 419,6 0.0
aknaLirS 0 000,05 267,2 0.0
dnaliahT 449,991 449,904 389,6 8.84
manteiV 017,425 012,198 458,11 9.85
External** Total

26 Population and Water
UNCHS (Habitat). (2001). The state of the world’s cities. Nairobi: UNCHS.
United Nations Children’s Fund (UNICEF). (1997). Facts and figures. [On-line]. Available: http://www.unicef.org/factx/facright.htm
United Nations Food and Agriculture Organization (FAO). (1990). Water for life. Rome: FAO.
United Nations Foundation. (2000, January 21). “Water: Manila meeting highlights Southeast Asianwoes.” [On-line]. Available: http://www.unfoundation.org/unwire/archives/UNWIRE000121.asp.
United Nations Population Fund (UNFPA). (1997). Population and sustainable development: Fiveyears after Rio. New York: UNFPA.
Vitousek, P.; Mooney, H.; Lubchenco, J.; & Melillo, J.M. (1997). “Human domination of the earth’secosystems.” Science 277, 494-499.
World Health Organization (WHO). (1992). Our planet, our health—Report of the WHO Commis-sion on Health and Environment. Geneva: WHO.
World Health Organization (WHO). (1997). Health and environment in sustainable development:Five years after the Earth Summit. Geneva: WHO.
World Resources Institute (WRI). (1987). World resources 1987. Washington, DC: WRI.
(continued from page 21)