Embed Size (px)
Citation preview

The Colonial Origins of ComparativeDevelopment: An Empirical Investigation∗
Daron Acemoglu† Simon Johnson‡ James A. Robinson§
June 22, 2000
Abstract
We exploit differences in the mortality rates faced by European colonialists toestimate the effect of institutions on economic performance. Our argument is thatEuropeans adopted very different colonization policies in different colonies, withdifferent associated institutions. The choice of colonization strategy was, at least inpart, determined by whether Europeans could settle in the colony. In places whereEuropeans faced high mortality rates, they could not settle and they were morelikely to set up worse (extractive) institutions. These early institutions persistedto the present. We document evidence supporting these hypotheses. Exploitingdifferences in mortality rates faced by soldiers, bishops and sailors in the coloniesin the 17th, 18th and 19th centuries as an instrument for current institutions, weestimate large effects of institutions on income per capita. Our estimates implythat differences in institutions explain approximately three-quarters of the incomeper capita differences across former colonies. Once we control for the effect ofinstitutions, we find that countries in Africa or those farther away from the equatordo not have lower incomes.
∗We thank Joshua Angrist, Abhijit Banerjee, Esther Duflo, John Gallup, Chad Jones, Andrei Shleifer,and participants at the Harvard-MIT Development Economics seminar, Berkeley Political Science semi-nar, Columbia Social Sciences seminar, and the Stanford Social Science History Institute conference foruseful comments. We also thank Robert McCaa for guiding us to the data on bishops’ mortality.
†Massachusetts Institute of Technology, Department of Economics, E52-371, Cambridge, MA 02319,and Canadian Institute of Advanced Research; e-mail: [email protected]
‡Massachusetts Institute of Technology, Sloan School of Management, Cambridge, MA 02319; e-mail:[email protected].
§University of California, Department of Political Science, 210 Barrows Hall, Berkeley CA94720; e-mail: [email protected].
1

1 Introduction
What are the fundamental causes of the large differences in income per capita across coun-
tries? Although there is still little consensus on the answer to this question, differences
in institutions and property rights have received considerable attention in recent years.
Countries with better “institutions”, more secure property rights, and less distortionary
policies will invest more in physical and human capital, and will use these factors more
efficiently to achieve a greater level of income (e.g., North and Thomas, 1976, North,
1981, Jones, 1981). This view receives some support from cross-country correlations
between measures of property rights and economic development (e.g., Knack and Keefer,
1995, Mauro, 1995, Barro, 1998, Hall and Jones, 1999, Rodrik, 1999), and from a few
micro-studies that investigate the relationship between property rights and investment or
output (e.g., Besley, 1995, Mazingo, 1999, Johnson, McMillan and Woodruff, 1999).
At some level, it is obvious that institutions matter. Witness, for example, the di-
vergent paths of North and South Korea, or East and West Germany, where one part of
the country stagnated under central planning and collective ownership, while the other
prospered with private property and a market economy. Nevertheless, we still lack con-
clusive evidence that institutional differences can have a large enough effect to explain
the phenomenal differences in output per capita across countries. It is quite likely that
economies that are rich choose or can afford better institutions. Perhaps more important,
economies that are different for a variety of reasons will differ both in their institutions
and in their income per capita.
To estimate the impact of institutions on performance, we need a source of exogenous
variation in institutions. In this paper, we propose differences in mortality rates faced
by European settlers at the time of colonization as a possible source of such exogenous
variation.1 We focus on societies that were colonized by European countries. These provide
us with a set of economies that had relatively similar income levels 400 years ago and
still exhibit large differences in per capita income today. Moreover, institutions in these
countries were shaped, at least in part, by their colonization experience.2
1We do not argue that differences in mortality rates are the only, or even the main, cause of variationin institutions. For our empirical approach to work, all we need is that they are a source of exogenousvariation.
2Young (1994) and Chazan et al. (1993) argue that the colonization policies of European powers had
1

Our argument rests on three premises:
1. There were different types of colonization policies which created different sets of in-
stitutions. At one extreme, European powers set up “extractive states”, exemplified
by the Belgian colonization of the Congo. These institutions did not introduce much
protection for private property, nor did they provide checks and balances against
government expropriation. In fact, the main purpose of the extractive state was to
transfer as much of the resources of the colony to the colonizer, with the minimum
amount of investment possible.
At the other extreme, many Europeans went and settled in a number of colonies,
creating what the historian Alfred Crosby (1986) calls “Neo-Europes”. The settlers
tried to replicate European institutions, with great emphasis on private property,
and checks against government power. Primary examples of this include Australia,
New Zealand, Canada, and the United States.
2. The colonization strategy was influenced by the feasibility of settlements. In par-
ticular, in places where the disease environment was not favorable to European
settlement, the cards were stacked against the creation of Neo-Europes, and the
formation of the extractive state was more likely.
3. The colonial state and institutions persisted even after independence.
Based on these three premises, we use the mortality rates expected by the first settlers
in the colonies as an instrument for institutions. More specifically, our theory can be
schematically summarized as
(potential) settlermortality
⇒ settlements⇒ earlyinstitutions
⇒ currentinstitutions
⇒ currentperformance
We use data on the mortality rates of soldiers, bishops, and sailors stationed in the
colonies between the 17th and 19th centuries, largely based on the work of the historian
Philip Curtin. These give a good indication of the mortality rates faced by settlers. Eu-
ropeans were well informed about these mortality rates at the time, though they did not
a long-lasting effect on Africa. In contrast, Chabal (1986) and Herbst (2000) maintain that the currentAfrican state is a continuation of the precolonial state. Although our assessment agrees with that ofYoung, since we are not comparing ex-colonies to non-colonized countries, our empirical approach doesnot take a position on this.
2
know how to control the diseases that caused these high mortality rates. Furthermore,
since these mortality rates refer to fairly homogeneous groups, they are comparable across
countries. We document empirically that (potential) settler mortality rates were a major
determinant of settlements; that settlements were a major determinant of early institu-
tions (in practice, institutions in 1900); that there is a strong correlation between early
institutions and institutions today; and finally that current institutions have a first-order
effect on current performance.
Our most parsimonious specification is to regress current performance on current in-
stitutions, and instrument the latter by settler mortality rates. Since our focus is on
property rights and checks against government power, we use the “risk of expropriation”
index from Political Risk Services as the proxy for institutions. This measures differences
in institutions originating from different types of states and state policies.3 The first-stage
relationship between this measure of institutions and settler mortality is strong. For ex-
ample, settler mortality alone explains over 25 percent of the variation in this index of
institutions. Using this specification, we find that institutions are a major determinant
of per capita income. The estimates are quite precise, and in fact larger than the OLS
estimates. They suggest that approximately three-quarters of the cross-country income
differences we observe can be explained by differences in institutions.
We document that this relationship is not driven by outliers. For example, excluding
Australia, New Zealand, Canada, and the United States does not change the results,
nor does excluding Africa. Interestingly, we show that once the effect of institutions on
economic performance is controlled for, neither distance from the equator (latitude) nor
the dummy for Africa is significant. These results suggest that Africa is poorer than the
rest of the world not because of pure geographic or cultural factors, but because of worse
institutions.
The validity of our approach is threatened if other factors correlated with the esti-
3We do not mean to imply that government expropriation is the only institutional feature that matters.Our view is that there is a variety of institutional guarantees, including constraints on governmentexpropriation, independent judiciary, property rights enforcement, equal access to education, and respectfor civil liberties, that are important to encourage investment and growth. Expropriation risk is relatedto all these institutional features. In the Appendix, we report results using a variety of other measures ofinstitutions that have been used in the literature, including the extent of the constraints on the executivecoded from the Polity III dataset, an index of law and order tradition from Political Risk Services, ameasure of property rights from the Heritage Foundation, a measure of rule of law from the FraserInstitute, and the efficiency of the judiciary from Business International. We obtain very similar resultswith all of these measures.
3
mates of the mortality rates faced by the settlers affect income per capita. We adopt
two strategies to substantiate that our results are not driven by omitted factors. First,
we investigate whether institutions have an important effect once we control for a num-
ber of variables potentially correlated with settler mortality and economic outcomes. We
find that none of these overturn our results; the estimates change remarkably little when
we include controls for climate, geography, religion, legal origin, main colonizer, natural
resources, and soil quality. Furthermore, the results are also robust to the inclusion of
controls for the current disease environment (e.g., the prevalence of malaria), the current
fraction of the population of European descent, and measures of ethnolinguistic fragmen-
tation.
Naturally, it is impossible to control for all possible variables that might be corre-
lated with settler mortality and economic outcomes. Furthermore, our empirical ap-
proach might capture the effect of settler mortality on economic performance, but work-
ing through other factors. For example, early European settlers might have brought a
“culture” conducive to economic progress, which could still have an effect on income per
capita today. Our instrumental variables strategy would then incorrectly assign this ef-
fect to institutions. We deal with this problem by using a simple overidentification test.
Since our hypothesis is that settler mortality affected settlements; settlements affected
early institutions; and early institutions persisted and formed the basis of current day
institutions, we can test the validity of our approach by using measures of European
migration to the colonies and of early institutions as additional instruments. We then
use overidentification tests to detect whether settler mortality, or any of the other instru-
ments, has a direct effect on current performance. The results are encouraging for our
approach; they generate no evidence for a direct effect of settler mortality on economic
outcomes.
We are not aware of others who have pointed out the link between settler mortality
rates and institutions, though scholars such as McNeill (1976), Crosby (1986) and Dia-
mond (1997) have discussed the influence of diseases on human history. Diamond (1997)
emphasizes comparative development, but his theory is based on the geographical deter-
minants of the incidence of the neolithic revolution. He ignores both the importance of
institutions and the potential causes of divergence in more recent development, which
are the main focus of our paper. Work by Gann and Duignan (1962), Robinson and
Gallagher (1961), Denoon (1983), and Cain and Hopkins (1993) emphasizes that settler
4

colonies such as the U.S. and New Zealand are different from other colonies, and point
out that these differences were important for their economic success. Nevertheless, this
literature does not develop the link between mortality, settlements and institutions.
Our argument is most closely related to work on the influence of colonial experience
on institutions. Hayek (1960) argued that the British common law tradition was superior
to the French civil law, which was developed during the Napoleonic era to restrain judges’
interference with state policies (see also Lipset, 1994). More recently, La Porta, Lopez-de-
Silanes, Shleifer and Vishny (1998, 1999) document empirically the importance of colonial
origin (the identity of the colonizer) and legal origin on current institutions. For example,
they show that common law countries have better property rights and more developed
financial markets. Similarly, North, Summerhill and Weingast (1998) argue that former
British colonies prospered relative to former French, Spanish and Portuguese colonies
because of the good economic and political institutions they inherited from Britain, and
Landes (1998, chapters 19 and 20) stresses the importance of the culture inherited from
Britain in these colonies. In contrast to this approach, which focuses on the identity of the
colonizer, we emphasize the conditions in the colonies. Specifically, in our theory–and
in the data– it is not the identity of the colonizer that matters, but whether European
colonialists could safely settle in a particular location: where they could not settle, they
brought worse institutions. In this respect, our argument is related to that of Engerman
and Sokoloff (1997) who also emphasize institutions, but link them to factor endowments.
Empirically, our work is related to a number of other attempts to uncover the link be-
tween institutions and development, as well as to Bertocchi and Canova (1996) and Grier
(1999) who investigate the effect of being a colony on postwar growth. Two papers deal
with the endogeneity of institutions by using an instrumental variables approach as we do
here. Mauro (1995) instruments for corruption using ethnolinguistic fragmentation. Hall
and Jones (1999), in turn, who use distance from the equator as an instrument for social
infrastructure because they argue that the distance from the equator is correlated with
‘Western influence’, which leads to good institutions. The theoretical reasoning for these
instruments is not entirely convincing. It is not easy to argue that the Belgian influence
in the Congo, or Western influence in the Gold Coast during the era of slavery promoted
good institutions or governance. Ethnolinguistic fragmentation, on the other hand, seems
endogenous, especially since such fragmentation almost completely disappeared in Eu-
rope during the era of growth when a centralized state and market emerged (see, e.g.,
5

Weber, 1976, Anderson, 1983). Econometrically, the problem with both studies is that
their instruments can plausibly have a direct effect on performance. For example, East-
erly and Levine (1997) argue that ethnolinguistic fragmentation can affect performance
by creating political instability, while Bloom and Sachs (1998) and Gallup, Mellinger, and
Sachs (1998) argue for a direct effect of climate on performance. This climate theory of
development has a long pedigree; it goes back at least to Montesquieu [1748](1989), who
suggested that low income and despotism are more likely in warmer climates. If, indeed,
these variables have a direct effect, they are invalid instruments and do not establish that
it is institutions that matter. The advantage of our approach is that conditional on the
variables we already control for, settler-mortality more than 100 years ago should have
no effect on output today, other than through its effect on institutions. Interestingly,
our results show that distance from the equator does not have an independent effect on
economic performance, so it validates the use of this variable as an instrument in the work
by Hall and Jones (1999).
The next section outlines our hypothesis and provides supporting historical evidence.
Section 3 presents OLS regressions of GDP per capita on our index of institutions. Section
4 describes our key instrument for institutions, the mortality rates faced by potential set-
tlers at the time of colonization. Section 5 presents our main results. Section 6 investigates
the robustness of our results, and Section 7 concludes.
2 The Hypothesis and Historical Background
We hypothesize that settler mortality affected settlements; settlements affected early in-
stitutions; and early institutions persisted and formed the basis of current institutions. In
this section, we discuss and substantiate this hypothesis. The next subsection discusses
the link between mortality rates of settlers and settlement decisions, then we discuss
differences in colonization policies, and finally, we turn to the causes of institutional per-
sistence.
2.1 Mortality and settlements
There is little doubt that mortality rates were a key determinant of European settlements.
Curtin (1964 and 1998) documents how both the British and French press informed the
public of the mortality rates in the colonies. For example, early European attempts to
settle in West Africa foundered due to high mortality from disease. In the “Province of
6

Freedom” European mortality in the first year was 46 percent, in Bulama (April 1792-
April 1793) there was 61 percent mortality among Europeans, and in the first year of the
Sierra Leone Company (1792-1793) 72 percent of the European settlers died. On Mungo
Park’s Second Expedition (May-November 1805), 87 percent of Europeans died during
the overland trip from Gambia to the Niger, and all the Europeans died before completing
the expedition. Such rates of mortality were shockingly high for Europeans at the time.4
An interesting example of the awareness of the disease environment comes from the
Pilgrim fathers. They decided to migrate to the U.S. rather than Guyana because of the
very high mortality rates in Guyana (see Crosby, 1986, pp. 143-144). Another example
comes from the Beauchamp Committee in 1795 which was set up to decide where to send
British convicts, who had previously been sent to the U.S.. One of the leading proposals
was the island of Lemane, 400 miles up Gambia river. The committee rejected this
possibility precisely because they decided mortality rates would be too high even for the
convicts. South-West Africa was also rejected for health reasons. The final decision was
to send convicts to Australia.
The eventual expansion of many of the colonies was also related to the living conditions
there. In places where the early settlers faced high mortality rates, there would be less
incentive for new settlers to come. Curtin (1964), for example, documents how early
British expectations for settlement in West Africa were dashed by very high mortality
among attempted settlers, about half of whom could be expected to die in the first year.
2.2 Types of colonization and settlements
The historical evidence supports both the notion that there was a wide range of differ-
ent types of colonization and that the presence or absence of European settlers was a
key determinant of the form colonialism took. Historians, including Gann and Duignan
(1962), Robinson and Gallagher (1961), Denoon (1983), and Cain and Hopkins (1993),
have documented the development of “settler colonies”, where Europeans settled in large
4Most mortality in the tropics was from (1) malaria (particularly Plasmodium Falciporum), and (2)yellow fever (with devastating periodic epidemics). In the first half of the nineteenth century therewas almost a complete misunderstanding of the nature of malaria– “miasma” from swamps was theprevailing view. Quinine was available but not understood nor used widely. The role of hygiene wasalso not properly understood. In the second half of the nineteenth century, there developed improvedheuristic rules about how to control disease–e.g., an understanding that mortality from malaria is oftenless at higher altitudes. Low mortality for Europeans in areas with tropical diseases only arrived in theearly twentieth century. Throughout the whole nineteenth century, areas without malaria, such as NewZealand or Mauritius, were more healthy than Europe.
7
numbers, and life was modeled after the home country. Denoon (1983) emphasizes that
settler colonies had representative institutions which promoted what the settlers wanted,
and what they wanted was freedom and the ability to get rich by engaging in trade. He
argues that “there was undeniably something capitalist in the structure of these colonies.
Private ownership of land and livestock was well established very early...” (p. 35).5
In many cases, when the establishment of European-like institutions did not arise
naturally, the settlers were ready to fight for them against the wishes of the home coun-
try. Australia is an interesting example here. Most of the early settlers in Australia
were ex-convicts, but the land was owned largely by ex-jailors. Initial property rights
were therefore unequal, and there was no legal protection against the arbitrary power
of landowners. But, the majority of settlers wanted institutions and political rights like
those prevailing in England at the time. They demanded jury trials, freedom from arbi-
trary arrest, and electoral representation. Although the British government resisted at
first, the settlers argued that they were British and deserved the same rights as in the
home country (see Hughes, 1987). Cain and Hopkins agree with this conclusion and write
(1993, p. 237) “from the late 1840’s the British bowed to local pressures and, in line with
observed constitutional changes taking place in Britain herself, accepted the idea that, in
mature colonies, governors should in future form ministries from the majority elements in
elected legislatures.” They also suggest that “the enormous boom in public investment
after 1870 [in New Zealand]... was an attempt to build up an infrastructure... to maintain
high living standards in a country where voters expected politicians actively to promote
their economic welfare.” (p. 225).
This is in sharp contrast to the colonial experience in Latin America during the 17th
and 18th centuries, and in Asia and Africa during the 19th and early 20th centuries. The
main objective of the Spanish and the Portuguese colonization was to obtain gold and
other valuables from America. For example, soon after the conquest the Spanish crown
granted rights to land and labor (the encomienda) and set up a complex mercantilist
system of monopolies and trade regulations to extract resources from the colonies (see
Lockhart and Schwartz, 1983, and Lang, 1975).6 Other European powers were attracted
5Bates (1983, ch. 3) gives a nice example of the influence of settlers on policy. The British colonialgovernment pursued many policies that depressed the price of cocoa, the main produce of the farmers inGhana. In contrast, the British government supported the prices faced by the commercial cereal farmersin Kenya. Bates shows that this was mainly because in Kenya, but not in Ghana, there were many settlerfarmers, who exerted considerable pressure on policy.
6Migration to Spanish America was limited by the Spanish Crown, in part because of a desire to keep
8

to colonialism because of the success of this strategy (see for example, Young, 1994, p.
64).
European powers developed the slave trade in Africa for the same reasons. Before the
mid-nineteenth century, colonial powers were mostly restricted to the African coast and
concentrated on monopolizing trade in slaves, gold and other valuable commodities–
witness the names used to descibe West African countries: the Gold Coast, the Ivory
Coast. Thereafter, colonial policy was driven in part by an element of superpower rivalry,
but mostly by economic motives. Crowder (1968, p. 50), for example, notes “it is signif-
icant that Britain’s largest colony on the West Coast [Nigeria] should have been the one
where her traders were most active and bears out the contention that, for Britain....flag
followed trade.”7
Davis and Huttenback (1986, p. 307) conclude that “the colonial Empire provides
strong evidence for the belief that government was attuned to the interests of business
and willing to divert resources to ends that the business community would have found
profitable.” They find that before 1885 investment in the British empire had a return 25
percent higher than that on domestic investment, though afterwards the two converged.
Roberts (1976, p. 193) summarizes the extent of resource extraction by Britain from
Northern Rhodesia by writing “[from]..1930 to 1940 Britain had kept for itself 2,400,000
pounds in taxes from the Copperbelt, while Northern Rhodesia received from Britain
only 136,000 pounds in grants for development.” Patrick Manning (1982) estimates that
between 1905 and 1914, 50 percent of GDP in Dahomey was extracted by the French,
and Young (1994, p.125) notes that taxation rates in Tunisia were four times as high as
those in metropolitan France.
Probably the most extreme case of extraction was that of King Leopold of Belgium in
the Congo. Gann and Duignan (1979, p. 30) argue that following the example of the Dutch
in Indonesia, Leopold’s philosophy was that “the colonies should be exploited, not by the
operation of a market economy, but by state intervention and compulsory cultivation of
cash crops to be sold to and distributed by the state at controlled prices.” Peemans (1975)
control of the colonists and limit their independence (for example Coatsworth, 1982). This gives furthersupport to our notion that settlers were able to influence the type of institutions set up in the colonies,even against the wishes of the home country government.
7Although in almost all cases the main aim was to cement trading privileges, protect economic interests,and obtain profits, the recipients of these profits varied. In the Portuguese case, it was the state, in theBelgian case, it was King Leopold, and in the British case, it was often private enterprises who obtainedconcessions or monopoly trading rights in Africa (Crowder, 1968, Part III).
9
documents the amount of resources extracted from the Belgian Congo and calculates that
tax rates on Africans approached 60 percent of their income during the 1920’s and 1930’s.
Jewsiewicki (1983) writes that during the period when Leopold was directly in charge,
policy was “based on the violent exploitation of natural and human resources,” with a
consequent “destruction of economic and social life...[and].. dismemberment of political
structures.”
In non-settler colonies, there were also few constraints on state power. The colonial
powers set-up authoritarian and absolutist states, with the purpose of solidifying their
control and facilitating the extraction of resources. Young (1994, p. 101) quotes a French
official in Africa as “the European commandant is not posted to observe nature,... He
has a mission... to impose regulations, to limit individual liberties...., to collect taxes.”
Manning (1988, p. 84) summarizes this as: “In Europe the theories of representative
democracy won out over the theorists of absolutism... But in Africa, the European
conquerors set up absolutist governments, based on reasoning similar to that of Louis
XIV.”
With a strategy of exploitation in mind, European powers had little incentive to invest
in institutions or in infrastructure in Africa. In fact, despite apparently very high rates
of return, almost no investment went to Africa (except from South Africa, see Freiden,
1994). The Indian textile industry was similarly rundown heavily, with no investment
(e.g., Fieldhouse, 1999). Young writes “ [the Belgian companies] brought little capital–a
mere 8000 pounds...[to the Congo basin]–and instituted a reign of terror sufficient to
provoke an embarrassing public-protest campaign in Britain and the United States at a
time when the threshold of toleration for colonial brutality was high.” (1994, p. 104).
2.3 Institutional persistence
There is a variety of evidence suggesting that the control structures set up in the non-
settler colonies during the colonial era persisted, while there is little doubt that the in-
stitutions of law and order and private property established during the early phases of
colonialism in Australia, Canada, New Zealand, and the U.S. have been the basis of the
current day institutions of these countries.8 Young emphasizes that the institutions set up
8The thesis that institutions persist for a long time goes back at least to Wittfogel (1957), who arguedthat the control structures set up by the large “hydraulic” empires such as China, Russia, and theOttoman Empire persisted for more than 500 years to the 20th century. Engerman and Sokoloff (1997),North, Summerhill and Weingast (1998), Coatsworth (1999) and La Porta, Lopez-de-Silanes, Shleifer
10
by the colonialists persisted long after the colonial regime ended. He writes that (1994,
p. 283) “although we commonly described the independent polities as ‘new states’, in
reality they were successors to the colonial regime, inheriting its structures, its quotidian
routines and practices, and its more hidden normative theories of governance.” Arthur
Lewis gives a succinct statement of the issues (1965, pp. 32-33)
“...for most of [the governments of newly independent African states] in-
dependence means merely that they have succeeded to the autocracy vacated
by British and French civil servants. They model themselves on the arrogant
and arbitrary pattern set by Governors and district commissioners.”
There are a number of intuitive economic mechanisms that will lead to institutional
persistence of this type. Here, we discuss three possibilities.
1. Setting up functioning institutions, which place restrictions on government power
and respect property rights, is costly (see, e.g., Acemoglu and Verdier, 1998). If
these costs have been sunk by the colonial powers, then it may not pay the elites at
independence to switch from this set of institutions to extractive institutions. In
contrast, when the new elites inherit extractive institutions, they may not want to
incur the costs of introducing better institutions, and may instead prefer to exploit
the existing extractive institutions for their own benefits.
An interesting case where functioning institutions proved to be very durable is
Mauritius. The French settled in relatively large numbers in Mauritius, and the
institutions were less extractive than in many other colonies.9 After independence,
Paul Berenger and his party Mouvement Militant Mauricien, which were viewed as
Communists at the time, came to power. But in contrast to other African regimes,
they continued to support property rights and businesses. In fact, they significantly
expanded the export processing zones, which were instrumental for the very rapid
growth experience of Mauritius (see, for example, Bowman, 1991).
2. The gains to an extractive strategy may depend on the size of the ruling elite. When
this elite is small, each member would have a larger share of the revenues, so the
and Vishny (1998, 1999) also argue that colonial institutions persisted. Engerman, Mariscal and Sokoloff(1998) provide further evidence supporting this view.
9Unfortunately, Mauritius is not in our data set as we do not have information on current institutions.Interestingly, however, Mauritius had very low mortality according to our sources, and is a relatively richcountry, with GDP per capita similar to that of Argentina.
11

elite may have a greater incentive to be extractive (see Acemoglu and Robinson,
2000). In many cases where European powers set up authoritarian institutions,
they delegated the day-to-day running of the state to a small domestic elite. This
narrow group often was the one to control the state after independence and favored
extractive institutions. Reno (1995), for example, argues that the governments of
post-independence Sierra Leone adopted the tactics and institutions of the British
colonizers to cement their political power and extract resources from the rest of
society. Boone (1992) provides a similar analysis of the evolution of the modern state
in Senegal. Perhaps the most extensively studied case is the Congo. Most scholars
view the roots of authoritarianism under Mobutu in the colonial state practices (e.g.,
Callaghy, 1984, or, Turner and Young, 1985, especially p. 43)
The situation in Latin America is similar. Independence of most Latin American
countries came in the early nineteenth centuries as domestic elites took advantage of
the invasion of Spain by Napoleon to capture the control of the state. But, the only
thing that changed was the identity of the recipients of the rents.10 The experience
of many other Latin American countries is also similar (see Lynch, 1986).
3. Finally, if agents make irreversible investments that are complementary to a par-
ticular set of institutions, they will then be more willing to support them, making
these institutions persist (see, e.g., Acemoglu, 1995). For example, agents who have
invested a lot in human and physical capital will be in favor of spending money to
enforce property rights, while those who have less to lose may not be. For exam-
ple, in the Mauritius example, the presence of a middle-class that had a stake in
democracy and the rule of law seems to have been important.
Further evidence for the persistence of extractive state institutions into the indepen-
dence era is provided by the persistence of the most prominent extractive policies. In
Latin America, the full panoply of monopolies and regulations, which had been created
by Spain, remained intact for most of the nineteenth century. Forced labor policies per-
sisted and were even intensified or re-introduced with the expansion of export agriculture
10Coatsworth (1978, p. 95) notes “Mexican independence came through a virtual coup d’etat by thecolony’s Creole elite, carried out largely to separate Mexico from the liberalizing process under way inthe Mother country... The principal proponent of these conservative efforts was a limited social group ofmajor landowners and industrialists in the center of the country...who had been the principal beneficiariesin the colony of the crown’s interventionism or who, like the large merchant houses of the capital, soughtto regain privileges the crown itself had abolished in the reforms of the late Bourbon era.”
12

in the latter part of the nineteenth century. Slavery persisted in Brazil until 1886, and
during the sisal boom in Mexico, forced labor was reintroduced and persisted up to the
start of the revolution in 1910. Forced labor was also re-introduced in Guatemala and El
Salvador to provide labor for coffee growing. In the Guatemalan case, forced labor lasted
until the creation of democracy in 1945. Similarly, forced labor was re-instated in many
independent African countries, for example, by Mobutu in Zaire.
The situation is similar with other extractive policies. For example, marketing boards,
which were used by colonial powers for rent extraction, were a ready made instrument
for the newly independent governments to tax agricultural producers (Bates, 1981). The
elites who controlled the government had little to gain from abolishing these marketing
boards or from setting up more efficient institutions. Very often these boards fitted well
with the structure of political power in the post independence era. For example, in Ghana,
Nkrumah’s support was primarily urban and amongst the Fanti, while the cocoa farmers
were inland and Ashanti. So he did not find it beneficial to set up institutions that would
restrict his taxation powers, and the marketing board provided a perfect instrument for
raising taxes from a group that was not going to support him politically in any case (see
Rimmer, 1992). Fieldhouse (1999, p. 96) writes “once these boards came under the control
of local politicians they were used to extract surplus from the rural producer, notionally
for development purposes, in practice largely for party and personal advantage.” He
also argues (p. 146) that the fact there were no marketing boards was important in the
development experience of Australia.
3 Institutions and Performance: Ordinary Least Squares Estimates
3.1 Data and Descriptive Statistics
Table 1 provides descriptive statistics for the key variables of interest. The first column
is for the whole sample, and column 2 is for our base sample, limited to the 64 countries
that were ex-colonies and for which we have settler mortality, institutions and GDP data.
The GDP per capita in 1995 is PPP adjusted and is taken from the World Bank’s 1999
World Development Indicators CD-Rom (a more detailed discussion of all data sources
is provided in the Appendix Table A1). Income (GDP) per capita will be our measure
of economic outcome. Since all ex-colonies in our sample had relatively low levels of
income 400 years ago, income per capita today is a good measure of long run economic
performance. The standard deviation of log per capita income both in the world sample
13

and in our basic sample are similar (1.1 in both cases), indicating that the large income
differences are present in our sample.
We use a variety of variables to capture institutional differences. Our main variable,
reported in the second row, is an index of protection against expropriation. These
data are from Political Risk Services (see, e.g., Coplin, 1993), and were first used in
the economics and political science literatures by Knack and Keefer (1995). Political Risk
Services reports a value between 0 and 10 for each country and year, with 0 corresponding
to the highest expropriation risk. We use the average value for each country between 1985
and 1995 (values are missing for many countries before 1985). This protection against
expropriation measure is appropriate for our purposes since the focus here is on differences
in institutions originating from different types of states and state policies. We expect our
notion of extractive state to correspond to a low value of this index, while the tradition
of rule of law and well enforced property rights should correspond to high values.11 The
next row gives an alternative measure, coded from the Polity III data set of Gurr and
associates, which is constraints on the executive in 1990 (see Appendix Table A3). This
variable is also closely related to state policies and institutions, so is relevant for our
purposes. To economize on space, in the text we report only results with the protection
against expropriation variable. Results using the constraints on the executive and other
measures are reported in the Appendix.
The next three rows give measures of early institutions from the same Gurr data set.
The first is a measure of constraints on the executive in 1900 and the second is an index of
democracy in 1900. This information is not available for countries that were still colonies
in 1900, so we assign these countries the lowest possible score in each index. In the third
row, we report an alternative measure, constraints on the executive in the first year of
independence, which does not use this assumption, and assigns values for earlier years for
many of the Latin America countries and Neo-Europes that were already independent in
the 19th-century. The final row gives the fraction of the population of European descent
in 1900, which is our measure of European settlement in the colonies, constructed from
McEvedy and Jones (1978), Curtin et al (1995) and some additional sources; see Appendix
11The protection against expropriation variable is most specifically for foreign investment, since Politicaland Risk Services construct these data for foreign investors. However, as noted by Knack and Keefer(1995), risk of expropriation of foreign and domestic investments are very highly correlated, and risk ofexpropriation of foreign investment may be more comparable across countries. In any case, all our resultshold also with a variety of other institutions and property rights measures (see Tables A1 and A4a, b, c,d, and e).
14

Table A5).
The remaining columns in Table 1 give descriptive statistics for groups of countries
at different quartiles of the settler mortality distribution. This is useful since settler
mortality is our instrument for institutions (this variable is described in more detail in
the next section).
3.2 Ordinary Least Squares Regressions
Table 2 reports Ordinary Least Squares (OLS) regressions of log per capita income on the
protection against expropriation variable in a variety of samples. The linear regressions
are for the equation
log yi = µ+ αRi +X0iγ + εi, (1)
where yi is income per capita in country i, Ri is the protection against expropriation
measure, Xi is a vector of other covariates, and εi is a random error term. The coefficient
of interest throughout the paper is α, the effect of institutions on income per capita.
The first two columns of Table 2 are for the whole world sample, while the second two
are for our former colonies sample. Since a priori we have no reason to believe that the
relationship between the institutions index and log GDP per capita is linear, in the second
and fourth columns, we regress GDP per capita on a set of dummy variables for different
quartiles of the distribution of the institutions index. The omitted group is the set of
countries in the lowest quartile (with the worst institutions), and three dummies for the
other three quartiles are included in the regression.12
Column 1 shows that in the whole world sample there is a strong correlation between
our measure of institutions and income per capita–recall that the high value of the index
means greater protection against expropriation risk. Column 2 indicates that the linear
specification is appropriate, as the dummies are ranked in the expected order, and the
gap between the various dummies is not very different from that implied by the linear
specification. Columns 3-4 show that the impact of the institutions variable on income per
capita in our base sample is quite similar to that in the whole world, and Figure 1 shows
this relationship diagrammatically. To get a sense of magnitudes, let us compare the 25th
and 75th percentiles of the distribution of the institution variable among all ex-colonies.
The 25th percentile of the institutional measure in this sample corresponds to a value of
12More generally, it may therefore be more appropriate to interpret the OLS and IV estimates fromlinear specifications as local average treatment effects giving the weighted average of the effects at differentpoints (as suggested in Angrist and Imbens, 1995).
15
5.6, while the 75th percentile of institutional measure is 7.4.13 The estimate in column
3, 0.52, indicates that there should be on average a 94 log point difference between the
log GDPs of the corresponding countries (or approximately a difference equivalent to 154
percent of the GDP of the poorer country). In practice, this GDP gap is 185 log points
(approximately 540 percent). Therefore, if the effect estimated in Table 2 were causal, it
would imply a fairly large effect of institutions on performance: differences in institutions
would account for approximately a quarter of the income per capita differences across
countries.
Many social scientists, including Montesquieu [1784](1989), Diamond (1997) and Sachs
and coauthors have argued for a direct effect of climate on performance, and Gallup,
Mellinger, and Sachs (1998) and Hall and Jones (1999) document the correlation between
distance from the equator (latitude) and economic performance. To control for this,
in columns 5-8, we add the absolute value of the distance from the equator in degrees
(latitude) as a regressor (we follow the literature in using a measure of latitude that is
scaled between 0 and 1). This changes the coefficient of the index of institutions little.
Latitude itself is also significant and has the sign found by previous studies. The coefficient
1.80 in column 7 indicates that a ten degree (0.10) distance gap from the equator, such
as the gap between Mauritania and Algeria, is associated with approximately 18 percent
difference in income per capita. In columns 6 and 8, we also add dummies for Africa,
Asia and other continents, with America as the omitted group. Although expropriation
risk remains significant, the continent dummies are also statistically and quantitatively
significant. For example, the coefficient of the Africa dummy in column 8 indicates that
in our sample African countries are 90 log points (approximately 145 percent) poorer even
after taking the effect of institutions into account.
Overall, the results in Table 2 show a strong correlation between institutions and
economic performance. Nevertheless, there are a number of important reasons for not in-
terpreting this relationship as causal. First, our measure refers to current institutions, so
it is plausible that rich economies are able to afford, or perhaps prefer, better institutions.
Arguably more important than this reverse causality problem, there are many omitted
determinants of income differences that will naturally be correlated with institutions. Fi-
nally, the measures of institutions are constructed ex post, and the analysts may have
had a natural bias in seeing better institutions in richer places. As well as these problems
13We focus on the inter-quartile range in order to reduce the influence of measurement error.
16

introducing positive bias in the OLS estimates, the fact that the institutions variable is
measured with considerable error creates attenuation and may bias the OLS estimates
downwards. All of these problems could be solved if we had an instrument for institu-
tions. Such an instrument must be an important factor in accounting for the institutional
variation that we observe, but not have a direct effect on performance. Our discussion
in Section 2 suggests that the mortality rates faced by the settlers during the time of
colonization is a plausible instrument. The next section will describe the construction of
this variable in more detail.
4 Data on the Mortality of Early Settlers
Our data on the mortality of European settlers come largely from the work of Philip
Curtin. In a series of books and articles over a period of nearly 40 years, Curtin has used
a variety of sources to document the mortality of Europeans in new colonies. Systematic
military medical record keeping began only after 1815, as an attempt to understand why
so many soldiers were dying in some places. The first detailed studies were retrospective
and dealt with British forces between 1817 and 1836. The U.S. and French governments
quickly adopted similar methods (Curtin 1989, p. 3 and p. 5), and some early data
are also available for the Dutch East Indies. By the 1870s, most European countries
published regular reports on the health of their soldiers.
The standard measure is annualized deaths per thousand mean strength. This measure
reports the death rate among 1,000 soldiers where each death is replaced with a new
soldier. Curtin (1989 and 1998) reviews in detail the construction of these estimates for
particular places and campaigns, and assesses which data should be considered reliable.
The data can be divided into two parts. Curtin (1989), Death by Migration, deals
primarily with the mortality of European troops from 1817 to 1848. At this time modern
medicine was still in its infancy, and none of the European militaries yet understood
how to design their campaigns so as to reduce mortality. This period is well before the
control of malaria and yellow fever was understood, and these were the major causes
of death from disease for both soldiers and settlers in places where mortality was high
(the third main cause of death was gastrointestinal diseases). These mortality rates can
therefore be interpreted as reasonable estimates of settler mortality. They are consistent
with substantial evidence from other sources (see, for example, Curtin 1964 and Curtin
1968).
17

Curtin (1998), Disease and Empire, adds similar data on the mortality of soldiers in
the second half of the nineteenth century. These numbers have to be used with more care,
because there was a growing awareness of how to avoid epidemics of the worst tropical
diseases, at least during short military campaigns. For example, the campaign in Ethiopia
at the end of the nineteenth century had very low mortality rates because it was short
and well-managed (see Table A2 and Figure 1). Although the mortality rates from this
successful campaign certainly underestimate the mortality rates faced by the settlers in
Ethiopia, we did not exclude this country because excluding it would have helped our
hypothesis. In all cases, we use the earliest available number for each country, reasoning
that this is the best estimate of the mortality that settlers would have faced, at least until
the 20th century.
Appendix B reviews in detail how our data are constructed, and describes alternative
assumptions that check the robustness of our results. The main gap in the Curtin data is
for South America since the Spanish and Portuguese militaries did not keep good records
of mortality. However, Gutierrez (1986) used Vatican records to construct estimates
for the mortality rates of bishops in Latin America from 1604 to 1876. Because these
data overlap with the Curtin estimates for several countries, we are able to construct
a data series for South America (details are in the Appendix).14 Curtin (1964) also
provides estimates of mortality in naval squadrons for different regions which we can use
to generate alternative estimates of mortality in South America. We show in Table 5
that these alternative methods produce remarkably similar results.
5 Institutions and Performance: Instrumental Variables Results
5.1 Determinants of Current Institutions
Mathematically, our theory can be expressed in the following way. Equation (1), which
we rewrite here,
log yi = µ+ αRi +X0iγ + εi, (1)
describes the relationship between current institutions and log GDP. In addition we have
Ri = λR + βRCi +X0iγR + νRi (2)
Ci = λC + βCSi +X0iγC + νCi (3)
14Combining data from a variety of sources will surely introduce measurement error in our estimates ofsettler mortality. Nevertheless, since we are using settler mortality as an instrument, this measurementerror does not lead to inconsistent estimates of the effect of institutions on performance.
18

Si = λS + βS logMi +X0iγS + νSi (4)
where R is the measure of current institutions (protection against expropriation between
1985 and 1995), C is our measure of early (circa 1900) institutions, S is the measure of
European settlements in the colony (fraction of the population with European decent in
1900), and M is mortality rates faced by settlers. X is a vector of covariates that affect
all variables.
The simplest identification strategy is to use logMi directly as an instrument for Ri in
equation (1). This identification strategy will be valid as long as logMi is uncorrelated
with εi–even if Ci and Si were correlated with εi. For example, if Europeans were more
likely to migrate to places with better resources and soil quality, and if resources and soil
quality still had an effect on income, there would be a correlation between Si and εi. This
would make European migration patterns an invalid instrument for current institutions.
Nevertheless, our identification strategy of using logMi directly as an instrument would
be valid. We start with this identification strategy, and then use the other equations to
derive overidentifying restrictions.
Figure 2 illustrates the relationship between the (potential) settler mortality rates and
the index of institutions. We use the logarithm of the settler mortality rates, since there
are no theoretical reasons to prefer the level as a determinant of institutions rather than
the log, and using the log ensures that the extreme African mortality rates do not play a
disproportionate role. As it happens, there is an almost linear relationship between the
log of the mortality rate and our measure of institutions.15
In Table 3, we document that this relationship works through the channels hypothe-
sized in Section 2. In particular, we present OLS regressions of equations (2), (3), and (4).
In the top panel, we regress the protection against expropriation variable on the other
variables. Column 1 uses constraints faced by the executive in 1900 as the regressor, and
shows a close association between early institutions and institutions today. For example,
past institutions alone explain 21 percent of the variation in the index of current institu-
tions. The second column adds the latitude variable, with little effect on the estimate.
Columns 3 and 4 use the democracy index, and confirm the results using the constraints
on the executive variable.
Both constraints on the executive and democracy indices assign low scores to countries
15Note that Gambia has a surprisingly good score for protection against expropriation risk. We do notexclude this country, since doing so would help our hypothesis.
19

that were colonies in 1900, and do not use the earliest post-independence information for
Latin American countries and Neo-Europes . In columns 5 and 6, we adopt an alternative
approach and use the constraints on the executive in the first year of independence (and
also control separately for time since independence). The results are similar, and indicate
that early institutions persist.
Columns 7 and 8 show the association between protection against expropriation and
European settlements. The fraction of Europeans in 1900 alone explains approximately
29 percent of the variation in our institutions variable today. Columns 9 and 10 show the
relationship between the protection against expropriation variable and the mortality rates
faced by settlers. This specification will be the first-stage for our main 2SLS estimates.
These regressions show that settler mortality alone explains 26 percent of the differences
in institutions we observe today.
Panel B of Table 3 provides evidence in support of the hypothesis that early institu-
tions were shaped, at least in part, by settlements, and that settlements were affected by
mortality. Columns 1-2 and 5-6 relate our measure of constraint on the executive and
democracy in 1900 to the measure of European settlements in 1900 (fraction of the pop-
ulation of European decent). Columns 3—4 and 7-8 relate the same variables to mortality
rates of settlers. These regressions show that settlement patterns explain over 50 percent
of the variation in early institutions. Finally, columns 9 and 10 show the relationship
between settlements and mortality rates.
Overall, Table 3 provides support for our hypothesis that mortality rates faced by
potential settlers affected settlement behavior, and that settlement behavior affected the
type of institutions that the colonialists brought to the country, and finally that early in-
stitutions persisted to the present. We next use settler mortality directly as an instrument
for current institutions, and look at the impact of current institutions on performance.
5.2 Institutions and Economic Performance
The basic results are presented in Table 4. The main equation is (1). We treat the
protection against expropriation variable, Ri, as endogenous, and model it as
Ri = ζ + β logMi +X0iδ + vi (5)
where Mi is our settler mortality rate. The exclusion restriction is that this variable does
not appear in (1). So we estimate equations (1) and (5) jointly with two stage least
squares (2SLS), using logMi as an instrument for Ri.
20
Panel A of Table 4 reports 2SLS estimates of the coefficient of interest, α from equation
(1) and Panel B gives the corresponding first-stages.16 Column 1 displays the strong
first-stage relationship between (log) settler mortality and current institutions in our
base sample, also shown in Table 3. The corresponding 2SLS estimate of the impact
of institutions on income per capita is 0.95 This estimate is highly significant with a
standard error of 0.16, and in fact larger than the OLS estimates reported in Table 2.
This suggests that measurement error in the institutions variables that creates attenuation
bias is likely to be more important than reverse causality and omitted variables biases.
To evaluate the quantitative significance of these estimates, we again compare the 25th
and 75th percentiles of the distribution of the protection against expropriation variable
among all ex-colonies. The baseline 2SLS estimate of 0.95 implies that there should be
a 171 log point (450 percent) difference between the average GDPs of the countries at
the 25th and 75th percentiles of the distribution of protection against expropriation, as
compared to the 185 log points (540 percent) difference in the data. Therefore, these
estimates suggest that over three-quarters of the income per capita differences across
countries is due to differences in institutions. Figure 3 plots the predicted values of
income per capita from our baseline regression, which includes only the institutions index
as a regressor, against actual income per capita for the countries in our sample (as well
as the 45 degree line). Most observations are close to the 45 degree line, which confirms
the explanatory power of our regression.17
Column 2 shows that adding latitude does not change the relationship; the institutions
coefficient is now 0.98 with a standard error of 0.22.18 Remarkably, the latitude variable
now has the “wrong” sign and is insignificant. This result suggests that many previous
studies may have found latitude to be a significant determinant of economic performance
because it is correlated with institutions (or with their exogenous component caused by
early colonial experience).
Columns 3 and 4 document that our results are not driven by the Neo-Europes. When
we exclude the U.S., Canada, Australia, and New Zealand, the estimates remain highly
16We have also run these regressions with standard errors corrected for possible clustering of themortality rates assigned from the same disease environment. This clustering has little effect on thestandard errors, and does not change our results.
17The cloud of points in this graph indicates a slope somewhat smaller than the 45 degree line, so our2SLS estimates may be underpredicting the income level in the countries with the worst institutions.
18In 2SLS estimation, all covariates that are included in the second stage, such as latitude, are alsoincluded in the first stage. When these first stage effects are of no major significance for our argument,we do not report them in the tables to save space.
21
significant, and in fact increase a little. For example, the coefficient for institutions is
now 1.29 (s.e.=0.37) without the latitude control, and 1.2 (s.e.=0.35) when we control for
latitude.
Columns 5 and 6 show that the result is also robust to dropping all the African
countries from our sample. The estimates without Africa are somewhat smaller, but also
more precise. For example, the coefficient for institutions is 0.61 (s.e.=0.11) without the
latitude control, and 0.59 (s.e.=0.12) when we control for latitude.
In Columns 7 and 8, we add continent dummies to the regressions (for Africa, Asia
and other, with America as the omitted group). The addition of these dummies does
not change the estimated effect of institutions, and the dummies are jointly insignificant
at the 5 percent level, though the dummy for Asia is significantly different from that
of America. The fact that the African dummy is insignificant suggests that the reason
why African countries are poorer is not due to cultural or geographic factors, but mostly
accounted for by the existence of worse institutions in Africa.
In Appendix Table A4a, b, c, d, and e, we repeat the same exercise using a variety
of alternative measures of institutions. These are constraints on the executive from the
Polity III dataset, an index of law and order tradition from Political Risk Services, a
measure of property rights from the Heritage Foundation, a measure of rule of law from
the Fraser Institute, and the efficiency of the judiciary from Business International (see
Tables A1 and A4 for more details). The results and the magnitudes are very similar
to those reported in Table 4. Furthermore, in Appendix Table A3, we also report very
similar results with 1970 values for the constraints on the executive and income per capita
in 1970, which show that the relationship between institutional measures and income per
capita holds across time periods.19
We should note at this point that if we limit the sample to African countries only,
the first stage relationship using the protection against expropriation variable becomes
considerably weaker, and the 2SLS effect of institutions is no longer significant. The
2SLS effect of institutions continue to be significant when we use the constraint on the
19The presence of alternative measures of institutions also enables us to ascertain whether the differencebetween OLS and 2SLS estimates could really be due to measurement error in the institution variable. Ifwe use the constraints on the executive measure as an instrument for the protection against expropriationmeasure, this would solve the measurement error, but not the endogeneity problem. This exercise leadsto an estimate of the effect of protection against expropriation equal to .88 (with standard error .16),which suggests that measurement error in the institutions variables is very important, and can explainthe whole difference between the OLS and 2SLS estimates.
22

executive variable or Fraser Institute’s rule of law variable (and not with other measures).
Therefore, we conclude that the relationship between settler mortality and institutions is
weaker within Africa.
Overall, the results in Table 4 show a large effect of institutions on economic perfor-
mance. In the rest of the paper, we investigate the robustness of these results.
6 Robustness
6.1 Alternative samples
In Table 5, we investigate the robustness of our results in different subsamples. In Table
4 we reported results in samples which differed by region. Here our objective is to see
whether the results are robust to varying degrees of data quality and different methods of
constructing the mortality estimates. In columns 1 and 2, we only use data from Curtin
(1989), Death by Migration, which is for 17 countries and refers always to pre-1840 data.
In this smaller sample, we find an even stronger relationship both in the first stage and
the second stage. The 2SLS estimate of the effect of institutions on income per capita
is 1.0 (s.e.=0.25) without controlling for latitude, and 1.1 (s.e.=0.33) when latitude is
included in the regression (compared to 0.95 and 0.98 in Table 4).
In columns 3 and 4, we add data from the second book by Curtin (1998), Disease and
Empire, for the earliest date available for each country. This increases the sample to
31 countries, and reduces both the estimate and the standard error a little; the results
are now much more similar to those reported in Table 4. In columns 5 and 6, we use
other information (described in detail in the Appendix), to assign mortality rates to
neighboring countries with the same disease environment. This increases the sample to
44, and changes the estimates little. In columns 7 and 8, we add data for Latin America,
but this time from naval stations instead of bishops. The results are identical to those
obtained in Table 4. In columns 9 and 10, we use an alternative (“conservative”) coding of
the African data. In particular, rather than using African estimates from small samples,
we assign mortality rates to areas that shared the same disease environment. For example,
the same number from Sierra Leone is applied to Benin, Cote d’Ivoire, Ghana, Guinea,
Nigeria, Togo, and the number from French Soudan is assigned to Mali and Niger. This
leads to estimates very similar to our baseline results. Finally, in columns 11 and 12,
we report regressions using mortality rates relative to home country, which again yield
very similar effects. Overall we conclude that the results hold in different samples with
23
varying degrees of data reliability.
6.2 Additional controls
The validity of our 2SLS results in Table 4 depends on the assumption that settler mor-
tality in the past has no direct effect on current economic performance. Although this
presumption appears reasonable, here we substantiate it further by directly controlling
for many of the variables that could plausibly be correlated with both settler mortality
and economic outcomes. Overall, we find that our results change remarkably little with
the inclusion of these variables, and many variables emphasized in previous work become
insignificant once the effect of institutions is controlled for.
La Porta, Lopez-de-Silanes, Shleifer and Vishny (1999) argue for the importance of
colonial origin (main colonizer) as a determinant of current institutions. The identity of
the colonial power could also matter because it might have an effect through culture, as
argued by Landes (1998). In column 1, we add dummies for the identity of the main
colonizer (for Belgium, Germany, the Netherlands, Italy, France, Spain, Portugal, with
Britain as the omitted group).20 The top panel gives the 2SLS estimates, the second panel
gives the first stage, and the bottom panel gives the corresponding OLS coefficient on the
protection against expropriation variable. The even numbered columns add latitude.
With or without latitude, the effect of institutions on income per capita is robust to
the inclusion of these dummies. Interestingly, the first-stage estimates show that these
dummies are jointly insignificant at the 15 percent level (i.e., a p-value over .15), when
the effect of mortality rates faced by the colonizers is controlled for (even though the
dummy for being a Belgian colony, which captures the Congo, is significantly negative).
These results therefore show little evidence for a major influence of the identity of the
colonizer on institutions once we control for the effect of the mortality rates faced by
colonialists. They therefore contrast with a common perception that the British former
colonies perform better.21 The reason why British colonies appear to perform better in
20In the table, we only report the coefficients on the Belgian, French and Spanish dummies to savespace, but the other dummies are also included in the estimation.
212SLS estimates show that the identity of the colonizer does have an effect on income per capita (i.e.,an effect not working through institutions). In particular, Belgian and Spanish ex-colonies do better thanexpected relative to their institutions. This is because Belgian and Spanish ex-colonies have substantiallyworse institutions, but the performance of these countries is not as bad as would be expected on thebasis of their institutions alone. The Belgian and Spanish dummies therefore take on positive valuesin the 2SLS estimatation to compensate for this. For example, in the case of Belgian colonies, thefirst-stage effect is -2.9, which multiplied with the coefficient of 1.1 on institutions, implies that Belgian
24

other studies seems to be that Britain colonized places where settlements were possible,
and this made British colonies inherit better institutions (in our sample too, ex-British
colonies have considerably better institutions, so if we drop the log mortality variable
from the regression, the British dummy has a significant and large positive effect on
institutions).
Hayek and (1960) and LaPorta, Lopez-de-Silanes, Shleifer and Vishny (1999) also
emphasize the importance of legal origin. In columns 3 and 4, we control for legal origin.
In our sample, all countries have either French or British legal origins, so we simply add a
dummy for French legal origin (many countries that are not French colonies nonetheless
have French legal origin). Once again, our estimate of the effect of institutions on
income per capita is unaffected. This time, however, we find that French legal origin is
associated with worse institutions, even when we control for the mortality rates faced by
the settlers.22
An argument dating back to Max Weber views religion as a key determinant of eco-
nomic performance. To control for this, in columns 5 and 6, we add the fraction of the
populations that are Catholic, Muslim, and of other religions, with Protestants as the
ommitted group. In the table we report the significance level (p-value) of the correspond-
ing F-statistic for these dummies as well as the 2SLS estimate of the effect of institutions.
Religion appears highly correlated with income per capita (in particular, higher fractions
of Catholics and Protestants are associated with greater income per capita), but the 2SLS
estimate of the effect of institutions hardly changes. Finally, column 7 adds all the vari-
ables in this table simultaneously. Again, these controls have very little effect on our main
estimate.
Another concern is that settler mortality is correlated with climate and current dis-
ease environment. Our instrument may therefore be picking up the direct effect of these
variables. In Table 7, we add a set of temperature and humidity variables. These are:
average, minimum and maximum monthly high temperatures, and minimum and max-
imum monthly low temperatures, and morning minimum and maximum humidity, and
ex-colonies should be approximately 320 log points poorer. The positive coefficient of 2.4 in the second-stage somewhat compensates for this, and leaves a net effect of 240-320=-80 log points (122 percent) forBelgian colonies–still a very large effect!
22In the second stage estimation, when the effect of institutions on performance is taken into account,the French legal origin dummy is positive. This is again for the reasons outlined in footnote 21. The neteffect of having French legal origin is not as bad as one would expect on the basis of the effect of Frenchlegal origins on institutions, but is still substantially negative, -90+23=-67 log points (approximately 95percent).
25

afternoon minimum and maximum humidity. In the table we report joint significance
levels for these variables (all data from Parker, 1997). Again, they have little effect on
our estimates.
Sachs and a series of coauthors have argued for the importance of malaria in explain-
ing African poverty (see, for example, Bloom and Sachs, 1998, Gallup and Sachs, 1998,
and Gallup et al., 1998). Since malaria was one of the main causes of settler mortality,
our estimate may be capturing some of the direct effects of malaria. We are skeptical
of this argument since the prevalence of malaria is highly endogenous; it is the poorer
countries with worse institutions that have been unable to eradicate malaria.23 Moreover,
it is hard to imagine how malaria could have such a large effect on economic performance.
Although Sachs and coauthors argue that this works through poor health, high mortal-
ity and absenteeism, most people who live in high malaria areas have developed some
immunity to the disease–if they survive to the age of five, they can fall ill periodically
but malaria is not fatal to them (see Curtin, 1998, or Bruce-Chwatt, 1980). We might
therefore expect that malaria should not have a very large effect on economic performance
(though, obviously, it will have very high social costs). In contrast, for Europeans, or
anyone else who has not been exposed to malaria as a very young child, malaria is fatal,24
making variations in malaria a key determinant of whether Europeans could settle in a
colony.
In any case, controlling for malaria does not change our results. We do this in the
second part of Table 7 by controlling for the fraction of the population who live in an area
where falciporum malaria is endemic in 1994 (as constructed and used by Gallup et al,
1998). In Appendix C, we show that the inclusion of an endogenous variable positively
correlated with income or institutions will bias the coefficient on institutions downwards.
Since the prevalence of malaria in 1994 is highly endogenous, controlling for it directly
will therefore underestimate the effect of institutions on performance. As a result, the
coefficient on protection against expropriation is estimated to be somewhat smaller in
23For example, the U.S. eliminated malaria from the Panama Canal zone, and Australia eliminatedit from Queensland (see Crosby, 1986, pp.141-142). Even in Africa, there are very successful campaignagainst malaria, including those in Algeria and that conducted by the Rio-Tinto Zinc mining companyin Zambia (then Northern Rhodesia).
24Some types of malaria are quite local. It is therefore quite possible for a person to have immunityto the local version of malaria, but to be highly vulnerable to malaria a short distance away. Thisis probably one explanation why Africans had such high mortality when they were forced to move bycolonial powers. For example, African labor on the Congo-Ocean railroad had mortality of 240 perthousand at its peak, and 100 per thousand on average (Curtin, et al., 1995).
26

Table 7, .76 instead of .95 as in Table 4. Nevertheless, it remains highly significant with
a standard error of .27, while malaria itself is highly insignificant.25 Hence, we conclude
that the effect of settler mortality on performance is not through its correlation with the
current disease environment, but likely through its effect on institutions.
A related concern is that in colonies where Europeans settled, the current population
consists of a higher fraction of Europeans. One might be worried that we are capturing
the direct effect of having more Europeans. To control for this we add the fraction of the
population of European descent in columns 7 and 8 of Table 7 (constructed from McEvedy
and Jones (1978), Curtin et al (1995) and some additional sources; see Appendix Table
A5). Interestingly, this variable is insignificant, while the effect of institutions remains
highly significant, with a coefficient of .87 and a standard error of .21. In column 9 of
Table 7, we add all these variables, for temperature, humidity, malaria, and European
descent, together, and the estimate of the effect of protection against expropriation on
income per capita is affected little.
Finally, in Table 8 we add a variety of controls for other potential determinants of
income per capita. These include a measure of ethnolinguistic fragmentation, measures
of soil quality and natural resources, and whether the country is landlocked (see the
Table A1 in the Appendix for definitions). For example, in column 1 where we include
ethnolinguistic fragmentation, the coefficient of protection against expropriation is 0.74
(s.e.= 0.13), which is only slightly smaller than our baseline estimate. Since ethnolinguistic
fragmentation is likely to be endogenous with respect to development (i.e., ethnolinguistic
fragmentation tends to disappear during periods of growth and formation of centralized
markets, see Weber, 1976, or Andersen, 1983) and is correlated with settler mortality, the
estimate of 0.74 likely understates the effect of institutions on income (see Appendix C).
The estimates also change relatively little when other controls are added. We therefore
conclude that the effect of variations in institutions caused by early colonial experience
on income is robust, and likely captures the causal effect of institutions and government
policies on economic well-being.
25Malaria is marginally significant in column 9 when we control for latitude, fraction of Europeandescent, and eight temperature and humidity variables. Nevertheless, all of these variables, or any subsetof them with malaria, are always jointly insignificant. For example, the F-test that all of these variablesare insignificant has a p-value of .17.
27

6.3 Overidentification tests
We can also investigate the validity of our approach by using overidentification tests.
Recall that according to our theory, settler mortality affected settlements; settlements
affected early institutions; and early institutions affected current institutions. Mathemat-
ically, we expressed these links by equations (2), (3), and (4). We can test whether any
of these variables, C, S, and M , has a direct effect on income per capita, log y, by using
measures of C and S as additional instruments.
The overidentification test will reject if:
1. the equation of interest (1) does not have a constant coefficient, i.e., log yi = µ +
αiRi + εi, or
2. C or S has a direct effect on income per capita, log yi (i.e., either S or C is correlated
with εi), or
3. settler mortality, M , has an effect on log yi that works through another variable,
such as culture.
The overidentifying restrictions implied by our approach are never rejected. This
implies that, subject to the caveats related to the power of the overidentification tests, we
can rule out all three of the above possibilities. This gives us additional confidence that
settler mortality is a valid instrument and that we are estimating the effect of institutions
on current performance with our instrumental variable strategy (i.e., not capturing the
effect of some other variable correlated with settler mortality).
The results of the overidentification tests, and related results, are reported in Table 9.
In the top panel, Panel A, we report the 2SLS estimates of the effect of protection against
expropriation on GDP per capita using a variety of instruments other than mortality
rates, while Panel B gives the corresponding first-stages. These estimates are always
quite close to those reported in Table 4. For example, in column 1, we use European
settlements in 1900 as the only instrument for institutions. This results in an estimated
effect of .90 (with standard error .13), as compared to our baseline estimate of .95. The
other columns add latitude, and use other instruments such as constraint on the executive
in 1900 and in the first year of independence, and democracy in 1900.
Panel D reports an easy-to-interpret version of the overidentification test. It adds
the log of mortality as an exogenous regressor. If mortality rates faced by settlers had
28

a direct effect on income per capita, we would expect this variable to come in negative
and significant. In all cases, it is small and statistically insignificant in all cases. For
example, in column 1, log mortality has a coefficient of -.06 (with standard error .07).
This confirms that the impact of mortality rates faced by settlers likely works through
their effect on institutions.
Finally, for completeness, in Panel C we report the p-value from the appropriate
χ2 overidentification test. This tests whether the 2SLS coefficients estimated with the
instruments indicated in Panels A and B versus the coefficients estimated using (log)
settler mortality in addition to the other instruments are significantly different (e.g., in the
first column, the coefficients using European settlements alone are compared to estimates
using European settlements and log mortality as instruments). We never reject the
hypothesis that they are equal; so these results also show no evidence that mortality rates
faced by settlers have a direct effect–or an effect working through a variable other than
institutions– on income per capita.
7 Concluding Remarks
Many economists and social scientists believe that differences in institutions and state
policies are at the root of large differences in income per capita across countries. There is
little agreement, however, about what determines institutions and the attitude of govern-
ments towards economic progress. This makes it difficult to isolate exogenous sources of
variation in institutions to estimate their effect on performance. In this paper we argued
that differences in colonial experience could be a viable source of exogenous differences in
institutions.
Our argument rests on the following premises. Europeans adopted very different col-
onization strategies, with different associated institutions. In one extreme, as in the case
of the U.S., Australia and New Zealand, they went and settled in the colonies and set-up
institutions that enforced the rule of law and encouraged investment. In the other ex-
treme, as in the Congo or the Gold Coast, they set up extractive states with the intention
of transferring resources rapidly to the metropole. The slave trade is perhaps the most
extreme example of this behavior. These sets of institutions were very detrimental to in-
vestment and economic progress. Which colonization strategy was adopted was, at least
in part, determined by the feasibility of European settlement. In places where Europeans
faced very high mortality rates, they could not go and settle, and they were more likely
29

to set up extractive states. Finally, we argue that these early institutions persisted to the
present. Determinants of whether Europeans could go and settle in the colonies, therefore,
have an important effect on institutions today. We exploit these differences as a source
of exogenous variation to estimate the influence of institutions on economic performance.
We document these hypotheses in the data by showing a high correlation between
mortality rates faced by soldiers, bishops, and sailors in the colonies and European set-
tlements; between European settlements and early measures of institutions; and between
early institutions and institutions today. We estimate large effects of institutions on in-
come per capita using this source of variation. Our estimates imply that differences in
institutions account for roughly three-quarters of the differences in income per capita. We
also document that this relationship is not driven by outliers, and is robust to control-
ling for climate, current disease environment, religion, natural resources, and current race
composition.
It is useful to point out that our findings do not imply that institutions today are
predetermined by colonial policies and cannot be changed. We emphasize colonial expe-
rience as one of the many factors affecting institutions. Since mortality rates faced by
settlers are arguably exogenous, they are useful as an instrument to isolate the effect of
institutions on performance. In fact, our reading is that these results suggest substantial
income gains from improving institutions in poor countries.
There are many questions that our analysis does not address. Institutions are treated
to some degree as a “black-box”: our results indicate that reducing expropriation risk
(or increasing other measures of propoerty rights enforcement) would result in significant
gains in income per capita, but do not point out what type of concrete steps would lead
to an improvement in these institutions. Institutional features, such as expropriation
risk, property rights enforcement or rule of law, should probably be interpreted as an
equilibrium outcome, related to some more fundamental “institutions”, e.g., presidential
vs. parliamentary system, or the presence of common law, etc., which can be changed di-
rectly. A more detailed analysis of the effect of more fundamental institutions on property
rights and expropriation risk is an important area for future study.
30

8 Appendix A:Data Sources
Appendix Table A1 shows the complete list of variables that we use, together with
their definitions and sources.
9 Appendix B:Construction of Settler Mortality Data
Appendix Table A2 reports our estimates for settler mortality in each country. The first
column of mortality estimates shows data from Curtin (1989) for countries located in the
exact place for which we have a mortality estimate from the first half of the nineteenth
century. These data are used in the first two columns of Table 5.
We have direct estimates of settler mortality for Algeria (1831-38), Canada (1817-
36), Guyana (1819-36), Jamaica (1817-36), Malta (1817-36), Mauritius (1818-36), New
Zealand (1846-55), Senegal (1819-38), and Sierra Leone (1819-36). We also have compara-
ble estimates for Britain (1830-36) and France (1820-22 and 1824-26). In some cases there
has been a simple change of name, but the country is the same geographically. We can
therefore use the estimate of settler mortality from Ceylon (1817-36) for Sri Lanka, from
Coastal Burma (1829-38) for Myanmar, from Cape Colony (1818-36) for South Africa,
and from the Windwards and Leewards islands (1817-36) for Barbados and for Trinidad
and Tobago. It is also reasonable to use the mortality estimate from Bengal (1830-38)
for Bangladesh, from the Dutch East Indies (1819-28) for Indonesia, and from the Straits
Settlements (1829-38) for Malaysia and Singapore. Note that there is a large variation in
mortality between the Straits Settlements and Dutch East Indies, even though these areas
are quite close geographically. This is because there exists substantial variation in disease
environment, particularly for malaria, even in neighboring areas. For example, Curtin
(1998) explains in detail the substantial variation in malaria risk just within Madagascar
at the end of the nineteenth century. Micro-climate, particularly the pattern of rainfall
and the precise vegetation, play a significant role in determining the risk of malaria. See
Curtin (1989) for further discussion.
For large countries where we have more than one regional estimate, we need to make
a choice. For the U.S. we use the estimate for the Northern United States (1829-38).
For India we use the estimate from Madras (1829-38); this is lower than for Bengal but
higher than for Bombay. None of our regression results are significantly affected if we
use alternative regional data for these countries.
The second column of mortality estimates in Appendix Table A2 adds data from
31

Curtin (1998), which covers the second half of the nineteenth century. Whenever Curtin
provides more than one estimate, we use the earliest available number for each country.
We have mortality data directly from Mexico in 1862-63 and Tunisia in 1881. As we
note in the text, data from the second half of the nineteenth century have to be used with
care, because there were improvements in the practice of military medicine around the
mid-nineteenth century, but most of this would not have helped to reduce the mortality
of civilian settlers. For example, the British campaigns of 1882 in Egypt, 1867-68 in
Ethiopia and the 1884-85 Nile expedition had low mortality because the army hurried
in and out with reasonable preventive health measures. We use the estimate for the
Magdala campaign of 1867-68 for Ethiopia (Curtin 1998, p. 44) and the post-campaign,
1882, mortality estimate for Egypt (the Egyptian 1882 campaign mortality was about
half the mortality in the immediate post-campaign period, see Curtin 1998, p. 158). For
Sudan, we use the death rate from 1885 at Suakin (on the coast). This was 88.2 per 1000
mean strength, mostly from typhoid. The very high mortality from disease in Madagascar
in 1895 is a reasonable estimate of what settlers would have expected because this was
not a particularly well-organized campaign (Curtin 1998, p. 188).
In the Mali campaign during 1878, the French expeditionary force lost 49 percent of
its Europeans to disease, particularly to yellow fever, in less than two months (Curtin
1998, p. 89). This is equivalent to an annual rate of 2,940 per 1000 mean strength. This
is high relative to what would have been expected in most years, but quite typical of
periods when there was an outbreak of yellow fever. We do not know the true extent
of yellow fever in West Africa, precisely because it was a major disincentive to settle
and Europeans generally stayed away from the most dangerous places. Yellow fever was
thought less frequent on the Gold Coast (Ghana) than elsewhere in West Africa, but there
were recorded outbreaks in 1852, 1857, 1859, and 1862 (Curtin 1998, p. 65). In April-May
1873, an outbreak of yellow fever in the Niger delta killed two-thirds of the Europeans
there. This was a quite typical death rate (see Curtin 1998, Table 4.1, p. 79, for the death
rate of Europeans in Senegal yellow fever epidemics). The case fatality for nonimmune
adults before quinine was 25-75 percent from malaria and 75 percent for yellow fever.
In Gambia, from May 1825 to December 1826, fever killed 279 British soldiers out
of a force that was seldom over 120 and often only 40 strong (Curtin 1998, p. 10).
Assuming a mean strength of 120 gives total deaths per 1,000 of 2,300, which is high but
not extraordinary for that time and place. This converts into a mortality rate of 120 per
32

month, or 1,470 per year.
The second column of mortality estimates in Appendix Table A2 assigns a settler
mortality number to a modern country if the country name today is the same as in Curtin
(1998). In Haut-Senegal (Niger), in 1880-83 there was a death rate of 400 per 1000 mean
strength (Curtin 1998, p. 85). In 1841, European mortality on a Niger expedition (in
modern Nigeria) was 167 per 1000 per month, equivalent to 2,004 per 1000 mean strength
per year (Curtin 1998, p. 89). In a period of several months, 82 percent of the Europeans
died from malaria. At least in this time and place, it was almost impossible for a person
to go for an entire year without receiving at least one infective mosquito bite.
This second column also assigns the same number to countries that were previously
part of one country. For example, Burkina Fasu, Central African Federation, Chad, French
Congo, and Mauritania were part of French Soudan. The estimate for Vietnam is from
Cochin China.
The third column of mortality estimates assigns a mortality number to a country if it
neighbors a country for which we have data and has the same disease environment. On
the Gold Coast (approximately southern Ghana today) in the period 1824-26, European
troops died from disease at a rate of 668 per 1000 per annum (Curtin 1998, p. 18).
Cote d’Ivoire and Togo had the same disease environment and we use the same estimate.
Angola, Cameroon, Rwanda, and Uganda receive the estimate from French Soudan, and
Guinea is from the Sierra Leone estimate. The estimate for Morocco is from Algeria and
Pakistan is from Bombay. Surinam is a neighor of French Guinea, for which we have a
direct estimate for the period 1819-36. The estimate for Kong is from the 1860 China
Field Force.
The third column of mortality estimates also assigns a number to several countries
for which we do not have mortality data for Europeans but we do have data for Africans
who moved into this country from a different disease environment, so they did not have
a built-up immunity to local malaria. As Curtin (1968) shows, in all situations where we
have adequate data, mortality of Africans from a disease environment is lower than but
comparable to European mortality. We can have a reasonable lower bound on European
mortality in Kenya of 145 per 1000 (Curtin et al 1995, p. 491) and in Congo of 240 per
1000 (Curtin et al 1995, p. 463).
The fourth column of Appendix Table A2 provides the data that we use in most of our
analysis. We use the data from the third column and add settler mortality estimates for a
33

few countries that are close by and have the same disease environment as places for which
we have direct data. We use the New Zealand estimate for Australia and the Windwards
and Leewards estimate for the Bahamas, Jamaica for Haiti and the Dominican Republic
(information from Gutierrez 1986 indicates that these were similar disease environments).
We also use a combination of the Gutierrez (1986) and Curtin (1989) numbers to
construct estimates for South America. Gutierrez calculates the mortality of bishops
aged 40-49 for three disease environments in the Caribbean, Central and South America:
10 (low), 11 (medium), and 23 (high) per 1000. We assume the ratio between bishop
mortality levels in different disease environments was the same as the ratio between soldier
mortality. We also assume that the type of disease environment (low, medium or high)
was the same for bishops and soldiers. We then use Gutierrez’s ratios with the Curtin
(1998) estimate of mortality of 71 per 1000 for Mexico 1862-63 (a low mortality region
in Gutierrez’s classification), to generate estimates of mortality for Central and South
America.
Note that the estimates we obtain would be virtually the same if we used the Curtin
(1989) estimate for Jamaica as the benchmark (a high disease environment by Gutierrez’s
classification). The implied mortality in Jamaica, using the Gutierrez data, would be
163.3. The direct estimate for mortality in Jamaica is 130 per 1000 in 1817-36 (Curtin,
1989). Running our regressions using data that takes Jamaica as the base for applying
the Gutierrez’s ratios actually strengthens our results.
Gutierrez provides considerable detail on the location of low, medium, and high mortal-
ity areas for bishops. High mortality regions are the Caribbean, low lying parts of Central
America, and tropical South America. This includes Nicaragua, and Panama. Medium
mortality locations are Costa Rica, El Salvador, Honduras, Paraguay, and Venezuela.
Low mortality locations are Bolivia, Brazil, Colombia, Ecuador, Guatemala, Peru, and
Uruguay.26 Some of these countries have a large variation in their disease environment,
even for a relatively small country. We know, for example, that the Colombian coast
was very unhealthy to Europeans. Mortality in the British siege of Cartegena in 1742
was very high– the force was there for only two months, but deaths from disease were
between 2/3 and 3/4 of the army (Curtin, 1989, p. 2). But most Europeans who went
26It is particularly difficult to assign an estimate to Brazil because we do not know the precise differencein mortality between the North-East, where much of the early settlement was attempted, and moresouthern locations that later attracted population. We have adopted a low mortality estimate as this isless favorable to our hypothesis.
34

to Colombia were able to settle at a higher altitude, e.g., in Bogota, where the disease
environment was much more favorable. It therefore seems reasonable to follow Gutier-
rez’s classification of disease environments, as the bishops tended to live where European
population was concentrated.
The last column of Appendix Table A2 uses an alternative source to calculate mortality
in Latin America. Average annual mortality, 1825-1845, from disease in the British naval
forces off West Africa was 54.4 per thousand (Curtin, 1964, p. 486). Comparable
mortality from disease at other naval stations over the same period was 7.7 in South
America, 9.3 in the Mediteranean, 9.8 in the Home Station, 15.1 in the East Indies, and
18.1 in the West Indies. The level of mortality from disease for British sailors was lower
than for British soldiers in all locations, but it is reasonable to assume that the ratio of
mortalities between the various regions was approximately the same.
This change of data does not affect the numbers much. For example, Argentina and
Chile move from a mortality of 71 per 1000 (using the data on bishops) to 68.9 (using the
data on naval forces). Table 5 reports regression results using alternative classifications,
with little effect on our findings.
Our baseline estimates in column 4 imply very high mortality rates in a number of
West African countries. Some of these estimates come from relatively small samples of
soldiers. We take comfort in the fact that our results are not affected when all African
countries are dropped from the sample. Nevertheless, as another check on our results, we
constructed a more conservative series of mortality estimates, which is reported in column
6. This series uses only Curtin estimates from long sample periods, and assigns those
to neighboring countries with the same disease environment. In particular, this series
assigns the mortality estimate from Sierra Leone to Cote d’Ivoire, Ghana, Nigeria, and
Togo, and assigns the estimate from French Soudan to the French Congo, Kenya, Mali,
Niger, Tanzania, and Zaire. We also use an alternative, lower estimate of mortality for
Madagascar (from Curtin, 1998). Table 5 shows that this different series leads to very
similar results to our baseline series.
There still remain several significant gaps. Most important, we do not have any
reliable estimates for much of Southern Africa, including Lesotho, Namibia, Swaziland,
Zimbabwe, Zambia, Malawi, Mozambique, or Botswana. We also do not have any rea-
sonable estimates for Eritrea, the Philippines, Cape Verde or Comoros. Liberia and
Thailand were not colonies and are not included in our study.
35
Appendix Table A2 reports mortality data for several countries for which we do not
have data on institutions or GDP per capita (PPP basis): Barbados, Central African
Federation, Chad, Mauritania, Myanmar, Mauritius, Rwanda, and Surinam. Qualita-
tively, the GDP per capita in these countries is quite consistent with the settler mortality
numbers and our regression results.
Finally, note that these estimates of mortality for soldiers are similar to the more
fragmentary evidence available on civilian settlers. For example, we know that early
European attempts to settle in West Africa foundered due to high mortality from disease
(Curtin, 1964). In the “Province of Freedom” European mortality in the first year was
46 percent, in Bulama (April 1792-April 1793) there was 61 percent mortality among
Europeans, and in the first year of the Sierra Leone Company (1792-1793) 72 percent of
the European settlers died.
36
10 Appendix C:Bias in The Effect of Institutions When OtherEndogenous Variables Are Included
To simplify notation, suppose that Ri is exogenous, and another variable that is endoge-
nous, zi, such as prevalence of malaria or ethnolinguistic fragmentation, is added to the
regression. Then, the simultaneous equations model becomes
Yi = µ0 + αRi + πzi + εi
zi = µ1 + φYi + ηi,
where Yi = log yi. We presume that α ≥ 0, φ < 0, and π < 0, which implies that
we interpret zi as a negative influence on income. Moreover, this naturally implies that
cov (ηi, εi) < 0 and cov (zi, Ri) < 0, that is the factor zi is likely to be negatively correlated
with positive influences on income.
Standard arguments imply that
plimbα = α+ cov³ eRi, εi´
var( eRi) = α− κ · cov(zi, εi)var( eRi) ,
where κ and are eRi are the coefficient and the residual from the auxiliary equation,
Ri = κ0 + κzi + eRi,and so
κ =cov (zi, Ri)
var (zi)< 0,
which is negative due to the fact that cov (Ri, zi) < 0. The reduced form for zi is:
zi =1
1− φπ ((µ+ φπ) + φαRi + φεi + ηi) . (7)
We impose the regularity condition φ · π < 1, so that an increase in the disturbance tothe z-equation, ηi, actually increases zi. Now using this reduced form, we can write
plim bα = α− κ · cov(zi, εi)var( eRi) = α− κ · (σεη + φσ
2ε)
(1− φπ) · var( eRi) (8)
where σ2ε is the variance of ε, and σεη is the covariance of ε and η.
Substituting for κ in (8), we obtain:
plim bα = α− (σεη + φσ2ε)
(1− φπ) · var( eRi) ·cov (zi, Ri)
var (zi)
Recall that φ < 0, σεη < 0, and cov (zi, Ri) < 0. Therefore, plim bα < α, and when wecontrol for the endogenous variable zi, the coefficient on our institution variable will be
biased downwards.
37

REFERENCES
Acemoglu, Daron (1995) “Reward Structures and the Allocation of Talent,” Eu-
ropean Economic Review, 39, 17-38.
Acemoglu, Daron and James A. Robinson (2000) “Political Origins of Poverty
and Prosperity,” Unpublished Working Paper, MIT.
Acemoglu, Daron and Thierry Verdier (1998).“Property Rights, Corruption
and the Allocation of Talent: A General Equilibrium Approach.” Economic Journal,
108, 1381-1403.
Alesina, Alberto and Roberto Perotti (1996) “Income Distribution, Political
Instability and Investment,” European Economic Review, 40, 1203-1225.
Anderson, Benedict (1983) Imagined Communities, Verso, London.
Angrist, Joshua and Guido Imbens (1995) “Two-Stage Least Squares Estimates
of Average Causal Response in Models with Variable Treatment Intensity,” Journal of the
American Statistical Association,
Bates, Robert H. (1981) Markets and States in Tropical Africa, University of
California Press, Berkeley CA.
Bates, Robert H. (1983) Essays on the Political Economy of Rural Africa, Cam-
bridge University Press, Cambridge.
Bertocchi, Graziella and Fabio Canova (1996) “Did Colonization Matter for
Growth? An Empirical Exploration into the Historical Causes of Africa’s Underdevelop-
ment,” CEPR Discussion Paper #1444.
Besley, Timothy (1995) “Property Rights and Investment Incentives: Theory and
Evidence from Ghana,” Journal of Political Economy, 103, 903-937.
Bloom, David E. and Jeffrey D. Sachs (1998) “Geography, Demography, and
Economic Growth in Africa,” Brookings Papers on Economic Activity, 1998:2, 207-295.
Boone, Catherine (1992) Merchant Capital and the Roots of State Power in Sene-
gal, 1930-1985, Cambridge University Press, New York NY.
Bowman, Larry W (1991) Mauritius: democracy and development in the Indian
Ocean, Boulder, Colo., Westview Press.
Bruce-Chwatt, Leonard J. (1980) Essential Malariology, London.
Cain, Philip J. and Anthony G. Hopkins (1993) British Imperialism: Innovation
and Expansion 1688-1914, Longman, New York.
38

Callaghy, Thomas M. (1984) The State-Society Struggle: Zaire in Comparative
Perspective, Columbia University Press, New York NY.
Chabal Patrick (1986) Political Domination in Africa, Cambridge University Press,
Cambridge.
Chazan Noami et al (1988) Poilitcs and Society in Contemporary Africa, Boulder,
Colo..
Coatsworth, John H. (1978) “Obstacles to Economic Growth in Nineteenth-Century
Mexico,” American Historical Review, 83, 80-100.
Coatsworth, John H. (1982) “The Limits of Colonial Absolutism: Mexico in the
Eighteenth Century,” in Karen Spalding ed. Essays in the Political, Economic and Social
History of Latin America, University of Delaware Press, Newark DL.
Coatsworth, John H. (1999) “Economic and Institutional Trajectories in Nine-
teenth Century Latin America,” in John H. Coatsworth and Alan M. Taylor eds. Latin
America and the World Economy since 1800, Harvard University Press, Cambridge MA.
Coplin, William D., Michael K. O’Leary, Tom Sealy (1991) A Business Guide
to Political Risk for International Decisions, 2nd edition, Political Risk Services, Syracuse,
NY.
Crosby, Alfred (1986) Ecological Imperialism: The Biological Expansion of Europe
900-1900, Cambridge University Press, New York NY.
Crowder, Michael (1968) West Africa under Colonial Rule, Northwestern Univer-
sity Press, Evanston IL.
Curtin, Philip D. (1964) The Image of Africa, University of Wisconsin Press,
Madison.
Curtin, Philip D. (1968) “Epidemiology and the Slave Trade,” Political Science
Quarterly, 83:181-216.
Curtin, Philip D. (1989) Death by Migration: Europe’s Encounter with the Tropical
World in the Nineteenth Century, Cambridge University Press, New York NY.
Curtin, Philip D. (1998) Disease and Empire: The Health of European Troops in
the Conquest of Africa, Cambridge University Press, New York NY.
Curtin, Philip D., Steven Feierman, Leonard Thompson, and Jan Vansina
(1995) African History: From Earliest Times to Independence, Longman, London and
New York, Second Edition.
Davis, Lance E. and Robert A. Huttenback (1987)Mammon and the Pursuit of
39

Empire: The Political Economy of British Imperialism, 1860-1912, Cambridge University
Press, Cambridge UK.
Denoon, Donald (1983) Settler Capitalism: The Dynamics of Dependent Develop-
ment in the Southern Hemisphere, Clarendon Press, Oxford UK.
Diamond, Jared M. (1997) Guns Germs and Steel: The Fate of Human Societies,
W.W. Norton & Co., New York NY.
Easterly, William and Ross Levine (1997) “Africa’s Growth Tragedy: Policies
and Ethnic Divisions,” Quarterly Journal of Economics, 1203-1250.
Engerman, Stanley L. and Kenneth L. Sokoloff (1997) “Factor Endowments,
Institutions, and Differential Paths of Growth among New World Economies,” in S.H.
Haber ed. How Latin America Fell Behind, Stanford University Press, Stanford CA.
Engerman, Stanley L., Elisa Mariscal and Kenneth L. Sokoloff (1998) “School-
ing, Suffrage, and the Persistence of Inequality in the Americas, 1800-1945,” Unpublished
Paper, Department of Economics, UCLA.
Fieldhouse, David K. (1999) The West and the Third World, Blackwell, Oxford
UK.
Freiden, Jeffery (1994) “International Investment and Colonial Control: A New
Interpretation,” International Organization, 48, 559-593.
Gallup, John L., Andrew D. Mellinger and Jeffrey D. Sachs (1998) “Geog-
raphy and Economic Development,” NBER Working Paper #6849.
Gallup, John L. and Jeffrey D. Sachs (1998) “The Economic Burden of Malaria,”
Unpublished paper, Harvard Center for International Development, October.
Gann, Lewis. H. and Peter Duignan (1962) White Settlers in Tropical Africa,
Penguin, Baltimore MD.
Gann, Lewis. H. and Peter Duignan (1979) The Rulers of Belgian Africa,
Princeton University Press, Princeton NJ.
Grier, Robin M (1999) “Colonial Legacies and Economic Growth” Public Choice
Vol. 98 (3-4), 317-35
Gutierrez, Hector (1986) “La Mortalite des Eveques Latino-Americains aux XVIIe
et XVII Siecles,” Annales de Demographie Historique, 29-39.
Gurr, Ted Robert (1997) “Polity II: Political Structures and Regime Change,
1800-1986,” Unpublished paper, University of Colorado, Boulder.
Gwartney, James and Robert Lawson (1997) Economic Freedom of the World
40

1997, The Fraser Institute.
Hall, Robert E. and Charles I. Jones (1999) “Why Do Some Countries Produce
so Much More Output per Worker than Others?,” Quarterly Journal of Economics, CXIV,
83-116.
Hayek, Frederich A. von (1960) The Constitution of Liberty University of Chicago
Press,
Herbst, Jeffrey (2000) States and Power in Africa, Princeton University Press,
Princeton.
Holmes, Kim R., Bryan T. Johnson, and Melanie Kirkpatrick (1997) 1997
Index of Economic Freedom, The Heritage Foundation and The Wall Street Journal,
Washington DC and New York.
Hughes, Robert (1987) The Fatal Shore, Collins Harvill, London UK.
Jones, Eric L. (1981) The European Miracle: Environments, Economies and Geopol-
itics in the History of Europe and Asia, Cambridge University Press, Cambridge UK.
Jewsiewicki, B. (1983) “Rural Society and the Belgian Colonial Economy,” in D.
Birmingham and P.M. Martin eds. The History of Central Africa, Volume II, Longman,
New York.
Johnson, Simon, John McMillan and Christopher Woodruff (1999) ”Prop-
erty Rights and Finance,” Unpublished working paper, MIT and UC San Diego.
Knack, Steven and Philip Keefer (1995) “Institutions and Economic Perfor-
mance: Cross-Country Tests Using Alternative Measures,” Economics and Politics, 7,
207-227.
Landes, David S. (1998) The Wealth and Poverty of Nations: Why Some Are So
Rich and Some So Poor, W.W. Norton & Co., New York.
Lang, James (1975) Conquest and Commerce: Spain and England in the Americas,
Academic Press, New York NY.
La Porta, Rafael, Florencio Lopez-de-Silanes, Andrei Shleifer and Robert
W. Vishny (1998). “Law and Finance,” Journal of Political Economy, 106, 1113-55.
La Porta, Rafael, Florencio Lopez-de-Silanes, Andrei Shleifer and Robert
W. Vishny (1999) “The Quality of Government,” Journal of Law, Economics and
Organization, 15, 222-279.
Lewis, W. Arthur (1965) Politics in West Africa, Oxford University Press, New
York NY.
41
Lipset, Seymour M. (1994) “The Social Requisites of Democracy Revisited,”
American Sociological Review, 59, 1-22.
Lockhart, James and Stuart B. Schwartz (1983) Early Latin America, Cam-
bridge University Press, New York NY.
Lynch, John (1986) The Spanish American Revolutions, 1808-1826, W.W. Norton
& Co. New York NY.
Manning, Patrick (1982) Slavery, Colonialism, and Economic Growth in Dahomey,
1640-1980, Cambridge University Press, New York NY.
Manning, Patrick (1988) Francophone Sub-Saharan Africa, 1880-1995, Cambridge
University Press, New York NY.
Mauro, Paulo (1995) “Corruption and Growth,” Quarterly Journal of Economics,
CX, 681-712.
Mazingo, Christopher (1999) “Effects of Property Rights on Economic Activity:
Lessons from the Stolypin Land Reform,” Unpublished Paper, Department of Economics,
MIT.
McEvedy, Colin and Richard Jones (1975), Atlas of World Population History,
Facts on File, New York.
McNeill, William H. (1976) Plagues and Peoples, Anchor Press, Garden City NJ.
Montesquieu, Charles de Secondat [1748] (1989) The Spirit of the Laws, Cam-
bridge University Press, New York NY.
North, Douglas C. (1981) Structure and Change in Economic History, W.W. Nor-
ton & Co., New York.
North, Douglass C., William Summerhill and Barry Weingast (1998) “Or-
der, Disorder and Economic Change: Latin America vs North America,” Unpublished
Manuscript, Hoover Institution, Stanford University.
North, D.C. and R.P. Thomas (1973) The Rise of the Western World: A New
Economic History, Cambridge University Press, Cambridge UK.
Parker, Philip M. (1997) National Cultures of the World: A Statistical Reference,
Cross-Cultural Statistical Encyclopedia of the World, Volume 4, Greenwood Press, West-
port, CT.
Peemans, Jean-Philippe (1975) “Capital Accumulation in the Congo under Colo-
nialism: The Role of the State,” in Lewis. H. Gann and Peter Duignan eds. Colonialism
in Africa 1870-1960, Volume 4 The Economics of Colonialism, Hoover Institution Press,
42
Stanford CA.
Reno, William (1995) Corruption and State Politics in Sierra Leone, Cambridge
University Press, New York NY.
Rimmer, Douglas (1992) Staying Poor: Ghana’s Political Economy 1950-1990,
Pergamon Press, Oxford UK.
Roberts Andrew (1976) A History of Zambia, Heinemann, London.
Robinson, Ronald E. and John Gallagher (1961) Africa and the Victorians:
The Official Mind of Imperialism, MacMillan, London.
Rodrik, Dani (1999) “Where has all the Growth Gone?” forthcoming in the Journal
of Economic Growth.
Turner, Thomas and Crawford Young (1985) The Rise and Decline of the
Zairian State, University of Wisconsin Press, Madison WI.
Weber, Eugen J. (1976) Peasants into Frenchmen, Stanford University Press, Stan-
ford CA.
Wittfogel, Karl A. (1957) Oriental Despotism: A Comparative Study of Total
Power, Yale University Press, New Haven CT.
Young, Crawford (1994) The African Colonial State in Comparative Perspective,
Yale University Press, New Haven CT.
43

Table 1Descriptive Statistics
Whole World
Base Sample By Quartiles of Mortality
(1) (2) (3) (4)
Log GDP per capita (PPP) in 1995 8.3 8.05 8.9 8.4 7.73 7.2(1.1) (1.1)
Average Protection Against 7 6.5 7.9 6.5 6 5.9Expropriation Risk, 1985-1995 (1.8) (1.5)
Constraint on Executive in 1990 3.6 4 5.3 5.1 3.3 2.3(2.3) (2.3)
Constraint on Executive in 1900 1.9 2.3 3.7 3.4 1.1 1(1.8) (2.1)
Constraint on Executive in First 3.6 3.3 4.8 2.4 3.1 3.4Year of Independence (2.4) (2.4)
Democracy in 1900 1.1 1.6 3.9 2.8 0.19 0(2.6) (3.0)
European Settlements in 1900 0.31 0.16 0.32 0.26 0.08 0.005(0.4) (0.3)
Log Mortality n.a. 4.7 3 4.3 4.9 6.3(1.1)
Number of Observations 163 64 14 18 17 15Standard deviations are in parentheses. Mortality is potential settler mortality, in deaths per annum per 1000 people, sources and methods are described in Appendix Table 2. Quartiles of mortality are for our base sample of 64 observations. These are: (1) less than 65.4; (2) greater than or equal to 65.4 and less than 78.1; (3) great than or equal to 78.1 and less than 280; (4) greater than or equal to 280. Average Protection Against Expropriation is measured on a scale from 0 to 10, where a higher score indicates greater protection against risk of expropriation of investment by government, from Political Risk Services, with128 observations in the Whole World sample and 64 observations in our Base Sample. Constraint on Executive in 1990, 1900, and First Year of Independence is measured from 1 to 7, where a higher score indicates more constitutional limits on arbitrary actions by the executive in that year, from the Polity III data set, with 89 observations in the Whole World sample and 59 observations in our Base Sample. First Year of Independence is the first year that the country appears in the Polity III data set. Democracy in 1900 is measured on a scale from 0 to 10, where a higher score indicates more democracy, from the Polity III data set, with 89 observations in the Whole World sample and 59 observations in our Base Sample. European settlements in 1900 is the fraction of the population in 1900 that was European or of European descent constructed from McEvedy and Jones (1978), Curtin et al (1995) and some additional sources (see Appendix Table A5), with 155 observations in the Whole World sample and 63 observations in the Base Sample. Constraint on executive in 1900 and democracy in 1900 are set equal to 1 (the lowest score) for countries that were colonies in that year. See Appendix Table A1 for more detailed variable definitions and sources.

Table 2OLS Regressions
Whole World
Whole World
Base Sample
Base Sample
Whole World
Whole World
Base Sample
Base Sample
(1) (2) (3) (4) (5) (6) (7) (8)
Average Protection Against 0.54 0.52 0.46 0.42 0.46 0.40Expropriation Risk, 1985-1995 (0.04) (0.06) (0.06) (0.05) (0.07) (0.06)
Dummy for anti-expropriation index 0.27 0.52in second quartile (0.22) (0.25)
Dummy for anti-expropriation index 1.50 1.50in third quartile (0.22) (0.26)
Dummy for anti-expropriation index 2.20 2.00in fourth quartile (0.21) (0.35)
Latitude 1.00 0.50 1.80 1.10(0.49) (0.51) (0.72) (0.63)
Asia Dummy -0.67 -0.66(0.19) (0.23)
Africa Dummy -1.00 -0.90(0.16) (0.17)
"Other" Continent Dummy -0.28 -0.04(0.21) (0.32)
Adjusted R-Squared 0.61 0.58 0.52 0.43 0.62 0.72 0.55 0.68
N 110 110 64 64 110 110 64 64Dependent Variable: Log GDP per capita (PPP basis) in 1995, current prices, (from the World Bank's World Development Indicators 1999). Average protection against expropriation risk is measured on a scale from 0 to 10, where a higher score means more protection against expropriation, averaged over 1985 to 1995, from Political Risk Services. Standard errors are in parentheses. In regressions including dummies for the anti-expropriation index, the dummy for the first quartile --i.e., with highest risk of expropriation-- is the omitted category. In regressions with continent dummies, the dummy for America is omitted. See Appendix Table A1 for more detailed variable definitions and sources.
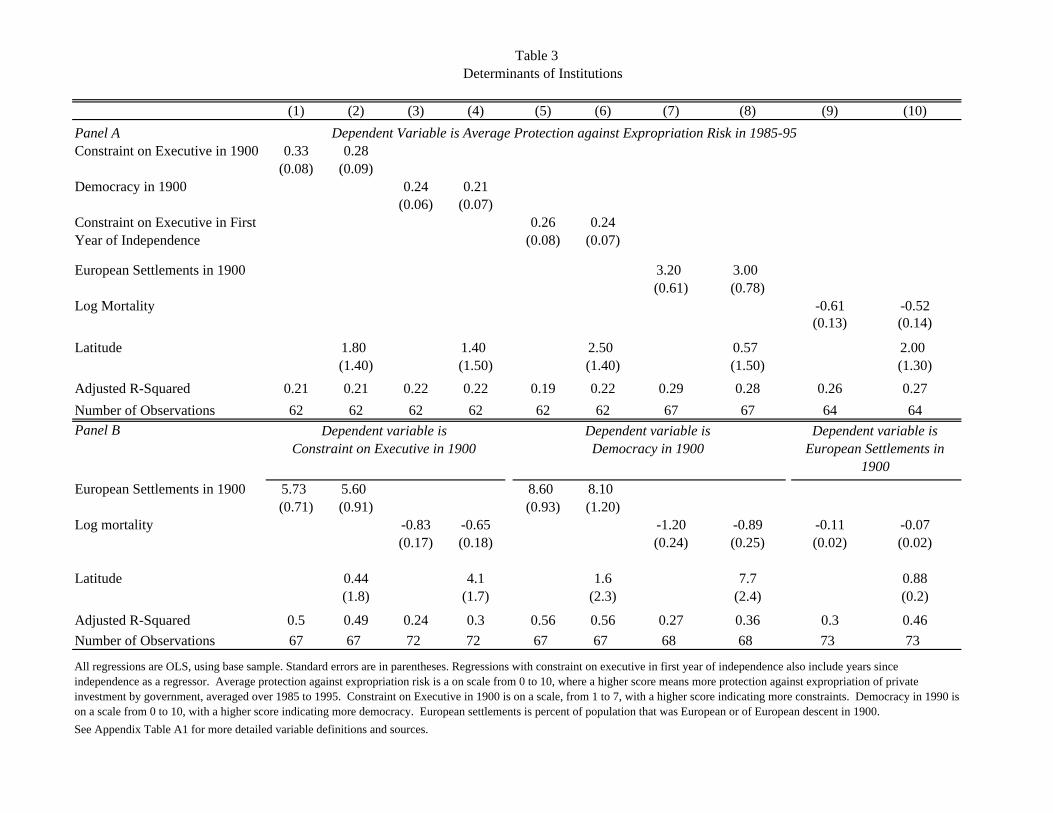
Table 3Determinants of Institutions
(1) (2) (3) (4) (5) (6) (7) (8) (9) (10)Panel A Dependent Variable is Average Protection against Expropriation Risk in 1985-95Constraint on Executive in 1900 0.33 0.28
(0.08) (0.09)Democracy in 1900 0.24 0.21
(0.06) (0.07)0.26 0.24
Year of Independence (0.08) (0.07)
European Settlements in 1900 3.20 3.00(0.61) (0.78)
Log Mortality -0.61 -0.52(0.13) (0.14)
Latitude 1.80 1.40 2.50 0.57 2.00(1.40) (1.50) (1.40) (1.50) (1.30)
Adjusted R-Squared 0.21 0.21 0.22 0.22 0.19 0.22 0.29 0.28 0.26 0.27Number of Observations 62 62 62 62 62 62 67 67 64 64Panel B
European Settlements in 1900 5.73 5.60 8.60 8.10(0.71) (0.91) (0.93) (1.20)
Log mortality -0.83 -0.65 -1.20 -0.89 -0.11 -0.07(0.17) (0.18) (0.24) (0.25) (0.02) (0.02)
Latitude 0.44 4.1 1.6 7.7 0.88(1.8) (1.7) (2.3) (2.4) (0.2)
Adjusted R-Squared 0.5 0.49 0.24 0.3 0.56 0.56 0.27 0.36 0.3 0.46Number of Observations 67 67 72 72 67 67 68 68 73 73
See Appendix Table A1 for more detailed variable definitions and sources.
All regressions are OLS, using base sample. Standard errors are in parentheses. Regressions with constraint on executive in first year of independence also include years since independence as a regressor. Average protection against expropriation risk is a on scale from 0 to 10, where a higher score means more protection against expropriation of private investment by government, averaged over 1985 to 1995. Constraint on Executive in 1900 is on a scale, from 1 to 7, with a higher score indicating more constraints. Democracy in 1990 is on a scale from 0 to 10, with a higher score indicating more democracy. European settlements is percent of population that was European or of European descent in 1900.
Constraint on Executive in First
Dependent variable is Constraint on Executive in 1900
Dependent variable is Democracy in 1900
Dependent variable is European Settlements in
1900

Table 4IV Regressions of log GDP per capita
Base Sample
Base Sample
Base Sample without
neo-Europes
Base Sample without
neo-Europes
Base Sample without Africa
Base Sample without Africa
Base Sample
with Continent Dummies
Base Sample
with Continent Dummies
(1) (2) (3) (4) (5) (6) (7) (8)Panel A: Two Stage Least Squares
Average Protection Against 0.95 0.98 1.29 1.2 0.61 0.59 0.93 1.00Expropriation Risk 1985-1995 (0.16) (0.22) (0.37) (0.35) (0.11) (0.12) (0.24) (0.3)
Latitude -0.4 1.3 0.22 -0.77(1.30) (1.50) (0.89) (1.5)
Asia Dummy -0.96 -1.00(0.37) (0.44)
Africa Dummy -0.47 -0.45(0.33) (0.37)
"Other" Continent Dummy -0.67 -0.68(0.6) (0.6)
Panel B: First-Stage for Average Protection against Expropriation Risk in 1985-95Log Mortality -0.61 -0.52 -0.39 -0.4 -1.2 -1.1 -0.48 -0.4
(0.13) (0.14) (0.13) (0.14) (0.20) (0.24) (0.16) (0.17)
Latitude 2.00 -0.15 1.9(1.30) (1.50) (1.40)
Asia Dummy 0.3 -0.4(0.5) (0.5)
Africa Dummy -0.26 -0.24(0.41) (0.41)
"Other" Continent Dummy 1 -0.87(0.68) (0.68)
Adjusted R-Squared 0.26 0.27 0.12 0.1 0.45 0.54 0.26 0.27
Panel C: Ordinary Least SquaresAverage Protection Against 0.52 0.46 0.48 0.46 0.48 0.45 0.43 0.4Expropriation Risk 1985-1995 (0.06) (0.06) (0.08) (0.08) (0.07) (0.08) (0.06) (0.06)
Number of Observations 64 64 60 60 37 37 64 64"Average Protection Against Expropriation Risk 1985-95" is measured on a scale from 0 to 10, where a higher score means more protection against risk of expropriation of investment by the government, from Political Risk Services (see Appendix Table A1 for more detail). Panel A reports the two stage least squares estimates with log GDP per capita (PPP basis) in 1995 as the dependent variable and instrumenting for protection against expropriation risk using log settler mortality; Panel B reports the corresponding first stage. Panel C reports the OLS coefficient from regressing log GDP per capita on protection against expropriation risk, with the other control variables indicated in that column (full results not reported to save space). Standard errors are in parentheses. In regressions with continent dummies, the dummy for America is omitted.

Table 5IV Regressions of log GDP per capita with Alternative Samples
Pre-1855 data
Pre-1855 data
Earliest available
data
Earliest available
data
Including neighbors with same
disease environment
Including neighbors with same
disease environment
Including Latin
America (from naval
stations)
Including Latin
America (from naval
stations)
Alternative Version of Curtin data on Africa
Alternative Version of Curtin data on Africa
Using Log of Ratio of Colonial to European Mortality
Using Log of Ratio of Colonial to European Mortality
(1) (2) (3) (4) (5) (6) (7) (8) (9) (10) (11) (12)Panel A: Two Stage Least Squares
Average Protection Against 1.0 1.1 0.84 0.82 0.93 0.96 0.93 0.95 0.9 0.91 0.99 1.00Expropriation Risk, 1985-1995 (0.25) (0.33) (0.17) (0.20) (0.17) (0.25) (0.16) (0.21) (0.15) (0.20) (0.18) (0.25)
Latitude -0.57 0.29 -0.34 -0.27 -0.11 -0.65(1.90) (1.30) (1.50) (1.30) (1.20) (1.4)
Panel B: First-Stage for Average Protection against Expropriation Risk in 1985-95Log Mortality -0.88 -0.77 -0.7 -0.6 -0.58 -0.47 -0.61 -0.52 -0.75 -0.66 -0.59 -0.49
(0.27) (0.30) (0.18) (0.19) (0.14) (0.16) (0.13) (0.14) (0.15) (0.17) (0.13) (0.14)
Latitude 1.60 1.80 2.23 2.00 1.40 2.1(1.80) (1.80) (1.60) (1.30) (1.40) (1.3)
Adjusted R-Squared 0.38 0.37 0.3 0.3 0.27 0.29 0.26 0.28 0.29 0.29 0.23 0.25
Panel C: Ordinary Least SquaresExpropriation Risk 0.63 0.57 0.55 0.5 0.54 0.47 0.52 0.46 0.52 0.46 0.52 0.461985-1995 (0.12) (0.14) (0.08) (0.08) (0.07) (0.08) (0.06) (0.07) (0.06) (0.07) (0.06) (0.07)
Number of Observations 17 17 31 31 45 45 64 64 64 64 64 64
Dependent Variable is log GDP per capita (PPP basis) in 1995. Panel A reports the two stage least squares estimates and Panel B reports the corresponding first stage. Panel C reports the OLS coefficient from regressing log GDP per capita on average protection against expropriation risk, with the other control variables indicated in that column (full results not reported to save space). Standard errors are in parentheses. Columns (1) and (2) use data only from Curtin (1989); this is the "first mortality estimate" in Appendix Table A2. Columns (3) and (4) use earliest available data on mortality for each country; this is the "second mortality estimate" in Appendix Table A2. Columns (5) and (6) assign the same mortality estimate to neighboring countries with similar disease environments; the "third mortality estimate" in Appendix Table A2. Columns (7) and (8) use an alternative estimate of mortality in Latin America, based on data from British naval stations; the "fifth mortality estimate" in Appendix Table A2. Columns (9) and (10) use an alternativversion of the Curtin estimates for Africa, which uses data only from long sample periods, and bishops for Latin America (the last column in Appendix Table A2). Columns (11) and (12) use the log of the ratio of colonial to European mortality (Britain for British colonies and France for other colonies) as the measure of mortality; using the "fourth mortality estimate" columin Appendix Table A2. See Appendix Table A1 for more detailed variable definitions and sources.

Table 6IV Regressions of log GDP per capita with Additional Controls
Base Sample
Base Sample
Base Sample
Base Sample
Base Sample
Base Sample
Base Sample
(1) (2) (3) (4) (5) (6) (7)Panel A: Two Stage Least Squares
Average Protection Against 1.10 1.10 1.1 1.2 0.91 0.95 1.00Expropriation Risk, 1985-1995 (0.19) (0.26) (0.19) (0.29) (0.15) (0.23) (0.23)
Latitude -0.58 -1.0 -0.44 -0.83(1.30) (1.50) (1.40) (1.4)
Belgian Colonial Dummy 2.4 2.5 1.7(1.20) (1.20) (1.30)
French Colonial Dummy 0.66 0.72 0.27(0.38) (0.44) (0.72)
Spanish Colonial Dummy 1.1 1.1 0.1(0.33) (0.37) (0.70)
French legal origin dummy 1.0 1.1 0.23(0.33) (0.41) (0.75)
p-value for Religion Variables [0.001] [0.002] [0.52]
Panel B: First-Stage for Average Protection against Expropriation Risk in 1985-95Log Mortality -0.57 -0.5 -0.54 -0.44 -0.58 -0.46 -0.7
(0.14) (0.16) (0.13) (0.14) (0.13) (0.15) (0.22)Latitude 1.5 2.1 2.4 1.6
(1.4) (1.3) (1.4) (1.6)French legal origin -0.8 -0.8 -0.9
(0.3) (0.3) (1.1)
Belgian Colonial Dummy -2.9 -2.7 -1.6(1.3) (1.3) (1.7)
French Colonial Dummy -0.51 -0.6 0.8(0.43) (0.40) (1.10)
Spanish Colonial Dummy -0.66 -0.6 0.9(0.40) (0.40) (1.00)
Adjusted R-Squared 0.31 0.31 0.31 0.33 0.28 0.3 0.3Panel C: Ordinary Least Squares
Expropriation Risk 1985-1995 0.54 0.5 0.57 0.51 0.53 0.46 0.46(0.06) (0.06) (0.07) (0.07) (0.06) (0.06) (0.06)
Panel A reports the two stage least squares estimates with log GDP per capita (PPP basis) in 1995 as dependent variable, and Panel B reports the corresponding first stage. The Dutch, Italian, German and Portuguese colonial dummies are not significant in the second or first stage and are not reported (to save space); the religion variables are included in the first stage of columns (5) and (6) but not reported here (to save space). Panel C reports the OLS coefficient from regressing log GDP per capita on average protection against expropriation risk, with the other control variables indicated in that column (full results not reported to save space). Standard errors are in parentheses. All regressions have 64 observations. The religion variables are 100 times percentage of population that are Catholics, Muslims, and "other" religions; Protestant is the base case. Our sample is all either French or British legal origin (as defined by La Porta et al 1999.)

Table 7Robustness Checks for IV Regressions of log GDP per capita
Base Sample
Base Sample
Base Sample
Base Sample
Base Sample
Base Sample
Base Sample
Base Sample
Base Sample
(1) (2) (3) (4) (5) (6) (7) (8) (9)Panel A: Two Stage Least Squares
Average Protection Against 0.97 0.98 0.92 0.9 0.76 0.81 0.96 0.98 0.61Expropriation Risk, 1985-1995 (0.24) (0.27) (0.16) (0.20) (0.28) (0.33) (0.28) (0.30) (0.28)
Latitude 0.29 0.24 -0.95 -0.41 -1.2(1.80) (1.30) (1.20) (1.3) (1.20)
p-value for Temperature Variables [0.9] [0.91] [0.93]
p-value for Humidity Variables [0.46] [0.44] [0.41]Malaria in 1994 -0.48 -0.53 -0.7
(0.50) (0.51) (0.32)Percent of European descent in 1975 -0.06 0.02 0.27
(0.8) (0.9) (0.7)Panel B: First-Stage for Average Protection against Expropriation Risk in 1985-95
Log Mortality -0.51 -0.47 -0.67 -0.56 -0.41 -0.36 -0.41 -0.41 -0.43(0.15) (0.15) (0.14) (0.15) (0.19) (0.19) (0.14) (0.15) (0.21)
Latitude 2.6 2.4 1.9 0.43 1.4(1.8) (1.4) (1.4) (1.5) (2.2)
Adjusted R-Squared 0.24 0.25 0.29 0.3 0.27 0.28 0.32 0.31 0.34Panel C: Ordinary Least Squares
Expropriation Risk 1985-1995 0.44 0.41 0.49 0.41 0.37 0.37 0.40 0.40 0.30(0.07) (0.07) (0.06) (0.06) (0.05) (0.06) (0.06) (0.06) (0.06)
Panel A reports the two stage least squares estimates with log GDP per capita (PPP basis) in 1995, and Panel B reports the corresponding first stages. Panel C reports the OLS coefficient from regressing log GDP per capita on average protection against expropriation risk, with the other control variables indicated in that column (full results not reported to save space). Standard errors are in parentheses. All regressions have 64 observations, except those including malaria and percent of European descent in 1975, which have 61 observations. The temperature and humidity variables are: average, minimum and maximum monthly high temperatures, and minimum and maximum monthly low temperatures, and morning minimum and maximum humidity, and afternoon minimum and maximum humidity. In the table we report joint significance levels for these variables (from Philip Parker, 1997). See Appendix Table A1 for more detailed variable definitions and sources.

Table 8Further Robustness Checks for IV Regressions of log GDP per capita
Base Sample
Base Sample
Base Sample
Base Sample
Base Sample
Base Sample
Base Sample
Base Sample
Base Sample
(1) (2) (3) (4) (5) (6) (7) (8) (9)Panel A: Two Stage Least Squares
Average Protection Against 0.93 0.98 1.1 1.2 1 1.1 0.74 0.77 0.87Expropriation Risk, 1985-1995 (0.19) (0.25) (0.28) (0.34) (0.19) (0.28) (0.13) (0.16) (0.28)Latitude -0.7 -0.12 -0.72 -0.66 -1.7
(1.4) (1.6) (1.5) (1.0) (1.4)P-Value for Soil Quality [0.43] [0.51] 0.54
P-Value for Natural Resources [0.59] [0.63] 0.91
Dummy for being landlocked 0.68 0.76 0.7(0.54) (0.63) -0.5
Ethnolinguistic fragmentation -1.1 -1.1 -1.7(0.32) (0.34) (0.50)
Panel B: First-Stage for Average Protection against Expropriation Risk in 1985-95Log Mortality -0.59 -0.5 -0.46 -0.41 -0.55 -0.45 -0.64 -0.56 -0.42
(0.15) (0.16) (0.14) (0.15) (0.13) (0.14) (0.15) (0.15) (0.17)Latitude 2.1 1.3 2.2 2.3 2.6
(1.4) (1.4) (1.3) (1.4) (1.6)Adjusted R-Squared 0.24 0.25 0.24 0.24 0.28 0.3 0.25 0.27 0.28
Panel C: Ordinary Least SquaresExpropriation Risk 1985-1995 0.50 0.46 0.50 0.46 0.51 0.44 0.52 0.46 0.44
(0.06) (0.07) (0.07) (0.07) (0.07) (0.07) (0.06) (0.07) (0.07)Dependent Variable is log GDP per capita (PPP basis) in 1995. Panel A reports the two stage least squares estimates and Panel B reports the corresponding first stages. Panel C reports the OLS coefficient from regressing log GDP per capita on average protection against expropriation risk, with the other control variables indicated in that column (full results not reported to save space). Standard errors are in parentheses. All regressions have 64 observations, except those including natural resources, which have 63 observations. Measures of natural resources are: percent of world gold reserves today, percent of world iron reserves today, percent of world zinc reserves today, number of minerals present in country, and oil resources (thousands of barrels per capita.) Measures of soil quality/climate are steppe (low latitude), desert (low latitude), steppe (middle latitude), desert (middle latitude), dry steppe wasteland, desert dry winter, and highland.

Table 9Overidentification Tests
Base Sample
Base Sample
Base Sample
Base Sample
Base Sample
Base Sample
Base Sample
Base Sample
Base Sample
Base Sample
(1) (2) (3) (4) (5) (6) (7) (8) (9) (10)Panel A: Two Stage Least Squares
Average Protection Against 0.9 0.93 0.81 0.81 0.81 0.81 0.66 0.7 0.64 0.65Expropriation Risk, 1985-1995 (0.13) (0.17) (1.30) (0.17) (0.13) (0.17) (0.12) (0.13) (0.11) (0.13)
Latitude -0.35 -0.02 0.002 -0.44 -0.35(1.20) (1.10) (1.10) (0.90) (0.90)Panel B: First-Stage for Average Protection Against Expropriation Risk
European settlements in 1900 2.20 2.1(0.71) (0.8)
Constraint on executive in 1900 0.19 0.16(0.1) (0.1)
Democracy in 1900 0.15 0.13(0.07) (0.07)
Constraint on executive in 0.18 0.17first year of independence (0.08) (0.08)Democracy in first year of independence 0.13 0.13
(0.05) (0.05)
Adjusted R-Squared 0.35 0.34 0.29 0.29 0.3 0.29 0.29 0.3 0.3 0.31Panel C: Results from Overidentification Test
p-value (from chi-squared test) [0.73] [0.79] [0.32] [0.32] [0.31] [0.31] [0.42] [0.4] [0.28] [0.26]
Panel D: Second Stage with log mortality as exogenous variableAverage Protection Against 0.83 0.86 0.51 0.44 0.53 0.47 0.5 0.5 0.44 0.44Expropriation Risk, 1985-1995 (0.24) (0.30) (0.25) (0.30) (0.24) (0.28) (0.21) (0.21) (0.19) (0.19)
Log mortality -0.06 -0.05 -0.22 -0.24 -0.21 -0.23 -0.13 -0.14 -0.17 -0.17(0.17) (0.18) (0.17) (0.17) (0.16) (0.17) (0.14) (0.14) (0.13) (0.12)
Latitude -0.27 0.55 0.51 -0.17 -0.04(1.10) (0.88) (0.87) (0.80) (0.75)
Panel A reports the two stage least squares estimates with log GDP per capita (PPP basis) in 1995 as the dependent variable, and Panel B reports the corresponding first stage (latitude is included in even numbered columns but is never significant and not reported here to save space). Panel C reports the p-value for the null hypothesis that the coefficient on average protection against expropriation risk in the second stage regression (i.e., Panel A) is the same as when instrumented using log mortality of settlers in addition to the indicated instruments; the two covariance matricies are based on a common estimate of the disturbance variance. Panel D reports results from the regression in which log mortality is included as an exogenous variable and current institutions are instrumented using the alternative instrument indicated (latitude is included in even columns but is never significant and not reported here to save space). Standard errors are in parentheses. All regressions with constraint on executive and democracy in first year of independence also include years since independence as a regressor. All regressions have 59 observations, except those with European settl

Appendix Table A1: Data Sources and Description
Variable Description Source
Log GDP per capita (PPP) in 1995 Logarithm of GDP per capita, on Purchasing Power Parity Basis. In our base sample this ranges from 6.1 to 10.2. World Bank, World Development Indicators, CD-Rom, 1999
Log GDP per capita (PPP) in 1975Logarithm of GDP per capita, on Purchasing Power Parity Basis. In our base sample this ranges from 6.1 to 10.2. This is the first date for which PPP GDP per capita is available. World Bank, World Development Indicators, CD-Rom, 1999
Average Protection against Expropriation Risk, 1985-95
Risk of expropriation of private foreign investment by government, from 0 to 10, where a higher score means less risk. We calculated the mean value for the scores in all years from 1985 to 1995. In our base sample this ranges from 3.5 to 10.
Dataset obtained directly from Political Risk Services, September 1999. This data was previously used by Knack and Keefer (1995) and was organized in electronic form by the IRIS Center (University of Maryland). The original compilers of this data are Political Risk Services.
Constraint on Executive in 1990
A seven category scale, from 1 to 7, with a higher score indicating more constraints. Score of 1 indicates unlimited authority; score of 3 indicates slight to moderate limitations; score of 5 indicates substantial limitations; score of 7 indicates executive parity or subordination. Scores of 2, 4, and 6 indicate intermediate values.
Polity III dataset, downloaded from Inter-University Consortium for Political and Social Research. Variable described in Gurr 1997.
Constraint on Executive in 1970
A seven category scale, from 1 to 7, with a higher score indicating more constraints. Score of 1 indicates unlimited authority; score of 3 indicates slight to moderate limitations; score of 5 indicates substantial limitations; score of 7 indicates executive parity or subordination. Scores of 2, 4, and 6 indicate intermediate values. Set equal to 1 if country was not independent on that date.
Polity III dataset, downloaded from Inter-University Consortium for Political and Social Research. Variable described in Gurr 1997.
Constraint on Executive in 1900From 1 to 7. Coding as for Constraint on Executive in 1990 and 1970. Set equal to 1 if country was not independent at that date.
Polity III dataset, downloaded from Inter-University Consortium for Political and Social Research. Variable described in Gurr 1997.
Constraint on Executive in first year of independence
From 1 to 7. Coding as for Constraint on Executive in 1970. Date of independence is first year that country appears in Polity III dataset.
Polity III dataset, downloaded from Inter-University Consortium for Political and Social Research. Variable described in Gurr 1997.
Democracy in 1900
An eleven category scale, from 0 to 10, with a higher score indicating more democracy. Points are awarded on three dimensions: Competitiveness of Political Participation (from 1 to 3); Competitiveness of Executive Recruitment (from 1 to 2, with a bonus of 1 point if there is an election); and Constraints on Chief Executive (from 1 to 4). Set equal to 1 if country was not independent at that date.
Polity III dataset, downloaded from Inter-University Consortium for Political and Social Research. Variable described in Gurr 1997.
Democracy in First Year of Independence
From 0 to 10. Coding as for Democracy in 1900. Date of independence is first year that country appears in Polity III dataset
Polity III dataset, downloaded from Inter-University Consortium for Political and Social Research. Variable described in Gurr 1997.
European settlements in 1900Percent of population that was European or of European descent in 1900. Ranges from 0 to 0.99 in our base sample.
Constructed from McEvedy and Jones (1978), Curtin et al (1995) and some additional sources (see Appendix Table A5).
Percent of European descent 1975 Percent of population that was European or of European descent in 1975. Ranges from 0 to 1 in our base sample.Constructed from McEvedy and Jones (1978), Curtin et al (1995) and some additional sources (see Appendix Table A5).
Ethnolinguistic Fragmentation Average of five different indices of ethnolinguistic fragmentation. Easterly and Levine (1997), as used in La Porta et al (1999).
Religion Variables
Percentage of the population that belonged to the three most widely spread religions of the world in 1980 (or for 1990-95 for countries formed more recently). The four classifications are: Roman Catholic, Protestant, Muslim, and "other". La Porta et al (1999)
French legal origin dummyLegal origin of the company law or commercial code of each country. All the countries in our base sample are either of French Commercial Code Origin or English Common Origin. La Porta et al (1999)
Colonial DummiesDummy variable indicating whether country was a British, French, German, Spanish, Italian, Belgian, Dutch or Portuguese colony. La Porta et al (1999)
Temperature VariablesTemperature variables are average temperature, minimum monthly high, maximum monthly high, minimum monthly low, and maximum monthly low, all in centigrade. Parker (1997)
Humidity VariablesHumidity variables are morning minimum, morning maximum, afternoon minimum, and afternoon maximum, all inpercent. Parker (1997)
Soil QualityMeasures of soil quality/climate are steppe (low latitude), desert (low latitude), steppe (middle latitude), desert (middle latitude), dry steppe wasteland, desert dry winter, and highland. Parker (1997)
Natural ResourcesMeasures of natural resources are: percent of world gold reserves today, percent of world iron reserves today, percent of world zinc reserves today, number of minerals present in country, and oil resources (thousands of Parker (1997)
Dummy for Landlocked Dummy variable equal to 1 if country does not adjoin the sea. Parker (1997)
Malaria in 1994 Malaria in 1994 is percent of people living in area where falciparum malaria is endemic Gallup and Sachs 1998.
Latitude Absolute value of the latitude of the country, scaled to take values between 0 and 1, where 0 is the equator. La Porta et al (1999)
Log Mortality Log of estimated settler mortality. From 1.7 to 6.2.See Appendix B for details on how this variable is constructed; primary sources are Curtin (1989 and 1998); Gutierrez (1986). The full dataset is in Appendix Table A2.
Law and Order Tradition in 1995 Law and Order Tradition in 1995, on a scale from 0 to 6, where a higher score indicates stronger law and order.
Dataset obtained directly from Political Risk Services, September 1999. This data was previously used by Knack and Keefer (1995) and was organized in electronic form by the IRIS Center (University of Maryland). The original compilers of this data are Political Risk Services.
Property Rights in 1997 Protection of property rights, on a scale from 1 to 5, where a higher score indicates less secure property rights. Holmes, Johnson, Kirkpatrick (1997)
Rule of Law 1995“Equality of citizens under the law and access of citizens to a non-discriminatory judiciary”; from 0 to 10, with a higher score indicating a better rule of law. Gwartney and Lawson (1997)
Efficiency of the JudiciaryEfficiency of the judiciary, average between 1980 and 1983, on a scale from 1 to 10, with a higher score indicating a more efficient judiciary. As reported in Mauro 1995, from Business International

Appendix Table A2Data on Mortality
Abbreviated name used in graphs
Log GDP per capita (PPP) in 1995
Average Protection Against Expropriation Risk 1985-95
First mortality estimate
Second mortality estimate
Third mortality estimate
Fourth mortality estimate (used in main analysis)
Fifth mortality estimate
Alternative version of Curtin data on Africa
Former ColoniesAngola AGO 7.77 5.36 280 280 280 280Argentina ARG 9.13 6.39 68.9 71 68.9Australia AUS 9.90 9.32 8.55 8.55 8.55Burkina Faso BFA 6.85 4.45 280 280 280 280 280Bangladesh BGD 6.88 5.14 71.41 71.41 71.41 71.41 71.41 71.41Bahamas BHS 9.29 7.50 85 85 85Bolivia BOL 7.93 5.64 71 71 71Brazil BRA 8.73 7.91 71 71 71Barbados BRB 9.27 85 85 85 85 85 85Central African Fed. CAF 7.19 280 280 280 280 280Canada CAN 9.99 9.73 16.1 16.1 16.1 16.1 16.1 16.1Chile CHL 9.34 7.82 68.9 71 68.9Cote d'Ivoire CIV 7.44 7.00 668 668 668 483Cameroon CMR 7.50 6.45 280 280 280 280Congo (French) COG 7.42 4.68 240 240 240 240 280Colombia COL 8.81 7.32 71 71 71Costa Rica CRI 8.79 7.05 78.1 78.1 78.1Dominican Re DOM 8.36 6.18 130 130 130 130Algeria DZA 8.39 6.50 78.2 78.2 78.2 78.2 78.2 78.2Ecuador ECU 8.47 6.55 71 71 71Egypt EGY 7.95 6.77 67.8 67.8 67.8 67.8 67.8Ethiopia ETH 6.11 5.73 26 26 26 26 26Ghana GHA 7.37 6.27 668 668 668 483Guinea GIN 7.49 6.55 483 483 483 483Gambia GMB 7.27 8.27 1470 1470 1470 1470 164.66Guatemala GTM 8.29 5.14 71 71 71Guyana GUY 7.90 5.89 32.18 32.18 32.18 32.18 32.18 32.18Hong Kong HKG 10.05 8.14 14.9 14.9 14.9 14.9Honduras HND 7.69 5.32 78.1 78.1 78.1Haiti HTI 7.15 3.73 130 130 130India DNI 7.33 8.27 48.63 48.63 48.63 48.63 48.63 48.63Indonesia IND 7.33 7.59 170 170 170 170 170 170Jamaica JAM 8.19 7.09 130 130 130 130 130 130Kenya KEN 7.06 6.05 145 145 145 280Sri Lanka LKA 7.73 6.05 69.8 69.8 69.8 69.8 69.8 69.8Morocco MAR 8.04 7.09 78.2 78.2 78.2 78.2Madagascar MDG 6.84 4.45 536.04 536.04 536.04 536.04 302Mexico MEX 8.94 7.50 71 71 71 71 71Mali MLI 6.57 4.00 2940 2940 2940 2940 280Malta MLT 9.43 7.23 16.3 16.3 16.3 16.3 16.3 16.3Myanmar MMR 5.77 34.6 34.6 34.6 34.6 34.6 34.6Mauritania MRT 7.41 280 280 280 280 280Mauritius MUS 9.05 30.5 30.5 30.5 30.5 30.5 30.5Malaysia MYS 8.89 7.95 17.7 17.7 17.7 17.7 17.7 17.7Niger NER 6.73 5.00 400 400 400 400 280Nigeria NGA 6.81 5.55 2004 2004 2004 483Nicaragua NIC 7.54 5.23 163.3 163.3 163.3New Zealand NZL 9.76 9.73 8.55 8.55 8.55 8.55 8.55 8.55Pakistan PAK 7.35 6.05 36.99 36.99 36.99 36.99Panama PAN 8.84 5.91 163.3 163.3 163.3Peru PER 8.40 5.77 71 71 71Paraguay PRY 8.21 6.95 78.1 78.1 78.1Rwanda RWA 6.48 280 280 280 280Sudan SDN 7.31 4.00 88.2 88.2 88.2 88.2 36.4Senegal SEN 7.40 6.00 164.66 164.66 164.66 164.66 164.66 164.66
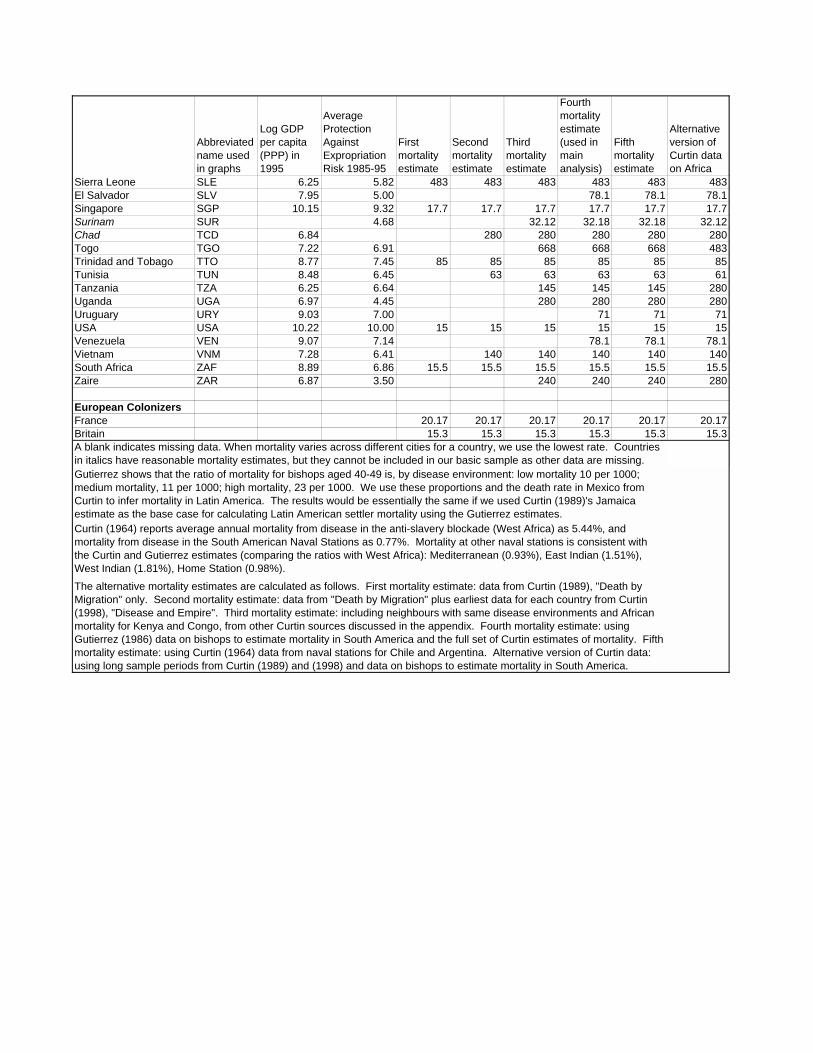
Abbreviated name used in graphs
Log GDP per capita (PPP) in 1995
Average Protection Against Expropriation Risk 1985-95
First mortality estimate
Second mortality estimate
Third mortality estimate
Fourth mortality estimate (used in main analysis)
Fifth mortality estimate
Alternative version of Curtin data on Africa
Sierra Leone SLE 6.25 5.82 483 483 483 483 483 483El Salvador SLV 7.95 5.00 78.1 78.1 78.1Singapore SGP 10.15 9.32 17.7 17.7 17.7 17.7 17.7 17.7Surinam SUR 4.68 32.12 32.18 32.18 32.12Chad TCD 6.84 280 280 280 280 280Togo TGO 7.22 6.91 668 668 668 483Trinidad and Tobago TTO 8.77 7.45 85 85 85 85 85 85Tunisia TUN 8.48 6.45 63 63 63 63 61Tanzania TZA 6.25 6.64 145 145 145 280Uganda UGA 6.97 4.45 280 280 280 280Uruguary URY 9.03 7.00 71 71 71USA USA 10.22 10.00 15 15 15 15 15 15Venezuela VEN 9.07 7.14 78.1 78.1 78.1Vietnam VNM 7.28 6.41 140 140 140 140 140South Africa ZAF 8.89 6.86 15.5 15.5 15.5 15.5 15.5 15.5Zaire ZAR 6.87 3.50 240 240 240 280
European ColonizersFrance 20.17 20.17 20.17 20.17 20.17 20.17Britain 15.3 15.3 15.3 15.3 15.3 15.3A blank indicates missing data. When mortality varies across different cities for a country, we use the lowest rate. Countries in italics have reasonable mortality estimates, but they cannot be included in our basic sample as other data are missing. Gutierrez shows that the ratio of mortality for bishops aged 40-49 is, by disease environment: low mortality 10 per 1000; medium mortality, 11 per 1000; high mortality, 23 per 1000. We use these proportions and the death rate in Mexico from Curtin to infer mortality in Latin America. The results would be essentially the same if we used Curtin (1989)'s Jamaica estimate as the base case for calculating Latin American settler mortality using the Gutierrez estimates. Curtin (1964) reports average annual mortality from disease in the anti-slavery blockade (West Africa) as 5.44%, and mortality from disease in the South American Naval Stations as 0.77%. Mortality at other naval stations is consistent with the Curtin and Gutierrez estimates (comparing the ratios with West Africa): Mediterranean (0.93%), East Indian (1.51%), West Indian (1.81%), Home Station (0.98%).The alternative mortality estimates are calculated as follows. First mortality estimate: data from Curtin (1989), "Death by Migration" only. Second mortality estimate: data from "Death by Migration" plus earliest data for each country from Curtin (1998), "Disease and Empire". Third mortality estimate: including neighbours with same disease environments and African mortality for Kenya and Congo, from other Curtin sources discussed in the appendix. Fourth mortality estimate: using Gutierrez (1986) data on bishops to estimate mortality in South America and the full set of Curtin estimates of mortality. Fifth mortality estimate: using Curtin (1964) data from naval stations for Chile and Argentina. Alternative version of Curtin data: using long sample periods from Curtin (1989) and (1998) and data on bishops to estimate mortality in South America.

Appendix Table A3IV Regressions using GDP per capita in 1975
Base Sample
Base Sample
Base Sample without
neo-Europes
Base Sample without
neo-Europes
Base Sample without Africa
Base Sample without Africa
Base Sample
with Continent Dummies
Base Sample
with Continent Dummies
(1) (2) (3) (4) (5) (6) (7) (8)Panel A: Two Stage Least Squares
Constraint on executive in 1970 0.54 0.61 0.64 0.7 0.31 0.3 0.48 0.56(0.15) (0.22) (0.31) (0.35) (0.13) (0.16) (0.18) (0.3)
Latitude -1.2 -0.96 0.1 -1.3(1.90) (2.10) (1.50) (1.8)
Asia Dummy -1.1 -1.2(0.48) (0.60)
Africa Dummy -0.65 -0.65(0.34) (0.39)
"Other" Continent Dummy -0.9 -1(0.7) (0.8)
Panel B: First-Stage for Constraint on Executive in 1970Log Mortality -0.82 -0.67 -0.54 -0.5 -1.5 -1.3 -0.79 -0.64
(0.21) (0.23) (0.23) (0.24) (0.44) (0.47) (0.27) (0.29)
Latitude 3.40 1.10 3.30 3(2.20) (2.60) (2.80) (2.2)
Asia Dummy -0.4 -0.21(0.9) (0.90)
Africa Dummy 0.1 0.08(0.70) (0.70)
"Other" Continent Dummy 1.7 1.6(1.10) (1.10)
Adjusted R-Squared 0.2 0.22 0.07 0.06 0.25 0.26 0.2 0.21
Panel C: Ordinary Least SquaresConstraint on executive in 1970 0.16 0.13 0.08 0.08 0.13 0.11 0.11 0.09
(0.05) (0.05) (0.05) (0.05) (0.06) (0.07) (0.04) (0.04)
Number of Observations 59 59 55 55 31 31 59 59
See Appendix Table A1 for more detailed variable definitions and sources.
Dependent Variable is log GDP per capita (PPP basis) in 1975. Constraint on Executive in 1970 is measured on a scale of 1 to 7, where a higher score represents more constraint, from the Polity III data set. Panel A reports the two stage least squares estimates and Panel B reports the corresponding first stage. Panel C reports the OLS coefficient from regressing log GDP percapita on average protection against expropriation risk, with the other control variables indicated in that column (full results not reported to save space). Standard errors are in parentheses. In regressions with continent dummies, the dummy for America is omitted.

Appendix Table A4aIV Regressions of log GDP per capita
Base Sample
Base Sample
Base Sample
without neo-Europes
Base Sample
without neo-Europes
Base Sample without Africa
Base Sample without Africa
Base Sample
with Continent Dummies
Base Sample
with Continent Dummies
(1) (2) (3) (4) (5) (6) (7) (8)Panel A: Two Stage Least Squares
Constraint on Executive 0.51 0.46 0.46 0.4 0.77 0.65 0.69 0.6in 1990 (0.08) 0.90 (0.10) (0.09) (0.32) (0.27) (0.23) (0.2)
Latitude 1.3 1.1 1.8 1.4(0.92) (1.10) (1.40) (1.1)
Asia Dummy 0.31 0.23(0.60) (0.53)
Africa Dummy 0.89 0.70(0.80) (0.72)
"Other" Continent Dummy -0.12 -0.16(0.6) (0.6)
Panel B: First-Stage for Constraint on Executive in 1990Log Mortality -1.1 -1.1 -1.0 -1.0 -0.86 -0.9 -0.63 -0.64
(0.19) (0.21) (0.20) (0.22) (0.38) (0.40) (0.21) (0.22)
Latitude 0.64 -0.30 -1.30 -0.22(2.00) (2.40) (2.40) (1.8)
Asia Dummy -1.7 -1.7(0.7) (0.7)
Africa Dummy -2.3 -2.3(0.53) (0.53)
"Other" Continent Dummy -0.2 -0.17(0.90) (0.91)
Adjusted R-Squared 0.34 0.33 0.25 0.24 0.11 0.09 0.48 0.47
Panel C: Ordinary Least SquaresConstraint on Executive 0.29 0.25 0.24 0.23 0.23 0.22 0.19 0.17in 1990 (0.04) (0.04) (0.04) (0.04) (0.07) (0.07) (0.05) (0.05)
Number of Observations 69 69 65 65 35 35 69 69Constraint on Executive in 1990 is measured on a scale, from 1 to 7, with a higher score indicating more constraints on the arbitrary actions that the executive can take, from the Polity data set (see Appendix Table 1 for more detail). Panel A reports the two stage least squares estimates with log GDP per capita (PPP basis) in 1995 as the dependent variable, instrumenting for constraint on the executive using log settler mortality; Panel B reports the corresponding first stage. Panel C reports the OLS coefficient from regressing log GDP per capita on constraint on the executive in 1990, with the other control variables indicated in that column (full results not reported to save space). Standard errors are in parentheses. In regressions with continent dummies, the dummy for America is omitted.
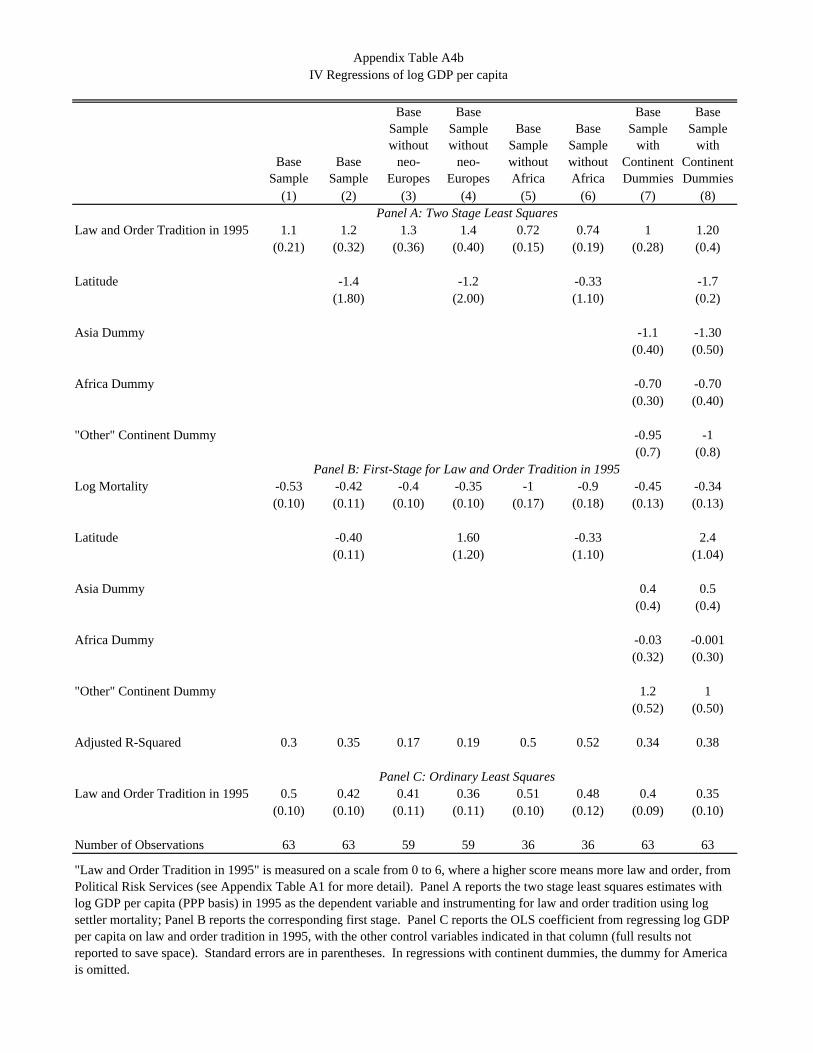
Appendix Table A4bIV Regressions of log GDP per capita
Base Sample
Base Sample
Base Sample without
neo-Europes
Base Sample without
neo-Europes
Base Sample without Africa
Base Sample without Africa
Base Sample
with Continent Dummies
Base Sample
with Continent Dummies
(1) (2) (3) (4) (5) (6) (7) (8) Panel A: Two Stage Least SquaresLaw and Order Tradition in 1995 1.1 1.2 1.3 1.4 0.72 0.74 1 1.20
(0.21) (0.32) (0.36) (0.40) (0.15) (0.19) (0.28) (0.4)
Latitude -1.4 -1.2 -0.33 -1.7(1.80) (2.00) (1.10) (0.2)
Asia Dummy -1.1 -1.30(0.40) (0.50)
Africa Dummy -0.70 -0.70(0.30) (0.40)
"Other" Continent Dummy -0.95 -1(0.7) (0.8)
Panel B: First-Stage for Law and Order Tradition in 1995Log Mortality -0.53 -0.42 -0.4 -0.35 -1 -0.9 -0.45 -0.34
(0.10) (0.11) (0.10) (0.10) (0.17) (0.18) (0.13) (0.13)
Latitude -0.40 1.60 -0.33 2.4(0.11) (1.20) (1.10) (1.04)
Asia Dummy 0.4 0.5(0.4) (0.4)
Africa Dummy -0.03 -0.001(0.32) (0.30)
"Other" Continent Dummy 1.2 1(0.52) (0.50)
Adjusted R-Squared 0.3 0.35 0.17 0.19 0.5 0.52 0.34 0.38
Panel C: Ordinary Least SquaresLaw and Order Tradition in 1995 0.5 0.42 0.41 0.36 0.51 0.48 0.4 0.35
(0.10) (0.10) (0.11) (0.11) (0.10) (0.12) (0.09) (0.10)
Number of Observations 63 63 59 59 36 36 63 63
"Law and Order Tradition in 1995" is measured on a scale from 0 to 6, where a higher score means more law and order, from Political Risk Services (see Appendix Table A1 for more detail). Panel A reports the two stage least squares estimates with log GDP per capita (PPP basis) in 1995 as the dependent variable and instrumenting for law and order tradition using log settler mortality; Panel B reports the corresponding first stage. Panel C reports the OLS coefficient from regressing log GDP per capita on law and order tradition in 1995, with the other control variables indicated in that column (full results not reported to save space). Standard errors are in parentheses. In regressions with continent dummies, the dummy for America is omitted.

Appendix Table A4cIV Regressions of log GDP per capita
Base Sample
Base Sample
Base Sample without
neo-Europes
Base Sample without
neo-Europes
Base Sample without Africa
Base Sample without Africa
Base Sample
with Continent Dummies
Base Sample
with Continent Dummies
(1) (2) (3) (4) (5) (6) (7) (8)Panel A: Two Stage Least Squares
Property Rights in 1997 -1.6 -1.8 -2.1 -2.3 -0.9 -0.9 -1.3 -1.50(0.33) (0.50) (0.80) (1.00) (0.15) (0.19) (0.46) (0.7)
Latitude -2 -1.2 -0.2 -1.4(2.20) (2.70) (0.90) (1.9)
Asia Dummy -0.14 -0.14(0.42) (0.50)
Africa Dummy -0.44 -0.44(0.44) (0.50)
"Other" Continent Dummy -0.28 -0.23(0.6) (0.6)
Panel B: First-Stage for Property Rights in 1997Log Mortality 0.37 0.28 0.2 0.2 -0.74 0.67 0.31 0.25
(0.10) (0.10) (0.10) (0.11) (0.17) (0.19) (0.13) (0.13)
Latitude -2.10 -1.10 -1.40 -1.8(1.00) (1.20) (1.20) (1.00)
Asia Dummy 0.5 0.4(0.4) (0.4)
Africa Dummy 0.3 0.24(0.32) (0.31)
"Other" Continent Dummy -0.24 -0.13(0.47) (0.47)
Adjusted R-Squared 0.17 0.22 0.06 0.06 0.3 0.31 0.17 0.2
Panel C: Ordinary Least SquaresProperty Rights in 1997 -0.69 -0.6 -0.6 -0.6 -0.65 -0.62 -0.51 -0.5
(0.10) (0.10) (0.10) (0.10) (0.08) (0.08) (0.08) (0.08)
Number of Observations 69 69 65 65 41 41 69 69
"Property Rights in 1995" is measured on a scale from 1 to 5, where a higher score means less protection for property rights, from the Heritage Foundation (see Appendix Table A1 for more detail). Panel A reports the two stage least squares estimates with log GDP per capita (PPP basis) in 1995 as the dependent variable and instrumenting for property rights using log settler mortality; Panel B reports the corresponding first stage. Panel C reports the OLS coefficient from regressing log GDP per capita on property rights in 1995, with the other control variables indicated in that column (full results not reported to save space). Standard errors are in parentheses. In regressions with continent dummies, the dummy for America is omitted.
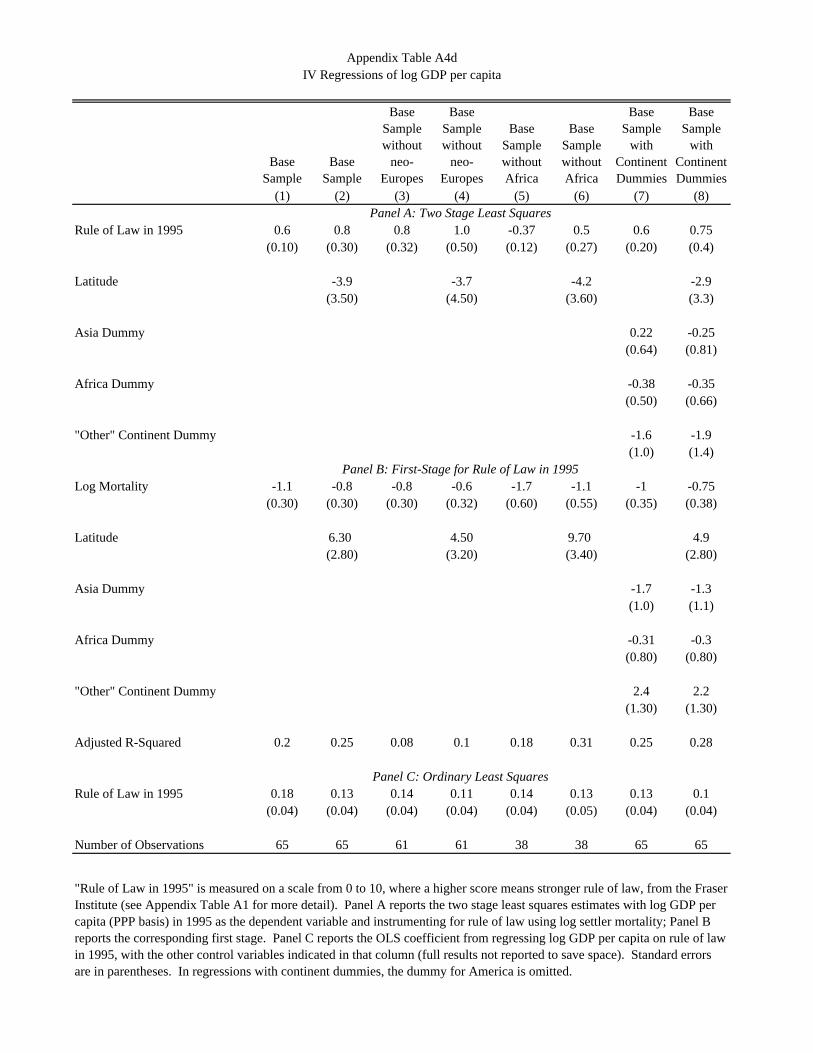
Appendix Table A4dIV Regressions of log GDP per capita
Base Sample
Base Sample
Base Sample without
neo-Europes
Base Sample without
neo-Europes
Base Sample without Africa
Base Sample without Africa
Base Sample
with Continent Dummies
Base Sample
with Continent Dummies
(1) (2) (3) (4) (5) (6) (7) (8)Panel A: Two Stage Least Squares
Rule of Law in 1995 0.6 0.8 0.8 1.0 -0.37 0.5 0.6 0.75(0.10) (0.30) (0.32) (0.50) (0.12) (0.27) (0.20) (0.4)
Latitude -3.9 -3.7 -4.2 -2.9(3.50) (4.50) (3.60) (3.3)
Asia Dummy 0.22 -0.25(0.64) (0.81)
Africa Dummy -0.38 -0.35(0.50) (0.66)
"Other" Continent Dummy -1.6 -1.9(1.0) (1.4)
Panel B: First-Stage for Rule of Law in 1995Log Mortality -1.1 -0.8 -0.8 -0.6 -1.7 -1.1 -1 -0.75
(0.30) (0.30) (0.30) (0.32) (0.60) (0.55) (0.35) (0.38)
Latitude 6.30 4.50 9.70 4.9(2.80) (3.20) (3.40) (2.80)
Asia Dummy -1.7 -1.3(1.0) (1.1)
Africa Dummy -0.31 -0.3(0.80) (0.80)
"Other" Continent Dummy 2.4 2.2(1.30) (1.30)
Adjusted R-Squared 0.2 0.25 0.08 0.1 0.18 0.31 0.25 0.28
Panel C: Ordinary Least SquaresRule of Law in 1995 0.18 0.13 0.14 0.11 0.14 0.13 0.13 0.1
(0.04) (0.04) (0.04) (0.04) (0.04) (0.05) (0.04) (0.04)
Number of Observations 65 65 61 61 38 38 65 65
"Rule of Law in 1995" is measured on a scale from 0 to 10, where a higher score means stronger rule of law, from the Fraser Institute (see Appendix Table A1 for more detail). Panel A reports the two stage least squares estimates with log GDP per capita (PPP basis) in 1995 as the dependent variable and instrumenting for rule of law using log settler mortality; Panel B reports the corresponding first stage. Panel C reports the OLS coefficient from regressing log GDP per capita on rule of law in 1995, with the other control variables indicated in that column (full results not reported to save space). Standard errors are in parentheses. In regressions with continent dummies, the dummy for America is omitted.

Appendix Table A4eIV Regressions of log GDP per capita
Base Sample
Base Sample
Base Sample without
neo-Europes
Base Sample without
neo-Europes
Base Sample without Africa
Base Sample without Africa
Base Sample
with Continent Dummies
Base Sample
with Continent Dummies
(1) (2) (3) (4) (5) (6) (7) (8)Panel A: Two Stage Least Squares
Efficiency of the Judiciary 0.62 0.56 0.74 0.7 0.41 0.36 0.66 0.611980-83 (0.12) (0.12) (0.24) (0.20) (0.08) (0.08) (0.15) (0.1)
Latitude -1 2.1 1.3 0.75(1.00) (1.40) (0.80) (1.0)
Asia Dummy -0.89 -0.81(0.37) (0.35)
Africa Dummy -0.40 -0.41(0.37) (0.34)
"Other" Continent Dummy -1.4 -1.3(0.7) (0.6)
Panel B: First-Stage for Efficiency of the Judiciary 1980-83Log Mortality -1 -1 -0.74 -0.83 -1.9 -1.9 -0.9 -1
(0.23) (0.26) (0.28) (0.28) (0.28) (0.30) (0.26) (0.30)
Latitude -0.41 -3.00 -2.10 -1.2(2.10) (2.50) (1.70) (2.00)
Asia Dummy -0.9 -0.1(0.4) (0.7)
Africa Dummy -0.4 -0.12(0.40) (0.70)
"Other" Continent Dummy 1.4 2.2(0.70) (1.00)
Adjusted R-Squared 0.51 0.32 0.16 0.17 0.6 0.61 0.37 0.36
Panel C: Ordinary Least SquaresEfficiency of the Judiciary 0.36 0.33 0.3 0.3 0.36 0.35 0.35 0.331980-83 (0.06) (0.06) (0.07) (0.07) (0.06) (0.06) (0.06) (0.05)
Number of Observations 38 38 34 34 27 27 38 38
"Efficiency of the Judiciary 1980-83" is measured on a scale from 1 to 10, where a higher score means a more efficient judiciary, from Business International (see Appendix Table A1 for more detail). Panel A reports the two stage least squares estimates with log GDP per capita (PPP basis) in 1995 as the dependent variable and instrumenting for efficiency of the judiciary using log settler mortality; Panel B reports the corresponding first stage. Panel C reports the OLS coefficient from regressing log GDP per capita on efficiency of the judiciary, with the other control variables indicated in that column (full results not reported to save space). Standard errors are in parentheses. In regressions with continent dummies, the dummy for America is omitted.

Appendix Table A5: Construction of Settlement Variables
Country
Settlers/total population in 1900 (low estimate)
Population of European descent in 1975 Notes and Sources
(page references are to McEvedy and Jones, unless otherwise noted)North America
Canada 0.99 0.98pp.283-284; indigenous people 0.1m in 1900, out of total population of 5.25m, and 0.25m in 1975, out of total population of 23m.
USA 0.88 0.84
pp.286-290; African Americans were 9m in 1900 and Amerindians were 0.5m in 1925, while total population was 76m in 1900; African Americans were 25m in 1975, Amerindians were 0.6m in 1975, and immigrants from Puerto Rico andMexico were 8.75m, when total population was 210m
Central America and Mexico
Mexico 0.15 0.15
p.291; there were 2m Spaniards in a total population of 13.5m in 1900; the proportions of 55% Mestizo (mixed race), 30% Amerindian, and 15% white have stayed "remarkably constant"
Central America 0.20 0.20 pp.294: 3/5 Amerindian; 1/5 Spanish; 1/5 mestizo in 1800
Guatemala 0.20 0.23pp.294-296; in 1975 55% Mestizo, 22.5% Amerindians, and 22.5% white; assuming 1900 proportions same as for Central America as a whole in 1800
El Salvador 0.20 0.20 pp.294-296; assuming unchanged from Central American proportions of 1800
Honduras 0.20 0.20 pp.294-296; assuming unchanged from Central American proportions of 1800
Nicaragua 0.20 0.20 pp.294-296; assuming unchanged from Central American proportions of 1800
Costa Rica 0.20 0.20 pp.294-296; assuming unchanged from Central American proportions of 1800
Panama 0.20 0.20 pp.294-296; assuming unchanged from Central American proportions of 1800
Belize 0.20 0.20 pp.294-296; assuming unchanged from Central American proportions of 1800
Caribbean Islands
Bahamas 0.10 0.10p.300, using 1975 non-African proportion; assuming no change from 1900 to 1975
Greater Antilles
Jamaica 0.02 0.10Rogozinski (1992), p.186 for 1911; 1975 from McEvedy and Jones p.300, "non-African" population
Haiti 0.00 0.00Rogozinski (1992), p.217 on expulsion of settlers from 1805; 1975 from McEvedy and Jones p.300, using "non-African population"
Dominican Republic 0.25 0.25p.300, using 1975 non-African proportion; assuming no change from 1900 to 1975
Lesser Antilles
Barbados 0.20 0.20p.300, using 1975 non-African proportion; assuming no change from 1900 to 1975
Trinidad and Tobago 0.40 0.40p.300, using 1975 non-African proportion; assuming no change from 1900 to 1975
South America
Colombia 0.20 0.25p.302; assuming same ethnic mix as Venezuela; assuming no change from 1900 to 1975
Venezuela 0.20 0.20 p.302; assuming no change from 1900 to 1975
Surinam 0.01 0.01
p.304; in 1975, o.4m total population, which was 40% black, 40% Asian Indian, 16% Indonesian, 2% Chinese, 1% Amerindian, and 1% white; assuming no change from 1900 to 1975
Guyana 0.02 0.02
p.304; in 1975, 0.8m population, 50% Asian Indian, 30% black, 4% Amerindian, 1% Chinese and 2% white; assuming no change from 1900 to 1975
Brazil 0.40 0.55
p.308; whites were 25% of the population in 1822 at time of independence; by 1975 had increase to 55%; assuming half this increased in proportion had occurred by 1900
Andean Region (ex-Inca) 0.27 0.30
by 1900 there were 2m of Spanish descent in the region, with a total population of 7.35m; in 1975 there were 9m of Spanish descent, with a total population of 30.25
Peru 0.30 0.30p.312; whites have consistently been 30% of the population; with 30% Mestizo and 40% Amerindian

Country
Settlers/total population in 1900 (low estimate)
Population of European descent in 1975 Notes and Sources
Ecuador 0.30 0.30p.312; whites have consistently been 30% of the population; with 30% Mestizo and 40% Amerindian
Bolivia 0.30 0.30p.312; whites have consistently been 30% of the population; with 30% Mestizo and 40% Amerindian
Paraguay 0.25 0.25
p.312; only 30,000 Amerindians in 1975, out of total population of 2.5m, 75% mestizos and 25% white; two thirds of adult male population died or disappeared due to war in 1865-1870; assuming no change in composition of population from 1900 to 1975
Argentina 0.60 0.90
p.313-4; 30% of population was foreign born in 1914 census (p.313); in 1975 only 10% of population had Indian or mixed ancestry; white population was 0.15m, Indians were 0.35m, and Mestizos were 0.75m in 1825 (for Argentina and Chile combined); most immigrants arrived after 1880s, with peak years in 1910s. White population was 15m out of total of 17m in 1950. Population was 4.75m in 1900; we assume 50% white population in 1900 (above that of Chile).
Chile 0.50 0.50
p.313-4; never more than 5% foreign born in any census (p.313); in Chile, population equally divided in 1975 between whites and those of Indian or mixed descent; since 1850 Argentina has received at least 2.5m net immigrants, while Chile has only received 0.2m
Uruguay 0.60 0.90 p.313-4; assuming same ethnic mix as Argentina
Oceania
Australia 0.98 0.99pp.327-8; 60,000 aborigines out of population of 3.75m in 1900; 80,000 aborigines out of population of 13.5m in 1975.
New Zealand 0.93 0.92pp.337-8; 42,000 Maori "in the 1890s", total population of 750,000 in 1900; 250,000 Maori in 1975, out of total population of 3m.
AfricaThe Maghreb
Morocco 0.01 0.00
assuming half of settlers in non-Algerian Mahgreb went to Morocco (p.220); In 1956 Europeans were 5.4 percent in former French Morocco (Curtin et al 1995, p.435); most left by end of 1960s
Algeria 0.13 0.00p.220; In 1956 Europeans were 10.9 percent in Algeria (Curtin et al 1995, p.435); most left by end of 1960s
Tunisia 0.03 0.00
assuming half of settlers in non-Algerian Mahgreb went to Tunisia; In 1956 Europeans were 6.7 percent (Curtin et al 1995, p.435), most left by end of 1960s
Libya 0.00 0.00 in 1956 no Europeans (Curtin et al 1995)
Egypt 0.01 0.00p.226; in 1882 Egypt had a population of 6,800,000 of which 90,000 were foreigners (Curtin 1998, p.127); most left by end of 1960s
Ethiopia 0.00 0.00 p.230; in 1956 no Europeans (Curtin et al 1995, p.435)Sudan 0.00 0.00 pp.235-236; in 1956 no Europeans (Curtin et al 1995)Sahel States Mauritania 0.00 0.00 pp.238-240; in 1956 no Europeans (Curtin et al 1995) Mali 0.00 0.00 pp.238-240; in 1956 no Europeans (Curtin et al 1995) Niger 0.00 0.00 pp.238-240; in 1956 no Europeans (Curtin et al 1995) Chad 0.00 0.00 pp.238-240; in 1956 no Europeans (Curtin et al 1995)West Africa Senegal 0.00 0.00 pp.241-246; in 1956 no Europeans (Curtin et al 1995) Gambia 0.00 0.00 pp.241-246; in 1956 no Europeans (Curtin et al 1995) Guinea-Bissau 0.00 0.00 pp.241-246; in 1956 no Europeans (Curtin et al 1995) Guinea-Conakry 0.00 0.00 pp.241-246; in 1956 no Europeans (Curtin et al 1995) Sierra Leone 0.00 0.00 pp.241-246; in 1956 no Europeans (Curtin et al 1995) Liberia 0.00 0.00 pp.241-246; in 1956 no Europeans (Curtin et al 1995) Ivory Coast 0.00 0.00 pp.241-246; in 1956 no Europeans (Curtin et al 1995) Ghana 0.00 0.00 pp.241-246; in 1956 no Europeans (Curtin et al 1995) Togo 0.00 0.00 pp.241-246; in 1956 no Europeans (Curtin et al 1995) Benin 0.00 0.00 pp.241-246; in 1956 no Europeans (Curtin et al 1995) Nigeria 0.00 0.00 pp.241-246; in 1956 no Europeans (Curtin et al 1995) Upper Volta 0.00 0.00 pp.241-246; in 1956 no Europeans (Curtin et al 1995)Central-West Africa Equatoria 0.00 0.00 pp.247-248; in 1956 no Europeans (Curtin et al 1995) Cameroon 0.00 0.00 pp.247-248; in 1956 no Europeans (Curtin et al 1995) Central African Republic 0.00 0.00 pp.247-248; in 1956 no Europeans (Curtin et al 1995) Gabon 0.00 0.00 pp.247-248; in 1956 no Europeans (Curtin et al 1995) Congo 0.00 0.00 pp.247-248; in 1956 no Europeans (Curtin et al 1995)

Country
Settlers/total population in 1900 (low estimate)
Population of European descent in 1975 Notes and Sources
Equatorial Guinea 0.00 0.00 pp.247-248; in 1956 no Europeans (Curtin et al 1995) Zaire 0.01 0.00 Using 1956 estimate, from Curtin et al (1995)
Angola 0.08 0.00500,000 settlers left before and after independence; in 1956 Europeans were 2.5 percent (Curtin et al 1995)
East Africa Uganda 0.00 0.00 pp.250-252; in 1956 no Europeans (Curtin et al 1995) Kenya 0.01 0.00 Using 1956 estimate, from Curtin et al (1995) Tanzania 0.00 0.00 pp.250-252; in 1956 no Europeans (Curtin et al 1995) Rwanda and Burundi 0.00 0.00 pp.250-252; in 1956 no Europeans (Curtin et al 1995)South-Central Africa
Zambia 0.03 0.00Using 1956 estimate, from Curtin et al (1995); most settlers left by end of 1960s
Rhodesia 0.07 0.04Using 1956 estimate, from Curtin et al (1995), for 1900; in 1965 there were 0.23m settlers, while total population in 1975 was 6.25m
Malawi 0.03 0.00Using 1956 estimate, from Curtin et al (1995); most settlers left by end of 1960s
Southern AfricaMozambique 0.03 0.00 p.256; all 150,000 Portuguese settlers left after independence
South Africa, Swaziland and Lesotho 0.22 0.16
In 1956 Europeans were 20.8 percent and "coloreds" were another 10 percent (Curtin et al 1995); assuming no change in proportions from 1900 to 1975; major immigration from Europe after 1867 and 1886, brought white population to about 1/5 of total in South Africa; in 1900 there were 1.2m whites, 3.75m Bantu, 0.4m "Cape coloureds", and 0.1m Indians; in 1975 there were 4.1m whites, 2.3m "Cape coloureds", 0.75m Indians, and 18m blacks (plus 1.5m Bantu in Swaziland and Lesotho)
Islands of the Western Indian OceanMadagascar 0.00 0.00 pp.264-266; no Europeans in 1956 (Curtin et al 1995, p.435)Mauritius 0.05 0.17 p.267; in 1800 5/6 of population were slavesReunion 0.05 0.33 p.266; 3/4 of population slaves in 1800
Pakistan, India and BangladeshBangladesh 0.00 0.00 pp.182-186; no significant European settlementsIndia 0.00 0.00 pp.182-186; no significant European settlementsPakistan 0.00 0.00 pp.182-186; no significant European settlementsSri Lanka 0.00 0.00 p.186; no significant European settlements
Burma 0.00 0.00 p.190; no significant European settlements
Indo-China
Vietnam 0.00 0.00p.196; there were a few thousand settlers, but these are not mentioned by McEvedy and Jones; almost all had left by 1975
Malay Archipelago
Malaysia 0.00 0.00p.198; there must have been a few thousand settlers (rubber plantations), but these are not mentioned by McEvedy and Jones; almost all had left by 1975
Singapore 0.05 0.00 Assuming population composition similar to Hong Kong
Indonesia 0.00 0.00p.198; there were a few settlers, but these are not mentioned by McEvedy and Jones
Hong Kong 0.04 0.00
from 1895 census; proportion of non-Chinese peaked at 0.06 in 1869; from Welsh (1993), p.253; population was 4m in 1971; there were 6,636 British subjects who were European in 1931
SourcesJan Rogozinski, A Brief History of the Caribbean, Meridian (Penguin Group), LondonFrank Welsh, A Borrowed Place: The History of Hong Kong, Kodansha International, New York, Tokyo, London, 1993.All Curtin et al (1995) references are to p.435, unless otherwise indicated

Log
GD
P pe
r cap
ita, P
PP, 1
995
Average Protection Against Expropriation Risk 1985-952 4 6 8 10
4
6
8
10
AGO
ARE
ARG
AUS
BFA BGD
BHR
BHS
BOL
BRABWA
CAN
CHL
CIVCMRCOG
COLCRI
DNI
DOMDZAECU
EGY
ETH
GAB
GHAGINGMB
GTM
GUY
HKG
HND
HTIIND
ISR
JAMJOR
KEN
KWT
LKAMAR
MDG
MEX
MLI
MLT
MOZMWI
MYS
NER NGA
NIC
NZL
OMN
PAK
PAN
PERPHL PRY
QAT
SAU
SDN SEN
SGP
SLE
SLV SYR
TGO
TTOTUN
TZA
UGA
URY
USA
VEN
VNM
YEM
ZAF
ZAR ZMB
ZWE
Figure 1

Figure 2Av
erag
e Pr
otec
tion
Agai
nst E
xpro
pria
tion
Ris
k 19
85-9
5
Log Mortality2 3 4 5 6 7 8
4
6
8
10NZL
AUS
HKG
USA
ZAF
CAN
MLT
SGP
MYS
ETHGUY
SUR
MMRPAK
DNI
TUNEGY
ARG
CHL
LKA
ECU
GTM
MEX
PERBOL
COLURY
BRA
BGD
VENPRY
HNDSLV
CRI
DZA
MAR
BHSTTO
SDN
DOM
JAM
HTI
VNM
KENPAN
NIC
GNB
SEN
PNGIND
COG
ZAR
UGA
TZA
GAB
AGO
BFA
CMR
NER
GIN
SLE
MDG
CIVTGO
GHA
GMB
NGA
MLI

Figure 3A
ctua
l log
GD
P pe
r cap
ita (P
PP) i
n 19
95
Predicted value of log GDP per capita from IV regression4 6 8 10 12
4
6
8
10
12
ZARHTISDN
MLIBFAMDGUGA
COG
NER
SLVGTM
BGD
NICHNDAGOPHL
NGA
BOL
ETH
PER
SLE
SYRGUY
PAN
SENZWE
KENPAKLKA
DOM
GHA
YEM
ARG
VNM
TUN
CMR
DZA
MOZ
GIN
ECU
TZA
ZMB
EGYJOR
MWI
ZAF
TGO
PRY
URY
CIV
CRI
KWT
MARJAM
VENOMN
AREMLT
COLTTOMEXBHSSAU
IND
QAT
BWAGABCHL
BRAMYS
BHRHKG
GMBDNI
ISRSGPAUS CAN
NZL
USA