Embed Size (px)
Citation preview

The CLEAR 2006 Evaluation
Rainer Stiefelhagen1, Keni Bernardin1, Rachel Bowers2, John Garofolo2,Djamel Mostefa3, and Padmanabhan Soundararajan4
1 Interactive Systems Lab, Universitat Karlsruhe, 76131 Karlsruhe, Germany{stiefel, keni}@ira.uka.de
2 National Institute of Standards and Technology (NIST), Information TechnologyLab - Information Access Division, Speech Group
{rachel.bowers, garofolo}@nist.gov3 Evaluations and Language Resources Distribution Agency (ELDA), Paris, France
[email protected] Computer Science and Engineering, University of South Florida, Tampa, FL, USA
Abstract. This paper is a summary of the first CLEAR evaluation onCLassification of Events, Activities and Relationships - which took placein early 2006 and concluded with a two day evaluation workshop in April2006. CLEAR is an international effort to evaluate systems for the multi-modal perception of people, their activities and interactions. It providesa new international evaluation framework for such technologies. It aimsto support the definition of common evaluation tasks and metrics, tocoordinate and leverage the production of necessary multimodal corporaand to provide a possibility for comparing different algorithms and ap-proaches on common benchmarks, which will result in faster progressin the research community. This paper describes the evaluation tasks,including metrics and databases used, that were conducted in CLEAR2006, and provides an overview of the results. The evaluation tasks inCLEAR 2006 included person tracking, face detection and tracking, per-son identification, head pose estimation, vehicle tracking as well as acous-tic scene analysis. Overall, more than 20 subtasks were conducted, whichincluded acoustic, visual and audio-visual analysis for many of the maintasks, as well as different data domains and evaluation conditions.
1 Introduction
CLassification of Events, Activities and Relationships (CLEAR) is an interna-tional effort to evaluate systems that are designed to analyze people’s identities,activities, interactions and relationships in human-human interaction scenarios,as well as related scenarios. The first CLEAR evaluation has been conductedfrom around December 2005, when the first development data and scoring scriptswere disseminated, until April 2006, when a two-day evaluation workshop tookplace in Southampton, UK, during which the evaluation results and system de-tails of all participants were discussed.

1.1 Motivation
Many researchers, research labs and in particular a number of current major re-search projects worldwide – including the European projects CHIL, Computersin the Human Interaction Loop [1], and AMI, “Augmented Multi-party Interac-tion” [2], as well as the US programs VACE, “Video Analysis Content extrac-tion” [3], and CALO, “Cognitive Assistant that Learns and Organizes” [4] – areworking on technologies to analyze people, their activities, and their interaction.However, common evaluation standards for such technologies are missing. Untilnow, most researchers and research projects use their own different data sets, an-notations, task definitions, metrics and evaluation procedures. As a consequence,comparability of the research algorithms and systems is virtually impossible. Fur-thermore, this leads to a costly multiplication of data production and evaluationefforts for the research community as a whole.
CLEAR was created to address this problem. Its goal is to provide a commoninternational evaluation forum and framework for such technologies, and to serveas a forum for the discussion and definition of related common benchmarks,including the definition of common metrics, tasks and evaluation procedures.
The outcomes for the research community that we expect from such a com-mon evaluation forum are
– the definition of widely adopted common metrics and tasks– a greater availability of resources by sharing the data collection and anno-
tation burden– provision of challenging multimodal data sets for the development of robust
perceptual technologies– comparability of systems and approaches and– thus faster progress in developing better, more robust technology.
1.2 Background
The CLEAR 2006 evaluation has emerged out of the existing evaluation effortsof the European Integrated project CHIL, which has in previous years conducteda number of evaluations on multimodal perceptual technologies, including taskssuch as person tracking and identification, head pose estimation, gesture recog-nition and acoustic event detection, as well as the technology evaluation effortsin the US VACE program, which conducted several similar evaluations in face,person and vehicle tracking. For CLEAR 2006, the technology evaluations ofCHIL and VACE were combined for the first time, and the evaluations were alsoopen to any site interested in participating.
In order to broaden the participation and discussion of evaluation tasksand metrics, representatives from other related projects and evaluation efforts(AMI[2], NIST RT evaluations[5], NIST People-ID evaluations, PETs[6], Trec-Vid[7], ETISEO[8]) were actively invited to participate in the preparation of theworkshop as well as to present an overview about their related activities at theworkshop.

1.3 Scope and Evaluation Tasks in 2006
The CLEAR 2006 evaluation and workshop was organized in conjunction withthe National Institute of Standards and Technology (NIST) Rich Transcrip-tion (RT) 2006 evaluation [5]. While the evaluations conducted in RT focuson content-related technologies, such as speech and text recognition, CLEARis more about context-related multimodal technologies such as person tracking,person identification, head pose estimation, analyzing focus of attention, inter-action, activities and events. CLEAR 2006 and RT06 in particular shared someof their evaluation data sets, so that for example the speaker-localization re-sults generated for CLEAR could be used for the far-field speech-to-text task inRT06. Also the evaluation deadlines of CLEAR and RT 2006 were harmonizedso that this would be possible. This is an important first step towards developinga comprehensive multimedia evaluation program.
The evaluation tasks in CLEAR 2006 can be broken down into four categories:
– tracking tasks (faces/persons/vehicles, 2D/3D, acoustic/visual/audio-visual)– person identification tasks (acoustic, visual, audio-visual)– head pose estimation (single view studio data, multi-view lecture data)– acoustic scene analysis (events, environments)
These tasks and their various subtasks will be described in Section 3.Due to the short time frame for preparing the joint technology evaluations
in CLEAR, it was decided that the evaluations tasks that had already beendefined in VACE and CLEAR, respectively, would be kept as they were, andthus were run independently in parallel, with their slightly differing annotationsand on different data sets. As a consequence there were, for example, several 3Dperson tracking tasks (CHIL) as well as 2D person tracking tasks (VACE) inCLEAR 2006. As a first step of harmonizing evaluation tasks, the participantsfrom CHIL and VACE had, however, agreed on common metrics for multipleobject tracking (see section 3.3). The aim for upcoming evaluations is to furtherharmonize metrics and benchmarks.
1.4 Contributors
CLEAR 2006 would not have been possible without the help and effort of manypeople and institutions worldwide. CLEAR 2006 was supported by the projectsCHIL [1] and VACE [3]. The organizers of CLEAR are the Interactive SystemsLabs of the Universitat Karlsruhe, Germany (UKA), and the US National In-stitute of Standards and Technology (NIST), with the support of contractorsUniversity of South Florida (USF) and VideoMining Inc. The participants andcontributors to the CLEAR 2006 evaluations included: the Research and Edu-cation Society in Information Technologies at Athens Information Technology,Athens, Greece, (AIT), the Interactive Systems Labs at Carnegie Mellon Uni-versity, Pittsburgh, PA, USA, (CMU) the Evaluations and Language resourcesDistribution Agency, Paris, France (ELDA), the IBM T.J. Watson Research

Center, RTE 134, Yorktown Heights, USA (IBM), the Project PRIMA of theInstitut National de Recherche en Informatique et en Automatique, Grenoble,France (INRIA), the Centro per la ricerca scientifica e tecnologica at the InstitutoTrentino di Cultura, Trento, Italy (ITC-IRST), the Laboratoire d’Informatiquepour la mecanique et les sciences de l’ingenieur at the Centre national de larecherche scientifique, Paris, France (LIMSI), Pittsburgh Pattern Recognition,Inc., Pittsburgh, PA, USA (PPATT), the department of Electronic Engineeringof the Queen Mary University of London, UK, (QMUL) the Institute of SignalProcessing of the Technical University of Tampere, Finland, (TUT), the Breck-man Institute for Advanced Science and Tech. at the University of Illinois UrbanaChampaign, USA (UIUC) the Institute for Robotics and Intelligent Systems ofthe University of Southern California, USA, (USC).
UKA and ITC-IRST provided recordings of seminars (lectures), which wereused for the 3D single person tracking tasks the face detection task and for per-son recognition. AIT, IBM and UPC provided several recordings of “interactive”seminars (basically small interactive meetings), which were used for the multi-person tracking tasks, for face detection, for the person identification tasks andfor acoustic event detection. INRIA provided the Pointing’04 database for headpose detection. UKA provided 26 seminar recordings with head pose annota-tions for the lecturer, which data was used for the second head pose estimationtask. UPC, ITC and CMU provided different databases with annotated acousticevents used for acoustic event classification. Visual and acoustic annotations ofthe CHIL seminar and interactive seminar data were mainly done by ELDA,in collaboration with UKA, CMU, AIT, IBM, ITC-irst and UPC. ELDA alsopackaged and distributed the data coming from CHIL. The data coming fromVACE was derived from a single source for the surveillance data - i-LIDS. Themeeting room data was a collection derived from data collected at CMU, Univer-sity of Edinburgh (EDI), NIST, TNO, and Virginia Tech (VT). The discussionand definition of the invidual tasks and evaluation procedures were moderatedby “task-leaders”. The task-leaders coordinated all aspects surrounding the run-ning of their given tasks. These were Keni Bernardin (UKA, 3D single- andmulti-person tracking), Maurizio Omologo (ITC-irst, 3D acoustic single-persontracking), John Garofolo/Rachel Bowers (NIST, 2D Multi-person tracking tasks,VACE 2D face tracking, vehicle tracking), Hazim Ekenel (UKA, visual personidentification), Djamel Mostefa (ELDA, acoustic identification), AristodemosPnevmatikakis (AIT, audio-visual identification), Ferran Marques and RamonMorros (both UPC, CHIL 2D Face detection), Michael Voit (UKA, head poseestimation), Andrey Temko (UPC, acoustic event detection). The tasks leaderswere also responsible for scoring the evaluation submissions, which in additionwere also centrally scored by ELDA.
This paper aims at giving an overview of the CLEAR 2006 evaluation. Inthe remainder of this paper we will therefore give a brief overview of the datasets used (Section 2) and the various evaluation tasks (Section 3). In Section4 we present an overview of the results and discuss some of the outcomes andpotential implications for further evaluations.

Further details on the tasks definitions and data sets can be found in theCHIL and VACE evaluation plans [9], [10] and on the CLEAR webpage [11].
2 Datasets Used In CLEAR 2006
2.1 The CHIL Seminar Database
A large mutimodal database has been collected by the CHIL consortium for theCLEAR 2006 evaluation, consisting of audiovisual recordings of regular lecture-like seminars and interactive small working group seminars. For some of theinteractive seminars, scripts were used in order to elicit certain activities (e.g.,opening doors, taking a coffee break), which were to be automatically detectedin one or more evaluation tasks (e.g., acoustic event detection).
The database contains audio and video recordings segments from 47 seminarsrecorded at the following sites:
– AIT, Athens, Greece,– IBM, New-York, USA,– ITC-IRST, Trento, Italy,– UKA, Karlsruhe, Germany,– UPC, Barcelona, Spain.
These seminars were given by students and lecturers of each institution or byinvited speakers on topics concerning technologies involved in the CHIL project,such as speech recognition, audio source localization, audio scene analysis, videoscene analysis, person identification and tracking, etc. The language is Englishspoken by mostly non native speakers. A detailled description of the CLEARdatabase can be found in [9].
Non-Interactive Seminars versus Interactive Seminars
– Non-interactive seminars were provided by ITC-IRST and UKA. Theseseminars consist of lecture-like presentations in a small seminar room. Onepresenter is talking in front of an audience of 10 to 20 people. In theserecordings, the focus is mainly on the presenter (he’s the only one wearing aclose talking microphone, moving, . . . ). As a consequence, only the presenterhas been annotated for the different tasks using this database (tracking,identification, . . . ). An example of non-interactive seminars is given by thefirst two pictures in Fig. 1.
– Interactive seminars were recorded by AIT, IBM and UPC. The recordingroom is a meeting room and the audience is made up of only 3 to 5 people.The attendees are sitting around a table and are wearing close-talking micro-phones, just as the presenter. There is a higher degree of interaction betweenthe presenter and the audience. During and after the presentation, there arequestions from the attendees with answers from the presenter. Moreoverthere is also activity in terms of people entering or leaving the room, open-ing and closing the door. AIT and UPC seminars have been scripted in order

to elicit certain activities (e.g., opening doors, taking a coffee break). Theseactivities were to be automatically detected in one or more evaluation tasks(e.g., acoustic event detection). The last 3 pictures of Fig. 1 show examplesof interactive seminars.
ITC−irst
AIT IBM UPC
UKA
Fig. 1. Scenes from non-interactive and interactive seminars
Data Description
– Raw data: Each seminar is composed of synchronized audio and videostreams. The video streams consist of 4 to 5 JPEG sequences recorded at15 to 30 frames per second by 4 fixed corner and a ceiling camera. Acousticsounds are recorded using a great variety of sensors. High quality close talk-ing microphones are used by every participant in interactive seminars and bythe presenter only in non-interactive seminars. In addition, omnidirectionaltable top microphones and several T-shaped arrays are used for far-fieldrecordings. All these microphones are synchronised at the sample level by adedicated sound card. Moreover, far field recordings are also captured by aNIST markIII 64 channel microphone array. Fig. 2 shows an example of arecording room setup.
– Audio transcription: For a single audiovisual data element (a seminar),two transcriptions were produced. The first one is the speaker transcriptionwhich contains the speech utterances of all intervening speakers, includinghuman-generated noises accompanying speech. This is done by transcribing

Fig. 2. Example recording room setup (source: UKA)
the close-talking microphone recording of the main speaker. The second oneis the environment transcription which contains all noises not produced bythe speaker(s). Environment transcriptions are realized on far-field record-ings. All environmental noises (human and non-human) and all speaker utter-ances are transcribed. Both transcriptions were produced with Transcriber[12] and are in native XML format.
Acoustic event noises annotations are made on the far field recordings withAGTK annotation tool [13]. This tool enables the annotations of overlappingnoises in a simple XML format.
– Video labels: Video annotations were realized using an in house developedtool. This tool allows to sequentially display video frames to be annotated,for the 4 corner cameras. On each displayed picture, the annotator was toclick on the head centroid (the estimated centre of the head), the left eye,right eye, and nose bridge of the annotated person. In addition to these fourpoints, a face rectangle bounding box was used to delimit the person’s face.These annotations were done on the lecturer for non-interactive seminarsand on each participant for interactive seminars. The 2D coordinates withinthe camera planes were interpolated among all cameras in order to computethe real ”ground truth” location of the speaker within the room. Fig. 3 showsan example of video labeling. Displayed are the head centroid, the left eye,the nose bridge, the right eye and the face bounding box.

Fig. 3. Example of video annotations
Development Data The development data is made of segments used in previ-ous CHIL evaluations and of new seminars provided by new recording sites. 17seminars from UKA used in the first CHIL evaluation and the NIST Rich Tran-scription 2005 were used as development data for CLEAR 2006. For each UKAseminar, two segments of 5min each were used. The first one is taken from thetalk of the presenter and the other one is selected from the question-answeringsession at the end of the talk. The second segment usually contains more spon-taneous speech and involves more speakers than the first one. In addition to theUKA seminars, around 1 h of data coming from AIT, IBM, ITC-IRST and UPCwas added to the development set. The first 15min of the first seminar recordedby each site was used. In total, the development set duration is 204min with80 % non-interactive seminars and 20 % interactive seminars. This imbalanceis mainly due to the fact that only 3 interactive seminars were recorded andlabeled at the time the development set was released. Table 1 gives an overviewof the composition of the development set.
Evaluation Data As for the development set, the evaluation set is composedof segments from interactive and non-interactive seminars. Due to the avail-ability of more data recorded at each site, the evaluation data is much morebalanced between interactive and non-interactive seminars. The total durationof the CLEAR’06 evaluation set is 190min, of which 14 seminars, representing68 %, are non-interactive and 12 seminars, representing 32 %, are interactive.Table 2 gives an overview of the composition of the evaluation set.

Site Type Number Total length (in minutes)
ITC-irst non interactive 1 15
UKA non interactive 17 148
AIT interactive 1 13
IBM interactive 1 15
UPC interactive 1 13
TOTAL 21 204
Table 1. The CLEAR’06 development set
Site Type Number Total length (in minutes)
ITC-irst non interactive 2 10
UKA non interactive 12 120
AIT interactive 4 20
IBM interactive 4 20
UPC interactive 4 20
TOTAL 26 190
Table 2. The CLEAR’06 evaluation set
2.2 VACE Related Databases
For tasks coordinated and led by the VACE community, the evaluations wereconducted using two main databases, the Multi-Site Meetings and the i-LIDSSurveillance data (see Table 3).
Data Raw Data Training Evaluation
Multi-Site Meetings ≈ 160GB 50 Clips (Face) 45 Clips (Face)
i-LIDS Surveillance ≈ 38GB 50 Clips (Person) 50 Clips (Person)
i-LIDS Surveillance ≈ 38GB 50 Clips (Moving Vehicle) 50 Clips (Moving Vehicle)
Table 3. The VACE related databases
All the raw data is in MPEG-2 format with either 12 or 15 I-frame rateencoding. The annotations are specifically done using the ViPER tool developedby UMD by VideoMining.
The Multi-Site Meetings are composed of datasets from different sites, sam-ples of which are shown in Fig 4.
1. CMU (10 Clips)2. EDI (10 Clips)3. NIST (10 Clips)4. TNO (5 Clips)

5. VT (10 Clips)
(a) CMU (b) EDI (c) NIST
(d) TNO (e) VT
Fig. 4. Scenes from Multi–Site Meetings
Each site has their own independent camera setup, different illuminations,viewpoints, people and topics in the meetings. Most of these datasets also figuredHigh-Definition (HD) recordings but were subsequently formatted to MPEG-2standard for evaluation purposes. Fig. 2.2 shows an example of the recordingroom setup for the NIST meeting data collection laboratory. The room has sevenHD cameras, the table has one quad microphone and three omni-directionalmicrophones. Each meeting room participant is equipped with one wireless lapelmic and one headmounted mic. The room is equipped with both traditional andelectronic whiteboards as well as a projector for presentations. All cameras aresynchronized using the NIST Smart Data Flow synchronization software. Formore details on the individual room setup for all the sites, please refer to [14].Specific annotation or labeling details can be found in Section 3.4.
i-LIDS is a video surveillance dataset that has been developed by the UnitedKingdom Government as a “benchmark for video-based detection systems”[15].VACE has obtained permission to use this data for their person and vehicledetection and tracking evaluations. The dataset for the CLEAR evaluation in-cludes outdoor views of roadways with walking paths. Though night scenes wereavailable for the data training test set the actual evaluation was limited to dayscenes. The dataset was composed of two different scenes with various shapes

Fig. 5. Example recording room setup (source: NIST)
and sizes of vehicles and people, making for a challenging evaluation task. Spe-cific annotation/labeling details for a person or vehicle in the video can be foundin Section 3.5 and 3.6.
2.3 Other Databases
In addition to the two main databases mentioned above, specific datasets attunedto the head pose estimation and the acoustic scene analysis tasks were also usedin the CLEAR’06 evaluation. These databases will be explained in more detailtogether with the corresponding task descriptions in section 3.
3 CLEAR Tasks and Metrics
This section gives an overview of the different tasks evaluated in the CLEAR’06evaluation. Three main databases were evaluated on: The first is a series ofrecordings made in CHIL smartrooms, using a wide range of synchronized sen-sors, and useful for multimodal analysis in indoor environments. The second,originally used for the VACE tasks, comprises a set of single camera surveillancevideos used for visual outdoor detection and tracking scenarios. The third isa set of multi-camera meeting room recordings used mainly for face detectiontasks (see Section 2 for details on the used data sets).
The CLEAR tasks can be broken down into four main categories: trackingtasks, identification tasks, head pose estimation tasks and acoustic scene analysistasks. Table 4 shows the different CLEAR tasks.

Table 4. Overview of CLEAR’06 tasks
Task name Organizer Database
Tracking
3D Single Person Tracking (A,V,AV) CHIL Non-interactive Seminars3D Multi-Person Tracking (A,V,AV) CHIL Interactive Seminars2D Face Detection & Tracking (V) CHIL/VACE All Seminars/Multi-Site Meetings2D Person Tracking (V) VACE Surveillance DataVehicle Tracking (V) VACE Surveillance Data
Person Identification (A,V,AV) CHIL All Seminars
Head Pose Estimation (V) CHIL Seminars1, Pointing04 DB
Acoustic Scene Analysis
Acoustic Event Detection CHIL Isolated Events, UPC SeminarsAcoustic Environment Classification CHIL AATEPS corpus
3.1 3D Single Person Tracking
One of the main tasks in the 2006 CLEAR evaluation, in terms of participation,was the 3D single person tracking task. The task definition was inherited fromprevious evaluations made in the CHIL project. The objective was to track a pre-senter giving a talk in front of an audience in a small seminar room (see Fig. 6).The database to be evaluated on consisted of recordings made at two CHIL sites,UKA and ITC-IRST, with different room sizes and layouts, but with a commonsensor setup. The video streams from the four corner cameras of the room andthe audio streams from the four T-shaped arrays and the MarkIII microphonearray were available to do the tracking. In addition to the raw data, only the cal-ibration information for the cameras and the locations of the microphones couldbe used. No explicit knowledge about the initial position of the presenter, thelocation of the whiteboard, of the room doors, of the audience, etc. was provided.However, participants were able to tune their systems on data from a separatedevelopment set, showing different seminars recorded in the same rooms.
Whereas in earlier CHIL evaluations the visual and acoustic tracking taskswere evaluated separately, here, for the first time, it was possible to comparethe performance of trackers from both modalities, through the use of commondatasets and metrics. A multimodal tracking task was also newly introduced,where the combined audio-visual streams could be used.
As opposed to the CLEAR 2D person tracking task, or similar tasks fromother evaluations, such as e.g. PETS [6], where the objective is typically totrack the positon or bounding box of moving objects in 2D images, the objectivehere was to track the actual location of a person in a room coordinate frame(typically with the origin at one of the bottom corners of the room and the
1 For this task, a number of non-interactive seminars, which were recorded in 2004,were annotated and used. These seminars, however, were not part of the datasetused for the tracking and identification tasks.

(a) cam1 (b) cam2
(c) cam3 (d) cam4
Fig. 6. Example scene from a UKA seminar recording
axes parallel to the walls). This is possible because the CHIL seminar recordingsoffer 4 overlapping, synchronized and calibrated camera views, allowing for videotriangulation, and at least 4 sets of microphone arrays, allowing for precise soundsource localization. As it was not intended to track specific body regions, such asthe head or the feet, a person’s position was defined as his or her x,y-coordinateson the ground plane. This proved a reasonable approximation usable for bothstanding and sitting persons and allowing to evaluate all types of trackers acrossmodalities.
The ground truth person locations for error calculations were obtained frommanual annotation of the video streams. In each of the four corner camerastreams, the presenter’s head centroid was marked. Using calibration informa-tion, these 2D positions were triangulated to obtain the 3D head position, whichwas then projected to the ground to yield the person’s reference position. If thepresenter’s head was not visible in at least 2 camera views, the frame was leftunmarked. Note that due to this annotation scheme, slight errors could be in-troduced in the labeled positions, for ex. when the presenter bends forward tochange his presentation slides. Nevertheless, the annotation of the head centroid

was found to be the easiest, most precise, and least error prone for this kindof task. To further reduce the cost of annotations, it was chosen to label videoframes only in intervals of 1s (i.e. every 15, 25, or 30 frames, depending on theactual framerate of the recording). Tracking systems could be run using all videoframes and audio samples, but were to be evaluated only on labeled frames. Thishelped reduce the cost of evaluation dramatically with only little impact on theaccuracy of results.
For the acoustic tracking task, an additional restriction was made. The evalu-ation of tracking performance was to be decoupled from that of speech detectionand segmentation. That is why acoustic tracking systems, although run contin-uously on all data, were evaluated only on segments of non-overlapping speechwhere the presenter is speaking and no greater source of noise (e.g. clapping) isaudible. These segments were defined by manual annotation.
For the multimodal tracking task, two separate conditions were defined, tooffer better comparability to the visual and acoustic tracking tasks. In conditionA, multimodal tracking systems were evaluated on segments of non-ovelappingspeech only, just as in the acoustic task. This could serve to measure whatincrease in precision the addition of the visual modality would bring to acoustictracking, given an already accurate speech segmentation. In condition B, theywere evaluated on all labeled time frames, as in the visual task, regardless if thespeaker was active or not. This served to measure the enhancement brought bythe fusion of modalities in the general case.
The metrics used to evaluate single person tracking performance are ex-plained in section 3.3 and the results for all subtasks and conditions summed upin section 4.1.
3.2 3D Multi-Person Tracking
As opposed to the 3D single person tracking task, where only the main speakerhad to be accounted for, ignoring the audience, the objective in the 3D multi-person tracking task is to simultaneously track all the participants in a smallinteractive meeting. To this effect, a set of recordings was made at three CHILsites, IBM, UPC, and AIT, with a slightly modified scenario involving 4 to6 people (see Fig. 7). While there is still a main speaker presenting a topicto the other participants, there is much more interaction as participants taketurns asking questions or move around while entering the room or during coffeebreaks. These recordings proved quite challenging compared to the single persontracking task due to the number of persons to track, the relatively small size ofthe meeting rooms and the high variability of the scenario.
The same sensor setup as for single person tracking was used. Additionally,video streams from a ceiling mounted panoramic camera were available. Theannotations were also made in the same manner, with the exception that foreach time frame, the head centroids of all participants were labeled.
In contrast to single person tracking, the definition of the multi-person track-ing task is quite dependent on the chosen modality.

(a) cam1 (b) cam2 (c) cam3
(d) cam4 (e) cam5
Fig. 7. Example scene from a UPC interactive seminar recording
For visual tracking, the objective is to track every participant of the interac-tive seminar for all labeled frames in the sequence.
For the acoustic tracking task, on the other hand, the objective was to trackonly one person at a time, namely the active speaker, because tracking duringoverlapping speech was considered to be too difficult at this time. While in singleperson tracking, this was limited to the presenter, here it could also be anyonein the audience. Systems are evaluated only on manually defined segments ofnon-overlapping speech with no considerable noise sources.
For multimodal tracking, again, two conditions were introduced: In conditionA, the objective is to audio-visually track only one person at each point in time,namely the active speaker. This is best comparable to the acoustic tracking task,and is evaluated only on manually defined active speech segments. In conditionB, the goal is to track all persons in all labeled time frames using streams fromboth audio and visual modalities.
Evaluating the performance of systems for tracking multiple persons, andallowing for comparative results across modalities and tasks required the defini-tion of a specialized set of metrics. These same metrics are also used in singleperson tracking, and in modified form in most other tracking tasks. They areexplained in detail in section 3.3. The results for the 3D multi-person trackingtask are summarized in section 4.2.

3.3 Multiple Object Tracking Metrics
Defining measures to express all of the important characteristics of a system forcontinuous tracking of multiple objects is not a straightforward task. Variousmeasures, all with strengths and weaknesses, currently exist and there is noconsensus in the tracking community on the best set to use. For the CLEARworkshop, a small expressive set of metrics was proposed. In the following, thesemetrics are briefly introduced and a systematic procedure for their calculationis shown. A more detailed discussion of the metrics can be found in [16].
The MOT Precision and Accuracy Metrics For the design of the CLEARmultiple object (person) tracking metrics, the following criteria were followed:
– They should allow to judge a tracker’s precision in determining exact objectlocations.
– They should reflect its ability to consistently track object configurationsthrough time, i.e. to correctly trace object trajectories, producing exactlyone trajectory per object (see Fig. 8).
Additionally, we expect useful metrics
– to have as few free parameters, adjustable thresholds, etc, as possible to helpmake evaluations straightforward and keep results comparable.
– to be clear, easily understandable and behave according to human intuition,especially in the occurence of multiple errors of different types or of unevenrepartition of errors throughout the sequence.
– to be general enough to allow comparison of most types of trackers (2D, 3Dtrackers, acoustic or visual trackers, etc).
– to be few in number and yet expressive, so they may be used e.g. in largeevaluations where many systems are being compared.
Based on the above criteria, we define a procedure for systematic and objec-tive evaluation of a tracker’s characteristics. Assuming that for every time framet a multiple object tracker outputs a set of hypotheses {h1 . . . hm} for a set ofvisible objects {o1 . . . on}, we define the procedure to evaluate its performanceas follows:
Let the correspondence between an object oi and a hypothesis hj be valid onlyif their distance disti,j does not exceed a certain threshold T (for CLEAR’06,T was set to 500mm), and let Mt = {(oi, hj)} be a dynamic mapping of object-hypothesis pairs.
Let M0 = {}. For every time frame t,
1. For every mapping (oi, hj) in Mt−1, verify if it is still valid. If object oi is stillvisible and tracker hypothesis hj still exists at time t, and if their distancedoes not exceed the threshold T , make the correspondence between oi andhj for frame t.
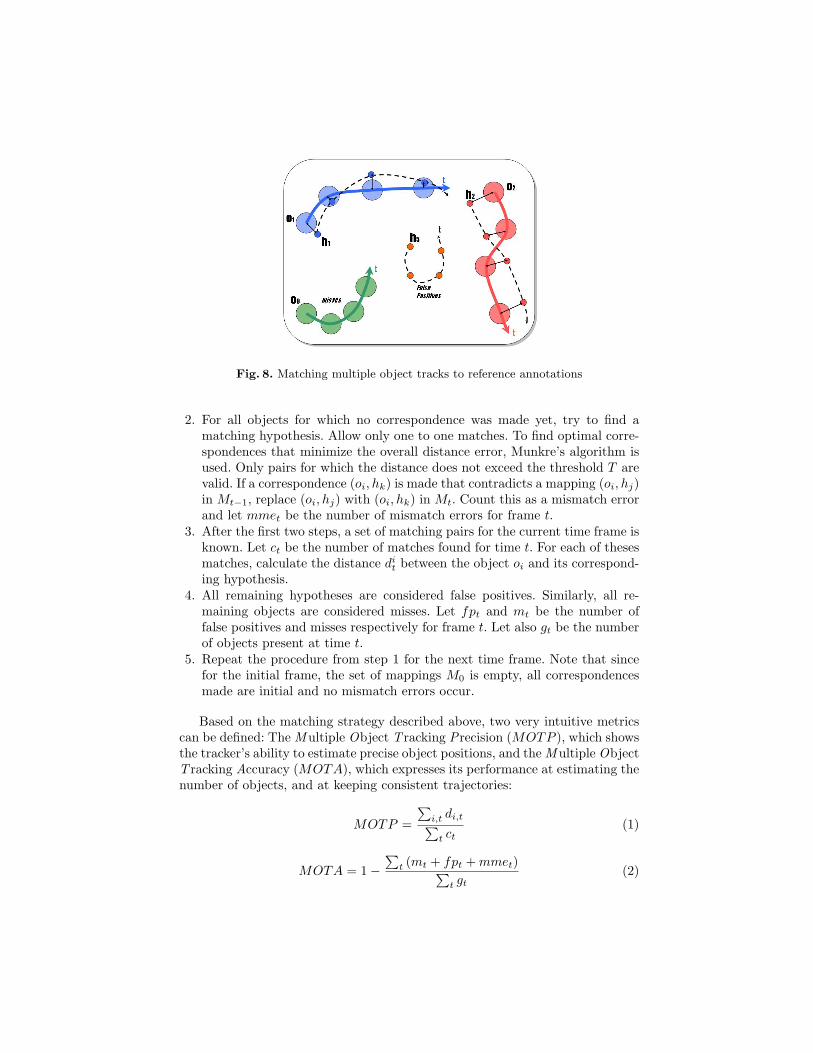
Fig. 8. Matching multiple object tracks to reference annotations
2. For all objects for which no correspondence was made yet, try to find amatching hypothesis. Allow only one to one matches. To find optimal corre-spondences that minimize the overall distance error, Munkre’s algorithm isused. Only pairs for which the distance does not exceed the threshold T arevalid. If a correspondence (oi, hk) is made that contradicts a mapping (oi, hj)in Mt−1, replace (oi, hj) with (oi, hk) in Mt. Count this as a mismatch errorand let mmet be the number of mismatch errors for frame t.
3. After the first two steps, a set of matching pairs for the current time frame isknown. Let ct be the number of matches found for time t. For each of thesesmatches, calculate the distance di
t between the object oi and its correspond-ing hypothesis.
4. All remaining hypotheses are considered false positives. Similarly, all re-maining objects are considered misses. Let fpt and mt be the number offalse positives and misses respectively for frame t. Let also gt be the numberof objects present at time t.
5. Repeat the procedure from step 1 for the next time frame. Note that sincefor the initial frame, the set of mappings M0 is empty, all correspondencesmade are initial and no mismatch errors occur.
Based on the matching strategy described above, two very intuitive metricscan be defined: The Multiple Object T racking Precision (MOTP ), which showsthe tracker’s ability to estimate precise object positions, and the Multiple ObjectT racking Accuracy (MOTA), which expresses its performance at estimating thenumber of objects, and at keeping consistent trajectories:
MOTP =
∑i,t di,t∑
t ct(1)
MOTA = 1 −∑
t (mt + fpt + mmet)∑t gt
(2)

The MOTA can be seen as composed of 3 error ratios:
m =∑
t mt∑t gt
, fp =∑
t fpt∑t gt
, mme =∑
t mmet∑t gt
,
the ratio of misses, false positives and mismatches in the sequence, computedover the total number of objects present in all frames.
For the current run of CLEAR evaluations, it was decided that for acous-tic tracking, it was not required to detect speaker change or to track speakeridentities through time. Therefore, the measurement of identity mismatches isnot meaningful for these systems, and an separate measure, the A − MOTA iscomputed, by ignoring mismatch errors in the global error computation:
A −MOTA = 1 −∑
t (mt + fpt)∑t gt
(3)
The above described MOTP and MOTA metrics were used in slightly modi-fied form throughout the CLEAR tracking tasks and proved very useful for largescale comparisons of tracker performance across tasks and modalities.
Multiple Object Detection Precision and Accuracy In contrast to thepoint-wise distance metric described above, for the Multiple Object Detec-tion Precision (MODP) the spatial overlap information between the groundtruth and the system output is used to compute an Overlap Ratio as defined inEq 4.
Here, the notation G(t)i denotes the ith ground truth object in the tth frame
and Dti denotes the detected object for Gt
i.
Overlap Ratio =Nt
mapped∑i=1
|G(t)i
⋂D
(t)i |
|G(t)i
⋃D
(t)i |
(4)
A threshold of 0.2 for the spatial overlap is used, primarily to compute themisses and false alarms (required while computing the MODA measure).
Using the assignment sets, the Multiple Object Detection Precision (MODP)is computed for each frame t as:
MODP (t) =(Overlap Ratio)
N tmapped
(5)
where, N tmapped is the number of mapped object sets in frame t. This gives us
the localization precision of objects in any given frame and the measure can alsobe normalized by taking into account the total number of relevant evaluationframes. If N t
mapped = 0, then the MODP is forced to a zero value.
N −MODP =∑Nframes
t=1 MODP (t)Nframes
(6)

The thresholded approach for the Overlap Ratio is meant to minimize theimportance of the spatial accuracy. The N-MODP hence gives the localizationprecision for the entire sequence.
The Multiple Object Detection Accuracy (MODA) serves to assess theaccuracy aspect of system performance. Here, only the missed counts and falsealarm counts are used. Assuming that in each frame t, the number of misses areindicated by mt and the number of false positives indicated by fpt, the MultipleObject Detection Precision (MODA) can be computed as:
MODA(t) = 1 − cm(mt) + cf (fpt)N t
G
(7)
where, cm and cf are the cost functions for the missed detects and false alarmpenalties. These cost functions are used as weights and can be varied based onthe application at hand. If misses are more critical than false alarms, cm can beincreased and cf reduced. N t
G is the number of ground truth objects in the tth
frame.The computation of the N-MODA, the normalized MODA for the entire
sequence, is made as:
N −MODA = 1−∑Nframes
i=1 (cm(mi) + cf (fpi))∑Nframes
i=1 N iG
(8)
Differences in the VACE Detection and Tracking Metrics In November2005, the evaluation teams from the CHIL and VACE projects both had theirown sets of individual metrics. It was decided that in order to harmonize theCLEAR evaluation tasks, the metrics also have to be harmonized. In the CHILProject, the tracking metrics used were:
– MOTP (Multiple Object Tracking Precision)– MOTA (Multiple Object Tracking Accuracy)
On the other hand, the VACE side used the following detection and trackingmetrics:
– SFDA (Sequence Frame Detection Accuracy) for Detection– ATA (Average Tracking Accuracy) for Tracking
and a whole set of diagnostic metrics to measure individual components of theperformance.
The key differences between the MODP/A and MOTP/A metrics, used inVACE-related tasks, and the standard MOTP/A used in CHIL-related tasks are:
– The metrics use the spatial component instead of the distance. We believethat for this evaluation we can keep this additional dimensionality.

– The mapping differs as in we use an Hungarian matching to map groundtruth and system output boxes and this again uses the spatial component(as in spatial overlap between two objects). The idea is to maximize themetric score based on these individual components.
3.4 2D Face Detection and Tracking
The goal of this evaluation task was to measure the quality and accuracy of facedetection techniques, both for meeting and for lecture scenarios. As opposed tothe person tracking tasks, the objective here was not to estimate the trajectoriesof faces in real world coordinates, but rather to correctly detect as many facesas possible within the separate camera views. To this effect, no triangulation or3D computation between views and no continuous tracking were required.
The main difficulty - and at the same time the scientific contribution - ofthis task stems from the nature of the database itself. In the CLEAR seminarand meeting databases, faces sizes are extremely small, in some cases down to(10x10) pixels, faces are rarely oriented towards cameras, lighting conditions areextremely difficult and faces are often partly occluded, making standard skincolor segmentation or template matching techniques inapplicable. This drivesthe development of new techniques, which can handle very difficult data recordedunder realistic wide camera view conditions. As in person tracking tasks, for thelecture scenario, only the presenter’s face was to be found, whereas for interactiveseminar and meeting scenarios, all faces had to be detected (see Fig. 9).
(a) UKA seminar (b) AIT interactive seminar
Fig. 9. Scenes from the Face Detection & Tracking database
A correct face detection should deliver not only the position of the face in theimage, but also its extension, as this information can be valuable for subsequentidentification or pose estimation processes. The ouput of face detection systemsare therefore the bounding boxes of detected faces, which are compared to man-ual annotations. The guidelines for annotating the face bounding boxes differed

very slightly for the CHIL and VACE databases, resulting in somewhat largerface boxes in the CHIL data. Also, the criteria for considering a face as visiblediffered. Whereas in the VACE data it depended on the visibility of at least oneeye, the nose, and part of the mouth, in the CHIL data, only visibility of at leastone eye or the nose bridge was necessary. For future evaluations, it is plannedto harmonize the annotation guidelines, to produce more uniform databases. Asfor the person tracking task, a face label was created only for every second ofvideo.
To evaluate the performance of face detection and tracking algorithms, fivemeasures were used: The percentage of correctly detected faces, wrong detec-tions, and non-detected (missing) faces, the mean weighted error (in pixels) ofthe estimated face center, and the mean (face) extension accuracy.
For a correctly detected face in a frame i, the mean weighted error is definedas:
wei =
∥∥Cdi − Cl
i
∥∥2
Ri
with Cdi and Cl
i , the centers of the detected and labeled faces respectively,and Ri the face size, calculated as the average of the vertical and horizontal facebounding box lengths.
The mean extension accuracy is defined as:
A((BBl ∪BBd)− (BBl ∩BBd))A(BBl)
the ratio of the area A(.) of the symmetric difference of the detected andlabeled bounding boxes BBd and BBl with respect to the labeled bounding boxBBl.
The resulting errors are averaged over all faces in all frames. The results ofthe face detection and tracking task, evaluated on the CHIL recording database,are presented in section 4.3.
In the VACE Multi-Site Meeting database, the face is marked horizontallybound to the extent of the eyes and vertically bound from just above the eyesto the chin. The face must have at–least one eye, part of the nose and lips seento be annotated. For specific annotation guidelines, please refer to [17]. TheMODA/MODP metrics for detection and MOTA/MOTP metrics for trackingare used.
3.5 2D Person Detection and Tracking
The goal of the person detection task is to detect persons in a particular frame,while for the tracking task it is to track persons in the entire clip. The annotationof a person in the Surveillance domain comprises the full extent of the person(completely enclosing the entire body including the arms and legs). Specific

Fig. 10. Sample annotation for a person in the Surveillance domain.
annotation details about how a person is marked are given in the annotationguidelines document [17].
Fig 10 shows a sample person annotation. When at least 25 % of a personis visible, the person is annotated. Each person is marked with a bounding boxand each box has a rich set of attributes to enable sub–scoring if needed.
For formal evaluations though, the simplest setting is used: the person mustbe clearly visible (should not be occluded by any other object, e.g. being oc-cluded by the branches of the tree. If a person walks behind a bigger object theannotations are stopped temporarily until the person is visible again. Depend-ing on how long it takes for this person to re-appear the objectID is maintainedaccordingly. The specific guidelines can be found in [17].
The metrics used are the MODA/MODP and the MOTA/MOTP.
3.6 Vehicle Tracking
The goal of the moving vehicle task is to track any moving vehicle in a given clip.During annotations, only vehicles that have moved at any time during the clipare marked. Vehicles which are completely stationary are not marked. Vehiclesare annotated at the first frame where they move. For specific details about theannotations please refer to the annotation guidelines document [17].
For a vehicle to be annotated, at least 25 % of the vehicle must be visible,and it is marked with a bounding box. Each box has a rich set of attributes,essentially recording if the vehicle is currently moving and whether it is occluded(a vehicle is marked as occluded if it is more than 50 % occluded). Fig 11 showsa sample vehicle annotation.

For this evaluation, the simplest setting was used: the vehicle has to bemoving and must be clearly visible (should not be occluded by other objects).In the i-LIDS dataset there are regions where vehicles are not clearly visible dueto tree branches or where the sizes of vehicles are very small. These particularregions are marked accordingly and are not evaluated. Also, since this is purelya tracking task, the metrics used here are the MOTA and MOTP.
Fig. 11. Sample from the moving vehicle tracking in Surveillance domain
3.7 Person Identification
In a smart meeting or lecture room environment, where many sensors and per-ceptual components cooperate to provide rich information about room activities,the tracking algorithms presented in the previous sections can serve as buildingblocks, providing necessary person locations, aligned faces, or localized speechsegments for subsequent identification processes. The goal of the CLEAR personidentification task is to measure what identification accuracies can be reached,and how fast they can be reached, using only far-field microphones and cameras,assuming person locations are already well known (see Fig. 12).
For this purpose, in addition to the head centers and the face boundingboxes, three additional marks have been annotated in the video images: Thepositions of the left and right eye and that of the nose bridge. These labelsserve to achieve an exact alignment and cropping of face images necessary forface identification routines, clearly decoupling the identification task from thedetection and tracking task. While all other features were marked for everysecond of video, the eye labels were produced every 200 ms, for better precision.
As for the face detection task, one of the big challenges - and the novelty - ofthe CLEAR visual identification task comes from the database itself. The sem-inar videos contain extremely low resolution faces, down to (10x10) pixels witheye distances ranging from 4 to 16 pixels, which are very difficult to detect with

Fig. 12. Sample from the CLEAR person identification database
conventional techniques, let alone to identify. This is also why a decoupling fromthe tracking task becomes necessary, if the performance of identification tech-niques alone is to be accurately measured. Similarly, the acoustic identificationis to be made solely on far-field microphones, arrays and tabletops, which canbe very distant from the speaker and include all kinds of room noises, murmurs,cross-talk, etc.
The above mentioned difficulties in the data led to a task definition requiringthe identification over time windows of varying length, as opposed to identi-fication on single frames, allowing for enough evidence for correct recognitionto be accumulated. For CLEAR 2006, a closed set identification task was pro-posed. The data consisted of synchronized audio-visual segments cut out fromthe CHIL seminar recordings and containing in total 26 different subjects. Inthe seminar scenario, only the presenter was to be identified, whereas in the in-teractive seminar scenarios, recognition was to be done for all participants. Forthe visual task, images from the four corner cameras, for the acoustic task, allthe signals from the far-field microphones could be used for identification. In themultimodal task, all information from the audio-visual streams was available.
The data for the person identification task was partitioned into training (en-rollment) and test segments of varying lengths, to assess the effect of temporalinformation fusion: For training, two conditions, A and B, with segment lengthsof (15 and 30)s respectively, were evaluated. The test conditions comprised seg-ments of (1, 5, 10 and 20)s, allowing to measure the increase in recognitionaccuracy as more information becomes available.
Identification systems are required to output one recognized ID per test seg-ment, which is compared to the labeled identity. The error measure used is thepercentage of wrongfully recognized persons for all training and testing condi-tions. The results of the person identification task are presented and discussedin detail in section 4.6.

3.8 Head Pose Estimation
As for the person identification tasks, the main condition in the CLEAR headpose estimation task builds on the results of person and head detection tech-niques and aims at determining the head orientations of seminar or meetingattendees using only the information provided by room corner cameras.
The head pose estimation task in CLEAR’06 was split into two conditions,based on two very different databases. The first is the INRIA 2004 PointingDatabase figuring studio quality close-up recordings of 15 persons providing 93images each (see Fig. 13). The objective for this database is to determine the panand tilt of the user’s head in still images. The reference annotations are made in15 degree intervals in the range from −90◦ to +90◦, and the error measures usedare the mean absolute error in pan and tilt, and the rate of correct classificationto one of the discrete pan and tilt classes.
Fig. 13. Samples from the INRIA Pointing’04 Database
A more natural and challenging problem is addressed in the second condition.Here, the goal is to estimate the pan orientation of the presenter’s head in aCHIL seminar room using the room corner cameras (see Fig. 14). Again, the lowresolution of heads in the camera views and the difficult lighting conditions, aswell as the availability of multiple synchronized video streams are what makethis task novel and challenging. The recordings consist of 12 training and 14 testseminars recorded in the Karlsruhe seminar room, with a length of 18min to68min each. The manual annotations are made for every tenth frame of video,and mark the presenter’s head orientation as belonging to one of 8 pan classes(north, north-west, west, south-west, . . . ), of 45◦ width each.
The goal in this subtask is to continuously track the presenter’s horizontalviewing direction in the global room coordinate frame. As for the visual personidentification task, the problem of estimating the head pose is decoupled from thehead tracking problem by the availability of manually annotated head boundingboxes in the camera images. The error measures used are the mean absolutepan error and the correct classification rate into one of the eight pan classes.In addition, the classification rate into either the correct pan class or one of itsneighboring classes (representing at most 90◦ absolute estimation error) is alsomeasured.
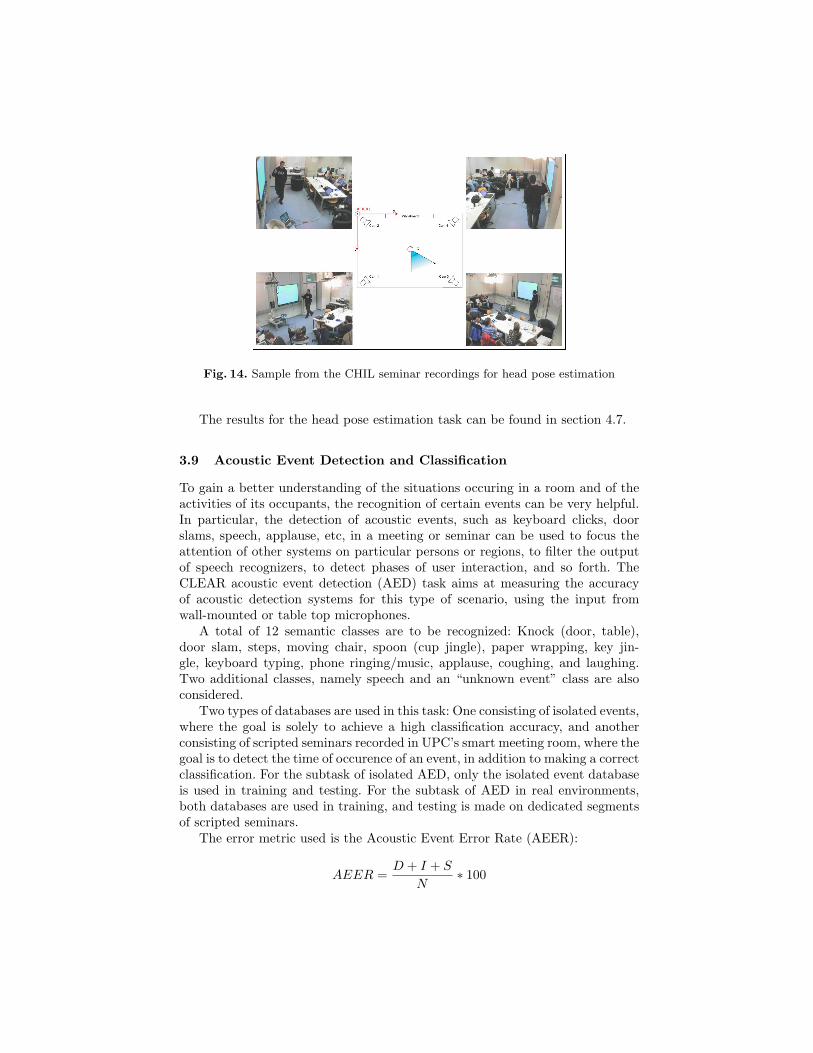
Fig. 14. Sample from the CHIL seminar recordings for head pose estimation
The results for the head pose estimation task can be found in section 4.7.
3.9 Acoustic Event Detection and Classification
To gain a better understanding of the situations occuring in a room and of theactivities of its occupants, the recognition of certain events can be very helpful.In particular, the detection of acoustic events, such as keyboard clicks, doorslams, speech, applause, etc, in a meeting or seminar can be used to focus theattention of other systems on particular persons or regions, to filter the outputof speech recognizers, to detect phases of user interaction, and so forth. TheCLEAR acoustic event detection (AED) task aims at measuring the accuracyof acoustic detection systems for this type of scenario, using the input fromwall-mounted or table top microphones.
A total of 12 semantic classes are to be recognized: Knock (door, table),door slam, steps, moving chair, spoon (cup jingle), paper wrapping, key jin-gle, keyboard typing, phone ringing/music, applause, coughing, and laughing.Two additional classes, namely speech and an “unknown event” class are alsoconsidered.
Two types of databases are used in this task: One consisting of isolated events,where the goal is solely to achieve a high classification accuracy, and anotherconsisting of scripted seminars recorded in UPC’s smart meeting room, where thegoal is to detect the time of occurence of an event, in addition to making a correctclassification. For the subtask of isolated AED, only the isolated event databaseis used in training and testing. For the subtask of AED in real environments,both databases are used in training, and testing is made on dedicated segmentsof scripted seminars.
The error metric used is the Acoustic Event Error Rate (AEER):
AEER =D + I + S
N∗ 100

with D, I, S, the number of deletions, insertions, and substitutions respec-tively, and N the number of events to detect. Here, an event is considered cor-rectly detected when its hypothesized temporal center is situated in the appro-priate time interval of one or more reference events and the hypothesized andreference labels match. If none of the labels match, it is counted as a substitu-tion error. An insertion error occurs when the hypothesised temporal center ofthe detected event does not coincide with any reference event’s time interval. Adeletion error is counted when a referenced event was not detected at all.
Section 4.8 sums up the results for the acoustic event detection task andbriefly describes the challenges and difficulties encountered.
3.10 Acoustic Environment Classification
In contrast to the acoustic event detection task, where the recognition of small,temporally constricted acoustic events is aimed at, the goal in this task is to gaina high level understanding of the type of recording environment itself using audioinformation. This high level knowledge can be used to provide context awarenessin mobile settings where large suites of sensors are not available. One exampleof an application where such knowledge is useful is the CHIL Connector [18]service, in which the environment is used as an information source to help asmart mobile telephone decide whether the user is available for communication.Knowledge of the environmental type can also be useful to boost the performanceof basic perceptual algorithms, e.g., by providing appropriate preprocessing orcontext dependent grammars for speech recognition modules.
In the CLEAR’06 evaluation, classification was tested on a fairly specificset of environments. These environments included airport, bus, gallery, park,restaurant, street, plaza, train, and train platform. Many of these environmentaltypes are self-explanatory. “Gallery” refers to a large indoor space in whichpeople gather, e.g., malls, museums, etc. “Street” is any urban outdoor spacewith streets dominated by vehicular traffic, while “plaza” refers to an urbanoutdoor space with streets dominated by pedestrian traffic, e.g., a city squareor outdoor marketplace. “Park” is an outdoor space not dominated by urbanaccoutrements. Finally, “train platform” refers specifically to that part of a trainor subway station where passengers board and exit train cars.
The environmental recording database used for this evaluation, the AmbientAcoustic Textures in Enclosed Public Spaces (AATEPS) corpus, consisted of aset of 10min audio recordings made with identical recording equipment in theseenvironments; recordings were made in 2004 and 2005 in North America, Europe,Asia, and Africa. A total of 10.5 h of data, divided into 5s segments, was usedin this evaluation, with 5400 segments used for training and 2160 for testing,with half of the test segments taken from recordings not part of the training set.Classification results attained in this evaluation are reported in section 4.9.

4 CLEAR Results and Lessons Learned
This section gives an overview of the CLEAR evaluation results and offers a briefdiscussion based on the attributes of the evaluated systems, and the underlyingproblems in the tasks and databases. It also hints at future directions to befollowed in the next evaluation run, based on the experiences made. For each ofthe CLEAR tasks and conditions, participants were asked to submit hypothesisfiles, which were then centrally scored against the reference ground truths. Sitescould submit several sets of results for each task, coming from different systems,with the condition that there were basic differences in the concerned systems’algorithms themselves, as opposed to simple differences coming from parametertweaking. Because of the great number of evaluated systems, no deep insight intothe individual approaches could be given here. The interested reader is referredto the individual system publications for details.
4.1 3D Single Person Tracking
The 3D single person tracking task solicited the greatest number of interest andparticipation. A total of 21 systems were evaluated for the different audio andvisual conditions. This was due in part to the traditional nature of the task -person tracking -, allowing for a great variety of approaches, from well knowntechniques to cutting edge algorithms, to be applied even though the difficultyof the data and the availability of multiple sensors posed new challenges whichdemanded their share of innovation. The evaluation was made for 4 conditions,the acoustic, the visual, as well as two audio-visual conditions, and the sys-tems were scored using the MOT metrics described in section 3.3. The commondatabase and metrics allowed for an easier comparison of the advantages of dif-ferent modalities for tracking on the realistic CLEAR data.
Fig. 15 shows the results for acoustic tracking. As the systems are only scoredon segments of active speech without noticeable noise, and there is only one tar-get to track, the acoustic subtask very closely resembles a source localizationproblem, with the difference that the actual detection of speech is not beingevaluated. For this reason, and for easier analysis of the results, two additionalerror measures to the MOT metrics are shown in Fig. 15: The rate of missescaused by localization errors exceeding the 500mm threshold, and the rate ofmisses attributed to missing speaker hypotheses. Many techniques were pre-sented, mostly based on the calculation of a generalized cross correlation (GCC)or global coherence field (GCF) function, accompanied by Kalman, particle, ordata association filtering. The best overall result was achieved by a joint proba-bilistic data association filtering technique using as features the TDOA betweenmicrophone pairs. Overall, the MOTP measure shows that, given correct speechsegmentation, very high localization accuracies of up to 14cm can be achieved.For comparison, the expected error in manual annotation of the speaker’s headis also of the order of 8-10cm. The MOTA measure, on the other hand, showsus that even for the best systems, in roughly 20 % of all cases the presenteris still to be considered missed. While for most systems, this stems from gross
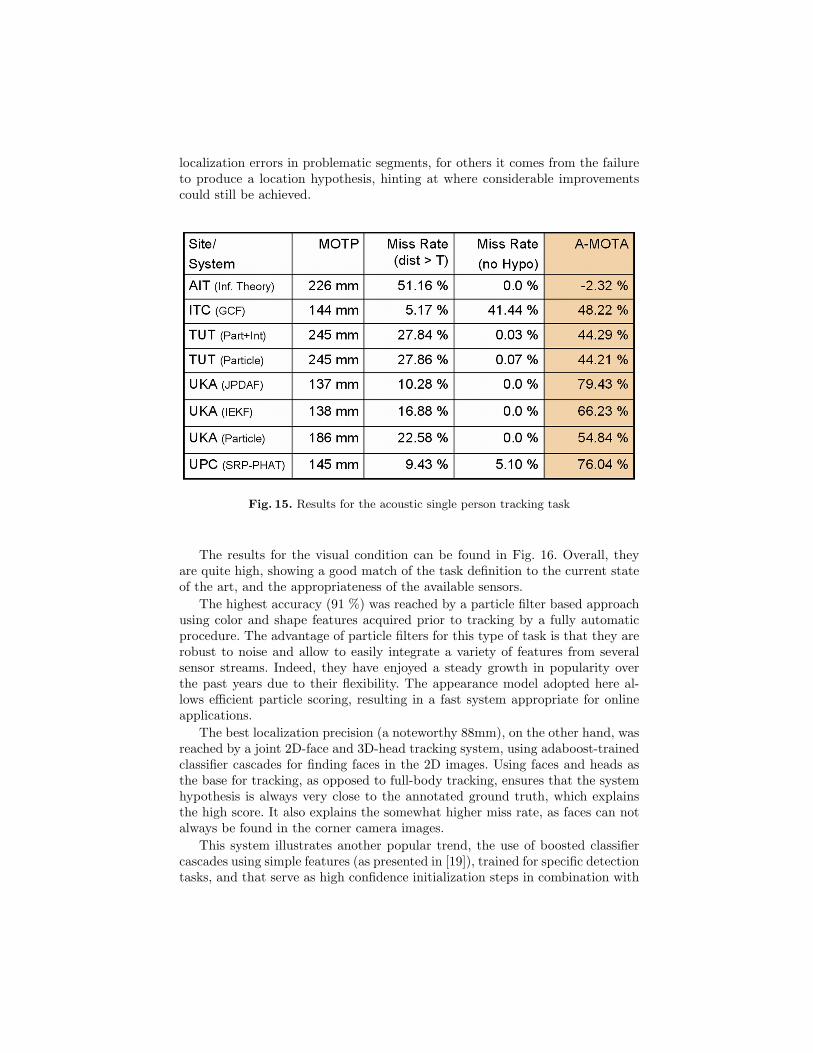
localization errors in problematic segments, for others it comes from the failureto produce a location hypothesis, hinting at where considerable improvementscould still be achieved.
Fig. 15. Results for the acoustic single person tracking task
The results for the visual condition can be found in Fig. 16. Overall, theyare quite high, showing a good match of the task definition to the current stateof the art, and the appropriateness of the available sensors.
The highest accuracy (91 %) was reached by a particle filter based approachusing color and shape features acquired prior to tracking by a fully automaticprocedure. The advantage of particle filters for this type of task is that they arerobust to noise and allow to easily integrate a variety of features from severalsensor streams. Indeed, they have enjoyed a steady growth in popularity overthe past years due to their flexibility. The appearance model adopted here al-lows efficient particle scoring, resulting in a fast system appropriate for onlineapplications.
The best localization precision (a noteworthy 88mm), on the other hand, wasreached by a joint 2D-face and 3D-head tracking system, using adaboost-trainedclassifier cascades for finding faces in the 2D images. Using faces and heads asthe base for tracking, as opposed to full-body tracking, ensures that the systemhypothesis is always very close to the annotated ground truth, which explainsthe high score. It also explains the somewhat higher miss rate, as faces can notalways be found in the corner camera images.
This system illustrates another popular trend, the use of boosted classifiercascades using simple features (as presented in [19]), trained for specific detectiontasks, and that serve as high confidence initialization steps in combination with

other fast but less reliable tracking techniques. It may be useful to remind herethat no background images of the empty room were supplied for this task, and notraining was allowed on the test set itself, which made it hard to use foregroundsegmentation based techniques.
The evaluation also revealed a problem in the visual tracking task definitionitself, namely the loose definition of the tracking object. In some cases, it can notbe unambiguously decided which of the room occupants is the presenter withoutusing prior scene knowledge or accumulating enough tracking statistics. Whilethis is a minor problem, it will most likely lead to changes in the tracking taskdefinition or annotations in future evaluations.
Fig. 16. Results for the visual single person tracking task
Figs. 17 and 18 show the results for the multimodal tracking task, conditionsB and A. As a reminder, for this task the two multimodal conditions differ onlyin the data segments to be evaluated. In condition B, all time frames, whetherthey contain speech or not, were scored. For condition A, only the time framesin which the presenter is speaking, without loud noise or crosstalk were scored.This is to better decouple the task from the speaker segmentation problem,accounting for the fact that single modality acoustic trackers are not usable inlonger periods of silence.
Compared to the visual tracking results, the numbers for multimodal condi-tion B show no significant improvement. This should by no means imply thataudio-visual fusion bears no advantages, but rather that for this type of scenario,with the current visual sensor coverage, the addition of acoustic features could
2 Results submitted one month after the official deadline and printed here for com-pleteness

not help maintain tracks in the seldom events where visual tracking fails. In con-trast, condition A shows that, considering only cases where both modalities arepresent, the addition of visual features helps improve performance, compared toacoustic tracking alone. For comparison, the best system for this task, a realtime-capable system using a particle filter framework, reached 90 % accuracy usingboth streams, and just 55 % and 71 % respectively using only acoustic and vi-sual streams. These examples also show us that a modified task description, e.g.limiting the numbers of available cameras or making automatic speech segmen-tation a requirement, or a slightly more compex scenario might be advantageousin order to better measure the improvement audio-visual fusion can bring whensingle modalities more frequently fail.
Fig. 17. Results for the multimodal single person tracking task, condition B
Fig. 18. Results for the multimodal single person tracking task, condition A
In conclusion, the results for the single person tracking task overall werequite satisfying, although there is still room for improvement. Accounting forthe lessons learned in this evaluation run, a move towards a more complex taskdefinition and a shift away from scenarios involving the tracking of just oneperson becomes very likely in the future.
4.2 3D Multi-Person Tracking
Compared to the single person case, the multi-person tracking task offers a vari-ety of new challenges requiring different systems and strategies. As the number

of tracking objects is no longer fixed, new techniques for determining personconfigurations, for deciding when to create or destroy a track, for avoiding trackmismatches, merges, etc, have to be designed. Compared to seminar recordings,which were used for the single person case, the scenarios in the interactive sem-inar database used here are also more challenging, including e.g. coffee breakswhere all tracked persons move and interact in very close proximity. A total of5 sites participated in the various subtasks for a total of 11 acoustic and visualtracking systems.
For the acoustic tracking subtask, the objective was quite similar to the singleperson case, in the sense that only one speaking person needs to be tracked atevery point in time. As a consequence, the presented approaches did not differsignificantly from the algorithmic point of view. The results are shown in Fig.19.
Fig. 19. Results for the acoustic multi-person tracking task
On the whole, the scores were quite low, compared to the single person case.Except for the leading system, which reached 64 % accuracy and 16cm precision,all other results were well below expectations. While for the second ranking sys-tem, this again comes from a large number of missing hypotheses, for all othersystems, the error lies in large inaccuracies in localization itself. The compara-tively poor performance of systems can be attributed to several factors: In partit comes from the difficult data itself, including very small rooms with severereverberations, and in part from the interactive seminar scenario, including fre-quent speaker switches, coffee breaks, etc.
The visual subtask, requiring the simultaneous tracking of all room occu-pants, posed a problem of much higher complexity. Three sites participated inthe evaluation, which was split in two conditions: The main condition involveddata from three sites, for which no previously recorded background images ofthe empty room were available. This made it much harder for trackers based

on conventional foreground segmentation to acquire clean tracks. The secondcondition involved data from just two sites, for which such background imageswere supplied. In addition to the four room corner cameras, a ceiling-mountedpanoramic camera, delivering a wide angle view of the room was available. Theresults can be found in Figs. 20 and 21.
Fig. 20. Results for the visual multi-person tracking task (3-site dataset)
Fig. 21. Results for the visual multi-person tracking task (2-site dataset)
Despite the associated problems, all submitted systems were based on fore-ground segmentation features at the lower level, with the main differences inthe higher level data fusion and tracking schemes. The leading system was arealtime-capable foreground blob tracking algorithm using just the single inputstream from the top view camera. It reached 51 % and 63 % MOT accuraciesfor the two conditions respectively, with precisions of about 20cm. The otherapproaches were based on the fusion of multiple camera streams and the resultsrevealed the still not satisfactorily solved problem of data association for suchhighly cluttered scenes. Perhaps the extension of one of the probabilistic track-ing schemes, which proved very effective in the single person tracking task, tothe multi-person case will allow to achieve a jump in performance for the nextevaluation runs.
Another important observation is that for all systems the relative amountof track identity mismatches made over a complete recording sequence is very

low, compared to other error types. Although this is explained in part by thenature of the data itself, with only few crossing person tracks, it does consider-ably diminish the influence of the mismatch rate on the general MOTA score.This observation is likely to lead to a redefinition or modification of the metricfor future evaluations, e.g. by the addition of separate weighting factors for thedifferent error ratios.
Fig. 22 shows the results for the audio-visual condition B, which is very sim-ilar to the visual tracking subtask, with the exception that acoustic informationcould be opportunistically used whenever available to increase the confidence inthe currently active speaker’s track. All presented systems used decision levelfusion on the outputs of single modality trackers. The figures show no significantincrease compared to visual tracking alone, which can in part be explained bythe low accuracies of the acoustic systems, and by the fact that usually only oneof the multiple persons to track is speaking at any point in time, considerablydecreasing the importance of audio features for the global tracking task.
Fig. 22. Results for the multimodal multi-person tracking task, condition B (2-sitedataset)
The results for condition A, in contrast, are better suited for analyzing theeffectiveness of data fusion techniques, as the importance of the single modalitiesfor tracking is better balanced. Here, the objective is to track just the activespeakers and to keep a correct record of their identities through time. The results,on the whole, stay relatively poor, due to the low performance of the acousticcomponent in most systems, which did not allow to filter out the correct speakertrack, and of the visual component for the leading system. More work is no doubtrequired on the single modalities before a synergetic effect can be obtained forthe combined systems. It would also be interesting to see if a robust feature levelfusion scheme, such as the ones presented in the single person tracking scenario,could lead to heightened performance.
In conclusion, it may be said that the CLEAR multi-person scenario stillposes a number of unmet challenges, which will keep driving cutting edge re-search on new and versatile techniques. Although the CLEAR 3D multi-persontracking task featured a novel and unconventional problem definition, the sub-

Fig. 23. Results for the multimodal multi-person tracking task, condition A (2-sitedataset)
mitted results for this first evaluation run were in part very encouraging and theexperiences made should prove valuable for future runs.
4.3 2D Face Detection and Tracking
Three sites participated in the face detection and tracking task, where the eval-uation was performed separately for the single person seminar scenario and themulti-person interactive seminar scenario. The results can be seen in Fig. 24.For both conditions, the leading systems built on the use of boosted classifiercascades, specially trained for use on CHIL recordings, delivering initial detec-tion hints which where then used by more elaborate multiple pass tracking andfiltering techniques.
Fig. 24. Results for the 2D face detection and tracking task
For the seminar scenario, the same system as already presented in the 3D vi-sual single person tracking task achieved best scores, with a correct detection rate
of 54 %, and moderate miss and false positive ratios. For the interactive seminarscenario, a three-stage system involving high acceptance detection, motion-basedtracking, and track filtering achieved a remarkable 72 % correct detection, withrelatively low miss and false positive ratios. In both cases, the average localiza-tion error was in the sub-pixel domain at under 0.2 pixels and face extensionerrors reached from 96 pixels to 141 pixels.
When judging these numbers, one must bear in mind that these results are av-erages computed over several seminars featuring multiple faces of different sizes.Detection accuracy was in fact nearly perfect for larger faces, which were locatedclose to the recording camera, while small, far away faces were very often missed.This also explains why systems run on the seminar database, involving only thepresenter’s face, tended to produce somewhat lower scores: The presenter’s facein this database was rarely visible (meaning an eye or the nose bridge is visible)from the closer cameras and face sizes were typically very small. To better assessthe effectiveness of face detection and tracking techniques in future evaluations,perhaps a categorization of the visual data into classes of increasing difficulty,with annotated face sizes as the selection criterion, and the separate scoring ofresults for each class could be a worthwile extension to the task definition.
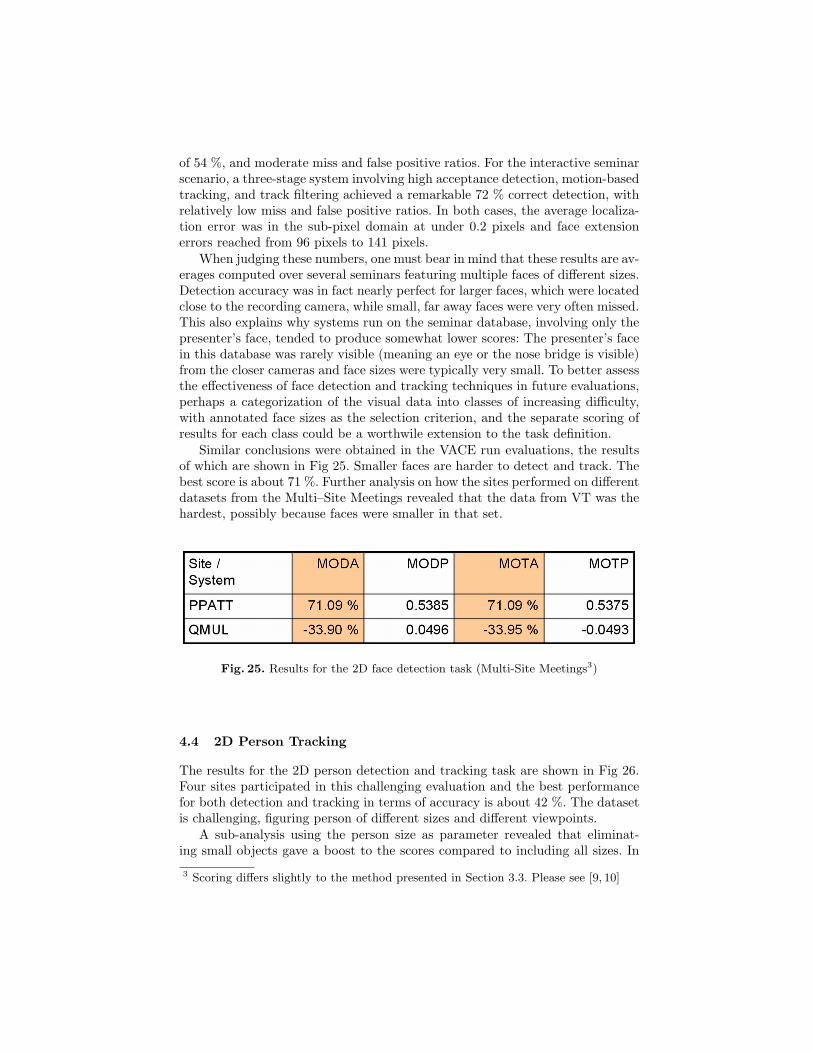
Similar conclusions were obtained in the VACE run evaluations, the resultsof which are shown in Fig 25. Smaller faces are harder to detect and track. Thebest score is about 71 %. Further analysis on how the sites performed on differentdatasets from the Multi–Site Meetings revealed that the data from VT was thehardest, possibly because faces were smaller in that set.
Fig. 25. Results for the 2D face detection task (Multi-Site Meetings3)
4.4 2D Person Tracking
The results for the 2D person detection and tracking task are shown in Fig 26.Four sites participated in this challenging evaluation and the best performancefor both detection and tracking in terms of accuracy is about 42 %. The datasetis challenging, figuring person of different sizes and different viewpoints.
A sub-analysis using the person size as parameter revealed that eliminat-ing small objects gave a boost to the scores compared to including all sizes. In
3 Scoring differs slightly to the method presented in Section 3.3. Please see [9, 10]

Fig. 26. Results for the 2D Person Detection and Tracking task (Surveillance)
conclusion, it can be said that smaller persons are harder to detect. Also, per-formance on one particular viewpoint was much better compared to the other,possibly because of lighting condition differences.
4.5 Vehicle Tracking
The evaluation results for Vehicle Tracking in the Surveillance domain are shownin Fig 27. The best performance for tracking in terms of accuracy is about 64 %.
Fig. 27. Results for the Moving Vehicle Tracking Task (Surveillance)
The dataset is challenging figuring different viewpoints and vehicle sizes. Asub-analysis using the vehicle size as parameter revealed that eliminating smallobjects gave a boost to the scores compared to including all object sizes. Inconclusion, it can be said that smaller vehicles, with respect to the frame, areharder to detect and track. Performance on both viewpoints was about equal incontrast to the 2D person detection and tracking evaluation (where performanceon one was better than on the other). This could possibly be due to the factthat vehicles are in general bigger, with respect to the frame, most of the time.
4 Problems with extracting video frames

4.6 Person Identification
Among the 2006 CLEAR tasks, the person identification task was no doubtone of the most complex to organize and carry out, from the point of view ofdatabase preparation and annotation, task definition, harmonization of acousticand visual metrics, and weighting and fusion of multiple audio-visual informationstreams. 6 different sites participated in the evaluation and a total of 12 audioand visual systems were presented.For the acoustic identification subtask, most systems built on Mel-frequencycepstral analysis of a single microphone stream, combined with filtering, warpingor reverberation cancellation, to reduce environmental effects. Fig. 28 shows theresults for the 15s and 30s training conditions.
Fig. 28. Error rates for the acoustic person identification task
In both cases, identification systems show a big drop in error rates fromthe 1s to the 5s testing conditions, followed by a steady decrease as more databecomes available. For the 30s train and 20s test condition, the best systemsalready reach 0 % error. This shows us that for a closed set identification task,with the current indoor seminar scenario and even using just one microphone,acoustic speaker identification can be a very powerful and robust tool. The nextworthwhile challenge would be an open set task involving also the automaticdetection and segmentation of speech from multiple persons, and the evaluationof identification hypotheses e.g. on a speaker turn basis.
The visual identification task proved much harder for the participating sites,in spite of manual face annotations to alleviate the alignment problem. Therewere three main difficulties:
– The dataset contained many tiny faces; the median eye distance was just 9pixels (see Fig. 29).
– There was no regularity in the number or visibility of faces in the (1, 5,10, and 20)s test sets. This is because the visual data was segmented syn-chronously to the acoustic data, in view of the multimodal task, and a higherpriority was put on producing segments containing speech. Due to this fact,

some small segments contained few or no usable frontal faces in any of thefour available camera views. This problem is especially severe for the 1s tests:more than 10 % of them contained no usable frontal faces.
– The frequency of the provided labels (every second for face bounding boxesand nose bridges, and every 200 ms for eyes) proved insufficient for problem-free face alignment.
Three systems were submitted for this subtask and the results are shown in Fig.30.
(a) Face samples (b) Eye distance histogram
Fig. 29. Examples of frontal faces at various eye distances and histogram of the eyedistances in the training and testing faces of the CLEAR database.
Fig. 30. Error rates for the visual person identification task
The best system for the 15s training case used two classifiers (PCA and LDA)fused together with temporal confidence accumulation and reached 20 % errorrate for the 20s test condition. The leading system for the 30s training case used

a local appearance technique based on DCT features. It reached a minimum 16% error rate. Both systems showed the expected steady decrease in error ratesas the test segment lengths increase, although minimum rates still stayed wellabove those reached using the acoustic modality.
Fig. 31 shows the results for the combined audio-visual identification sys-tems. 4 different approaches were presented, all using decision-level fusion ofsingle modality system outputs. As could be expected from the single modal-ity results, the weighting of the two modalities played an important role, withsystems favoring the acoustic side clearly outperforming those which assignedequal weights. The best system, which was not represented in the acoustic sub-task, used a fusion scheme incorporating streams from multiple microphones inaddition to temporal information. It reached remarkably low error rates of 0.56% for the 20s test condition, in both 15s and 30s test cases.
Fig. 31. Error rates for the multimodal person identification task
In conclusion, it may be said that although acoustic identification techniquesseem to outperform visual ones, this is largely due to the nature of the dataat hand and the definition of the task. Perhaps the only fair way of compar-ing modalities would imply completely automatic detection and segmentation ofspeech in an open set for the acoustic side, and fully automatic tracking, align-ment, and identification for the visual side. This would however also greatlyincrease the complexity of the tasks and required metrics. In a lesser case, acareful selection of the database, with equal audio and visual complexities, anda redefinition of the multimodal task to better reflect the advantage of fusionduring single modality failure, could also help reduce the apparent imbalanceand drive the development of novel fusion techniques.

4.7 Head Pose Estimation
The two subtasks of the CLEAR head pose estimation task offered two verydistinct levels of challenge to evaluation participants. While the frame basedestimation on the studio database, featuring close-up images, was the more con-ventional task which has been adressed before, the pose tracking task on theseminar database with multi-view low resolution head captures opened a newfield with new challenges for head pose estimation.
For the former condition, three systems were presented, based on a variety ofapproaches, from PCA classification to feed-forward or auto-associative neuralnets. The results can be seen in Fig. 32.
Fig. 32. Results for the head pose estimation task (Pointing’04 data)
The best systems reach an error rate of 10.1◦ and 12.8◦ for pan and tiltrespectively, which is well in range of a human’s estimation error on such images.The correct classification rate into 15◦ orientation classes is also shown in Fig. 32,with the leading system achieving 55 % pan and 84 % tilt classification accuracy.
For the more difficult subtask involving real seminar data, a series of newtechniques were explored, including 3D head texture modeling, fusion of neuralnet classifiers, and combination of boosted classifier cascades. The results areshown in Fig. 33. For the leading system, based on sequential multi-view facedetection and HMM filtering, 45 % correct classification (into 45◦ classes) wasreached. When allowing also classification into the neighboring class, the scorereaches 87 %. To better view these numbers in context, it must be said that evenhuman annotation of 45◦ head pose classes in the room corner camera imagesproved very difficult, since it was often ambiguous to the annotators, whichorientation class to choose. Here, an analysis of inter-annotator agreement isneeded in the future.
In conclusion, one can say that although the head pose estimation task onCHIL seminar data presented a novelty to the field, the results achieved in thisfirst evaluation run proved very encouraging. The availability of several cameraviews alleviates the problem of small head sizes with respect to the frame anddrives the development of more sophisticated fusion schemes. One must alsonote that a big part of the difficuly in the current recordings came from the

Fig. 33. Results for the head pose estimation task (Seminar data)
difficult lighting conditions in the seminar room, affecting the performance of allalgorithms.
4.8 Acoustic Event Detection and Classification
For the two conditions of the acoustic event detection task, the classification ofisolated events, and the detection and classification of events in seminars, a totalof 11 systems were presented by 3 sites. The systems are based on the HMM orSVM classification of spectral features gained from a single audio channel. Theresults are shown in Figs. 34 and 35.
Fig. 34. AEER error rates for the acoustic event detection task (classification only)
Fig. 35. AEER error rates for the acoustic event detection task (detection and classi-fication)

The error rates show that, while for the recognition of isolated events, currenttechniques are already appropriate, reaching about 4 % error in the best case, thedetection of low-energy events in a complex seminar scenario, on the backgroundof speech, is still an unsolved problem. The best system, using a two step SVMapproach for detection of silence/non-silence and subsequent recognition of the12 event classes, delivered 97 % error rate on unsegmented seminar data, andabout 60 % error on presegmented event databases. One of the main difficultiesno doubt came from the presence of speech in the recordings, showing that abetter coupling with SAD systems could yield some improvement. Additionally,the use of multiple microphones to better handle noise and room acoustics yethas to be explored, and may constitute one of the main research directions forthe future.
4.9 Acoustic Environment Classification
For the acoustic environment classification task, only one site participated. Theresults for the seen test condition, the unseen test condition, and the average ofthese two conditions are shown in Fig. 36. The system performed much betterin identifying environments from locales specifically seen in the training data;however, the error rate for unseen locales is still much better than chance. Theseresults indicate that while practical systems might be fielded to identify a user’sfrequently-visited locales, work still needs to be done on improving generalityand adapting to new locales.
Fig. 36. Results for the Acoustic Environment Classification Task
5 Summary
This paper summarized the CLEAR 2006 evaluation, which started early 2006and was concluded with a two day workshop in April 2006. It described theevaluation tasks performed in CLEAR’06, including descriptions of metrics andused databases, and also gave an overview of the individal results achieved bythe evaluation participants. Further details on the individual systems used canbe found in the respective system description papers in the proceedings of theevaluation workshop.
The goal of the CLEAR evaluation is to provide an international frameworkto evaluate multimodal technologies related to the perception of humans, their

activities and interactions. In CLEAR’06, sixteen international research labora-tories participated in more than 20 evaluation subtasks.
An important contribution of the CLEAR evaluation is the fact that it pro-vides an international forum for the discussion and harmonization of relatedevaluation tasks, including the definition of procedures, metrics and guidelinesfor the collection and annotation of necessary multimodal datasets.
CLEAR has been established through the collaboration and coordinationefforts of the European Union (EU) Integrated Project CHIL - Computers inthe Human Interactive Loop - and the United States (US) Video Analysis andContent Extraction (VACE) programs. From a decision made in mid November2005 by CHIL and VACE to establish CLEAR, to the actual CLEAR workshopin April 2006, over 20 evaluation subtasks were performed. In that period of fourmonths, evaluation tracking metrics between CHIL and VACE were harmonized,several hours of multimedia data were annotated for the various evaluation tasks,large amounts of data were distributed to 16 participants worldwide, and dozensof teleconferences were held to help coordinate the entire evaluation effort.
An additional important contribution of CLEAR 2006 and the supportingprograms is that significant multimedia datasets and evaluation benchmarkshave been produced and made available to the research and community. Eval-uation packages for the various tasks, including data sets, annotations, scoringtools, evaluation protocols and metrics, are available through the Evaluationsand Language Distribution Agency (ELDA)[20] and NIST.
While we consider CLEAR 2006 as a remarkable success, we think that theevaluation tasks performed in CLEAR 2006 - mainly tracking, identification,head pose estimation and acoustic scene analysis - only scratch the surface ofautomatic perception and understanding of humans and their activities. As sys-tems addressing such “lower-level” perceptual tasks are becoming more mature,we expect that more challenging tasks, addressing human activity analysis onhigher levels will become part of future CLEAR evaluations.
In order to keep CLEAR focused, the coordinators are committed to workingtogether to synergize more aspects of the CLEAR evaluations. This synergywill allow evaluation assets developed to be greater than if they were developedindependently by each participating evaluation program. For instance synergy inareas of data annotations and format will positively impact future evaluationsby providing a lasting data resource whose development is cost-shared acrossevaluation programs and projects, while useful for numerous tasks due to thecommonalities.
Acknowledgments
The authors would like to thank the following people for all their help andsupport in organizing the CLEAR evaluation and for their help in revising thispaper:
Matthew Boonstra, Susanne Burger, Josep Casas, Hazim Ekenel, DmitryGoldgof, Rangachar Kasturi, Valentina Korzhova, Oswald Lanz, Uwe Mayer,

Rob Malkin, Vasant Manohar, Ferran Marques, John McDonough, Dennis Moell-mann, Ramon Morros, Maurizio Omologo, Aristodemos Pnevmatikakis, Gerasi-mos Potamianos, Cedrick Rochet, Margit Rodder, Andrey Temko, Michael Voit,Alex Waibel.
The work presented here was partly funded by the European Union (EU)under the integrated project CHIL, Computers in the Human Interaction Loop(Grant number IST-506909) and partial funding was also provided by the USGovernment VACE program.
Disclaimer
The here presented tests are designed for local implementation by each partici-pant. The reported results are not to be construed, or represented, as endorse-ments of any participant’s system, or as official findings on the part of NIST orthe U. S. Government.
References
1. CHIL - Computers In the Human Interaction Loop, http://chil.server.de.2. AMI - Augmented Multiparty Interaction, http://www.amiproject.org.3. VACE - Video Analysis and Content Extraction, https://control.nist.gov/dto/
twiki/bin/view/Main/WebHome.4. CALO - Cognitive Agent that Learns and Organizes, http://caloproject.sri.com/.5. NIST Rich Transcription Meeting Recognition Evaluations, http://www.nist.gov/
speech/tests/rt/rt2006/spring/.6. PETS - Performance Evaluation of Tracking and Surveillance,
http://www.cbsr.ia.ac.cn/conferences/VS-PETS-2005/.7. TREC Video Retrieval Evaluation, http://www-nlpir.nist.gov/projects/trecvid/.8. ETISEO Video Understanding Evaluation, http://www.silogic.fr/etiseo/.9. Mostefa, D., Garcia, M.N., Bernardin, K., Stiefelhagen, R., McDonough, J., Voit,
M., Omologo, M., Marques, F., Ekenel, H.K., Pnevmatikakis, A.: Clear eval-uation plan. Technical report, http://www.clear-evaluation.org/downloads/chil-clear-v1.1-2006-02-21.pdf (2006)
10. The VACE evaluation plan, http://www.clear-evaluation.org/downloads/ClearEval-Protocol-v5.pdf.
11. CLEAR evaluation webpage, http://www.clear-evaluation.org.12. Transcriber Labeling Tool, http://trans.sourceforge.net/.13. AGTK: Annotation Graph Toolkit, http://agtk.sourceforge.net/.14. Fiscus, J.G., Ajot, J., Michel, M., Garofolo, J.S.: The rich transcription 2006 spring
meeting recognition evaluation. In: 3rd Joint Workshop on Multimodal Interactionand Related Machine Learning Algorithms (MLMI-06), (Springer)
15. The i-LIDS dataset, http://scienceandresearch.homeoffice.gov.uk/hosdb/physical-security/detection-systems/i-lids/ilids-scenario-pricing/?view=Standard.
16. Bernardin, K., Elbs, A., Stiefelhagen, R.: Multiple object tracking performancemetrics and evaluation in a smart room environment. In: Sixth IEEE InternationalWorkshop on Visual Surveillance, in conjunction with ECCV2006, Graz, Austria(2006)

17. ViPER: The Video Performance Evaluation Resource, http://viper-toolkit.sourceforge.net/.
18. Danninger, M., Flaherty, G., Bernadin, K., Ekenel, H., Kohler, T., Malkin, R.,Stiefelhagen, R., Waibel, A.: The Connector — facilitating context-aware commu-nication. In: Proceedings of the International Conference on Multimodal Interfaces.(2005)
19. Viola, P., Jones, M.: Rapid object detection using a boosted cascade of simplefeatures. In: Proceedings of the 2001 IEEE Computer Society Conference on Com-puter Vision and Pattern Recognition - CVPR 2001. Volume 1. (2001) 511–518
20. ELRA/ELDA’s Catalogue of Language Resources: http://catalog.elda.org/.