Embed Size (px)
DESCRIPTION
The City of Vancouver has a vision to be the Greenest City in the world by 2020. To get there, we have defined ten long term goals each with an associated 2020 target. The Greenest City 2020 Action Plan (GCAP) highlights the strategies required to meet each of the targets with an emphasis on highest priority actions. For each goal, this plan outlines the baseline, actions that the City is already undertaking, and results of the public engagement process used to create this plan.
Citation preview

ADMINISTRATIVE REPORT
Report Date: July 5, 2011 Contact: Amanda Pitre-Hayes
Contact No.: 604.871.6619 RTS No.: 09212 VanRIMS No.: 08-2000-20 Meeting Date: July 12, 2011 TO: Vancouver City Council
FROM: Deputy City Manager
SUBJECT: Greenest City 2020 Action Plan (GCAP)
RECOMMENDATION
A. THAT Council adopt in principle the Greenest City 2020 Action Plan (GCAP), included
as Appendix 1, direct staff to begin implementation of the highest priority short term actions, and to report out on progress made against the targets every two years beginning in 2013. Staff will seek Council approval of programs and projects that require policy change or significant financial investments, and cannot be accommodated in current operating and capital budgets.
B. THAT Council adopt one additional Greenest City 2020 target: “Double the number of
companies that are actively engaged in greening their operations over 2011 levels by 2020.” This is in addition to the targets adopted by Council in January 2011.
DEPUTY CITY MANAGER'S COMMENTS
The Greenest City 2020 Action Plan builds on work accomplished over a number of years in the City. The goals laid out in this action plan will enable us to save money in our operations, create economic opportunities for our city and our businesses, and further establish our international reputation as a vibrant and innovative city. Nonetheless, becoming the Greenest City also represents changes in how we do our business and can add costs. Given our current financial constraints it’s imperative that we strategically use our financial and staff resources to achieve economic and social objectives while achieving our Greenest City goals. The GCAP represents thousands of hours of volunteer time by our partners across the city and input from over 35,000 people. Staff have worked to integrate this input into our final recommendations. Staff sees the GCAP as a map describing potential paths for becoming the Greenest City in the world. We recognize some of these strategies will require significant policy shifts, and others will require the allocation of financial resources outside of the City’s budgets; in these situations we will present the opportunity to Council for consideration.
RR-1
Greenest City 2020 Action Plan - 09212 2
Strategies and technologies will continue to evolve, and new possibilities and partnerships will emerge, so the GCAP must be seen as a map rather than a to-do list. We will not be able to do everything included in this plan, but we have prioritized the short term actions and will continue to evolve the longer term strategies and actions in working to become the Greenest City. COUNCIL POLICY
In January 2011, Council adopted 14 Greenest City targets as Council policy. Staff were directed to develop a 15th target on greening existing workplaces, as well as to continue the public engagement process with the purpose of finalizing the Greenest City 2020 Action Plan in consultation with stakeholders and the community. In February 2010, Council adopted the long term goals recommended by the Greenest City Action Team (GCAT) and directed staff to proceed with the development of a Greenest City 2020 Action Plan. Council approved a motion directing staff to report back on any recommended revisions to the targets laid out in the GCAT report, as well as with a report outlining how the action plans can optimize these targets. Staff also provided Council with an update as to the status of the original Quick Start actions outlined by GCAT. In October 2009, Council received the Greenest City Action Team’s report entitled Vancouver 2020: A Bright Green Future, which recommended ten long-term goals and thirteen 2020 targets that would chart Vancouver’s course in becoming the greenest city in the world by 2020. Council approved a motion directing staff to report back with an implementation plan for the recommended actions. In May 2009, Council received the GCAT Quick Starts report, which recommended early actions the City could take to help Vancouver become the greenest city by 2020. Council approved a motion directing staff to report back with an implementation plan for the recommended actions. For many years preceding this, Council has directed staff to develop policy and plans that have been built upon in the current Greenest City work including Clouds of Change, the Community Climate Change Action Plan, EcoDensity, the Vancouver Food Charter, and others. For many years to come, new plans, policy and programs supporting the implementation of the Greenest City 2020 Action Plan should be expected. SUMMARY
The Greenest City staff planning team, Steering Committee, staff Working Groups, and External Advisory Committees have been working on the development of the Greenest City 2020 Action Plan with advice and ideas from the public through the Talk Green to Us and Talk Green Vancouver engagement programs since June 2010. The Greenest City 2020 Action Plan is the culmination of this work, laying the foundation on which the next nine years of implementation will be built. In May 2010, staff Working Groups were tasked with:
Undertaking background research; Identifying key stakeholder organisations that should participate in the process as External
Advisory Committee (EAC) members; Evaluating each 2020 target and developing recommended changes in consultation with
EACs; Beginning to implement quick start actions supporting the implementation of the Greenest
City vision and targets;

Greenest City 2020 Action Plan - 09212 3
Developing and prioritizing potential strategies and actions; Integrating feedback from the broader public engagement process; Preparing a draft Greenest City 2020 Action Plan, to be used for public consultation; and Preparing a final Greenest City 2020 Action Plan, responding to feedback heard from the
public. In addition to this, the Greenest City staff planning team, with support from Corporate Communications, implemented Phase 1 (June-Oct. 2010) and Phase 2 (Dec.2010 – March 2011) of the Greenest City public engagement program. This report includes the final Greenest City 2020 Action Plan. It describes the addition of one more target, highlights the highest priority actions from the strategies to achieve each target, describes the results of the public engagement process (with a focus on Phase 2), and includes an update of actions that are underway. The successful implementation of this plan will rely on being incorporated into City financial and business planning processes in order to be resourced. PURPOSE
The purpose of this report is to recommend adoption in principle of the Greenest City 2020 Action Plan, and to outline what will be required to achieve the Greenest City targets. The purpose is also to recommend approval of a 15th Greenest City target focused on greening existing workplaces. BACKGROUND
The Greenest City Action Team (GCAT) was launched as an advisory committee to the Mayor in February 2009 and was given a mandate to make recommendations to help Vancouver become the Greenest City in the world by 2020. The team, co-chaired by Mayor Gregor Robertson and Dr. David Boyd, consists of two Council liaisons, Councillor Reimer and Councillor Cadman as well as individuals with broad experience, expertise and interest in climate protection, transportation, land use, green energy, food security, environmental health, biodiversity, economic development and finance. The team was asked to issue two reports to Council, a ‘Quick Starts’ report on actions that could be implemented immediately, and a comprehensive final report outlining goals and actions to be implemented over a ten year period to 2020. The Quick Starts report was received by Council on April 29, 2009 and the GCAT ten year plan report, titled “Vancouver 2020: A Bright Green Future” was received by Council on October 20, 2009. In February 2010, Council received a staff report recommending adoption of the long term Greenest City goals. Council approved the staffing and resources required to develop a Greenest City 2020 Implementation Plan - an actionable plan for City staff and residents to use in achieving the long-term goals. Staff were tasked with reviewing and revising the Greenest City 2020 targets, based on an analysis of how the implementation plans could optimize the targets. In January 2011, Council received a staff report recommending adoption of 14 Greenest City targets, as well as receiving an update on the planning and public engagement process. Staff were tasked with continuing the public engagement efforts and developing the final Greenest City 2020 Action Plan.

Greenest City 2020 Action Plan - 09212 4
DISCUSSION
The Greenest City planning process is catalyzing some important work within our city. Through this integrated planning process, staff from numerous departments in the City are working together to understand the ecological, social, and economic benefits and challenges of achieving the Greenest City vision, goals, and targets. Though the plan is primarily focused on environmental issues and opportunities, strong economic development, social sustainability and equity lenses have been put on all of our work to ensure that we are considering critical sustainability issues as we move ahead with this work, and envision the future of our city. The public engagement process is enabling new conversations with a wide variety of stakeholders and community members, and is encouraging the creation of innovative new partnerships as we work toward implementation of the Greenest City 2020 Action Plan. The following five sections describe: considerations as the GCAP is implemented; how Greenest City relates to land use planning; an update on the public engagement process; the rationale for adding a 15th target; and a brief description of each section of the Greenest City 2020 Action Plan. 1. Implementation The GCAP has been written to describe the path the City will need to take in order to achieve the targets, however many of the actions do not fall fully within the jurisdictional authority of the City of Vancouver. The figure below demonstrates that most of the strategies and actions described under each of the Greenest City targets can only be delivered through City led policy, programs and regulations in relationship with other levels of government, non-profit and private sector partners, as well as the community at large. This helps us to understand the extent to which the City will need to work with our partners, and how essential these partnerships will be, in order for us to achieve the Greenest City targets.
Greenest City 2020 Action Plan - 09212 5
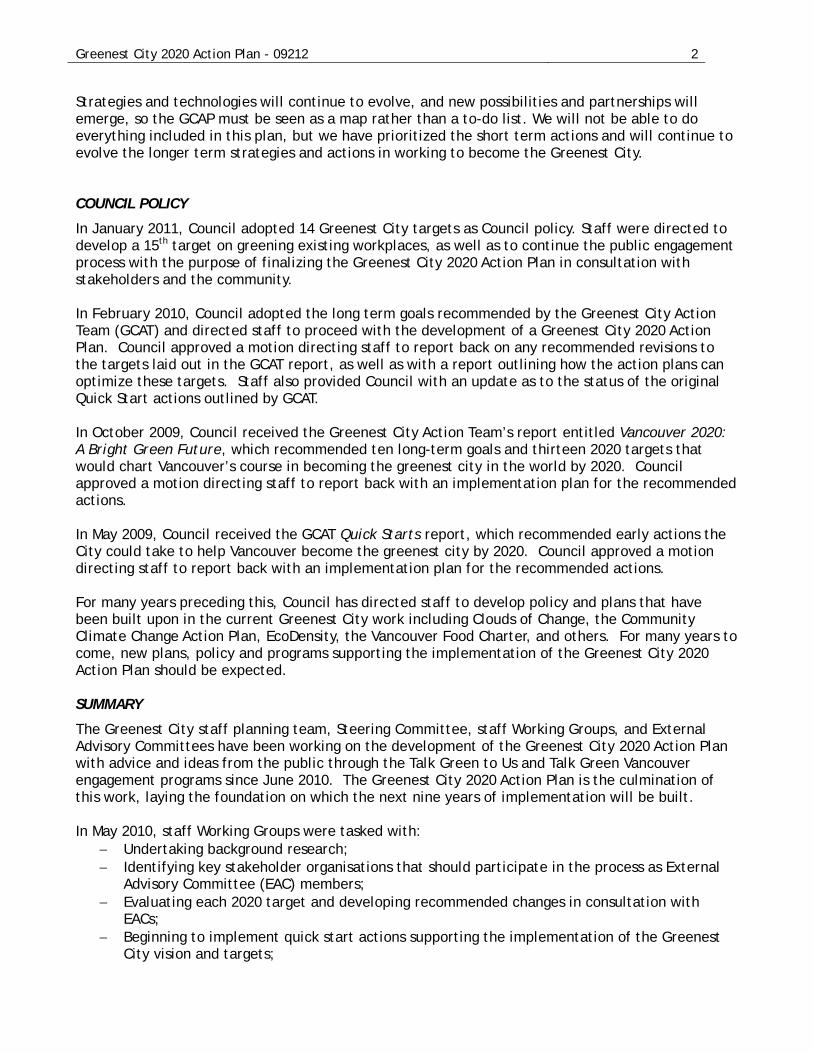
The GCAP is a significant policy initiative for the City of Vancouver. At the same time, the City has limits to our financial capacity we need to be increasingly strategic in how these resources are allocated. For this reason the City will be focusing our implementation efforts on three themes – carbon, waste and ecosystems. The graphic below demonstrates this focus, and shows how each Greenest City goal nests into these focus areas.
2. Land Use Although this is not explicitly a land use plan, smart land use planning has long been recognized as critical in the achievement of a sustainable city. In Vancouver, policies and practices over generations have progressively emphasized this relationship. Indeed, the initial Greenest City Action Team report, A Bright Green Future, spoke strongly on the role of density, land use and design in achieving Greenest City aspirations, noting that more needed to be done in this area. Smarter land use, density and design will be essential to achieving many of the targets in this GCAP. In particular, achievement of the climate leadership, green buildings, and green transportation targets are highly dependent on land use decisions that:
put more people and jobs closer to public transit; make active transportation modes more possible and desirable through
proximity/concentration and urban design; provide a critical mass for local shopping/jobs/schools; enable home offices and other work from home and telecommuting solutions; enable more use of the City’s job lands; and make technologies such as local- and district-scale renewable energy systems feasible.
Further, the achievement of the access to nature and local food targets will be supported by land use decisions that integrate existing or new green and open spaces and places for food production and distribution. These kinds of goals are frequently facilitated through the financial arrangements agreed to as land use decisions are made. It is highly improbable, if not impossible, to achieve the targets in these categories without supportive land use decisions. Throughout the implementation of the Greenest City Action Plan, connections to land use decisions will continue to remain a key requirement for success.

Greenest City 2020 Action Plan - 09212 6
3. Public Engagement More than 35,000 people participated in the public engagement process called “Talk Green to Us” in phase 1 and “Talk Green Vancouver” in phase 2, with more than 9,500 being very active contributors and participants. There was a high degree of support for the goals and targets expressed in the GCAP, and for the overall goal of Vancouver becoming the greenest city in the world by 2020. There was also a high degree of commitment from stakeholders and citizens to play key roles in working with the City to implement the plan. There were two main elements to the public engagement process: the External Advisory Committees (EAC) and the broad based public process, each of which is described here. Over 130 organisations participated as EAC members, directly advising the staff working groups on finalizing the targets, and on preparing the GCAP. An EAC was created for each of the 10 Greenest City goals, and ranged from 10-35 members representing key stakeholders from the academic, business and industry, non-profit, and government sectors. The City is grateful for, and appreciative of, the significant contributions made by these people. The list of members for the EACs can be found in each of the Greenest City 2020 Action Plans. The broad based public engagement process consisted of two phases. Phase 1 ran from June-October 2010 and was focused on collecting ideas from the community about how the Greenest City goals and targets might be achieved. Phase 2 ran from December 2010 – March 2011 and was focused on collecting feedback on the draft GCAPs in order to finalize the plans. The objectives for the public engagement process were:
To hear what different communities had to say about the GCAP and to respond to their feedback;
To build constituency and garner support for the City to take bold and innovative measures to achieve the Greenest City goals;
To build a sense of ownership from community members and stakeholders for taking action to achieve goals;
To build partnerships with organizations for implementation; To test new and innovative engagement methods and tools.
The following tactics were used to broadly reach out to the different communities that live and work in Vancouver in ways that were accessible and meaningful for them:
On-line discussion fora Major events, including Pecha Kucha, Ideas Slam, Open House, Greenest City Camp Receptions with key stakeholder groups Social media Workshops, dialogues and events co-hosted with over 60 organisations in the community Policy visualization tools Presentations Webinars Do it yourself consultation tool kit Advertising Multicultural roundtables City staff engagement

Greenest City 2020 Action Plan - 09212 7
Below is a table that summarizes the engagement activities, including the number of people who participated. The quality of discussion on both the on-line forum and at the in-person events was very high.
Phase 1+2 Public Engagement Activities Metric
Number of unique ideas from P1 online forum 726
Number of registered users from P1 and P2 online forums 3,414
Number of votes from P1 online forum 28,026
Number of comments from P1 & P2 online forums 2,262
Number of visitors to websites 35,979
Number of cities visiting website 1,600+
Number of people on our mailing list (as of June 1, 2011) 2,358
Total video views (as of June 1, 2011) 25,940
Twitter followers (as of June 1, 2011) 4,514
Facebook fans (as of June 1, 2011) 2,298
In person outreach at events (P1 & P2) 6,045
Direct mail (letters to community organisations) ~1,200 The overall themes from the public consultation were as follows. The City should:
1. Walk the talk and lead by example; 2. Focus on education, information sharing, and raising awareness of issues and solutions; 3. Ensure that “green” solutions should also be accessible and affordable; 4. Collaborate and build relationships with other governments, organizations, businesses,
community members, etc. for implementation; 5. Encourage leadership and self-organising among individuals and neighbourhoods; 6. Use both carrots and sticks – create incentives as well as encourage innovation through
policies, regulations, and zoning; 7. Reward, recognize and celebrate; 8. Broaden outreach, inclusion and engagement to communities across incomes and cultures; 9. Work on changing culture, shifting paradigms and mindset; 10. Ensure integration across the 10 Greenest City goals in order to find synergies and
efficiencies; and 11. Be accountable to progress made through the use of clear metrics and by communicating
results. For more information on the public engagement process please see the “Public Engagement Summary” section in each of the Greenest City 2020 Action Plans as well as Appendix 2. 4. Recommended New Target: Green Economy Target #2 - Greening Existing Workplaces Staff at the Vancouver Economic Development Commission and the City, along with their External Advisory Committee, have worked to establish a second green economy target: “Double the number of companies that are actively engaged in greening their operations over 2011 levels, by 2020.” This supplements the first target that focuses on increasing green jobs in the city, and works on greening the entire economy. The intent is to help these companies be more competitive and gain market share by becoming green. It is also to motivate as many businesses as possible to actively contribute to creating the Greenest City, not just those businesses that are providing green jobs.

Greenest City 2020 Action Plan - 09212 8
The VEDC has been working with Vancouver-based businesses, as well as service providers that offer green workplace advice, resources and incentives, in order to understand the current state of workplace greening in the city. The proposed target is based on research into different sizes of businesses and different sectors, and on barriers they face, as well as the benefits that are incurred by greening their operations. Work to develop a more robust methodology, and to establish a 2011 baseline, is ongoing. The target has been carefully crafted to provide an opportunity for as many businesses as possible in Vancouver to get involved in the Greenest City vision and Action Plan, while remaining responsive to the unique challenges that different businesses face. 5. Greenest City Goals, Targets, Highest Priority Actions, Strategies, and Actions Underway The GCAP is focused on city-wide efforts to achieve the goals and targets. However, through the public consultation process many people commented that the City should be leading the way. Staff have included three highest priority actions that relate to the City’s own corporate activities to demonstrate a commitment to lead on green. More comprehensive work related to greening municipal operations is being done through Short-term priority 3A of the City’s Corporate Business Plan -- to develop and implement a corporate environmental sustainability framework. This framework will guide the work of departments across the City and move us toward the goals of zero carbon, zero waste and healthy ecosystems. Highest Priority Corporate Actions (3 year):
1. Plan and implement a comprehensive corporate waste reduction and diversion program for all City facilities;
2. Develop a procurement policy and practice that supports the purchase and use of local food in City-run facilities including community centres and Parks Board restaurants and concessions;
3. Look for opportunities to green community events that the City runs, sponsors and permits. 4. Plan and implement a program to significantly reduce greenhouse gas emissions and fossil
fuel use in City of Vancouver buildings and fleet, and achieve carbon neutral City government operations.
What follows is a summary of each of the 10 Greenest City goals. It includes the goal, the 2020 target(s), accountability for implementation, the highest priority actions for the next three years, the 2020 strategies, and finally actions that are currently underway. The full Greenest City 2020 Action Plan, outlining the trail map for how the targets will be achieved, is provided in Appendix 1.
Green Economy Working Group Chair: John Tylee, Vancouver Economic Development Commission Goal 1: To secure Vancouver’s international reputation as a mecca of green enterprise.
2020 Targets: Target #1: Double the number of green jobs in the City by 2020, over 2010 levels. Target #2 (proposed addition): Double the number of companies that are actively engaged in greening their operations over 2011 levels, by 2020. Accountability: Chief Executive Officer - Vancouver Economic Development Commission in collaboration with other City managers.

Greenest City 2020 Action Plan - 09212 9
Highest Priority Actions (3 year): 1. Develop a hub (such as an incubator, accelerator or research facility), along with
demonstration platforms to showcase local companies and relevant incoming and outgoing trade missions to create international linkages;
2. Develop a formal green pre-procurement program to create ongoing dialogue between the City’s purchasing category managers and technology companies;
3. Establish a Green Enterprise Zone (recommended locations include the Port Lands, the Downtown Eastside, and the False Creek Flats)1; and
4. Deliver a business program that aligns Greenest City and economic development tools to achieve measurable improvements in the environmental performance of Vancouver businesses.
Strategies to 2020:
1. Continue to increase uptake and use of “Vancouver Green Capital” brand 2. Emphasize local employment, investment and capacity building 3. Develop green incentives and financing mechanisms 4. Expand eco-industrial networking opportunities 5. Support local and green supply chain development 6. Create measurement standards, common metrics, benchmarks and reduction strategies for
greening businesses 7. Support flexible work arrangements to reduce environmental impacts of employee travel.
Actions Underway:
The Metro Vancouver Commerce Olympic Business Program resulted in over $60m in total green investments in the region (complete)
Clean tech trade mission to China, the resulting MoU for green building showcase in Tianjin and creation of other significant opportunities for local businesses (complete)
Home weatherization and green jobs pilot project with EMBERS (underway) Building and promoting Green Capital brand and Vancouver as a global leader for green
business (underway) Deconstruction and green jobs pilot projects (underway) Green economic development strategy (summer 2011) Deliver robust green business retention, expansion and attraction (BREA) program, including
tracking of business activities (ongoing) MoUs and collaborative efforts with global technology companies and local green enterprises
to demonstrate and test technology and grow international market potential (ongoing) Developing business plan for green technology centre and network (fall 2011) Development of Campus-City Collaborative to connect post-secondary institutions with each
other and the City to work on Greenest City challenges (early 2011) Ongoing support for community-based sustainability initiatives in the Downtown Eastside
through capital allocations, project facilitation, business development support, etc. (e.g. RTS 9206)
The full action plan for Green Economy, including the public engagement results, can be found beginning in Appendix 1.
Climate Leadership Working Group Chair: Sean Pander, Sustainability Group
1 Further details on this proposed action will come to Council as a separate report.

Greenest City 2020 Action Plan - 09212 10
Goal 2: Eliminate dependence on fossil fuels. 2020 Target: Reduce community-based greenhouse gas emissions by 33% from 2007 levels. Accountability: Climate Protection Program Manager, Sustainability Group Highest Priority Actions (3 year):
1. Work with developers and energy utilities to establish four new renewable energy systems for new, large site, high density developments;
2. Work with existing energy system operators to facilitate at least one major industrial or institutional energy system conversion to a local renewable energy source; and
3. Work with key stakeholders to research the opportunities and considerations associated with district-scale renewable energy sources with the aim of developing a policy framework to establish clear expectations as to the conditions under which the City will (or will not) consider each of these energy sources.
Strategies to 2020:
1. Renewable energy: work with partners to develop economically viable opportunities for the large scale deployment of sustainable energy systems, particularly in high density, mixed use urban neighbourhoods.
2. Green buildings: create programs, tools, and regulations to decrease climate impacts of new construction and existing buildings (see Green Building Action Plan).
3. Green transportation: build infrastructure, programs and plans that combine land use planning and green transportation goals in order to decrease reliance on automobiles and increase use of active transportation modes and public transportation (see Green Mobility Action Plan).
4. Zero Waste: work to reduce compostable materials in the garbage, capture and beneficially utilize methane arising from the landfill, and reduce indirect emissions from production and manufacture of goods (see Zero Waste Action Plan).
5. Climate Change Adaptation: participate in climate change adaptation planning in partnership with other local governments and the scientific community in order to understand, plan for, and mitigate risks.
6. Support Provincial climate and energy plans: remain engaged with the Province, other local governments, and provincial energy utilities to help ensure that the 2007 Provincial Climate Action Plan and 2010 Provincial Energy Plan are implemented.
Actions Underway:
Work to expand the Neighbourhood Energy Utility in South East False Creek to serve new developments and connect Science World (underway).
Corporate climate leaders program, currently working with three large emitters as well as small- and medium enterprises to measure and develop action plan for energy and GHG reduction (underway)
Offer incentives for solar thermal installations (complete) Work with private sector partners and utilities to develop additional district energy systems
across the City, including ones to serve East Fraserlands and North East False Creek (underway)
Cisco and Pulse Energy MoU partnership for improved energy management and reduction (underway)
Develop a Carbon Neutral City Operations plan (underway) Enhance landfill gas capture so that by the end of 2012 the City will achieve the 2016
regulatory target of 75% capture efficiency (underway)

Greenest City 2020 Action Plan - 09212 11
The full action plan for Climate Leadership, including the public engagement results, can be found beginning in Appendix 1.
Green Buildings Working Group Co-Chairs: Will Johnston, Chief Building Official and Dave Ramslie, Sustainability Group
Goal 3: Lead the world in green building design and construction. Accountability: Chief Building Official and Green Building Program Manager, Sustainability Group. 2020 Targets: Target #1: Require all buildings constructed from 2020 onward to be carbon neutral in operations. Target #2: Reduce energy use and GHG emissions in existing buildings by 20% over 2007 levels. Highest Priority Actions (3 year):
1. Update Vancouver Building Bylaw with aim to increase energy efficiency and reduce greenhouse gas emissions;
2. Develop and promote financing tools for building retrofits; 3. Use price signals in permit fees to reward energy efficiency and greenhouse gas reductions in
new and existing buildings. Strategies to 2020:
1. Regulation: introduce regulations that improve energy performance, reduce greenhouse gases, and mitigate financial implications for building owners and developers
2. Financing tools: work with stakeholders to ensure that opportunities for financing energy efficiency upgrades are available in multiple market segments
3. Development of price signals in permit fees: a revenue neutral system where projects approaching net zero energy receive lower permit fees financed by the higher permit fees charged to less energy efficient projects
4. Incentives: work with partners like utilities and other levels of government to offer energy efficiency incentives
5. Capacity building: work with partners to build capacity required for re-imagining Vancouver’s building stock
6. User engagement, education and outreach programs: co-develop new tools such as social marketing, education, building labelling and benchmarking to enable occupants to make informed decisions about buildings.
Actions Underway:
Green Rezoning Strategy requires that buildings are designed to LEED Gold standard for all new rezonings (bylaw in place)
Published passive design toolkit and green home renovation how-to guides (2008-2009) Require solar-ready homes and offer incentives for solar hot water in homes (launched Jan.
2010) LEED-ND Platinum for Olympic Village (2010) First LEED Platinum certification for a community centre in Canada (Creekside, completed) United Nations Environment Program LivCom Award for South East False Creek (2010) Laneway housing policy (bylaw in place)

Greenest City 2020 Action Plan - 09212 12
Real time energy metering of venues during the Olympics and at nine City facilities (complete)
West House sustainable laneway home display during Olympics (complete) Update the building code to increase energy efficiency of new buildings (underway) West House ongoing monitoring project (underway) Green building audio tours (underway) Van Dusen Garden building targeting Living Building Challenge and net zero energy (to be
completed 2011) The full action plan for Green Buildings, including the public engagement results, can be found beginning in Appendix 1.
Green Transportation Working Group Co-Chairs: Jerry Dobrovolny, Director of Transportation and Brent Toderian, Director of Planning.
Goal 4: Make walking, cycling, and public transit preferred transportation options. 2020 Targets: Target #1: Make the majority of trips (over 50%) on foot, bicycle, and public transit. Target #2: Reduce distance driven per resident 20% from 2007 levels. Accountability: Director of Transportation and Director of Planning Highest Priority Actions:
1. Update the City’s transportation plan and develop a more detailed active transportation master plan, supporting and building upon the Greenest City transportation goals, targets, and strategies noted here, and taking forward for consideration more detailed ideas gathered through the Greenest City consultation process.
2. Develop a pedestrian safety study and action plan to identify opportunities to improve safety through engineering, education, and enforcement measures.
3. Support transportation and active transportation planning with land use policies that enable the City to meet mobility targets.
4. Continue to work with partners to deliver high capacity, fast, frequent, and reliable rapid transit for the Broadway Corridor from Commercial Drive to UBC.
5. Launch a public bicycle sharing program. Strategies to 2020:
1. Land Use: support shorter trips and sustainable transportation choices through mixed land use, pedestrian oriented design, transit supportive densities, and new housing choices that put the majority of residents close to jobs, schools, recreation and transit.
2. Walking and Cycling: make active transportation choices such as walking and cycling feel safe, convenient, comfortable and fun for people of all ages and abilities.
3. Transit: support transit improvements to increase capacity and ensure service that is fast, frequent, reliable, fully accessible, and comfortable.
4. Demand Management: advance policies that help reduce automobile usage and ownership. 5. Low Carbon Vehicles: accelerate the shift to low- and zero emissions vehicles. 6. Goods Movement: work with partners to develop a sustainable urban goods movement
strategy that supports a growing economy while reducing GHG emissions related to goods movement through and within Vancouver.

Greenest City 2020 Action Plan - 09212 13
Actions Underway:
Downtown separated bike lane trials (underway) Electric vehicle charging infrastructure including: Project Get Ready Vancouver; first to
require electrical charging stations in new multi-unit residential buildings; installed first fast charging station in Canada; stations installed at City Hall and other parking lots in the City (underway)
Land use initiatives promoting public and active modes (i.e. Cambie Corridor Plan recently completed; Broadway Corridor Plan underway, Neighbourhood Centres, and Community Plans)
Update to City transportation plan (initiated Jan 2011); Cycling and pedestrian master plans (2011).
iMIEV and LEAF electric cars launched to demonstrate and test these new technologies (complete)
Streetcar demonstration project during the Olympics (complete) Working with car-share providers, including Modo and Car2Go, to encourage uptake of their
services (ongoing) The full action plan for Green Mobility, including the public engagement results, can be found beginning in Appendix 1.
Zero Waste Working Group Chair: Rowan Birch (retired), Assistant City Engineer – Solid Waste
Goal 5: Create zero waste. 2020 Target: Reduce total solid waste going to landfill or incinerator by 50% from 2008 levels. Accountability: Director – Waste Reduction and Recovery Management Highest Priority Actions (3 years):
1. Collect all compostables from single family residential properties on a weekly basis and introduce every-other-week garbage collection and pilot collection of compostables from multi-family and commercial properties;
2. Develop zero waste education and enforcement strategies for all sectors (single family households, apartments/condominiums, commercial businesses and institutions) to encourage behaviours that reduce waste, maximize reuse and recycling and recover resources from the waste stream;
3. Work with the Province to expand Extended Producer Responsibility (EPR) programs, especially for packaging, printed paper, plastic bags, and newsprint;
4. Develop policy and incentives to encourage deconstruction for renovation and demolition projects.
Strategies to 2020:
1. Nurture a zero waste culture 2. Make reducing and reusing a priority 3. Capture the compostables 4. Be a catalyst for extended producer responsibility (EPR) 5. Keep recyclables out of landfills and incinerators

Greenest City 2020 Action Plan - 09212 14
6. Reduce, reuse and recycle more construction, renovation and demolition waste 7. Foster a local closed-loop economy
Actions Underway:
Composting of raw fruits and vegetables in single family and duplex residences (underway); extension to additional compostable materials subject to council approval (2012)
Collecting mattresses for recycling at the Vancouver transfer station and landfill (underway) Neighborhood composting pilot programs (underway) Community based social marketing program to promote backyard composting (underway) Enhanced waste diversion for City facilities (underway) Pilot program for newspaper recycling on City streets (underway) Building deconstruction pilot program (initiated December 2010) Clean wood waste diversion program at Vancouver Landfill and Transfer Station (January
2011) Diverting reusable items at the at Vancouver transfer station and landfill (underway)
The full action plan for Zero Waste, including the public engagement results, can be found beginning in Appendix 1.
Access to Nature Working Group Co-Chairs: Tilo Driessen, Parks Board - Manager of Planning and Research and Neal Carley, Director of Streets.
Goal 6: Vancouver residents enjoy incomparable access to green spaces, including the world’s most spectacular urban forest. 2020 Targets: Target #1: Ensure that every person lives within a five minute walk of a park, beach, greenway, or other natural space by 2020. Target #2: Plant 150,000 additional trees in the city between 2010 and 2020. Accountability: Deputy General Manager – Parks and Recreation and Director of Streets – Engineering Services. Highest Priority Actions (3 years):
1. Convert street rights-of-way into 4-6 mini-parks; 2. Identify land and build 2-3 new parks in priority neighbourhoods; 3. Plant 15,000 new trees on City and other public property. 4. Green Hastings Park.
Strategies to 2020:
1. Convert street rights-of-way into mini-parks that serve as multifunctional spaces for neighbourhoods
2. Build new parks in neighbourhoods defined as park deficient 3. Grow the urban forest through the development of an Urban Forest Management Plan.
Actions Underway:
Urban Forest Management Plan (underway) Street to mini-park conversion at Main and 18th Avenue (underway)

Greenest City 2020 Action Plan - 09212 15
Increased number of community garden plots and other forms of urban agriculture – 450 community garden plots added in 2010, including a community garden at City Hall
Increased street tree planting – over 3,200 in 2010 Encourage planting with native and edible plants (ongoing) Green streets program encouraging neighbourhood stewardship (ongoing)
The full action plan for Access to Nature, including the public engagement results, can be found beginning in Appendix 1.
Lighter Footprint Working Group Chairs: Mairi Welman, Director of Corporate Communications Goal 7: Achieve a one planet ecological footprint.
2020 Target: Reduce Vancouver’s per capita ecological footprint by 33% by 2020 over 2006 levels. Accountability: City of Vancouver leads for other Greenest City targets (~12% of target) and community partners (~21% of target). Highest Priority Actions (3 year):
1. Pilot a green neighbourhood outreach and infrastructure program in one Vancouver neighbourhood
2. Actively support non-profits and social enterprises working to reduce ecological footprint; and
3. Work with the Open Data Initiative to open Greenest City data. Strategies to 2020:
1. Enhance other GCAP goals using the ecological footprint lens 2. Evaluate and report out on progress toward all Greenest City targets 3. Engage in partnerships, dialogue and idea generation to promote the accelerated
implementation of GCAP priorities in one Vancouver neighbourhood 4. Encourage and enable lighter footprint lifestyles through delivery of tools, programs and
incentives by an established environmental non-profit organisation 5. Exemplify lighter footprint in City operations.
Actions Underway:
Greenest City Scholars program in partnership with UBC (launched summer 2010) Partner with UBC to develop innovative ways to engage the public on sustainability issues
(underway) Pilot an eco-concierge program (fall 2011) Launch the Greenest City Mayor’s Award (summer 2011) Launch Greenest Neighbourhood engagement program (fall 2011) Partner with, and support local community organizations in their implementation efforts
(ongoing) Allocate $100,000 per year as Greenest City grants (ongoing)
Greenest City 2020 Action Plan - 09212 16
The full action plan for Lighter Footprint, including the public engagement results, can be found beginning in Appendix 1.
Clean Water Working Group Chair: Brian Crowe, Assistant City Engineer – Water and Sewers Goal 8: Vancouver will have the best drinking water of any city in the world.
2020 Targets: Target #1: Meet or beat the most stringent of British Columbian, Canadian and international drinking water standards and guidelines. Target #2: Reduce per capita water consumption by 33% over 2006 levels. Accountability: Director - Water and Sewers, Engineering. Highest Priority Actions (3 year):
1. Require water metering on all new single and dual family home services (new construction and major renovations) effective 2012;
2. Develop and commence enhanced water education, incentive and conservation programs; 3. Continue to expand public access to drinking water; 4. Eliminate combined sewer overflows from sewage outfalls at Crowe and Burrard Streets and
develop Integrated Stormwater Management Plan.
Strategies to 2020: 1. Water quality monitoring and protection 2. Leadership and advocacy with Metro Vancouver, the academic community and the citizenry 3. Improved public access to water 4. Policy development relating to building code revisions and water conservation regulations 5. Community engagement to encourage behavioural changes and redefine the value of water 6. Support and provide incentives for water conservation enabling technology
Actions Underway:
Increase access to potable water through use of portable water stations and other activities (underway)
Program to encourage use of rain barrels for apartments (underway) Explore bylaw revision to allow ticketing for illegal yard sprinkling (underway) Lawn sprinkling education and awareness program pilot (underway) Metro Vancouver’s Capilano filtration plant construction (underway)
The full action plan for Clean Water, including the public engagement results, can be found beginning in Appendix 1.
Clean Air Working Group Chair: Sean Pander, Sustainability Group
Goal 9: Breathe the cleanest air of any major city in the world.

Greenest City 2020 Action Plan - 09212 17
2020 Target: Meet or beat the most stringent of British Columbian, Canadian, and international air quality standards and guidelines. Accountability: Climate Protection Program Manager, Sustainability Group Highest Priority Actions (3 years):
1. Encourage electric vehicle transport; 2. Regulate uncontrolled wood burning appliances for residential buildings; 3. Establish a framework for integration of air quality considerations into the City planning. 4. Collaborate with Port Metro Vancouver, Metro Vancouver and BC Hydro on joint air quality
issues. Strategies to 2020:
1. Motor vehicles 2. Non-road diesel engines 3. Marine vessels 4. Air quality improvement strategy for vulnerable populations 5. Develop plan to manage volatile organic compounds (VOCs)
Actions Underway:
Electric vehicle charging station pilot program (underway) Develop air quality protection plan that supports Metro Vancouver planning (fall 2011) Replace City waste transfer tractor trailers with cleaner fuel vehicles in partnership with
Fortis BC (under discussion) Develop and implement a green fleets plan for the City of Vancouver (underway)
The full action plan for Clean Air, including the public engagement results, can be found beginning in Appendix 1.
Local Food Working Group Chair: Mary Clare Zak, Director – Social Policy Goal 10: Vancouver will become a leader in urban food systems.
2020 Target: Increase city and neighbourhood food assets2 by a minimum of 50%. Accountability: Director of Social Policy, Community Services Group Highest Priority Actions (3 year):
1. Support urban agriculture by: a. Creating 5-6 community gardens/yr; b. Enabling 3 new urban farms; c. Encouraging 2 new farmers markets; d. Adding public fruit trees; e. Investing in 3 neighbourhood food networks and f. Support the development of a Vancouver Food Hub
2. Provide local food in City facilities, such as community centres, through the development and implementation of a local food procurement plan.
2 “Neighbourhood food assets” include: community kitchens, farmers markets, pocket markets, community food composting facilities, garden plots, community orchards, urban farms, and food hubs.

Greenest City 2020 Action Plan - 09212 18
3. Develop a Vancouver Food Strategy. 4. Comprehensive review of policy and regulatory barriers to growing local food for personal
consumption or economic development, and plan to remove barriers.
Strategies to 2020: 1. Implement Vancouver Food Strategy 2. Support creation of food infrastructure and food-related green jobs 3. Ensure food system resilience and equal access to resources at the neighbourhood scale 4. Support the provision of information on just and sustainable local food systems 5. Ensure City promotes and advocates for food issues with other levels of government
Actions Underway:
Support farm markets by making it easier to host them in all zones (complete) Greenest City grants for neighbourhood food projects (first grants made in 2010) Increased number of community garden plots and other forms of urban agriculture – 450
community garden plots added in 2010, including a community garden at City Hall Edible landscaping information and support program (ongoing) Expand street food vending program (summer-fall 2010) Support urban farming on City land, including SoleFood farm lease on City land (underway) Plant fruit trees in parks, first orchard complete Fall 2010 (underway) Increase food carts on public right of way including local foods (underway) Bee hives located on City Hall (first hives installed 2010) Backyard chicken bylaw (2010) Encourage local food in City procurement processes (Fall 2011) Support food business incubator (winter 2010/11)
The full action plan for Local Food, including the public engagement results, can be found beginning in Appendix 1. FINANCIAL IMPLICATIONS
As the City moves fully into the implementation of the GCAPs, the financial impacts and potential tradeoffs will be presented to Council for their consideration and approval. The 2012-2014 Capital Plan aims to include highest priority Greenest City actions as much as possible within the available fiscal envelope. The 2012 Capital and Operating Budget processes will also integrate Greenest City requests within the available fiscal envelope. Significant new policy, regulatory, planning or programmatic recommendations will come to Council on their own as they are developed. Staff will work to achieve the Greenest City 2020 Action Plans as much as possible using existing financial and staff resources, and will also look to leverage its own investments through partnerships and access external funding where possible. PERSONNEL IMPLICATIONS
Existing staff from multiple departments and agencies developed the Greenest City 2020 Action Plans, with the Greenest City Planning Team in the Sustainability Group offering coordination and support as well as delivery of the public engagement work from June 2010 – June 2011. The Sustainability Group has been realigned to support and coordinate implementation of the GCAP across the City. Accountable City departments will be responsible for implementing their parts of the plan as a part of their work. Community engagement for the Greenest City will be led by Corporate Communications with staffing needs currently funded to the end of 2011. Each department with accountability for implementing part of the GCAP will bring personnel implications
Greenest City 2020 Action Plan - 09212 19
forward to be evaluated as part of the City’s operating budget processes beginning in 2011 for the 2012 fiscal year. ENVIRONMENTAL IMPLICATIONS
The development and implementation of a detailed action plan to achieve the Greenest City 2020 goals and targets will make a significant contribution to City-wide environmental performance on key issues like climate, local food and green jobs. Some of the strategies and actions may be transferable to other industrialized, and industrializing cities, as Vancouver shares our successes and challenges along the way. Vancouver will continue to look to international cities for best practices, and for innovative solutions that can be imported and adapted to the Vancouver context. SOCIAL IMPLICATIONS
Reflecting the importance of addressing the social sphere of sustainability as integral to overall sustainability goals, the Greenest City 2020 work has applied a strong social lens to all of the ten goal areas, including:
assessing job potential of different actions including threshold opportunities accessible to at-risk, low income and youth populations;
planning to create a diversity of job types that will build a stronger local, green economy; applying a justice and affordability analysis, particularly to our climate, transportation,
ecological footprint, and local food draft action plans; maximizing opportunities to enable the creation of social enterprises that support Greenest
City goals as a way of lending financial stability to non-profit organisations participating in GCAP implementation;
considering access issues in our plans (e.g. access to drinking water); and working to engage a more diverse audience in our public engagement activities both now,
and throughout the implementation of the Greenest City 2020 Action Plan. Given the strong correlation between climate, transportation, sustainable and local food, access to drinking water and the city’s urban health, staff are working to align Greenest City planning and Urban Health strategies. IMPLEMENTATION PLAN
More in-depth financial planning for implementation of action plans will be done in alignment with the Capital Investment Strategy and the Capital Plan. Annual operating budget alignment will begin with the 2012 budget, and ongoing business planning alignment will occur as that plan is refreshed. Staff will report back to Council on Greenest City implementation as a part of those processes. A plan for ongoing data collection, analysis and reporting out is being developed to ensure accountability of the City to its residents in achieving the Greenest City 2020 targets. Staff will report back to Council on progress made against the targets every two years, beginning in 2013. COMMUNICATIONS PLAN
An extensive public engagement plan, called “Talk Green to Us” in phase 1 and “Talk Green Vancouver” in phase 2, was developed and implemented for the Greenest City 2020 Action Planning process. The engagement plan included detailed description of the purpose, targeted audiences, and tactics employed for Phase 1 and Phase 2 of the public engagement process. A communications plan was also used during the public consultation, and described the collaboration between the Sustainability Group and Corporate Communications regarding advertising, design, creative materials, editing content, and media relations. Ongoing work to coordinate communications

Greenest City 2020 Action Plan - 09212 20
across departments on the GCAP will be facilitated by the communications and public engagement managers in Corporate Communications.
CONCLUSION
This report provides Council and the community with the final Greenest City 2020 Action Plan, including the strategies and actions that will mark the path to the achievement of the Greenest City targets. It includes a summary of the results of the dialogue held with people and organisations across the city about their vision and expectations of what would make Vancouver the Greenest City. This report provides some detail on how the baseline metrics were calculated for each of the 15 targets in order to ensure an institutional record, and to be transparent about the methodology used in order to facilitate transferability to other cities and stakeholders. More than 35,000 people participated in this process, with more than 9,500 people actively contributing to the development of the Greenest City 2020 Action Plan. These numbers will continue to grow as the City continues to build new partnerships and collaborations with a focus on implementation. Dialogue has been sparked, and continues to spread throughout this city, and the many cities around the world that have been inspired by what Vancouver is striving to do. The adoption of the Greenest City 2020 Action Plan is a critical milestone in the City’s path to becoming the greenest in the world, and attention must now be focused on implementing this bold, ambitious, and important plan for current and future Vancouverites.
* * * * *

Greenest City 2020 Action Plan - 09212 21
Appendix 1: Greenest City 2020 Action Plan and Background

Greenest City 2020 Action Plan - 09212 22
Goal 1 ‐ Green Economy
1. GOAL AND TARGETS
Long Term Goal #1: To secure Vancouver’s international reputation as a mecca of green enterprise 2020 Target 1: Double the number of green jobs over 2010 levels by 2020 2020 Target 2: Double the number of companies that are actively engaged in greening their
operations over 2011 levels by 2020 Accountability: Chief Executive Officer, Vancouver Economic Development Commission in collaboration
with other City managers.
2. BACKGROUND
2.1 Context The green economy in Vancouver is growing more than twice as fast as other sectors and represents opportunities for considerable innovation and advancement. Greening all Vancouver workplaces as well as growing our green businesses will not only reduce our environmental footprint, but will also contribute to a building a robust and competitive economy. Borrowing from the UNEP definition, green jobs are those that contribute to restoring or preserving environmental quality, reducing energy, materials and water consumption, and minimizing or altogether avoiding the generation of all forms of waste and pollution. Sectors range from clean technology and green building, to education and materials recovery. Green jobs also include jobs in traditional sectors with businesses that have significantly greener processes or operations than industry standards, such as Vancouver’s emerging eco‐fashion cluster. Local food is added to the UNEP definition, as growing an urban food system is central to the Greenest City vision for a sustainable economy. Local is defined as all food and beverage (including wine) produced and consumed within the province of British Columbia (BC). Table 1: Types of jobs in the green economy
Target Sector Types of new jobs Existing jobs that will be greened
Clean Technology
Electric vehicle mechanics; Smart grid engineers and technicians; Smart meter manufacturers
Energy efficient lighting specialist; ICT networking specialist; Natural gas engine mechanics; Power engineers
Green Buildings
Building commissioning agent; Energy modelers; Green roof technicians; Energy managers
Green renovators; Building operators; Insulation specialists; Drafters and architects
Waste Management & Recycling
Compost collectors; Waste reduction consultants; e‐waste specialists; Recycling facility operator
Waste technicians; Waste collectors; Recycling materials handlers
Local Food Economy
Urban farmers; Bee‐keepers Processors; Horticulturalists; Food retailers; Chefs; Servers
Sustainability Services & Education
GHG emissions auditors; Offsets aggregator; Carbon traders; Sustainability mangers
Policy analysts; Supply chain managers; Teachers and educators
The first target is to double the number of green jobs over 2010 levels by 2020 and thereby double the size of the green economy. Approximately half of new green jobs will be entirely new jobs, created through attraction

Greenest City 2020 Action Plan - 09212 23
and expansion of green businesses. The other half will come from jobs that are transformed via green skills upgrading and the greener practices of Vancouver businesses. The second target is to increase green business practices across all sectors of the economy, and in doing so help Vancouver companies benefit from cost advantages and market opportunities. Companies that consume less energy and produce less waste face lower operating costs, and can access contracts from the increasing number of larger organizations that have sustainable purchasing requirements. In addition, companies that employ ‘systems thinking’ can find opportunities for improved productivity, innovative business processes, creation of shared value and additional revenue streams. The Green Economy goal has an impact on each of the nine other goal areas. Conversely, the implementation plans for each of the Greenest City goals affect the Green Economy targets. As the economic development agency for the City of Vancouver, the Vancouver Economic Development Commission (VEDC) has overall responsibility for the Green Economy goals and targets, but some specific proposals are managed by other City departments. 2.2 Baseline Vancouver has about 11,000 green jobs in 8 sectors, or nearly 3 percent of Vancouver’s jobs. There are approximately 3,900 local food jobs in the city, leading to a total of 14,900 green and local food jobs in the city of Vancouver.
0
500
1,000
1,500
2,000
2,500
3,000
3,500
4,000
Local food Clean tech &
green building
products
Green
transp'n, infr.
& planning
Waste
management
& recycling
Remediation &
env'l
consulting
Green building
design &
construction
Sust. services,
public sector &
education
Green jobs in
traditional
sectors
Number of Green Jobs
Figure 1: Green and local food jobs in the city of Vancouver. Source: Vancouver Economic Development Commission survey and estimates, March 2010 and April 2011. See Working Paper Series on the Green Economy at www.vancouvereconomic.com Opportunities in the green economy are attainable by all, including professionals and trades people, and those facing barriers to employment. At least 10 percent of green jobs are low barrier jobs that are accessible to residents facing language barriers, mental health issues or other challenges. These include jobs in urban farming, compost collection, home weatherization and building deconstruction, among others. It is critical for the success of the Greenest City initiative that Vancouver companies maximize their efforts to green their operations as well as grow jobs, and this is the focus of target 2. There are different approaches businesses can take – some focus on one or more areas for improvement, such as energy use reduction, while

Greenest City 2020 Action Plan - 09212 24
others generate GHG inventories and undertake assessment, monitoring and reporting activities of differing levels of complexity. The challenge is to develop a limited set of key indicators that can be readily understood and implemented by small firms as well as well‐resourced companies, and that build on practices already in place, so that no duplication of effort is required. VEDC has identified six indicators of measurable sustainability that apply to almost all companies: reduction in building energy use; reduction in fuel purchased; increase in proportion of employees that commute via foot, bike or transit; reduction in water used; waste diverted from landfill; and reduction of copy paper used. VEDC is also testing the addition of a green and local purchasing indicator, as this has a significant green job multiplier effect and helps to achieve target 1. Based on consultant recommendations the VEDC is proposing that a firm be considered as ‘actively engaged in greening its operations’ if it: 1. Has made a public environmental commitment to measure and improve its environmental footprint; and
2. Is measuring and improving performance in the following areas on an annual basis:
a. Energy (fuel, buildings, commuting)
b. Water
c. Use of copy paper
d. Waste
VEDC is currently testing these metrics with a variety of business groups. The metrics and definitions will be refined based on feedback from the business sector. A 2011 baseline for the number of companies engaged in greening their operations has not yet been established but evidence suggests that perhaps 5‐15 percent of businesses meet the above definition of ‘actively engaged’. Some firms with over 50 employees that have the resources to develop systems to monitor their performance in these areas, set targets and report results. Smaller companies (10‐50 employees) have more limited resources, though many are making progress in this direction. The smallest companies (less than 10 employees) do not typically have the resources for assessments and generally have a limited environmental impact; moreover, more than half of all new companies fail within the first five years. Amongst the smallest companies, small restaurants and retail locations can have a large impact on the environment and present an opportunity for considerable improvements especially in the area of local food purchasing. During 2011, VEDC will develop an accurate baseline with the use of a randomized telephone survey, to be repeated every two years, dependent on funding. 2.3 Challenges and Opportunities
Challenged by the lack of a coordinated approach from federal, provincial, regional and all other levels of
government on the issues of full cost price signals and market creation for energy, water, waste etc.
Challenged by the lack of a comprehensive, integrated, multi‐government strategy to engage all part of the
private sector
Opportunity to liaise with other levels of government, other jurisdictions and international institutions on
green economy best practices
Opportunity to engage Vancouver’s private sector towards green economy goals
3. STRATEGIES AND ACTIONS
Growing the green economy requires strategies on the large scale, such as district energy technologies, as well as on the small scale, such as weather‐stripping homes. Strategies for the global context are also essential, to attract the best and the brightest to Vancouver and build strong export markets. Greening Vancouver

Greenest City 2020 Action Plan - 09212 25
workplaces requires strategies that address the barriers small businesses face in measuring and reducing their environmental footprint. Highest Priority Short Term Actions (3 years): 1. Develop and support hubs (such as an incubator, accelerator or research facility)for each key green cluster,
and locate these in the GEZ as much as possible, along with a demonstration platform for local companies and relevant incoming and outgoing trade missions; a. Start with a technology centre that includes a hub for clean technology, and a food processing
enterprise incubator.
b. Include annual inbound/outbound trade missions to/from West Coast US, China and India, and
advance alliances with major international companies to market local green technology abroad.
c. Focus on Green Neighborhood and its capacity to act as a demonstration zone for local and global
green innovations
d. Leverage a range of assets, such as city‐owned property, to showcase clean technologies and green
building products
Green clusters include:
Clean technology, in particular smart grid, power electronics and power conversion equipment
Green buildings, in particular green renovations and carbon neutral new construction
Materials management and recycling, in particular composting and materials salvage and recovery
Local food economy, in particular food processing and manufacturing
Sustainability services and education, in particular sustainability consulting and carbon finance
Greener traditional industries, in particular eco‐fashion
2. Develop a formal green pre‐procurement program
a. Create an ongoing dialogue between the City’s purchasing category managers and technology
companies and advance showcasing of local green technologies.
b. Design an information exchange program (two information sessions per year and follow‐up);
3. Establish a Green Enterprise Zone (GEZ) in the downtown Eastside and False Creek Flats. A GEZ would have
high green standards and become the ‘greenest place to work’ in the world3.
4. Deliver a business engagement program that aligns Greenest City and economic development messages to
achieve measureable improvements in the environmental performance of Vancouver businesses while also
achieving prosperity and job growth.
a. Consult with key business associations (e.g. Business Council of BC, Board of Trade, BC Restaurant and
Food Services Association) and develop business‐sensitive programs for large, medium and small
businesses, along with collateral that promotes both economic growth and greening operations,
emphasizing for each size of company, the business advantages of assessment and monitoring key
sustainability indicators
b. Hire a Green Business Development Officer (BDO) to deliver the above program in coordination with
VEDC’s existing business outreach program, BDO’s and Business Energy Advisor (BEA). Targeting firms
of over 10 employees as well as restaurants and retail locations, this person would work closely with
3 Further details on this proposed action will come to Council as a separate report.

Greenest City 2020 Action Plan - 09212 26
the BEA, Sustainability Group, BIAs, industry associations, sustainability service providers and other
agencies to help green Vancouver businesses and point them towards auditing, consulting and other
services. In particular for restaurants and retail, purchasing of local food and green products and
services will be highlighted.
c. Create a network of sustainability service providers and work with them to provide a consistent
approach and common metrics for assessment and monitoring of environmental indicators
d. Undertake a baseline study to determine the proportion of Vancouver companies that are engaged in
improving their environmental performance
3.2 Strategies and Short‐ and Medium Term Actions
Target 1 ‐ Short Term Actions (1‐3 years):
Create brand equity for green firms using ‘Vancouver Green Capital’ brand.
Offer local green companies that demonstrate their technologies locally the use of the ‘Vancouver
Green Capital’ brand to support them in their marketing and business development efforts
Emphasize local employment, investment and capacity building.
Support Campus City Collaborative (‘C3’) to deliver green education/training (especially areas in short
supply, e.g. building operators, energy modelers) and collaborate on ongoing Greenest City research
Create a database of green education/training programs to highlight career entry/change opportunities
Support internships with City departments as well as with private sector green start‐ups
Develop employment incentives for green businesses to hire people with barriers to employment
Target 1 ‐ Medium Term Actions (3‐9 years): Develop small‐ and large‐scale eco‐industrial networking opportunities. Manufacturing and service
businesses that are located near each other can co‐ordinate environmental and resource issues, leading to
more efficient and denser use of industrial lands. For example, properties can share logistics, shipping and
receiving facilities, and parking allocations. They can also work to offset complementary heating or cooling
loads, or otherwise share waste resources from industrial operations.
Develop green incentives and financing mechanisms aimed at private green enterprise investment that
align with programs offered by other levels of government and industry partners
Support local and green supply chain development via procurement policies. The City’s environmental
procurement policy can be expanded to include green and local guidelines for procurement, particular in
the areas of food, IT, buildings and energy technologies.
Ongoing monitoring and research of Vancouver's green economy. Policy‐research for green economic
development and survey of green jobs (recommend every three years)
Target 2, Short Term Actions (1‐3 years):
Assist with the creation of measurement standards, common metrics, benchmarks and recommended
reduction strategies for various size and categories of Vancouver businesses
Work with industry associations and sustainability service providers to collect baseline data for
Vancouver
Develop a common set of metrics and benchmarks to track the environmental performance of
businesses
Greenest City 2020 Action Plan - 09212 27
Target 2, Medium Term Actions (3‐9 years):
Tele‐working. Flexible working arrangements can help to reduce greenhouse gases if employees are able to
work from their homes and attend meetings virtually.
Support the research into smart work centres in Vancouver to identify the environmental impacts of
tele‐working and implications for apartment size and neighbourhood development.
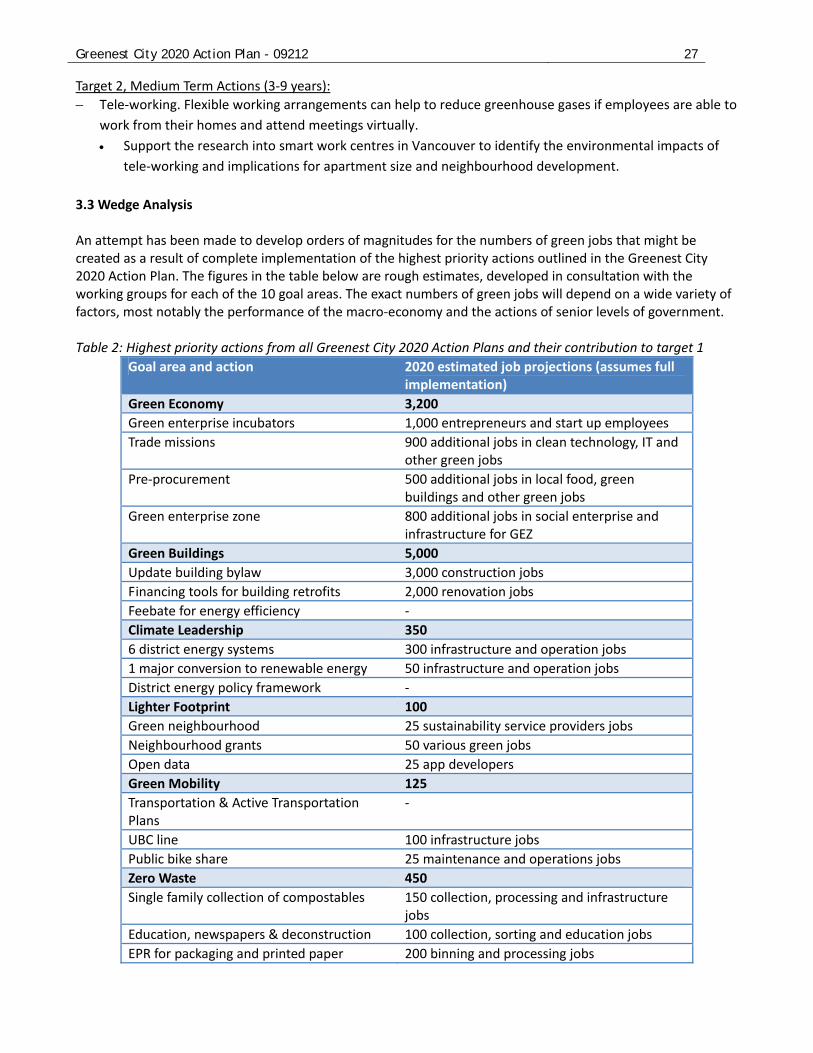
3.3 Wedge Analysis An attempt has been made to develop orders of magnitudes for the numbers of green jobs that might be created as a result of complete implementation of the highest priority actions outlined in the Greenest City 2020 Action Plan. The figures in the table below are rough estimates, developed in consultation with the working groups for each of the 10 goal areas. The exact numbers of green jobs will depend on a wide variety of factors, most notably the performance of the macro‐economy and the actions of senior levels of government. Table 2: Highest priority actions from all Greenest City 2020 Action Plans and their contribution to target 1
Goal area and action 2020 estimated job projections (assumes full implementation)
Green Economy 3,200
Green enterprise incubators 1,000 entrepreneurs and start up employees
Trade missions 900 additional jobs in clean technology, IT and other green jobs
Pre‐procurement 500 additional jobs in local food, green buildings and other green jobs
Green enterprise zone 800 additional jobs in social enterprise and infrastructure for GEZ
Green Buildings 5,000
Update building bylaw 3,000 construction jobs
Financing tools for building retrofits 2,000 renovation jobs
Feebate for energy efficiency ‐
Climate Leadership 350
6 district energy systems 300 infrastructure and operation jobs
1 major conversion to renewable energy 50 infrastructure and operation jobs
District energy policy framework ‐
Lighter Footprint 100
Green neighbourhood 25 sustainability service providers jobs
Neighbourhood grants 50 various green jobs
Open data 25 app developers
Green Mobility 125
Transportation & Active Transportation Plans
‐
UBC line 100 infrastructure jobs
Public bike share 25 maintenance and operations jobs
Zero Waste 450
Single family collection of compostables 150 collection, processing and infrastructure jobs
Education, newspapers & deconstruction 100 collection, sorting and education jobs
EPR for packaging and printed paper 200 binning and processing jobs

Greenest City 2020 Action Plan - 09212 28
Clean Water 50
Water metering all homes 50 auditing and installing jobs
Enhance education and access ‐
Eliminate CSOs and develop integrated SWMP
‐
Local Food 1,150
Support urban agriculture and local processing
300 farming, farmers market, processing, hub and incubator jobs
Stimulate institutional & private sector procurement
550 local food jobs
Street food vending and retail in food deserts
300
Access to Nature
Urban forest management plan ‐
Pocket parks and tree planting on public prop.
‐
Clean Air
Encourage electric vehicles ‐
Regulate wood burning and air quality plan ‐
Total 10,425
Target 2 is still under development and the estimates below are anticipated to evolve based on feedback from the business sector. Table 3: Highest priority actions and their contribution to target 2
Action Estimated projections to 2020
Business energy advisor 100 companies per year
Green business development officer 100 companies per year
Partnerships with industry associations, BIAs, etc.
100 companies per year
Total 2,700 companies
4. CROSS REFERENCE
Greenest City 2020 Action Plans: Each Greenest City goal must contribute to the creation of green jobs and assist with greening Vancouver workplaces. Nearly two‐thirds of green jobs in the next decade are projected to come from the green building sector, while the green economy strategies in this plan could contribute approximately 20 percent to the target. Other City of Vancouver plans:
‐ VEDC’s economic development strategy
‐ Greenest City 2020 Green Enterprise Zone plan
‐ Transportation 2040 Plan and Active Transportation Plan
‐ Communications Strategy for Greenest City
‐ Municipal Food Strategy
‐ Industrial area land use planning

Greenest City 2020 Action Plan - 09212 29
5. EXTERNAL ADVISORY COMMITTEE MEMBERSHIP Target 1:
Richard Hallman BC Innovation Council
Jennie Moore BC Institute of Technology
Robin Hemmingsen BC Institute of Technology
Pascal Spothelfer BC Technology Industry Association
Lee Loftus BC & Yukon Construction Trades Council
Wayne Peppard BC & Yukon Construction Trades Council
Michael Heeney Bing Thom Architects
Shirley Chan Building Opportunities with Business
Brian Smith Building Opportunities with Business
Wal van Lierop Chrysalix
John Lerner EMBERS
Marcia Nozick EMBERS
Paul Shorthouse Globe Foundation
Mark Holland HB Lanarc
Bob Ingratta LifeSciences BC
Helen Goodland Light House Sustainable Building Centre
Gil Yaron Light House Sustainable Building Centre
Linda Nowlan Environmental Lawyer & Consultant
Lori Law National Research Council ‐ IRAP
Walter Wardrop National Research Council ‐ IRAP
Linda Oglov Oglov Business Development
Heather Tremain ReSource Rethinking Building
Paul Austin Sustainable Development Technology Canada
Sean Markey Simon Fraser University
James Tansey University of British Columbia
Maureen Cureton Vancity
Target 2:
Gordon Harwick BC Film Commission
Christy Intihar BC Hydro PowerSmart
Joy Beauchamp BC Government LiveSmart
Bernie Magnan Board of Trade
Catherine Chick Business Development Bank of Canada
Elizabeth Sheehan Climate Smart
Charles Gauthier Downtown Vancouver BIA
Wes Regan Hastings Crossing BIA
Sophie Agobonkhese Strathcona BIA
Walt Judas Tourism Vancouver
Michael Krafczyk Translink
Maureen Cureton Vancity
Lorina Keery BOMA BC

Greenest City 2020 Action Plan - 09212 30
6. STAFF WORKING GROUP MEMBERSHIP John Tylee (Chair) VEDC
Juvarya Warsi (Staff Lead) VEDC
Chris Clibbon Planning
Kira Gerwing Planning
Lee Malleau VEDC
Bryan Buggey VEDC
Jonathan Kassian VEDC
John McPherson VEDC
Peter Vaisbord Community Services
Abhijeet Jagtap UBC Greenest City Scholar
Nouri Majjar UBC Greenest City Scholar
7. PUBLIC ENGAGEMENT SUMMARY Phase One On the Talk Green to Us forum there were 44 ideas with 1155 votes submitted for “Create green jobs”. The top five ideas in this category were:
Idea Votes
Build a high speed rail line between Vancouver and Seattle 632
Grow local supply chains 61
Create a green business certification scheme 57
Make Vancouver a global destination for companies to develop and demonstrate emerging clean energy technologies, green transportation systems, energy efficiency solutions, water technologies, green building technology by encouraging, facilitating, procuring and enabling projects to happen in Vancouver rather than other cities
50
Create a Green Enterprise Zone that would serve as a magnet for the development of green business, technology, products and services
27
Phase Two
In order to be successful, innovative financing mechanisms and other incentives will be needed. This includes incentives (not only financial incentives), but want to make sure that businesses don't become reliant on these as they should be able to thrive in the long term without them.
Support for using the green economy goal/vision as a broader communications strategy about the greenest city that will resonate with people.
A lot of excitement about the potential for research, education and training to support building of the green economy
Need to encourage, drive, and empower business owners to change: participate in corporate climate leaders, walk the talk, encourage workplace participation.
Great support for synergy between green job generation and other greenest city goals ("closed loop economy"), most particularly waste, food, ecological footprint, buildings; talked about the green enterprise as one place for this, but not to prevent businesses in other parts of the city from participating.
Green choices can't be more expensive; "all of us should be able to afford it"
Need to clearly demonstrate and communicate the green dividends (in the triple bottom line sense) of the green economy
Greenest City 2020 Action Plan - 09212 31
In order to succeed, need to change the mindframe of both businesses and consumers and the consumer economy
One of the things that people were excited about, was that the green economy was particularly good for young people, and that it is exciting, tangible, and engages citizens.
8. BASELINE METHODOLOGY a. Green jobs To define the term ‘green’, this study borrows from the United Nations Environment Program (UNEP) definition which has a focus on those activities that restore or preserve environmental quality, reduce energy, materials and water consumption, de‐carbonize the economy, and minimize or altogether avoid the generation of all forms of waste and pollution. As growing the local food economy is central to Greenest City 2020 vision to create a sustainable economy, the UNEP definition is supplemented by the inclusion of local food. The definition is further expanded to allow for non‐union and part‐time workers. Voluntary work is currently excluded from the definition of ‘job’ for the purposes of this Action Plan. After defining ‘green’, the study develops a process in order to determine whether a job is considered a ‘green job’. Those employees working for an organization that produces green products or services are the most obvious; however the definition also includes those working on processes that improve environmental performance. For example, manufacturers of high efficiency windows are considered green, as are sustainable lighting consultants. The provider of carbon management solutions is included in the definition, as are those employees involved in improving the performance of a company in an otherwise non‐green firm. On the other hand, jobs that are considered indirect are not included. For instance, suppliers to the window manufacturer would be excluded, in order to avoid any double counting of such jobs in the general economy. Jobs that are in traditional sectors but where the tasks are focused on environmental improvement are also considered green jobs. For example, a sustainability officer or energy manager at a conventional window manufacturer would be included. This working definition is also comparable to the definition of the green jobs used by the Globe Foundation and previous VEDC studies. Three methodologies were used to estimate the number of green jobs in Vancouver and to corroborate the results from each method. The first method was based on North American Industry Classification System (NAICS) employment figures for the Metro Vancouver area, derived from the census data available from Statistics Canada. The second method was based on Statistics Canada’s Inter‐Provincial Input Output (I‐O) Model, as applied by the Globe Foundation in the development of the report ‘BC’s Green Economy’ (2010). The third method was based on primary data, collected via a survey of city companies by Vancouver Economic Development Commission (VEDC). Census based methodology The census‐based methodology used census data from 2006 and associated NAICS codes to estimate the number of green jobs at the Vancouver Census Metropolitan Area (Vancouver CMA) level (analogous to the Metro Vancouver region). Analysis of the NAICS 4‐digit codes identified all industry sectors with the potential to contain green jobs, with these codes then re‐organized into eight broad categories. The CMA census data for these codes was analyzed to provide the number of jobs in each of these respective industries. Depending on the nature of each NAICS code, in some cases intensity ratios were applied to the sector to determine the number of green jobs. (Refer Appendix C for results). Intensity ratios were developed via literature reviews and interviews with industry experts. Green jobs for the city of Vancouver were then estimated by assuming that approximately one third of Metro Vancouver jobs are located in city of Vancouver, an assumption based on empirical analysis of general employment trends in the Metro Vancouver area.

Greenest City 2020 Action Plan - 09212 32
Input‐Output based methodology The Input‐Output method was adopted by the Globe Foundation and is summarized in their document BC’s Green Economy: Research Methodology. Globe’s definition of green jobs is very similar to the approach taken by VEDC, though their approach to finding an estimate number of green jobs is different. The data from Globe was adapted in order to estimate the green jobs for the city of Vancouver by assuming that approximately one third of the Metro Vancouver jobs as reported by Globe are located in city of Vancouver (Globe’s study did not provide direct numbers for the City, and only provided numbers for Metro from which we derived the City numbers). Survey based methodology The survey methodology is a continuation of the previous work done for VEDC, as summarized in the report ‘Vancouver’s Green Economy’ by Hurrian Peyman. This method relies on collecting primary data from organizations that are identified as part of the green economy. Using existing databases, interviews with industry experts and canvassing Vancouver companies, VEDC established a database of Vancouver’s green companies, and conducted a survey to determine the number of jobs that could be considered green at each organization. Example survey questions For a green company (e.g. David Suzuki Foundation):
‐ How many employees do you have? (count all) For a company involved in green projects (e.g. Busby, Perkins & Will):
‐ How many of your projects are considered green? (multiply total number of employees by % green projects)
For a company in a traditional sector (e.g. Teck): ‐ Are your business operations significantly greener than your industry peers (e.g. carbon neutral
operations)? (if yes, count all) ‐ If not, do you have any personnel dedicated to greening your business practices and operations?
(count each individual) Figure 2: Methodology to define green job b. Local food jobs The first stage of the methodology was to establish the definitions and scope of the study. Specifically, the following two terms needed to be defined; ‘Local Food’ and ‘a Local Food Job’, particularly in reference to their geographical boundaries. To define ‘Local Food’, research was carried out into the definitions of this phrase chosen by other relevant organisations and associations. This research showed that there was no one single commonly agreed definition

Greenest City 2020 Action Plan - 09212 33
of local food. Typically they ranged from a radius of 30 to 100 miles, although some definitions used non‐distance measurements such as bioregional boundaries. After careful consideration, consultation with key local food experts including members of the Vancouver Food Policy Council, and an assessment of the likely feasibility of various methodologies, the following definition of local food was chosen: ‘Local food’ is all food originating from the province of British Columbia. The local food jobs study used an analysis of the North American Industry Classification System (NAICS) to identify every industry where a local food job could be potentially located. This analysis resulted in occupations being broadly classified under five local food sectors: Production; Processing; Retail; Restaurants & Eating/Drinking Places; and Support Services. Analysis of Employment Data The objective of this stage was to produce an estimated maximum number of local food jobs by NAICS for 2010. This was achieved through the utilisation of Census 2006 employment data by NAICS for Vancouver CSD and Vancouver CMA (if CSD level data was not available). In order to calculate the percentage of jobs that were present in the City of Vancouver (as opposed to being held by residents of the city and potentially located outside of its boundaries), the relative percentages were taken from the 2001 Metrocore Jobs Study (which identified jobs by place of work as opposed to place of residency). Intensity Ratios An intensity ratio is a quantitative analytical method that enables an unknown subset of a population to be estimated, based on its perceived intensity. This study needed to use intensity ratios in order to estimate the total number of local food jobs, as the population size i.e. the total number of potential local food employers was so large (approximately several thousand) that contacting and assessing them all for local food jobs was infeasible. For each NAICS code, an intensity ratio was estimated/generated through interviews with industry experts and the surveys conducted with the Local Food Leaders as well as a randomised sample of other food related employers. Local Food Leaders A database of Local Food Leaders was then developed in order to establish:
a) The highest possible intensity ratio per industry; and b) To build the first database of highly significant contributors to the local food economy in terms of jobs
by industry. For each industry, employers qualified by meeting the minimum threshold in terms of B.C. food sourcing. Local Food Leaders were employers were identified through data‐mining of existing local food databases (such as the GetLocalBC’s directory and the Food Network’s 100 mile website,) in addition to canvassing industry experts and relevant Vancouver based food related companies.

Greenest City 2020 Action Plan - 09212 34
Figure 3: Methodology to determine local food jobs
c. Greening small businesses A firm might be considered ‘actively engaged in greening its operations’ if it has made a public environmental commitment and is both measuring and improving performance in the following areas on an annual basis: energy (covering fuel, building energy use and employee commuting); water; use of copy paper; and waste. This can include absolute improvements, or for firms that are experiencing high growth rates, an intensity measure of reductions (e.g. reduction in GHGs emitted per unit of output). This definition is currently being tested in consultation with the business community. Evidence suggests that very few businesses fall in this category with the exception of some firms with over 50 employees. VEDC intends to establish a 2011 base line through a telephone survey. However, based on existing information, the target is to: Double the number of businesses that are actively engaged in greening their operations over 2011 levels by 2020 In pursing this target, VEDC’s top priority will be firms with over 50 employees, since they have both the greatest capacity to become actively engaged and the greatest potential impact on helping to achieve Greenest City goals. Other priorities will be companies with 10‐50 employees, and restaurants and retail outlets of all sizes Definition of ‘engagement’ Based on best practices and standards such as the ISO 14000 collection, there are four components considered as indicative of a company’s engagement in improving its environmental performance:
Measuring Improving Monitoring Reporting
VEDC has found that small businesses are reportedly active in reducing their impact, but are not necessarily doing so in a systematic way, and are not engaging in measuring, monitoring or reporting. Conversely, larger companies with more capacity and resources are more likely to be actively pursuing all four of these activities.

Greenest City 2020 Action Plan - 09212 35
While the definition needs to reflect these different circumstances, ‘engagement’ must indicate that a company is achieving real and measurable improvements in its environmental performance in order to align with the Greenest City vision. For Greenest City purposes, engagement is indicated when a company is both measuring AND improving its environmental performance, and has made a public commitment to do so. Indicators of environmental performance Businesses’ environmental priorities will vary depending on the industry sector they are in, their size, and other parameters. In addition, while there are emerging protocols for GHG reporting, there are still no universal standards or established common metrics in the world of environmental reporting. Businesses and providers of sustainability services to business alike recognize this as a major problem and would welcome an established framework with which to report the level of engagement of businesses in greening their operations. Based on emerging best practices and Greenest City goals and targets, VEDC has identified a set of indicators that would be applicable across most industry sectors in Vancouver: 1. The company has made a public environmental commitment to measure and improve its environmental
footprint; and
2. The company is measuring and improving performance in the following areas on an annual basis:
a. Energy (fuel, buildings, commuting)
b. Water
c. Use of copy paper
d. Waste

Greenest City 2020 Action Plan - 09212 36
Goal 2 ‐ Climate Leadership
1. GOAL AND TARGET Long Term Goal #2: Eliminate dependence on fossil fuels. 2020 Target: Reduce community‐based greenhouse gas emissions by 33% from 2007 levels. Accountability: Climate Protection Program Manager ‐ Sustainability Group
2. BACKGROUND
2.1. Context Greenhouse gas emissions from human activities are upsetting the natural balance of gases in the earth’s atmosphere. This is resulting in increasingly dangerous climatic changes which many view as the greatest environmental challenge of our time. City of Vancouver must pursue its Climate Leadership strategies and actions in partnership with businesses, citizens, and other public institutions to meet its 2020 GHG reduction target while at the same time preparing Vancouver for the impacts from climate change that are already occurring. The next nine years are critical – if Vancouver is successful in implementing this aggressive plan it will have the expertise, infrastructure, and financial and regulatory tools in place to make achieving the 80% reduction by 2050 relatively easy. In addition, further improvement of Vancouver’s growing global reputation in urban planning, green building, sustainable transportation, and integrated energy systems will result in significant new employment and business opportunities, and a better quality of life for everyone.
2.2 Baseline Metrics Vancouver’s original Community Climate Change Action Plan (2005) plotted a course of action to reduce emissions associated with buildings, transportation and waste by 6% below 1990 levels by 2012. The 2008 community GHG inventory indicated that emissions grew significantly during the 1990’s, peaked in 2000, and have declined back to 1990 levels. The planned expansion of Vancouver’s landfill gas recovery system is expected to reduce emissions to 6% below 1990 levels by the end of 2012. These reductions have occurred at the same time as population has increased by more than 27% and jobs have increased by over 18% proving that climate leadership and prosperity can be achieved together.
Figure 1: Vancouver’s 2008 GHG Emission Inventory; City of Vancouver
The primary sources of GHG emissions in Vancouver include burning natural gas for heating buildings, water, and industrial processes; the use of fossil fuels such as gasoline and diesel in cars and trucks; and methane emitted to atmosphere from the anaerobic decomposition of organic matter in the landfill. The use of

Greenest City 2020 Action Plan - 09212 37
electricity does result in some emissions, but these impacts are much less than in other cities as most power in British Columbia is generated from hydroelectric dams.
Figure 2: 2008 greenhouse gas emissions (tCO2e)
It is important to note that Vancouver’s greenhouse gas emission inventories exclude some significant emission sources due to measurement challenges and jurisdictional limitations. Greenhouse gas emissions associated with the production of fuel, food, and materials such as cement and consumer goods that are imported to the city are not included in our local inventory. In addition, emissions from marine, rail, air transportation, and non‐road equipment such as generators and construction equipment are also excluded. However, leading best practices in GHG measurement are starting to report emissions associated with the full lifecycle of the goods we consume, as well as emissions traditionally considered outside of a municipality’s realm of influence. The City will expand its efforts to quantify and support actions by other entities to minimize emissions from all sources.
2.3 Challenges and Opportunities Despite Vancouver’s success to date, implementing this 2020 Climate Action plan will be challenging; the rate of decrease in emissions will need to double over what was achieved during the past 10 years in order to achieve the 2020 target. Our success will rely upon continued provincial action to decrease the carbon content of vehicle fuels and electricity, to require new vehicles to be more fuel efficient, and to support City action by providing us new regulatory authority. It depends on continuing an approach of focusing new development into areas to foster compact and complete communities that can easily be served by public transit and renewable energy. A new funding model for public transportation and significant new investments in this area are required at the same time as new financing and regulatory tools must be developed to ensure buildings are as efficient as possible. Finally, in addition to sustainable heat sources such as geo‐based and waste heat, the success of this Plan will require Vancouver to increase its use of organic materials such as food and wood waste
2008 GHG Emissions (tCO2e)
Light-Industrial365,000
13%
Commercial305,000
11%
Multi-unit Residential Buildings320,000
12%
1& 2 Family Homes530,000
19%
Light Duty Vehicles880,000
32%
Heavy Duty Vehicles125,000
5%
Solid Waste220,000
8%

Greenest City 2020 Action Plan - 09212 38
to generate heat and biogas – recognizing the importance of reusing and recycling wood to the greatest extent possible.
3. STRATEGIES, SHORT‐ AND MEDIUM TERM ACTIONS 3.1 Highest Priority Short Term Actions (3 year) The highest priority actions to reduce GHG emissions in Vancouver that are not described under green mobility, green buildings, and waste management relate to the rapid expansion of neighbourhood scale renewable energy systems: 1. Work with developers and energy utilities to establish four new renewable energy systems for new, large
site, high density developments by 2014 that will reduce emissions by an estimated 12,000t/year by 2020 (with these reductions continuing to increase as the developments these renewable systems serve continue to grow).
2. Work with existing system operators to facilitate at least one major industrial or institutional energy system converting to a to a local renewable energy source by 2014 to reduce emissions by at least 15,000t.
3. Work with key stakeholders to research the opportunities and considerations associated with district scale renewable energy sources with the aim of developing a policy framework to establish clear expectations as to the conditions under which the City will (or will not ) consider each of these energy sources.
3.2 Strategies and Short‐ and Medium Term Actions This plan outlines seven strategy priorities to reduce emissions to the 2020 targeted level. Reductions projections for each strategy are relative to the projected emissions levels that have been estimated for 2020 if current trends continued without significant new actions being undertaken. Strategy 1 ‐ Renewable Energy. Vancouver’s experience in developing the Neighbourhood Energy Utility for South East False Creek has taught Vancouver that there are economically viable opportunities for the large scale deployment of sustainable energy systems using current technologies, especially in high density, mixed‐use urban neighbourhoods. High capital costs and low energy prices have been significant barriers to market adoption of renewable energy technologies. One strategy to overcome these barriers is to use a utility approach to the ownership and operation of renewable energy systems. A utility can invest higher upfront capital costs in renewable energy systems and still make a profit over the life of the system because of much lower operating costs. A second strategy to address capital cost barriers to renewable energy systems is to deploy them at a district scale as the cost per unit of energy produced decreases dramatically for most technologies when these are developed to serve numerous buildings. Short Term Actions (1‐3 years)
Work with developers and energy utilities to establish district energy systems for new, large site, high density developments with mechanisms to ensure the switch to a renewable energy source when there is a large enough customer base for the investment
Work with existing industrial, institutional, and commercial energy system operators to identify and facilitate a switch to a local renewable energy source
Medium Term Actions (3‐9 years)
Work with senior government and industry partners to explore infrastructure, financing, and regulatory approaches to facilitate the connection of existing buildings to renewable district energy systems.

Greenest City 2020 Action Plan - 09212 39
Explore the opportunities and issues relating to establishing shared, low‐carbon energy systems between buildings or at the block scale.
Explore the benefits, challenges, and opportunities to integrate individual district systems into a thermal energy grid.
Work with energy utilities to develop a distributed sustainable energy utility model where instead of selling natural gas or electricity to the building, they install and operate a building scale renewable energy system and sell heat or power directly to the building or grid.
Strategy 2 ‐ Green Building. When it comes to greening our city, there is a great deal of potential in the building sector. Building (and industrial) operations account for 55% of GHG emissions in Vancouver. Vancouver plans to create programs, tools, and regulations to drive building and industry retrofits to reduce emissions from existing buildings by 20% by 2020. In addition, Vancouver plans to progressively decrease the climate impacts of new construction so that by 2020, all new buildings will be carbon neutral. Vancouver’s Green Building Action Plan has five areas of focus: 1. Regulation: develop policies, bylaws, and building codes that requires improvements to energy efficiency in
new and existing buildings. 2. Financing tools: develop financial tools so that investments in energy performance are more accessible to
homeowners and investors. 3. Incentives: promote incentives offered by others and aim to fill gaps, where possible, through partnerships
with others; invest in innovations being led by the building sector where there is City‐wide benefit. 4. Capacity building: develop industry capacity over time through partnerships, demonstrations, incentives,
training programs, and sharing resources. 5. User engagement, education and outreach: engage building occupants in conservation practices through
use of a variety of information and marketing tools. Refer to the Green Building section of the Greenest City 2020 Action Plan for more details. Strategy 3 ‐ Green Transportation. Motor vehicles are among the largest sources of greenhouse gases and other pollutants, causing health problems, climate change and other socio‐economic and ecological challenges. In Vancouver, light duty vehicles accounted for over 30% of GHG emissions in 2007. In addition to continuing to work on various green transportation initiatives, Vancouver has begun to update the City’s Transportation Plan and is developing the City’s first ever Active Transportation Master Plan. These two plans will build upon the work done to create the Greenest City 2020 Action Plan and identify specific programs and infrastructure projects to help make the majority of trips in Vancouver occur by walking, cycling, or transit and to reduce vehicle kilometres travelled per resident by 20% by 2020. Programs and infrastructure that focus on mobility are only part of the story – transportation and land use go hand in hand. Good land use can reduce the distance people travel and support more sustainable choices like walking and cycling by bringing people closer to their daily destinations. Building complete communities that put people close to jobs, schools, services, amenities, and transit will continue to be a key strategy as Vancouver moves forward. The Greenest City Transportation Plan has six strategies: 1. Supporting shorter trips through mixed land use, complete community design, and new housing choices
that put the majority of residents close to jobs, schools, recreation, and transit. 2. Supporting transit improvements to increase capacity and ensure service that is fast, frequent, reliable,
fully accessible, and comfortable.

Greenest City 2020 Action Plan - 09212 40
3. Making active transportation choices such as walking and cycling feel safe, convenient, comfortable, and fun for people of all ages and abilities.
4. Advancing policies that reduce automobile use and ownership. 5. Accelerating the shift to low‐ and zero‐ emissions vehicles. 6. Working with partners to develop a sustainable urban goods movement strategy that supports a growing
economy while reducing GHG emissions related to goods movement through and within Vancouver.
Refer to the Green Transportation section of the Greenest City 2020 Action Plan for more details. Strategy 4 ‐ Zero Waste. The direct, measurable relationship between waste reduction and climate change in Vancouver, according to how cities measure GHG emissions using international accounting protocols, results from the decomposition of organic matter in the landfill which produces methane gas. The ultimate goal is to reduce the amount or organic materials going to the landfill. Where organics do make it to the landfill, the goal is to capture as much methane gas as possible, as the emissions that are not captured have a significant impact on climate because they are 21 times more powerful than CO2 as a greenhouse gas. In addition to these direct emissions, waste has many emissions that are not accounted for locally as many of the materials that go into landfill required significant use of fossil fuels to extract, manufacture and transport. A critical step in reducing these GHG emissions will be for people to prevent waste at the outset by consuming less and keeping resources in circulation. Short Term Actions (1‐3 years)
Continue to expand the landfill gas capture system and seek the best use of the biogas produced even after organic matter is banned from the landfill.
Work with Metro Vancouver on their efforts to prevent compostables from entering the landfill.
Explore the use of clean waste wood and other biomass sources to recover energy through bio‐gasification or direct combustion, provided there are no significant air quality impacts, there is certainty in the sustainability of biomass supply, and that policies and infrastructure are in place to maximize the beneficial reuse of waste wood.
Long Term Actions (3‐9 years)
Assess the feasibility and opportunities to establish infrastructure to recycle food scraps, compostable paper and other organic materials into biogas as a clean source of energy and/or transportation fuel.
Work with Metro Vancouver to ban organic waste from the landfill by multi‐family dwellings and business institutions by 2015, and increase regional capacity to use the organics for productive purposes.
Undertake research and explore opportunities to account for and reduce the greenhouse gas emissions associated with the production, transportation, and disposal of goods and materials, including food, through life‐cycle waste management approaches.
Explore the opportunities and mechanisms to create valid carbon offsets from recycling projects and infrastructure development to stimulate investment in reuse and recycle technologies as a viable option for the reduction of indirect greenhouse gas emissions.
The actions above summarize the most significant opportunities to reduce direct GHG emissions relating to waste in Vancouver. Refer to the Zero Waste section of the Greenest City 2020 Action Plan for a complete discussion of Zero Waste issues, opportunities, strategies and actions that will help Vancouver to also reduce the indirect and embedded GHG emissions of materials. Strategy 5 ‐ Climate Change Adaptation. There is scientific consensus that climate change is already occurring, but the degree of change expected and its impacts are still in question, especially at the local level. From what we know now, Vancouver will likely encounter longer drier summers, more intense weather events (wind, rain,

Greenest City 2020 Action Plan - 09212 41
snow), and gradual sea level rise. Municipal and regional governments around the world, including the City of Vancouver, have recognized the need to take action to prepare their communities to deal with the impacts of climate change. The City began a high‐level assessment of climate change risks in 2007‐08 by adopting a leading framework to understand the local climate projections, and identify some of the vulnerabilities in our municipal operations and infrastructure. The City learned that more localized climate modelling is required, predicting change based on historical data is a challenge, and that systems have to be flexible enough to accommodate changing conditions over time. The City is participating in the ICLEI Canada (Local Governments for Sustainability) Climate Change adaptation planning pilot project along with other local governments both within the Region and across Canada. Short Term Actions (1‐3 years)
Report to Council with draft Adaptation Plan including adaptation action recommendations.
Implement key actions in priority areas.
Begin implementing other actions recommended in Adaptation Plan. Support departments incorporating these actions into operating and capital budget processes.
Integrate climate change adaptation planning into City business with accessible climate projections and decision‐making support tools.
Medium Term Actions (3‐9 years)
Inventory current City actions, plans and policies to identify opportunities and gaps for climate change adaptation actions.
Work with other government partners and the scientific community to ensure climate variable projections and scenarios are current and relevant to City decision‐making.
Build on previously completed vulnerability and risk assessments to detail climate impacts and priority areas for subsequent action planning focus.
Strategy 6 ‐ Support Provincial Climate and Energy Plans. The 2007 Provincial Climate Action Plan and 2010 Provincial Energy Plan includes key actions and new legislation that, if successfully implemented, will be critical to Vancouver meeting its 2020 target as they account for 40% of the reductions required for Vancouver to achieve its own target. Medium Term Actions (3‐9 years): The City of Vancouver must remain engaged with the Province, other local governments, and provincial energy utilities to help ensure that these Plans are successfully implemented including follow‐through on:
renewable fuel legislation that requires a gradual decrease in the fossil fuel content of our transportation fuels;
legislation requiring gradual improvements in the fuel efficiency of new vehicles sold in B.C.;
requirements to increase provincial clean energy generation so we are no longer a net importer of power and to procure offsets for emissions from operations and for older power facilities so that electricity in B.C. is carbon neutral by 2020.

Greenest City 2020 Action Plan - 09212 42
3.3 Wedge Analysis
2007 emission levels 2,760,000 t eCO2 2020 projected emissions (current trends) 2,900,000 t eCO2 2020 targeted emission levels (33% below 2007) ‐ 1,850,000 t eCO2 GHG Emission reductions required = 1,020,000 t e CO2 Total reductions from Action Plan (graph above) 1,140,000 t e CO2* *Total reductions from the actions in this plan slightly exceed the amount required to achieve the 2020 target with the understanding that some actions may not be 100% completed by 2020.
4. CROSS REFERENCE The strategies and actions from other Greenest City goals and targets that directly support the climate leadership plan are: Green Transportation
Make the majority of trips (over 50%) on foot, bicycle and public transit by 2020
Reduce distance driven per resident 20% from 2007 levels
Climate leadership strategies and actions should be incorporated into the upcoming Transportation Plan.
Green Building
Require all buildings constructed from 2020 onward to be carbon neutral in operations
Reduce energy use and greenhouse gas emissions in existing buildings by 20% over 2007 levels Zero Waste
Reduce total solid waste going to landfill or incinerator by 50% from 2008 levels Lighter Footprint
Reduce Vancouver’s per capita ecological footprint by 33% over 2006 levels Other CoV Planning processes
Climate leadership should be considered in future land use plans and rezoning processes.
GHG Emission Reductions from Plan
Provincial Regulation
445,00039%
Zero Waste50,000
4%
Green Transoprtation
255,00022%
Renewable Energy120,000
11%
Green Buildings270,000
24%

Greenest City 2020 Action Plan - 09212 43
5. EXTERNAL ADVISORY COMMITTEE MEMBERSHIP Eve Hou Metro Vancouver
Josha MacNab Pembina Institute
Dale Littlejohn Community Energy Association
Guy Dauncey BC Sustainable Energy Association (BCSEA)
John Robinson UBC
Stephen Sheppard UBC
Kevin Millsip Vancouver School Board
Mark Roseland SFU
Nicholas Heap David Suzuki Foundation
Norm Connolly Community Energy Association
Stacey Bernier Canadian District Energy Association
Victoria Smith BC Hydro
Colleen Sparks BC Climate Action Secretariat
Paul Shorthouse Globe Foundation
Alan Boniface Urban Land Institute
Mauricio A. Acosta Energy & Environmental Sustainability Facilities Management, Vancouver Coastal Health
Elizabeth Sheehan Executive Director, Climate Smart
John Turner Fortis BC
6. STAFF WORKING GROUP MEMBERSHIP Sean Pander (Chair) Sustainability
Hugo Haley (Staff Lead) Sustainability
Chris Baber Engineering
Dave Ramslie Sustainability
Malcolm Shield UBC Greenest City Scholar/Sustainability
Derek Pope UBC Greenest City Scholar
Lisa Westerhoff UBC Greenest City Scholar
7. PUBLIC ENGAGEMENT SUMMARY Phase One There were 87 ideas and 1432 votes submitted for in the category “Reduce greenhouse gas emissions” on the Talk Green to Us forum. The top ideas were:
Ideas Number of Votes
Expand the use of electric trolley buses and electric vehicles 195
Build energy/transit corridors to support electric streetcars and district energy systems
171

Greenest City 2020 Action Plan - 09212 44
Work with developers and energy utilities to establish district heating systems
90
Increase overnight rates to curb energy consumption in offices 82
Encourage businesses to roof with solar panels 42
Phase Two
Energy is too cheap; need price signals that encourage investment in energy efficiency, improved performance. Focus on reduction of energy use.
Need incentives. Example of feebates. Incentives that help with mitigating risk associated with use of new technology in order to encourage innovation.
Excited about district energy and renewable energy. Examples of localized renewables (e.g. policy like Merton Rule), use of biogas, use of biomass (specifically mention BC forestry waste). Note that if this is not done correctly it could be dirty and counter productive.
Show leadership ‐ waiting for others (particularly other levels of government) will cause inaction. Model leadership at local level ‐ lobby/advocate for policy and regulatory change required.
Need an adaptation strategy. Need to explain what this means, and why it is important, in lay terms. Risk assessment ‐ assess and convey how high the risks of inaction on climate change are so that the risk of doing nothing is appropriately communicated.
Strong support, and see connections between, climate, clean air, building, transportation, land use, health and heath care.
Support for integrated land use, though differing views of what this means. Find best ways to densify land we have. Include examples of low rises achieving same densities as high rises ‐ cite statistics used and back up with figures; Mole Hill as example neighbourhood.
Selective about what is being focused on, i.e. Port. Must fit in the larger, integrated action with other jurisdictions.
Additional comments:
Look to model of the Carbon Trust in the UK to accelerate energy efficiency and climate change solutions; CoV to establish a similar organisation.
Conflicting views about BC Hydro supplying clean energy: sustainable energy strategy is a low priority because BCH is clean; BCH isn't a sustainable power source due to the huge environmental and social impacts of dam construction.
Assumptions about carbon neutrality may be flawed, and should be re‐examined.
Translate the GHG target into one that people can understand.
8. BASELINE METHODOLOGY Introduction This document describes how the GCAT GHG Plan Projections calculations are made to ascribe the GHG reductions associated with each of the City’s major mitigation strategies. Section 2 Business‐as‐Usual Growth describes the methodologies and assumptions made in predicting the City’s emissions in 2020 should no action be taken to abate the growth in emissions. Section 3 Reduction Pathways details the calculation methodologies used in predicting the effectiveness of each of the City of Vancouver’s major reduction strategies for the five main GHG areas as defined by ICLEI‐Local Governments for Sustainability (www.iclei.org).

Greenest City 2020 Action Plan - 09212 45
Business‐as‐Usual Growth The City of Vancouver’s GHG emissions for 2007 were interpolated from the City of Vancouver’s 2008 Greenhouse Gas Emissions Inventory: Summary and Methodologies and City of Vancouver Climate Protection Progress Report (the City’s 2006 emissions inventory) reports. Emissions are categorised into five main sources: natural gas, electricity, light duty vehicles (<5000kg GVW), heavy duty vehicles (>=5000 kg GVW) and landfill gas from solid municipal waste disposal. The business‐as‐usual (BAU) case for each source established the GHG emissions levels for 2020 according to the methodologies below. Natural Gas
The weather corrected figures supplied to the City of Vancouver from Terasen Gas Ltd. (now Fortis BC Inc.) show that despite increases in population and economic activity gas use is, in real terms, declining due to fuel switching and efficiency gains. However, downward pressure on gas pricing is expected to suppress efficiency increase demands leaving natural gas use constant at 2007 levels. Electricity
As part of its strategic business planning BC Hydro has conducted an extensive growth and demand forecast for time horizons out to 2029 which is reported in the Electric Load Forecast 2008/09‐ 2028/29. The study predicts, before any demand‐side‐management or rate controls, load requirements for residential, commercial and industrial customers as well as total load and peak demand increases. A mean annual compound growth rate of 1.6% is expected when residential, commercial, and industrial loads are taken together. The 2010 BAU prediction is made by:
1. Converting the 2007 GHG emissions to total electricity usage (in GWh) using the BC Hydro 2007 carbon intensity for electricity generation.
2. The 2007 GHG generation is then used to predict the 2020 GHG generation based on the 1.6% compound growth rate.
3. The 2020 generation level is converted to emitted GHGs using an average carbon intensity value for the years 2004‐2009.
Light Duty Vehicles (LDV’s)
Business‐as‐usual growth in the use of light duty vehicles is assumed to mirror that of population growth within the City of Vancouver. Internal, City of Vancouver, population growth rates out to 2021 are used to calculate a growth rate of 1.49% a year until 2020. Heavy Duty Vehicles (HDV’s)
As part of Metro Vancouver’s Lower Fraser Valley Air Emissions Inventory, Forecast & Backcast, Translink conducted some detailed modelling forecasts of vehicle kilometres travelled, VKmT, for scenarios out to 2030. Metro Vancouver forecasting is made for three conditions corresponding to low, medium, and high levels of vehicle growth. The City of Vancouver’s GHG calculations are based on the moderate growth scenario, which uses Translink modelled figures to predicted future VKmT. The model predicts a 1.75% annual growth rate in HDV VKmT, although the class division at which LDVs and HDV are demarcated is different for Metro Vancouver’s methodology and that of the City (ICLEI). The difference is not deemed to affect the values significantly, or have an impact upon the vehicle strategies’ efficacy. Landfill Gas
As part of the City’s landfill management practices CH2M Hill Ltd. were contracted to perform a landfill gas assessment given the closure schedule for the different sections of the Vancouver Landfill. The Technical Memorandum prepared by CH2M Hill predicts landfill gas (LFG) production using CH2M Hill proprietary

Greenest City 2020 Action Plan - 09212 46
modelling software for the period 2008‐2075. The figures calculated were used to predict 2020 emissions having accounted for LFG capture efficiency, soil oxidation, on‐site use (building heating) and destruction through flaring, heating and sale to Maxim Power Corporation. The landfill generation calculated for 2020 was deemed to be BAU once expected capture of 85%, soil oxidation, on‐site use and destruction (at 2010 levels) were accounted for. Reductions Pathways A series of reductions pathways have been identified, and are detailed below for each source. Gains in building efficiency are not expected to be equal in newly built stock and buildings that have been retrofitted. Building stock turnover is 1.6% per year, while floor space increases at about 0.85% per year. The sum of these two growth rates gives the total fraction of new floor‐space generated annually. By 2020 this equates to 32% of total 2007 floor‐space. Natural Gas
Improvements in building efficiency are designed to apply to both space heating (almost the sole preserve of natural gas) and power consumption (electricity). Of the new stock constructed by 2020 some will be serviced by renewable district energy systems. Renewable Heat
Renewable heat from district energy systems will provide almost carbon neutral heat for the new large developments as well as those for North‐East and South‐East False Creek, and the East Fraserlands. Vancouver General Hospital and Children’s & Women’s Hospital will also to be heated from renewable sources. The heating of Downtown Vancouver will become renewable and gains in efficiency from the City’s industrial partners will provide further reductions in natural gas related GHGs. Incremental expansion will be offset through integration of heating loads in the Broadway corridor and Downtown, while the Cambie corridor will also be heated from renewable district energy. Internal planning efforts based on predicted residential heating requirements, the ability to integrate loads and increase industrial efficiency have outlined potential reductions to be made by 2020. Given the uncertainty in implementation associated with such large projects, only 75% of the potential 2020 gains are applied for the City’s renewable heat reduction pathway calculations. Increased Heating Efficiency
By 2020 new building stock will have heating that is 50% more efficient than 2007. An average increase in efficiency of 25% is used for the 13 year period from 2007 to 2020 since the way in which the increases will roll out into the building stock over this period is unclear. Building stock older then 13 years in 2020 will have been retrofitted to be heated 20% more efficiently. GHG savings are calculated by applying the 20% gain to the fraction of 2020 BAU natural gas usage that is consumed by retrofitted buildings (68%). Of the building stock that is newer than 2007, GHG savings are calculated by:
1. Applying the 25% saving to 32% of 2020 BAU natural gas GHGs. 2. Establishing the total floor space attributable to North‐East and South‐East False Creek, and the East
Fraserlands is calculated. 3. Using a value of 1400 sq.ft per tonne of GHG the expected annual GHG emissions for the three
developments are calculated.

Greenest City 2020 Action Plan - 09212 47
4. To account for implementation uncertainty the savings are applied at a rate of 75% and subtracted from the reduction calculated in Step 1, since these developments are to be heated from renewable district heating (see 0 Renewable Heat).
Electricity
Building Reductions
By 2020 new building stock will be 50% more electricity efficient than 2007. An average increase in efficiency of 25% is used for the 13 year period from 2007 to 2020 since the way in which the increases will roll out into the building stock over this period is unclear. Building stock older than 13 years in 2020 will have been retrofitted to be 20% more electricity efficient. GHG savings are calculated by applying the 25% or 20% reduction to the fraction (new 32% and retrofitted 68%) of total BAU electricity usage in 2020. Provincially Mandated Carbon Neutral Electricity
The BC Energy Plan mandates all new BC electricity generating capacity to be carbon neutral and by 2016 all generation to be carbon neutral. The electricity which remains after reductions in new and old building stock consumption (see 0 Building Reductions) is thus all carbon neutral in 2020, leaving the balance of BAU emissions as GHG reductions. Light Duty Vehicles (LDV’s)
VKT Reduction
Using the 2008 Translink Trip Diary data a reduction between 15 & 22% was assessed with a median 20% reduction target adopted. The reduction is applied to the 2020 BAU LDV GHG emissions. Electric Vehicles
Using data from ICBC on the distribution of vehicle age (reported in the Lower Fraser Valley Air Emissions report) and assuming a target of 15% of new sales to be electric in 2020 the total rolling stock in 2020 that is expected to be electric is 8.8%. The purchase trend towards 15% new sales was assumed to take a compound growth from 0% in 2010 to 15% over 10 years, and reflects ‘typical’ consumer uptake of new technology. The 15% target was formed after consultation and informed by studies conducted by: Electric Mobility Canada (Electric Vehicle Technology Roadmap for Canada), Deloitte (Gaining Traction: A customer view of the electric vehicle mass adoption in the U.S. automotive market), University of Waterloo for the Ontario Provincial Government (Towards and Action Plan for Ontario Plug‐In Electric Vehicles) and Pollution Probe (Canadians’ Perceptions of Electric Vehicles). GHG emissions from electric vehicles are assumed to be zero since electricity generation in BC will be carbon neutral in 2020 (see 3.2 Electricity). Vehicle Efficiency Gains
Of the vehicles that remain following VKmT reductions and EV implementation, fuel efficiency increases will yield further GHG reductions. Metro Vancouver’s 2005 Lower Fraser Valley Air Emissions; Inventory and Forecast & Backcast report (published January 2010) contains detailed VKmT and vehicle fuel consumption data by class and is used as a proxy for the City of Vancouver’s VKmT and fuel consumption profile. The increase in fleet efficiency is calculated by:
1. Calculating the percentage reduction in fuel consumption for each class of vehicle according the Metro Vancouver data.
2. Establishing what proportion of total VKmT is travelled by each vehicle class.

Greenest City 2020 Action Plan - 09212 48
3. The decrease in fuel consumption for each class is then attributed to the portion of total VKmT travelled for all vehicles.
4. The sum of the reductions in fuel consumption for each class are then totalled for LDVs and HDVs to yield the total reduction in fuel consumption for the LDV and HDV rolling stock respectively.
BC Renewable & Low Carbon Fuel Requirements
Of the fuel that is consumed by LDV transport, emissions reductions will be realised from improved fuel blends. It has been Provincially Mandated that transport fuels will be 10% less carbon intensive by 2020. This reduction is applied to the non‐electric portion of the fleet once improvements in fuel consumption have been taken into account. Heavy Duty Vehicles (HDV’s)
A similar approach to the LDV reduction was taken with the HDV reductions; however, the Metro Vancouver 2005 Lower Fraser Valley Air Emissions; Inventory and Forecast & Backcast suggests no improvement in fuel consumption by 2020 for HDV’s. The only observed GHG reductions come from Provincially mandated reductions in fuel carbon intensity. The BC Renewable & Low Carbon Fuel Requirement regulation stipulates that HDV fuel be 10% less carbon intensive by 2020. New technologies like natural‐gas engines and hydraulic hybrids will increase fuel efficiency yet are not reflected in the Metro Vancouver fuel consumption predictions. The introduction of the Pacific Gateway will also affect HDV traffic, as will changes to waste haulage and transit patterns. It is not possible to accurately predict the changes that will occur, nor their effect on the HDV GHG reduction plan. Landfill Gas
The City of Vancouver has set the target that by 2020 50% less waste than in 2008 will go to landfill. The same CH2M Hill Ltd. Technical Memorandum used to calculate BAU landfill gas generation also reported 2008 landfill gas generation levels. The reduction in landfill gas generation was calculated by applying the 50% reduction in waste generation to the 2008 modelled GHG generation figure. The 2020 BAU destruction, soil oxidation and usage rates were used to calculate the gas consumed, the balance of which were deemed fugitive. The difference between the 2020 BAU and 2020 fugitive emissions are those savings realised from reduced waste generation.

Greenest City 2020 Action Plan - 09212 49
Goal 3 ‐ Green Buildings
1. GOAL AND TARGETS Long Term Goal #3: Lead the world in green building design and construction. 2020 Target 1: Require all buildings constructed from 2020 onward to be carbon neutral in operations. 2020 Target 2: Reduce energy use and GHG emissions in existing buildings by 20% over 2007 levels. Accountability: Sustainable Development Program Manager, Sustainability Group Chief Building Official
2. BACKGROUND 2.1 Context Canadians spend more than 90% of our time indoors. As such a focal point of our lives, buildings should be designed to operate efficiently and occupants should be aware of how their activities translate to energy consumption. Buildings should be designed appropriately to suit our climate, provide comfortable, healthy indoor environments, and to be durable, accommodating current and future uses. Much of our current building stock does not meet the abovementioned criteria. In recent years other considerations took priority over energy efficient design and occupant comfort. Much of our existing building stock is inefficient in its design and operation, and as a result these buildings consume more energy than is necessary, primarily through heat loss and overuse of mechanical systems. Our goal is to build a suite of tools and partnerships that build capacity, foster innovation, cultivate demand and awareness, such that high performance carbon neutral design and construction becomes the baseline and can be seen as complementary to other important design considerations. Our current regulations for new buildings are competitive or better than other jurisdictions across North America. Until recently, efforts to green buildings in Vancouver did not adequately address the performance of existing buildings. We can mandate that new construction is built green, but this only gradually transforms our overall building stock. It is more challenging to improve the performance of existing buildings that are already in operation than to mandate design requirements to new buildings. Both of these targets are consistent with international best practices for carbon reduction in the built environment, and are supported by the latest climate science as being necessary for climate change mitigation. 2.2 Baseline The target for new buildings is to mandate carbon neutral new buildings by 2020. The City of Vancouver has adopted a working definition of carbon neutral buildings. The City’s definition for purposes of this target is as follows: “carbon neutrality is achieved through a process of measuring emissions, reducing use of carbon‐based energy sources and producing the required energy through renewable sources or offsetting any emissions such that there is no net carbon emitted through the operation of a building.” When it comes to greening our city, there is a great deal of potential in existing buildings. Buildings account for 55% of citywide GHG emissions in Vancouver. Half of those emissions come from residential buildings, both multi‐unit and single family dwellings. As the number one source of emissions by a substantial margin, any reduction in energy consumption and GHG emissions in the building sector will have a significant impact on Vancouver’s overall GHG footprint.

Greenest City 2020 Action Plan - 09212 50
Light-Industrial363,611
13%
Commercial303,009
11%
Multi-unit Residential Buildings318,160
12%
1& 2 Family Homes530,266
19%
Light Duty Vehicles878,310
32%
Heavy Duty Vehicles124,031
5%
Solid Waste220,000
8%
Figure 1: 2008 greenhouse gas emissions (tCO2e)
2.3 Challenges and Opportunities Energy is cheap in BC, so homeowners, tenants and business owners are not responding to price signals, as in other jurisdictions, to motivate them to conserve energy. Another challenge is the “split incentive” wherein landlords and developers are not inclined to pursue energy efficiency design or retrofits as tenants and purchasers are responsible for paying their utility bills, and therefore it is the tenant that benefits from the savings. Cost is a barrier to retrofitting existing buildings; owners will only pursue upgrades with very short paybacks. First costs borne by the developer are also perceived as a barrier in new construction. Finally, there is a barrier in terms of industry capacity. In both the new construction and retrofit sectors, there is a need for education, training and capacity building in energy efficient design, construction and operations.
3. STRATEGIES AND ACTIONS 3.1 Highest Priority Short Term Actions (3 year) 1. Update Vancouver Building Bylaw with aim to increase energy efficiency and reduce greenhouse gas
emissions; 2. Develop and promote financing tools for building retrofits; 3. Use price signals in permit fees to reward energy efficiency and greenhouse gas reductions in new and
existing buildings. 3.2 Approach to Target 1: New Construction The overall approach to achieving this target is as follows: a. First reduce actual energy demand by 50% (this reduction is in absolute terms [kwh/m2/yr] compared to a
2010 baseline). Specific building sector reduction targets will be identified by further technical analysis and review; and
b. Supply remainder through renewable energy sources (e.g. renewable district heating, solar thermal, geothermal etc.).

Greenest City 2020 Action Plan - 09212 51
In order to achieve this target the City will focus on energy conservation first, supplying renewable energy second and where necessary making use of low GHG intensity grid‐supplied electricity for applications that require high quality energy. The City recognizes that there will still be a need for grid‐supplied hydroelectricity, which by Provincial mandate will be carbon neutral by 2016. The strategy will ensure that this electricity is used conservatively for processes where no other suitable replacement is available. The purchase of offsets will be used as a last case scenario as a bridging mechanism in special cases where a plan to achieve renewable energy on‐site may require a longer development horizon. While achieving this improved efficiency, minimum requirements for renewable energy in new buildings will also be introduced for the purposes of heating and conditioning spaces. This renewable energy can be provided either on‐ or off site and will focus on the generation of heat. 3.3 Approach to Target 2: Existing Buildings The overall approach to achieving this target is to encourage energy efficiency upgrades through: a. Regulation and market mechanisms; and b. The development of accessible, affordable energy efficiency services and financing programs to assist the
consumer in making upgrades. Note: This target refers to a 20% reduction on average across all buildings (e.g. poor performers will target >20% reduction while efficient buildings may only improve slightly).
This target is based on projected energy efficiency retrofits and improvements to a portion of the city’s building stock that will take place between today and 2020. The target is for reductions in both GHG emissions and energy use because while different fuel types have varying footprints in terms of GHG emissions, it is not enough to simply mandate a reduction in GHG emissions ‐ it is our goal to reduce the absolute energy demand of buildings to support broader GHG reductions provincially and regionally. Mandatory abatement programs will become required in some sectors in order to reach the number of buildings required to achieve our target as we approach 2020. This will only occur once robust financing tools are in place. Overall the City views the alignment of regulation with incentives, financing tools, capacity building, quality assurance and user engagement as being necessary to achieve both targets. Below is a summary of actions that will be taken, followed by more specific actions broken down by the six aforementioned focus areas (regulation, financing tools etc.). 3.4 Strategies and Short and Medium Term Actions for Targets 1 and 2 Strategy 1 – Regulation In reviewing international best practices on GHG reductions in the built environment, every jurisdiction that has been successful in reducing GHG’s has used regulation as a tool. Vancouver's approach is to introduce regulations that as much as possible mitigate financial implications for building owners and developers, while improving energy performance and lowering associated GHG’s. In order to introduce more aggressive improvements through regulation, the city will develop new financial tools to connect the upfront costs to the long‐term operating cost savings. Short Term Actions (1‐3 year):
Add energy efficiency considerations into an updated Vancouver Building Bylaw. Standards could be included in Part 10 of the 2012 edition of the Vancouver Building Bylaw.
Vancouver will target development of an HVAC bylaw, regulating the commissioning, maintenance, fuel choice and efficiency of heating, cooling and ventilation equipment in buildings by early 2012.
By 2014, the City will offer an outcomes‐based codes path to compliance in addition to its prescriptive and performance based paths. The purpose of the outcomes based codes are to base compliance on the actual performance of the building rather than its’ predicted or modeled performance. In essence the outcomes‐based code will enforce energy intensity targets expressed in kilowatt‐hour or Kilo‐joules per square meter

Greenest City 2020 Action Plan - 09212 52
per year (kWh/m2/yr or kJ/m2/yr). The outcomes‐based code approach simplifies the compliance process and assures the city that it is actually receiving the emissions reductions that it requires.
Medium Term Actions (3‐9 years):
Create better, easier to use legislation that requires higher performing buildings at defined intervals e.g. 2011, 2014, 2017, 2020. Vancouver's approach is to introduce regulations that as much as possible mitigate financial implications for building owners and developers, while improving energy performance and lowering associated GHG’s.
Adapt policy framework and compliance regime such that it will be based on actual outcomes that support GHG reductions rather than the modeled results of energy simulation.
Seek simplicity in policy development and raise requirements consistently and predictably to minimize uncertainty in the market.
Strategy 2 ‐ Financing Tools Vancouver recognizes that financing for energy efficiency upgrades in new buildings and retrofits is required to catalyze wide‐spread market transformation. To this end, Vancouver will work with stakeholders to ensure that opportunities for financing energy efficiency upgrades are available in multiple market segments. We will seek solutions that tie the investments to the beneficiaries and eliminate the split incentive. Financial tools will facilitate more aggressive regulation as they increase upfront affordability and introduce fairness as they allow all future owners of buildings to share equally in the benefits of the upgrades. Short Term Actions (1‐3 years):
Financing for one and two family homes: Home Energy Loans Program (HELP). Vancouver is developing a program to help homeowners finance energy efficiency upgrades in their homes. After undergoing a home energy audit, homeowners will be able to select from a ‘menu’ of energy efficiency upgrades that will be covered under the HELP program. Homeowners will have the opportunity to pay for the work over a period of time. Payments will be collected using the City’s utility billing mechanism. Incremental payments will be modelled to be less than or equal to the savings on utility bills. When the house is sold, the new owner becomes responsible for the payments and benefits from the savings derived from the retrofits. Improvements will be quantified by before and after home energy assessments to measure the related energy savings and GHG emissions reductions.
Multi‐Unit Residential Retrofit Financing. The City is currently partnering with utilities and major financial institutions to deliver financing for collective property and some in‐unit energy efficiency measures. The program is again structured to ensure that the savings are sufficient to fund the upgrades. The City sees this as not only a method to ensure that energy efficiency upgrades occur in a sector that badly needs them but also serves as a platform for retrofitting electric vehicle infrastructure into these projects.
Strategy 3 ‐ The Development of Price Signals in Permit Fees: Short Term Action (1‐3 years):
Vancouver will develop a revenue neutral system whereby projects that are approaching net zero energy use receive lower permit fees and possibly even grants that are funded by higher fees for less energy efficient projects. The premise of the program relies on the polluter pays principle. The program sends the appropriate price signals to industry and allows applicants to invest money that would otherwise be going to permit fess to be invested in energy efficient design.
Strategy 4 ‐ Incentives Short Term Actions (1‐3 year):
Solar Hot Water Incentive. $4,300 is currently available towards the installation of a solar hot water system for people building new homes in Vancouver. Each system will be metered in order to quantify the amount

Greenest City 2020 Action Plan - 09212 53
of solar heat produced as well as reduction in natural gas (or electricity) consumption. The City is able to provide this incentive by partnering with Terasen Gas, Offsetters, and SolarBC.
Medium Term Actions (3‐9 year):
Vancouver will actively promote existing utility and government incentive programs and, where there are gaps, be creative in developing effective incentives and partnering with others to deliver programs.
The City could be a partner in investing in the innovation required to achieve carbon neutrality within two construction cycles (~5 years) if there are co‐learning benefits for the broader industry. The City may have to be a partner in this in order to ensure that future programs include process improvements: a “fee‐bate” model, increased development rights, grants, or tax adjustments, for example.
Strategy 5 ‐ Capacity Building Medium Term Actions (3‐9 year):
Local government will need to partner with industry and professional associations, post secondary institutions and trades in order to ensure that the necessary resources are available to meet the needs of market as it undergoes a decade of rapid evolution.
The City is in a unique position to convene disparate groups, connect information and leverage its brand as a trusted source of information. Some possible methods to convene people include developing a centre of excellence and shared resources around envelope and passive design. Other strategies may also include home builder and general contractor training and certification programs.
Continued leadership in civic facilities. The City of Vancouver has already developed Canada’s first net‐zero multi‐unit residential building and has begun construction on its first Living Building. In order to seed the market and build capacity in design and construction field there should be continued leadership to build carbon neutral new buildings within its own portfolio of facilities.
Strategy 6 ‐ User Engagement, Education and Outreach Programs Energy conservation goes beyond technology and building science. Building occupants must also be engaged in the conservation process and require the necessary information to make informed decisions both in lifestyle choices and purchasing decisions. To support this, Vancouver believes that new tools such as social marketing, education, and building labelling and benchmarking will be required. Medium Term Actions (3‐9 year):
Vancouver proposes to label 1000 large residential, industrial, commercial and institutional buildings over a period of 18 months as a pilot. Labels will empower tenants and building owners to make decisions about building occupancy and operations based on energy performance. Vancouver will partner with the gas and electric utilities to create uniform labelling standards.
The City will explore mandatory disclosure legislation that will require commercial and high density residential buildings to disclose energy use to the City with the eventual goal of making this information publicly accessible.
Quality Assurance: Home Energy Assessments. There needs to be rigorous third party verification of energy use in buildings in order to ensure that all of the above programs are achieving the desired results. How these programs roll out or who will be responsible is yet to be determined. Some tools already exist such as NRCan’s EcoENERGY for homes assessment tool. Tools such as this could be used as they are now but new tools will need to be investigated for other building types.
4. CROSS REFERENCE Greenest City Plans
Climate Leadership. As part of the climate leadership target, the City is developing a strategy around new opportunities for district energy systems based on renewable fuel sources. The district energy strategy

Greenest City 2020 Action Plan - 09212 54
supports our carbon neutral buildings by 2020 target by providing access to renewable heat sources to service new construction and lower GHG’s of existing buildings that could be connected. Much of the success of being able to provide carbon neutral new buildings will depend on successful deployment of low‐carbon district energy through out the city.
Green Economy. Encouraging green renovations throughout the City of Vancouver will stimulate the local renovation industry and create new job opportunities in green home renovations. It will also spurn the growth of people working in the design and energy efficient technology sectors.
Green Transportation. For holistic GHG reductions the placement of high performance buildings in walkable neighborhoods close to transit is critical. Higher densities with a mix of uses focused on corridors or nodes are also supportive of district energy development. Looking for sources of high quality, low cost, waste or renewable heat sources close to transit as potential sites for higher densities will yield even greater GHG reductions then if either were considered in isolation.
5. EXTERNAL ADVISORY COMMITTEE MEMBERSHIP Allan Francis AIBC Sustainability Committee
Michael Blackman APEG (Association of Professional Engineers and Geoscientists) / RJC (Read Jones Christoffersen Ltd.)
Chris Corps Asset Strategies Ltd; Canadian Royal Institute of Chartered Surveyors
Toby Lau Manager of Codes and Standards, BC Hydro
BCBEC (BC Building Envelope Council) Member
John Cordonier Bentall
Lorina Keery Energy Conservation and Sustainability Programs, BOMA BC
Paul LaBranche Vice President, BOMA BC
Peter Laforest Energy and Sustainability Programs, BOMA BC
Teresa Coady Principal, Bunting Coady Architects
Martin Nielsen Architect, Busby, Perkins + Will
Joe Stano GREEN UP Program Manager, CaGBC (Canada Green Building Council)
Thomas Mueller President and CEO, CaGBC (Canada Green Building Council)
Jessica Woolliams Director, Cascadia Green Building Council
Joel Sisolak Cascadia Green Building Council
Mona Lemoine Director of Education and Training, Cascadia Green Building Council
Allan Francis CEI Architecture Planning Interiors
John Scott Senior Partner, CEI Architecture Planning Interiors
Kevin Hydes Engineer/Consultant, CEO Integral Group
Jennifer Sanguinetti Director, Smart Buildings & Energy Management BC Housing
Jennie Moore Director, Sustainable Development BCIT
Jeff Fischer Executive Director, Urban Development Institute
Amy Spencer‐Chubey Director of Government Relations, GVHBA (Greater Vancouver Homebuilders Association)
Denisa Ionescu Manager, Research and Education, HPO (Homeowner Protection Office)
Murray Mackinnon Vice President of Sustainability, Canadian Contact, Ledcore

Greenest City 2020 Action Plan - 09212 55
Helen Goodland (or Gil Yaron)
Executive Director, Light House Sustainable Building Centre
Trudy Rotgans Manager, Building Policy, BC Gov
Norm Shearing Parklane
Guido Wimmers Passive House Institute
Jonathan Meads Project Manager, Concert Properties
Katherine Muncaster Province of BC
Graham Finch RDH Building Engineering
Warren Knowles RDH Building Engineering
Brenda Martens Recollective
Michael Yeates Regional Manager Business Banking, Vancity
Heather Tremain RethinkingBuilding
Lyn Bartram Assistant Professor, SFU SIAT (School of Interactive Arts + Technology)
Ray Cole Professor, UBC SALA (School of Architecture + Landscape Architecture)
Juvarya Warsi VEDC (Vancouver Economic Development Commission)
Keith Sashaw VRCA (Vancouver Regional Construction Association) 6. STAFF WORKING GROUP MEMBERSHIP Will Johnston (Chair) CBO L&I
Dave Ramslie (Chair / Staff Lead) Sustainability
Rick Michaels Development Services
Ron Dyck Inspections
Sailen Black Planning
Mark Hartman Sustainability
Rachel Moskovic Sustainability
Kandiah Pavananthan Development Services
Pat Ryan Development Services
Chris Warren Development Services
Jay Worthing UBC Greenest City Scholar
7. PUBLIC ENGAGEMENT SUMMARY Phase 1 “Build carbon neutral new buildings” received 21 ideas and 355 votes. The top ideas were:
Ideas Number of Ideas
Create incentives for every homeowner to install Photovoltaics, Wind Turbines, or Solar Hot Water
66
Solar panel on every roof top 62
Change the building code to require that all new buildings are built green
31
Grants for passive houses and buildings 20
Require all properties to capture rainwater/manage rainwater runoff on‐site
19

Greenest City 2020 Action Plan - 09212 56
“Green existing buildings” had 37 ideas and 772 votes submitted. The top ideas were:
Ideas Number of Votes
Encourage conversion of flat roofs to useable, productive greenspace 198
Encourage the development of laneway homes 51
Provide low‐cost financing for building and home owners to fund energy efficient retrofits
45
Empower apartment residents to hang their laundry to dry 43
Change the Building Code to require timer light switches and motion sensors for lights in common areas
39
Phase 2 General Comments
Vancouver is seen as a leader.
The goals are invigorating. Regulatory Tools
Mixed use zoning
Incentives, tax incentives, bylaw and code amendments
Simpler regulations, make the transition simple, don’t change building codes every two years – hard to keep up
Provide clear long‐term plan and keep messaging consistent (developers are always looking 10 years ahead, so need to know what requirements will be down the road)
Focus on compliance, don’t just put in standards and not do quality control
Specific suggestion: from board of trade workshop: “require energy audit with all retrofits”
Performance based codes are a good idea – simpler
City needs to provide tools to enable industry to meet new regulations
Support for innovation in private industry
City needs to create an environment that encourages rather than poses barriers to innovation Partnership and collaboration
Ensure involvement of all sectors
Partnerships are important
Take a collaborative approach to development and innovation
Share and work with other municipalities
Encourage collaboration across silos (including government, institutional) Education and Capacity Building
Education and capacity building are needed within the industry and among the public
Extend requirements from developers to buildings
Recognise diversity of understanding in the industry
Translate GHG emissions into something people can understand
Need general support to make it happen
Educate consumers and developers to influence demand (i.e. people should know that air conditioning is not required in residential buildings in our climate)
“Buildings don’t produce carbon, people do.” – From Carbon Talks dialogue report

Greenest City 2020 Action Plan - 09212 57
Pilot Projects and Information Sharing
Make use of high profile examples/demonstration projects
Demonstration projects as case studies that everyone can learn from
City to lead the way by example
Piloting, information sharing, energy monitoring
Measurement and metrics are important
Share data across the industry Integration and Holistic Approach
Maximize benefits by thinking beyond property lines holistic approach (neighbourhood scale)
Connect green buildings to food and zero waste goals
Integrate and leverage across the goal areas
Look for business opportunities
Plan for what happens inside the building once occupied. ie. Create standards for tenants of green buildings
Specific suggestions from Sustainability meet‐up event ‐‐ Create requirements for business licenses in green buildings, similar to bylaws, for building code and development permits
Concerns
Fear that strict codes in Vancouver will drive development outside city boundaries
Concern 2020 targets could be hard to meet for buildings
Affordability, concern about increased costs In addition to the Talk Green Vancouver consultations, a full day Carbon Talk also gathered recommendations from key stakeholders in the field. In many cases the dialogue feedback parallels the themes from the broader consultation. A report of the Carbon Talks workshop is available.
8. DETAILED BASELINE REPORT Baseline data for this report was taken directly from utility billing data for natural gas (Fortis BC) use and electricity (BC Hydro) use in buildings. See the baseline report included in the Climate Leadership plan for more data on how this was achieved and what methodologies were used. Aggregation of building energy use data from both utilities is recommended every 2 years in order to track trends in energy use in existing buildings. Tracking of achievement of carbon neutral new construction will be supported by the development of building labelling programs outlined above.

Greenest City 2020 Action Plan - 09212 58
Goal 4 ‐ Green Transportation 1. GOAL AND TARGETS Long Term Goal #4: Make walking, cycling, and public transit preferred transportation options 2020 Target 1: Make the majority of trips (over 50%) on foot, bicycle, and public transit 2020 Target 2: Reduce distance driven per resident 20% from 2007 levels Accountability: Director of Transportation and Director of Planning 2. BACKGROUND 2.1 Context Great green cities are places where walking and cycling are the safest and most convenient ways of getting around, and transit is fast, frequent, reliable, and accessible to everyone. Encouraging sustainable transportation makes sense for many reasons:
Health: Sustainable transportation choices mean healthier and more active citizens, cleaner air, and reduced accident risk, resulting in higher quality of life and significantly reduced public healthcare costs.
Resiliency: Great transportation cities have the capacity and flexibility to host big events and the ability to respond to the unexpected. They are also better prepared to deal with increasing fuel prices, since they are less reliant on fossil fuels.
Affordability: Sustainable transportation costs a lot less than driving, especially if the need to own a car is reduced. Households that go car‐light or car‐free save thousands of dollars each year–money that can be spent on housing or in the local economy.
Community: Cities that focus on moving people rather than cars have more vibrant public spaces, and provide richer cultural experiences and more opportunities for social interaction.
Economy: Sustainable transportation choices support a strong economy by enabling the exchange of goods, services, and ideas throughout the city. This positions Vancouver as a place where the world wants to live, work, and do business, and supports our role as a Pacific gateway. It also increases our reputation as a tourism destination, creating jobs and opportunities for residents.
Environment: Great transportation cities are less reliant on motor vehicles, which are among the largest sources of greenhouse gases and other pollutants. In Vancouver, light duty vehicles accounted for over 30% of greenhouse gases in 2008. Sustainable transportation choices help us clean our air, reduce our carbon footprint, and lead in the fight against climate change. Great transportation cities are also compact places, allowing for preservation and restoration of agricultural lands and ecologically sensitive areas throughout the region.
The strategies and actions contained in this chapter will inform and help direct the upcoming transportation plan update, active transportation master plan, and related work. In addition, there are numerous pilot projects and initiatives which could be launched in the short term. Many of these initiatives will require support from partners, outside agencies, and the citizens of Vancouver in order to succeed. Programs and infrastructure that focus on mobility are only part of the story–transportation and land use go hand in hand. Good land use can reduce the distance people travel and support more sustainable choices like walking and cycling by bringing people closer to their daily destinations. Building complete communities that put people close to jobs, schools, services, amenities, and transit will continue to be a key strategy as Vancouver moves forward.
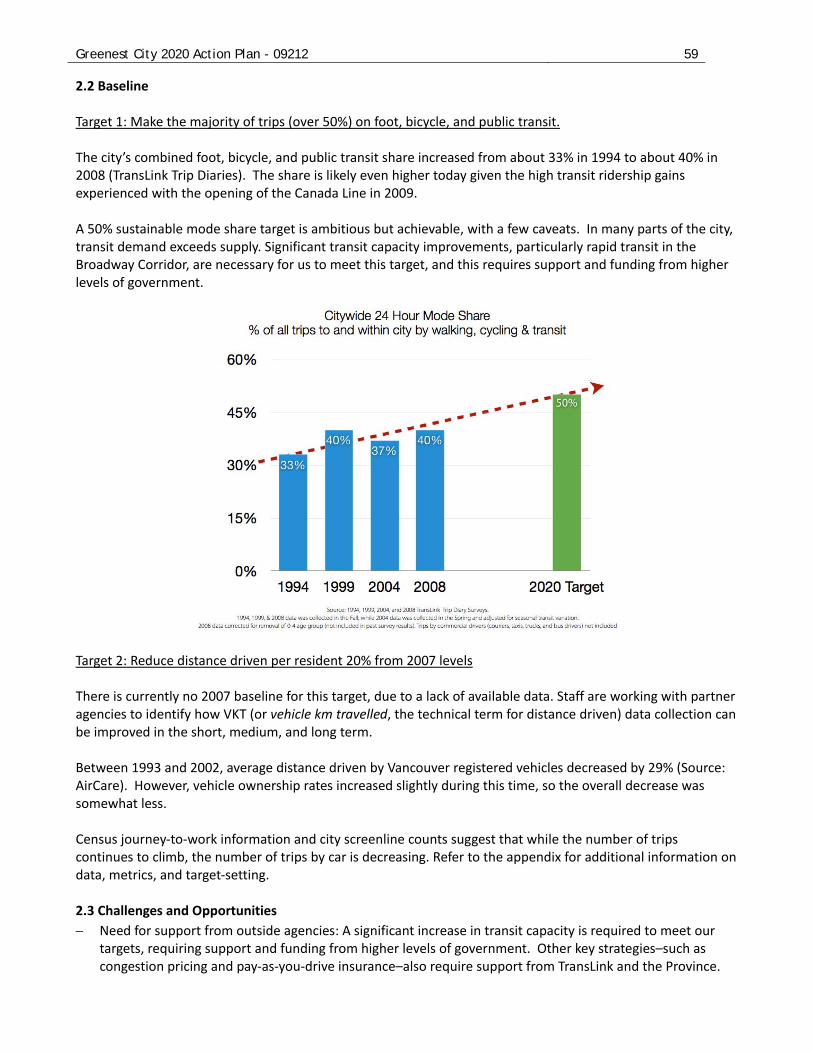
Greenest City 2020 Action Plan - 09212 59
2.2 Baseline Target 1: Make the majority of trips (over 50%) on foot, bicycle, and public transit.
The city’s combined foot, bicycle, and public transit share increased from about 33% in 1994 to about 40% in 2008 (TransLink Trip Diaries). The share is likely even higher today given the high transit ridership gains experienced with the opening of the Canada Line in 2009. A 50% sustainable mode share target is ambitious but achievable, with a few caveats. In many parts of the city, transit demand exceeds supply. Significant transit capacity improvements, particularly rapid transit in the Broadway Corridor, are necessary for us to meet this target, and this requires support and funding from higher levels of government.
Target 2: Reduce distance driven per resident 20% from 2007 levels There is currently no 2007 baseline for this target, due to a lack of available data. Staff are working with partner agencies to identify how VKT (or vehicle km travelled, the technical term for distance driven) data collection can be improved in the short, medium, and long term. Between 1993 and 2002, average distance driven by Vancouver registered vehicles decreased by 29% (Source: AirCare). However, vehicle ownership rates increased slightly during this time, so the overall decrease was somewhat less. Census journey‐to‐work information and city screenline counts suggest that while the number of trips continues to climb, the number of trips by car is decreasing. Refer to the appendix for additional information on data, metrics, and target‐setting.
2.3 Challenges and Opportunities
Need for support from outside agencies: A significant increase in transit capacity is required to meet our targets, requiring support and funding from higher levels of government. Other key strategies–such as congestion pricing and pay‐as‐you‐drive insurance–also require support from TransLink and the Province.

Greenest City 2020 Action Plan - 09212 60
Continued commitment to reallocate road space is required: Many key actions, including improving the pedestrian realm, building a complete and attractive cycling network, improving transit capacity and reliability, and creating vibrant public spaces, will require further road space reallocation from the private automobile.
Need for improved monitoring, metrics, and modelling: Limited data availability and reliability make it difficult to set the right targets and track progress. Current modelling tools do not allow for accurate forecasting of active modes and GHG emissions. Improved data collection, monitoring, and modelling are a big part of the task ahead, and also require support from outside agencies.
3. STRATEGIES AND ACTIONS 3.1 Highest Priority Short Term Actions (3 years):
1. Update the City’s transportation plan and develop a more detailed active transportation master plan, supporting and building upon the Greenest City transportation goals, targets, and strategies noted here, and taking forward for consideration more detailed ideas gathered through the Greenest City consultation process.
2. Develop a pedestrian safety study and action plan to identify opportunities to improve safety through engineering, education, and enforcement measures.
3. Support transportation and active transportation planning with land use policies that enable the City to meet mobility targets.
4. Continue to work with partners to deliver high capacity, fast, frequent, and reliable rapid transit for the Broadway Corridor from Commercial Drive to UBC.
5. Launch a public bicycle sharing program. 3.2 Strategies The strategies below will help guide the City’s transportation plan update and active transportation master plan, as well as related work. In addition, many detailed actions have been collected for each strategy (see Section 5). Some of these actions are already underway, while others will be taken forward for consideration in the more detailed plans noted above. Because the next step in implementing the GCAP for green transportation is already underway – the development of the 2040 transportation plan and active transportation master plan – this section of the GCAP takes a slightly different format than the others. Strategy 1 – Land Use. Support shorter trips and sustainable transportation choices through: mixed land use; pedestrian‐oriented design; densities that support walking, cycling, and transit; and new housing choices that put the majority of residents close to jobs, schools, recreation, and transit. Continue to plan for an appropriate land use mix and a high‐quality pedestrian‐oriented realm throughout
Vancouver, where most services and amenities—such as grocery stores, schools, daycare, parks, community centres, and transit—are within a safe, enjoyable 10 minute walk from where people live.
Plan for new development in ways that support existing and new transit infrastructure, while recognizing local context.
Advance new housing choices in walkable neighbourhoods to reduce household and transportation costs for low‐ and middle‐income households.
Strategy 2 – Walking and Cycling. Make active transportation choices such as walking and cycling feel safe, convenient, comfortable, and fun for people of all ages and abilities.
Build high‐quality, pedestrian‐oriented streets and sidewalks that feel safe, interesting, and comfortable, while recognizing varying street function and supporting local character.

Greenest City 2020 Action Plan - 09212 61
Improve pedestrian safety and accessibility through engineering, education, and enforcement measures.
Expand programs and infrastructure to create vibrant temporary and permanent pedestrian public spaces.
Consider establishing car‐free and/or pedestrian‐priority corridors in the city centre. Develop a complete cycling network that feels safe and attractive to all, including children, seniors, and
novice cyclists.
Provide an abundant supply of the right mix of bicycle parking and end‐of‐trip facilities.
Improve integration of cycling and transit.
Support cycling through programs that educate and encourage, and through new legislation and enforcement approaches.
Design facilities that can accommodate other forms of active transportation, as well as walking and cycling. Strategy 3 – Transit. Support transit improvements to increase capacity and ensure service that is fast, frequent, reliable, fully accessible, and comfortable.
Work with TransLink and the Province to deliver key transit improvements.
Support transit service improvements through public realm design (such as bus and pedestrian bulges, and street furniture), and through transit priority measures such as lane and signal prioritization.
Plan for new development in ways that support existing and new transit infrastructure, while recognizing local context.
Improve integration of transit and active transportation.
Advocate for legislative changes to enable new financing mechanisms to support an increase in transit service.
Consider piloting a community transit pass program for residents who live near transit.
Strategy 4 – Demand Management. Advance policies that make it easier to drive less, and help reduce automobile use and ownership.
Advance parking policies that encourage a reduction in vehicle ownership and driving, support sustainable transportation choices, and increase housing affordability near transit.
Reallocate road space to support more sustainable modes, while maintaining access for services, deliveries, and goods movement.
Advocate for provincial legislative changes that support reduced driving.
Work with TransLink and other partners to increase telework, live‐work, flexible hours, and other programs that reduce the need for some trips.
Expand programs to support personal and company car‐sharing. Strategy 5 – Low Carbon Vehicles. Accelerate the shift to low‐ and zero‐ emissions vehicles.
Ensure charging and fuelling infrastructure is in place to support early adoption of electric vehicles.
Support early deployment of electric vehicles.
Integrate City electric vehicle planning with the public, institutes and local green industry. Strategy 6 – Goods Movement. Maintain access for services, and work with partners to develop a sustainable urban goods movement strategy that supports a growing economy while reducing GHG emissions related to goods movement through and within Vancouver.
Protect rail corridors and increase rail‐based goods movement capacity.
Encourage ‘right‐sizing’ of delivery and service vehicles, including smaller vehicles that allow for more pedestrian‐scaled environments, and larger vehicles that reduce CO2 production for larger loads.
Promote low impact goods movement in urban areas (e.g. active transportation, low carbon fleets).

Greenest City 2020 Action Plan - 09212 62
3.3 Wedge Analysis
Preliminary staff estimates suggest that it is possible to increases the active transportation share of all trips in the City to 25% by 2020. To reach the 50% target, the transit share must also increase to 25%. Given that transit demand currently exceeds supply in many parts of the city, reaching this target will require significant improvements in transit capacity.
4. CROSS REFERENCE Greenest City Plans:
Access to Nature: Increase access to nature by building new greenways, upgrade portions of Council‐approved bikeways to greenways, and converting street right‐of‐way into mini‐parks. More green space and pedestrian amenities within a five‐minute walk of every residence will support walking. Enhanced bikeways and greenways will encourage walking and cycling as a sustainable transportation choice. Converting street right‐of‐way into mini‐parks could also be an effective traffic‐calming measure to protect neighbourhood bike routes from through traffic and make them feel safer to a wider range of users.
City of Vancouver Plans:
Transportation Plan Update (2011‐2012)
Active Transportation Master Plan (2012)
Pedestrian Safety Study & Action Plan (2011)
Viaducts Study (2011)
Cambie Corridor Plan (2011)
Viva Vancouver
2012‐2014 Capital Plan
Future updates to community and citywide plans

Greenest City 2020 Action Plan - 09212 63
5. DETAILED IDEAS FOR CONSIDERATION IN TRANSPORTATION PLAN Many detailed ideas and actions emerged through the Greenest City engagement process, and are highlighted under the Greenest City Green Transportation strategies below. Some of these actions are already underway. Others will be taken forward for consideration as the more detailed transportation plan update, active transportation master plan, and related plans are developed in 2011‐2012. Strategy 1 – Land Use:
Target neighbourhoods that score low on the walkability index, for example by adding specific amenities (e.g. grocery stores) to underserved neighbourhoods, or by adding pedestrian connections to make areas more accessible.
Strategy 2 – Walking and Cycling: Build high‐quality, pedestrian‐oriented streets and sidewalks that feel safe, interesting, and comfortable, while recognizing varying street function and supporting local character.
Develop street typologies for redevelopment and construction projects, highlighting features such as sidewalk widths, accessibility, pedestrian lighting, street furniture, public art, landscaping and street trees, wayfinding, weather protection, paving materials, and gathering spaces.
Identify and prioritize measures to address missing links (e.g. incomplete sidewalks, missing accessibility features), opportunities for new connections to increase pedestrian connectivity, and locations for sidewalk widening and maintenance.
Make alleys and laneways safe and attractive pedestrian environments, while maintaining essential functions (e.g. access for loading, parking, and waste collection). Examples include giving special consideration to laneway public realm in new development, piloting infrastructure improvements in existing high‐density neighbourhoods, and considering laneways for temporary or recurring animation activities.
Create ‘pedestrian greenways’ by upgrading existing neighbourhood bike routes to include greenway features for pedestrians (e.g. pedestrian lighting, wayfinding, public seating, and water fountains).
Improve pedestrian safety through engineering, education, and enforcement measures.
Develop a pedestrian safety study and action plan to identify opportunities to improve safety through engineering, education, and enforcement measures.
Ensure pedestrian concerns are represented through city advisory committees (e.g. through a new pedestrian advisory committee, or an expanded active transportation advisory committee).
Add pedestrian count‐down signals at key intersections to improve safety at crossings.
Develop pilot projects to promote pedestrian safety in areas where there are high instances of pedestrian‐cycle or pedestrian‐car collisions.
Investigate support for residents for whom walking is the primary mode of travel (e.g. City‐supported foot clinics for low income individuals, cart storage, better binning carts).
Expand programs and infrastructure to create vibrant temporary and permanent pedestrian public spaces.
Enable and support creative uses of the street by the community through evolving trial programs (e.g. Summer Spaces, Rediscover Granville, and other programs through the Viva Vancouver initiative), flexible guidelines and processes, idea toolkits, and funding partnerships.
Launch a ‘pavement to plazas’ trial program to transform under‐utilized road space or on‐street parking into mini‐plazas or sidewalk extensions. Successful trials could be considered for permanent reclamation.

Greenest City 2020 Action Plan - 09212 64
Develop neighbourhood public plazas or gathering spaces by reallocating pavement to people‐friendly uses, for example by closing side streets to cars at commercial intersections to create street‐end plazas. Consider design features that support and encourage use in rainy weather.
Support temporary recurring street events with movable, semi‐permanent or retractable infrastructure (e.g. retractable bollards).
Consider establishing car‐free and/or pedestrian‐priority corridors in the city centre.
Develop at least one car‐free corridor in the city centre, building on the success of the Olympics and Rediscover Granville Street. Possible first steps include identifying potential locations through the transportation plan update, and/or initiating a design competition.
Create pedestrian‐priority streets that mix pedestrians with other forms of motorized and non‐motorized traffic on a single shared surface with priority given to pedestrians. Key elements include reduced speed limits, enhanced traffic calming, street furniture, and design details that invite pedestrians to use the entire street.
Develop a complete cycling network that feels safe and attractive to all, including children, seniors, and novice cyclists.
For routes on arterials and other busy streets, physically separate cyclists from motor traffic and pedestrians by curbs, planters, parked cars, or other barriers.
For quieter neighbourhood routes, enhance safety through improved traffic calming, including reduced motor vehicle speed limits and limited motor vehicle access / through traffic.
Review the network for completeness, and address significant gaps and barriers.
Make the bikeway network easy to navigate with consistent, legible wayfinding and information.
Connect all schools and community centres to the existing greenway system.
Provide an abundant supply of the right mix of bicycle parking and end‐of‐trip facilities.
Ensure new developments have sufficient and conveniently‐located secure parking to meet or exceed cycling mode share targets.
Develop a retro‐fit program for existing buildings, e.g. by encouraging conversion of motor vehicle parking spaces to secure bicycle storage, and by making it easier to retrofit buildings with other end‐of‐trip facilities.
Provide abundant and secure bicycle parking at transit stations and other key locations (e.g. Downtown, Granville Island).
Consider requiring bicycle valet services at corporate‐sponsored and community events.
Provide secure and conveniently located bicycle parking near school entrances.
Increase the supply of on‐street bicycle parking to support mode share targets, using approaches that allow for ample pedestrian space (e.g. through the use of bike corrals).
Sponsor a public competition to design new racks in neighbourhoods throughout the city.
Improve integration of cycling and transit.
Provide abundant, convenient, and secure bicycle parking at all transportation hubs (e.g. SkyTrain stations).
Ensure safe connections to transit stations from the existing bicycle network.
Support measures to facilitate on‐board carrying capacity of bicycles on transit vehicles.
Implement a bike‐sharing program in the Downtown and other high cycling‐potential areas.
Focus on areas with high cycling potential and locations that maximize integration with transit.
Coordinate with cycling route safety improvements, as well as cycling education and skills programs.
Ensure the system can be expanded to other Metro Vancouver municipalities.
Greenest City 2020 Action Plan - 09212 65
Support cycling through programs that educate and encourage, and through new legislation and enforcement approaches.
Work with the Province to establish and enforce road safety regulations to protect vulnerable road users including pedestrians and cyclists (e.g. reduced speed limits, driver training).
Support school programs that teach students to cycle in traffic, and work with the school board and Province to make commuter cycling skills a standard part of the curriculum.
Consider designating special buffer zones around schools to encourage active transportation and restrict driving (e.g. Copenhagen proposed bylaw for car‐free zones around schools).
Support programs that promote cycling in communities under‐represented in today’s cycling culture. Design facilities that can accommodate other forms of active transportation, as well as walking and cycling. Strategy 3 – Transit: Work with TransLink and the Province to deliver transit improvements including:
Fast, frequent, high‐capacity, and reliable rapid transit for the Broadway Corridor between Commercial Drive and UBC;
The Downtown Streetcar initiative;
Bus rapid transit routes on Hastings Street and on 41st Avenue;
Improved local bus frequency, capacity, and reliability on high‐demand routes; and
Improved West Coast Express and Seabus services. Support transit service improvements through public realm design (such as bus and pedestrian bulges, and street furniture), and through lane and signal prioritization.
Ensure high‐quality street furniture—such as shelters, benches, litter and recycling containers—is provided at all bus stops where there is sufficient sidewalk space.
Work with TransLink to support the provision of real‐time information at transit stops.
Improve transit reliability through bus bulges, queue jumpers, signal priority, and lane priority or reallocation where appropriate.
Work with TransLink, provincial and federal governments, and cross‐border agencies to improve inter‐regional commuter rail service (e.g. Amtrak service).
Improve integration of transit and active transportation.
Provide abundant, convenient, and secure bicycle parking at all transportation hubs (e.g. SkyTrain stations).
Ensure safe connections to transit stations from the existing bicycle network.
Support measures to facilitate on‐board carrying capacity of bicycles on transit vehicles.
Implement a bike‐sharing program.
Advocate for legislative changes to enable new financing mechanisms to support an increase in transit service, including:
Road and/or congestion pricing.
Vehicle levies.
Consider piloting a community transit pass program for residents who live near transit (e.g. SFU UniverCity Pass program).
Demonstrate feasibility by piloting a community transit pass program in a City‐controlled project(s).
Consider encouraging transit pass programs in other development through negotiated relaxations in parking requirements.

Greenest City 2020 Action Plan - 09212 66
Strategy 4 – Demand Management: Advance parking policies that encourage a reduction in vehicle ownership and driving, support sustainable transportation choices, and increase housing affordability near transit.
Continue to reduce off‐street parking requirements, and implement maximum allowances.
Consider eliminating off‐street parking requirements in areas well‐served by transit, in conjunction with strategies to mitigate parking spillover concerns.
Strengthen requirements for demand management programs in major developments, and explore strategies that replace parking with programs that reduce driving demand (e.g. community pass transit programs, car‐sharing, payment‐in‐lieu).
Require parking and housing costs to be unbundled in new multi‐family development in areas well‐served by transit.
Redesign the residential parking permit program to address parking spillover concerns associated with off‐street reductions and to better reflect actual street space value (e.g. gradual implementation of market pricing, limitations on the number of permits per household, escalating costs for additional permits).
Initiate city‐wide parking policies to manage curb space to reduce cruising and congestion caused by drivers searching for an available space (e.g. variable‐priced parking – e.g. San Francisco pilot).
Consider a neighbourhood parking benefit district pilot project, where a portion of parking revenue is used to fund local improvements and nearby amenities.
Provide real‐time availability information for City‐owned off‐street parking (e.g. through electronic signage, mobile device applications).
Design parking spaces and modify related codes and policy so that spaces can be converted to other uses in the future (e.g. bicycle parking, storage).
Implement design guidelines in larger developments to encourage mechanical parking and/or multiple levels of security to resolve security issues around on‐site car‐sharing or leasing spaces to non‐residents.
Consider approaching parking as a shared neighbourhood resource for larger projects, to allow for increased efficiency through better management (making shared use, market pricing, car‐sharing, and unbundling easier).
Reallocate road space to support more sustainable modes.
Where feasible and appropriate, gradually reallocate road space to improve pedestrian realm, create separated cycling facilities, and/or increase transit reliability, while recognizing the importance of maintaining efficient goods movement and essential vehicle access.
Advocate for provincial legislative changes that support reduced driving.
Support pay‐as‐you‐drive insurance premiums that reward car owners for driving less.
Support road and/or congestion pricing, with revenue directed towards transit improvements. Work with TransLink and other partners to increase telework, live‐work, flexible hours, and other programs that eliminate the need for some trips.
Review existing bylaw and zoning requirements to remove barriers to work at home; review property tax implications.
Encourage Vancouver residents and businesses to participate in TransLink’s TravelSmart program.
Consider piloting a SmartWork approach in city facilities (e.g. incorporating telepresence technology), and making some locations available to outside individuals or groups.
Expand programs to support personal and company car‐sharing.
Expand requirements for car‐sharing in new development.

Greenest City 2020 Action Plan - 09212 67
Consider parking design approaches in new development (e.g. multiple levels of security, parking as a shared neighbourhood resource) to make car‐sharing easier.
Strategy 5 – Low Carbon Vehicles: Even with an increase in walking, cycling, and transit, there will still be vehicles on the road for the foreseeable future. Adoption of clean vehicles will be critical to successfully meet the 2020 greenhouse gas emissions targets. At least 15 percent of new vehicles in Vancouver should be plug‐in electric or fuel cell electric vehicles by 2020. Ensure charging and fuelling infrastructure is in place to support early adoption of electric vehicles.
Adopt the Project Get Ready Vancouver recommended targets for number and location of charging infrastructure at home, work and on‐the‐go, with a priority on reducing range anxiety.
Require all new developments to include electric vehicle charging infrastructure.
Develop a retrofit program for existing buildings, for example by supporting provincial and federal government incentives programs, creating a communication plan for stakeholders (property owners, developers) to help them understand the process and resources available to them, and streamlining and minimizing costs for residential and commercial permitting processes.
Partner with private industry to provide charging in retail locations, existing parking lots, and other underutilized land.
Market access to charging infrastructure using web tools such as Google.
Advocate for new provincial and federal government incentives as outlines by Electric Mobility Canada in their proposal titled Driving the Rapid Adoption of Electric Vehicles in Canada.
Develop condominium guidelines with bylaw or rule examples to ensure fair access to power for all condo residents.
Consider piloting hydrogen fuelling stations for City fuel cell vehicles (when those vehicles come to market).
Ensure that charging infrastructure is integrated with the BC Hydro electric grid.
Support early deployment of electric vehicles.
Convert the City’s own fleet to plug‐in electric or fuel cell electric vehicles, and partner with BC Hydro and the Province to motivate automakers to bring these vehicles to our broader community as soon as possible.
Work with partners to assess local demand for low carbon vehicles and communicate results to automakers and city planners.
Support electric‐assist bicycles as part of broader cycling and low carbon vehicle strategies, for example by tailoring charging infrastructure, communications, and incentives plans.
Integrate City electric vehicle planning with the public, institutes and local green industry.
Create a cross‐functional low carbon transport committee at the City.
Work with NGOs to communicate low carbon vehicle best practices between municipal groups.
Create a public engagement and community education plan for electric vehicles.
Ensure electric vehicle adoption and charging infrastructure planning is integrated with research and educational goals of local academic institutions such as BCIT, UBC and SFU.
Support the growth of local green transportation initiatives by considering public‐private partnerships and pilot initiatives.
Establish insurance awareness and commercial fleet maintenance savings programs to support market transformation.

Greenest City 2020 Action Plan - 09212 68
Strategy 6 – Goods Movement: Transportation plays a key role in supporting Vancouver’s economic vitality. Opportunities exist to improve goods movement efficiency within and through our city while reducing our carbon footprint.
Partner with GreenfleetsBC and all levels of government to introduce low carbon fleet technologies, require local fleet route optimization, and potentially clean vehicle corridors.
Introduce a program to provide paid parking for large and over‐size vehicles in underused or industrial street areas, to reduce operators’ need to dead‐head to and from suburban areas.
Introduce paid loading zones to better value on‐street space and facilitate more efficient loading operation.
Support local production and distribution to reduce the need for transport of goods, including: incentives for locally produced and distributed goods; bulk purchasing opportunities to bring together and support local producers (including community
shared agriculture); and food production in the city, including roof‐top gardens and food production buildings.
6. EXTERNAL ADVISORY COMMITTEE MEMBERSHIP
Kevin Volk Senior Manager, Programs Transportation Policy Branch, BC Ministry of Transportation
Raymond Kan/Eve Hou Senior Planner, Metro Vancouver
Greg Yeomans Manager, Policy & Plans, TransLink
Magaret Mahan Executive Director, Better Environmentally Sound Transportation
Keith Ippel Executive Director, Vancouver Area Cycling Coalition
Karen Parusel/Karen Fung Transportation Coordinator, Vancouver Public Space Network
Adam Cooper Program Coordinator, UBC TREK Program Centre, UBC
Larry Frank/Andrew Devlin Bombardier Chair in Sustainable Transportation, School of Community & Regional Planning, UBC
Gordon Price Director, City Program, SFU
Kevin Millsip Sustainability Coordinator, Vancouver School Board
Alice Miro Project Manager, CLASP Initiative, Built Environment and Health, Heart & Stroke Foundation
Heather McKay/Sara Lusina/ Azaria Botta
Vancouver Coastal Health
David Feldhaus Vancouver Electric Vehicle Association
Mike Elwood Chair, Electric Mobility Canada
7. STAFF WORKING GROUP MEMBERSHIP Jerry Dobrovolny (Chair) Transportation
Brent Toderian (Chair) Planning
Paul Krueger (Staff Lead) Planning
Brian Beck Sustainability
Dale Bracewell Transportation
Lon LaClaire Transportation
Neal LaMontagne Planning

Greenest City 2020 Action Plan - 09212 69
Andrew Pask Social Policy
Jo Fung Transportation
Maggie Baynham UBC Greenest City Scholar
Tate White UBC Greenest City Scholar 8. PUBLIC ENGAGEMENT SUMMARY Phase 1 “Travel predominately by foot, bike and transit” had the most ideas on the Talk Green to Us forum with 167 ideas and 7375 votes. The top ideas for this target were:
Ideas Number of Votes
Cycling for Everyone: Develop a complete cycling network that feels safe and attractive to all
1063
Build the Downtown Streetcar Network 544
Create more affordable family housing within easy walking/biking/transit radius of downtown
409
Repeal mandatory bike helmet legislation 408
Reclaim road and/or parking space to create plazas and parklets 394
Provide abundant & secure bicycle parking at transit stations & other key locations
360
The second Green Transportation target “encourage shorter vehicle trips” received 16 ideas and 995 votes. The top ideas were:
Ideas Number of Votes
Build complete, walkable neighbourhoods interconnected by great transit and cycling routes
606
Support Pay‐As‐You‐Drive (PAYD) auto insurance premiums to reward those who drive little
202
No Car City: Measure and reduce car passenger miles: If we drive less, a green city can emerge.
45
Walkable schools.....don't close existing schools 21
Use school buildings as evening community learning centres 16
Phase 2 The majority of feedback was positive, with some strategies receiving more comment than others. The following overview outlines the kinds of comments we received most frequently in response to questions such as “What actions are you most excited about?” and “What will it take for these strategies to succeed?” In several cases, respondents made specific recommendations for policies or initiatives. Transit needs to be convenient, frequent and accessible (This was the topic area that received the most attention.) Lower fares, transit too expensive Run translink services 24 hours, Extend time when skytrain runs (accessibility) More rapid transit in suburban areas, Meet suburban commuter needs, need a regional network Rapid transit on Broadway corridor Improve transit system, reliable, on‐time, reasonable hours, affordable

Greenest City 2020 Action Plan - 09212 70
Public transit already at capacity and does not run late enough. Integrate translink with other forms of transportation, Mini buses to supplement main transit, Need a
continuum between cycling and transit and traffic Accessibility of transit passes is an issue (ie a create family pass) Bring back streetcars There were also specific recommendations about implementing rapid transit and following models used in
cities like Curitiba. Cycling
General support for increased safety and infrastructure for cyclists, including: Secure bike parking, bike sharing, dedicated bike lanes and a complete cycling network
Revisit helmet laws (came up several times, seen as a barrier to bike sharing and bike use. One respondent referenced a study that showed decreased safety linked to helmet laws.)
Demand management
Road space allocation: signal priority for buses
Pollution tax for cars
Free transit, “roads are ‘free’ for users”
Reduce speed limit for cars, Reduce vehicle speeds
“Take space and benefits away from cars”
Reduce easy access to on‐street parking and requirements for vehicle spaces in new developments.
Introduce road pricing
Need more parking hubs so people have a place to park while using alternatives for short haul trips Goods movement strategy
There was a lot of support for a sustainable goods movement strategy. Here are a few ideas that rose to the top.
Focus on addressing the ‘last mile’ problem of goods movement
Use short haul alternative vehicles, cargo bikes
Commuter vehicles could be a green business
Support local production to reduce the need for transportation of goods. Low Carbon Vehicles
EV charging and infrastructure received a lot of comments online, with suggestions for creating charging stations in homes and throughout the city.
We also received a Do‐It‐Yourself consultation report from community members who spent a lot of time on the topic of electric vehicles. Their comments are included in the last slide
Engage industry in development of EV infrastructure
Concern about lack of hard targets for EV and infrastructure
Need more regulations and support for electric bikes Walking and Public Realm
Lots of support for Mixed/multi‐use zoning that encourages more walkable neighbourhoods.
Support for improvement to public realm/spaces
“More local markets in neighbourhoods to encourage reduced trips.” Consultation, Engagement and Education
Consult with business owners impacted by pedestrian only streets

Greenest City 2020 Action Plan - 09212 71
Concern about discouraging use of cars, without good transit options in place and the effect this will have on businesses.
Engage private sector to support employee transportation
Concern that social marketing, education for behaviour change is not mentioned, invest in professional educators
Some support for incentives for those who car‐pool or drive ‘eco‐friendly’ cars.
Re‐brand green transportation as more attractive. Issue of car culture competing with negative perceptions of transit
Other Comments
“City shouldn’t underestimate its role”
Recommend fewer bus stops (more blocks between bus stops) so transit can move faster through the city
Reallocate money from roadway expansion
Cancel Gateway project
Work with province to create a Transportation Act instead of Motor Vehicle Act
Reduce costs of infrastructure and permitting for new/innovative ideas
Include more in the plan about boat and rail transportation Concerns
Increased transportation infrastructure may lead to increased fares or costs for the public
Some resistance to taxing drivers if transit system wasn’t adequate to accommodate them
Some saw bike routes not being used frequently. Electric Vehicles
Participants would like to see measurable goals and strategies to bring Vancouver’s electric vehicle strategy in line with the other leading North American (or even Asian) cities. The existing plan is weak and unsubstantial, and we would like to see Vancouver taking a much clearer and stronger lead advancing electric charging infrastructure and educating Vancouverites on the benefits of buying electric vehicles. This includes EVs, plug‐in hybrids, but also EVs for transport of goods, and slow‐moving traffic such as E‐scooters and E‐bikes. There are 2 electric scooter owners in our group, and they both feel strongly that this is an excellent option for families who need a second vehicle, but there is little education, incentives out there for citizens. There are also many regulatory “grey areas”, in that cars and cyclists alike do not know how to treat the slower moving E‐vehicles. Our group suggested that there need to be clear strategies for encouraging and regulating slow‐moving traffic, including possibly designated lanes and other infrastructure (e.g. level 2 chargers, some level 3 chargers as well), social marketing and education from the city, clarity on laws and safety issues for operators and motorists and cyclists, possibly specific training and licensing for such slow‐moving e‐vehicles, and E‐motorcycle parking incentives and spaces.
Related to slower vehicles, a change of the speed limit in Vancouver to 40 km/hour would also reduce incentives to cars, increase safety for pedestrians and cyclists, and increase the quality of life in Vancouver.
In terns of infrastructure for electric vehicles, our group identified concerns that there were no specific plans for level 2 or level 3 charging infrastructure to be “rolled out” in Vancouver, and we suggest a strategy and actions to ensure charging infrastructure on all major routs, in each neigbourhood or high density area, and clear targets to meet this goal. Such charging infrastructure could also be synergized with laneway developments, car and bike sharing initiatives or other strategies.
Need for regional network in Greater Vancouver as a target strategy”

Greenest City 2020 Action Plan - 09212 72
9. DETAILED METHODOLOGY Target 1 (mode share): Make the majority of trips (over 50%) on foot, bicycle, and public transit. TransLink Regional Trip Diary results suggest that the city’s combined foot, bicycle, and public transit share increased from about 33% in 1994 to about 40% in 2008. The share is likely even higher today given the high transit ridership gains experienced with the opening of the Canada Line in 2009. Given this trend, City staff confirmed the recommended 50% GCAT target to be ambitious but achievable, but only if significantly transit capacity improvements are delivered. This will require support and funding from TransLink and the Province. Without increased transit supply, a 45% target is more reasonable. Target 2 (VKT): Reduce distance driven per resident 20% from 2007 levels. In addition to confirming the original GCAT target, staff added a second target around vehicle km travelled, or VKT. VKT is important because it reflects not only improvements in mode choice, but also reductions in trip distance and number of trips–which speak to improved land use decisions and directly impact GHG emissions. The VKT metric also accounts for trips 365 days of the year. Staff chose a 20% reduction by 2020—to be confirmed in the city transportation plan update—based on detailed preliminary work done in 2009 by the regional transportation target working group (a group led by Metro Vancouver that included representatives from TransLink, the City, and other municipalities). The group established preliminary regional targets of 10 to 15% per capita reductions from 2007 levels by 2021, and 25 to 30% by 2041. The 20% city target is in line with these numbers, albeit a little more ambitious because it is for our residents only. There is currently no 2007 baseline due to a lack of available data. Some historical information is available through AirCare, which suggests a 29% decrease in average distance driven in the City between 1993 and 2002. However, vehicle ownership rates increased slightly during this time, so the overall decrease was somewhat less. Staff will use future data sources as they become available, in conjunction with historical AirCare data, to backcast a 2007 baseline. Data improvements are needed to monitor progress and set more detailed targets For both targets, there are significant issues with source data and forecasting tools. Improvements are needed to monitor progress and set more detailed targets. At present, the only source of data for 24‐hour mode share is TransLink’s regional trip diary, conducted about every five years, and only for residents for a ‘typical weekday’. Because of limited sample size, this data becomes less reliable as it is broken down to the municipal level. To further complicate matters, the survey methodology has varied considerably over the years, making it difficult to compare numbers year‐to‐year. The City cannot collect this data without the support of the region, since travel patterns are regional in nature. Tracking VKT is even more challenging. While there are no solid data sources for VKT at present, the future is more promising. Odometer readings are one approach, and would be possible with support from the Province and ICBC. Improved regional travel surveys are another possibility. Staff from Metro Vancouver, TransLink, and the Province are currently studying how VKT data collection can be improved in the short, medium, and long term, and are planning to report back with issues and recommendations.

Greenest City 2020 Action Plan - 09212 73
Given the challenges with the regional trip diary, it is helpful to look at other travel data sources. One such source is the Census, conducted every 5 years, which provides information on commute trips. While commute trips only account for about one‐third of all trips, they are particularly significant since they are more likely to take place during periods when congestion is greatest. According to 1996 and 2006 Census reports, while the absolute number of commute trips to and within the city have risen–hardly surprising given the growth in population and employment–the number of commute trips by car has fallen (See Figure 1). Changes to the way the federal government collects Census data (i.e. replacement of the mandatory long form with a new volunteer survey) will make future trend analysis more difficult. Cordon counts are another source of information. Almost every year for the past 30 years, the city staff have counted the number of vehicles entering the city and the downtown. The numbers support the Census findings: while the number of trips overall has gone up along with population and employment, the number of trips by car has decreased (See Figure 2). Forecasting transportation mode share, kilometres travelled, and emissions for planning and target setting is currently limited by the lack of a regional transportation model that accounts for 24‐hour travel, impacts of induced land use, and trip chaining. Improving data collection, monitoring, and forecasting is an important part of the work ahead, and requires the support of regional and provincial partners, particularly since travel behaviour is regional in nature. Transportation‐related targets, sub‐targets, and indicators will be explored further through the development of the transportation plan update and active transportation master plan.
Figure 4. Journey‐to‐Work Trips to and within the City of Vancouver, 1996 vs. 2006

Greenest City 2020 Action Plan - 09212 74
Figure 5. Population & Job Growth vs. Vehicle Trips, Citywide, 1996‐2011 (24 Hours)

Greenest City 2020 Action Plan - 09212 75
GOAL 5 ‐ ZERO WASTE
1. GOAL AND TARGET Long Term Goal #5: Create zero waste. 2020 Target: Reduce total solid waste going to landfill or incinerator by 50%, from 2008 levels. Accountability: Director – Waste Reduction and Recovery Management
2. BACKGROUND 2.1 Context Canadians produce more solid waste than just about any other country in the world. In the Metro Vancouver region, we generate over 3 million tonnes of solid waste a year. About 55% of this is diverted to recycling, composting, or niche energy recovery. Still, about 1.5 million tonnes is sent to landfill or incinerator annually. The City of Vancouver’s share of landfilled or incinerated waste is about 480,000 tonnes per year – enough to fill a line of garbage trucks parked nose‐to‐tail from City Hall to Kamloops. Harvesting, mining, pumping and refining these wasted resources contribute to some of the most pressing environmental issues of our time. Climate change, deforestation, species extinction, and pollution – these and other issues stem from over‐consumption and waste. Zero waste aims to prevent waste and keep resources in circulation. The Zero Waste International Alliance defines zero waste as a goal “to guide people to emulate sustainable natural cycles, where all discarded materials are resources for others to use. Zero waste means designing products and processes to reduce the volume and toxicity of materials, conserve and recover all resources, and to not burn or bury them.” Practically, zero waste can be expressed as a long‐term goal to decrease garbage to landfills or incinerators by 90%. This is no small task, and requires changing behaviours and broader social norms. More importantly, it requires changing the system so that the least wasteful choices are also the most convenient and cost effective choices. Ultimately, zero waste is a guiding principle for moving to a closed‐loop, cradle‐to‐cradle economy where all resources are put to their highest best use. 2.2 Baseline The amount of solid waste to landfill or incinerator from the City of Vancouver is estimated to be roughly 480,000 tonnes in 2008.4 The industrial, commercial and institutional (ICI) sector accounts for more garbage than any other sector at 208,000 tonnes (Figure 1). Residential garbage is next, of which the majority comes from multi‐family residences (“MF”, 71,000 tonnes), followed by single‐family residences (“SF”, 62,000 tonnes) and residential drop off at transfer stations (“RDO”, 35,000 tonnes, of which 90% is estimated to come from SF, 5% each from MF and 5% from ICI). The construction and demolition sector disposes of approximately 97,000 tonnes.
4 This includes 68,645 tonnes of demolition waste used for construction purposes at the Vancouver Landfill.
0
50,000
100,000
150,000
200,000
250,000
Commercial Residential Construction &Demolition
Figure 1. Estimated Amount of Solid Waste to Landfill or Incinerator by Sector in Vancouver (2008)
SF
SF
RDO
MF

Greenest City 2020 Action Plan - 09212 76
2.3 Opportunities and Challenges Compostables. Compostable wastes like food scraps, food‐soiled paper and yard trimmings make up 33% of
the garbage (Figure 2). Capturing the compostables presents the most immediate opportunity to reduce garbage and prevent methane (a significant contributor to climate‐changing greenhouse gases) from being generated in landfills. Collecting and processing compostables offers tremendous potential for creating low‐barrier and high‐tech green jobs, generating bio‐energy and returning nutrients and structural elements to the soil. Metro Vancouver intends to ban compostables from single family (SF) garbage once all municipalities have programs in place, possibly in 2012, and from garbage produced by apartments, condominiums, commercial businesses and institutions in 2015. The challenge will be to ensure the infrastructure is in place in the region to manage compostables within this time frame.
Wood. Wood makes up 19% of total waste disposed from all sectors (Figure 2). About half of total wood disposed is clean, compostable, untreated wood. Key challenges will be to balance incentives for reuse, recycling and energy recovery to ensure wood is put to its highest best use, and to determine management options for painted or treated wood in the long term.
Curbside Recyclables. Despite being banned from landfill or incinerator, recyclables like newsprint, cardboard, paper, and glass, metal and plastic (1,2,4,5) containers make up 12% of total waste disposed (Figure 2). Increasing participation rates will require more education and support, especially for apartments, condominiums and businesses. Metro Vancouver’s regional waste plan also calls for municipalities to enforce disposal bans at the source. To do so, the City may require new authority granted by the Province through an amended Vancouver Charter.
Extended Producer Responsibility (EPR): Over the life of the Greenest City plan, there will be major advancements in EPR. Also known as industry product stewardship or takeback programs, EPR shifts the responsibility for managing discarded products from local governments to the companies that produce them. Under a Canada‐wide Action Plan for EPR developed by the Canadian Council of Ministers of the Environment (CCME),5 the province is committed to working towards EPR programs for electronics, hazardous wastes, mercury‐containing products, automotive products, and packaging and printed paper (including materials recycled in existing curbside programs) by the end of 2015.6 Then, by the end of 2017, the Canada‐wide plan recommends EPR for building products, carpet, furniture and textiles. Together, these products make up nearly 60% of garbage (Figure 2). The City’s ability to meet the zero waste target depends on the province introducing EPR according to the schedule in the Canada‐wide plan.
2020 Target tracking: Waste flows across municipal boundaries and is tracked by Metro Vancouver at the regional level. The 2008 baseline for Vancouver was calculated based on estimated percentages of the region’s residents, jobs and demolition permits based in the city. New methods must be developed to track Vancouver tonnages accurately.
5 Canadian Council of Ministers of the Environment (2009). Canada‐wide Action Plan for Extended Producer Responsibility. 6 British Columbia has already introduced legislation requiring EPR for electronics by 2012 and packaging and printed paper by 2014.
MF

Greenest City 2020 Action Plan - 09212 77
Figure 2: Waste Diversion Opportunities ‐ Total Waste Disposed by All Sectors: Residential, ICI & DLC (2008)
3. STRATEGIES AND ACTIONS 3.1 Highest Priority Short Term Actions (3 year) 1. Collect all compostables from SF residential properties on a weekly basis and introduce every‐other‐week
garbage collection, and pilot compost collection from multi‐family and commercial properties. 2. Develop zero waste education and enforcement strategies for all sectors (single family households,
apartments/condominiums, commercial businesses and institutions) to encourage behaviours that reduce waste, maximize reuse and recycling, and recover resources from the waste stream.
3. Work with the province to expand EPR programs, especially for packaging, printed paper, plastic bags and newsprint.
4. Develop a policy and incentives to encourage deconstruction for renovation and demolition projects.
3.2 Strategies and Short‐ and Medium Term Actions Strategy 1 ‐ Nurture a Zero Waste Culture. The City will nurture a zero waste culture through a combination of inspiration, information, incentives and enforcement, and encourage infrastructure and “assets” that enable zero waste habits. Short Term actions (1‐3 years) Public education & engagement Partner with Metro Vancouver to develop and deliver a zero waste education and behaviour change
program for the public and businesses using community‐based social marketing, social media, traditional media and other methods. Pursue opportunities to collaborate with social enterprises, not‐for‐profits and the arts in developing and delivering these programs.
COMPOSTABLES 33% Food scraps 22% Compostable paper 6% Yard & garden 3% Landclearing debris 1% Pet waste 1%
WOOD 19% Clean compostable wood 8% Wood building products 8% Wood furniture 2% Pallets <2%
CURBSIDE RECYCLABLE 13% Paper 11% Plastic containers (1,2,4,5) 1% Metal containers <1% Glass containers <1%
EXISTING EPR PROGRAMS 4% Beverage containers 1% Computers, TVs, audio/visual 1% Small appliances (begins 2011) <1% All other electronics (begins 2012) 1% Paint, pesticides, solvents, gasoline, pharmaceuticals, used oil <1% Tires <1%
EPR 2015 6% Remaining packaging 6% Other hazardous waste <1%
EPR 2017 13% Building products 8% Textiles 2% Carpet <2% Furniture 1%
EPR NEEDS TO BE PLANNED 8% All other products
ROCKS, SOIL, FINE PARTICLES 4%
Greenest City 2020 Action Plan - 09212 78
Develop an in‐person public engagement program to invite a two‐way dialogue between the City and community groups to advance zero waste. Using multiple methods (workshops, events, conversations), gain input on public policy, and spark public ideas on individual and community actions. Specific efforts will be made to engage Vancouver’s diverse multi‐cultural communities, schools, neighbourhood networks, apartment and condominium residents, building managers, the business community, and the solid waste industry.
Topics and initiatives in the education and engagement programs include: Promoting composting and food waste reduction ‐ all sectors Compost coaches to deliver community‐based social marketing to all sectors in support of the curbside
compostables program, as well as backyard composting for single family residents Promoting recycling to all sectors, with special emphasis on the multi‐family sector Engaging multi‐family residents and building managers to identify and address barriers to multi‐family
recycling. Invite them to demonstrate zero waste buildings and suites. Promoting EPR programs A volunteer corps to coach and share “how‐to” information with neighbours and community groups,
and provide education materials with support by the City A zero waste recognition program to highlight zero waste initiatives being led by individuals,
community groups, businesses and other organizations, and inspire others to take action Explore the possibility of establishing a civic Zero Waste Advisory Committee that advises Council on policy,
programs and projects related to zero waste. Invite organizations and community groups to adopt the 2020 zero waste target for themselves.
Incentives & enforcement
Expand bylaw requirements (insofar as allowable under the Vancouver Charter) and develop a program to enforce disposal bans at the household and business level, as required in Metro Vancouver’s regional waste plan. Targeted materials include: Curbside recyclables – all sectors Products covered by EPR programs Compostables (possibly in 2012 for single‐family households and by 2015 for multi‐family and ICI
sector) Wood (2015)
Develop a strategy to discourage bulky items like mattresses, furniture and large appliances from being dumped in lanes and public spaces.
Medium Term actions (3‐9 year) Public education & engagement Coordinate friendly zero waste challenges. Consider three levels: within the City of Vancouver, between
communities in the Metro Vancouver region, and with international cities. Incentives & enforcement Review garbage collection fees in order to create a stronger price signal incentive to reduce garbage in
single‐family homes. One possibility is to make fees more proportional to container sizes.
Infrastructure
Develop a strategy to create zero waste infrastructure, or “assets,” like lending libraries, recycling drop‐off locations, neighbourhood composters, processing facilities, etc. to enable zero waste practices.
Strategy 2 ‐ Make Reducing and Reusing a Priority. Reducing and reusing are even more important than recycling and energy recovery in a zero waste society. By avoiding the need to extract raw resources, and extending the life of goods already consumed, the top 2Rs conserve energy, and as a result, greenhouse gas emissions.

Greenest City 2020 Action Plan - 09212 79
Short Term actions (1‐3 years) Offer grants to start lending libraries or sharing co‐ops, much like book libraries or car‐share cooperatives,
but focusing on items like tools and toys, and managed by resident associations, social enterprises or cooperatives.
Host a zero waste conference event that focuses on the first 2Rs (Reducing consumption and Reusing). Through this event, engage those in the reuse field, neighbourhoods and other interested groups to identify barriers to source reduction and reuse, and invite them to generate possible solutions. Use the results to develop a strategy to strengthen the supply and demand of reused goods in the local economy.
Work with the Green Economy working group to establish a reuse centre to sort, store and distribute salvaged building materials, and incubate new reuse and recycling markets.
Given that the City does not have clear legal authority to ban or tax plastic bags under the provisions of the Vancouver Charter, form a community advisory group to map out a strategy and a campaign to make Vancouver plastic bag free. Advocate for future packaging EPR programs to prioritize reducing the number of bags distributed. Collaborate with Metro Vancouver on a social marketing pilot program to promote reusable bags.
Pilot neighbourhood give‐away programs or spaces for reusable items. Take precautions to ensure these sites do not attract abandoned garbage.
Collaborate with Metro Vancouver to reduce junk mail, as stated in the regional waste plan. Medium Term actions (3‐9 year) Join Metro Vancouver in advocating that senior governments adopt policies to encourage manufacturers
to reduce packaging and adopt cradle‐to‐cradle designs. In partnership with Metro Vancouver, work with industry sectors to reduce waste at the source and
increase reuse, recycling and composting. Key sub‐sectors include hospitality (restaurants, hotels, events), schools and post‐secondary institutions, health care, offices, manufacturing, warehousing, retail, and film and television.
Investigate and pursue options for promoting reusable diaper services.
Strategy 3 ‐ Capture the Compostables. The City will increase diversion and prevent landfill gas generation by keeping compostables out of the waste stream. Short Term actions (1‐3 years) All Sectors
Deliver the education, engagement and enforcement programs described in Strategy 1.
City Hall
Collect and recycle food scraps and food‐soiled compostable paper from all City facilities and events and ensure that dishes and packaging in City concessions and events are reusable, recyclable or compostable.
Single‐family households
Collect all compostables from SF residential properties on a weekly basis and introduce every‐other‐week garbage collection.
Apartments and condominiums
Conduct a pilot to collect compostable organics from a limited number of multi‐family and commercial properties.
Based on the pilot results, develop a strategy for ensuring food scraps are collected from multi‐family buildings.

Greenest City 2020 Action Plan - 09212 80
Businesses and institutions
Work with Metro Vancouver, the Local Food working group and the Vancouver Food Policy Council to engage the food industry to modify products, marketing and operations to reduce over‐purchasing and over‐producing food, and encourage the redistribution of unsold food.
Infrastructure
Enhance landfill gas capture at the Vancouver Landfill so that by the end of 2012 the City will achieve the province’s 2016 regulatory target of 75% capture efficiency.
Investigate on‐site in‐vessel composting technologies as an option for apartment and condominium complexes, schools and businesses.
Assess the feasibility of developing organic material conversion facilities to transform food scraps and food‐soiled compostable paper into compost or biogas at locations such as the Vancouver Landfill and in district energy systems.
Medium Term actions (3‐9 year) All Sectors
Ensure food scraps and other compostable materials are recycled from all apartments, condominiums, businesses and institutions by the end of 2015, either through on‐site composting, or transport to composting or bioenergy facilities.
Explore the possibility of social enterprises collecting food scraps by bicycle from businesses in the downtown core and delivering the material to a transfer station or processing facility in support of the Green Economy action plan.
Investigate options for composting pet waste.
Strategy 4 ‐ Be a Catalyst for Extended Producer Responsibility (EPR). EPR is the cornerstone of our zero waste plan, and a significant contributor to achieving a green economy. The City of Vancouver will be a dynamic player in advancing EPR, and do its part to make existing programs more effective. Short Term actions (1‐3 years) Integrate decision‐making regarding operational decisions for the City’s solid waste collection services with
EPR plans being developed by the Province. Develop a clear policy and principles to define the City’s operational role with respect to existing and future
EPR programs. Work with Metro Vancouver and other local governments to advocate for the province to introduce EPR
programs according to the schedule in the CCME’s Canada‐Wide Action Plan for Extended Producer Responsibility.
Work with the province to expand EPR programs, especially for packaging (including plastic bags) and printed paper.
Actively participate in public consultations for EPR programs for packaging and printed paper. During the plan development phase for packaging EPR programs, advocate that source reduction be
prioritized for plastic bags, coffee cups, fast food packaging and other packaging and printed paper products.
Work with the province, Metro Vancouver, stewardship agencies, businesses, haulers and the public to explore creative collection models that improve convenience and access to existing EPR programs.
Enable more takeback locations with the City’s community planning, zoning, development approval, licensing, and permitting processes.
Medium Term actions (3‐9 year) Facilitate and promote a voluntary in‐store Takeback Network in advance of the formal EPR programs to
help cultivate the market. Target products typically found as abandoned garbage in Vancouver and listed in the Canada‐wide plan for EPR (e.g. electronics, furniture, carpet, textiles and building materials).
Build a coalition of major cities from BC to California to advocate for EPR programs in the Pacific Northwest in order for EPR to cover a large enough market to influence manufacturers’ product designs.

Greenest City 2020 Action Plan - 09212 81
Strategy 5 ‐ Keep Recyclables Out of Landfills and Incinerators. Keeping recyclables out of the garbage will go a long way toward achieving our zero waste target. Improving recycling rates in apartments, condominiums, businesses and institutions will be a major priority for the City. Short Term actions (1‐3 years)
All sectors Deliver the education, engagement and enforcement programs described in Strategy 1. Apartments and condominiums Explore user‐friendly recycling services for apartment and condominium buildings, like container sizes and
collection frequencies that are scaled to the number of units in a building and configuration of the space.
Businesses and institutions Explore options for leveraging business licenses to create financial incentives to improve recycling and
reduce litter. Advocate for EPR programs to collect packaging and printed paper generated on the premises of
businesses and institutions. City facilities, public spaces and events Expand recycling at the Vancouver Transfer Station and Vancouver Landfill to include more products and
materials. Expand the pilot program for on‐street newspaper recycling to provide more recycling bins on streets, in
parks and at public events. Transition the responsibility for this program to industry when the EPR program for packaging and printed paper comes into effect.
Develop a Zero Waste protocol and tools for public events. Reporting As much as possible, track end‐markets and contamination rates for recyclables collected by the City to
ensure they are put to their highest best use, and to distinguish the true recycling rate from the curbside collection rate. Deduct the contamination rate from the amount collected to report accurately on progress towards the Greenest City target.
Report out on what happens to recyclables collected by the City. Medium Term actions (3‐9 year) Apartments and condominiums Re‐examine the City’s role in regulating multi‐family garbage collection services and explore Pay‐As‐You‐
Throw models. Businesses and institutions Re‐examine the City’s role in regulating ICI garbage collection services and explore Pay‐As‐You‐Throw
models. Work with Metro Vancouver and other interested parties to share businesses best practices in recycling. Explore options to provide technical support to encourage small‐to‐medium enterprises to adopt zero
waste practices. Working with interested partners, develop a zero waste certification program to spotlight businesses and
institutions that meet or exceed recycling and waste reduction criteria. Build on business‐to‐business waste‐to‐resource networks in the city to help businesses use each other’s
waste as resources. Engage haulers and the business community to explore ways to simplify collection, pricing, and container
designs that encourage recycling and composting over garbage disposal.

Greenest City 2020 Action Plan - 09212 82
Strategy 6 ‐ Reduce, Reuse and Recycle More Construction, Renovation & Demolition Waste. Many building materials such as concrete, asphalt, gypsum drywall, wood and metal have high diversion rates. With the exception of metals, many of these materials are recycled in the region. Still, more can be done to reduce, reuse and recycle even more construction, renovation and demolition waste. Short Term actions (1‐3 years) Develop a policy and incentives to encourage deconstruction for renovation and demolition projects. Pursue options for mandating waste reduction and recycling at construction and demolition job sites, with
financial incentives to meet diversion targets, such as deposits refunded with proof of recycling. Collect clean wood at the Vancouver Transfer Station and Vancouver Landfill. Work with Metro Vancouver,
private recycling centres and building retailers to provide additional drop off locations throughout the city. Join Metro Vancouver in advocating that the provincial government revise the BC Building Code to allow
the use of salvaged lumber, and explore options for doing so in the City’s building policies. Develop strategies to address barriers to reusing salvaged building materials in construction and
renovation projects. Medium Term actions (3‐9 year) City Hall Adopt a policy for deconstruction, zero waste job sites, and incorporating reused and recycled content in
the City’s construction and renovation projects. Construction, renovation and demolition jobsites Work with the provincial government and Metro Vancouver to embed durable construction practices in the
BC Building Code. Ban clean wood from disposal at the Vancouver Transfer Station and Vancouver Landfill by 2015.
Strategy 7 ‐ Foster a Local Closed‐Loop Economy. Zero waste calls for a transformation of our linear cradle‐to‐grave economy to a closed‐loop cradle‐to‐cradle economy where harvested resources are kept in circulation and put to their highest best use. The City will pull on its economic development levers to attract an industry that manufactures products with high recycled content from locally‐generated waste. Also, during the transition to a closed‐loop economy, and in an effort to divert as much waste from landfill or incinerator as possible, the City will explore appropriate forms of energy recovery for specific wastes that cannot be reused or recycled. It is recognized, however, that waste is not a renewable fuel when it contains non‐renewable resources like petroleum‐based plastics, metals, rare minerals, or plant‐based materials harvested faster than they can be replenished. The long‐term goal is to eliminate Vancouver’s dependence on fossil fuels, and foster an economy where manufacturers design products that are durable, reusable and recyclable from the start. Short Term actions (1‐3 years) Pursue options to recover materials from garbage bound for landfill or incinerator and direct them to reuse,
recycling and “niche” energy recovery applications, within the long‐term context of transitioning towards closed‐loop systems.
Work with the Climate Leadership group to determine which waste management options for specific types of wastes could have the lowest climate change impacts from a life cycle perspective. This evaluation will compare the spectrum of greenhouse gas emissions for each level of the waste management hierarchy (reducing, reusing, recycling/composting or recovering energy). The evaluation will be completed within the overarching context of the Climate Leadership goal to eliminate Vancouver’s dependence on fossil fuels. Results will inform the Triple Bottom Line evaluation framework in the action below.
Develop a Triple Bottom Line decision‐making framework to determine the highest best uses for specific types of waste based on environmental, social and economic considerations. “Highest best use” means managing a specific type of waste at the highest possible level on the waste management hierarchy (source reduction, reuse, recycling, and energy recovery, including conversion technologies). Results from the greenhouse gas assessment described in the previous action would be integrated into the framework as an environmental consideration.
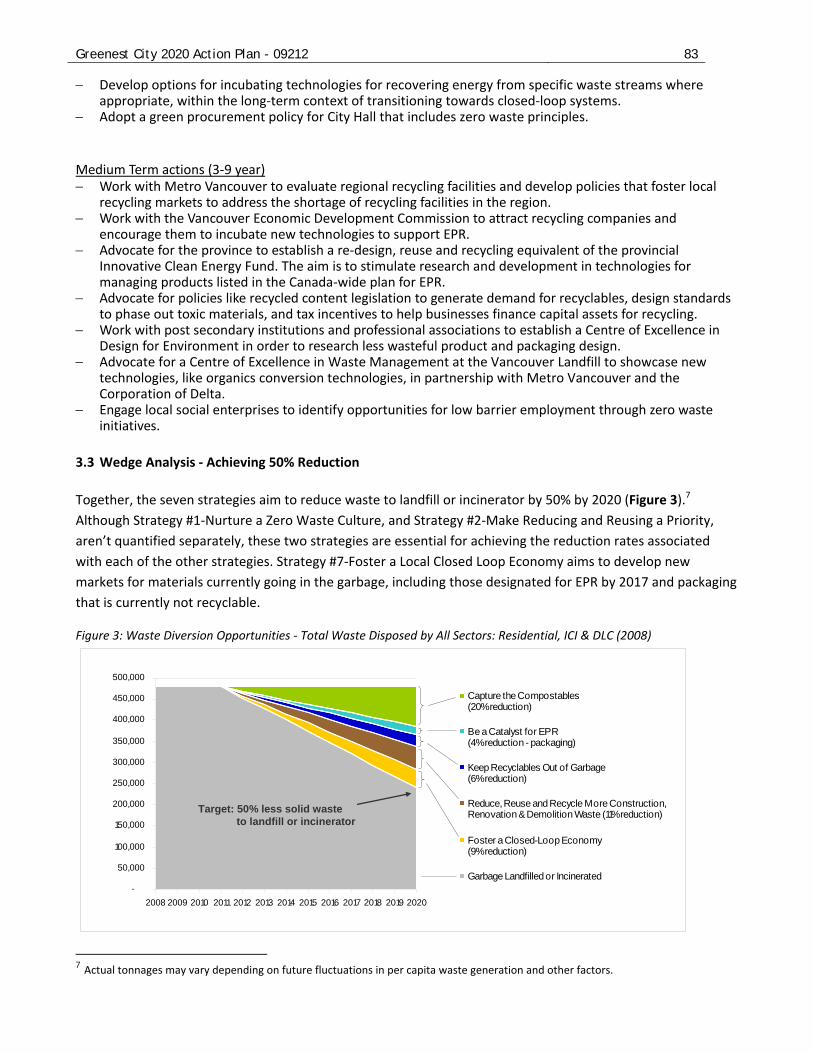
Greenest City 2020 Action Plan - 09212 83
Develop options for incubating technologies for recovering energy from specific waste streams where appropriate, within the long‐term context of transitioning towards closed‐loop systems.
Adopt a green procurement policy for City Hall that includes zero waste principles. Medium Term actions (3‐9 year) Work with Metro Vancouver to evaluate regional recycling facilities and develop policies that foster local
recycling markets to address the shortage of recycling facilities in the region. Work with the Vancouver Economic Development Commission to attract recycling companies and
encourage them to incubate new technologies to support EPR. Advocate for the province to establish a re‐design, reuse and recycling equivalent of the provincial
Innovative Clean Energy Fund. The aim is to stimulate research and development in technologies for managing products listed in the Canada‐wide plan for EPR.
Advocate for policies like recycled content legislation to generate demand for recyclables, design standards to phase out toxic materials, and tax incentives to help businesses finance capital assets for recycling.
Work with post secondary institutions and professional associations to establish a Centre of Excellence in Design for Environment in order to research less wasteful product and packaging design.
Advocate for a Centre of Excellence in Waste Management at the Vancouver Landfill to showcase new technologies, like organics conversion technologies, in partnership with Metro Vancouver and the Corporation of Delta.
Engage local social enterprises to identify opportunities for low barrier employment through zero waste initiatives.
3.3 Wedge Analysis ‐ Achieving 50% Reduction
Together, the seven strategies aim to reduce waste to landfill or incinerator by 50% by 2020 (Figure 3).7
Although Strategy #1‐Nurture a Zero Waste Culture, and Strategy #2‐Make Reducing and Reusing a Priority,
aren’t quantified separately, these two strategies are essential for achieving the reduction rates associated
with each of the other strategies. Strategy #7‐Foster a Local Closed Loop Economy aims to develop new
markets for materials currently going in the garbage, including those designated for EPR by 2017 and packaging
that is currently not recyclable.
Figure 3: Waste Diversion Opportunities ‐ Total Waste Disposed by All Sectors: Residential, ICI & DLC (2008)
-
50,000
100,000
150,000
200,000
250,000
300,000
350,000
400,000
450,000
500,000
2008 2009 2010 2011 2012 2013 2014 2015 2016 2017 2018 2019 2020
Capture the Compostables(20% reduction)
Be a Catalyst for EPR(4% reduction - packaging)
Keep Recyclables Out of Garbage(6% reduction)
Reduce, Reuse and Recycle More Construction,Renovation & Demolition Waste (11% reduction)
Foster a Closed-Loop Economy(9% reduction)
Garbage Landfilled or Incinerated
7 Actual tonnages may vary depending on future fluctuations in per capita waste generation and other factors.
Target: 50% less solid waste to landfill or incinerator

Greenest City 2020 Action Plan - 09212 84
4. CROSS REFERENCE The strategies and actions from other Greenest City goal areas that directly support zero waste are: Green Economy Establish a Green Enterprise Zone (GEZ), with a Green Technology Centre to incubate recycling
technologies and a Reuse Technology Centre to sort, store and distribute salvaged materials and incubate new markets
Develop a green economic development strategy with a concentration on waste management and recycling
Create a local employment plan with pilot projects in building deconstruction and compost collection Develop green pre‐procurement and local supply chain programs to identify opportunities for recycled
content and support a local closed‐loop, cradle‐to‐cradle economy Climate Leadership Framework to compare lifecycle greenhouse gas impacts of waste management methods for specific
segments of the waste stream (e.g. wood, certain plastics) Approach to account and award carbon credits for the GHG benefits of waste reduction, reuse and recycling Expanded landfill gas capture system Lighter Footprint One Planet Plan Greenest city event guidelines Pilot programs to enable lighter footprint lifestyles through reducing waste Lighter footprint certification process for business Clean Water Reducing bottled water consumption through improving access to water refilling stations will reduce waste
at source Local Food
Reducing food waste by strengthening food recovery programs to channel surplus edible food to people
Promoting large‐scale commercial food scraps recovery
Community and neighbourhood composting projects
Creating infrastructure and “green jobs” through managing food scraps and food‐soiled paper
5. EXTERNAL ADVISORY COMMITTEE MEMBERSHIP
Ruth Abramson Corporate Manager, Environmental Sustainability, Provincial Health Services Authority
Helen Spiegelman Coordinator, Zero Waste Vancouver
Dennis Ranahan Sr. Engineer, Metro Vancouver
Norman Point Mgr. Capital Projects, Musqueam Indian Band, Musqueam Reserve
Charles Gauthier Executive Director, Downtown Vancouver BIA (DVBIA)
Kevin Millsip Sustainability Coordinator, Vancouver School Board
Richard Taki Regional Director, Health Protection, Vancouver Coastal Health
Brock Macdonald/ Jordan Best
Executive Director, Recycling Council of BC / Policy & Research Coordinator, Recycling Council Of BC
Avtar Sundher Emergency Response Officer, Ministry of the Environment
Sam Dahabieh Facilities Services Operations Director, SFU
Robert Weatherbe Owner/Operator, Recycling Alternative
Louise Schwarz Owner/Operator, Recycling Alternative

Greenest City 2020 Action Plan - 09212 85
6. STAFF WORKING GROUP Rowan Birch (Chair) Departmental Services
Chris Underwood (Staff Lead) Solid Waste
Monica Kosmak Solid Waste
Lynn Belanger Solid Waste
Mani Deo Solid Waste
Doug Robertson Environmental Protection Branch
Catherine Kinahan Legal Services
Valery Presolly UBC Greenest City Scholar
Darlene Seto UBC Greenest City Scholar
7. PUBLIC ENGAGEMENT SUMMARY Phase One There were 92 ideas and 4664 votes on in the “Reduce waste” category on the Talk Green to Us forum. The top five ideas were:
Ideas Number of Votes
Extend food waste collection program to include apartments and condos
775
Ban disposable cups, plates and cutlery in all restaurants/cafes 353
Mandatory 25¢ fee for plastic shopping bags 337
Require all fast food take‐out containers to be reusable, compostable, or recyclable
323
Require businesses to be responsible for their own waste 240
Phase two Waste was one of the most discussed topics throughout the public engagement process. In addition to the conversation on the website, there were two workshops specifically focused on zero waste. The following themes and feedback emerged from these workshops. 1. “Nurture a Zero Waste Culture” ‐ Exciting:
Neighbourhoods, businesses and schools working together – taking on the goal for themselves
Neighbourhood scale
Zero waste assets ‐ Large & small scale infrastructure
Gaps identified / Refinement
Behaviour change strategy (beyond just “education” and CBSM programs)
Zero Waste assets / land use – need to inventory
Showcase community & citizen initiatives
Financial incentives/disincentives
Information (where to take things, how to recycle certain things, what happens to recyclables, what to do with pet waste)
Use the arts! Social norming, storytelling, movies, media, FUN!
Nurture a culture of refusal
Need teaching reduction & reuse skills (repair, etc.)

Greenest City 2020 Action Plan - 09212 86
Litter strategy
Keep Vancouver Spectacular – all year round, advertise it
Provide garbage grabbers & buckets in community centres/parks
Zero Waste school pizza lunches & events
Funding for “to go” cups for high school students
Recognize citizen & business early adopters
Develop clear labels for composting & recycling streams, and share with businesses
Recycling/composting bins in Aquatic Centre
Business opportunities for Greenest City brand
Swift enforcement requires bylaw changes for immediate ticketing
Education about illegal dumping
Engage cultural groups, immigrant communities 2. “Make Reducing & Reusing a Priority” ‐ Exciting:
Emphasis on reduction – opportunity to create a social strategy to move this Gaps identified
Infrastructure – reuse depots, zero waste assets etc. Reuse depot at transfer station and landfill
Zero Waste food giveaways
Need shop & swap in community spaces
Give bylaw and zoning preferences, tax breaks to local companies with ZW approach
Education in schools, universities, colleges on 2Rs
Strategy to address move‐out days
Reusable takeaway dishes citywide
Searchable database for alternatives for hard‐to‐recycle
Kids party library (dish sets at community centres)
Community sheds at community centres (tool library)
Local returnable/refillable mason jar economy (link to local food processing hub)
Ban plastic bags
Encourage reusable container/bag business
Tax garbage generated by businesses
Ban or tax single use coffee cups
Control free newspaper distribution
Strategy to prevent illegal dumping at reuse sites 3. “Capture the Organics” – Exciting:
Apartment/condo organics collection
Composting coaches
Hub concept: shorter distance, smaller scale
Organics conversion facilities Gaps identified/ refinements suggested
Promote on‐site composting equipment
Address contamination in large‐scale pickup
Exclusivity for larger haulers
Need more emphasis on neighbour‐scale collection & processing
Zoning for private sector processing is not supportive (replace red tape with green tape)

Greenest City 2020 Action Plan - 09212 87
Financial barrier: currently more expensive than garbage
Multi‐unit dwellings – not a pilot! Roll it out
Bicycle collection (like Victoria)
Dog waste composting in parks, downtown
Parks board to use local compost
Biogas – caution, prevention is best
Marry biogas with district energy
Ban garburators
More commercial composting bins
Concerns about more dumpster‐size containers for more streams; re‐examine the dumpster model
Business interested in assistance for composting collection (?) 4. “Be a Catalyst for Takeback Programs” – Gaps/refinements:
“Corporate leadership through environmental responsibility will set Vancouver apart”
Making producers responsible for paying and collecting
Transition from municipality to producer responsibility
Expanding to more types of products
Involving business – “they have a lot of power”
Hassle to take back materials to multiple locations – need eco‐depot style locations, consolidation, integration
Need measures to encourage business to design out waste
Need more emphasis on reuse in EPR
More credit to greener producers
Should be deposits for all products and packaging
Need public education on EPR
Consider making EPR a part of all business plans
Participants may have confused EPR with business recycling Strategic alliances with City & BIAs BC MEX needs to be better used Eco‐industrial parks Harmonization of programs across BC Economies of scale (help businesses who don’t meet minimum pickup requirements)
“Keep Recyclables Out of Landfill or Incinerator” ‐ Exciting:
City walking the talk Front of house zero waste programs (libraries, theatres, concessions, parks): opportunity to showcase,
leadership Back of house zero waste programs (offices, fire hall, police, etc.): gives plan integrity
City phasing out non‐compostable and non‐recyclable products
Options for leveraging (business licenses)
ZW certification idea for businesses Gaps identified
Apartment/condo recycling actions need to stand out more. (Same for ICI strategy.)
Industrial, commercial, institutional (ICI) actions need to target specific industries (e.g. film industry, events) Make recycling/composting a condition of permits
BIAs – revisit dumpster‐free, recycling collection assistance
Spatial requirements for old and new buildings (Metro ZW Challenge strategy)
Deposit‐refund system for more products
Greenest City 2020 Action Plan - 09212 88
Extend recycling to other products
811 waste line for waste info
Single stream recycling
Enforce disposal bans at the point of collection
Keep highest best use hierarchy, don’t downgrade 6. “Enhance Construction & Demolition Recycling” ‐ Exciting:
Increase capacity in the city for deconstruction
More ReStores
Wood ban (“Wood is captured carbon. The longer it stays in use, the better.”) Gaps identified / Refinements suggested:
Advocacy to prohibit offshore/ocean dumping of DLC materials in Burrard Inlet
Longer life cycle for construction
Discourage cosmetic renovations
Certification program to create a skilled deconstruction workforce
Rewards and demonstrations of innovative building techniques for longer‐lasting construction (less focus on demolition)
Encourage private recycling firms to set up large‐scale construction & demolition recycling facilities
Why just ban wood?
Increase LEED accreditation requirements (e.g. ZW jobsites)
Enforce disposal bans at all landfills, public and private, to avoid cherrypicking
Need infrastructure to sort & store deconstructed materials
Need flexible building codes to allow for innovative materials 7. Foster a Local, Closed‐Loop Economy” – Exciting:
“This is truly the ideal win‐win scenario”
“Glad to see this is a cornerstone of the city’s plans”
Developing local manufacturing to serve local markets
Discussion about what closed‐loop systems are
Simultaneous carrots and sticks, but positive incentives are most possible Gaps identified/refinements suggested
Tax incentives for (re)manufacturing
Green Bucks (local currency)
Competition to promote excellence in manufacturing
Information about the current system: where we import from, where waste goes
Different metrics for an “economy” – what do we mean by wealth/consumption
8. BASELINE METHODOLOGY All solid waste estimates provided in this appendix are for planning purposes only and are not presented as official statistics for the City of Vancouver. 8.1 Summary of Methodology Used The Greenest City solid waste baseline is based on a blend of reported and estimated amount of waste from all sectors: single family (SF); multi‐family (MF); industrial, commercial and institutional (ICI); demolition, landclearing and construction (DLC); and “residential” drop‐off (RDO), also known as “self‐haul,” which is estimated to be 95% SF, 5% MF and 5% ICI.

Greenest City 2020 Action Plan - 09212 89
Baseline year The year 2008 was chosen as a baseline because this is the year of Metro Vancouver’s most recently published solid waste annual report (Recycling and Solid Waste Management – 2008 Report). Data availability and gaps The City has good data from its customer base – primarily for all SF curbside waste (garbage, recycling and yard trimmings), MF recycling, and recycling depots at the Vancouver transfer station and landfill. The City has reported these solid waste statistics through annual surveys to Metro Vancouver since Metro adopted the 1995 Solid Waste Management Plan. These statistics, which are published in the City’s Solid Waste Division Report 2004‐2009, include:
SF curbside garbage, recycling and yard trimmings
MF curbside recycling
Recycling depots at the Vancouver transfer station and landfill
Cumulative number of backyard composters distributed by the City, which Metro Vancouver uses to calculate a diversion estimate for backyard composters
However, data gaps exist for waste that is hauled by the private sector. Metro Vancouver tracks this waste at the regional level, but accurate data is not available at the city level for:
MF residential garbage
ICI garbage, recycling and composting
DLC waste disposed or recycled
SF, MF and ICI direct drop‐off at transfer stations, also known as residential drop‐off (RDO) or “self‐haul”
For disposal, Metro Vancouver attempts to track MF, ICI and RDO garbage arriving at its transfer stations by municipality. The City has reported this as an average of 338,000 tonnes in its Solid Waste Division Report (2004‐2009). However, Metro Vancouver staff cautioned that, for the purpose of establishing Vancouver’s Greenest City baseline, this data may not paint a complete picture of Vancouver garbage, because of possible reporting errors at the scales. (This is evidenced by solid waste tonnages that skew higher for some of the municipalities that host a transfer station, including the North Shore Transfer Station, which receives a considerable amount of Vancouver garbage, especially from the ICI and RDO sectors.) Reporting errors may result from private haulers crossing municipal boundaries on a single collection route, or reporting by the municipality that licenses the hauler as opposed to the municipality(ies) on the collection route. For diversion, Metro Vancouver records regional ICI and DLC recycling, composting and niche energy recovery statistics based on reports provided by private recycling facilities. Private recyclers are not required to track waste flows by municipality. Similarly, EPR programs often voluntarily report their recycling and energy recovery tonnages by region, but not by municipality. Addressing data gaps The methodology to estimate solid waste where data gaps exist was developed in consultation with Metro Vancouver staff. Where data gaps exist, the amount of waste was extrapolated based on Vancouver’s proportion of regional demographics, as shown in Tables 1, 2 and 3. These percentages were applied to data published in Metro Vancouver’s Recycling and Solid Waste Management – 2008 Report. Where possible, the percentages were applied to more detailed data that Metro Vancouver used to compile the Summary, particularly for specific types of waste diverted to composting, recycling or niche energy recovery.

Greenest City 2020 Action Plan - 09212 90
Table 1. Vancouver’s Estimated Proportion of the Region’s Population, Jobs and Demolition Permits
Sector Proxy Metro Vancouver Total
City of Vancouver
City of Vancouver’s proportion of the region
Source (Demographic Data)
SF RDO SF population (2009) 1,409,040 312,076 22% Metro Vancouver
MF garbage and RDO
MF population (2009) 864,055 316,545 37%
Metro Vancouver
ICI Jobs (2006) 1,115,800 378,000 34%
City of Vancouver, Understanding Vancouver web page8
DLC SF demolition permits (2008)
2,078 728 36% Metro Vancouver
EPR Total population (2008) 2,273,241 616,450 27% BC Stats Population Estimates 1999‐2009 (Metro Vancouver, Jan/2010)
Table 2. Determining the Baseline for Solid Waste Disposal to Landfill or Incinerator (2008)
Sector Actual or Estimate
Method/Assumptions Sources (Solid Waste Data)
SF garbage (curbside) Actual Used tonnages reported annually by City of Vancouver
City of Vancouver submission to Metro Vancouver’s 2008 solid waste survey
SF RDO garbage Estimate Assumed 22% of regional SF RDO tonnages, based on SF population
MF garbage (curbside) Estimate Assumed 37% of regional MF RDO tonnages, based on MF population
MF RDO garbage Estimate Assumed 37% of regional MF RDO tonnages, based on MF population
ICI garbage (private haul and drop‐off)
Estimate Assumed 34% of regional ICI tonnages, based on number of jobs
DLC garbage Estimate Assumed 36% of regional DLC tonnages, based on number of SF demolition permits. Assumed proportion of ICI demolitions is the same as SF demolitions.
Metro Vancouver 2008 Recycling and Solid Waste Summary, supplemented by detailed information provided by Metro Vancouver
8 http://vancouver.ca/commsvcs/planning/stats/regionalcontext/index.htm Accessed December 3, 2010.

Greenest City 2020 Action Plan - 09212 91
Table 3. Determining the Baseline Diversion Estimate for Composting, Recycling and Niche Energy Recovery (2008)
Sector Actual or Estimate
Method Sources (Solid Waste Data)
SF recycling and yard trimmings (curbside)
Actual Used tonnages reported annually by City of Vancouver
City of Vancouver submission to Metro Vancouver’s 2008 solid waste survey
SF backyard composting
Estimate Derived from Metro Vancouver’s estimate based on cumulative amount of backyard composters distributed by the City
Metro Vancouver spreadsheet for 2008 Recycling and Solid Waste Summary
MF recycling (curbside)
Actual Used tonnages reported annually by City of Vancouver
City of Vancouver submission to Metro Vancouver’s 2008 solid waste survey
SF & MF depot recycling
Actual Used data reported by City of Vancouver for recyclables received at the Vancouver transfer station and landfill, plus Metro Vancouver’s estimated amount of recyclables received at Metro transfer stations from Vancouver residents and businesses
City of Vancouver submission to Metro Vancouver’s 2008 solid waste survey. Metro Vancouver spreadsheet for 2008 Recycling and Solid Waste Summary
ICI recycling Estimate Assumed 34% of regional ICI recyclables, based on number of jobs
Metro Vancouver’s spreadsheet for Metro Vancouver Recycling & Solid Waste ‐ 2008 Summary
DLC recycling Estimate Assumed 36% of regional DLC recyclables, based on number of SF demolition permits
Metro Vancouver Recycling & Solid Waste ‐ 2008 Summary, supplemented by detailed information provided by Metro Vancouver
EPR Estimate Assumed 27% of EPR recyclables collected in the region, based on population. (Most EPR programs report by regional district. Where regional data is not available, Metro contacts the EPR programs for an estimate.)
Metro Vancouver Recycling & Solid Waste ‐ 2008 Summary. EPR program annual reports, available on the BC Ministry of Environment’s product stewardship website.
Determining the waste composition estimate Understanding waste composition is important for planning diversion programs. The composition of solid waste to landfill or incinerator was estimated by using the categories and percentages in Metro Vancouver’s most recent waste composition studies, as follows:

Greenest City 2020 Action Plan - 09212 92
For SF residential, ICI and RDO waste: 2009 Solid Waste Composition Study (July 16, 2010)
For MF residential waste: Multi‐family Buildings Waste Audit (April 2006)
For DLC waste: DLC Waste Composition Study of the Ecowaste and Vancouver Landfills (January 2005) The waste category percentages from each of these studies were multiplied against the corresponding City of Vancouver disposal estimate for each sector. To determine the average composition of total waste disposed, the waste category tonnages for each sector were added up and divided by the total disposal estimate of 473,019 tonnes. The resulting percentages for the City’s total waste are different from Metro Vancouver’s because of the higher proportion of ICI and DLC waste for the City relative to the rest of the region. Combining the waste categories from the three waste composition studies resulted in a detailed list of over 220 product categories. These categories were then reorganized according to diversion potential based on composting, recycling and EPR programs, including future EPR programs scheduled in the CCME’s Canada‐Wide Action Plan for EPR. 8.2 Baseline Result for the Zero Waste Target Based on the assumptions in section 8.1, total solid waste to landfill or incinerator from all sectors in the City of Vancouver is estimated to be approximately 473,000 tonnes in 2008. However, the total is sensitive to the estimated proportion of ICI and DLC waste. For example, if the ICI proportion were estimated at 35% (the level it was in 2001), total waste would be approximately 477,000 tonnes. To allow for inaccuracies, the final baseline was rounded up to 480,000 tonnes (Table 4). Table 4. Estimated Solid Waste Disposed to Landfill or Incinerator for City of Vancouver (2008)
Waste Sector
Metro VancouverDisposed (Tonnes)
City of Vancouver’s Estimated Proportion
City of Vancouver Estimated Disposed
Residential 618,661 167,790
Single Family Combined 417,690 94,136
Single Family Curbside 272,310 62,152
Single Family RDO 145,380 22% 31,984
Multi‐Family Combined 200,971 73,655
Multi Family Curbside 192,894 37% 70,667
Multi Family RDO 8,077 37% 2,988
ICI (estimated) 614,527 208,183
ICI Curbside 606,450 34% 205,447
ICI Drop‐Off 8,077 34% 2,736
Sub‐Total (RES, ICI, EPR only) 1,233,188 375,974
DLC 266,043 36% 97,045
TOTAL 1,499,231 473,019
Rounded Up to Allow for Inaccuracies: 480,000
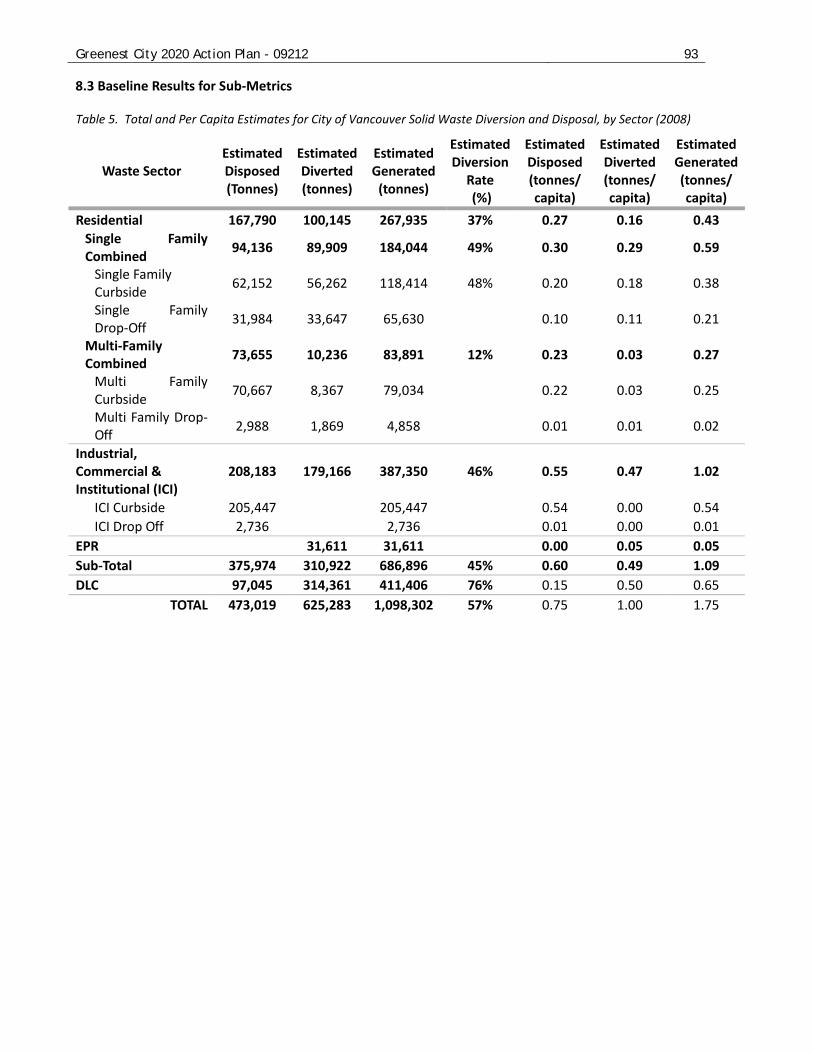
Greenest City 2020 Action Plan - 09212 93
8.3 Baseline Results for Sub‐Metrics Table 5. Total and Per Capita Estimates for City of Vancouver Solid Waste Diversion and Disposal, by Sector (2008)
Waste Sector Estimated Disposed (Tonnes)
EstimatedDiverted (tonnes)
Estimated Generated (tonnes)
EstimatedDiversion Rate (%)
Estimated Disposed (tonnes/ capita)
EstimatedDiverted (tonnes/ capita)
Estimated Generated (tonnes/ capita)
Residential 167,790 100,145 267,935 37% 0.27 0.16 0.43
Single Family Combined
94,136 89,909 184,044 49% 0.30 0.29 0.59
Single Family Curbside
62,152 56,262 118,414 48% 0.20 0.18 0.38
Single Family Drop‐Off
31,984 33,647 65,630 0.10 0.11 0.21
Multi‐Family Combined
73,655 10,236 83,891 12% 0.23 0.03 0.27
Multi Family Curbside
70,667 8,367 79,034 0.22 0.03 0.25
Multi Family Drop‐Off
2,988 1,869 4,858 0.01 0.01 0.02
Industrial, Commercial & Institutional (ICI)
208,183 179,166 387,350 46% 0.55 0.47 1.02
ICI Curbside 205,447 205,447 0.54 0.00 0.54
ICI Drop Off 2,736 2,736 0.01 0.00 0.01
EPR 31,611 31,611 0.00 0.05 0.05
Sub‐Total 375,974 310,922 686,896 45% 0.60 0.49 1.09
DLC 97,045 314,361 411,406 76% 0.15 0.50 0.65
TOTAL 473,019 625,283 1,098,302 57% 0.75 1.00 1.75

Table 6. Estimated Diversion to Recycling, Composting or Niche Energy Recovery, by Material and Sector, City of Vancouver (2008)
Material
SF Curbside (tonnes)
SF Recycling Depots
(tonnes)
SF Combined (tonnes)
MF Curbside (tonnes)
MF Recycling Depots
(tonnes)
MF Combined (tonnes)
Total Residential (SF & MF
Combined) (tonnes)
ICI (tonnes)
DLC (tonnes)
EPR (tonnes)
Total(tonnes)
Compostables 31,285 21,537 52,822 1,196 1,196 54,018 25,459 79,477
Curbside yard trimmings 21,400 21,537 42,937 1,196 1,196 44,133 25,459 69,593
Backyard compost 9,885 9,885 9,885 9,885
Wood 23,637 43,189 66,826
Wood ‐ clean 7 43,189 43,196
Mixed wood & plastic 23,630 23,630
Curbside Recyclables 24,977 3,265 28,242 8,367 181 8,548 36,791 114,263 151,054
Paper fibres 18,394 3,124 21,518 6,194 174 6,368 27,886 101,070 128,956
Plastic containers 1,646 88 1,733 543 5 548 2,281 3,622 5,904
Mixed metal containers 1,646 29 1,675 543 2 545 2,220 961 3,180
Glass containers 3,292 24 3,316 1,087 1 1,088 4,404 8,609 13,013
Existing EPR Products 1 1 1 5,509 31,611 37,121 Beverage containers (except milk & beer 11,337 11,337
Beer Containers 6,551 6,551
Computers, TVs, peripherals 1,424 1,424
Batteries 3 3 Household Hazardous (paint, pesticides, solvents, gasoline) 374 374
Pharmaceuticals 5 5
Tires 3,697 3,697
Lead‐acid batteries 1,627 1,627 Used oil products (oil, filterst, containers) 6,601 6,601
Antifreeze 1 1 1 1
Large appliances (2012) 5,509 5,509
EPR 2015 Products 4,723 10,232
Plastic packaging 4,723 4,735
EPR 2017 Products 2,369 2,369 132 132 2,501 224 268,673 271,398 Building products (construction & demolition) 2,340 2,340 130 130 2,470 221 268,673 271,363
Concrete 139,496 139,496 Gypsum drywall (includes some plaster) 2,340 2,340 130 130 2,470 221 32,253 34,944
Asphalt 96,923 96,923
Furniture (Mattresses) 29 29 2 2 31 4 34
EPR Not Yet Planned 6,474 6,474 360 360 6,834 5,351 1,513 13,698
Misc. metal products 5,594 5,594 311 311 5,904 2,999 990 9,894
Rubber products (except tires) 2,176 2,176
Misc. recyclables 881 881 49 49 930 176 523 1,628
Rock, Dirt, Soil 986 986
Soil 986 986
TOTAL 56,262 33,647 89,909 8,367 1,869 10,236 100,145 179,166 314,361 31,611 625,283
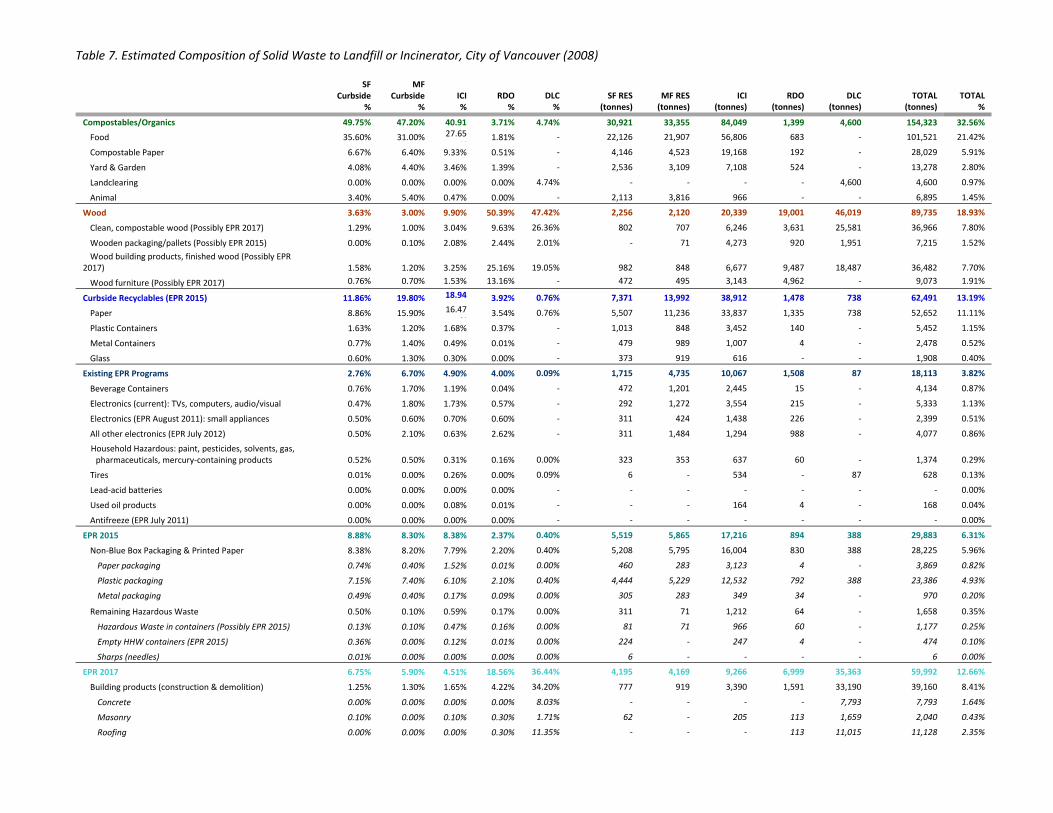
Table 7. Estimated Composition of Solid Waste to Landfill or Incinerator, City of Vancouver (2008)
SF Curbside
%
MF Curbside
% ICI %
RDO %
DLC %
SF RES (tonnes)
MF RES (tonnes)
ICI (tonnes)
RDO (tonnes)
DLC (tonnes)
TOTAL (tonnes)
TOTAL %
Compostables/Organics 49.75% 47.20% 40.91 3.71% 4.74% 30,921 33,355 84,049 1,399 4,600 154,323 32.56%
Food 35.60% 31.00% 27.65%
1.81% ‐ 22,126 21,907 56,806 683 ‐ 101,521 21.42%
Compostable Paper 6.67% 6.40% 9.33% 0.51% ‐ 4,146 4,523 19,168 192 ‐ 28,029 5.91%
Yard & Garden 4.08% 4.40% 3.46% 1.39% ‐ 2,536 3,109 7,108 524 ‐ 13,278 2.80%
Landclearing 0.00% 0.00% 0.00% 0.00% 4.74% ‐ ‐ ‐ ‐ 4,600 4,600 0.97%
Animal 3.40% 5.40% 0.47% 0.00% ‐ 2,113 3,816 966 ‐ ‐ 6,895 1.45%
Wood 3.63% 3.00% 9.90% 50.39% 47.42% 2,256 2,120 20,339 19,001 46,019 89,735 18.93%
Clean, compostable wood (Possibly EPR 2017) 1.29% 1.00% 3.04% 9.63% 26.36% 802 707 6,246 3,631 25,581 36,966 7.80%
Wooden packaging/pallets (Possibly EPR 2015) 0.00% 0.10% 2.08% 2.44% 2.01% ‐ 71 4,273 920 1,951 7,215 1.52%
Wood building products, finished wood (Possibly EPR 2017) 1.58% 1.20% 3.25% 25.16% 19.05%
982 848 6,677 9,487 18,487
36,482 7.70%
Wood furniture (Possibly EPR 2017) 0.76% 0.70% 1.53% 13.16% ‐ 472 495 3,143 4,962 ‐ 9,073 1.91%
Curbside Recyclables (EPR 2015) 11.86% 19.80% 18.94%
3.92% 0.76% 7,371 13,992 38,912 1,478 738 62,491 13.19%
Paper 8.86% 15.90% 16.47%
3.54% 0.76% 5,507 11,236 33,837 1,335 738 52,652 11.11%
Plastic Containers 1.63% 1.20% 1.68% 0.37% ‐ 1,013 848 3,452 140 ‐ 5,452 1.15%
Metal Containers 0.77% 1.40% 0.49% 0.01% ‐ 479 989 1,007 4 ‐ 2,478 0.52%
Glass 0.60% 1.30% 0.30% 0.00% ‐ 373 919 616 ‐ ‐ 1,908 0.40%
Existing EPR Programs 2.76% 6.70% 4.90% 4.00% 0.09% 1,715 4,735 10,067 1,508 87 18,113 3.82%
Beverage Containers 0.76% 1.70% 1.19% 0.04% ‐ 472 1,201 2,445 15 ‐ 4,134 0.87%
Electronics (current): TVs, computers, audio/visual 0.47% 1.80% 1.73% 0.57% ‐ 292 1,272 3,554 215 ‐ 5,333 1.13%
Electronics (EPR August 2011): small appliances 0.50% 0.60% 0.70% 0.60% ‐ 311 424 1,438 226 ‐ 2,399 0.51%
All other electronics (EPR July 2012) 0.50% 2.10% 0.63% 2.62% ‐ 311 1,484 1,294 988 ‐ 4,077 0.86%
Household Hazardous: paint, pesticides, solvents, gas, pharmaceuticals, mercury‐containing products 0.52% 0.50% 0.31% 0.16% 0.00%
323 353 637 60 ‐
1,374 0.29%
Tires 0.01% 0.00% 0.26% 0.00% 0.09% 6 ‐ 534 ‐ 87 628 0.13%
Lead‐acid batteries 0.00% 0.00% 0.00% 0.00% ‐ ‐ ‐ ‐ ‐ ‐ ‐ 0.00%
Used oil products 0.00% 0.00% 0.08% 0.01% ‐ ‐ ‐ 164 4 ‐ 168 0.04%
Antifreeze (EPR July 2011) 0.00% 0.00% 0.00% 0.00% ‐ ‐ ‐ ‐ ‐ ‐ ‐ 0.00%
EPR 2015 8.88% 8.30% 8.38% 2.37% 0.40% 5,519 5,865 17,216 894 388 29,883 6.31%
Non‐Blue Box Packaging & Printed Paper 8.38% 8.20% 7.79% 2.20% 0.40% 5,208 5,795 16,004 830 388 28,225 5.96%
Paper packaging 0.74% 0.40% 1.52% 0.01% 0.00% 460 283 3,123 4 ‐ 3,869 0.82%
Plastic packaging 7.15% 7.40% 6.10% 2.10% 0.40% 4,444 5,229 12,532 792 388 23,386 4.93%
Metal packaging 0.49% 0.40% 0.17% 0.09% 0.00% 305 283 349 34 ‐ 970 0.20%
Remaining Hazardous Waste 0.50% 0.10% 0.59% 0.17% 0.00% 311 71 1,212 64 ‐ 1,658 0.35%
Hazardous Waste in containers (Possibly EPR 2015) 0.13% 0.10% 0.47% 0.16% 0.00% 81 71 966 60 ‐ 1,177 0.25%
Empty HHW containers (EPR 2015) 0.36% 0.00% 0.12% 0.01% 0.00% 224 ‐ 247 4 ‐ 474 0.10%
Sharps (needles) 0.01% 0.00% 0.00% 0.00% 0.00% 6 ‐ ‐ ‐ ‐ 6 0.00%
EPR 2017 6.75% 5.90% 4.51% 18.56% 36.44% 4,195 4,169 9,266 6,999 35,363 59,992 12.66%
Building products (construction & demolition) 1.25% 1.30% 1.65% 4.22% 34.20% 777 919 3,390 1,591 33,190 39,160 8.41%
Concrete 0.00% 0.00% 0.00% 0.00% 8.03% ‐ ‐ ‐ ‐ 7,793 7,793 1.64%
Masonry 0.10% 0.00% 0.10% 0.30% 1.71% 62 ‐ 205 113 1,659 2,040 0.43%
Roofing 0.00% 0.00% 0.00% 0.30% 11.35% ‐ ‐ ‐ 113 11,015 11,128 2.35%

Table 7. Estimated Composition of Solid Waste to Landfill or Incinerator, City of Vancouver (2008)
SF Curbside
%
MF Curbside
% ICI %
RDO %
DLC %
SF RES (tonnes)
MF RES (tonnes)
ICI (tonnes)
RDO (tonnes)
DLC (tonnes)
TOTAL (tonnes)
TOTAL %
Outdoor Wall Finishing 0.00% 0.00% 0.00% 0.00% 0.70% ‐ ‐ ‐ ‐ 679 679 0.14%
Indoor Wall Finishing (gypsum drywall, plaster) 0.40% 0.30% 0.20% 0.40% 0.33% 249 212 411 151 320 1,343 0.28%
Insulation 0.00% 0.00% 0.00% 0.00% 0.11% ‐ ‐ ‐ ‐ 107 107 0.02%
Flooring (excluding carpet) ‐ ‐ 0.00% 0.00% 0.08% ‐ ‐ ‐ ‐ 78 78 0.02%
Plumbing 0.05% 0.00% 0.05% 0.12% 0.34% 31 ‐ 103 45 330 509 0.11%
Misc. Glass Building Products 0.40% 1.00% 0.70% 1.30% 0.03% 249 707 1,438 490 29 2,913 0.61%
Misc. Plastic Building Products 0.00% 0.00% 0.00% 0.00% 6.10% ‐ ‐ ‐ ‐ 5,920 5,920 1.25%
Misc. Metal Building Products 0.00% 0.00% 0.00% 0.00% 2.54% ‐ ‐ ‐ ‐ 2,465 2,465 0.52%
Misc. Building Products 0.30% 0.00% 0.60% 1.80% 2.78% 186 ‐ 1,233 679 2,698 4,796 1.01%
Asphalt ‐ ‐ ‐ 0.10% ‐ ‐ ‐ ‐ 97 97 0.02S%
Carpet 1.30% 1.20% 0.80% 6.00% 1.19% 808 848 1,644 2,262 1,155 6,717 1.42%
Textiles 4.20% 2.60% 1.86% 1.84% 1.02% 2,610 1,837 3,821 694 990 9,953 2.10%
Furniture 0.00% 0.80% 0.20% 6.50% 0.03% ‐ 565 411 2,451 29 3,456 0.73%
EPR Not Yet Planned 12.51% 9.10% 9.67% 9.63% 0.13% 7,775 6,431 19,867 3,631 126 37,803 7.98%
Household hygiene (diapers, etc.) 5.57% 4.40% 0.76% 0.20% ‐ 3,462 3,109 1,561 75 ‐ 8,208 1.73%
Medical/biological 0.17% 0.00% 0.23% 0.00% ‐ 106 ‐ 473 ‐ ‐ 578 0.12%
Misc. Paper products 0.10% 0.30% 0.40% 0.30% ‐ 62 212 822 113 ‐ 1,209 0.26%
Misc. Plastic products 3.48% 0.00% 3.79% 2.55% ‐ 2,163 ‐ 7,786 962 ‐ 10,911 2.30%
Misc. Metal products 1.72% 1.40% 2.89% 6.25% ‐ 1,069 989 5,937 2,357 ‐ 10,353 2.18%
Misc. Non‐compostable organic products 1.47% 2.00% 1.60% 0.33% 0.13% 914 1,413 3,287 124 126 5,865 1.24%
Other/Misc. 1.00% 707 ‐ ‐ 707 0.15%
Rock, Soil, Fine Particles 3.60% 0.90% 3.00% 7.40% 9.62% 2,237 636 6,163 2,790 9,336 21,163 4.47%
TOTAL 99.74% 100.90% 100.21 99.98% 100.01 61,990 71,303 205,879 37,700 97,055 473,927 100.0%
Estimated Tonnages ( from Table 1) 62,152 70,667 205,447 37,708 97,045 473,019
Difference (162) 636 431 (8) 10 908
Key: SF curbside: Garbage collected at curb from single family (one‐ and two‐family) homes MF curbside: Garbage collected at curb from multi‐family buildings ICI: Industrial, commercial and institutional garbage RDO: “Residential Drop‐Off,” or “self‐haul” garbage that is taken directly to transfer stations by residents and businesses. Assume 95% is from SF, 5% is from MF and 5% is from ICI. DLC: Demolition, landclearing and construction waste that is landfilled Notes: Numbers may not add due to rounding. More detailed sub‐categories are not shown.

Greenest City 2020 Action Plan - 09212 97
8.5 Future Data Needs Actual Solid Waste Quantities by Sector Using demographics to estimate Vancouver’s proportion of waste in Metro Vancouver may be appropriate for establishing a baseline, but it is not suitable for tracking progress towards the Greenest City goal. This is the proportional estimate assumes equal waste generation and diversion rates across all the municipalities in the region. Any progress (or lack of it) towards the zero waste target will be diluted across all municipalities in the region. It is recommended that the City work with Metro Vancouver, member municipalities and private processing facilities to research waste by sector and, if possible, develop tracking systems that more accurately reflect solid waste quantities at the municipal level for the following waste streams:
Multi‐family garbage
ICI garbage, recycling and compostables
DLC waste to DLC landfills and recycling In the event that it is not possible to collect accurate data for these sectors, it is recommended that supporting indicators be developed to assess progress towards the strategies, actions and overarching objectives of the Zero Waste plan. Waste composition Waste composition data provides feedback on diversion rates and program performance at a detailed level, which is important for zero waste planning. Understanding waste composition will be important to assist the province in developing EPR programs for products recommended for EPR by 2017 in the Canada‐Wide Action Plan. Also of interest is MF waste composition. Staff will work with Metro Vancouver to include the MF sector, as well as integrate the categories used in the DLC waste composition study, into future waste composition studies for residential, ICI and RDO waste. 8.6 Recommended Data Collection and Reporting Frequency Data should be collected and reported on annually to track progress towards the Zero Waste target. This will allow for strategies and actions to be prioritized accordingly.

Greenest City 2020 Action Plan - 09212 98
Goal 6 ‐ Access to Nature
1. GOAL AND TARGET Long Term Goal #6: Vancouver residents enjoy incomparable access to green spaces, including the
world’s most spectacular urban forest. 2020 Target: Every person lives within a five‐minute walk of a park, beach, greenway, or other
natural space; plant 150,000 additional trees in the city. Accountability: Deputy General Manager of Parks and Recreation
Director Streets Engineering Services
2. BACKGROUND 2.1 Context Nature has jobs to do in a city: cleaning the air, tempering temperature extremes, intercepting rain water, providing relief from the stresses of urban life, connecting people with the cycles of life, and offering a setting for communities to be social. People are happier and healthier when they have generous access to nature. Vancouver’s green infrastructure: the parks, waterfronts, greenways, and its urban forest are vital to the functioning and well‐being of the city. 2.2 Baseline Vancouver has more than 220 parks on 1,300 ha of land, close to 12% of the city’s land base. Parks are unevenly distributed due to historical park land acquisition opportunities; park provision differs among neighbourhoods by a factor of eight. Plotting a five‐minute (400m) walking distance around parks, greenways and other green spaces shows the gaps (totalling 8% of the city land base) that currently do not meet the target.
Figure 1: Pink/medium grey areas are those not within a 5 minute walk of a natural space; dark green/dark grey areas are existing parks in the city.
Greenest City 2020 Action Plan - 09212 99
Vancouver has 138,000 street trees and uncounted trees in parks and on private property. Over the last 20 years, every year 1,300 hazardous street trees have been replaced and 2,000 new street trees added. 2. 3 Challenges and Opportunities
Community engagement: The Access to Nature actions are best delivered in close cooperation with local residents and community groups, integrated with other Greenest City initiatives, and embedded in a concerted communication and engagement effort that builds on the momentum achieved with the Greenest City process. This implementation model requires a dedicated multi‐agency staff team.
Scarcity and cost of land: Capital funds to acquire new park land will be targeted to fill the gaps between parks in those neighbourhoods that are deemed park deficient (based on the provision of parks per population), in addition to continuing with existing park land acquisition priorities like making the waterfronts public, protecting unique habitats, completing ongoing park land assemblies and providing more parks in areas of rapid population growth.
Space for trees: In older neighbourhoods, street trees have sufficient space above and below ground to grow large canopies and root systems. In newer and denser developments, sufficient space for street trees is difficult to achieve, severely limiting the mature size of new trees. New strategies need to be developed that make room for legacy trees of the future.
Cost of tree planting: Most of the easy planting sites on streets have been planted, what is left are the more challenging sites, requiring improvements to the street infrastructure in order to create viable conditions for new street trees.
3. STRATEGIES, SHORT‐ AND MEDIUM TERM ACTIONS 3.1 Highest Priority Short Term Actions (3 years):
1. Convert street rights‐of‐way into 4‐6 mini‐parks. 2. Identify land and build 2‐3 new parks in priority neighbourhoods. 3. Plant 15,000 new trees on City and other public property. 4. Green Hastings Park
3.2 Strategies and Short‐ and Medium Term Actions Strategy 1: Convert street rights‐of‐way into mini‐parks. Street rights‐of‐way have the potential to be multifunctional spaces, serving recreational, cultural, social and habitat purposes in addition to being transportation and utility corridors. This is an opportunity to re‐develop existing street rights‐of‐way into mini‐parks, community gardens, nature areas or for other community uses. Within the next Capital Plan phase (2012‐14), six new neighbourhoods will meet the target of every resident within a five‐minute walking distance to park, greenway or green space. Short Term Actions (1‐3 year): Develop a tool kit for use by neighbourhoods including:
a map of candidate street sites respecting the City’s emerging transportation plan, longer term utility strategies, local access and service conditions;

Greenest City 2020 Action Plan - 09212 100
a box of ideas (a grove of bird‐loving trees, a wetland, a street hockey rink, a community garden, a neighbourhood dance floor) in the form of drawings, models, even full‐size park elements;
temporary street closures to try things out;
a community‐driven selection and design process; and
community participation in the construction and animation of the new mini‐parks. Medium Term Actions (3‐9 year): Continue with street to mini‐park conversions across the city, neighbourhood by neighbourhood. Strategy 2: Acquire and build new parks. Capital funds for park acquisition are prioritised for neighbourhoods defined as park deficient when measuring the provision of neighbourhood parks per population. Additional park land acquisition opportunities will be pursued as part of comprehensive re‐developments, as public benefits identified in community or area plans, or to continue with existing land acquisition strategies creating public access along waterfront, protecting important natural areas, and completing on‐going land assemblies. Short Term Actions (1‐3 year): Buy land and build two to three new parks in priority neighbourhoods. Within the next Capital Plan phase, six neighbourhoods will meet the target of every resident living within a five minute walking distance to park or green space. Medium Term Actions (3‐9 year): Continue with park acquisitions across the city, neighbourhood by neighbourhood. Strategy 3: Grow the Urban Forest Work is underway to develop an Urban Forest Management Plan. The urban forest is the sum of all trees in the city, including trees in streets, in parks and on private property. This plan will provide a comprehensive and holistic view of the local urban forest against a background of global issues, develop a set of tree values and benefits, and guide the management and growth of the urban forest with a number of recommendations addressing trees in a variety of conditions, including a revised street tree plan. The plan will include: planting guidelines and other policies; recommendations for tree bylaw changes; ideas for private tree planting programs, education and engagement; tree planting programs for parks regarding habitat and bio‐diversity, remnant woodland rejuvenation; etc. Staff have estimated that there is space for 45,000 new street trees, 45,000 new trees in parks, and 6,000 new trees on other public land. Private land is targeted to be planted with 54,000 new trees. Short Term Actions (1‐3 year):
Complete and implement the Urban Forest Management Plan.
Plant trees sustainably in every available public planting site in six priority neighbourhoods: in streets, parks, and on other public property.
Develop tree planting programs for private properties. Some ideas for the private tree planting program include:
Greenest City 2020 Action Plan - 09212 101
Revise private property tree bylaw provisions to establish a minimum number of trees to be planted and/or retained on all sites, including fruit and nut trees (one additional tree on every residential lot would ultimately increase the number of trees in the city by 90,000).
Revise landscape standards for industrial and commercial zoning districts to require trees to be planted in parking lots.
Increase the number of trees planted and/or retained on private property where no development or redevelopment is anticipated, including fruit and nut trees, through a series of incentives and amendments to the private property tree bylaw.
Explore the use of promotional programs e.g. tree fairs, arbour days, that increase awareness of the benefits of tree planting and ongoing tree care on private property.
Consider a program to provide purchase discounts for trees to be planted on private property in Vancouver.
Engage community groups/interest groups/schools to develop and deliver tree and ecological diversity programs throughout the city.
The neighbourhood‐based implementation approach aims to green up neighbourhoods one by one; progress toward becoming the Greenest City in 2020 will be measured by the growth in the number of greenest neighbourhoods. Medium Term Actions (3‐9 year): Continue with tree planting across the city, neighbourhood by neighbourhood. Strategy 4: Green Hastings Park The implementation of the Hastings Park / PNE Master Plan will transform the Hastings Park of today into a greener, year‐round destination for park use that includes an amusement park, the annual fair, and places for festivals, culture, sport and recreation, leisure and fun. Key components of the plan are the addition of 49 acres of new park space (this includes 11 acres of new habitat space; 22 acres of meadow, gardens and sports fields; and 16 acres of urban plaza with landscaping and seating), a daylighted stream over one kilometre in length, new greenways crisscrossing and circling the park, naturalisation and habitat creation. Hastings Park will deliver on many Greenest City goals, including improving access to nature by increasing park area, creating new diverse habitat, planting trees, improving the quality of stormwater run‐off, and expanding the neighbourhood’s active transportation network. Short Term Actions (1‐3 year): ‐ Design and construction of Empire Field. ‐ Design and construct North‐South and East‐West greenways and internal park connections. Medium Term Actions (3‐9 year): ‐ Design and construction of Plateau Sports Park. ‐ Design and construction of stream daylighting. The new daylighted stream provides public access to
nature, creates new habitat, and restores ecological functions; recaptures site stormwater run off; and improves quality of stormwater entering the Burrard Inlet.
‐ Design and construction of perimeter greenway, which will integrate some residential areas that are currently not within a 5 minute walk of a park.

Greenest City 2020 Action Plan - 09212 102
4. CROSS REFERENCE Local Food. Fruit trees and community gardens can be incorporated into new and existing parks and
other green space. Green Economy. Increased demand for landscaping can increase green jobs, especially for the
ongoing care and protection of trees and vegetation. Climate Leadership. More trees and green space will have a positive impact on climate leadership
through carbon sequestering in the bio‐mass. Green Mobility. More green space within a five‐minute walk of every residence will support
walking. Enhanced bikeways and greenways will encourage walking and cycling as a sustainable transportation choice.
Lighter Footprint. Increased shade by the urban forest can reduce the need for building cooling to reduce energy consumption. Promotion of walking and cycling can reduce fuel consumption by personal motor vehicles.
Clean Air. More trees and green space will have a positive impact on air quality through natural filtering systems and oxygen production.
5. EXTERNAL ADVISORY COMMITTEE MEMBERSHIP
David Zandvliet Associate Professor, Science and Environmental Education Faculty of Education Simon Fraser University
Emily Jubenvill Greenspaces Coordinator, Vancouver Public Space Network
Andrew Appleton Manager of Stewardship & Restoration Services, Evergreen
Dawn Hanna Chair, Jericho Stewardship Group
Catherine Berris BC Society of Landscape Architects
Chan, Kai Asst Prof & Tier 2 Canada Research Chair Institute for Resources, Environment & Sustainability, UBC
Coutts, M Nature Vancouver
Kevin Millsip Sustainability, Vancouver School Board
Patricia Thompson Executive Director, Stanley Park Ecology Society
6. STAFF WORKING GROUP MEMBERSHIP
Tilo Driessen (Chair) Park Board, Planning and Operations
Neal Carley (Chair) Engineering Services, Streets
Alan Duncan (Staff Lead) Park Board, Research and Planning
Eileen Curran Engineering Services, Planning and Development
Doug Manarin Engineering Services, Streets
Douglas Scott Engineering Services, Greenways
Megan Stuart‐Stubbs Park Board, Research and Planning
Cathy Buckham Community Planning
Andrew Pask Social Policy
Katherine Isaac Park Board, Planning and Operations
Ben Mulhall Park Board, Planning and Operations
Bill Stevens Park Board, Arboriculture
Piet Rutgers (retired) Park Board
Amit Gandha Park Board, Arboriculture
Lindsay Bourque UBC Greenest City Scholar

Greenest City 2020 Action Plan - 09212 103
7. PUBLIC ENGAGEMENT SUMMARY Phase One “Improve Access to Nature” had 42 ideas and 1318 votes on the Talk Green to Us forum. The top five ideas for this category were:
Ideas Number of Votes
Put the Blue into Green: daylight our Lost Creeks 231
Green Hastings Park 148
Develop more useable and green school grounds with more trees and community gardens
147
Convert streets to mini parks, green linkages and/or open space 78
Revitalize the False Creek Flats to tidal flats to bring the salmon back to Vancouver
73
“Plant additional trees” had 10 ideas and 441 votes. The top five ideas were:
Ideas Number of Votes
Plant additional trees on wide boulevards 123
Plant trees to reduce your property tax 89
Mandatory soil volume requirements for street trees 64
Plant edibles 60
Plant trees lots and lots of trees! 42
No really strong themes emerged in this goal, and overall there was not very much feedback on the access to nature goal and targets. Themes (mentioned twice):
Support for tree planting ‐ makes for a more enjoyable city
More streets de‐paved and made into greenways. Particular support for locating greenways where there were historically streams, and daylighting these streams over time to make them green and blue ways.
Encourage stormwater infiltration.
Don't like "tree equivalents" ‐ jargon; makes it sound like we think we're apart from nature.
Need for increased awareness: about groundwater, runoff, pollution, fish habitat, watersheds. Additional Comments (mentioned once):
Comment that all actions seem to be leveraged by development at no cost to City, and note that partnerships with private and public institutions will be needed (Board of Trade workshop).
Do some analysis about how new parks in the city can = economic profit; also analysis that city parks will make recreation more accessible and reduce driving for recreation.
Find value of environment in each culture and speak to this ‐ caring about nature not new, it's part of each culture, and that this conversation could be a bridge. Stop romanticizing priviledge of going back to nature (seen as a white perspective). (multicultural round table).

Greenest City 2020 Action Plan - 09212 104
Message of needing to do your share today to make sure environment is still beautiful for future generations.
"green" is about something deeper than trees.
Excited about new parks in park deficient areas.

Greenest City 2020 Action Plan - 09212 105
Goal 7 ‐ Lighter Footprint
1. GOAL AND TARGET Long Term Goal #7: Achieve a one planet ecological footprint 2020 Target: Reduce Vancouver’s per capita ecological footprint by 33% over 2006 levels. Accountability: The accountability for this target will be in part (~12%) with the City of
Vancouver through the achievement of other Greenest City targets and in part (~21%) with community partners.
2. BACKGROUND 2.1 Context: A One Planet Ecological Footprint The ecological footprint measures the amount of land and sea needed to produce the renewable resources consumed by a population, and to absorb its wastes. A one planet ecological footprint evenly divides the amount of biologically productive land and sea available on earth among the earth’s human population. Vancouver’s per capita footprint is 5.31 global hectares, (adapted from Moore, 2011), and a one planet footprint is 1.8 global hectares per capita (Global Footprint Network, 2010). Vancouverites, like all Canadians, are using more than our “fair earth share” of biologically productive land and sea. If everyone on earth lived like we do, we would require an additional two planet earths. Vancouverites are drawing down our natural capital at a higher rate than the earth can sustain (e.g. marine fish) and overloading our waste sinks (e.g. accumulation of carbon in the atmosphere). This is being done at the expense of other people, and ecosystems, who must survive with less. A one planet per capita footprint for Vancouver requires visualizing and creating a city that is vibrant, liveable and just, and in which our habits and modes of production and consumption remain within the limits of the earth’s ecological carrying capacity.
Figure 2: Components of the Ecological Footprint. Source: Global Footprint Network, 2010

Greenest City 2020 Action Plan - 09212 106
2.2 Baseline9
Figure 1: Components of Vancouver’s ecological footprint (Adapted from J. Moore, 2011) Table 1: Description of the components of Vancouver’s ecological footprint
2.3 Challenges and Opportunities Four main challenges and opportunities accompany the lighter footprint long‐term goal and 2020 target. First, City‐led actions alone will not achieve the 2020 target. Some components of the ecological footprint, in particular food and consumer goods, are not traditionally within the scope of City regulation or policy and other components require lifestyle changes in order to succeed even when the City does have some policy tools to use (e.g. transportation choices). Many actions will need to be taken by senior levels of government. Significant actions are required from Vancouver’s local businesses, entrepreneurs, diverse communities, organizations, and individuals to experiment with, support and catalyse Vancouver‐wide lighter footprint change. To ensure such participation and leadership, the ecological footprint concept and its role in Vancouver’s Greenest City aspirations must be clearly communicated in a way that
9 Value for Senior Government Services is a placeholder estimated from Global Footprint Network data (2003) and Moore (2011). Actual value must be calculated at a future date.
Components Food and beverages: Full production life cycle including transport for: meats; dairy; fish; grains; legumes; fruits and vegetables; oils; tea; coffee; sugar; cocoa; other beverages
Transportation: Commercial; private; transit; embodied and operating energy; materials and energy required for up‐keep of streets and lanes
Consumable Items: Full life cycle of goods including disposal: paper products; textiles; plastics; rubber; metals; glass; household hygiene products Waste Operations: Energy, materials and land required to operate the Vancouver Landfill; Vancouver South Transfer Station; Vancouver Liquid Waste Facility; Vancouver Green Waste Collection facility; Vancouver portion of Cache Creek Landfill
Buildings: Energy and materials to build, operate and maintain
Senior Government Services: Resources that support federal and provincial services such National Defence; provincial highways; RCMP operations. All Canadian residents accept a share as part of their ecological footprints.

Greenest City 2020 Action Plan - 09212 107
compels and inspires a sense of shared responsibility and opportunity.10 A successful public engagement campaign resulting in measurable outcomes will be central to achieving the one planet footprint goal. Second, there is no blueprint for transforming our modern, industrialized city into one where each resident uses only their one planet share of resources.11 This is going to require that Vancouver harness it’s creative talents as much as it builds on it’s sustainability knowledge and capabilities – this challenge requires charting new territory, a commitment to learning, experimentation and innovation, and to evidence based action toward one planet living. Third, the one planet goal requires ongoing innovation in City policy and regulation. The Greenest City targets, actions, and strategies established in 2011 will need to be revisited through to 2020 to ensure that all opportunities for reducing ecological footprint through use of the City’s policy and regulatory tools are taken advantage of. Finally, the creation of a tool to measure the ecological footprint of a city using local data has been formidable. The work of PhD candidate Jennie Moore from the University of British Columbia has taken this work to the next level of sophistication for Vancouver, as well as other cities around the world. Some data sets still need to be developed more fully, most notably the food data needs to be localized, and the senior government services data and analysis needs more work. As such, the baseline methodology is likely to change as the footprinting tool continues to improve and data becomes more available. This is a great opportunity for Vancouver to show innovation and leadership through supporting the academics working to create new tools for cities to use to more fully understand and address their environmental impacts.
3. STRATEGIES AND ACTIONS The strategies for achieving the 2020 target centre on three themes. 1. Highlight the success of other departments in the City of Vancouver toward reducing ecological
footprint and report out on progress made toward achieving the lighter footprint target. 2. Engage the public in dialogue and co‐production of solutions for lighter footprint. “Engagement”
means working across the spectrum of public participation including informing, consulting, involving, collaborating, and empowering12. Encourage and Enable lighter footprint for individuals, diverse communities, organizations, institutions and businesses through delivery of tools, programs and incentives.
3. Exemplify lighter footprint in the City of Vancouver’s own operations. Reductions must be achieved among the five largest components of Vancouver’s ecological footprint that the City and community have the ability to change: food; transportation; consumables; buildings; and waste. Actions will be evidence‐based and designed for adaptation to ongoing evaluation and monitoring. Further ecological footprint reductions may be achieved through strengthening actions in other GC targets during implementation, as the City’s policy tools change and as new information becomes available. 10 In a recent survey conducted for the City of Vancouver (Mustel, 2010), 62% of Vancouverites surveyed had heard of the ecological footprint but only 7% could identify its true meaning. 11 Some industrialized, modern cities have lower per capita ecological footprints than Vancouver, for example Milan, Italy (4.17ha/capita) [globalfootprintnetwork.org, 2010], but no city has mapped out a route to one planet living. 12 International Association for Public Participation. IAP2 Spectrum of Public Participation, 2007.

Greenest City 2020 Action Plan - 09212 108
The per capita ecological footprint of Vancouver should be measured every three years beginning 2012 and using the 2011 census data. New local data sources will be required particularly for food, consumables and waste. More detail on how the ecological footprint baseline for Vancouver was developed can be found in Appendix 3.
3.1 Highest Priority Short Term Actions (3 year) 1. Green Neighbourhood Pilot. City of Vancouver works with partner organisations to pilot a suite of
green neighbourhood strategies, infrastructure and programs in one Vancouver neighbourhood. Evaluate effectiveness of program against Greenest City targets, and explore rolling out to other Vancouver neighbourhoods in future. Will attempt to focus funding going to pilots and capital projects from other departments in one neighbourhood, where possible.
2. Greenest City grants. Actively support non‐profits and social enterprises working to reduce ecological footprint and create green neighbourhoods.
3. Open Greenest City data. Work with Open Data Initiative in the IT department to open Greenest City data, starting with transportation data sets. Collaboratively develop plans to encourage the innovative use of this data.
3. 2 Strategies and Short‐ and Medium Term Actions Strategy 1: Highlight the success of other departments in the City of Vancouver toward reducing ecological footprint and report out on progress made toward achieving the lighter footprint target. Short Term Actions (1‐3 year):
Through delivery on the other nine Greenest City goals, explore innovations in zoning bylaws, property taxes, business licences, building codes, building permits and other instruments that will result in lighter footprint activity and practices.
Develop and implement strategic, coordinated community‐based social marketing to encourage behaviour change.
Evaluate the City granting programs for funds that can be used to support organizations in implementing Greenest City targets.
Develop Greenest City event requirements for all community events that are permitted by the City. Medium Term Actions (3‐9 year):
Evaluate, monitor and report bi‐annually, and more often on key metrics regarding progress on Greenest City targets, strategies and actions. Develop systems, tools, and protocols to report on the achievements and progress of the Greenest City action plans and related local initiatives in the city, industry, and community. Include data in City’s Open Data program and encourage its use by others.
Through delivery on the other nine Greenest City goals, identify opportunities for local government to appeal to, and collaborate with, senior levels of government on policies that will reduce the senior government services component of the ecological footprint.
Strategy 2: Engage in partnerships, dialogue and idea generation. Encourage and enable lighter footprint lifestyles for individuals, diverse communities, organizations, institutions and businesses through delivery of tools, programs and incentives.

Greenest City 2020 Action Plan - 09212 109
Short Term Actions (1‐3 year):
Develop and launch a program of in‐person public engagement focused on one pilot neighbourhood. The goals for this action are to invite two‐way dialogue with the public on the Greenest City using multiple methods (e.g. conversations, art, workshops), and to catalyse systems‐wide, community and individual actions. Specific efforts will be made to engage Vancouver’s diverse multi‐cultural communities. One aspect of this program could be an Ambassadors Program where trained volunteers meet with groups, including different cultural communities, to plan and implement projects and activities, building on the success of volunteerism during the Olympics.
Develop and launch a Greenest City information and action campaign using integrated social media tools (website, Facebook, Twitter, on‐line community). The goals of this campaign are the same as those listed for in‐person engagement above.
Work with a Vancouver Business Improvement Association to pilot a Greenest City program that could include a lighter footprint certification process, awards and incentives for innovations in lighter footprint practices.
Partner with, and support organizations that support small and medium sized enterprises in their efforts to reduce their ecological footprints and negative environmental impacts in a pilot neighbourhood.
Greenest City Mayor’s award program, potentially using a Citizen’s Jury selection process.
Implement the Greenest City Conversations Project with University of British Columbia to test and evaluate methods of public engagement.
Medium Term Actions (3‐9 year):
Develop scenarios/visualization of the Greenest City including living with a one planet ecological footprint. Partner with organizations, community and school groups to have them develop scenarios and visualizations of one planet or lighter footprint living.
Establish partnerships with diverse local organizations and stakeholders to leverage existing networks and expertise in catalyzing public interest, stimulating experimentation, and taking action.
Support the development of global metrics for footprints of different cities around the world and encourage the global sharing of ideas, solutions, and results. See how we stack up against competition and see how we can both learn from and inspire others.
Invite neighbourhoods and individuals to self‐organize and identify policy barriers to lighter footprint living. For example, a neighbourhood could request a street closure, or new median to restrict access to only one end of the block as a means to reduce private vehicle traffic and open up public space for other uses.
Work with partners to establish a volunteer corps to coach and share “how‐to” information with neighbours and community groups and deliver education materials.
Partner with an organization to establish a comprehensive local directory of sustainable choices for local, lighter footprint goods and services.
Encourage use of City’s Greenest City data by mobile APP developers, businesses, community organisations, and international researchers using the Open Data program, and to develop innovative engagement and monitoring tools.
Strategy 3: Exemplify lighter footprint in the City of Vancouver’s own operations

Greenest City 2020 Action Plan - 09212 110
Short Term Actions (1‐3 year):
Establish Greenest City guidelines for all events held by, or hosted at, the City; the guidelines would apply to waste, food services, other procurement choices, and mobility choices associated with events.
Fully implement the Corporate Environmental Framework, the Carbon Neutral Operations Plan, the Ethical Purchasing policy and other City instruments already in existence.
Coordinate, facilitate and execute actions described in all of the Greenest City 2020 Action Plans in order to advocate for achievement of the targets as well as hold the Greenest City vision. This should be done internally, to support all of the departments working on each target in finding efficient, effective, and integrated ways to implement their plans as well as externally in the community.
Medium Term Actions (3‐9 year):
Publish progress on the City’s website and share stories of success with Vancouverites and other cities.
Create an internal Greenest City website for staff ideas, and profiles of internal initiatives and successes.
Integrate a sustainability charter throughout the City of Vancouver to coordinate ecological and socio‐economic policy, planning and programming.
3.3 Wedge Analysis This table estimates the footprint reduction that is intended to result from the strategies and actions described in this plan, as well as in several other Greenest City 2020 Action Plans that have a key role to play in reducing ecological footprint (local food, zero waste, green transportation, green buildings, climate leadership). Because many of the actions rely on changes in choices made by people and organisations, it is challenging to estimate the anticipated footprint reductions from these actions. This analysis aims to demonstrate where the largest ecological footprint impacts are, and how our City‐ and community‐led actions could contribute to achieving the 33% reduction target. Table 2: Wedge analysis of the reduction in ecological footprint expected from proposed actions (estimated from Moore, 2011)
Contributors to EF % of Total Per Capita
EF
Targets, Strategies and Actions from other GCAPs
Target Reduction in Total EF
LF Strategies and Actions
City Exemplified
Action
FOOD13 40%
Meat, Fish, Eggs (beef & veal = 13%) Flour, other Grains Dairy Oils Other
19%
7.2% 5.5 % 5.3% 3%
Reduce consumption of high impact foods by 10%
3.4% Further 10% reduction in high impact foods = 3.4% EF
Food procurement target TBC
CONSUMABLES 14%
Paper 8% Reduce 2% Further reduce Corporate
13 Amount of land area required and mode of production eg. grain‐fed livestock and level of pesticide use on crops, are the largest factors in the ecological footprint of these foods. Balancing consumption of these foods with other lower impact foods will help to reduce the ecological footprint.

Greenest City 2020 Action Plan - 09212 111
Metals Household hygiene (incl. diapers) Other
1.3% 1%
3.7%
consumption of all new products, with a focus on paper products, by 15%
consumption of all new products, with a focus on paper products, by an additional 15% = 2% EF
waste reduction target TBC
WASTE14 1%
Energy to transport solid waste to disposal site; solid and liquid waste facilities
1% Reduce Solid waste to landfill and incinerator by 50%
0.5% Requires full participation of community in City programs
Corporate waste diversion target TBC
TRANSPORTATION 15%
Private Vehicles Commercial Vehicles Embodied energy in vehicles Air Travel Other
8% 1%
2.6%
2.6%
1.8%
Reduce vehicle kilometres travelled by 20%
2% Further 10% reduction in VKT = 1% EF Reduce air travel distance 30% = 0.8% EF
Corporate VKT target TBC Corporate business travel target TBC
BUILDINGS 12%
Operating Energy: ‐Commercial ‐Residential Other
5% 5% 2%
20% reduction in energy use and GHGs in existing buildings New construction energy demand reduced by 50% District Energy Systems
1.9%
0.6%
1.1%
Reduce energy use in existing buildings by a further 10% = 1% EF
Energy efficiency target for existing CoV buildings TBC
SENIOR GOVERNMENT SERVICES
18%
GCAP LF Community Total
TOTALS 100 ‐11.5% ‐8.2% ‐19.7%
14 Methane, a significant greenhouse gas emitted at landfills, is not included in the ecological footprint. This is because EF measures available renewable resources and sinks: methane is not readily absorbed by the earth’s atmosphere, while carbon is more readily absorbed.

Greenest City 2020 Action Plan - 09212 112
The table above highlights the largest contributors to key components of Vancouver’s ecological footprint. It identifies GCAP targets and strategies that will help to reduce the size of each component, and also reveals a significant gap in achievement of the target that will need to be filled through strategies and actions developed in future. Smaller contributors to the components are combined in the line, “Other”. Opportunities exist for reductions in these smaller contributors. For example, Other Food includes coffee, tea, sugar and cocoa which together make up 2.0% of Vancouver’s per capita ecological footprint. Reduced consumption of these items will yield a small but still meaningful reduction. In the Building component, changes in types and sourcing of materials, also 2.0% of per capita EF, can help. No actions are listed for the Senior Government Services component, however, the City, community members, organizations, and businesses can use their networks and partnerships to engage with, and support senior levels of government in pursuing lighter footprint operations.
4. CROSS REFERENCE The targets, and their associated strategies and actions, from other Greenest City working groups that directly support lighter footprint are: Green Economy
Ensure that 65% of Vancouver employees work for businesses that are engaged in greening their operations, over 2011 levels.
Establish a Vancouver Green Enterprise Zone, particularly demonstration projects around reuse technologies and local food.
Green pre‐procurement program and local food procurement policy. Climate Leadership
Integrated land‐use, transportation and energy planning strategy to develop compact, mixed‐use communities
Sustainable energy strategy, including creation of new district energy systems using renewable energy.
Green Building
The carbon neutral new construction by 2020 target includes a strategy of reducing energy demand from a base case building by 50% plus requirement for renewable energy as a portion of heating and cooling, and both of these contribute to a footprint reduction.
Reduce energy use and greenhouse gas emissions in existing buildings by 20% over 2007 levels – all strategies and actions in support of these targets will reduce ecological footprint, particularly the existing building target.
Green Mobility
Reduce vehicle kilometres travelled by 20% from 2007 levels – all strategies and actions in support of this target will reduce ecological footprint, important to include light‐ and heavy‐duty vehicles.
Urban goods movement strategy.
Shift to low‐ and no‐carbon vehicles. Zero Waste
Reduce total solid waste going to landfill and incineration by 50% from 2008 levels – all strategies and actions in support of this target will reduce ecological footprint, particularly those that focus on waste reduction.
Food
Ensure that each neighbourhood has, as needed: a. Community kitchens; community composting b. A farmers market or pocket market opportunities
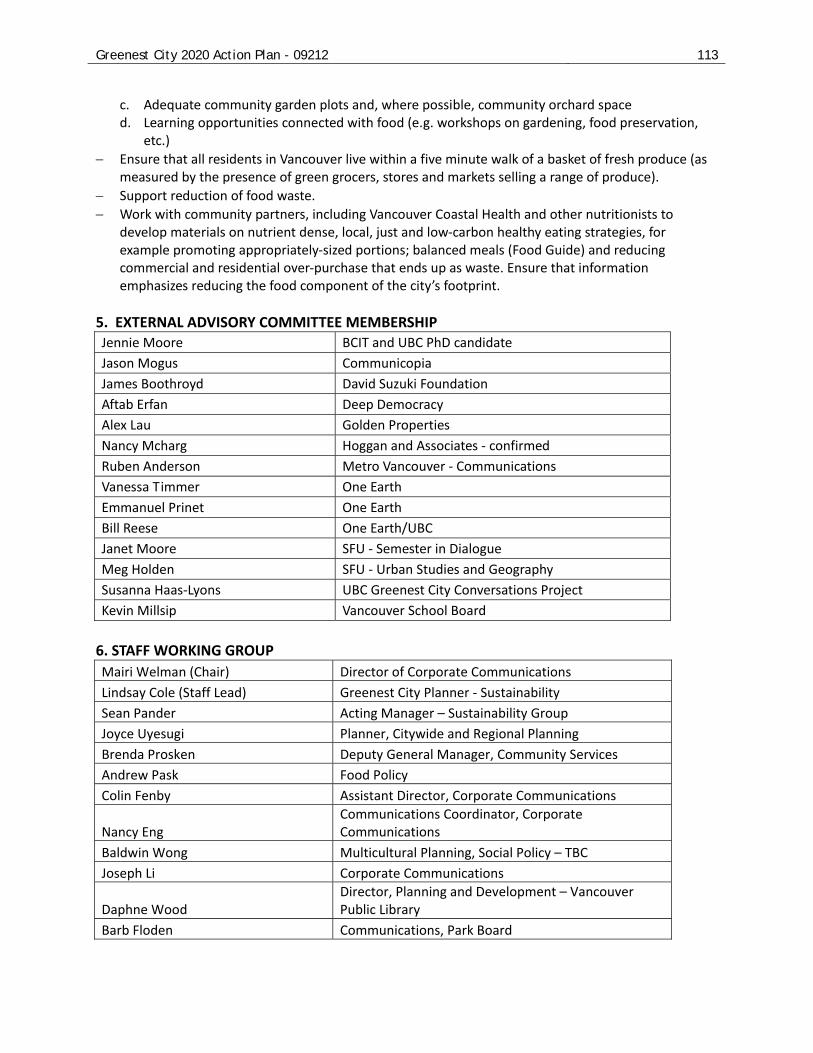
Greenest City 2020 Action Plan - 09212 113
c. Adequate community garden plots and, where possible, community orchard space d. Learning opportunities connected with food (e.g. workshops on gardening, food preservation,
etc.)
Ensure that all residents in Vancouver live within a five minute walk of a basket of fresh produce (as measured by the presence of green grocers, stores and markets selling a range of produce).
Support reduction of food waste.
Work with community partners, including Vancouver Coastal Health and other nutritionists to develop materials on nutrient dense, local, just and low‐carbon healthy eating strategies, for example promoting appropriately‐sized portions; balanced meals (Food Guide) and reducing commercial and residential over‐purchase that ends up as waste. Ensure that information emphasizes reducing the food component of the city’s footprint.
5. EXTERNAL ADVISORY COMMITTEE MEMBERSHIP Jennie Moore BCIT and UBC PhD candidate
Jason Mogus Communicopia
James Boothroyd David Suzuki Foundation
Aftab Erfan Deep Democracy
Alex Lau Golden Properties
Nancy Mcharg Hoggan and Associates ‐ confirmed
Ruben Anderson Metro Vancouver ‐ Communications
Vanessa Timmer One Earth
Emmanuel Prinet One Earth
Bill Reese One Earth/UBC
Janet Moore SFU ‐ Semester in Dialogue
Meg Holden SFU ‐ Urban Studies and Geography
Susanna Haas‐Lyons UBC Greenest City Conversations Project
Kevin Millsip Vancouver School Board
6. STAFF WORKING GROUP
Mairi Welman (Chair) Director of Corporate Communications
Lindsay Cole (Staff Lead) Greenest City Planner ‐ Sustainability
Sean Pander Acting Manager – Sustainability Group
Joyce Uyesugi Planner, Citywide and Regional Planning
Brenda Prosken Deputy General Manager, Community Services
Andrew Pask Food Policy
Colin Fenby Assistant Director, Corporate Communications
Nancy Eng Communications Coordinator, Corporate Communications
Baldwin Wong Multicultural Planning, Social Policy – TBC
Joseph Li Corporate Communications
Daphne Wood Director, Planning and Development – Vancouver Public Library
Barb Floden Communications, Park Board

Greenest City 2020 Action Plan - 09212 114
Laurie Best Director, Web Redevelopment Project
Jennifer Bailey Water Quality and Conservation Program Manager, Engineering
Amy Fournier Outreach Coordinator –Sustainability Group
Paul Henderson Strategic Initiatives, Engineering
Cornelia Sussman UBC Greenest City Scholar
Avery Titchkosky UBC Greenest City Scholar
Maggie Wang UBC Greenest City Scholar
Polly Ng UBC Greenest City Scholar
7. PUBLIC ENGAGEMENT SUMMARY Phase One On the Talk Green to Us forum 61 ideas and 3041 votes were submitted in the Lighter Footprint category. The top five ideas were:
Ideas Number of votes
Encourage a vegan diet 1083
Create a degree granting inter‐institutional program within the City where students can earn credits while researching, studying and solving pressing issues
732
Support green art organizations 235
Promote organic, Fair Trade and low‐carbon agricultural products 101
One city block: turn back alleys into a place for community building through shared resources, integrated waste pickup, composting and community gardens
90
Phase Two Themes (mentioned at least 3 times):
Be inclusive; work with connectors in the city; find allies/spokespeople/delegates/ambassadors in different communities (business leaders, taxi drivers, youth, new immigrants, First Nations, multigenerational, different classes/incomes)
Use technology to enable and support action (not on it’s own): range of linked tools, social media, real time tracking of performance on targets, brochures don’t work on their own, open data
Start with topics that people care most about; use language that is meaningful, tangible and accessible for people: prosperity; health; economic development; in response to Maslo’s hierarchy of needs; show holistic solutions/responses; “green” and “sustainable” lack meaning; use strong emotive language rooted in fact.
Go to where people are to get outside the choir: cultural festivals; neighbourhood houses; seniors centres; community school teams; residents associations, BIAs, faith communities
Look for champions in different places, look for the ordinary people doing extraordinary things. Reward and incent people; recognize them.

Greenest City 2020 Action Plan - 09212 115
Focus on making the “green choices” the easy, cost effective, routine, everyday choices. Create infrastructure to make these choices easier; address challenges/barriers; build in full costing; focus on changing behaviours; use labeling so that people can make informed choices.
Focus on action not a big branding campaign: tangible actions not just talk; work with keeners to take action not participate in workshops; match requests for action from community with strong policy at City
Bring art, culture, music, creativity into events and activities; create space for people to learn and participate in ways of their choosing/design; make engagement and action fun.
Provide communities and organisation with tools to self‐organise and facilitate their own change in their own language and/or in ways that are meaningful for them.
Use generational storytelling; show people what is happening (video, tour pilot projects, etc.)
Create a package of pilot projects and invite neighbourhoods (several blocks) to participate
Build partnerships: use grants and matching funds to build partnerships for implementation
Speakers series, forums, places to share ideas
“Creating a green culture isn't just taking the steps, it's something you believe in and practice every day” (Multicultural round table)
Interesting ideas (mentioned only once):
Need a 3‐5 year funding commitment and mandate to really make a dent in changing public consciousness and behaviour
Need to have resources, capacity and knowledge to add value to the greenest city work being led by other departments
Work with media to sustain a series of articles
Focus on staff engagement in order to increase size of “greenest city team” to include many others from other departments; UBC has a program that could be modeled
Support building of GC goals and targets into workplans of others in and outside of the CoV
Engage cultural communities uniquely
Build research and evaluation into public engagement and share this learning with the broader community
Make the discussion first about the bigger picture, not about personal change
Increase the scientific literacy of the community
Align the social campaign across the organisation
What is “good”? So many choices are partly good, how to cut through this and make environmentally and socially responsible decision‐making easier and clearer for people?
Build capacity in groups, don’t just “outreach”
Engage through infrastructure and action (e.g. community gardens)
Open up opportunities for creative solutions, and for leaders to emerge and engage
Build in feedback mechanisms (e.g. scales in garbage cans)
Ensure that people feel empowered
Ensure that there are methods to follow up on dialogue that is happening in the community
8. BASELINE METHODOLOGY Prepared for the City of Vancouver by Jennie Moore, PhD student, University of BC. The scope of the study is limited to tracking energy and materials associated with urban consumption patterns of Vancouver residents. This includes commercial, institutional and utility services and their related ecological footprint. This excludes energy and materials associated with large industrial

Greenest City 2020 Action Plan - 09212 116
processes, e.g. chemical manufacturing, rail and shipping activities tied to the port. These are excluded because the intent is to understand the energy and materials consumption associated with the lifestyles of the Vancouver population, not the total flow‐through of energy and materials that constitute Vancouver’s role as one of Canada’s most important trade gateways. The year 2006 is chosen as the base year for the study because it represents the latest Canadian census and the most recent year for which complete data are available. The data are allocated according to the following components: food, buildings, consumables and waste, transportation, water. Within each component, sub‐components are then grouped according to data about: i) the weight and type of materials consumed, ii) embodied energy associated with producing and transporting those materials, iii) energy used in operations, e.g., for operation of equipment, and iv) built land area, e.g., building floor plate. Further disaggregation within each sub‐component represents the allocation according to consumption by sector, e.g., residential, commercial, and institutional in order to provide a more refined analysis (see Figure 1). Figure 1: Component structure of the integrated metabolism and ecological footprint assessment
Most of the data required to compile Vancouver’s urban metabolism comes from local and provincial government and provincial crown corporation sources including: i) City of Vancouver reports on greenhouse gas emissions, solid waste management and recycling, and land use; ii) Metro Vancouver reports on: common air contaminants and greenhouse gas emissions inventories, solid waste management and recycling, waste composition surveys, water management, wastewater management, and land use fact sheets; Greater Vancouver Transportation Authority reports on: travel surveys that reveal vehicle kilometres travelled by vehicle type; iii) Province of British Columbia reports on: energy use and greenhouse gas emissions that include source characterization data for solid waste, motor vehicles, and building types; BC Hydro reports on: electricity consumption and related greenhouse gas emission coefficients. Data from the largest natural gas company in the Province of British Columbia was also obtained for residential, commercial and institutional building natural gas consumption. iv) This data was supplemented with lifecycle assessment data derived from the Athena Impact Estimator for Buildings software program and the literature for various infrastructure, household and corporate consumer items including: primary building materials, e.g. wood and concrete; road construction: e.g. asphalt; personal consumables such as: electronic equipment, paper and cardboard, plastics, and fibres used in clothing and upholstery. It is important to note that data for the food component was obtained primarily through national statistics, including input‐output tables and the national census as part of a separate research project led by Dr. Meidad Kissinger, Department of Geography and Environmental Development, Ben‐Gurion University of the Negeve, Israel. These national data were then extrapolated

Greenest City 2020 Action Plan - 09212 117
across the national population to derive a per‐capita value that was then multiplied by the total Vancouver population of 578,041 people (Statistics Canada, 2006). Future studies would benefit from the availability of local data about food production and consumption within the City and Province. To determine Vancouver’s ecological footprint, the area of land, measured in hectares, that is required to provide the various material and energy inputs documented for each component and its sub‐components in the metabolism study is calculated. National average yield data for a variety of foods, including fisheries, and fibres is calculated and converted to equivalent global average yields using reference values provided by Statistics Canada, Agriculture Canada, Natural Resources Canada, Department of Fisheries and Oceans, and the United Nations Food and Agriculture Association. This step provides the global average yield data for various land types required to produce the various products, e.g. crop land, pasture land, fishing area, forest land. For energy land, meaning land required to sequester the carbon dioxide emissions associated with fossil fuel and methane combustion, the global average carbon dioxide sequestration value of forested land less the amount sequestered by the oceans is calculated (Ewing et al. 2009; IPCC 2006). Next, the equivalent global bio‐productive capacity, i.e., global hectares, that measures an average bio‐productive capacity for all land types, including fishing area, is calculated using the 2006 Equivalence Factors calculated by the Global Footprint Network (Ewing et al. 2009). Once converted to global hectares, these land types become commensurate so that the total demand for ecological services can be expressed as one value (Ewing et al. 2009). Thus, the output of the ecological footprint assessment is a measure, in global hectares, of ecological services required to produce the fibre and food and to sequester the emissions associated with combustion of fossil fuels and methane that is necessary to support the population of the City. References: Ewing, B., Goldfinger, S., Oursler, A., Reed, A., Moore, D., Wackernagel, W. 2009. The Ecological Footprint
Atlas 2009. Oakland: Global Footprint Network. Intergovernmental Panel on Climate Change. 2006. 2006 IPCC Guidelines for National Greenhouse Gas
Inventories Volume 4: Agriculture Forestry and Other Land Use. Statistics Canada. 2006. Census Data: Community Profiles: Vancouver, British Columbia (Census
Metropolitan Area). Recommendations for Future Research 1. Establish methods for, and record‐keeping of, local food consumption data. This project could be
carried out in cooperation with UBC or SFU through student project contract work arrangements. The following data are required: food sales by volume per item, beverage sales by volume per item, and from grocery store chains as well as importers and other vendors. Additional data needs include a survey of Vancouverites’ dining out habits: how often; what kinds of foods consumed. Vancouver‐specific food consumption is required to establish a local baseline for the ecological footprint of food and to monitor changes as the ecological footprint is updated every three years. The current draft ecological footprint baseline uses national data for food metrics.
2. Commission calculation of Government Services component of ecological footprint. This project could be carried out in conjunction with UBC or SFU. An accurate Government Services measure would apply to any Canadian municipality and could be shared as an open source.
3. Collect existing data or commission research into total yield potential of urban agriculture in Vancouver.

Greenest City 2020 Action Plan - 09212 118
Goal 8 ‐ Clean Water
1. GOAL AND TARGETS Long Term Goal #8: Vancouver will have the best drinking water of any city in the world. 2020 Target 1: Meet or beat the strongest of British Columbia, Canadian and international
drinking water quality standards and guidelines. 2020 Target 2: Reduce per capita water consumption by 33% from 2006 levels. Accountability: Director – Water and Sewers.
2. BACKGROUND
Ensuring high quality drinking water for current and future generations of Vancouverites is a critical responsibility of the municipal government. Fundamental to this is providing opportunities for access to drinking water for the maintenance of public health, and developing comprehensive conservation programs to secure the source waters for future need. Expanding the water supply is costly in financial and ecological terms; avoiding source expansion through conservation is the best way to live within our means.
Currently Vancouver’s drinking water consistently meets the provincial water quality standards and Health Canada’s guidelines. However, at an average daily residential consumption per capita of 320 litres (2006 figure), Vancouver is barely under the Canadian average of 329 litres15 and far exceeds the per capita water consumption of leading global cities.
2.1 Context
Metro Vancouver supplies the City of Vancouver with drinking water that is collected in three protected freshwater lakes located on the North Shore Mountains. These watersheds provide ample storage of water during the winter months and are drawn down during the drier summer months. These sources are expected to provide an adequate water supply assuming current consumption rates and population growth until 2070, at which time a source would need to be expanded or a new source developed. However, climate change may have unknown effects on rainfall and snowfall in our watersheds.
Water is supplied on a cost recovery basis; users pay what it costs the municipality to purchase and distribute the water. Water supply and delivery is not subsidized by general taxation; all the monetary costs associated with bulk purchase of water from Metro Vancouver and delivering water including capital, operation, administration, and maintenance costs are fully recovered by user fees. Similarly wastewater fees recover the costs of Vancouver’s wastewater utility.
Most of Vancouver’s Water Utility costs are fixed because the system is gravity fed and sized to serve fire suppression flow. Fire suppression flow requirements far exceed those of domestic consumption; therefore, the costs related to the design of the system do not vary with domestic consumption fluctuations. However, expansion of the infrastructure to utilize new water sources would have very high costs.
Over the next 5 years, without any changes to conservation and quality programs, water rates will increase by approximately 62% or by roughly $230 per single family residential service. This increase is driven primarily by Metro Vancouver bulk water rate increases required to recover capital costs for water filtration, UV and ozonation initiatives.
15 “Wise Water Use”, Environment Canada, accessed Sept 28, 2010, http://www.ec.gc.ca/eau‐water/default.asp?lang=En&n=F25C70EC‐1

Greenest City 2020 Action Plan - 09212 119
Industrial, commercial, institutional, and multi‐family residential buildings are metered and pay for water based on volume. Single and two‐family dwellings pay a flat rate for water.
2.2 Baseline Metrics
Target 1 ‐ Water Quality
The City of Vancouver has a well‐established Water Quality Monitoring Program that involves routine testing for microbiological indicators, physical and chemical water quality parameters from representative locations across the entire City. Vancouver’s drinking water consistently meets BC’s Drinking Water Protection Regulation standards and Health Canada’s Guidelines for Canadian Drinking Water Quality.
Figure 1: Bacteriological quality of drinking water, incidents of non‐compliance 1995‐2009
In a comprehensive public survey commissioned by Metro Vancouver, citizen confidence in drinking water has improved over two‐year period of since the launch of the Tap Water campaign in 2008. Respondents reported significant overall reduction in the use of bottled water (decrease of 52%) and a 15% increase in the use of tap water for drinking water purposes.
Target 2 ‐ Water Consumption
The City’s water consumption has been tracked closely for 25 years through a set of water meters that account for incoming bulk water from Metro Vancouver16.
16 Consumption for industrial, commercial, institutional and multi‐family residential sectors is measured through a system of 14,000 water
meters. Average consumption per single/dual family home is based on total consumption, less non‐revenue water (system leakage, city facilities and parks) and metered consumption, divided by the number of service connections in this sector.
0
10
20
30
40
50
60
70
80
90
100
1995 1996 1997 1998 1999 2000 2001 2002 2003 2004 2005 2006 2007 2008 2009
Inc
ide
nc
es
of
No
n-c
om
pli
an
ce
total coliform >10cfu/100ml
fecal >1 cfu/100ml

Greenest City 2020 Action Plan - 09212 120
2,000
3,000
4,000
5,000
6,000
7,000
8,000
1986
1988
1990
1992
1994
1996
1998
2000
R20
0220
0420
0620
08
Year
Co
nsu
mp
tio
n (
m3)
100
200
300
400
500
600
700
Res
iden
tial
Co
nsu
mp
tio
n (
lpcd
)
IC&I Sector21% Reduction in Water Consumption over 25 years (per service)
Residential Sector12% Reduction in Water Consumption over 25 years
Figure 2: Twenty five year water consumption trends in residential and ICI sector
In 2006, the average daily residential per capita water consumption was 320 litres, on par with the Canadian average of 329 litres. A downward trend in total water consumption has been seen across all sectors over the last 25 years. That said, Vancouverites consume significantly more water than residents of other international cities with similar climates who have an average per capita consumption between 150 and 220 litres per day.
System Leakage11%
Industrial, Commercial, Institutional
25%
Multi-Family Dwelling
26%
Single/Two Family Dwelling
30%
Other (Including CoV properties)
4%
Parks4%
Figure 3: Water use by sector (2008)

Greenest City 2020 Action Plan - 09212 121
2.3 Challenges and Opportunities
While Vancouverites depend on tap water for drinking, washing, irrigation, industrial and commercial processes, few people give much consideration to the value of water. A clean supply combined with a temperate climate and favourable geography result in relatively low economic costs for water. A flat rate pay system in the residential sector disconnects consumers from the volume they use. These conditions result in high consumption levels.
3. STRATEGIES AND ACTIONS
3.1 Highest Priority Short Term Actions (3 year):
1. Require water metering on all new single and dual family home services (new construction and major renovations) effective 2012. Mandating use of water meters is considered best practice by water purveyors. It allows for billing equity, provides water users with consumption data to support behaviour change and supports efficient management of the water distribution network.
2. Develop and commence enhanced water education, incentive and conservation programs. To realize the potential for water conservation by 2020, an initial investment is required to launch a number of programs to increase public awareness through education and enforcement. Resources will be dedicated to run pilot programs, further develop retrofit and incentive programs for Council consideration and explore and capitalize on partnerships with utilities and higher levels of government.
3. Eliminate combined sewer overflows from sewage outfalls at Crowe and Burrard Streets and develop Integrated Stormwater Management Plans for the City and the Musqueam watershed.
4. Continue to expand public access to drinking water. Plan and install access to drinking water in public spaces.
3.2 Strategies and Actions for Target 1: Water Quality
Vancouver’s drinking water quality is considered to be some of the best in the world. The strategies outlined are ways we can ensure high quality water into the future and provide public access to clean, safe drinking water for our citizens. Strategy 1 ‐ Water Quality Monitoring and Protection
Short Term (1‐3 year) Actions:
Continue the use of real‐time water quality monitoring technology for early detection of contaminants.
Continue the replacement of water mains, and valves on a life‐cycle basis to minimize pipe breaks, leakage, and maintain reliable water service.
Decrease potential for stagnation by increasing water circulation through the “looping” of dead end
water mains.
Ensure the water is tested from appropriate and representative locations. Hydraulic modeling of the water system will be used to determine representative flow locations.
Ensure the number of water quality tests conducted exceeds requirements in regulatory plans.
Continue to test appropriate water quality parameters for compliance with strongest of BC, Canadian and International standards and guidelines as appropriate to the distribution system.

Greenest City 2020 Action Plan - 09212 122
Medium Term (3‐9 year) Actions:
Prevent drinking water contamination through expansion of the Cross Connection Control Program, which serves to regulate and monitor the installation of backflow devices to safeguard against contamination of drinking water from private side sources. Program goal is to increase audits of ICI parcels to a 5 year cycle.
Strategy 2 ‐ Leadership and Advocacy
Short Term (1‐3 year) Actions:
Accelerate combined sewer separation in the areas discharging into False Creek.
Strengthen advocacy and leadership role through the Regional Engineers Advisory Committee in order to help advance regional water quality improvement and sewage treatment initiatives and extend the life of drinking water sources
Establish water quality forum with partner agencies (e.g. Vancouver Coastal Health) and universities to keep current with emerging water quality science and issues.
Develop an integrated rainwater management plan including infiltration and rainwater capture. Strategy 3 ‐ Public Access to Drinking Water
Short Term (1‐3 year) Actions:
Continue to expand options for year‐round public access to municipal drinking water in public spaces.
3.3 Strategies and Actions for Target 2: Water Conservation
Reducing Vancouver’s per capita water consumption by 33% from 2006 levels is an ambitious target that will require significant water efficiency improvements in each sector, behaviour changes nurtured by connecting people to the value of water, and regulation where appropriate. To underpin these actions, four strategies have been developed. Overall success in meeting the target will be determined by the strategies outlined below, in addition to future synergies from changes in housing stock, development of new technology and co‐production of local solutions through public and industry engagement. The recommended actions are expected to reduce consumption by 21%. The remainder will be achieved through future policy and program development. Strategy 1 ‐ Policy
Short Term (1‐3 year) Actions:
Ban once through cooling systems and phase out existing systems.
Mandate use of efficient water fixtures and support alternate water sources through the City’s development and zoning regulations and policy.
Expand Sprinkling Regulation Education and Enforcement Program.
Research options to achieve additional water use reduction through exploring alternate sources of water, acceleration of single/dual family metering program, and introduction of alternate pricing models.
Medium Term (3‐9 year) Actions:
Implement selected options that will deliver the additional 12% water use reduction.

Greenest City 2020 Action Plan - 09212 123
Strategy 2 ‐ Engagement
Short Term (1‐3 year) Actions:
Establish and implement an engagement plan that includes promotion, education, and community‐based social marketing for behaviour change campaigns. Coordinate this with other Greenest City engagement plans.
Conduct audits for water efficiency and sewer discharge pollution prevention. Strategy 3 ‐ Leadership
Short Term (1‐3 year) Actions:
Reduce system leakage through proactive leak detection and implement pressure management program to reduce background leakage from the water system.
Conduct water use study at civic and Parks facilities to identify and implement opportunities to conserve water.
Strategy 4 ‐ Technology
Short Term (1‐3 year) Actions:
Develop incentive programs to accelerate installation of water efficient fixtures, including rebate programs for low flow toilets and rain sensors for in ground sprinkler systems.
Develop retrofit program in partnership with other utilities to supply and install low flow fixtures in targeted housing stock and populations.
Implement water meters on all new single family and duplex developments and introduce volume‐based pricing to better connect citizens to the value of water and encourage efficiencies.
3.4 Wedge Analysis
Water Quality Strategies
Strengthen Water Quality &Protection
Leadership & Advocacy
Public Access to DrinkingWater
Figure 4: Achievement of Target 1 is expected to be achieved equally by each of the three strategies.

Greenest City 2020 Action Plan - 09212 124
Water Conservation Strategies to Achieve 33% Reduction
Policy 3-9 year12%
Engagement 6.5%
Leadership 5%
Technology 4.5%
Policy 1-3 year 5%
Figure 5: 21% of target 2 has been mapped out in this action plan; the remaining 12% will come from future policy and programs that are still to be developed.
4. CROSS REFERENCE
Greenest City Plans
Green Buildings: Although the strategies outlined in the Green Buildings goal are focused primarily on energy efficiencies, changes to the building and plumbing codes to allow for rainwater and greywater uses should take place in concert with other green‐related code changes.
Access to Nature: Planting 150,000 trees in the city helps with the mitigation of storm sewer flows. These plantings should be coordinated with sewer and water departments to prevent the tree roots from infiltrating mains and connections.
Local Food: The increase in food gardens and other urban agriculture strategies should be coordinated with the Water Conservation group in order to capitalize on synergies with water conservation measures.
Zero Waste: As the City ramps up its food scraps composting program there may be opportunities to work toward the elimination of food grinders in kitchen sinks. Pharmaceutical products are subject to extended producer responsibility; however, few people are aware of the proper way to dispose of unused pharmaceuticals and much of it ends up in the sewer system. As the City supports EPR awareness, pharmaceuticals should be included.
City of Vancouver Plans
One of the 40 goals outlined in the City of Vancouver’s Corporate Business Plan is to determine the details of the overall strategy to eliminate combined sewer overflows by 2050. This strategy should become part of the Greenest City Clean Water Goal
Regional Plans
The Drinking Water Management Plan from Metro Vancouver identifies strengthening water quality measures, eliminating once‐through cooling, substituting alternatives to drinking water for non‐potable uses, and managing infrastructure proactively as strategies to ensure the best future for our

Greenest City 2020 Action Plan - 09212 125
drinking water supply. All of these strategies are consistent with those in the Greenest City Action Plan for Clean Water.
The Integrated Liquid Waste and Resource Management Plan requires the City of Vancouver to eliminate combined sewer overflows by 2050. Additionally, the plan requires the City to strengthen its pollution source control programs, develop integrated stormwater management plans for the entire city, and reduce wet weather flows. All of these requirements support the direction set for the City’s Clean Water Goal.
5. EXTERNAL ADVISORY COMMITTEE MEMBERSHIP
Oliver Brandes POLIS
Dr. Patricia Daly Vancouver Coastal Health
Bob Jones Metro Vancouver
Dr. Dirk Kirste Simon Fraser University
Dr. Gunilla Oberg University of British Columbia
Kirk Stinchcombe Econnics
Dr. Tim Takaro Simon Fraser University
Dr. Troy Vassos NovaTech Consultants Inc.
Stan Woods Metro Vancouver
6. STAFF WORKING GROUP MEMBERSHIP
Brian Crowe (Chair) Assistant City Engineer, Water and Sewer Division
Peter Navratil (Staff Lead) Manager, Water Design
Andrew Ling Sewer and Drainage Design
Carolyn Drugge Water and Sewer Division
Piet Rutgers/Danica Djurkovi Director of Planning and Operations, Park Board
David Ramslie Sustainability Group (Green Buildings)
Grace Cheng Finance
Jack Chen Finance
Jennifer Bailey Waterworks Design
Donny Wong Waterworks Design
Sara Orchard UBC Greenest City Scholar
Joshua Welsh UBC Greenest City Scholar
7. PUBLIC ENGAGEMENT SUMMARY
Phase 1 There were 12 ideas and 159 votes in the “Improve water quality” category on the Talk Green to Us forum. The top three ideas were:
Idea Number of Votes
Divert storm runoff into green areas that can soak up and neutralize the pollution before it enters the water table
40
Explore natural sewage treatment options such as solar aquatic systems
21
Improve sewage treatment to include tertiary treatment 20

Greenest City 2020 Action Plan - 09212 126
The “Use less water” category received 22 ideas and 1252 votes. The top tree ideas were:
Ideas Number of Votes
Ban bottled water and install public drinking water fountains instead 430
Change the Building Code to require rainwater collection & water efficient irrigation systems
315
Require residential water metering 196
Phase 2 The water goal did not receive a lot of attention from workshop or event participants. However, water‐related comments, particularly related to conservation and reuse did come up in conversations about the green buildings, zero waste and lighter footprint goals. Here is a summary of what we heard.
General support for water conservation and increased efficiency, with a number of suggestions for how to do this. These include metering, monitoring, auditing, reporting, regulations and price incentives.
Focus on existing buildings to lower water consumption, tie into waste. (EAC mtg)
Support for rain water handling and re‐use (EAC mtg)
Grey water recycling was suggested in three of seven online comments.
There was some support online and in workshops for a ban of bottled water in the City
Drinking water in public spaces also received support in the online forum.
One comment suggested more use of permeable paving
There was a question about how this goal ties into Metro's Drinking Water Management Plan. (EAC Mtg)
There was general support for increased literacy, outreach and education, similar to what we heard across all the goal areas.
Additional Comments:
“Enforcement and public education is necessary to reduce waste dumping in our ocean, whether it's from the toilet or plastic.” (online comment)
“Participants felt that our municipal drinking water is excellent and bottled water sales should be banned” (Dialogue students report)
“Has to affect people's finances. Charge people for water and electricity and gas we use, otherwise people don't have an incentive to save water/electricity/gas.” (UBC MBA workshop)
“I would like to see grey water encouraged, at least for watering gardens and maybe even flushing toilets. It seems senseless to be flushing with drinking water.” (online comment)
“We need to promote ways to reduce sprinkling by converting lawns (private and public) to permaculture gardens and using native grasses that require less water.” (online comment)
“Practice what you preach don’t serve bottled water” (UBC MBA workshop)
“Meter all users and possible warning system so that overuse is addressed in a meaningful way.” (Board of Trade workshop)
“Make Water Audits for ICI available to the public and ensure literacy.” (Board of Trade workshop)
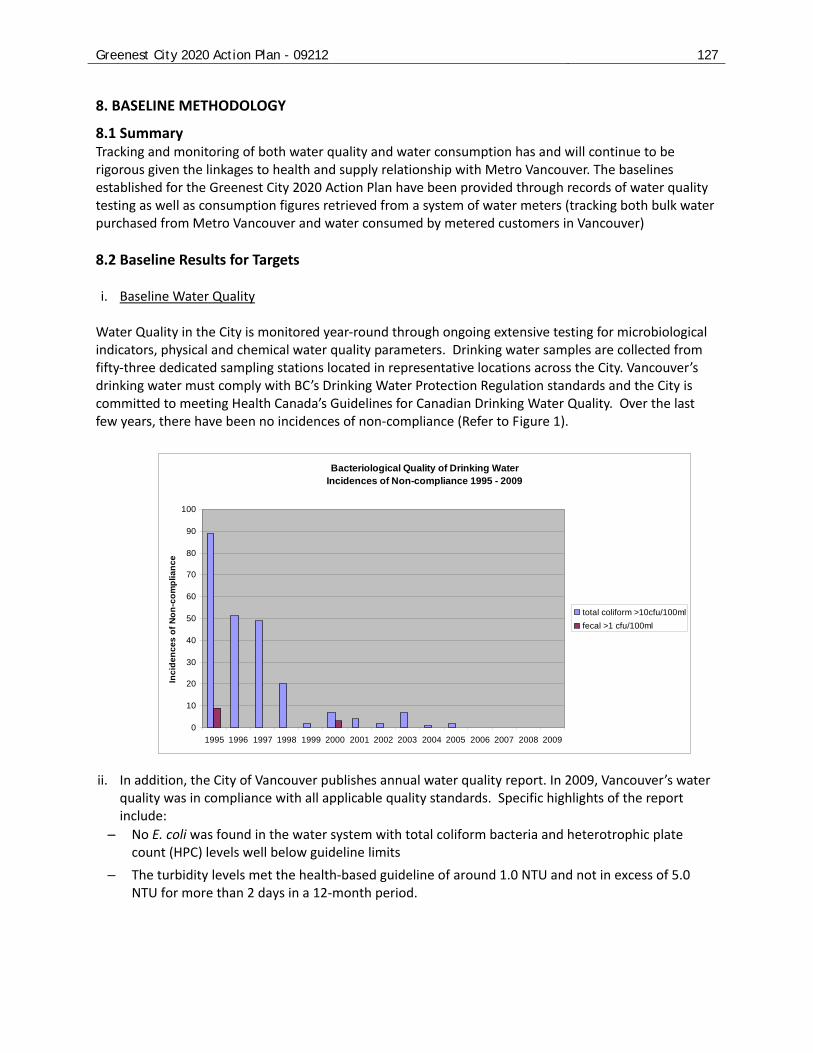
Greenest City 2020 Action Plan - 09212 127
8. BASELINE METHODOLOGY
8.1 Summary Tracking and monitoring of both water quality and water consumption has and will continue to be rigorous given the linkages to health and supply relationship with Metro Vancouver. The baselines established for the Greenest City 2020 Action Plan have been provided through records of water quality testing as well as consumption figures retrieved from a system of water meters (tracking both bulk water purchased from Metro Vancouver and water consumed by metered customers in Vancouver)
8.2 Baseline Results for Targets
i. Baseline Water Quality
Water Quality in the City is monitored year‐round through ongoing extensive testing for microbiological indicators, physical and chemical water quality parameters. Drinking water samples are collected from fifty‐three dedicated sampling stations located in representative locations across the City. Vancouver’s drinking water must comply with BC’s Drinking Water Protection Regulation standards and the City is committed to meeting Health Canada’s Guidelines for Canadian Drinking Water Quality. Over the last few years, there have been no incidences of non‐compliance (Refer to Figure 1).
ii. In addition, the City of Vancouver publishes annual water quality report. In 2009, Vancouver’s water quality was in compliance with all applicable quality standards. Specific highlights of the report include:
No E. coli was found in the water system with total coliform bacteria and heterotrophic plate count (HPC) levels well below guideline limits
The turbidity levels met the health‐based guideline of around 1.0 NTU and not in excess of 5.0 NTU for more than 2 days in a 12‐month period.
Bacteriological Quality of Drinking Water Incidences of Non-compliance 1995 - 2009
0
10
20
30
40
50
60
70
80
90
100
1995 1996 1997 1998 1999 2000 2001 2002 2003 2004 2005 2006 2007 2008 2009
Inc
ide
nc
es
of
No
n-c
om
pli
an
ce
total coliform >10cfu/100ml
fecal >1 cfu/100ml

Greenest City 2020 Action Plan - 09212 128
Water temperature met the aesthetic objective of less than 15oC with the exception of some warmer months in late summer. Average water temperature was 15.9oC in August and 16.7oC in September 2009
Chlorine residuals were above the 0.2 mg/L minimum target for disinfection with the exception of some low flow sites located near distribution system end points
Disinfection by‐products concentrations are consistent with previous years and were within the Guidelines for Canadian Drinking Water Quality Maximum Acceptable Concentrations
iii. Baseline Water Consumption The City’s water consumption has been tracked closely for 25 years through a set of water meters that measure bulk water purchases from Metro Vancouver. In 2006, the average daily residential per capita water consumption was 320 litres. While average residential per capita consumption is on par with the Canadian average of 329 litres, Vancouverites are still considered high consumers when compared to other Cities internationally, due in part to seasonal abundance and relatively low cost.
A comparison of water consumption and cost of supply/disposal is shown in the table above. It is generally observed that increased consumption is encouraged when the cost of water is low.
0
50
100
150
200
250
300
350
Copenhag
en
Mel
bourne
Paris
London
Stock
holm
San F
ranci
sco
Seattl
e
Portlan
d
Toronto
Calgar
y
Vanco
uver
Victo
ria
Lit
res
per
cap
ita
per
day
$-
$1.00
$2.00
$3.00
$4.00
$5.00
$6.00
$7.00
$8.00
$9.00
Co
st o
f W
ater
/Was
tew
ater
($/
m3 )

Greenest City 2020 Action Plan - 09212 129
*Consumption for industrial, commercial, institutional and multi‐family residential sectors is measured through a system of 14,000 water meters. **Average consumption per single/dual family home is based on total consumption, less non‐revenue water (system leakage, city facilities and parks) and metered consumption, divided by the number of service connections in this sector.
iii. Water Consumption Trends
Residential water consumption has decreased over the last 25 years by 12%. This decrease in consumption is likely the result of a number of factors including: 1. A change in behaviour resulting from education and awareness campaigns,
2. The growth in multifamily housing stock and the limited amount of discretionary outdoor water use compared with single family lots, and
3. The introduction of lawn sprinkling guidelines initiated by Metro Vancouver.
Industrial, commercial and institutional water consumption has decreased over the last 25 years by 21%. Main contributors to this trend are: 1. The elimination of a ‘declining block’ pricing scheme for IC&I customers (where water is less
expensive the more is used)
2. The conversion of some waterfront industrial properties (which generally support water intensive industries) to residential/mixed uses.
2,000
3,000
4,000
5,000
6,000
7,000
8,000
1986
1988
1990
1992
1994
1996
1998
2000
R20
0220
0420
0620
08
Year
Co
nsu
mp
tio
n (
m3)
100
200
300
400
500
600
700
Res
iden
tial
Co
nsu
mp
tio
n (
lpcd
)
IC&I Sector21% Reduction in Water Consumption over 25 years (per service)
Residential Sector12% Reduction in Water Consumption over 25 years

Greenest City 2020 Action Plan - 09212 130
Goal 9 ‐ Air Quality
1. GOAL AND TARGET Long Term Goal #9: Breathe the cleanest air of any major city in the world. 2020 Target: Meet or beat the most stringent of British Columbian, Canadian, and
international air quality standards and guidelines. Accountability: Climate Protection Program Manager – Sustainability Group
2. BACKGROUND 2.1 Context Vancouver’s air quality is currently good compared to that of other major North American cities. Our air quality is better than it was 20 years ago, however, health impacts still occur at current levels and as our population increases, it may be challenging to maintain our current air quality. Cars, trucks, buses, ships, trains, planes, industrial operations, and commercial facilities all emit air pollutants. This action plan identifies the range of strategies and actions that the City of Vancouver must pursue in partnership with Metro Vancouver and other levels of government, business, NGOs and citizens to maintain and improve our air quality.
2.2 Baseline Metro Vancouver is the authority responsible for air quality planning, monitoring and management within the region. Metro Vancouver’s 2011 Integrated Air Quality Management Plan sets three goals for the region: 1) Protect public health and the environment, 2) improve visual air quality, and 3) reduce the region’s contribution to global climate change. Metro Vancouver maintains a network of ambient air quality monitoring stations throughout the Lower Fraser Valley. Two of these stations are located within the City of Vancouver, one in Kitsilano and one in Robson Square. As illustrated in Table 1, air pollutant levels in Vancouver do not always meet the GC 2020 target. The table also summarises which strategies are aimed at tackling the exceedances of each pollutant. Table 1: Recent Air Contaminant Target Compliance and Main Contaminant Source
Pollutant Do recent levels meet the GC 2020 target?
GC 2020 strategy to address these exceedances
Sulphur Dioxide
No (exceedances at
Kitsilano and Robson Square)
Marine Vessels
Nitrogen Dioxide
No (minimal number of
exceedances at Robson Square only)
Light duty vehicles (Green Transport Strategy) Marine Vessels Non‐Road Equipment

Greenest City 2020 Action Plan - 09212 131
Particulate Matter
No (minimal number of
exceedances at Kitsilano and Pandora Park17)
Non‐Road Equipment Marine Vessels Residential Wood Combustion
Ground‐level Ozone
No (minimal number of
exceedances at Kitsilano only)
Major sources of smog‐forming emissions: Light‐Duty Vehicles (Green Transport Strategy) Consumer Products Non‐Road Equipment
Carbon Monoxide
Yes
2.3 Challenges and Opportunities
The Green Transportation Working Group is ultimately responsible for motor vehicle strategies, one of the largest sectors in which air quality improvements can be made.
With thousands of mobile emissions sources, complex topography, meteorology and atmospheric chemistry, air quality can vary significantly from location to location. Additional monitoring and/or modeling may be required to support new regulation and programs.
Air quality monitoring and/or computer modeling information will inform land use planning, which is integral to the larger Greenest City goals and as a result requires significant consultation both internally and externally.
There is a need to ensure that GHG management also protects air quality and human health.
Given the broad impact of air quality, many stakeholders will need to be engaged, including at least: Metro Vancouver, utilities, Port Metro Vancouver, transport authorities, freight carriers, the development community, health authorities, research institutions, Federal and Provincial government.
Complex modeling would be required to determine if the strategies would bring the attainment of the Air Quality Target. The City of Vancouver does not currently have, nor does Metro Vancouver, the resources to conduct this modeling. However, monitoring of air quality as the strategies are implemented will allow an evaluation of their efficacy and ensure that the strategies can be reassessed and amended based upon the observations made.
3. STRATEGIES, SHORT‐ AND MEDIUM TERM ACTIONS
The City of Vancouver is developing strategies and actions to improve air quality standards in support of Metro Vancouver’s broader efforts. Our local actions will support our surrounding municipalities because air quality is not confined to city geographical boundaries. 3.1 Highest Priority Short Term Actions (3 year) 1. Encourage electric vehicle transport
Ensure scalable charging infrastructure is in place to support early adoption of plug‐in electric vehicles.
17 Fine particulate matter is not monitored at Robson Square due to space constraints. These exceedances were measured
using non‐standard portable monitoring equipment at a temporary monitoring site in Pandora Park.

Greenest City 2020 Action Plan - 09212 132
Support early deployment of plug‐in electric vehicles by establishing green fleet buying groups. 2. Regulate uncontrolled wood burning appliances for residential buildings.
Prohibit the installation of wood burning appliances in new residential building construction.
Promote Metro Vancouver’s Wood Stove Exchange Program to Vancouver residents. 3. Establish a framework to integrate new air quality considerations into City planning that will:
Determine City of Vancouver monitoring and computer modeling needs.
Ensure the air quality impact is assessed and mitigated for new local projects. 4. Collaborate with Port Metro Vancouver, Metro Vancouver and BC Hydro on joint air quality issues.
3.2 Strategies and Short‐ and Medium Term Actions Strategy 1 ‐ Motor Vehicles
Motor vehicle transport is one of the largest contributors to air pollution. However, its diffuse mobile nature makes it challenging to tackle. The range and levels of pollutants emitted by mobile combustion engines varies by use, make, model and maintenance. Better emissions standards and emission inspection programs like, AirCare, will continue to reduce air pollution on a per vehicle basis. The majority of the Green Transportation Plan is dedicated to getting people out of their cars and reducing the number of vehicles and vehicle‐kilometres travelled on City of Vancouver roads. For the vehicles that remain the Green Transportation Plan will deliver significant air quality improvements through its low‐carbon vehicle and efficient goods movement strategies. Short Term Actions (1‐3 years)
Ensure scalable charging and fuelling infrastructure for low‐ and zero emission vehicles is in place to support early adoption of zero‐emission electric and low emission vehicle solutions.
Support early deployment of low emission and zero‐emission vehicles.
Integrate City low‐and zero‐emission vehicle planning with the public, institutes and local green industry.
Medium Term Actions (3‐9 years)
Protect rail corridors and increase rail‐based goods movement capacity.
Encourage ‘right‐sizing’ of commercial goods movement and essential service vehicles, including smaller vehicles that allow for more pedestrian‐scaled environments, and larger vehicles that reduce CO2 production for larger loads.
Strategy 2 ‐ Non‐Road Diesel Engines Diesel emissions often occur at ground level and close to where people live, work and play; this results in higher exposures and increased health risks. Additionally, diesel emissions and especially particulate matter contribute to climate change and impair visual clarity. To minimize these impacts Metro Vancouver has adopted a new bylaw to reduce emissions from privately and publicly owned non‐road diesel machines such as excavators, backhoes, forklifts and loaders.

Greenest City 2020 Action Plan - 09212 133
Short Term Actions (1‐3 year)
Assist Metro Vancouver with promotion of the Non‐Road Diesel Engine Bylaw to increase participation and compliance;
City of Vancouver will adopt these requirements in its operations and support adoption throughout the community.
Strategy 3 ‐ Marine Vessels
Marine vessels are the main source of oxides of sulphur (SOx) in Vancouver air and are also significant sources of particulate matter and nitrogen oxide emissions. The International Maritime Organization recently approved the formation of an Emission Control Area in Canadian and American waters that will require marine vessels to meet stringent fuel quality and emission limits. Starting in 2012 these requirements will significantly reduce emissions from ocean‐going vessels. As precursors to particulate matter, SOx and NOx reduction also help improve ambient particulate matter levels. One of the most effective ways to protect Vancouver citizens and visitors from exposure to marine diesel emissions is to install terminal “shore power” so vessels do not have to idle their engines while docked. In 2009, Port Metro Vancouver became the first port in Canada, and the third in the world, to allow cruise ships to plug into the city's electricity grid. However, only the Canada Place terminal and two cruise lines are equipped with the appropriate plug‐in technology at this time. Short Term Action (1‐3 year)
Work with Port Metro Vancouver, BC Hydro and Metro Vancouver to increase the use of shore power for ocean‐going vessels calling in Vancouver.
Strategy 4 ‐ Home Woodsmoke Reduction The improper operation of wood burning appliances generates excessive smoke and fine particulate matter. When inhaled, fine particulate matter can cause a range of acute and chronic heath concerns. Metro Vancouver has received funding from the provincial government to administer a regional Wood Stove Exchange Program aimed at existing wood stoves and fireplaces, in which residents are eligible for cash contributions towards the cost of updating their appliances. The City of Vancouver is currently reviewing its Building Bylaw and will consider the inclusion of a clause that prohibits the installation of wood burning appliances in new building construction. Metro Vancouver is also exploring a range of regulatory options to reduce residents’ exposure to home wood smoke, ranging from episode‐based regional burn bans to mandatory decommissioning of devices upon the sale of homes and the City will be involved with the discussion of all these options. Short Term Actions (1‐3 year)
Prohibit the installation of wood burning appliances in new residential building construction.
Promote Metro Vancouver’s Wood Stove Exchange Program to Vancouver residents.
Assist Metro Vancouver to explore regulatory options that will reduce residents’ exposure to home wood smoke.

Greenest City 2020 Action Plan - 09212 134
Strategy 5 ‐ Air Quality Improvements for Vulnerable Populations Although healthy individuals can also experience side effects during periods of poor air quality, children, the elderly, pregnant women and people with pre‐existing lung and heart disease are especially vulnerable. As the City aims to increase its density under the EcoDensity Charter, it is important to consider that infill development near busy arterial roadways can increase residents’ exposure air pollutants. Metro Vancouver will assist the City to develop a set of development guidelines to minimize exposure at new health, child and senior care facilities and mitigate air pollution in existing locations. Medium Term Actions (3‐9 year)
Work with Metro Vancouver to ensure air quality considerations inform land use planning.
Develop mechanisms to reduce high exposure to air contaminants for schools, daycares, hospitals, etc. and other sensitive populations, such as planning and urban design guidelines.
Develop possible mitigation solutions for existing locations. Strategy 6 ‐ Enhanced Air Quality Assessment & Planning
Metro Vancouver currently monitors air quality at two locations within the City of Vancouver (Downtown and Kitsilano). The City will increase its understanding of the role and implications of air quality monitoring and computer modelling, both of which must be considered as part of more comprehensive air quality planning for major projects such as district energy and large developments. Short Term Actions (1‐3 year)
Determine City of Vancouver monitoring and computer modeling needs.
Develop a framework to ensure that the air quality impact is assessed and mitigated for new local projects.
Medium Term Actions (3‐9 year)
The City will work with Metro Vancouver to enhance air quality monitoring and/or modelling for Vancouver.
Conduct Air Quality Impact Assessments as an integral part of all major City project planning processes.
Strategy 7 ‐ Low VOC Strategy Although air quality targets have not been set specifically for volatile organic compounds (VOCs), these pollutants are important because they are precursors to ground‐level ozone and are involved in the formation of fine particulate matter. Ground‐level ozone can cause a variety of symptoms including chest discomfort, reduced lung function and irritation of the eyes, nose and throat. Some of the largest sources of volatile organic compounds include paints and coatings, industrial/commercial solvents, refuelling stations, household cleaners, toiletries, rubbing compounds, windshield washer fluid, polishes and waxes.

Greenest City 2020 Action Plan - 09212 135
Short Term Actions (1‐3 year)
Include on the City of Vancouver website Metro Vancouver information about low‐VOC products and promote their use in City of Vancouver business and resident outreach. Also promote Metro Vancouver’s regulatory requirements related to VOC emissions from businesses (e.g., refuelling stations).
4. CROSS REFERENCE Green Transportation The Working Group with the most influence over urban air quality is the Green Transport Group. Air pollutants of all kinds from transport will be significantly reduced by meeting both Green Transport Targets, i.e. over 50% of trips to be walk, bike or transit and a vehicle kilometres travelled reduction of 20%. Further, the longer term goals aimed at supporting low‐ and zero‐emission vehicles will yield extensive improvements in urban air quality through, amongst other things, reduced oxides of nitrogen and particulate matter generation. Sustainable urban goods movement will cut exposure levels as well as pollutant concentrations, while allowing tighter local pollution control measures Other Related Planning Processes
City of Vancouver Green Transportation Plan
Metro Vancouver Draft Integrated Air Quality & Greenhouse Gas Management Plan
5. EXTERNAL ADVISORY COMMITTEE AND WORKING GROUP MEMBERSHIP Note: this team did not have a large EAC, rather the City of Vancouver and Metro Vancouver staff worked collaboratively to develop this plan.
Roger Quan Metro Vancouver – Air Quality Policy and Management Division Manager
Laurie Bates‐Frymal Metro Vancouver – Air Quality Planner
Derek Jennejohn Metro Vancouver – Senior Engineer
Sean Pander City of Vancouver – Sustainability Group
Brian Beck City of Vancouver – Sustainability Group
Malcolm Shield City of Vancouver – Sustainability Group
Adam Hyslop UBC Greenest City Scholar

Greenest City 2020 Action Plan - 09212 136
6. PUBLIC ENGAGEMENT SUMMARY REPORT Phase One There were 27 ideas and 605 votes cast in the category “Improve air quality” on the Talk Green to Us forum. The top ideas were:
Ideas Number of Votes
Ban all wood burning appliances in the City of Vancouver 178
Regulate non‐road emission sources like diesel generators, lawn mowers and leaf blowers
82
Ban woodstoves through bylaws 58
Stop all types of smoke and chemical scented products in residential areas
40
Make green roofs and living walls mandatory 39
Phase Two
The Clean Air target did not receive much specific attention from participants during phase two of consultation. However, a number of the strategies and actions – such as working across jurisdictions with Metro Vancouver and the Port, introducing more electric vehicles and reducing the need for cars – received support in comments from other draft plans, such as transportation. In general participants were supportive of the goal and recognized that its success depended on the success of actions in other goal areas such as Climate Leadership and Green Transportation.
The report from the SFU Undergraduate Semester in Dialogue students indicated that one group found the clean air target “ambiguous”. They wrote that participants were not interested in having the cleanest air, so much as air that is as clean as they enjoy currently.
There were 12 online comments in total. Eight addressed the issue of wood‐burning stoves, with the majority opposing an exchange program where old wood stoves would be replaced with more ‘efficient’ ones. There was support for a prohibition on the installation of new wood stoves, and a call for chimney and woodstove emissions targets along with inspections similar to those used by AirCare.
2 comments addressed the issue of air quality inside homes.
1 comment called for Vancouver to implement restricted inner city travel to low emission vehicles similar to laws in Berlin. “In your own report on "Vancouver: a bright green future" (2010) you mention that "Berlin has restricted travel in its inner city Environmental Zone to low emission vehicles since 2008..[and] Stockholm requires the rationalization of heavy truck traffic before it enters the city centre."(p.58). These are two great measures that should be considered for implementation now.” Online comment.
1 comment called for Neighbourhood Pollution monitoring stations and annual reporting. “… at hotspots, cul‐de‐sacs, major roads etc.” Online comment.

Greenest City 2020 Action Plan - 09212 137
7. BASELINE METHODOLOGY The City of Vancouver does not conduct its own air quality monitoring; this responsibility falls with, and will continue to stay with, Metro Vancouver. The comprehensive set of data collected and analysed for the Lower Fraser Valley airshed is large, complex and extends beyond the monitoring network alone. Metro Vancouver summarizes pollutant concentrations from the Lower Fraser Valley monitoring network in an annual report. Metro Vancouver also compiles a detailed analysis of emissions and emission sources in the airshed, and reports this information in the Lower Fraser Valley Emissions Inventory. The baseline for all air quality targets will be set according to the 2009 figures in Tables A and B (data provided by Metro Vancouver) since the 2010 data is currently undergoing quality assurance tests and analysis. The Kitsilano and Downtown stations will be used to monitor future progress. The latest data available for the City of Vancouver pertain to the years 2008 and 2009 (Tables A and B), and these shall form the baseline figures against which progress will be reported. It must be noted however, that the number of exceedences are (with the exception of SOx) already very low and to ensure a statistically significant improvement in future years may take several years to assess. The metrics listed in Tables A and B that exceed the most stringent of World Health Organisation, Canadian, BC or Metro Vancouver guidelines for air quality will from the complete set of parameters used to assess progress against the 2020 Targets. Currently, the small number of monitoring stations and the limitations of the Robson Square station curtail the fidelity of air quality measurement across the City of Vancouver. Air quality data will continue to be collected as it is currently (see point f below) since the methods used are internationally accepted, rigorous and accurate. Currently data are recorded at each of the two monitoring stations at five‐minute intervals, these data are converted to hourly averages for storage and subsequent processing. The data are reported annually in the Lower Fraser Valley Air Quality Monitoring Report and it is expected that this level of detail and rigour will continue.

Greenest City 2020 Action Plan - 09212 138
Table A: WHO Guideline Exceedences for the Downtown Monitoring Station for 2008 & 2009
* Metro Vancouver’s objectives for these pollutants and averaging periods are identical to the WHO guidelines. 18 The WHO guidelines for ground-level ozone (8-hour) and sulphur dioxide (24-hour) are more stringent than Metro Vancouver’s objectives. 19 The WHO allows 3 exceedances of this guideline per year, while Metro Vancouver’s objective is not to be exceeded. 20 Metro Vancouver’s annual PM2.5 objective is 8 ug/m3, which is more stringent than WHO guideline. Metro Vancouver has also adopted a long-term planning goal of 6 ug/m3. 21 In addition to the 24-hour mean, the WHO has a 10-minute mean concentration guideline for sulphur dioxide. 22 In addition to the 8-hour mean and 1-hour mean, the WHO has 15-minute and 30-minute mean concentration guidelines for carbon monoxide. Metro Vancouver does not retain long-term records of ambient data with averaging periods less than one hour.
Pollutant = Guideline Value in �g/m3 (ppb)
Times exceeded in 2008 / 2009
Comments
Ground‐level ozone = 100 �g/m3 (51 ppb) based on 8‐hour rolling mean values18
0 / 0 No exceedances of the WHO guideline at this station in 2008 or 2009
PM2.5 = 25 �g/m3
based on 24‐hour rolling mean values19
N/A Not measured at this station due to space constraints
PM2.5 = 10 �g/m3
based on annual mean values20 N/A
Not measured at this station due to space constraints
Sulphur dioxide = 20 �g/m3 (8 ppb) based on 24‐hour rolling average values2,21
376 / 220
The WHO 24‐hour sulphur dioxide guideline was exceeded for at least one hour during 40 days in 2008 and 17 days in 2009. The maximum 24‐hour average sulphur dioxide concentration measured at T1 was 13 ppb in 2008 and 14 ppb in 2009, which does not exceed the Metro Vancouver objective.
Nitrogen dioxide = 200 �g/m3 (107 ppb)* based on 1‐hour mean values
0 / 0 No exceedances of the WHO guideline at this station in 2008 or 2009
Nitrogen dioxide = 40 �g/m3 (22 ppb)* based on annual mean values
1 / 1
The WHO annual nitrogen dioxide guideline was exceeded at T1 by 1 ppb in 2008 and 0.5 ppb in 2009
Carbon monoxide = 30,000 �g/m3 (27 ppm)* based on 1‐hour mean values22
0 / 0 No exceedances of the WHO guideline at this station in 2008 or 2009
Downtown Van
couver (T1)
Carbon monoxide = 10,000 �g/m3 (9 ppm)* based on 8‐hour rolling mean values
0 / 0 No exceedances of the WHO guideline at this station in 2008 or 2009
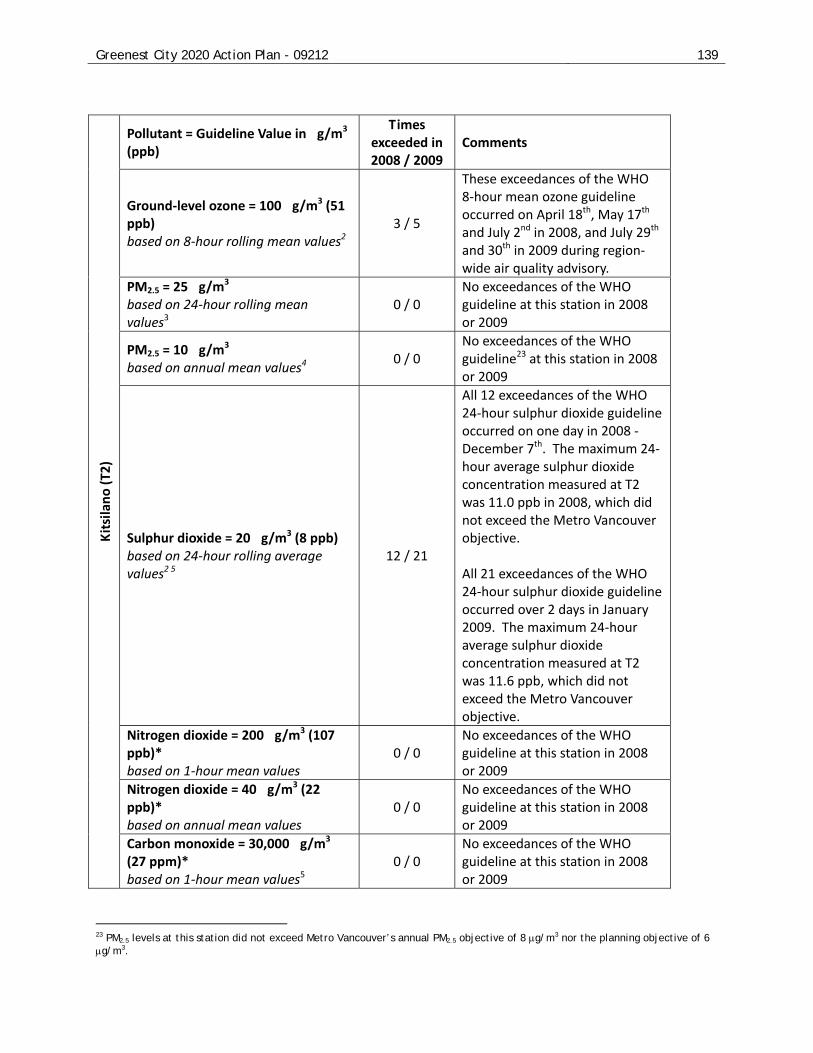
Greenest City 2020 Action Plan - 09212 139
23 PM2.5 levels at this station did not exceed Metro Vancouver’s annual PM2.5 objective of 8 g/m3 nor the planning objective of 6 g/m3.
Pollutant = Guideline Value in �g/m3 (ppb)
Times exceeded in 2008 / 2009
Comments
Ground‐level ozone = 100 �g/m3 (51 ppb) based on 8‐hour rolling mean values2
3 / 5
These exceedances of the WHO 8‐hour mean ozone guideline occurred on April 18th, May 17th and July 2nd in 2008, and July 29th
and 30th in 2009 during region‐wide air quality advisory.
PM2.5 = 25 �g/m3
based on 24‐hour rolling mean values3
0 / 0 No exceedances of the WHO guideline at this station in 2008 or 2009
PM2.5 = 10 �g/m3
based on annual mean values4 0 / 0
No exceedances of the WHO guideline23 at this station in 2008 or 2009
Sulphur dioxide = 20 �g/m3 (8 ppb) based on 24‐hour rolling average values2 5
12 / 21
All 12 exceedances of the WHO 24‐hour sulphur dioxide guideline occurred on one day in 2008 ‐ December 7th. The maximum 24‐hour average sulphur dioxide concentration measured at T2 was 11.0 ppb in 2008, which did not exceed the Metro Vancouver objective. All 21 exceedances of the WHO 24‐hour sulphur dioxide guideline occurred over 2 days in January 2009. The maximum 24‐hour average sulphur dioxide concentration measured at T2 was 11.6 ppb, which did not exceed the Metro Vancouver objective.
Nitrogen dioxide = 200 �g/m3 (107 ppb)* based on 1‐hour mean values
0 / 0 No exceedances of the WHO guideline at this station in 2008 or 2009
Nitrogen dioxide = 40 �g/m3 (22 ppb)* based on annual mean values
0 / 0 No exceedances of the WHO guideline at this station in 2008 or 2009
Kitsilano (T2)
Carbon monoxide = 30,000 �g/m3 (27 ppm)* based on 1‐hour mean values5
0 / 0 No exceedances of the WHO guideline at this station in 2008 or 2009

Greenest City 2020 Action Plan - 09212 140
Table B: WHO Guideline Exceedences for the Kitsilano Monitoring Station for 2008 & 2009
24 Measured using non-standard portable monitoring equipment.
Carbon monoxide = 10,000 �g/m3 (9 ppm)* based on 8‐hour rolling mean values
0 / 0 No exceedances of the WHO guideline at this station in 2008 or 2009
Pollutant = Guideline Value in �g/m3 (ppb)
Times exceeded in
2009 Comments
Ground‐level ozone = 100 �g/m3 (51 ppb) based on 8‐hour rolling mean values2
N/A No exceedances of the WHO guideline at this station in 2009
PM2.5 = 25 �g/m3
based on 24‐hour rolling mean values3
2624
The WHO 24‐hour PM2.5 guideline was exceeded for 26 consecutive hours on January 17th‐18th, 2009 at this location during a period of very stable, foggy conditions with poor dispersion.
PM2.5 = 10 �g/m3
based on annual mean values4 0
No exceedances of the WHO guideline7 at this station in 2009
Sulphur dioxide = 20 �g/m3 (8 ppb) based on 24‐hour rolling average values2,5
1521
The WHO 24‐hour sulphur dioxide guideline was exceeded at Pandora Park for at least one hour during 94 days in 2009. The maximum 24‐hour average sulphur dioxide concentration measured at Pandora Park was 36 ppb in 2009, which does not exceed the Metro Vancouver objective of 48 ppb.
Nitrogen dioxide = 200 �g/m3 (107 ppb)* based on 1‐hour mean values
0 No exceedances of the WHO guideline at this station in 2009
Nitrogen dioxide = 40 �g/m3 (22 ppb)* based on annual mean values
0 No exceedances of the WHO guideline at this station in 2009
Carbon monoxide = 30,000 �g/m3 (27 ppm)* based on 1‐hour mean values5
0 No exceedances of the WHO guideline at this station in 2009
Pan
dora Park
Carbon monoxide = 10,000 �g/m3 (9 ppm)* based on 8‐hour rolling mean values
0 No exceedances of the WHO guideline at this station in 2009

Greenest City 2020 Action Plan - 09212 141
Goal 10 ‐ Local Food 1. GOAL AND TARGET Long Term Goal #10: Vancouver will become a global leader in urban food systems. 2020 Target: Increase city and neighbourhood food assets by a minimum of 50% from 2010
levels. Accountability: Social Policy, with support from Engineering (Streets) and Parks.
2. BACKGROUND
2.1 Context Just as food is central to human existence, resilient local food systems have been central to the sustainability of cities for millennia. In relation to Greenest City Goals, the production, distribution, processing and consumption of food presents one of the single largest sources of greenhouse gas and carbon production though cities don’t typically include food in their GHG profile. At the same time, it presents one of the best opportunities to ‘green’ the planet, create green jobs, and shift towards a more sustainable future. Currently the food production processes that are used to feed Vancouver’s 600,000 residents account for about 40% of the city’s ecological footprint. By encouraging a more ‘local’ dimension in food we can start to cut down on the use of fossil fuels, arrest the loss of food producing lands (and related biodiversity), support the local economy and eat food that is healthier and better for us. There are a number of considerations when advancing the idea of “local food” in Vancouver. Among these are: 1. The complexity of defining “local” food; 2. Considerations affecting the availability of local food to Vancouverites – including questions of
traceability, seasonality of production, cost, government jurisdiction and more; 3. Identification of how “local” aligns with other values implicit in the notion of a “just and sustainable
food system.” 4. Aligning food system actions with the need to reduce overall ecological footprint Given the many considerations that exist around “local food” it is important for the City to define the term. To that end, the Greenest City focus is on supporting a local food system, where “local” means as close to home as possible. This refers to the geographic distance between growing and consumption of the product. Local is further understood to include products with good inputs, sound labour practices, a low‐carbon, non‐polluting production regime and affordable products – and with a preference for organic products where available. Transforming Vancouver into a global leader in urban food systems will mean building on our existing strengths and transforming them into something even better. Vancouver has already demonstrated a willingness to lead the way by being at the front of policy and action in a number of areas. Among the achievements to date:
Creating a Food Policy Council to act as an arms‐length advisory body on food issues (2004)
Creating and approving a Vancouver Food Charter to underpin the goals of a just and sustainable food system (2007)
Increasing public involvement in community gardens and community orchards through the 2010 by 2010 Challenge (2007‐2010)

Greenest City 2020 Action Plan - 09212 142
Creating guidelines and bylaw changes to encourage hobby beekeeping (2005) and the keeping of backyard hens (2010)
Initiating curbside pick‐up of food waste – and to take strides in the diversion of food waste from the landfill (2010)
Transforming Vancouver into a global leader will require the idea of “local” to be part of a larger program that includes food that is fairly produced, does not rely on chemicals that harm the planet, and is able to be accessed, on an equitable basis, by Vancouver residents. The Vancouver Food Charter, approved by Council in 2007, calls for the City to enable “a just and sustainable food system for all.” The Charter further advocates that the growing, processing and distribution of healthy food be regionally based, and the aspect of “local” also seen as part of other values including social justice, economic security and environmental sustainability.
2.2 Baseline Metrics Although some work has been done related to baselines, one of the key challenges is the lack of a comprehensive set of food security indicators that would help to assess progress. Thanks to the Vancouver Food Policy Council and the development of Food Secure Vancouver, an integrated and ongoing review, analysis, and reporting process that monitors the status of Vancouver’s food security, there has been a solid effort made to attend to this gap; however, the availability of trend related data, or data that would facilitate comparisons with other urban centres is still very thin. In the meantime, three metrics will be used as a composite to measure progress toward the target of increasing neighbourhood food assets. 1. Selected Neighbourhood and City‐wide Food Infrastructure Assets. Food assets are defined as
resources, facilities, services or spaces that are available to residents of the City (either at the city‐wide or neighbourhood scale) and which are used to support the City’s food system, and include:
Number of food hubs25
Number of community kitchens
Number of farmers markets
Number of community produce stands
Food composting facilities and community composting programs
Number of community garden plots / orchards
Number of urban farms
Other variables may also be added to support the long term GCAP goal of developing a just and sustainable urban food system. Taken in aggregate, the current number of food assets would increase from 3,340 community kitchens, markets, compost facilities, garden plots, orchards, farms and food hubs, to a total of 5,158 – a 54.4% increase from current level in 2010.
25 Facility intended to connect rural supply to urban demand, farmers to people, seller to buyers.

Greenest City 2020 Action Plan - 09212 143
Table 1: 2010 Baseline of Neighbourhood Food Assets in Vancouver
November 2010
2020 Goal
% Increase
Community Kitchens 69 100 45%
Farmers Markets 4 22 450%
Community Produce Stands 3 15 500%
Community Food Composting facilities 0 5 500%
Garden Plots 3,260 5,000 53%
Community Orchards 3 10 233%
Urban Farms 1 5 400%
Food Hub 0 1 100%
TOTAL
3,340
5,158
54.4%
2. Presence and coverage of Neighbourhood Food Networks (NFNs) and opportunities for
Vancouverites to benefit from their activities. NFNs are defined as coalitions of community members, community organizations, agencies and businesses who work collaboratively to achieve food system goals, and in so doing, seek to increase overall human capital and community capacity at the neighbourhood scale. There are a number of NFNs currently operating in the City of Vancouver, including five that were funded (2010) through the City’s Green Grants program. The intent is to ensure that each neighbourhood is serviced by an adequately resourced NFN. Depending on need, this may or may not mean an NFN is present in each local area and could also involve an overarching coordinating body to assist their development. At present, it is unclear how many NFNs will be needed, so a precise target or operational formula has not been proposed.
3. Percentage of residents who live within a five minute (400m) walk of a basket of healthy produce.
Figure 1: Map showing the 400 metre walking circles around locations currently offering a basket of fresh produce.

Greenest City 2020 Action Plan - 09212 144
This metric is designed to ensure that the majority of Vancouver residents live within a five minute walk of a basket of fresh produce. This is a measure that will require more work to properly define because the availability of this information is, at present, limited and imprecise. Figure 1 shows an estimate of the current distribution of fresh produce retailers throughout the city and includes:
Large‐scale supermarkets (license category “Retailer ‐ Market”)
Small/Medium grocery stores selling produce (license categories “Retailer – Grocery” and “Retailer – Food ‐ Other”)
Green grocers (license category “Retail – Food ‐ Green Grocer”)
Community Produce Stands (seasonal)
Farmers markets (seasonal)
As illustrated by the map, licensees and market locations can be plotted on a map and buffered with a 400 metre (average 5 minute walk) radius. A total population count of residents inside and outside of the buffered areas will be used as a basis for the metric. At present, City licensing categories for “Retailer ‐ Market”, “Retailer – Grocery” and “Retailer Food – Green Grocer” provide a reasonably accurate picture of stores that sell fresh produce. However, there is a large number of retail outlets licensed as “Retailer – Food ‐ Other” that have not been sufficiently assessed for whether or not they sell a basket of produce (these are represented as yellow dots on the map – “Produce Possible”). Additional research around these outlets is required in order to produce an accurate metric. That being said, the present, limited map does show that there are a number of areas, particularly in the southern half of the city, where access to a basket of fresh produce is well outside of the five minute walk.
2.3 Challenges and Opportunities There has been considerable growth in interest in the local food movement in recent years; citizens are eager to buy and grow local food. Vancouver has already demonstrated a willingness to develop policy and initiatives that foster and promote local food. Departments will continue to work inter‐departmentally to achieve food policy goals. One of the challenges of building a local food action plan is that base metrics and measures are inconsistent and incomplete. Although some work has been done in this regard, one of the key challenges is the lack of a comprehensive set of food security indicators that would help to assess progress. Thanks to the Vancouver Food Policy Council, there has been a solid effort made to attend to this gap; however the availability of trend related data, or data that would facilitate comparisons with other urban centres is still thin.
3. STRATEGIES AND ACTIONS 3.1 Highest Priority Short Term Actions (3 year): 1. Support urban agriculture by:
Creating 5‐6 community gardens/yr;
Enabling 3 new urban farms;
Encouraging 2 new farmers markets;
Adding public fruit trees;
Investing in 3 neighbourhood food networks and food hub infrastructure

Greenest City 2020 Action Plan - 09212 145
2. Provide local food in City facilities, such as community centres, through the development and implementation of a local food procurement plan.
3. Develop a Municipal Food Strategy. 4. Conduct a comprehensive review of policy and regulatory barriers to growing local food for personal
consumption or economic development, and plan to remove barriers.
3.2 Strategies and Short‐ and Medium Term Actions Strategy 1 ‐ Develop a coordinated municipal food strategy. The City has a strong track record in food policy, but in order to move further and faster towards the long‐term goal of becoming a global leader in urban food systems there must be a coordinated municipal strategy to address all aspects of the food system including: production, processing, distribution, access and consumption. There must be a higher degree of coordination between City departments, the Vancouver Food Policy Council, community partners and the various policy programs that currently exist. Short Term (1‐3 year) actions:
Create a local food procurement strategy for all City facilities so that the City, through its purchasing power, can play a substantial role in creating a market for just, sustainable and locally produced food products. When this strategy is sufficiently robust, explore larger scale procurement strategies with other Vancouver‐based institutions, non‐profit agencies and Farm to Cafeteria programs;
Link together the work of Social Policy, Engineering, Parks, Real Estate, other City departments, and community partners to develop an overarching municipal food policy action plan;
Create an urban agriculture component of the municipal food strategy that will focus on identifying and increasing the amount of cultivatable land and local food related economic activity.
Medium Term (3‐9 year) actions:
Create land use policies that make use of rezoning, public benefit, and other regulatory levers to build new food infrastructure, retrofit existing infrastructure or enhance the potential for urban agriculture and food system activities. Actions here could include: a. Establishing dedicated zoning to protect food‐growing spaces (including, but not limited to
community gardens); b. Supporting appropriate placement and licensing of urban farms; c. Bolstering the role of urban agriculture as a public amenity; d. Amending current bylaws to better facilitate food production, community produce stands, etc.)
Strategy 2 ‐ Support the creation of food infrastructure and food‐related green jobs26 related to production, processing, storage, distribution, access and waste management. In order to achieve a sustainable urban food system that is as resilient as possible, a dedicated land base, relevant food infrastructure and necessary labour force needs to be in place. Based on lessons learned in other cities, there are efficient ways to do this that can be linked to the development of food infrastructure. Short Term (1‐3 year) actions:
Ensure that each neighbourhood has, as needed: a. Sufficient emergency food services b. Community kitchens
26 Types of “green jobs” include: clean technology, green buildings; waste management and recycling; local food; and sustainability services and
education.

Greenest City 2020 Action Plan - 09212 146
c. A farmers market d. Sufficient community produce stand opportunities to enable better access to healthy produce e. Adequate community garden plots (a rough target of 8 plots/thousand with equitable
distribution throughout the city); and, where possible, community orchard space f. Learning opportunities connected with food (e.g. workshops on gardening, food preservation,
etc.) g. Storage facilities for foods (community root cellars) h. Community composting facilities i. Other assets as needed (community bread ovens, cold/dry storage facilities, bee keeping, fish
processing etc.)
Support the development of a food related incubator to assist in the establishment of food businesses.
Medium Term (3‐9 year) actions:
Support the creation of a central Food Hub that can serve as a central food infrastructure asset within the city. A Food Hub would provide space for the assembly, storage and distribution of food from local farms, as well as for the processing and development of local food products.
Strategy 3 ‐ Ensure that Vancouver’s food system is resilient at the neighbourhood level, and that each Local Area has equitable access to the resources needed to ensure a just and sustainable food system. Strengthening neighbourhood based food resources will enable more people to access quality local food resources within a few minutes of their home. Neighbourhood networks and neighbourhood food assets work to make strategic linkages between the different food assets in a community while responding to local food security needs. Food networks are further supported by a land use planning that enables and encourages neighbourhood based green grocers and other healthy food resources. Short Term (1‐3 year) actions:
Develop and implement a plan to grow the number of functional, adequately supported, neighbourhood food networks that are operational in Vancouver so that every Local Area has equitable access to the resources and capacity building opportunities that they provide, and that every resident has the opportunity to participate in neighbourhood‐based food network activities.
Medium Term (3‐9 year) actions:
Improve accessibility of residents to green grocers, stores and markets selling a range of produce by: a. reviewing existing retail licensing categories as a means to ensure better information about the
availability of fresh produce; b. assessing existing small/medium “food” retailers to determine where fresh produce is being
sold; c. determining an appropriate metric and baseline for the proportion of the population residing
within a 5 minute walk of a basket of fresh produce; d. reviewing and/or amend zoning and related land‐use policy with a view encouraging the
development of fresh produce retailers.
Support the reduction in food waste by: a. strengthening community efforts around food recovery programs that can get surplus edible
food to the people that need it; and, where waste does occur;

Greenest City 2020 Action Plan - 09212 147
b. developing a program and/or regulatory tools to promote large‐scale (commercial) food recovery; and
c. promoting neighbourhood‐related composting projects to ensure that household food waste does not end up in the landfill.
Strategy 4 ‐ Support the compilation, brokering and dissemination of information on just and sustainable local food systems. There are too many good food projects happening in Vancouver and not enough points of connection. Smaller initiatives have a difficult time promoting their work and the City can help with this. Vancouver’s Food Policy resources are well recognized in the community and can be enhanced to offer more information to residents, facilitate the building of linkages between different community stakeholders and create clearer and more accessible resources for the community. Short Term (1‐3 year) actions:
Work with community partners, including the Vancouver Food Policy Council and Neighbourhood Food Networks to develop a directory of key local food initiatives, building on existing information databases; ensure that it is updated regularly, and available in print form at community centres and libraries as well as online and on mobile devices.
Collect information and data on the city’s food related ecological footprint to get a better understanding of where to prioritize food related ecological footprint reduction actions.
Work with community partners, including Vancouver Coastal Health and other nutritionists to develop materials on nutrient dense, local, just and low carbon healthy eating strategies. This might mean promoting appropriately‐sized portions and balanced meals (Food Guide), and reducing commercial and residential over purchase that ends up as waste. Ensure that information emphasizes reducing the food component of the city’s ecological footprint.
Medium Term (3‐9 year) actions:
In collaboration with local food agencies, develop a “Food Charter – Seal of Approval” for food products that support the goals of local, low footprint, just and sustainable food system.
Develop an annual City‐ or neighbourhood focused “Local Food Festival” or Smaller Footprint Healthy Eating challenge.
Strategy 5 ‐ Ensure that the City plays a strong advocacy role in promoting food issues at a regional, provincial and national level. Even though Vancouver has a growing number of local food assets and food resources, the city will continue to be dependent on food grown elsewhere in order to meet the needs of its residents. Short Term (1‐3 year) actions:
Continue to advocate for maintaining the integrity of food production capacity within the Agricultural Land Reserve (ALR) and other agricultural lands with regional and provincial governments, as well as neighbouring municipalities.
Medium Term (3‐9 year) actions:
Promote a “food systems” approach to other levels of government, and support policy that reinforces a coordinated approach to food system planning.
In concert with other large cities, work to develop a small portfolio of key food system indicators with which local governments can gauge their efforts to promote sustainable food planning.

Greenest City 2020 Action Plan - 09212 148
In concert with the Vancouver School Board, collaborate to ensure that each neighbourhood has adequately funded and resourced school, daycare and pre‐school breakfast, lunch and snack programs.
4. CROSS REFERENCE Since food production, distribution and consumption play such a fundamental role, it’s not surprising that the goals and objects of local food intersect with other Greenest City Action Plans. The following are some key areas of connection: Access to Nature. This section has identified the need to increase food production through gardens and fruit and nut bearing trees and bushes on both public and private land, an objective that would assist more residents to produce local food and access edible landscaping. Lighter Footprint identifies a variety of activities aimed at reducing Vancouver’s ecological footprint. Ecological literacy and education on local food issues, nutrition and consumption choices can be part of this, as can the idea that the City can ‘convene and connect’ groups working on key issues. Green Transportation/Mobility. This plan devotes attention to goods movement, of which food is a substantial component. Changes to how food is produced and distributed could have a have a positive effect on the movement of food into, out of, and throughout the city. Clean Water. Food production requires access to clean water, but can also be a driver of smart water recycling, rainwater collection and grey water technologies, as well as landscaping practices that encourage crops that are not as water‐intensive. Green Economy. The production and processing of local food has the potential to play a key role in meeting the Greenest City target of doubling the number of green jobs. Moreover, a robust local food system will bolster the green economy in the city and region. Green Buildings. There is strong potential for urban agriculture to be better integrated into new buildings, enabling the inhabitants of new residential, commercial and office developments to access local food opportunities via garden plots, green roofs and edible landscaping. Climate Change. The creation of greenhouse gases from food production (carbon inputs) and food waste (i.e. landfill methane) can be addressed by programs that encourage low‐carbon food, food‐waste diversion and smarter consumption. This will also contribute to the aims set out in the Clean Air section. Zero Waste. As discussed in the note on Climate Change, food waste diversion (via composting, or product stewardship initiatives that reduce the amount of food packaging) could assist greatly in making Vancouver the Greenest City. Other CoV Planning Processes:
Municipal Food Strategy
Revised Community Garden Guidelines
Revised Beekeeping Guidelines
Edible Landscaping Guidelines
5. EXTERNAL ADVISORY COMMITTEE MEMBERSHIP Joanne Bays Public Health Association of British Columbia
Brent Mansfield Vancouver School Board
Doug Aason Greater Vancouver Foodbank
Daryl Arnold Commercial poultry farmer

Greenest City 2020 Action Plan - 09212 149
Herb Barbolet SFU, Centre for Sustainable Community Development and Local Food First
Maria Burglehaus Vancouver Coastal Health
Carole Christopher Society Promoting Environmental Conservation (SPEC)
Trish Kelly Horizon Distributors
André LaRivière Green Table Network
Tara McDonald Your Local Farmers Market Society
Ross Moster Village Vancouver
Jeff Nield Farm Folk City Folk
Cale Price Vancouver Chef
Janine de la Salle Food Systems Planning, HB Lanarc
Carla S. Shore C‐Shore Communications Inc.
Yona Sipos UBC Faculty of Land and Food Systems
Helen Spiegelman Zero Waste Vancouver
Kim Sutherland BC Ministry of Agriculture
David Tracey Vancouver Community Agriculture Network (VCAN)
T’Uy’Tanat‐Cease Wyss Skwxw’u7mesh Nation
6. STAFF WORKING GROUP Mary Clare Zak (Chair) Social Policy
Andrew Pask (Staff Lead) Social Policy
Wendy Mendes Social Policy
Brent Toderian Planning
Tami Gill Planning
Rick Michaels Development Services
Sean Pander Sustainability
John Breckner Real Estate Services
Scott Edwards Transportation
Erin McDonald Transportation
Alan Duncan Park Board, Research and Planning
Bill Manning Park Board, Research and Planning
Douglas Scott Engineering
Kevin Millsip VSB
Liane McKenna (retired) Parks Board
Tegan Adams UBC Greenest City Scholar

Greenest City 2020 Action Plan - 09212 150
7. PUBLIC ENGAGEMENT SUMMARY Phase One There were 53 ideas and 3775 votes submitted for “Encourage local food” on the Talk Green to Us forum. The top five ideas were:
Ideas Number of Votes
Encourage urban food production 669
Develop a local food hub and expand the availability of local food at a neighbourhood level
509
Develop a city‐supported urban farming program 315
Create more community gardens 274
Municipal tax break for property owners that allow urban farmers to farm their yards
256
Phase Two
Great deal of support for, and high prioritization of, need to increase food infrastructure and food related green jobs related to production, processing, storage, distribution, access, and waste. Some specific infrastructure mentioned most often includes: urban farms and gardens. Some specific points: rezoning to allow these uses; accessible;
connection of cultural communities to farming; donate city‐owned land; need for an urban agriculture strategy
community meals and community kitchens maintain integrity of land and soil food hub create new, and strengthen, farmers markets and pocket markets composting infrastructure linked to food production food incubator
Strong support for school programs (as well as other institutions) related to food: healthy school meals; gardening class
Excited to see that social justice is being integrated into food priorities: accessibility of local, healthy, culturally appropriate foods accessibility of garden space, and of healthy food retailers affordability
Like to see the strong connections between green economy, food, waste and landscape
Need for tools, education and resources in collaboration with others (dieticians, teachers, farmers) to build local food systems
Need to support better land use regionally, and to develop systems to keep food in the region
In order to succeed, need to find ways to adjust tastes to seasonal produce in culturally sensitive ways
8. BASELINE METHODOLOGY Establishing the baseline of neighbourhood food assets in Vancouver involved integrated methods of data collection. Although some work had been done related to information on neighbourhood food

Greenest City 2020 Action Plan - 09212 151
assets, there was a general lack of comprehensive set of indicators that could be used to assess the availability of food assets. Three broad‐level metrics were determined to be valuable measurements in charting success of the Action Plan. First, the measure of “neighbourhood and city‐wide food infrastructure assets” was identified as a strong aggregate metric that could be created out of existing sub‐indicators. To do this, staff, in consultation with internal and external stakeholders, developed a definition of “food asset” – a concept that was linked to “the resources, facilities, services or spaces that support the City’s food system.” Following this, inventory data from a set of measurable city‐wide assets was compiled from various sources (including 2010‐Challenge Community Garden data, City grant data bases, and input from community partners). This information was then used as a baseline from which a series of estimate/projections were made as to the potential increases in infrastructure that seemed possible given strong civic policy support, a mixture of investment sources, and current community trends. These estimates were validated via interviews with City staff, the Vancouver Food Policy Council, key community informants, coordinators of community gardens and community food programs. Second, the presence and coverage of Neighbourhood Food Networks was determined as a strong organizational measure that would support Greenest City goals. Neighbourhood Food Networks work collaboratively in neighbourhoods to achieve food system objectives and are typically comprised of a coalition of community members, community organizations, agencies and business. At the time of developing the goal five formally funded Neighbourhood Food Networks were operating in various neighbourhoods and other informal networks were planned and/or in development. Interviews with the Network coordinators were conducted to assess the levels and locations of their activities and to assess neighbourhood gaps. Third, the percentage of residents who live within a five minute (400m) walk of a basket of healthy produce involved determining the licensees and locations of retail outlets that sell – or could sell – a mixture of fresh produce. The first step was to compile existing City of Vancouver business license permits in the categories of large‐scale supermarkets, Retail‐grocery, Retail‐Produce and “Retail‐other.” The latter category – because it includes a wide range of outlets (from convenience stores through to small gas station kiosks) required a visual review and assessment of each store – and a staff assessment of the likelihood that produce was being sold). Additional layers were added to the map identifying community produce stands, and farmers markets. Point data for all locations were mapped, and a buffer of 400 m was drawn around each to assess the five minute walking distance. Further study is needed to determine the percentage of people living within the buffer areas. The Local Food indicators provide a snapshot of the infrastructure and networks that are already established that support and enhance local food goals. The indicators will provide a measurement overtime to track success of the local good goals; however, there are still areas of further research needed and indicators that are not featured in the three broad‐level measurements. Local Food activities can have multiple benefits such as skill building, green employment, and urban greening which are not captured in the measurement. The qualitative aspects of local food, such as the knowledge, capacity and social capital among citizens, also requires further attention to more fully capture the impacts of the Local Food Action Plan.

Greenest City 2020 Action Plan - 09212 152
Appendix 2 – Public Engagement Summary 1. INTRODUCTION During the development of the Greenest City 2020 Action Plan, public input was sought on two occasions. For Phase 1 (June – October 2010), the public was asked for ideas that could help the City achieve the Greenest City targets. In Phase 2 (December 2010 – March 2011), public input was sought to provide comments on the draft Greenest City 2020 Action Plan. Objectives for the public engagement:
- To build constituency and garner support for the City to take bold and innovative measure to achieve the Greenest City goals;
- To build a sense of ownership from community members and stakeholders for taking action to achieve goals;
- To build partnerships with organizations for implementation; - To test new and innovative engagement methods and tools.
1.1 Public Engagement by the numbers: Through a blended approach of online tools and in person events over 35,000 people were engaged, with 9,500 being very active contributors to the process. From online ideas brainstorming to in‐person events, a variety of methods were used. At the end of phase one over 3,000 users had submitted 726 unique ideas, 28,000 votes, and 2,100 comments on the Talk Green to Us forum. We hosted ten events that attracted more than 3,700 people. In phase two, we engaged over 2,300 people in more than 50 workshops or events, ranging from fifteen minutes to full day workshops. Counting all of the time these individuals gave to the process came to 4605 hours – or more than 570 people working for a full day. In addition, we continued to engage people online with more than 200 people submitting comments online.
Phase 1+2 Public Engagement Activities Metric
Number of unique ideas from P1 online forum 726
Number of registered users from P1 and P2 online forums 3,414
Number of votes from P1 online forum 28,026
Number of comments from P1 & P2 online forums 2,262
Number of visitors to websites 35,979
Number of cities visiting website 1,600+
Number of people on our mailing list (as of June 1, 2011) 2,358
Total video views (as of June 1, 2011) 25,940
Twitter followers (as of June 1, 2011) 4,514
Facebook fans (as of June 1, 2011) 2,298
In person outreach at events (P1 & P2) 6,045
Direct mail (letters to community organisations) ~1,200

Greenest City 2020 Action Plan - 09212 153
2. ENGAGEMENT PRINCIPLES The following approaches and principles served as a guide the engagement strategy. We chose them to reinforce/compliment the objectives of diversified outreach and community ownership: 2. 1 Design Opportunities Across the Spectrum of Participation The International Association of Public Participation (IAP2) Spectrum of Public Participation framework was used as a lens during the design of the public engagement process. This spectrum outlines the varying levels of public engagement, based on the weight of public input. On one end of the spectrum is “inform”, where the public is notified about a decision, with limited input. On the opposite side of the spectrum, “empower”, citizens have direct control over the decision being made. A conscious effort was made to include tactics and strategies along the spectrum. To encourage two‐way dialogue and build ownership for these ideas in the community. In all cases we were working to move community members further towards the empower end of the spectrum.
Figure 6: Greenest City public engagement tactics mapped along the IAP2 Spectrum of Public Involvement27
2.2 Be innovative, iterative & nimble We tested a variety of methods and adjusted and modified our engagement based on lessons we learned as we went. From webinars, to casual ‘tweet‐ups’ to an unconference, the tools evolved in an iterative process as we learned more about what did and didn’t work. This spirit of experimentation was key to creating the conditions for diverse partnerships and shared ownership in the process. 2.3 Don’t do it alone, partner Rather than organizing a series of events on our own, we worked to build relationships and collaborate with organizations and groups who have existing networks and membership. This not only allowed us to reach more people than we would have otherwise, it also created opportunities for these organizations
27 Adapted from the International Association of Public Participation’s Spectrum of Public Participation http://www.iap2.org/associations/4748/files/IAP2%20Spectrum_vertical.pdf

Greenest City 2020 Action Plan - 09212 154
to shape the engagement process itself and to become active participants in its development. With multiple and sometimes diverse perspectives in the engagement planning and implementation, we aimed to encourage a more innovative and accessible process for all involved. 2.4 Encourage peer‐to‐peer When possible, we encouraged community members to engage with their peers in ways that made sense to them. This included a Do‐It‐Yourself consultation kit that provided the resources for residents to host their own Greenest City conversations with their friends and neighbours. It also involved collaborating with formal and informal local leaders who were interested in talking about the Greenest City initiative with their communities/members. 2.5 Meet people where they are This phrase represents the approach of both the workshop facilitation and also the physical location of many events. In some cases, we literally went to locations where people were already gathered – from a Sunday afternoon film screening at the Waldorf Hotel to a living room in South Fairview. This approach was closely linked with the collaboration, shared ownership and peer‐to‐peer principles. In addition to locating events in spaces where people already gathered, we also often began workshops with questions about participants’ own hopes and visions for the city. This recognized the knowledge and interest that was already in the room and helped connect the purpose of the consultation and draft plans with community members’ own interests. Through this sense of connection, we also hoped to cultivate community ownership of these proposed actions to encourage longer‐term engagement and action towards achieving the 2020 Greenest City targets. Meeting people where they are also refers to online engagement. For engagement, it is important to go to where the people are, and increasingly people are online. In 2009, Statistics Canada reported that 86% of Vancouverites aged 16 and older used the Internet for personal reasons, compared to a national average of 80%. A 2010 Ipsos Reid report determined that 55% of Canadians have a personal profile on an online social network. Among the 18 to 34 age range, 84% of Canadians have an online social network profile.28 In a 2008 survey conducted by Synovate Ltd for the City of Vancouver on the 2010 Host City, residents and businesses were asked their preferred communication channels for information on participation opportunities. The web was identified as the number one preferred opportunity channel, whereas public meeting was the least favourable option.29 Open Houses, surveys and workshops are the traditional methods that the City solicits input on planning initiatives. Although there is a place for these strategies, they are becoming increasingly limited. Finding the time to attend a public workshop can be challenging. Conversations that take place at these events are limited to the participants who were involved in them. Moving this dialogue to an online space moves these conversations into the open, improving transparency. 2.6 Reach beyond the ‘usual suspects’ Throughout Phase One and Phase Two, the team recognized that an innovative engagement process needed to involve a broad cross‐section of the community. From the local arts organization, Vancouver is Awesome, to S.U.C.C.E.S.S., which provides resources and support to new immigrant and Chinese
28 The Ipsos Canadian inter@ctive Reid Report 2010 Fact Guide: The Definitive Resource on Canadians and the Internet. 29 Synovate Ltd. (December 2, 2008) 2010 Host City Survey Final Report
Greenest City 2020 Action Plan - 09212 155
Canadian communities, we sought out groups with strong ties to sectors that might not otherwise participate in either a city‐led or environmental sustainability focused conversation. Social media helped to connect with a new and younger audience. 2.7 Walk the talk We strived to emulate the Greenest City principles in every event that we hosted. This meant serving only vegetarian and vegan food, providing tap water instead of bottled water, and working with the caterer to reduce packaging waste. Real plates, glassware, cutlery and cloth napkins helped reduce waste along with composting and recycling. Events were held in transit accessible places and a bike valet provided free and secure bicycle parking at larger events. Scholarships and volunteer shifts enabled people to attend Greenest City Camp regardless of finances. We also applied this principle as we selected contractors. We worked with smaller companies and start‐ups to give them experience and grow jobs. 3. METHODS A core objective for the Greenest City consultation was to test new and innovative engagement methods and tools. This was done in effort to broaden the reach of the consultation and to reach out to new audiences. Throughout the consultation period, a blended approach of in person and online tools were tested including:
- Online public brainstorming (Talk Green to Us UserVoice forum) - External Advisory Committees - Cohosted and organized workshops, dialogues, potlucks, film screenings - Events (Pecha Kucha launch, Ideas Slam, Open House, Alfresco Dinner) - Social Media (Facebook, Twitter, Flickr, Youtube) - Talk Green Vancouver Website - Multicultural Outreach - Illustrated videos - Webinars - Greenest City Camp - DIY (Do It Yourself) Consultation Kits - Advertising in print, online, transit, on facebook
The process has been really well received. In an evaluation of the engagement process, the most commonly used words to describe the consultation were “Informative,” “creative” and “stimulating.”

Greenest City 2020 Action Plan - 09212 156
4. OVERALL THEMES The following pages summarize the results from both the online and in person workshops from both phases. They were derived at through a vigorous themeing process. 4.1 Level of support for the plan To assess support for Greenest City throughout the community, a baseline public opinion poll was conducted in July 2010. This randomized telephone survey found that at that time (just at the start of phase 1 consultation) that almost two‐thirds of Vancouver residents interviewed had heard of the Greenest City 2020 initiative. About half of residents said that becoming the Greenest City is very important to them (8 out of 10) with the average score for this question was 7.1 out of 10. Only 9% of respondents gave this initiative a low importance. Throughout the public consultation there was a high degree of support for the Greenest City vision and the course it establishes for the City of Vancouver. This support was evident by the number of people who participated online, came out to workshops and events. It was seen in the enthusiasm and excitement displayed in blog posts, earned media and social media. It was evident from the number of inquires from community members who wanted to get involved in the initiative, and from other cities wanting to learn about what Vancouver is doing. From workshop feedback and survey responses there was a sense that “Vancouver is on the right track”, the “plan is bare minimum” and that “this is the only direction we can go in. There is no turning back.” Pursuing the Greenest City vision gave some respondents pride in their City and confidence in City Council. “I am impressed with these initiatives and they give me confidence in my local government.” We’re “proud to be a in city that is looking at these things.” This public support could partially be attributed to the thorough and more open approach to consultation. This was achieved through online voting in phase one, the collaborative agenda building at Greenest City Camp, and through the design of workshops where community members with shared interests could meet and connect. By doing things differently and meeting people where they were, working with partner organizations, and practicing openness appeared to signify that the City was genuine about getting feedback and was serious about this plan.

Greenest City 2020 Action Plan - 09212 157
“I am impressed that the city is taking public involvement to such lengths; it seems to me to demonstrate the genuineness of the city's commitment to becoming more environmentally friendly.” What did you come away with from the consultation? “A perception that the City is really working hard to make this happen. This is inspiring.”
“The was the first time I felt designers and their ideas were really valued by the bureaucracy.”
Although support was high, a level of skepticism exists about whether this vision is a cleaver branding exercise or a plan that will be implemented. There was a sense that some people agree with the direction but “actions speak louder than words” and they are holding their breath to judge the outcome until actions have been made. This speaks to the need for the City to be very transparent about how it is progressing towards achieving the Greenest City targets. Open data and communicating actions as they are implemented can help demonstrate that the City is serious about achieving these targets.
“A lot of good ideas and initiative around an ambitious vision. The challenge will be to live up to the expectations that have been set.” “I’m concerned that the Greenest City initiative may be more about promoting the Vancouver brand than making the massive change that is needed in a timely way.”
There also exists a level of tension between a top‐down vision imposed by the City and a more bottom‐up grassroots approach to change. A way to overcome this is to continue with the approach that this consultation started and empower community organizations to make change happen. Move the City into a convener role and create the space to facilitate connections with residents around communities of interest. Give these groups tools to do meaningful work and invite them to contribute towards achieving the targets. It was clear from this consultation that the community wants to get involved, the challenge exists on how to most effectively facilitate that involvement. The Greenest City Neighbourhood Grants are a great start towards this more collaborative approach to achieving targets.
“The session I was at actually provided people the space to meet with others in my neighbourhood that were interested in the same issue. It made the situation more empowering instead of top down, like many other consultation processes I’ve been through.” “Provide communities with the tools to facilitate their own change” “I am always attending things and offering ideas and I never have a chance to implement them or do any follow up. It is continually frustrating.” (Survey respondent)
Throughout this consultation we found that Vancouver is filled with passionate, smart people who want to see sustainable solutions implemented and they want to be involved in making that transformation. This corresponds to the results from the phone survey. For the question “who is responsible for taking action to make Vancouver a green city” the top answer was individuals, followed by government with municipal and then provincial expected to bear the responsibility.

Greenest City 2020 Action Plan - 09212 158
4.2 What will it take to succeed? These overarching themes emerged from comments made at more than 50 events and workshops, along with comments made online. These themes offer useful advice for the City to consider as it moves forward with implementation plans. 1. Walk the talk, lead by example
Phase out non‐compostable, non‐recyclable products in city operations.
The Greenest City effort must be non‐partisan we need to “embed these goals in the government machine”
Demonstrate a strong financial commitment from the City.
2. Educate, inform, raise awareness
Explain/define/redefine terminology like "green" and "sustainable" so they have meaning.
Build public awareness through outreach and “education of everybody.”
Make it intergenerational, focus on kids and spread their excitement to parents.
Involve students and schools.
Tailor information for diverse communities.
Labeling and information about impacts of actions, to encourage/support informed decision‐making (e.g. toxics in materials, using plastic bags, flying).
Market these efforts consistently: “one name and better branding.”
Public education as a tool (regarding zero waste, local food, water, in response to question “What are you most excited about?”)
3. Ensure accessibility and affordability
Make it simple to implement actions, for example create infrastructure to support action
“Make it easy for people who don’t care to participate.”
Increase accessibility, support easy access to relevant services and infrastructure. 4. Collaborate and build relationships for implementation (with other governments, organizations,
businesses, community members, artists)
Need broad community dialogue
Collaborate towards partners taking on goals as a shared mandate, and remember: “External groups can lead partnerships.”
Leverage knowledge of other cities in Metro Vancouver and beyond.
Act at local and regional scales. 5. Encourage leadership and self‐organization among individuals and neighbourhoods
Engage volunteers.
“Find keeners to do projects, not workshops.”
Encourage “neighbourhoods self organizing to make them more green” towards synergistic action”.
“Build capacity in groups, not just outreach” to them.
Use a peer‐to‐peer approach
City as enabling, connecting people, a green city “dating service.”
Engage and empower expertise that is already in community (individuals, institutions, organizations, programs, meeting spaces).

Greenest City 2020 Action Plan - 09212 159
Community spaces as labs.
“Things will start from the bottom up. Won’t solve this with a top to bottom change. We’re the people who will start changing this. What we’re doing here is a pivotal thing”
6. Use carrots and sticks: create incentives, encourage innovation through policies, regulations, zoning
Provide financial and tax incentives.
Reduce red tape and develop supportive legislation for things like re‐zoning.
Price signals: “it has to affect people’s finances” in positive and negative ways. “Right now it’s cheaper to throw away than recycle.”
Stimulate behaviour change.
Financing tools and regulation that support action.
“Provide incentives, don’t penalize action”. 7. Reward, recognize, celebrate
Use inter‐neighbourhood competitions (i.e. Greenest Neighbourhood by 2020)
Have a system to recognize businesses who comply with ‘green’ initiatives
Recognize the contributions regular people are making, and use their faces/stories to humanize.
“Businesses are saying they want to be rewarded and be incentivized for green practices” 8. Broaden outreach, inclusion and engagement to communities across culture, income
Create a shared meaning of “green” across languages and cultures
“Try not to preach to the choir” by broadening outreach and engaging “Various cultural community and class communities”
“I appreciate that the city was willing to fork over the plan to strangers”
“People really wanted the opportunity to talk” “It’s hard to remain cynical when people are really, sincerely engaging”
“It was helping people to make changes, just by having the conversation.” 9. Change culture, shift paradigms and mindsets
“We need a paradigm shift.”
Positive, optimistic, inspiring tone and approach (from question: “What are you most excited about?”)
“The goals are transformative”
“Saw a value shift” through DIY consultations 10. Integrate goals, find synergies, take holistic view
Encourage efforts that take into account multiple goal areas and advance a number of targets.
Responsive land‐use policies. 11. Be accountable, use measurement and clear metrics
Set targets and develop metrics for measuring these efforts.
Be explicit about tradeoffs and make informed choices: “How does this mesh/conflict with other issues such as housing affordability?”
4.3 What should we watch out for?
Cost to businesses and/or residents of initiatives “green can’t be more expensive.”
Politically driven actions: “Will this initiative survive an election? A recession?”

Greenest City 2020 Action Plan - 09212 160
Strategies that are financially viable.
Inflexibility or top‐down approach: ”Don’t impose a one‐size‐fits‐all solution” Use “performance‐based housing codes.”
Do we have the capacity to achieve such ambitious goals? Will it happen?
Equity. Some groups can’t shoulder all the changes; the plan needs to be explicit about affordability and social justice.
Insufficient education about upcoming changes, benefits, opportunities.
Negative impacts on businesses: “If you discourage cars, you discourage the way that most people in this area get their customers.”
Using inaccessible language. “What does green mean?”
“Green fatigue” rebellion created by messages of “you should do this” or moral judgment.
Cost to the City at the expense of other important programs. “Why is GCAP not incorporated into other city goals?”
4.4 Advice from the Multi‐cultural roundtables on how to share this message with other communities
Words like “environment” and “green” don’t translate easily. It’s important to; “Talk green to me in my language”
Work with assets that are in the community, listen to knowledge that community members already have, particularly around what might be called traditional cultural practices.
Celebrate community leaders and those who are already taking action in some way.
Acknowledge and encourage what is already happening in different communities.
Recognize and address the systemic issues or challenges that impact people’s choices.
Encourage solutions to come from the communities. Challenged the perception that new Canadians or different cultural communities don’t care about environmental issues.
Without a community, people may be scared to change behaviour on their own.
Having a physical hub like Chinatown is a major opportunity where people could change together as a community.
Educational programs will be really important.
Connect with existing groups and events (i.e. the Chinese Cultural Festival)
The way the green movement is being marketed with romanticism of going back to nature, may not resonate with cultures that have worked to distance themselves from nature.
Economics and relevance: how are we able to afford this? Organic food as example. How to balance budget; afford and sustain, make it more attractive
Importance of class (perhaps more than culture) in accessibility of these issues
Shouldn't be a one size fits all approach ‐ entry level into green lifestyle

Greenest City 2020 Action Plan - 09212 161
Appendix 3 – Highest Priority Actions, 3 year Corporate 1. Plan and implement a comprehensive corporate waste reduction and diversion program
for all City facilities; 2. Develop a procurement policy and practice that supports the purchase and use of local
food in all City-run facilities including community centres and Parks Board restaurants; 3. Look for opportunities to green community events that the City runs, sponsors and
permits. 4. Plan and implement a program to significantly reduce greenhouse gas emissions and fossil
fuel use in City of Vancouver buildings and fleet, and achieve carbon neutral City government operations.
Green Economy 5. Develop a research, technology hub, incubator and trade mission program for each key
green cluster; 6. Develop a formal green pre-procurement program to create ongoing dialogue between the
City’s purchasing category managers and technology companies, and advance showcasing of local green technologies;
7. Establish a Green Enterprise Zone (recommended locations include the Port Lands, the Downtown Eastside, and the False Creek Flats);
8. Deliver a business program that aligns Greenest City and economic development tools to achieve measurable improvements in the environmental performance of Vancouver businesses with more than 10 employees.
Climate Leadership 9. Work with developers and energy utilities to establish four new renewable energy systems
for new, large site, high density developments; 10. Work with existing system operators to facilitate at least one major industrial or
institutional energy system conversion to a local renewable energy source; and 11. Work with key stakeholders to research the opportunities and considerations associated
with district-scale renewable energy sources with the aim of developing a policy framework to establish clear expectations as to the conditions under which the City will (or will not) consider each of these energy sources.
Green Buildings 12. Update Vancouver Building Bylaw with aim to increase energy efficiency and reduce
greenhouse gas emissions; 13. Develop and promote financing tools for building retrofits; 14. Use price signals in permit fees to reward energy efficiency and greenhouse gas reductions
in new and existing buildings. Green Transportation 15. Update the City’s transportation plan and develop a more detailed active transportation
master plan, supporting and building upon the Greenest City transportation goals, targets, and strategies noted here, and taking forward for consideration more detailed ideas gathered through the Greenest City consultation process.
16. Develop a pedestrian safety study and action plan to identify opportunities to improve safety through engineering, education, and enforcement measures.
17. Develop land use policies that enable mobility targets. 18. Continue to work with partners to deliver high capacity, fast, frequent, and reliable rapid
transit for the Broadway Corridor from Commercial Drive to UBC. 19. Launch a public bicycle sharing program.

Greenest City 2020 Action Plan - 09212 162
Zero Waste 20. Collect all compostables from single family residential properties on a weekly basis and
introduce every-other-week garbage collection and pilot compost collection from multi-family and commercial properties;
21. Develop zero waste education and enforcement strategies for all sectors (SF, MF and ICI) to encourage behaviours that maximize recycling and recover resources from the waste stream;
22. Work with the Province to expand Extended Producer Responsibility (EPR) programs, especially for packaging, printed paper, plastic bags, and newsprint;
23. Develop policy and incentives to encourage deconstruction for renovation and demolition projects.
Access to Nature 24. Convert street rights-of-way into 4-6 mini-parks; 25. Identify land and build 2-3 new parks in priority neighbourhoods; 26. Plant 15,000 new trees on City and other public property. Lighter Footprint 27. Pilot a green neighbourhood outreach and infrastructure program in one Vancouver
neighbourhood; 28. Actively support non-profits and social enterprises working to reduce ecological footprint;
and 29. Work with the Open Data Initiative to open Greenest City data. Clean Water 30. Require water metering on all new home services (single and dual family homes, new
construction and major renovations) effective 2012; 31. Develop and commence enhanced water education, incentive and conservation programs; 32. Continue to expand public access to drinking water; 33. Eliminate combined sewer overflows from sewage outfalls at Crowe and Burrard Streets
and develop Integrated Stormwater Management Plan. Clean Air 34. Encourage electric vehicle transport; 35. Regulate uncontrolled wood burning appliances for residential buildings; 36. Establish a framework for new air quality planning in the City. 37. Collaborate with Port Metro Vancouver on joint air quality issues. Local Food 38. Support urban agriculture by:
g. Creating 5-6 community gardens/yr; h. Enabling 3 new urban farms; i. Encouraging 2 new farmers markets; j. Adding public fruit trees; k. Investing in 3 neighbourhood food networks and l. Support the development of a Vancouver Food Hub
39. Provide local food in City facilities, such as community centres, through the development and implementation of a local food procurement plan.
40. Develop a Vancouver Food Strategy. 41. Comprehensive review of policy and regulatory barriers to growing local food for personal
consumption or economic development, and plan to remove barriers.