Embed Size (px)
Citation preview

The Childhood Obesity Surveillance Initiative (COSI)
in the Republic of IrelandFindings from 2008, 2010, 2012 and 2015

This report should be cited as:
Bel-Serrat S, Heinen MM, Murrin CM, Daly L, Mehegan J, Concannon M, Flood C, Farrell D, O’Brien S, Eldin N, Kelleher CC [2017]. The Childhood Obesity Surveillance Initiative (COSI) in the Republic of Ireland: Findings from 2008, 2010, 2012 and 2015. Dublin: Health Service Executive.
Copyright: Health Service Executive
The Childhood Obesity Surveillance Initiative (COSI) in the Republic of Ireland: Findings from 2015/2016
Dr Silvia Bel-Serrat, Dr Mirjam Heinen, Dr Celine Murrin, Professor Leslie Daly, Dr John Mehegan, Ms Máire Concannon, Ms Caira Flood, Mr Dónal Farrell, Ms Sarah O’Brien, Dr Nazih Eldin, and Professor Cecily Kelleher
The research of this report was undertaken by the National Nutrition Surveillance Centre (NNSC), School of Public Health, Physiotherapy and Sports Science, Woodview House, Belfield, University College Dublin, Dublin 4
Report commissioned by the Health Service Executive (HSE)
January 2017

Childhood Obesity Surveillance Initiative Ireland
Page 1
ForewordI very much welcome the publication of this report which sets out the trends observed in relation to healthy weight, overweight and obesity in primary school children in Ireland over the period 2008 to 2015. Drawing on data from more than 17,000 examinations of primary school children it paints a compelling picture. Over the four rounds of the surveillance (2008-2015) some key trends have emerged including:
the levels of overweight and obesity in 1st class children (age 7 years) and those aged 8 years appear to be stabilising albeit at a high level,
this stablisation is not observed in those children attending DEIS schools; and
there is a marked difference across genders with more girls tending to be overweight and obese than boys.
The trends evident from the surveillance reveal that the patterning of health inequality emerges early in life. When data from children attending DEIS schools is compared with that of children attending other schools, those attending DEIS schools tend to have higher levels of overweight and obesity and the gap becomes wider as children get older.
Healthy Ireland, a Framework for Improved Health and Wellbeing 2013-2025 seeks a whole of government and whole of society involvement to proactively improve the health and wellbeing of the population. We know that overweight and obesity is a significant risk factor for the development of chronic diseases such as cardiovascular disease and type 2 diabetes as well as certain cancers. And we know that childhood obesity tracks strongly into adulthood bringing with it all the inherent risk factors. More worryingly there is emerging evidence of many chronic illnesses previously only seen in adult populations, such as high blood pressure, type 2 diabetes emerging that children and young people.
In 2016, under the Healthy Ireland Framework, the Government published Healthy Weight for Ireland: Obesity Policy and Action Plan which sets a clear short-term target for a sustained downward trend in levels of excess weight in children and a reduction in the gap in obesity levels between the highest and lowest socio-economic groups by 10%. The ten steps forward set out in the Action Plan to achieve this target require coordinated and focused action across multiple sectors including industry, the built environment and transport, education, health, communities and individuals
The findings of this report indicate that we still have a significant way to go to create environments in our homes, schools and communities that support every child to grow and develop healthily from birth through to adulthood. Lifestyles and health are intrinsically linked and are heavily influenced by the prevailing environment. The development and nurturing of healthy lifestyles must occur across the life course at individual, community and societal level, if we are to successfully achieve a population shift away from our current tendency towards unhealthy weight and the consequent risks of chronic disease and their impacts at individual and population level.
I would like to thank the National Nutrition Surveillance Centre, who were commissioned to carry out this research. In particular I wish to acknowledge and thank the children who participated in the body measurements and their parents for agreeing to participate. In doing so they provide us with a vital tool for monitoring the impact of our efforts to promote healthy lifestyles and prevent childhood obesity.
Sarah O’Brien National Lead Healthy Eating Active Living Policy Priority Programme Health Service Executive
May 2017

Childhood Obesity Surveillance Initiative Ireland
Page 2
ContentsExecutive summary 3
Key findings 4
Introduction 5
Methods 7
Study characteristics 14
Results 18
Part A: Cross-sectional analyses First class children 18
Part B: Cross-sectional analyses children ≥8 years old 23
Conclusion 28
References 30
Acknowledgements 32

Childhood Obesity Surveillance Initiative Ireland
Page 3
Executive summary
Childhood Obesity Surveillance Initiative in the Republic of IrelandThe prevalence of obesity in children has been rising rapidly, leading to many serious health consequences worldwide. In 2008, the WHO Regional Office for Europe issued recommendations and guidelines for regular collection of data on weight, height, and waist and hip circumference in children worldwide in order to monitor prevalence trends of growth, overweight and obesity. Furthermore, data collection on possible risk factors contributing to childhood obesity was also encouraged. The Department of Health and the Health Service Executive commissioned the National Nutrition Surveillance Centre, based at the School of Public Health, Physiotherapy and Sports Science in University College Dublin, to carry out this surveillance work in the Republic of Ireland. This Irish survey is affiliated with the WHO European Childhood Obesity Surveillance Initiative, which was set up in 2006 by the WHO Regional Office for Europe, with an initial 13 Member States participating.
Study populationThe current report presents findings from four waves of the WHO Childhood Obesity Surveillance Initiative survey in the Republic of Ireland in 2008, 2010, 2012 and 2015. In 2008, 163 randomly selected primary schools participated in this project and in the first round the protocol as set out by the WHO for participating countries was followed. The target group was children aged exactly 7 years in First class. In the subsequent three waves, the same WHO protocol was followed and the same schools were contacted. As in Round 1, the target age group in Round 2, Round 3 and Round 4 was 7-year-old children in First class.
Cross-sectional surveysFirst class children in Round 2 were examined again two years later in Third class (9 years old) in Round 3 and five years later in Sixth class (12 years old) in Round 4. A second cohort of children was measured in Third class in Round 2 and in Fifth class (11 years old) in Round 3. First class children in Round 3 were examined again three years later in Fourth class (10 years old) in Round 4. This means that there are four cross-sectional surveys of 7-year-old children, two cross-sectional surveys of 9-year-olds, and one cross-sectional comparison group of 7-, 9-, 10-, 11- and 12-year-old children. In this report, we present the findings from the cross-sectional surveys of 7-year-old children and of ≥8-year-old children, separately.

Childhood Obesity Surveillance Initiative Ireland
Page 4
Key findings Over the four waves, data from a total of 17,145 examinations were available. In the first
data collection round (2008), 163 Irish primary schools participated. In the second (2010), third (2012) and fourth (2015) data collection rounds, 152, 159 and 138 schools participated, respectively. In 2008, 2,630 students from First class had their height, weight and waist circumference measurements recorded. In Round 2 (2010), 2,013 First class and 2,016 Third class students were examined. In Round 3 (2012), 1,729 First class, 1,945 Third class and 1,903 Fifth class students had their measurements recorded. In Round 4 (2015), 1,531 First class, 1,647 Fourth class and 1,731 Sixth class children were examined.
According to the International Obesity Task Force standards, the percentages of overweight and obesity in First class children were 21.6% in Round 1, 20.8% in Round 2, 16.8% in Round 3 and 16.9% in Round 4 (p-value for inverse trend p<0.001). Measurements in Round 1 took place in summer and children were, therefore, older than those examined in the other three rounds as examinations were undertaken in autumn (Round 2), and during winter and spring time (Rounds 3 and 4). However, children’s chronological age seems to explain the higher rates observed in Round 1 rather than a seasonal effect. When children were split into 6-months intervals of age, results showed a significant temporal effect towards the stabilisation of overweight and obesity rates across rounds in Irish First class children. On the other hand, the decline in participation rates over time among First class children could be linked to a certain degree of participation bias, mainly among the overweight and obese, resulting in lower overweight and obesity rates.
The prevalence of obesity among First class boys was 17.2%, 15.5%, 13.5% and 13.2% for the first, second, third and fourth rounds, respectively (p-value for inverse trend p=0.011). For girls, these percentages were 25.3%, 25.7%, 20.0% and 20.4%, respectively (p-value for inverse trend p<0.001). Overall, the prevalence of overweight and obesity was significantly higher (p-value <0.001) in girls compared with boys across all rounds. Significant inverse trends for overweight (including obesity) were observed for First class children in non-disadvantaged schools (p-value for trend <0.001), whereas no significant trend (p>0.05) was observed for disadvantaged schools across rounds. Overweight and obesity rates for Round 4 in disadvantaged schools were the lowest as compared with previous rounds.
Percentages of overweight and obesity when categorised by International Obesity Task Force standards for boys aged ≥8 years were 23.5%, 22.4%, 20.7%, 14.5% and 18.0% for Third class (Round 2), Third class (Round 3), Fifth class (Round 3), Fourth class (Round 4) and Sixth class (Round 4), respectively. The percentages of overweight and obesity for girls aged ≥8 years were 30.0%, 26.5%, 23.3%, 24.8% and 22.9% for Third class (Round 2), Third class (Round 3), Fifth class (Round 3), Fourth class (Round 4) and Sixth class (Round 4), respectively. Girls were more overweight and obese than boys; this difference reached significance (p<0.001) among Fourth class children in Round 4. Overall, both boys and girls showed a stabilisation in the prevalence of overweight and obesity across rounds and with age. Disadvantaged schools had higher prevalence of overweight and obesity in comparison with children in non-disadvantaged schools. While the prevalence of overweight and obesity in children in non-disadvantaged schools could be stabilising across rounds, overweight and obesity rates among children older than 8 years in disadvantaged schools seem to increase as they grow up.
In conclusion, the prevalence of overweight of obesity in Irish First class children could be stabilising; however, no trend was observed for First class children in disadvantaged schools. Among children aged ≥8 years, overweight and obesity rates seems to be stabilising as children become older; however, children attending disadvantaged schools show higher prevalence with age.

Childhood Obesity Surveillance Initiative Ireland
Page 5
IntroductionThe prevalence of childhood obesity has risen rapidly during the last decades. In 2014, the World Health Organisation (WHO) estimated that about 41 million children under the age of 5 years were overweight or obese (1). Although there is evidence of a potential stabilisation in several countries, current overweight and obesity rates are still too high. Projected prevalence of overweight, including obesity, shows global overweight prevalence for children aged 5-17 years rising from 14.2% in 2013 to 15.8% in 2025, from which 5.4% will be obese (2). Overweight and obesity are linked to more deaths worldwide than underweight and, globally, there are more people who are obese than underweight (1).
Obesity has been estimated to cost the European Union €70 billion annually through healthcare costs and lost productivity (3). For the Republic of Ireland, the direct and indirect costs of overweight and obesity in 2009 were estimated at €1.13 billion (4). It is estimated that diseases linked to overweight and obesity account for between 5% and 7% of total health care costs in Europe (3). The increase in the prevalence of obesity in childhood and adolescence occurs in conjunction with the increase in the prevalence of comorbidities including glucose intolerance, type 2 diabetes, hypertension, and hyperlipidaemia (5). Abnormalities in the gastrointestinal, pulmonary, orthopaedic, neurologic, dermatologic, and psychosocial systems are also linked to obesity (6). Although some of these comorbidities were exclusively observed in adult populations, they are now regularly observed in obese children. In addition, overweight and obesity during childhood and adolescence track into adulthood and have been shown to increase the risk of chronic disease, such as cardiovascular disease or cancer, and premature death during adulthood, regardless of being obese during adulthood (7-10). The Bogalusa Heart Study linked childhood obesity to early pathological vascular changes (11) and associated overweight in adolescence with hypertension and lipid and cholesterol abnormalities in later adult life (12). A cohort of 276,835 Danish children found body mass index (BMI) to be linearly associated with future coronary heart events (13).
In 2002, the Irish North-South National Children’s Food Survey established baseline data on the prevalence of overweight and obesity among 4- to 16-year-olds. The prevalence of overweight and obesity among boys was 23% and 28% among girls (14). The survey was conducted between 2003 and 2004 reported that the prevalence of obesity in boys ranged from 4.1 to 11.2% and in girls from 9.3 to 16.3% depending on which definition of obesity was used. This represents a two to fourfold increase in obesity in Irish children aged 8-12 years since 1990, again depending on the definition of obesity used (15). Two smaller Irish studies observed a similar prevalence of overweight and obesity: 24.6% for data collected in 2007 in children aged 4-13 years (16) and 27% for data collected between 2004 and 2007 in children aged 6 (17). The National Taskforce on Obesity (2005) (18) reported that in Ireland over 300,000 children were estimated to be overweight and obese and this was projected to increase annually by 10,000.
In 2005, the WHO Regional Office for Europe issued recommendations and guidelines for regular collection of data on weight, height, and waist and hip circumference in children worldwide (19). Preventing the rise in levels of overweight and obesity was a significant challenge for the Irish government. Therefore, in 2005, The Department of Health published the report of the National Taskforce on Obesity (18). As part of its plan for tackling obesity, the Taskforce recommended that:
‘A national database of growth measurements (height, weight, waist circumference, BMI) for children and adults should be developed by the Population Health Directorate in order to monitor prevalence trends of growth, overweight and obesity. The database can be created by developing the surveillance systems to collect the required data, for example the national health and lifestyle surveys, established longitudinal research projects and the school health surveillance system.’ (recommendation 4, 5).

Childhood Obesity Surveillance Initiative Ireland
Page 6
As a result, in 2008 the Department of Health and the Health Service Executive (HSE) commissioned the National Nutrition Surveillance Centre (NNSC) based at the School of Public Health, Physiotherapy and Sports Science in University College Dublin (UCD) to commence this surveillance work among primary school children in the Republic of Ireland. The following three rounds in 2010, 2012 and 2015 were commissioned by the HSE. In 2016, the Department of Health launched the Obesity Policy and Action Plan 2016-2025 ‘A Healthy Weight for Ireland’ (20), as part of the Healthy Ireland initiative. The document states short-term targets for overweight and obesity to be achieved in a five-year time frame. These include a decrease of 0.5% per year in the level of excess weight in children and a reduction in the gap in obesity levels between the highest and lowest socioeconomic groups by 10%. The policy also presents the ‘Ten Steps Forward’, which gathers a number of priority actions to be taken in order to prevent overweight and obesity and achieve the short-term targets. The priority action areas under Step 10 ‘Monitor research and review’ include, among others, ‘to sustain ongoing obesity surveillance through Healthy Ireland and Childhood Obesity Surveillance Initiative (COSI) as means of monitoring progress.’ Regular surveillance of weight status among Irish children will be essential to monitor any changes occurring in terms of childhood obesity in order to inform the policy and to evaluate the progress on achieving these targets.
Aims and objectivesThe Irish COSI is an ongoing, systematic process of collection, analysis interpretation and dissemination of descriptive information for monitoring obesity, identified as a serious public health problem in the WHO European region (21) and for use in programme planning and evaluation (19).
The system aims to measure trends in overweight and obesity in primary school children in order to have a correct understanding of the progress of the epidemic in Ireland, while also allowing inter-country comparisons within the WHO European region. The implementation of a simple, effective and sustainable surveillance system will be important to provide valuable information to be able to tackle and monitor the obesity epidemic in children, identify groups at risk and evaluate the impact of obesity preventive interventions.
In this context, it is important to highlight that surveillance is not equivalent to screening. Screening involves applying a test to a defined group of persons in order to identify a risk factor or a combination of risk factors of a disease at an early stage – the people who are identified as ‘at risk’ are then treated. By contrast, surveillance collects anonymised data in a representative sample of people to monitor trends and for policy and planning purposes.
The core objective of COSI in Ireland is to measure in primary school children:
Weight, height, body mass index (BMI) and waist circumference.
Prevalence of underweight, normal weight, overweight and obesity.

Childhood Obesity Surveillance Initiative Ireland
Page 7
Methods
Study designThe WHO European COSI is a collaborative study with principal investigators from all countries co-operating in relation to survey content, methodology and timing using a common European protocol. The Irish surveillance system followed the protocol of the WHO European COSI, which was jointly developed by the WHO Regional Office for Europe and the participating Member States. Strict adherence to the original protocol was required for inclusion in the European database and this procedure was achieved with the current study.
More details about the cluster-sampling procedure and the sample size calculations were previously described in the first report (22). In summary, 163 schools consented to take part in this study in Round 1 (2008) and children in First class were measured. Only one First class per school was sampled, even if there were multiple First classes in the school. Those same 163 schools were contacted again for Round 2, Round 3 and Round 4 for data collection in 2010, 2012 and 2015, respectively. In cases where the school participating in the Round 1 was a junior school, the senior schools were approached as well during Rounds 2, 3 and 4. Junior schools include Junior infants, Senior infants and First class, whereas senior schools include Second to Sixth classes. One of the goals of the subsequent rounds was to follow up those children measured previously. Therefore, in Round 2 (2010) not only First class was included, but also Third class; in Round 3 (2012), First, Third and Fifth class were included, and in Round 4 (2015), First, Fourth as well as Sixth class were included. Also for Rounds 2, 3 and 4, only one class from each year was selected per school.
SubjectsOriginally, the children in First, Third and Fifth class were chosen because these classes include children with the exact ages of 7, 9 and 11 years, respectively. Fourth and Sixth class were selected in Round 4 to follow those children in First class and Third class in Round 3, respectively. These age groups precede puberty (23) and at these ages the identification of obesity is of value to predict the condition in adulthood (24).
Ethical considerationsEthical approval was obtained from the Research Ethics Committee, Human Research Sub Committee, UCD, on all four occasions (2008, 2010, 2012 and 2015).
Consent was obtained on three levels: at school, parent and child level. Within each round, an initial letter and a consent form were sent to the principals in which the objectives of the surveillance system were explained. A final number of 163 schools consented to participate in this study in 2008. Subsequently, all parents from the sampled classes with the selected age groups in participating schools were given a letter explaining the surveillance system and the anthropometric measurements. Parents were fully informed about all study procedures and a signed informed consent was obtained on a voluntary basis prior to the child’s enrolment to the study. On the day of the measurement, verbal consent was also obtained from the child. The exact same procedure was followed for Round 2 (2010), Round 3 (2012) and Round 4 (2015).
To ensure confidentiality for all collected and archived data, unique identification (ID) numbers were assigned to each child and each register refers only to these numbers. The research team alone has access to the full list of ID numbers and corresponding names of the children sampled, which is held separately from the examination data. The original hardcopy records are also anonymised, e.g. by removing the child’s name, and stored in locked cabins in UCD and used only for reference if required. These hardcopy records will be destroyed after seven years.
All information and consent forms for parents/guardians were approved by the Irish National Adult Literacy Agency (NALA). These forms were also available in Irish and this translation was conducted by a professional translator. Moreover, only for Round 1, Polish forms, translated by a professional translator, were available.

Childhood Obesity Surveillance Initiative Ireland
Page 8
TrainingPrior to their recruitment, all candidates were required to undergo the police vetting process to disclose any criminal convictions. For Round 1 (2008), 30 graduate nutritionists were recruited to carry out the fieldwork. For Round 2 (2010), Round 3 (2012) and Round 4 (2015), 15, 17 and 19 nutritionists were recruited, respectively. All researchers attended a training session in anthropometric measurements and data collection, following a standardised protocol drawn up by the WHO. The training included a review of the background and objectives of the surveillance system, standardised use of the forms, obtaining measurements of subjects as described in the protocol, support of children with anxieties, calibration of measurement instruments, recording measurement values immediately after reading them and writing legibly to reduce mistakes during data transfer.
Anthropometric measurementsMeasurements were carried out over as short a period of time as possible and data were not collected during the first two weeks of a new school term or immediately after a major holiday. For Round 1, measurements commenced two weeks after the Easter break on the 10th April 2008 and continued until the 26th June 2008 (11-week period). For Round 2, measurements commenced on 11th October 2010 and continued until the 29th November 2010 (7-week period). For Round 3, measurements commenced on 8th November 2012 and continued until the 30th January 2013 (12-week period with a 4-week break for the Christmas holidays). For Round 4, measurements commenced on 5th November 2015 and continued until 2nd February 2016 (13-week period with a 3-week break for the Christmas holidays).
Anthropometric measurements were carried out following standardised procedures for weight, height and waist circumference. For Round 1 (2008) and Round 2 (2010), SECA 872 weighing scales and the SECA 214 portable stadiometres were used throughout. For Round 3 (2012) and Round 4 (2015), Leicester Height Measure portable stadiometres were used throughout. Weight measurements were taken with HD-305 Tanita scales in Round 3 and with Tanita WB-100 MA scales in Round 4. For all four rounds, weighing scales were calibrated prior to the start of the data collection. Waist circumference was measured in 2008 and 2010 using a non-elastic metal tape with blank lead-in and in 2012 and 2015 using a non-stretchable plastic tape with a clear plastic slider with cursor line.
Children can be very sensitive about their own size and those of children around them, which was an important planning consideration for the research team (25). Measuring height, weight and waist circumference could accentuate these sensitivities and arguably might increase the risk of stigmatisation and bullying. To minimise any potential for harm or discomfort, all measurements were therefore done either in a private room or behind screens to ensure confidentiality and privacy. The nutritionists worked in pairs and were all female. Children were asked to wear normal, light, indoor clothing without shoes. Hair ornaments were removed and ponytails undone and all children were asked to empty their pockets.
Weight was measured in kilograms, to the nearest 100 gram unit (0.1 kg). The stadiometres were mounted at a right angle between a level floor and against a straight vertical surface (wall or pillar). Children’s height was measured in centimetres and the reading taken to the last completed 1 millimetre (mm). Waist circumference was measured in cm and recorded to the nearest mm.

Childhood Obesity Surveillance Initiative Ireland
Page 9
Other dataIndividual information on date of birth, date and time of measurement, sex, clothes worn when measured, as well as data on school year, school name and school address were also collected through the core data collection form. Furthermore, verbal permission was asked of the child before the measurements were taken and recorded.
An additional form was also completed by the teacher or principal. The mandatory school return form reported on the location of the school, the number of children registered and measured (examined) per sampled class, the number having refused to be measured and those absent on the measuring day. Additionally, a number of school (environmental) characteristics were also included, such as the frequency of physical education lessons, availability of school playgrounds, the possibility of obtaining certain foods and beverages on the school premises and current ongoing school initiatives organised to promote a healthy lifestyle (healthy eating, physical activity).
During Round 2 (2010), parents from both First class and Third class children were asked if they would like to fill in a Family Survey form as part of the study, which was returned separately to UCD by post. Through this survey, information regarding the child’s diet and physical activity pattern and family’s socioeconomic characteristics and co-morbidities was obtained. During Round 3 and Round 4, only parents of the First class cohort were asked to fill in this Family Survey form, since data of the other age cohorts were already measured in previous rounds. A report describing the Family Survey data collected in Round 2 and Round 3 was published (26).
Feedback to parents and childrenAlthough their child’s height, weight and waist circumference measurements were not routinely given to parents, they were given if requested. Children were never told their measurements or the measurements of other children. Research showed that children find it acceptable to be measured in school as long as the measurements were taken in a private room and not shared with their peers (25).
Data entryAll of the above data were recorded on prepared data sheets. The original data sheets were then sent to the NNSC. In addition, the nutritionists also recorded the coded data into standardised spreadsheets for Rounds 1 to 3, which were emailed back to the NNSC. For Round 4, data were recorded into an electronic data entry system, OpenClinica. Data were checked for inconsistencies. The final dataset only included children with informed consent and complete information on age and sex.
Measuring childhood obesityBMI is considered to be the best available population marker for monitoring trends in obesity. It is calculated from the formula, weight in kg/height in m2. Hall (27) has described it simply as an index of weight adjusted for height. Although it has many weaknesses as a measure of fatness of an individual, it is the only convenient measure for monitoring whole population fatness. It is widely used in adult populations and cut-off points of 25 kg/m2 and 30 kg/m2 are recognised worldwide as definitions of adult overweight and obesity.
Defining overweight and obesity in children requires a different methodology: children’s body fat content changes as they grow and is different for boys and girls. These differences mean that a single categorisation cannot be used to define childhood overweight and obesity; each sex and age group needs its own categorisation. Age- and sex-specific growth reference percentile charts and corresponding z-scores have been developed for this purpose. Z-scores allow for comparisons of anthropometric measures by standardising the measure relative to a reference population. Different countries however, use different growth reference charts based on different reference populations. This leads to difficulties in comparing data across countries.

Childhood Obesity Surveillance Initiative Ireland
Page 10
In the current study, the British 1990 reference data were used to calculate z-scores (27), because this reference database includes z-scores for weight, height and BMI of 3 to 17-year-old children, separately for boys and girls. The following were computed for each sex: weight-for-age, height-for-age and BMI-for-age z-scores.
To categorise underweight, overweight and obesity categories, Cole et al. in 2000 and 2007 (28, 29) developed a series of age - (by 6-month intervals) and sex-specific BMI cut-off points for the categories of childhood underweight, overweight and obesity based on pooled international data. These BMI cut-off points were derived from sex-specific BMI age curves that pass through a BMI of 18.5, 25 and 30 kg/m2 at age 18 years (Table 1). These cut-off points correspond to the adult underweight, overweight and obesity cut-off points of 18.5, 25 and 30 kg/m², respectively.
Table 1
The International Obesity Task Force cut-off points for underweight, overweight and obesity according to body mass index (BMI).
Grade BMI range at 18 years
Underweight <18.5
Normal weight 18.5 - <25
Overweight 25 - <30
Obesity ≥30
The percentile cut-off points at age 18 years corresponding to BMI cut-off points for underweight, normal weight, overweight and obesity (Table 1) are used to calculate percentiles and z-scores for children at different ages and sex. This work was done following a recommendation of an expert committee of the International Obesity Task Force (IOTF) and these cut-offs are known as the IOTF cut-off points. They are recommended for use in international comparisons of prevalence of overweight and obesity in childhood populations and therefore used in the current study. Overweight using IOTF cut-off points was defined as overweight including obesity.
Data analysisData were anonymised at the point of data entry. The dataset used for analysis included only children with informed consent and complete information on age and sex. Waist circumference extreme values were checked and children with unrealistic measurements were excluded (<30 cm or >110 cm) compared to their weight and height (n=2).
Analyses included children in First class aged 6-7 years and children in Third, Fourth, Fifth and Sixth class aged 8-13 years (Table 2).
Table 2
Classes and age ranges included in the analysis.
Class Age range
First Class 6-7 years
Third Class 8-9 years
Fourth Class 9-10 years
Fifth Class 10-11 years
Sixth Class 11-13 years
Childhood Obesity Surveillance Initiative Ireland
Page 11
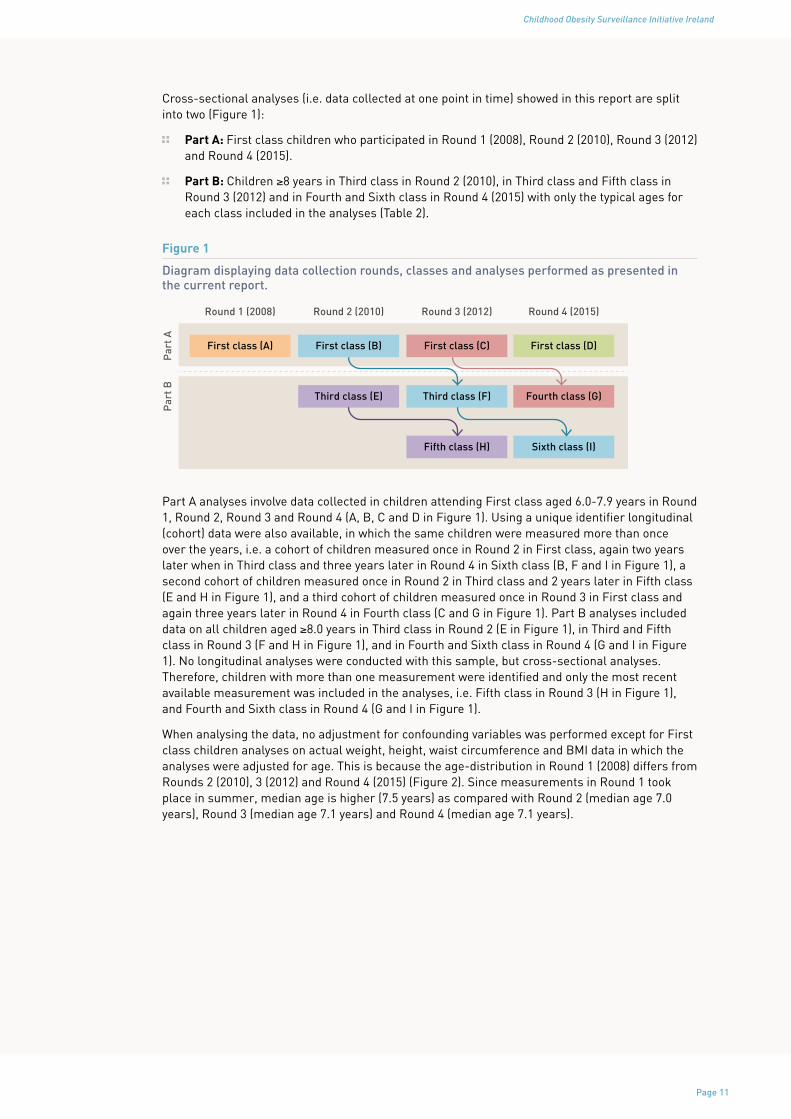
Cross-sectional analyses (i.e. data collected at one point in time) showed in this report are split into two (Figure 1):
Part A: First class children who participated in Round 1 (2008), Round 2 (2010), Round 3 (2012) and Round 4 (2015).
Part B: Children ≥8 years in Third class in Round 2 (2010), in Third class and Fifth class in Round 3 (2012) and in Fourth and Sixth class in Round 4 (2015) with only the typical ages for each class included in the analyses (Table 2).
Figure 1
Diagram displaying data collection rounds, classes and analyses performed as presented in the current report.
Par
t AP
art B
First class (A)
Round 1 (2008)
First class (B)
Round 2 (2010)
First class (C)
Round 3 (2012)
First class (D)
Third class (E) Third class (F) Fourth class (G)
Fifth class (H) Sixth class (I)
Round 4 (2015)
Part A analyses involve data collected in children attending First class aged 6.0-7.9 years in Round 1, Round 2, Round 3 and Round 4 (A, B, C and D in Figure 1). Using a unique identifier longitudinal (cohort) data were also available, in which the same children were measured more than once over the years, i.e. a cohort of children measured once in Round 2 in First class, again two years later when in Third class and three years later in Round 4 in Sixth class (B, F and I in Figure 1), a second cohort of children measured once in Round 2 in Third class and 2 years later in Fifth class (E and H in Figure 1), and a third cohort of children measured once in Round 3 in First class and again three years later in Round 4 in Fourth class (C and G in Figure 1). Part B analyses included data on all children aged ≥8.0 years in Third class in Round 2 (E in Figure 1), in Third and Fifth class in Round 3 (F and H in Figure 1), and in Fourth and Sixth class in Round 4 (G and I in Figure 1). No longitudinal analyses were conducted with this sample, but cross-sectional analyses. Therefore, children with more than one measurement were identified and only the most recent available measurement was included in the analyses, i.e. Fifth class in Round 3 (H in Figure 1), and Fourth and Sixth class in Round 4 (G and I in Figure 1).
When analysing the data, no adjustment for confounding variables was performed except for First class children analyses on actual weight, height, waist circumference and BMI data in which the analyses were adjusted for age. This is because the age-distribution in Round 1 (2008) differs from Rounds 2 (2010), 3 (2012) and Round 4 (2015) (Figure 2). Since measurements in Round 1 took place in summer, median age is higher (7.5 years) as compared with Round 2 (median age 7.0 years), Round 3 (median age 7.1 years) and Round 4 (median age 7.1 years).

Childhood Obesity Surveillance Initiative Ireland
Page 12
Figure 2
Age distribution (in months) according to weight measurements for Round 1 (2008; panel 1), Round 2 (2010; panel 2), Round 3 (2012; panel 3) and Round 4 (2015; panel 4).
Wei
ght (
kg)
60
50
40
30
20
10
60
50
40
30
20
1072 78 84 90 96 72 78 84 90 96
Age (months)
1 2
3 4
In Part A, data are presented and tested for differences among rounds in weight, height, waist circumference and BMI in First class children. Analysis of covariance (ANCOVA) was used to assess a linear trend across Round 1 (2008), Round 2 (2010), Round 3 (2012) and Round 4 in First class children for weight, height, waist circumference and BMI; including the categorical variable for the rounds as a continuous term in the ANCOVA model adjusted for age as already described. Differences and a linear trend in the prevalence of overweight and obesity across different rounds was evaluated, using IOTF cut-off points as defined earlier. To determine a significant difference, Pearson’s chi-squared tests were used. Pearson’s chi-squared tests, adjusted for age, were used to assess trends. Weight, waist circumference and BMI were non-normally distributed and were therefore transformed to attain normality and their transformed values were used for the comparisons between rounds.
As already described, Part B shows measurements on weight, height, waist circumference and BMI in children aged ≥8.0 years taken in Rounds 2, 3 and 4. Data are presented separately by round and class. Weight, waist circumference and BMI were non-normally distributed; therefore non-parametric tests were applied to evaluate differences between sexes. Also, prevalence of overweight and obesity using IOTF categories is displayed for each round and class evaluated including subgroup analyses by sex, urban/rural schools and disadvantaged/non-disadvantaged schools. Pearson’s chi-squared tests were used to evaluate differences between groups.
All p-values in this report were based on two-sided tests and considered statistically significant if p-value<0.05. This means that a result is only called statistically significant if the probability of its occurrence purely by chance is less than 5%. No adjustments were conducted at this stage for the cluster-sampling procedure.

Childhood Obesity Surveillance Initiative Ireland
Page 13
In the current report, firstly, study characteristics are described which include the children’s participation rates and age distribution. Subsequently, Part A presents the cross-sectional analyses on First class children and Part B focuses on the results of the cross-sectional analyses on children ≥8 years old. No results on the longitudinal data are presented in this report.
Disadvantaged schools have been identified by the Department of Education and Skills as those schools that are at a social or economic disadvantage, which prevents students from deriving appropriate benefit from education in schools. The School Support Programme under the DEIS (Delivering Equality of Opportunity in Schools) action plan for educational inclusion, run by the Department of Education and Skills, had identified 631 disadvantaged schools in 2008 and 860 in 2012. The definition of these disadvantaged schools is based upon the “educational disadvantage” in the Education Act (1998) as: “…the impediments to education arising from social or economic disadvantage which prevent students from deriving appropriate benefit from education in schools” (30). The identification of disadvantaged schools for DEIS was based on the following variables: unemployed parents, Local Authority accommodation, lone parenthood, Travellers, free book grants and large families (i.e. ≥4 siblings) (31).

Childhood Obesity Surveillance Initiative Ireland
Page 14
Study characteristics
Recruitment of schoolsLetters were sent initially to schools inviting them to participate in the study and these were followed up by telephone calls. In 2008, 163 schools consented to take part in this study. These randomly selected schools were a representative sample of all primary Irish schools taking into account of the issue of small schools in the Republic of Ireland (22).
In 2010, 2012 and 2015, only the schools that took part in 2008 were approached, plus the senior schools if the junior school was included in the 2008 sample (Table 3). School response rates in Rounds 2 and 3 were similar and very high. Schools participation in Round 4 was lower as compared with the other rounds, but still high. Lack of time, busy period or too many other commitments, among others, were the main reasons why schools declined to take part in the study.
Table 3
Schools response rate in Rounds 2, 3 and 4.
Collection period Class Response rate
Round* Period n %
Round 2 Oct-Nov 2010 First 132/163 81.0
Third 132/165 80.0
Round 3 Nov 2012-Jan 2013 First 136/165 82.4
Third and Fifth 133/167 79.6
Round 4 Nov 2015-Feb 2016 First 116/162 71.6
Fourth and Sixth 117/166 70.5
*From this point onwards referred to as R2 (2010), R3 (2012) and R4 (2015), respectively
Urban and rural schoolsSchools response rates according to school location, i.e. urban or rural, for Rounds 2, 3 and 4 are presented in Table 4. Response rates were similar in Round 2 among urban and rural schools; however, rural schools had higher participation rates compared to urban schools in Round 3 and Round 4. Participation rates in Round 4 fell among both types of schools.
Table 4
Response rate of urban vs rural schools
Round* School typeResponse rate
n %
R2 (2010) Urban schools 120/148 81.1
Rural schools 32/40 80.0
R3 (2012) Urban schools 125/155 80.7
Rural schools 34/40 85.0
R4 (2015) Urban schools 108/153 70.6
Rural schools 30/40 75.0

Childhood Obesity Surveillance Initiative Ireland
Page 15
Disadvantaged schoolsIn 2008, 21 disadvantaged schools consented to take part in Round 1. The percentages of disadvantaged schools consenting to participate in Rounds 2 and 3 are comparable. In Round 4, disadvantaged schools had higher participation as compared to previous rounds, while the participation rate among non-disadvantaged schools was the lowest (Table 5).
Table 5
Response rate of disadvantaged schools
Round* School typeResponse rate
n %
R2 (2010) Disadvantaged 21/25 84.0
Other schools 131/162 80.9
R3 (2012) Disadvantaged 21/27 77.8
Other schools 138/168 82.1
R4 (2015) Disadvantaged 26/26 100.0
Other schools 112/167 67.1
Participation rates and parental consentSchools were asked to return a school form, which included data on total class numbers, parents who had not consented for their child to take part in the study, children themselves who declined on the day of measurement and those who were absent. During Round 1 (2008) 154 schools returned a school form, during Round 2 (2010) 154 schools (including junior and senior schools), during Round 3 (2012) 159 schools (including junior and senior schools) and during Round 4 (2015) 138 schools (including junior and senior schools). Over the four rounds, data of in total 17,145 examinations are available.
Table 6
Participation rates and parental consent
Round ClassExamined Parents refused Absent
n % n % n %
R1 (2008) First 2635 72.2 850 23.3 161 4.4
R2 (2010) First 2016 65.0 1002 32.3 111 3.6
Third 2016 63.8 1028 32.5 114 3.6
R3 (2012) First 1753 55.6 1261 39.9 181 5.7
Third 1945 62.5 1004 32.2 165 5.3
Fifth 1903 61.1 1023 32.8 188 6.0
R4 (2015) First 1531 56.6 1030 38.1 142 5.3
Fourth 1647 62.7 874 33.3 122 4.6
Sixth 1731 64.0 869 32.1 125 4.6
Over time, numbers of children in First class being examined decreased (Table 6). The participation rate of First class children in Round 4 slightly increased as compared with Round 3. Participation rates among older children remained similar across rounds. Children in Sixth class in Round 4 showed the highest response rate (64.0%). The percentage of parents who refused for their children in First class to take part in the study increased. It was still high in Round 4 (38.1%), but lower than in Round 3 (39.9%). For children ≥8 years old, the percentage of parents who refused to take part in the study remained similar across rounds and ranged from 32.1% for Sixth class in 2015 to 33.3% in Fourth class in 2015. Children being absent on the day of the measurement was very low ranging from 3.6% in First and Third class in 2010 to 6.0% in Fifth class in 2012.

Childhood Obesity Surveillance Initiative Ireland
Page 16
Table 7
Participation rates among First class children by sex, urban and rural schools, and disadvantaged and non-disadvantaged schools.
R1 (2008) R2 (2010) R3 (2012) R4 (2015)
n % n % n % n %
Boys 1226 70.1 969 64.0 867 56.3 737 54.9
Girls 1409 74.1 1047 65.9 886 54.8 794 58.3
Urban schools 2168 72.4 1664 64.7 1446 54.9 1270 56.3
Rural schools 467 71.2 352 66.5 307 58.6 261 58.0
Other schools 2405 72.5 1877 66.2 1589 56.9 1382 58.5
Disadvantaged schools
230 69.5 139 52.5 164 45.1 149 43.4
Focusing on participation rates among First class children (Table 7), a drop in the response rate was observed over time in both boys and girls, with participation remaining similar between sexes in the same round. Response rates declined over time in all types of schools. Participation equally dropped in urban and rural schools and response rates were quite similar in both types of schools within each round. Overall, response rate was slightly higher among rural schools, except for Round 1 were children in urban schools showed higher participation than those attending schools in rural areas. Lower participation rates were observed across rounds in both disadvantaged and non-disadvantaged schools, although the decline was more pronounced in children attending disadvantaged schools, from 69.5% in Round 1 to 43.4% in Round 4.
Childhood Obesity Surveillance Initiative Ireland
Page 17
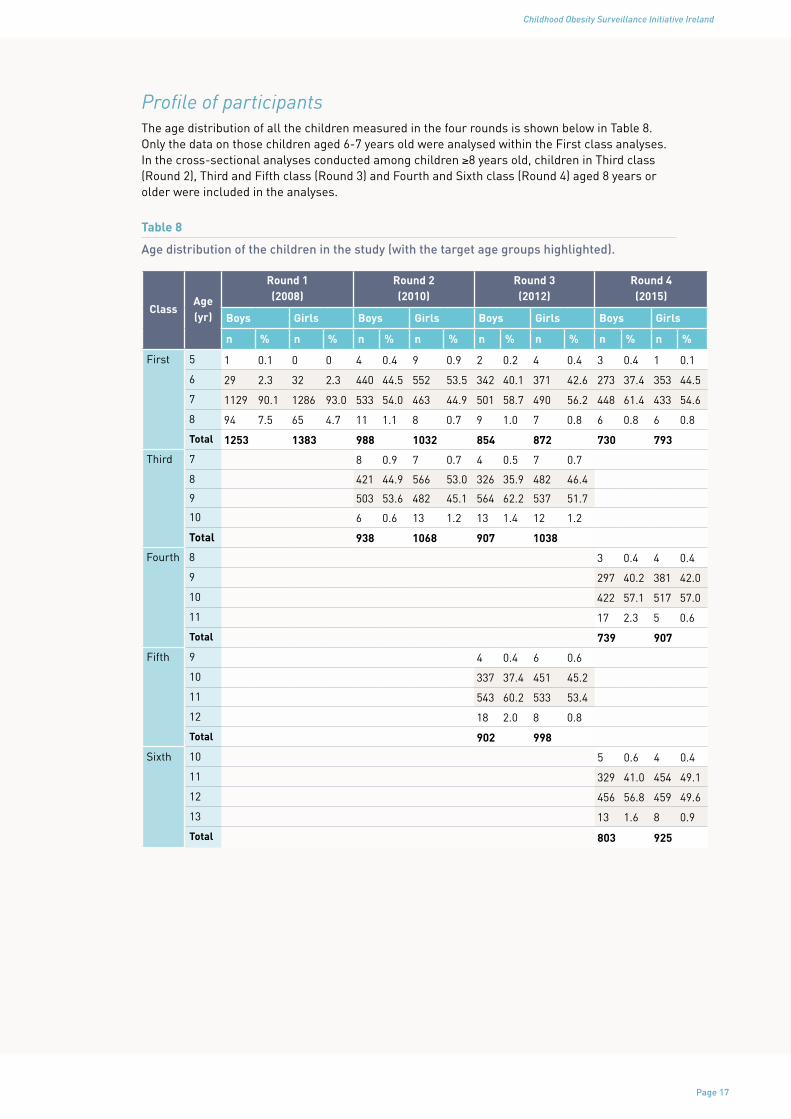
Profile of participantsThe age distribution of all the children measured in the four rounds is shown below in Table 8. Only the data on those children aged 6-7 years old were analysed within the First class analyses. In the cross-sectional analyses conducted among children ≥8 years old, children in Third class (Round 2), Third and Fifth class (Round 3) and Fourth and Sixth class (Round 4) aged 8 years or older were included in the analyses.
Table 8
Age distribution of the children in the study (with the target age groups highlighted).
ClassAge (yr)
Round 1 (2008)
Round 2 (2010)
Round 3 (2012)
Round 4 (2015)
Boys Girls Boys Girls Boys Girls Boys Girls
n % n % n % n % n % n % n % n %
First
5 1 0.1 0 0 4 0.4 9 0.9 2 0.2 4 0.4 3 0.4 1 0.1
6 29 2.3 32 2.3 440 44.5 552 53.5 342 40.1 371 42.6 273 37.4 353 44.5
7 1129 90.1 1286 93.0 533 54.0 463 44.9 501 58.7 490 56.2 448 61.4 433 54.6
8 94 7.5 65 4.7 11 1.1 8 0.7 9 1.0 7 0.8 6 0.8 6 0.8
Total 1253 1383 988 1032 854 872 730 793
Third
7 8 0.9 7 0.7 4 0.5 7 0.7
8 421 44.9 566 53.0 326 35.9 482 46.4
9 503 53.6 482 45.1 564 62.2 537 51.7
10 6 0.6 13 1.2 13 1.4 12 1.2
Total 938 1068 907 1038
Fourth
8 3 0.4 4 0.4
9 297 40.2 381 42.0
10 422 57.1 517 57.0
11 17 2.3 5 0.6
Total 739 907
Fifth
9 4 0.4 6 0.6
10 337 37.4 451 45.2
11 543 60.2 533 53.4
12 18 2.0 8 0.8
Total 902 998
Sixth
10 5 0.6 4 0.4
11 329 41.0 454 49.1
12 456 56.8 459 49.6
13 13 1.6 8 0.9
Total 803 925

Childhood Obesity Surveillance Initiative Ireland
Page 18
Results
Part A: Cross-sectional analyses First class childrenThe results of the comparisons of anthropometric data for First class children are shown in Table 9.
Table 9
Descriptives and differences over time of age, weight, height, waist circumference and body mass index in First class children.
Round n median P25-P75 p-value for trenda
Age (years)
All 7663 7.2 6.9-7.5
R1 2458 7.5 7.3-7.7
<0.001*R2 1990 7.0 6.7-7.3
R3 1708 7.1 6.8-7.4
R4 1507 7.1 6.8-7.3
Age (months)
All 7663 86.4 82.2-89.9
R1 2458 90.0 87.0-92.8
<0.001*R2 1990 84.0 80.5-87.4
R3 1708 85.1 82.0-88.3
R4 1507 85.0 81.9-88.0
Weight (kg)
All 7652 25.0 22.6-28.0
R1 2455 26.0 23.5-29.1
<0.001*R2 1984 24.7 22.4-27.5
R3 1707 24.6 22.3-27.4
R4 1506 24.6 22.2-27.4
Height (cm) All 7651 124.0 120.1-127.9
R1 2454 125.4 121.6-129.3
0.972R2 1983 122.8 119.2-126.8
R3 1708 123.6 119.6-127.1
R4 1506 123.6 119.8-127.4
WC (cm) All 7647 56.3 53.5-59.9
R1 2452 57.1 54.4-60.6
<0.001*R2 1982 56.3 53.5-60.0
R3 1708 55.5 52.8-58.9
R4 1505 56.0 53.2-59.5
Body mass index (kg/m2)
All 7650 16.3 15.3-17.6
R1 2454 16.4 15.5-17.9
<0.001*R2 1983 16.3 15.3-17.6
R3 1707 16.2 15.3-17.4
R4 1506 16.0 15.1-17.3
aage-adjusted for weight, height, waist circumference and body mass index. *p<0.05 WC - waist circumference

Childhood Obesity Surveillance Initiative Ireland
Page 19
A small but statistically significant trend was observed over time for weight, waist circumference and BMI. No statistically significant trend was observed for height. Overall, First class children in Round 1 were older, taller, heavier and had higher waist circumference and BMI, which could be explained by the fact that they were also older as compared with First class children measured in the other three rounds (Round 2, Round 3 and Round 4). Without considering Round 1, weight remained quite stable among First class children in Rounds 2, 3 and 4 and children in Round 2 were slightly smaller than those measured in Round 3 and Round 4. First class children in Round 3 had the lowest waist circumference (55.5 cm), followed by children in Round 4 and Round 2 with a median waist circumference of 56.0 cm and of 56.3 cm, respectively. A significant small but linear drop in median BMI was observed across rounds ranging from 16.4 in Round 1 to 16.0 Round 4.
Anthropometric data were further described considering children age in months. Results are shown in Table 10 split into 6-month categories: 72-77 months (6.00-6.49 years), 78-83 months (6.50-6.99 years), 84-89 months (7.00-7.49) and 90-95 months (7.50-7.99).

Childhood Obesity Surveillance Initiative Ireland
Page 20
Table 10
Descriptives and differences over time of weight, height, waist circumference and body mass index in First class children over 6-month periods of age.
Rou
nd72
-77
mon
ths
78-8
3 m
onth
s84
-89
mon
ths
90-9
5 m
onth
s
n m
edia
nP
25-P
75p-
valu
ean
med
ian
P25
-P75
p-va
luea
nm
edia
nP
25-P
75p-
valu
ean
med
ian
P25
-P75
p-va
luea
Wei
ght
(kg)
A
ll31
423
.721
.2-2
6.2
2030
24.0
21.9
-26.
733
8625
.222
.8-2
8.1
1862
26.2
23.7
-29.
5
R1
--
--
9124
.922
.4-2
8.0
0.00
5*
1120
25.7
23.2
-28.
6
0.00
0*
1244
26.3
23.8
-29.
7
0.05
9R
220
423
.821
.3-2
6.2
0.90
1
784
24.2
22.1
-26.
880
225
.122
.7-2
8.0
194
25.8
23.4
-28.
7
R3
9222
.920
.8-2
5.7
603
24.0
22.1
-26.
376
824
.822
.5-2
7.9
244
26.0
23.8
-28.
7
R4
7824
.221
.2-2
7.3
552
23.6
21.4
-26.
869
624
.822
.8-2
7.4
180
25.9
23.2
-28.
9
Hei
ght
(cm
)A
ll37
412
0.2
116.
6-12
4.0
2030
121.
811
8.3-
125.
333
8512
4.6
120.
9-12
8.2
1862
126.
312
2.5-
130.
0
R1
--
--
9112
3.4
119-
126.
7
0.67
4
1119
124.
812
1.2-
128.
5
0.42
7
1244
126.
312
2.5-
130.
0
0.97
3R
220
412
0.3
117.
5-12
3.9
0.35
7
784
121.
611
8.0-
125.
080
112
4.2
120.
7-12
8.0
194
125.
212
2.5-
129.
6
R3
9211
9.5
114.
9-12
3.7
603
122.
011
8.5-
125.
276
912
4.2
120.
4-12
7.9
244
126.
612
3.0-
130.
2
R4
7812
1.6
116.
7-12
4.9
552
121.
711
8.3-
125.
569
612
4.9
121.
1-12
8.5
180
126.
512
2.2-
129.
7
WC
(c
m)
All
374
55.7
52.7
-58.
720
2855
.652
.9-5
9.4
3383
56.4
53.6
-59.
918
6257
.154
.4-6
0.6
R1
--
--
9156
.954
.0-6
0.7
0.00
4*
1117
56.9
54.1
-60.
3
0.00
0*
1244
57.4
54.6
-61.
1
0.00
1*R
220
455
.853
.1-5
8.8
0.95
8
783
55.9
60.2
-53.
280
156
.653
.6-5
9.9
194
56.8
54.2
-60.
5
R3
9254
.951
.6-5
8.0
603
55.3
52.7
-58.
376
955
.652
.8-5
9.2
244
56.3
53.5
-59.
8
R4
7856
.152
.8-6
0.6
551
55.5
52.7
-59.
469
656
.153
.8-5
9.5
180
56.9
53.8
-60.
0
Bod
y m
ass
inde
x (k
g/m
2 )
All
374
16.3
15.5
-17.
520
3016
.215
.2-1
7.4
3384
16.2
15.3
-17.
518
6216
.415
.4-1
7.9
R1
--
--
9116
.515
.4-1
8.2
0.00
0*
1119
16.4
15.4
-17.
8
0.00
0*
1244
16.5
15.5
-18.
0
0.00
6*R
220
416
.415
.5-1
7.5
0.75
9
784
16.3
15.3
-17.
680
116
.215
.3-1
7.6
194
16.4
15.3
-17.
6
R3
9216
.215
.4-1
7.5
603
16.1
15.3
-17.
476
816
.215
.2-1
7.4
244
16.2
15.3
-17.
5
R4
7816
.215
.6-1
7.6
552
16.0
14.9
-17.
269
616
.015
.1-1
7.1
180
16.2
15.3
-17.
8
a p-va
lue
for
tren
d. *
p<0.
05. 7
2-77
mon
ths=
6.00
-6.4
9 ye
ars;
78-
83 m
onth
s=6.
50-6
.99
year
s; 8
4-89
mon
ths=
7.00
-7.4
9 ye
ars;
90-
95 m
onth
s=7.
50-7
.99;
W
C -
wai
st c
ircu
mfe
renc
e.

Childhood Obesity Surveillance Initiative Ireland
Page 21
Overall, height remained stable across rounds and age categories with no significant trends over time (Table 10). No significant changes in weight occurred across rounds among children aged 72-77 months and 90-95 months; a slight but significant decrease occurred in children aged 78-83 months and a stabilisation was observed in 84-89 months children. A significant trend across rounds was observed for waist circumference, except for those aged 72-77 months. Data showed a small decrease in waist circumference among children aged 78-83 months, and a tendency towards stabilisation seemed to be present in 84-89 months and 90-95 months children. A significant decrease in BMI was observed across rounds in 78-73 months, 84-89 months and 90-95 months children. These results suggest a stabilisation more than a real drop in BMI rates. In this sense, results should be interpreted with caution as participation rates have also dropped since Round 1 – 72.1% in Round 1 to 56.6% in Round 4. However, it cannot be precluded that the observed decrease in BMI is explained by the lower participation rates rather than a real drop in BMI among First class children.
Figures 3-5 present combined prevalence of overweight and obesity among First class children using IOTF cut-offs points.
Figure 3
Differences over time in overweight and obesity prevalence (categorised using IOTF standards) for First class boys and girls.
Per
cent
ages
(%)
25.3
21.6
17.215.5
20.8
16.8 16.9
25.7
20.0 20.4
10
15
20
25
30
Girls
Boys
All
R4 (2015)R3 (2012)R2 (2010)R1 (2008)
13.5 13.2
Overall, a significant inverse trend was observed in First class for the prevalence of overweight and obesity (p-value for trend <0.001). Similarly, overweight and obesity prevalence significantly decreased among both boys and girls in First class (p-value for trend =0.011 in boys, p-value for trend <0.001 in girls). The prevalence of overweight and obesity was significantly higher (p-value <0.001) in girls as compared with boys across all rounds.
The prevalence of overweight and obesity among First class children stratified by urban and rural schools (Figure 4) and by disadvantaged schools (Figure 5) is shown below.
Figure 4
Comparisons of overweight and obesity prevalence (categorised using IOTF standards) by urban and rural schools for First class children.
0
5
10
15
20
25
Rural schools
Urban schools
R4 (2015)R3 (2012)R2 (2010)R1 (2008)
Per
cent
ages
(%)
21.5
22.3 21.8
20.6
17.1 17.3
15.3 15.4

Childhood Obesity Surveillance Initiative Ireland
Page 22
Figure 5
Comparisons of overweight and obesity prevalence (categorised using IOTF standards) by disadvantaged schools for First class children.
0
5
10
15
20
25
30
Disadvantaged schools
Other schools
R4 (2015)R3 (2012)R2 (2010)R1 (2008)
Per
cent
ages
(%)
25.3
21.2 20.6
22.524.0
21.7
16.0 16.5
Significant inverse trends for overweight (including obesity) were observed for both urban and rural schools (p-value for trend <0.001 in urban schools, p-value for trend=0.002 in rural schools) and non-disadvantaged schools (p-value for trend <0.001) towards a stabilisation of overweight and obesity rates. No significant trend (p>0.05) was observed across rounds for disadvantaged schools, although the prevalence of overweight and obesity among First class children in Round 4 was the lowest observed so far, coupled with a drop in participation rates in children attending these schools. There were no significant differences (p>0.05) in the prevalence of overweight and obesity between either urban and schools or disadvantaged and non-disadvantaged schools. However, overweight and obesity prevalence remains higher among disadvantaged schools in comparison to non-disadvantaged schools and the gap between both types of schools is still present. This gap was more marked in Round 3 (2012).

Childhood Obesity Surveillance Initiative Ireland
Page 23
Part B: Cross-sectional analyses children ≥8 years oldAge distribution among children aged 8 years and older included in these analyses can be seen in Table 11, separately for each round and class.
Table 11
Age distribution of children ≥8 years old by round and class included in the analyses.
Age category (yr)
Round 2 Round 3 Round 4All rounds
Third class Third class Fifth class Fourth class Sixth class
n % n % n % n % n % n %
8 616 52.5 512 43.2 - - - - - - 1128 14.9
9 558 47.5 672 56.8 - - 614 38.0 - - 1844 24.4
10 - - - - 770 41.2 1000 62.0 - - 1770 23.4
11 - - - - 1098 58.8 - - 706 41.0 1804 23.9
≥12 - - - - - - - - 1014 59.0 1014 13.4
Total 1174 100 1184 100 1868 100 1614 100 1720 100 7560 100
As for First class children, descriptive analyses split by round and class are shown in Tables 12, 13 and 14 for children aged 8 years and older who participated in Rounds 2, 3 and 4.
Table 12
Descriptive analyses of age, weight, height, waist circumference and body mass index among children ≥8 years old in Third class in Round 2 (2010).
Round ClassAll Boys Girls
p-valuea
n median P25-P75 n median P25-P75 n median P25-P75
Age (years) R2 Third 1174 9.0 8.7-9.3 524 9.0 8.7-9.3 650 8.9 8.7-9.2 0.001*
Weight (kg) R2 Third 1173 31.4 27.8-36.4 523 31.7 28.2-36.5 650 31.2 27.5-36.4 0.493
Height (cm) R2 Third 1173 134.4 130.6-138.9 523 134.9 131.4-139.5 650 133.8 130.0-138.3 0.001*
WC (cm) R2 Third 1173 60.5 56.8-66.2 523 60.3 57.0-65.7 650 60.9 56.5-66.8 0.902
BMI (kg/m2) R2 Third 1173 17.4 16.0-19.3 523 17.2 16.0-18.9 650 17.5 16.0-19.5 0.091
aMann-Whitney test. *p<0.05. WC - waist circumference
Table 13
Descriptive analyses of age, weight, height, waist circumference and body mass index among children ≥8 years old in Third class and Fifth class in Round 3 (2012).
Round ClassAll Boys Girls
p-valuea
n median P25-P75 n median P25-P75 n median P25-P75
Age (years) R3 Third 1184 9.1 8.8-9.4 566 9.2 8.8-9.4 618 9.0 8.7-9.3 <0.001*
Fifth 1868 11.1 10.8-11.3 879 11.1 10.8-11.4 989 11.1 10.8-11.3 <0.001*
Weight (kg) R3 Third 1184 31.3 27.9-35.8 566 31.5 28.1-36.1 618 31.0 27.6-35.5 0.211
Fifth 1866 38.8 34.1-45.3 878 38.6 34.3-44.5 988 38.9 34.0-45.8 0.522
Height (cm) R3 Third 1184 134.9 130.8-138.9 566 135.5 131.5-139.5 618 134.4 130.0-138.4 <0.001*
Fifth 1867 146.2 141.7-150.9 878 146.4 142.1-150.6 989 146.0 141.4-151.2 0.640
WC (cm) R3 Third 1182 60.0 56.2-65.0 566 60.3 56.6-64.8 616 59.7 55.7-65.2 0.203
Fifth 1864 63.8 54.9-69.8 876 63.8 60.1-69.4 988 63.8 58.8-70.0 0.058
BMI (kg/m2) R3 Third 1184 17.2 15.9-19.1 566 17.2 15.9-18.9 618 17.3 15.9-19.3 0.515
Fifth 1866 18.1 16.5-20.3 878 18.1 16.6-20.0 988 18.1 16.4-20.6 0.442
aMann-Whitney test. *p<0.05. WC - waist circumference

Childhood Obesity Surveillance Initiative Ireland
Page 24
Table 14
Descriptive analyses of age, weight, height, waist circumference and body mass index among children ≥8 years old in Fourth class and in Sixth class in Round 4 (2015).
Round ClassAll Boys Girls
p-valuea
n median P25-P75 n median P25-P75 n median P25-P75
Age (years) R4 Fourth 1614 10.1 9.8-10.3 718 10.1 9.8-10.4 896 10.1 9.8-10.3 0.074
Sixth 1720 12.1 11.8-12.3 797 12.1 11.8-12.4 923 12.0 11.7-12.3 <0.001*
Weight (kg) R4 Fourth 1612 34.2 30.6-39.1 717 33.9 30.6-38.3 895 34.6 30.4-40.1 0.087
Sixth 1717 43.2 37.9-50.5 796 42.3 37.2-49.2 921 44.2 38.4-51.6 <0.001*
Height (cm) R4 Fourth 1612 140.2 136.2-144.6 717 140.7 136.7-145.2 895 139.6 135.7-144.3 0.002*
Sixth 1716 152.7 147.6-157.5 796 152.3 147.4-156.9 920 152.9 148.0-158.0 0.175
WC (cm) R4 Fourth 1610 61.2 57.6-66.1 716 61.2 57.9-65.5 894 61.2 57.4-66.8 0.787
Sixth 1717 65.2 61.2-71.4 795 65.5 61.6-71.7 922 64.8 60.5-71.3 <0.001*
BMI (kg/m2) R4
Fourth 1612 17.3 16.0-19.2 717 17.1 16.0-18.7 895 17.6 16.1-19.8 <0.001*
Sixth 1715 18.5 16.9-20.8 796 18.2 16.7-20.2 919 18.8 17.1-21.5 <0.001*
aMann-Whitney test. *p<0.05. WC - waist circumference
Overall, descriptors of anthropometric variables showed an increase in their values in parallel with increasing age suggesting linear growth among children (Tables 12, 13 and 14). Children were heavier and taller with waist circumference and BMI also increasing with age, reflecting a normal growing pattern. Differences in anthropometric variables between boys and girls are also shown for children within the same class. There were no significant differences in weight between sexes, except for Sixth class children with girls being heavier than boys (p<0.001). Overall, boys were taller than girls, with significant differences between Third class children in Round 2 (p=0.017) and Round 3 (p<0.001) and Fourth class (p=0.030) in Round 4. Waist circumference was similar between sexes; only boys in Sixth class had significantly (p<0.001) higher waist circumference than girls. As for BMI, girls in Fourth class (p<0.001) and Sixth class (p<0.001) showed significantly higher values of BMI than boys whereas no differences were observed between boys and girls in the other classes. However, these significant differences might not be relevant from a clinical point of view.
Figures 6-9 show individual anthropometric variables by round separately by sex.

Childhood Obesity Surveillance Initiative Ireland
Page 25
Figure 6
Change in weight with age for children ≥8 years.
0
5
10
15
20
25
30
35
40
45
50
Third class Third class Fourth class Fifth class Sixth class
R2 (2010) R3 (2012) R4 (2015) R3 (2012) R4 (2015)
Wei
ght (
kg)
Boys Girls
31.7 31.2 31.5 31.033.9 34.6
38.6 38.942.3
44.2
Figure 7
Change in height with age for children ≥8 years.
120
125
130
135
140
145
150
155
Third class Third class Fourth class Fifth class Sixth class
R2 (2010) R3 (2012) R4 (2015) R3 (2012) R4 (2015)
Hei
ght (
cm)
Boys Girls
134.9 133.8135.5 134.4
140.7
146.4 146.0
152.3 152.9
139.6
Figure 8
Change in waist circumference with age for children ≥8 years.
56
58
60
62
64
66
Third class Third class Fourth class Fifth class Sixth class
R2 (2010) R3 (2012) R4 (2015) R3 (2012) R4 (2015)
Wai
st c
ircu
mfe
renc
e (c
m)
Boys Girls
60.360.9
60.359.7
61.2 61.2
63.8 63.8
65.564.8

Childhood Obesity Surveillance Initiative Ireland
Page 26
Figure 9
Change in body mass index with age for children ≥8 years.
16
17
18
19
Third class Third class Fourth class Fifth class Sixth class
R2 (2010) R3 (2012) R4 (2015) R3 (2012) R4 (2015)
BM
I (kg
/m2 )
Boys Girls
17.217.5
17.2 17.317.1
17.6
18.1 18.1 18.2
18.8
Figure 6 shows that boys were heavier than girls at younger ages. This tendency was reversed as children grew up with girls steadily becoming heavier than boys, being this difference more marked (and significant) among Sixth class children. Boys remained taller than girls across classes (Figure 7). However, girls in Sixth class children were taller than boys, and although not statistically significant (p>0.05), it could be an indicator of the initiation of the pubertal development in girls, which tends to occur earlier than in boys.
There was no clear pattern in terms of waist circumference and children’s age (Figure 8). Overall, girls had higher BMI than boys in all classes. A more marked and statistically significant difference was observed between boys and girls in Fourth class and Sixth class in Round 4.
Figure 10
Prevalence of overweight and obesity (categorised using IOTF standards) by class among children ≥8 years.
27.124.6
22.120.2 20.6
23.5 22.420.7
14.5
18.0
30.0
26.523.3
24.822.9
0
5
10
15
20
25
30
35
Third class Third class Fifth class Fourth class Sixth class
R2 (2010) R3 (2012) R4 (2015)
Per
cent
ages
(%)
All Boys Girls
Figure 10 presents combined prevalence of overweight and obesity among children aged 8 years and older using IOTF cut-offs points. A higher proportion of girls was overweight and obese, with significant differences (p<0.001) between sexes in the prevalence of overweight and obesity in Third class in Round 2 (p=0.013), Fourth class (p<0.001) and Sixth class (p=0.013) in Round 4. No significant differences were observed between boys and girls in classes examined in Round 3. A stabilisation in terms of overweight and obesity rates seems to be occurring in both sexes.
Figures 11-12 show the prevalence of overweight and obesity among children ≥8 years old stratified by urban and rural schools (Figure 11) and by disadvantaged schools and other schools (Figure 12).

Childhood Obesity Surveillance Initiative Ireland
Page 27
Figure 11
Comparisons of overweight and obesity prevalence (categorised using IOTF standards) by class separately for urban and rural schools in children ≥8 years.
26.824.0
21.520.2
21.6
28.8 27.824.7
20.6
15.2
0
5
10
15
20
25
30
35
Third class Third class Fifth class Fourth class Sixth class
R2 (2010) R3 (2012) R4 (2015)
Per
cent
ages
(%)
Urban schools Rural schools
Figure 12
Comparisons of overweight and obesity prevalence (categorised using IOTF standards) by class separately for disadvantaged schools and other schools in children ≥8 years.
26.824.3
21.318.6 18.4
29.627.2
29.6 30.8 32.2
0
5
10
15
20
25
30
35
Third class Third class Fifth class Fourth class Sixth class
R2 (2010) R3 (2012) R4 (2015)
Per
cent
ages
(%)
Other schools Disadvantaged schools
No significant differences were observed between urban and rural schools in terms of overweight and obesity prevalence, except among children in Sixth class (p=0.019) in Round 4. Overweight and obesity could be stabilising in urban schools, whereas a drop seems to be taking place with age in rural schools. Disadvantaged schools had higher prevalence of overweight and obesity in comparison with other schools. Children in Fifth class (p=0.011) in Round 3 and in Fourth class (p<0.001) and Sixth class (p<0.001) in Round 4 attending disadvantaged schools showed significantly higher overweight and obesity rates than children in other schools. These results show that the existing gap in overweight and obesity rates between disadvantaged schools and other schools becomes wider as children become older. Furthermore, while the prevalence of overweight and obesity in children attending non-disadvantaged schools could be stabilising across rounds, overweight and obesity rates among children older than 8 years seem to be increasing with age in disadvantaged schools.

Childhood Obesity Surveillance Initiative Ireland
Page 28
Conclusion
Participation ratesA large dataset on anthropometric variables is currently available for a representative sample of Irish primary school children examined across the four COSI rounds. Overall, the participation rate among schools has fallen over time, mainly among non-disadvantaged schools. In contrast, all the disadvantaged schools that were invited to take part in the study in Round 4 agreed to participate. Participation rates among First class children have also decreased across rounds, with the highest participation rate being observed in Round 1 and the lowest in Round 3. Nevertheless, it has slightly increased among First class children in Round 4. The participation rate among older children has remained similar over waves.
The main reason for children not participating in the survey is the lack of consent from their parents. Although no information has been collected on the specific reasons why parents do not allow their children to be measured, we have speculated that, firstly, since obesity is a sensitive topic in Ireland, parents may feel judged when their children are measured and, as a result, they do not give consent for their children to be examined. However, it cannot be precluded that our findings are explained by the fact that overweight and obese children were not fully represented in our sample, rather than a real tendency towards stabilisation of overweight and obesity rates among Irish children, mainly among those in First class. This should be a consideration when interpreting the findings presented in this report.
First class childrenFirst class children measured in Round 1 were older than those measured in subsequent rounds. It is explained by the fact that measurements in Round 1 took place during summer and most of the children had turned 7 years when they were examined. For that reason, analyses were split into smaller age categories, i.e. 6 months, to potentially remove the age effect. This allowed us to observe that a significant time trend towards stabilisation in overweight and obesity rates appears to be occurring in Irish First class children when focusing on those with the same exact age, i.e. 84-89 months (7.00-7.49 years). Hence, date of measurement in relation to birthdate needs to be considered when investigating obesity in 7-year-old children as a 6-month age difference could represent a large gap in growth.
Girls were significantly more overweight and obese than boys across waves. Significant inverse trends for overweight (including obesity) were observed for First class children in urban, rural and non-disadvantaged schools, whereas no significant trend across rounds was observed for disadvantaged schools. Overweight and obesity rates for Round 4 in disadvantaged schools were the lowest as compared with previous rounds; however, they still remain higher in comparison with other schools and the gap between both types of schools is still present. Although participation rates declined among all types of schools over time, it was markedly higher among children attending disadvantaged schools.

Childhood Obesity Surveillance Initiative Ireland
Page 29
Children ≥8 years oldFindings showed linear normal growth among children aged ≥8 years. Older girls (12-13 years) had higher weight and height than boys, which could be an indicator of the onset of the pubertal development. Overweight and obesity rates are stabilising with age in both sexes and more girls were overweight and obese than boys. Children ≥8 years attending disadvantaged schools had higher rates of overweight and obesity than children in other schools. While the prevalence of overweight and obesity in children attending non-disadvantaged schools could be stabilising with age, overweight and obesity rates among children older than 8 years in disadvantaged schools seem to become higher as they grow up.
To conclude, results showed a significant temporal effect towards the stabilisation of overweight and obesity rates across rounds in Irish First class children. It was not observed for First class children in disadvantaged schools, though. Among children aged ≥8 years, overweight and obesity rates seems to be stabilising as children become older; however, children attending disadvantaged schools show higher prevalence with age. The decline in participation rates over time could be linked to the existence of some degree of participation bias, mainly among the overweight and obese, which could partially explain the observed results.

Childhood Obesity Surveillance Initiative Ireland
Page 30
References 1. Obesity and overweight fact sheet. The World Health Organisation. Available from:
http://www.who.int/mediacentre/factsheets/fs311/en/ (accessed on 15th December 2016)
2. Lobstein T, Jackson-Leach R. Planning for the worst: estimates of obesity and comorbidities in school-age children in 2025. Pediatr Obes 2016;11(5):321-325.
3. Final Report Summary - EATWELL (Interventions to Promote Healthy Eating Habits: Evaluation and Recommendations). The University of Reading (UK), Research and Enterprise Services. Available from: http://cordis.europa.eu/result/rcn/149433_en.html (accessed on 15th December 2016).
4. The cost of overweight and obesity on the Island of Ireland - Executive Summary. SafeFood, 2012. Available from: http://www.safefood.eu/SafeFood/media/SafeFoodLibrary/Documents/Publications/Research%20Reports/Final-Exec-Summary-The-Economic-Cost-of-Obesity.pdf (accessed on 15th December 2016).
5. Dietz WH, Robinson TN. Clinical practice. Overweight children and adolescents. The N Engl J Med 2005;352(20):2100-2109.
6. Lee H, Pantazis A, Cheng P, Dennisuk L, Clarke PJ, Lee JM. The Association Between Adolescent Obesity and Disability Incidence in Young Adulthood. J Adolesc Health 2016;59(4):472-478.
7. van Dam RM, Willett WC, Manson JE, Hu FB. The relationship between overweight in adolescence and premature death in women. Ann Intern Med 2006;145(2):91-97.
8. Must A, Phillips SM, Naumova EN. Occurrence and timing of childhood overweight and mortality: findings from the Third Harvard Growth Study. J Pediatr 2012;160(5):743-750.
9. Bjorge T, Engeland A, Tverdal A, Smith GD. Body mass index in adolescence in relation to cause-specific mortality: a follow-up of 230,000 Norwegian adolescents. Am J Epidemiol 2008;168(1):30-37.
10. Inge TH, King WC, Jenkins TM, Courcoulas AP, Mitsnefes M, Flum DR, et al. The effect of obesity in adolescence on adult health status. Pediatrics 2013;132(6):1098-1104.
11. Li S, Chen W, Srinivasan SR, Bond MG, Tang R, Urbina EM, et al. Childhood cardiovascular risk factors and carotid vascular changes in adulthood: the Bogalusa Heart Study. JAMA 2003;290(17):2271-2276.
12. Srinivasan SR, Bao W, Wattigney WA, Berenson GS. Adolescent overweight is associated with adult overweight and related multiple cardiovascular risk factors: the Bogalusa Heart Study. Metabolism 1996;45(2):235-240.
13. Baker JL, Olsen LW, Sorensen TI. Childhood body-mass index and the risk of coronary heart disease in adulthood. N Engl J Med 2007;357(23):2329-2337.
14. Whelton H, Harrington J, Crowley E, Kelleher V, Cronin M, Perry IJ. Prevalence of overweight and obesity on the island of Ireland: results from the North South Survey of Children’s Height, Weight and Body Mass Index, 2002. BMC Public Health 2007;7:187.
15. O’Neill JL, McCarthy SN, Burke SJ, Hannon EM, Kiely M, Flynn A, et al. Prevalence of overweight and obesity in Irish school children, using four different definitions. Eur J Clin Nutr 2007;61(6):743-751.
16. Barron C, Comiskey C, Saris J. Prevalence rates and comparisons of obesity levels in Ireland. Br J Nurs 2009;18(13):799-803.
17. Evans DS, Glacken M, Goggin D. Childhood obesity: the extent of the problem among 6-year-old Irish national school children. Child Care Health Dev 2011;37(3):352-359.

Childhood Obesity Surveillance Initiative Ireland
Page 31
18. National Taskforce on Obesity. Obesity - The Policy Challenges - The Report of the National Taskforce on Obesity. Department of Health and Children, 2005.
19. Wijnhoven T and Branca F. WHO European Childhood Obesity Surveillance Initiative. Protocol, Version January 2008. Copenhagen, 2008.
20. A Healthy Weight for Ireland - Obesity Policy and Action Plan 2016-2025. Healthy Ireland - Department of Health. Dublin, 2016.
21. The challenge of obesity in the WHO European Region and the strategies for response. Summary. World Health Organization - Regional Office for Europe. Copenhagen, 2007.
22. Heavey P, McGloin A, Kilroe J, Daly L, O’ Mahony D, Kelleher C. Childhood Obesity Surveillance Initiative in Ireland. Main Report. Health Service Executive and Department of Health and Children: Dublin, 2009.
23. Lehingue Y. The European Childhood Obesity Group (ECOG) project: the European collaborative study on the prevalence of obesity in children. Am J Clin Nutr 1999;70(1):166s-168s.
24. Janssen I, Katzmarzyk PT, Srinivasan SR, Chen W, Malina RM, Bouchard C, et al. Utility of childhood BMI in the prediction of adulthood disease: comparison of national and international references. Obes Res 2005;13(6):1106-1115.
25. McConnon A, Kelly C, McGloin A, Kelleher C. Investigation of the acceptability of anthropometric measurement to Irish children in the school setting: Children’s perspective in Republic of Ireland (Abstract). Irish J Med Sc 2009;178:S503.
26. Heinen MM, Murrin C, Daly L, O’Brien J, Heavey P, O’Brien M, Scully H, Mulhern LM, Lynam A, Eldin N, Kelleher CC. The Childhood Obesity Surveillance Initiative (COSI) in the Republic of Ireland: Descriptives of childhood obesity risk factors. Health Service Executive: Dublin, 2016.
27. Hall D. Uses and Abuses of the BMI, in Supplement to BACCH News-Measuring Childhood Obesity. Autumn 2005.
28. Cole TJ, Bellizzi MC, Flegal KM, Dietz WH. Establishing a standard definition for child overweight and obesity worldwide: international survey. BMJ 2000;320(7244):1240-1243.
29. Cole TJ, Flegal KM, Nicholls D, Jackson AA. Body mass index cut offs to define thinness in children and adolescents: international survey. BMJ 2007;335(7612):194.
30. DEIS: Delivering Equality of Opportunity in Schools. Department of Education and Skills. Available from: http://www.education.ie/en/Schools-Colleges/Services/DEIS-Delivering-Equality-of-Opportunity-in-Schools-/FAQs.html (accessed on 15th December 2016).
31. Archer P, Sofroniou N. The assessment of levels of disadvantage in primary schools for DEIS. Educational Research Centre: Dublin. Available from: http://www.erc.ie/documents/deis_assess_disadv_prim_sch.pdf (accessed on 15th December 2016).

Childhood Obesity Surveillance Initiative Ireland
Page 32
AcknowledgementsWe are indebted to the children who participated in this study and to their parents who consented for their child to take part in the study. Further, we wish to thank all the principals and teachers involved in this study.
Below, a table presents all those who have worked on the several rounds of the COSI study and their specific role(s).
Role Name Institution Place
Principal Investigator
Nazih Eldin (Rounds 2 and 3) Department of Health Dublin
Cecily Kelleher National Nutrition Surveillance Centre, University College Dublin
Dublin
Ursula O’Dwyer (Round 1) Department Health Dublin
Project Manager
Patricia Heavey (Rounds 1, 2)Mirjam Heinen (Round 3, 4)
National Nutrition Surveillance Centre, University College Dublin
Dublin
Data Clerks Adeline Gruel (Round 2)Orla McMahon (Round 2)Lisa-Marie Mulhern (Round 3)Michelle O’Brien (Rounds 2, 3)Helena Scully (Round 3)Máire Concannon (Round 4)Dónal Farrell (Round 4)Ciara Flood (Round 4)
National Nutrition Surveillance Centre, University College Dublin
Dublin
Data Collectors Round 1:Aimi Baker, Louise Basquille, Orla Brady, Melissa Byrne, Maria Carr, Mona Connolly, Grainne Corrigan, Cathy Cronin, Karen Cronin, Elaine Cunniffe, Thais Ferguson, Michelle Gray, Sinead Hopkins, Ingrid Hutchinson, Heather Jordan, Soniya Kaluskar, Jean Kennedy, Aine McConnon, Fiona McVeigh, Aine O’Connor, Katrina O’Hagan, Mary Clare O’Hara, Gillian O’Loughlin, Heidi O’Neill, Sarah Jane O’Sullivan, Darina Quigley, Nicola Taylor, Claire Toher, Nuala Tully, Olive Tully
National Nutrition Surveillance Centre, University College Dublin
Dublin
Round 2:Siobhan Boyle, Lorraine Carrabine, Cathy Cronin, Gillian Dawson, Sinead Duffy, Sinead Duignan, Clare Kelly, Laura Kennedy, Louise Mahony, Elaine McCarthy, Orla McMahon, Amy Mullee, Sinead O’Brien, Tonya O’Neill, Eilis Sutton
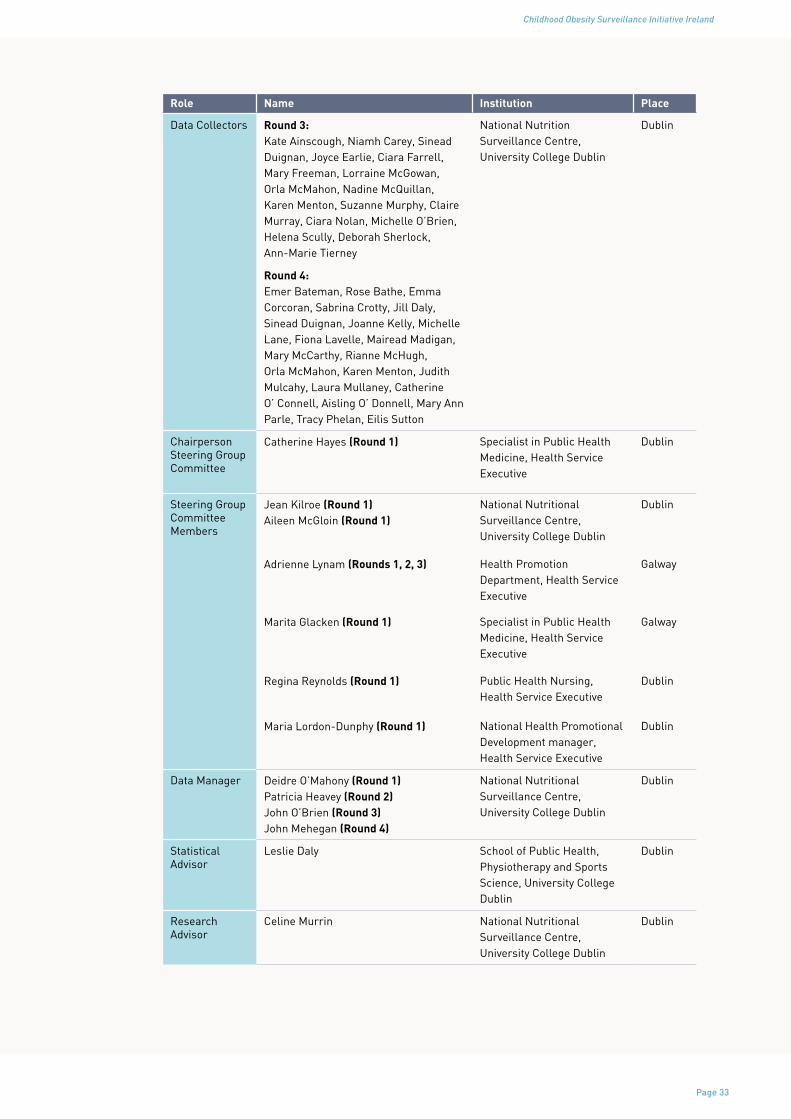
Childhood Obesity Surveillance Initiative Ireland
Page 33
Role Name Institution Place
Data Collectors Round 3: Kate Ainscough, Niamh Carey, Sinead Duignan, Joyce Earlie, Ciara Farrell, Mary Freeman, Lorraine McGowan, Orla McMahon, Nadine McQuillan, Karen Menton, Suzanne Murphy, Claire Murray, Ciara Nolan, Michelle O’Brien, Helena Scully, Deborah Sherlock, Ann-Marie Tierney
National Nutrition Surveillance Centre, University College Dublin
Dublin
Round 4:Emer Bateman, Rose Bathe, Emma Corcoran, Sabrina Crotty, Jill Daly, Sinead Duignan, Joanne Kelly, Michelle Lane, Fiona Lavelle, Mairead Madigan, Mary McCarthy, Rianne McHugh, Orla McMahon, Karen Menton, Judith Mulcahy, Laura Mullaney, Catherine O’ Connell, Aisling O’ Donnell, Mary Ann Parle, Tracy Phelan, Eilis Sutton
Chairperson Steering Group Committee
Catherine Hayes (Round 1) Specialist in Public Health Medicine, Health Service Executive
Dublin
Steering Group Committee Members
Jean Kilroe (Round 1)Aileen McGloin (Round 1)
National Nutritional Surveillance Centre, University College Dublin
Dublin
Adrienne Lynam (Rounds 1, 2, 3) Health Promotion Department, Health Service Executive
Galway
Marita Glacken (Round 1) Specialist in Public HealthMedicine, Health ServiceExecutive
Galway
Regina Reynolds (Round 1) Public Health Nursing, Health Service Executive
Dublin
Maria Lordon-Dunphy (Round 1) National Health Promotional Development manager, Health Service Executive
Dublin
Data Manager Deidre O’Mahony (Round 1)Patricia Heavey (Round 2)John O’Brien (Round 3)John Mehegan (Round 4)
National Nutritional Surveillance Centre, University College Dublin
Dublin
Statistical Advisor
Leslie Daly School of Public Health, Physiotherapy and Sports Science, University College Dublin
Dublin
Research Advisor
Celine Murrin National Nutritional Surveillance Centre, University College Dublin
Dublin


![Ap COSI PORTUGAL onocop [Modo de Compatibilidade] · 14-11-2009 1 WHO European Childhood Obesity Surveillance Initiative COSI PORTUGAL Ana Rito Investigadora Principal Instituto Nacional](https://img.dokumen.tips/doc/110x75/5c62dc9409d3f26d208b9879/ap-cosi-portugal-onocop-modo-de-compatibilidade-14-11-2009-1-who-european.jpg)