Embed Size (px)
Citation preview
The Chemistry and CVD of
Hydrophobic Surfaces
Colin R. Crick
University College London
2011

Declaration
2
I, Colin R. Crick, confirm the work presented in this thesis as my own. Where information has
been derived from other sources, I confirm that this has been indicated in this thesis.

Abstract
3
Abstract
This thesis details the use of chemical vapour deposition (CVD) to deposit hydrophobic
surfaces, in addition to this, the functional properties are investigated and further
characterisation of the surfaces extreme water repulsion (superhydrophobicity) is made. The
design and manufacture of surfaces that repel water (hydrophobic) draws much inspiration
from the natural world, including examples of superhydrophobic leaves. The way water can
interact with a surface is characterised, with many examples of superhydrophobic surface
generation provided from the literature, along with general routes toward their formation. The
main aspects of CVD depositions are addressed and examples of hydrophobic surfaces using
this technique are cited.
The novel deposition of thermosetting and thermosoftening polymers has been
investigated, with the role of the CVD deposition mechanism emphasised. The deposition of
the polymer occurs via the preformation of polymer particles, which is not typical in CVD,
these were then deposited onto the substrate. The result was an easy-to-produce and robust
superhydrophobic thin film, constructed from an inherently hydrophobic material. The same
principle is then expanded to silica microparticles, films of the particles were deposited on to
a substrate with hydrophilic surfaces originally deposited. The silica films were subsequently
rendered exceptionally superhydrophobic by a simple post-treatment. The formation of copper
films is then reported, using copper nitrate precursors a relatively flat metallic copper film
was formed. The films were then roughened by reaction to form copper hydroxide nano-
crystals, this hydrophilic surface is again functionalised to render it superhydrophobic. All
films deposited were characterised using energy dispersive X-ray analysis, glancing angle X-
ray diffraction, UV/Vis spectroscopy, infra-red/Raman spectroscopy and scanning electron
and atomic force microscopy were used to study surface morphology, with the
hydrophobicities of each surface quantified.
The superhydrophobic elastomer films underwent microbiological testing in order to
examine the adhesion of bacteria. A substantial reduction in the ability of bacteria to attach to
the superhydrophobic surfaces was observed and rationalised through a reduction in available
contact between the media of the bacteria (water) and the surface material.
The dynamic interaction between water and surfaces was examined through water
bouncing. The dependence of water bouncing on surface hydrophobicity and microstructure

Abstract
4
was studied, in addition to the effect of water droplet volume and impact velocity. A new
definition and scale for superhydrophobicity is proposed, through the ability of water droplets
to bounce on a surface. Finally the insight gained from previous work carried out is used in
developing a device for separating mixtures of oil and water, through the use of
superhydrophobic meshes.

Acknowledgements
5
Acknowledgements
Firstly, for support and guidance, I thank Prof. Ivan Parkin who has taught me a great deal in
the time I have spent within his group, which I very much appreciate. I would also like to
thank my secondary supervisor Prof. Claire Carmalt for time taken to discuss the project.
To those who helped me get started in the Parkin Laboratory I thank you; Ms. Gillian
Walters, Mr. Paolo Melgari, Dr. Naima Bj and Dr. Caroline Knapp. For constructive
discussion and debate I would like to mention; Dr. Geoff Hyett, Dr. Charlie Dunnill and Dr.
Russell Binions. Additionally I would like to thank everyone in Lab 308, past and present,
who helped to create a wonderful working environment, many of whom I consider to be my
close friends.
I thank Kevin Reeves for assistance with SEM imaging and EDX analysis, and Dr.
Steve Firth for help with Raman Spectroscopy. For collaboration on bacterial studies I would
like to thank Mr. Salim Ismail and Dr. Jonathan Pratten, in addition to Professor David Sheel
for constructive dialogue. Mr. Dave Knapp and Mr. Joe Nolan are thanked for technical
support and engineering issues. The EPSRC are thanked for providing funding and making
the project possible.
I would also like to take this opportunity to thank my parents, brothers Chris and Sam,
and friends who helped to support me through my studies. I extend greater thanks to my
partner Karolina, who has been there for me throughout my PhD, and who without, the
journey would have been much harder.

Contents
6
Contents
Declaration.................................................................................................................................2
Abstract..................................................................................................................................3-4
Acknowledgements....................................................................................................................5
Contents................................................................................................................................6-13
List of Figures and Tables.................................................................................................14-24
List of Abbreviations.........................................................................................................25-26
1. Introduction....................................................................................................................27-68
1.1. The Lotus Effect 28
1.2. Surface Models 30
1.2.1 Surface Models 30
1.2.1.1 Wenzel Model 31
1.2.1.2 Cassie-Baxter Model 33
1.2.1.3 Intermediate States 34
1.2.2 Superhydrophobicity 36
1.3. The Construction of Hydrophobic Surfaces 37
1.3.1 Fluoroalkylsilane (FAS) Coatings 37
1.3.2 Poly(tetrafluoroethylene) (PTFE) Surfaces 39
1.3.3 Alkyl–ketene Dimers (AKDs) 40
1.3.4 Poly(alkylpyrrole) 43
1.3.5 Chemically Altered Metal Surfaces 44
1.3.6 Carbon Nanotubes 48
1.3.7 Modified Silica-based Surfaces 50

Contents
7
1.3.8 Miscellaneous Surfaces 52
1.3.8.1 Lithographic Imprinting 52
1.3.8.2 Electro-spinning of Polystyrene 53
1.4. Chemical Vapour Deposition 54
1.5. Hydrophobic Surfaces via Chemical Vapour Deposition 55
1.5.1 Carbon Nanotubes (CNTs) 55
1.5.2 Polytetrafluoroethylene (PTFE) 56
1.5.3 Thermally Activated Deposition 56
1.6. Routes to Hydrophobicity 57
1.7. Commercial Application of Hydrophobic Surfaces 58
1.7.1 Lotus Effect Self-cleaning (Anti-biofouling) 59
1.7.2 Surface Protection 60
1.7.3 Textiles 60
1.7.4 Movement of Water 61
1.7.5 Microfluidics 62
1.7.6 Oil–water separation 62
1.8. Summary 62
1.9. References 63
2. The Aerosol Assisted Chemical Vapour Deposition of Polymers............................69-102
2.1. Introduction 70
2.1.1 Thermosoftening vs. Thermosetting Polymers 70
2.1.2 Aerosol Assisted Chemical Vapour Deposition 71
2.2. Experimental Details 72
2.2.1 Materials 72

Contents
8
2.2.2 AACVD Precursor Solutions 72
2.2.2.1 Melamine Precursors 72
2.2.3 Dip-coating/Spin-coating of Polymer Solutions 73
2.2.3.1 Dip-coating/Spin-coating of Melamine-formaldehyde Resin 73
2.2.4 Spray-Coating 73
2.2.5 Aerosol Assisted Chemical Vapour Deposition of Polymer Solutions 74
2.2.5.1 Modifications and Enhancements of AACVD Process 75
2.2.6 Film Characterisation 76
2.2.7 Surface Hydrophobicity Measurements 76
2.3. Results and Discussion 77
2.3.1 The Deposition of Thermosoftening Polymers 77
2.3.1.1 Dip-coated Films of Dyneon FC-2120 on Glass 77
2.3.1.2 AACVD Films of Dyneon FC-2120 on Glass 78
2.3.2 The Deposition of Thermosetting Polymers 79
2.3.2.1 Dip-coated Films of Sylgard 184 and NuSil Med-4850 on Glass 80
2.3.2.2 AACVD Films of Sylgard 184 and NuSil Med-4850 on Glass 80
2.3.2.3 Spray-coating of Sylgard 184 85
2.3.3 Comparing the AACVD of Thermosoftening and Thermosetting Elastomer 86
2.3.3.1 Substrate Adhesion 86
2.3.3.2 Film Appearance and Microstructure 87
2.3.3.3 Hydrophobicity 87
2.3.4 Surface Modifications and Enhancements 88
2.3.4.1 Dip-coating of CVD Substrates Prior to the AACVD of Sylgard 184 88
2.3.4.2 Swell Encapsulation of Methylene Blue 90
2.3.4.3 Incorporation of Gold Nanoparticles 90

Contents
9
2.3.4.4 Atomiser Assisted Deposition of Sylgard 184 91
2.3.5 The Deposition of Hydrophilic Melamine-formaldehyde Resin 94
2.3.5.1 Spin/Dip-coated Films 94
2.3.5.2 AACVD Deposited Films 95
2.3.5.3 Comparison with Low Surface Energy Materials 100
2.4. Conclusions 101
2.5. References 102
3. The Hybrid CVD and Functionalisation of Silica Microparticles.........................103-115
3.1. Introduction 104
3.1.1 The Hydrophobicity of Silica 104
3.1.2 The CVD of Silica-based Thin Films 105
3.2. Experimental Details 105
3.2.1 Materials 105
3.2.2 Hybrid CVD of Silica Microparticles 105
3.2.3 Functionalisation of Silica Microparticle Surface 106
3.2.4 Film Characterisation 107
3.2.5 Surface Hydrophobicity Measurements 107
3.3. Results and Discussion 107
3.3.1 The Deposition of Silica Microparticles via Hybrid CVD 107
3.3.1.1 Preliminary Depositions 107
3.3.1.2 Substrate Adhesion and Film Appearance 108
3.3.1.3 Film Microstructure 108
3.3.1.4 Hydrophobicity 110
3.3.2 Functionalisation of Silica Microparticle Surface 111
3.3.2.1 Hydrophobicity of Functionalised Silica Film 112
Contents
10
3.4. Conclusions 114
3.5. References 114
4. The Aerosol Assisted Chemical Vapour Deposition and Functionalisation of Copper
(0) and Copper (I) Oxide Thin Films...........................................................................116-128
4.1. Introduction 117
4.1.1 Thin Films of Copper via CVD 117
4.1.2 Copper in Hydrophobic Surfaces 117
4.2. Experimental Details 118
4.2.1 Materials 118
4.2.2 Precursor Solutions 118
4.2.3 AACVD of [Cu(NO3)2.3H2O] Solutions 118
4.2.4 Film Characterisation 119
4.2.5 Functionalisation of Copper Metal Films 119
4.2.6 Surface Hydrophobicity Measurements 119
4.3. Results and Discussion 119
4.3.1 AACVD of [Cu(NO3)2.3H2O] in Methanol 119
4.3.1.1 Film Appearance and Substrate Adhesion 119
4.3.1.2 Surface Microstructure 120
4.3.1.3 Phases Deposited 122
4.3.2 AACVD of [Cu(NO3)2.3H2O] in Ethanol and Water 123
4.3.3 Functionalisation of Copper (0) Films 124
4.3.3.1 Film Properties 124
4.3.3.2 Hydrophobicity 125
4.4. Conclusions 126
4.5. References 126
Contents
11
5. Bacterial Adhesion to Superhydrophobic Polymer Surfaces................................129-143
5.1. Introduction 130
5.2. Experimental Details 131
5.2.1 Materials 131
5.2.2 Sylgard 184 Precursor Solutions 131
5.2.3 Dip-coating of Microscope Slides 131
5.2.4 AACVD of Sylgard 184 onto Polymer-Coated Microscope Slides 132
5.2.5 Film Characterisation 133
5.2.6 Surface Hydrophobicity Measurement 133
5.2.7 Bacterial Strains 133
5.2.8 Bacterial Attachment Assay 133
5.2.9 Fluorescence Microscopy 134
5.3. Results and Discussion 134
5.3.1 AACVD of Sylgard 184 134
5.3.2 Bacterial Attachment Investigation 136
5.3.3 Bacterial Interaction with Superhydrophobic Surfaces 140
5.4. Conclusions 141
5.5. References 142
6. Dynamic Study of the Interaction of Water with a Surface..................................144-156
6.1. Introduction 145
6.1.1 The Comparison of Water Contact Angles and Tilt Angles 145
6.1.2 Factors Affecting the Behaviour of Water on a Surface 146
6.1.3 Water Bouncing Studies 147
6.2. Experimental Details 147

Contents
12
6.2.1 Materials 147
6.2.2 Surface Materials 148
6.2.2.1 Pre-prepared Surfaces 148
6.2.2.2 Titanium Dioxide 148
6.2.2.3 Silicone Elastomer 148
6.2.2.4 Functionalised Silica Microparticles 148
6.2.2.5 Functionalised Copper Hydroxide 148
6.2.2.6 Polytetrafluoroethylene 148
6.2.3 Static Surface Hydrophobicity Measurement 149
6.2.4 Water Bouncing Measurement 149
6.2.5 Water Droplet Rolling Observation 150
6.3. Results and Discussion 150
6.3.1 Water Droplet Bouncing 150
6.3.1.1 Effect of Water Impact Speed and Droplet Volume 150
6.3.1.2 Water Bouncing on Surfaces with a Rounded Microstructure 150
6.3.1.3 Varying Surface Microstructure 152
6.3.1.4 Superhydrophobic Water Bouncing 153
6.3.2 Rolling Motion of Water Droplets 154
6.4 Conclusions 155
6.5 References 155
7. Separation of Oil-Water Mixtures...........................................................................157-167
7.1. Introduction 158
7.2. Experimental Details 159
7.2.1 Materials 159
7.2.2 Superhydrophobic Mesh 159

Contents
13
7.2.3 Device Designs 160
7.2.3.1 Tilted Flowing Separation 160
7.2.3.1 Horizontal Dual-Layer Separation 161
7.24 Film Characterisation 162
7.3. Results and Discussion 163
7.3.1 Mesh Properties 163
7.3.2 Tilted Flowing Separation 164
7.3.3 Horizontal Dual-Layer Separation 165
7.4. Conclusions 166
7.5. References 166
8. Conclusions.................................................................................................................168-171
8.1. The Development of New Routes to Superhydrophobic Surfaces 169
8.2. The Anti-microbial Application of Superhydrophobic Surfaces 170
8.3. Utilising the Dynamic Interaction of Water 170
8.4. References 171
Appendices......................................................................................................................172-178
A.1. List of Publications 173
A.2. Water Contact Angle/Water Bouncing - Full Data Set 174

List of Figures and Tables
14
List of Figures and Tables
Chapter 1 - Introduction
Figure 1.01 A superhydrophobic disk prevents wetting of the surface, a water droplet is placed
static in the centre.
27
Figure 1.02 Diagram showing the interaction of water droplets with (a) hydrophobic and (b)
superhydrophobic surfaces. “Lotus effect” self-cleaning on superhydrophobic
surfaces allows for dirt and bacteria to be carried away from the under action of
water.
29
Figure 1.03 Scanning electron microscope (SEM) image of Nelumbo nucifera (Lotus) leaf
exhibiting a highly rough surface microstructure, with additional smaller scale
roughness on the protrusions. Scale bar shows 50 μm.
29
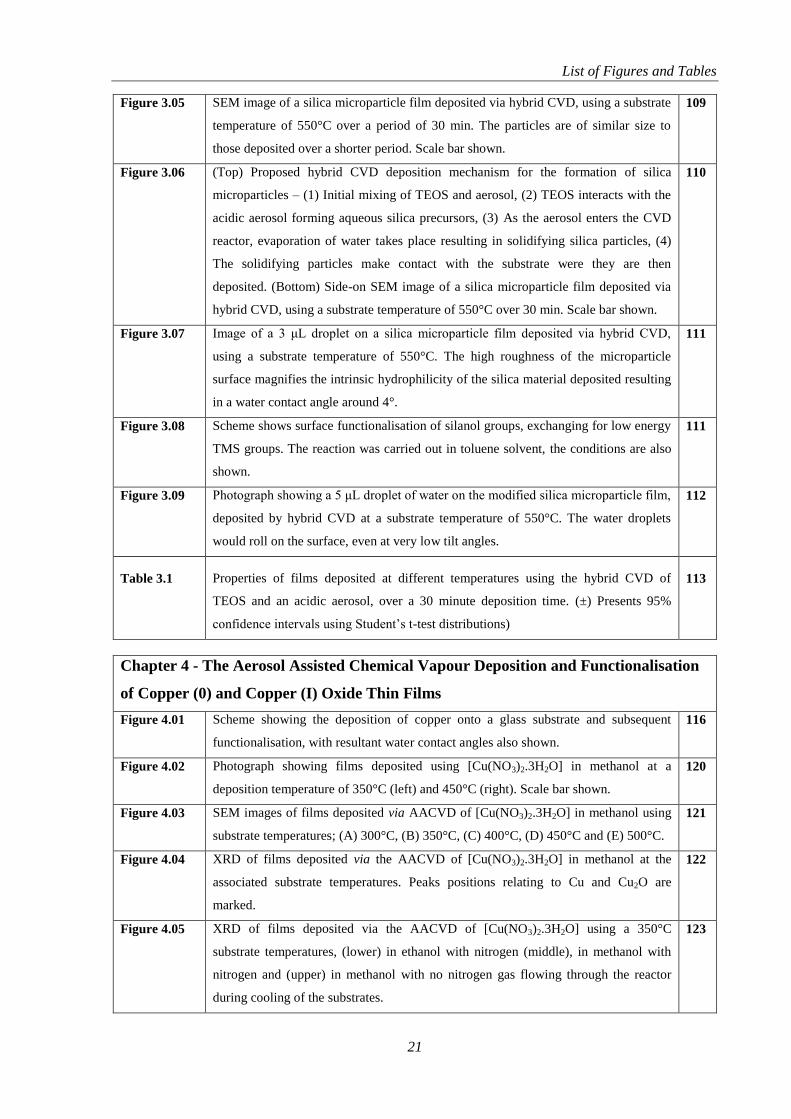
Figure 1.04 SEM images of a water striders leg. Spindle-like structures emanating off the leg have
a nano-grooved structure, providing dual-scale roughness to the leg. A secreted wax
acts to repel water. Scale bars – left = 20 μm and right = 200 nm.
30
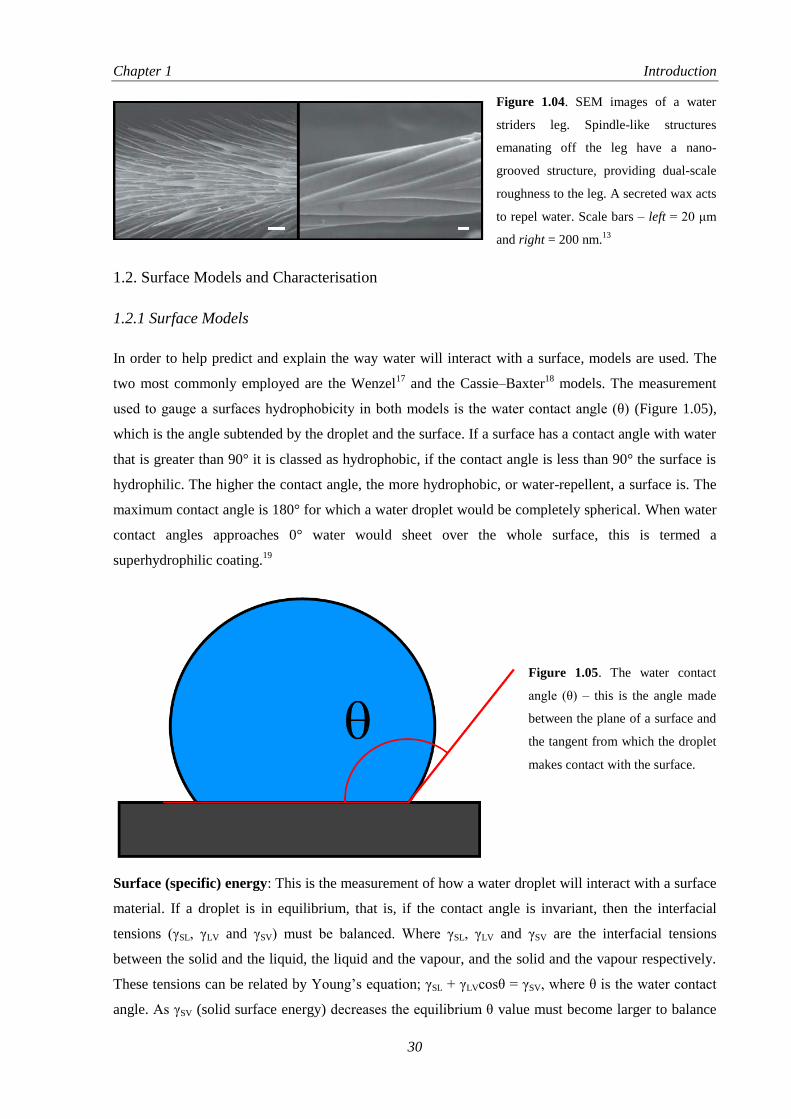
Figure 1.05 The water contact angle (θ) – this is the angle made between the plane of a surface
and the tangent from which the droplet makes contact with the surface.
30
Figure 1.06 Methods for measuring advancing (θA) and receding (θR) water contact angles. (a)
Shows a tilted surface, the water droplet on-top is at the point where it will begin to
move across the surface. (b) Volume can also be added (θA) or taken away (θR) from a
droplet at rest on a horizontal surface, the point where the droplet’s diameter at the
point of contact changes provides the advancing/receding water contact angle.
31
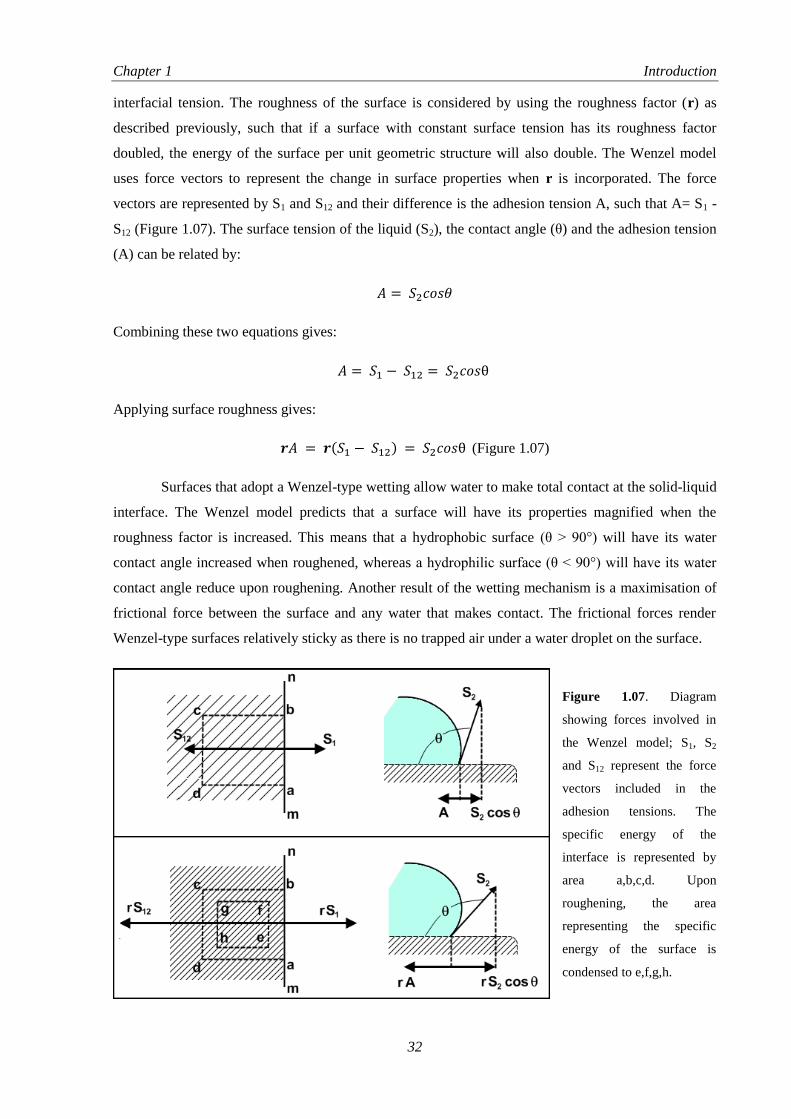
Figure 1.07 Diagram showing forces involved in the Wenzel model; S1, S2 and S12 represent the
force vectors included in the adhesion tensions. The specific energy of the interface is
represented by area a,b,c,d. Upon roughening, the area representing the specific
energy of the surface is condensed to e,f,g,h.
32
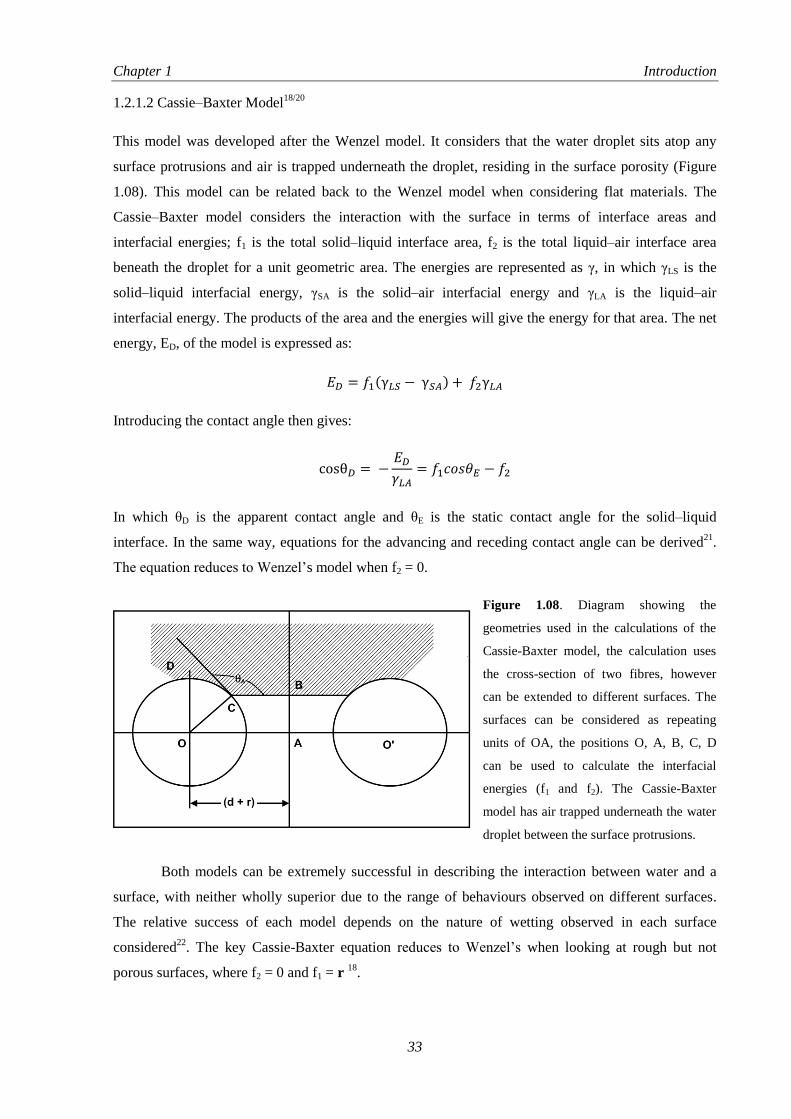
Figure 1.08 Diagram showing the geometries used in the calculations of the Cassie-Baxter model,
the calculation uses the cross-section of two fibres, however can be extended to
different surfaces. The surfaces can be considered as repeating units of OA, the
positions O, A, B, C, D can be used to calculate the interfacial energies (f1 and f2).
The Cassie-Baxter model has air trapped underneath the water droplet between the
surface protrusions.
33
Figure 1.09 Diagram of Wenzel and simplified Cassie-Baxter approaches with key equations, in
which θDC/W
is the apparent contact angle assuming each theory, θe is the equilibrium
contact angle on a flat surface, r is the roughness factor and Φs is the fraction of
solid–liquid contact of the total water surface interface (where 1 - Φs = fraction of
liquid-air contact).
34

List of Figures and Tables
15
Figure 1.10 Diagram showing a Cassie–Baxter/Wenzel intermediate state with the key equation,
in which θDcw
is the apparent contact angle, θe is the equilibrium contact angle on the
flat surface and Φscw
is the fraction of solid-liquid contact in the total projected
surface-water interface plane. The protrusions of the surface only partially penetrate
the water droplet. The equation combines the approaches of each surface model.
35
Figure 1.11 Water contact angle measurement disparities – Duplicated images of a 5 μL water
droplet on a superhydrophobic surface analysed by using a) ellipse fitting; b) circle
fitting; c) tangent searching and d) Laplace–Young Fitting. The result shows that the
same water droplet can give a range of results depending on the method of analysis.
The overlaid lines show horizontal baselines or shape simulation lines used to
calculate the water contact angle.
37
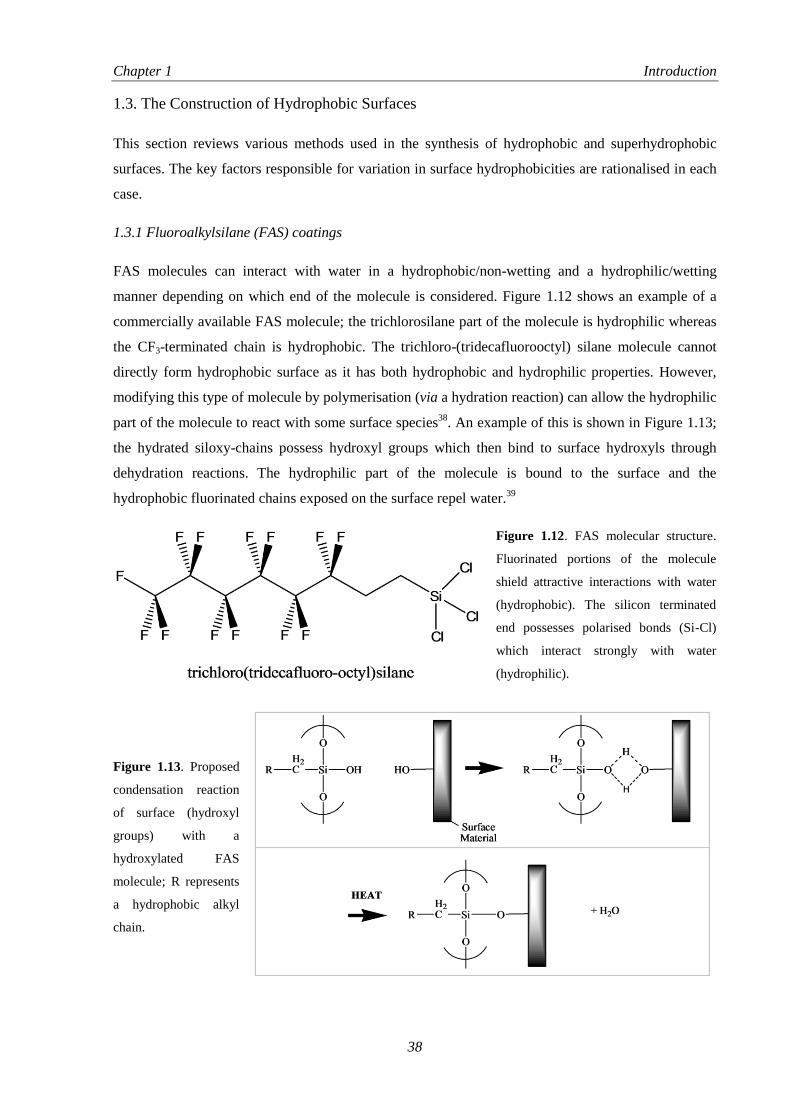
Figure 1.12 FAS molecular structure. Fluorinated portions of the molecule shield attractive
interactions with water (hydrophobic). The silicon terminated end possesses polarised
bonds (Si-Cl) which interact strongly with water (hydrophilic).
38
Figure 1.13 Proposed condensation reaction of surface (hydroxyl groups) with a hydroxylated
FAS molecule; R represents a hydrophobic alkyl chain.
38
Figure 1.14 SEM image of a spiked FAS surface designed to maximise the attainable contact
angle. The surface protrusions allow for less water-surface contact, using the Cassie-
Baxter wetting model a water contact angle of 167° is expected, this is achieved by
the surface.
39
Figure 1.15 SEM image of a surface made from an FAS / acrylic polymer blend; the surface
microstructure allows for air to be trapped underneath any water on the surface
maximising surface hydrophobicity for large water contact angles.
39
Figure 1.16 Basic chemical structure of a PTFE chain. The polymer molecules are very
hydrophobic as they do not interact with water due to no substantial access to the
polarised C-F bonds.
40
Figure 1.17 Schematic for construction of microporous PTFE surfaces. Surface microstructure
was altered by changing the size of silica opals and sintering temperature.
41
Figure 1.18 The chemical structure of an AKD molecule, R is a long alkyl chain approximately
sixteen carbon atoms long. The alkyl chains will repel water due to their non-polar
nature, whereas the polarised C=O bonds could potentially interact in a hydrophilic
manner.
41
Figure 1.19 The dimerisation of RCH2COCl reaction gives AKD after removal of HCl. AKDs
react with water forms dialkylketone (DAK) impurity after loss of carbon dioxide. R
= alkyl group - ((CH2)15CH3).
42
Figure 1.20 AKD surfaces at different magnifications (SEM images). Surfaces were left to
solidify for 3 days under an inert nitrogen atmosphere at room temperature.
42

List of Figures and Tables
16
Figure 1.21 The chemical structure of poly (alkylpyrrole), contains both water attracting (polar C-
N bonds) and repelling components (alkyl R groups). The high surface roughness
generated by this material magnifies the material’s net hydrophobicity giving the
constructed surface superhydrophobic properties.
43
Figure 1.22 The reaction of 1-n-octadecylpyrrole (alkylpyrrole) with sodium p-toluenesulfate,
carried out with an applied potential difference, to give the poly(alkylpyrrole);
R=(CH2)17CH3.
43
Figure 1.23 SEM image of the electrodeposited poly(alkylpyrrole) surface. The microstructure
both acts to magnify the material’s hydrophobicity in addition to trapping air
underneath any water lying on the surface. Inset: A view of a water droplet on the
superhydrophobic surface.
44
Figure 1.24 SEM images of an oxidised copper surface before the application of PDMS. The high
surface roughness of the uncoated hydrophilic surface gives water contact angles of
23°. When the surface is coated with PDMS water contact angles rise to 158°. Scale
bars are shown at each magnification.
45
Figure 1.25 Schematic showing the method for generating platinum nanowires on Ti/Si
substrates, the roughened surface was subsequently modified with a layer of FAS
((hepta-decafluoro-1,1,2,2,-tetrahydro-decyl)-1-trimethoxysilane) molecules to give
water contact angles up to 158°.
46
Figure 1.26 SEM image of the uniform coverage of Cu(OH)2 nanoneedles on the copper substrate
prior to modification with n-dodecanethiol. The nano-roughness combined with
microstructure of the copper mesh, and the low surface energy provided by the C-H
bonds of the thiol gave water contact angles of 151°.
47
Figure 1.27 Left: Experimental set-up of water–solvent mixture separation. The mixtures were
added at a rate of 1 drop per second onto the superhydrophobic copper mesh which
prevented water falling through the mesh and rolled into a separate vessel, whereas
the solvent permeated the mesh and fell through, not travelling down the tilted
surface. Right: A weighted miniature boat (dimensions: 4 x 2 x 1 cm) constructed
from superhydrophobic copper mesh, prevents water from passing through the pores
and thus the boat floats on water.
47
Figure 1.28 A ligand substitution reaction, the fluorinated chain increases the nanoparticles’
hydrophobicity.
48
Figure 1.29 Left: TEM images of carbon nanotubes with a) five, b) two and c) seven layers. Right:
diagram depicting the arrangement of carbon atoms in one type of carbon nanotube.
48
Figure 1.30 Left: Attachment of functionalised nitrenes to MWCNTs changes the wetting nature
of the surface. Right: An etched surface of vertically aligned nanotubes attached to
the tops of protrusions.
49
Figure 1.31 Left: Summary of the process used to generate the patterned surface and the growth of
the MWCNTs. Right: An SEM of the patterned, nanotube coated surface.
49

List of Figures and Tables
17
Figure 1.32 Schematic showing the functionalisation of silica surface hydroxyl groups. Treatment
of a flat silica substrate with these groups lowers the surface energy and renders the
surface hydrophobic.
50
Figure 1.33 SEM image showing a fumed silica film on glass obtained by spin-coating a solution
of 5 wt% trimethylsiloxane and silica nanoparticles, in methyl isobutyl ketone
solvent. The silica particles diameters are approximately 10 nm; the agglomeration of
these particles gives rise to the high surface roughness. The functionalisation with
surface trimethylsiloxane groups lowers the surfaces energy. Scale bar shows 200 nm.
51
Figure 1.34 Schematic for the preparation of a roughened silica surface. Microstructure is
generated by pyrolysis of a surface template material, this is followed by surface
functionalisation with TMS groups which lowers surface energy.
52
Figure 1.35 Lotus leaf imprinting: 1) A PDMS stamp is prepared by placing it on the surface of
the leaf; 2) the stamp is pressed onto the ink; 3) the stamp is peeled off and dried to
give an inverse Lotus leaf-type surface. Lower image shows chemical structure of the
ink (BP-AZ-CA) used for imprinting.
52
Figure 1.36 Schematic showing the soft lithography of silica spheres, once moulded to the surface
the sphere were functionalised with silver nanoparticles which were then treated with
perfluorodecanethiol, lowering surface energy.
53
Figure 1.37 Electro-spun polystyrene – Left: SEM image of the polystyrene fibres (THF/DMF
ratio of 1:3). Right: A surface profile cross section gained by atomic force microscopy
(AFM).
54
Figure 1.38 Schematic showing a general CVD mechanism – (1) vaporisation of precursors, (2)
transfer to substrate where reaction can take place on the surface (some pre-reaction
usually takes place at this step), (3) loss of gaseous molecules from reaction that are
then transferred to exhaust as waste, (4) physisorption of reaction products onto
substrate surface, (5) chemisorption of atoms in ideal surface environment and film
formation.
55
Figure 1.39 SEM of a superhydrophobic PTFE surface constructed by using pulsed PECVD. The
pulses of plasma were required for material to agglomerate during the deposition of
the film (scale bars = 1 μm).
56
Figure 1.40 Shows water droplets sitting on a tungsten–selenide film deposited via APCVD, tip
angles of 0° (left), 90° (centre) and even suspended upside down (right) could not
remove the water droplet. This clearly demonstrates the effect of Wenzel-type surface
wetting on the nature of interaction between water and a surface.
57
Figure 1.41 Schematic showing four main mechanisms (1a, 1b, 2a, 2b) for the construction of a
hydrophobic surface.
58
Figure 1.42 Soot-coated Formica plates. The side of the left plate is untreated and shows no
Lotus-effect self-cleaning and soot removal with action of water is inefficient. The
right side of the plate is coated with micropowdered PTFE giving the surface
superhydrophobic properties, from which soot is easily removed with water.
59

List of Figures and Tables
18
Figure 1.43 An SEM image of superhydrophobic cotton fabric coated with a fluoroalkyl siloxane.
The cotton fibres provide an inherent surface roughness, and coating the fabric with a
low energy material increases hydrophobicity.
60
Figure 1.44 Schematic showing the experimental setup to show a difference in flow though pipes.
The movement of water through superhydrophobic tubing is a lot faster relative to
unaltered tubing. This more rapid movement is due to a reduction in drag force
between the water and the walls of the superhydrophobic tubes.
61
Table 1.1 Calculated water contact angles (θ) for planar surfaces composed pure arrays of CF3,
CF2, CH3 and CH2 terminal groups. Calculations were made by considering surface
energies.
36
Chapter 2 - The Aerosol Assisted Chemical Vapour Deposition of Polymers
Figure 2.01 SEM image of silicone elastomer film deposited via CVD. 69
Figure 2.02 Schematic showing a representation of inter-chain bonding in thermosoftening and
thermosetting polymers. Thermosoftening polymer chains have weak attractions,
mainly electrostatic, which are lessened by high temperatures and so the polymers
melt upon heating. The covalently bonded chains in thermosetting polymers are not
readily broken, and excessive heating may cause decomposition.
71
Figure 2.03 (upper) Experimental set-up for the AACVD deposition of polymer films. (lower)
Photograph of CVD reactor, with glass slides inserted.
74
Figure 2.04 Component molecules of the Dyneon FC-2120 Co-polymer. Both the C-F and C-H
bonds act to lower the surface energy by their strong repulsion of water.
77
Figure 2.05 AFM image of a dip-coated film of Dyneon FC-2120 fluoroelastomer on glass, (a) 2D
and (b) 3D. Surface feature height confirmed as less than 40 nm by AFM
measurements. Scale bar is shown. Viewing area is 25 x 25 μm.
77
Figure 2.06 Raman spectrum from 3000 to 0 cm−1
of a Dyneon™ FC-2120 film deposited by
AACVD showing the expected C-F vibrations.
78
Figure 2.07 AFM image of Dyneon FC-2120 deposited by AACVD onto glass substrate carried
out at 300°C, (a) 2D and (b) 3D. Viewing area is 25 x 25 μm, scale bars are shown.
79
Figure 2.08 Chemical structure of the main component used in the silicone base portion of
Sylgard 184. Chain cross-linking is accomplished through a platinum based cure
system which links the unsaturated ends of the chains. Hydrophobic methyl side
chains repel water and lower the surface energy of the material.
79
Figure 2.09 Infra-red spectrum across a range of 3500 to 2500 cm−1
of Sylgard 184 deposited by
AACVD showing the expected C-H vibrations.
80
Figure 2.10 SEM image of a Sylgard 184 film deposited by deposited by AACVD onto glass
substrate at a 240°C substrate temperature. Scale bar shown.
81

List of Figures and Tables
19
Figure 2.11 SEM images of films deposited by AACVD using Sylgard 184 using a deposition
temperature of (A/BSide-on) 270°C, (C) 300°C and (D) 360°C, and NuSil Med-4850
deposited at (E/FSide-on) 420°C. The particle agglomeration increased with deposition
temperatures (A > B > C), with deformation of the spherical elastomer particles also
increasing (probably due to increased decomposition). The NuSil particles have a
smaller average diameter (~0.5 μm) in comparison to the Sylgard particles (~1 μm).
Side-on SEM images (B/F) show the porosity of the polymer thin films. The
thickness of the highest temperature depositions for Sylgard/NuSil are 3.2/1.5 μm
respectively.
82
Figure 2.12 Schematic representation of the deposition mechanism of thermosetting polymers via
AACVD.
83
Figure 2.13 Images showing 10 μL water droplets on Dyneon, Sylgard and NuSil surfaces (from
left to right) deposited via AACVD 330, 360 and 420°C respectively. Images chosen
represent average water contact angles on each surface (104°, 160° and 162°).
85
Figure 2.14 SEM image of a Sylgard 184 spray-coated glass surface. The substrate temperature
during coating was 300°C. Feature heights were confirmed as 2 – 3 µm high with the
surface achieving an average water contact angle of 102°.
86
Figure 2.15 SEM image of a Sylgard 184 surface deposited via AACVD onto a glass substrate
dip-coated with a layer of the same elastomer. Image shows agglomeration between
deposited material and the dip-coated under-layer. Deposition was carried out at
360°C. Scale bar inset.
89
Figure 2.16 Photograph showing a 3 μL water droplet in a Sylgard 184 surface deposited via
AACVD onto a glass substrate dip-coated with a layer of the same elastomer. The
elastomer coated substrate provides highly consistent water contact angle
measurement (average 169°).
89
Figure 2.17 UV-vis spectrum of Sylgard 184 film deposited via AACVD using an atomiser
aerosol generator, post-treated by incorporation of methylene blue dye. Absorption
observed at 630 nm relates to an absorption by the dye molecule embedded in the
polymer.
90
Figure 2.18 SEM image showing gold nanoparticles (50-100 nm diameter) deposited by AACVD
at 450°C, the nanoparticles are embedded in a Sylgard 184 polymer also deposited by
AACVD but at 360°C.
91
Figure 2.19 SEM images showing the atomiser assisted depositions of Sylgard 184 elastomer,
with precursor solutions of (top) 10 g in 400 mL chloroform, (middle) 20 g in 400 mL
chloroform and (bottom) 30 g in 400 mL chloroform. A substrate temperature of
360°C was used in all depositions. Scale bars inset.
93
Figure 2.20 Polymerisation reaction between melamine and formaldehyde under alkaline
conditions.
94

List of Figures and Tables
20
Figure 2.21 SEM images of melamine-formaldehyde resin films formed via; (left) spin-coating
and (right) evaporation of the pre-polymer material. Both films were heated at 250°C
for 1 hour for evaporation/curing. Scale bar shown is consistent for both images.
95
Figure 2.22 Raman spectrum of melamine-formaldehyde resin film deposited via AACVD at
250°C.
96
Figure 2.23 Top-down SEM image of melamine-formaldehyde resin, deposited using AACVD at
a reactor temperature of 250°C, showing a highly developed microstructure. Scale bar
shown.
97
Figure 2.24 Contact angle images used in the analysis of wetting properties on a film deposited
using AACVD at a deposition temperature of 250°C. Images show droplets on the
surface on a; (left) a region of the highest surface coverage (water contact angle =
133°), (right) a region of low surface coverage (water contact angle = 92°).
97
Figure 2.25 Side-on SEM images of melamine-formaldehyde resin, all deposited using AACVD
(deposition temperature 250°C). Showing; (Top) a region of low substrate coverage
(film thickness ~ 1.5 μm, average water contact angle ~ 80°), (Middle) a region of
medium substrate coverage (film thickness ~ 2–3 μm, average water contact angle
120–135°), (Bottom) a region of heavy substrate coverage (film thickness ~ 4 μm,
average water contact angle ~ 10°).
99
Figure 2.26 Schematic representation of a cross-section through; (a) a normal deposition with air
trapped between the surface protrusions and glass, and (b) a heavier deposition
showing more space for air to travel and so the air is not trapped beneath a water
droplet.
100
Table 2.1 Water contact angles (at least ten separate measurements) for Dyneon FC-2120,
Sylgard 184 and NuSil Med-4850 films deposited on glass substrates by AACVD. (*)
Indicates films with significant discolouration, (–) indicates films with decomposition
of the polymer. Temperatures indicated are those of the carbon block used while the
AACVD deposition was carried out. All films were deposited onto the top plate
which was measure to be ca 50°C lower. (±) Presents 95% confidence intervals using
Student’s t-test distributions)
84
Chapter 3 - The Hybrid CVD and Functionalisation of Silica Microparticles
Figure 3.01 SEM image of a silica microparticle surface deposited using CVD, with an image of a
water droplet on the surface subsequent to functionalisation.
103
Figure 3.02 The hydrolysis of a silica surface when left at room temperature in ambient
conditions, leads to the production of water attracting surface silanol groups. The
reverse transformation occurs upon heating.
104
Figure 3.03 Schematic of the hybrid CVD setup. 106
Figure 3.04 SEM image showing an area of low coverage of silica microparticles deposited via
hybrid CVD at a deposition temperature of 600°C for a period of 5 minutes. The
variation in particle size can be observed in this image. Scale bar shown.
108
List of Figures and Tables
21
Figure 3.05 SEM image of a silica microparticle film deposited via hybrid CVD, using a substrate
temperature of 550°C over a period of 30 min. The particles are of similar size to
those deposited over a shorter period. Scale bar shown.
109
Figure 3.06 (Top) Proposed hybrid CVD deposition mechanism for the formation of silica
microparticles – (1) Initial mixing of TEOS and aerosol, (2) TEOS interacts with the
acidic aerosol forming aqueous silica precursors, (3) As the aerosol enters the CVD
reactor, evaporation of water takes place resulting in solidifying silica particles, (4)
The solidifying particles make contact with the substrate were they are then
deposited. (Bottom) Side-on SEM image of a silica microparticle film deposited via
hybrid CVD, using a substrate temperature of 550°C over 30 min. Scale bar shown.
110
Figure 3.07 Image of a 3 μL droplet on a silica microparticle film deposited via hybrid CVD,
using a substrate temperature of 550°C. The high roughness of the microparticle
surface magnifies the intrinsic hydrophilicity of the silica material deposited resulting
in a water contact angle around 4°.
111
Figure 3.08 Scheme shows surface functionalisation of silanol groups, exchanging for low energy
TMS groups. The reaction was carried out in toluene solvent, the conditions are also
shown.
111
Figure 3.09 Photograph showing a 5 μL droplet of water on the modified silica microparticle film,
deposited by hybrid CVD at a substrate temperature of 550°C. The water droplets
would roll on the surface, even at very low tilt angles.
112
Table 3.1 Properties of films deposited at different temperatures using the hybrid CVD of
TEOS and an acidic aerosol, over a 30 minute deposition time. (±) Presents 95%
confidence intervals using Student’s t-test distributions)
113
Chapter 4 - The Aerosol Assisted Chemical Vapour Deposition and Functionalisation
of Copper (0) and Copper (I) Oxide Thin Films
Figure 4.01 Scheme showing the deposition of copper onto a glass substrate and subsequent
functionalisation, with resultant water contact angles also shown.
116
Figure 4.02 Photograph showing films deposited using [Cu(NO3)2.3H2O] in methanol at a
deposition temperature of 350°C (left) and 450°C (right). Scale bar shown.
120
Figure 4.03 SEM images of films deposited via AACVD of [Cu(NO3)2.3H2O] in methanol using
substrate temperatures; (A) 300°C, (B) 350°C, (C) 400°C, (D) 450°C and (E) 500°C.
121
Figure 4.04 XRD of films deposited via the AACVD of [Cu(NO3)2.3H2O] in methanol at the
associated substrate temperatures. Peaks positions relating to Cu and Cu2O are
marked.
122
Figure 4.05 XRD of films deposited via the AACVD of [Cu(NO3)2.3H2O] using a 350°C
substrate temperatures, (lower) in ethanol with nitrogen (middle), in methanol with
nitrogen and (upper) in methanol with no nitrogen gas flowing through the reactor
during cooling of the substrates.
123

List of Figures and Tables
22
Figure 4.06 SEM image of Cu(OH)2 nano-crystals formed by immersing copper metal surfaces in
NaOH/K2S2O8 solution for 20 mins – (left) copper deposited by AACVD and (right)
copper plate. Scale bars inset.
125
Figure 4.07 Water droplets (3μL) on copper deposited by AACVD, Cu(OH)2 nano-crystals
formed by oxidising copper and thiol-functionalised Cu(OH)2 nano-crystal films.
125
Figure 4.08 Schematic showing the deposition and functionalisation steps of copper coating. (i)
AACVD of [Cu(NO3)2.3H2O] using a substrate temperature of 350°C, (ii) Oxidation
of copper with potassium persulfate and sulphuric acid solution and (iii)
functionalisation of surface using a toluene solution of perfluorodecanethiol.
126
Chapter 5 - Bacterial Adhesion to Superhydrophobic Polymer Surfaces
Figure 5.01 Schematic showing the interaction of a bacterial suspension and a superhydrophobic
surface.
129
Figure 5.02 Schematic showing the action of an anti-microbial surface on bacteria. The repeated
killing of bacteria leads to a coating of dead bacteria ideal for the growth of bacterial
colonies.
130
Figure 5.03 Schematic of the AACVD apparatus, shown is the position of the polymer coated
microscope slides. The edge of the first slide is positioned 35 mm away from the
reactor inlet, in the middle of the top plate.
132
Figure 5.04 Schematic showing the film deposition process of microscope slide portions. The
AACVD slide was removed from the top plate prior to microbiological testing.
133
Figure 5.05 SEM images of a Sylgard 184 film deposited using AACVD using a deposition
temperature of 360°C onto glass microscope slide substrates pre-treated with a dip-
coated layer of the same elastomer, (left) from above (right) side-on. Partial
integration of features deposited during AACVD into the elastomer coated substrate
can be seen. Scale bar shown.
135
Figure 5.06 Photograph showing a 10 μL water droplet on microscope slide coated with Sylgard
184 via dip-coating then AACVD.
136
Figure 5.07 Adherence of E. coli and S. Aureus to uncoated, dip-coated and AACVD coated glass
surfaces measured by fluorescence live/dead staining assay. Bars represent the mean
adherent E. coli/S. Aureus and standard error of the mean per microscope field of
view. Results are from 2 experiments performed in duplicate.
137
Figure 5.08 Fluorescence microscopy of S. Aureus attached to glass surfaces. Images are of a
section of a microscope field of view showing live (green) and dead (red) S. Aureus
cells attached to (A) uncoated glass, (B) dip-coated glass and (C) AACVD coated
glass after 1 h exposure to identically populated bacterial suspensions. Bar represents
10 μm. Images are from a representative experiment.
138
Figure 5.09 Schematic showing an aqueous bacterial suspension lying on the superhydrophobic
Sylgard 184 surfaces deposited via AACVD, bacteria suspended in the water are only
able to attach to surface protrusions.
139

List of Figures and Tables
23
Chapter 6 - Dynamic Study of the Interaction of Water with a Surface
Figure 6.01 A water droplet rebounding from impact with a superhydrophobic surface. 144
Figure 6.02 Schematic showing the dispensing of a water droplet on a superhydrophobic surface
(A), with the edges of the droplet deforming the water droplet and increasing the
apparent water contact angle (B > C). The extent of droplet bowing increases with the
volume of the droplet.
145
Figure 6.03 Schematic showing the removal of water from Cassie-Baxter surfaces with differing
microstructure types - [1] Rounded and [2] Sharpened edges. Different stages of
detachment are shown – (i) Partial - Droplet is more effectively held by pinning to
surface type [2] and (ii) Full – Droplets that were pinned leave behind traces of water
on the surface making the surface stickier on subsequent bounces.
146
Figure 6.04 Schematic showing the water bounce experimental set-up. The variable of the
experiments are (A) Drop height – this determines the velocity of droplet impact, (B)
Dispensing tip – this determines the droplet volume and (C) Substrate – this dictates
the nature of the water-surface interaction. The optimum set-up was (A) 20 mm and
(B) 27 Gauge (internal diameter – 0.203 mm) with a level substrate (C).
149
Figure 6.05 Series of photographs of an 8 μL water droplet dropped from a height of 20 mm (tip
to surface) and bouncing on substrates with a range of water contact angles. The
droplets velocity at point of impact was 0.34 m/s. Water droplets were coloured with
methylene blue to aid visualisation; this did not alter the bouncing behaviour on the
surface.
151
Figure 6.06 Plot showing number of bounces of a water droplet dropped from a 27 gauge
dispensing tip from a height of 20 mm (tip to surface). Surfaces chosen demonstrated
a range of hydrophobicities and all possessed rounded or flat microstructures. Spot
testing measurements were carried out on silicone elastomer surfaces deposited via
AACVD. Water bouncing only occurred on surfaces with water contact angle over
151°.
152
Figure 6.07 SEM images of superhydrophobic surfaces - Rounded (A) Sylgard 184 elastomer
agglomerations, θ = 165° / B = 7 and (B) functionalised silica microparticles, θ =
175° / B = 12, in addition to sharp-edged (C) sandpaper roughened PTFE, θ = 158° /
B = 2, and (D) thiol-functionalised copper hydroxide nano-needles, θ = 172° / B = 12.
Scale bars inset.
153
Figure 6.08 Schematic showing a water droplet (~15 μL) moving down a tilted superhydrophobic
functionalised silica surface deposited via Hybrid CVD. The rolling motion of the
droplet can be seen by tracking the movement of plastic particles suspended within
the droplet – the same particle is circled in each image.
154

List of Figures and Tables
24
Chapter 7 - Separation of Oil-Water Mixtures
Figure 7.01 Mixed droplet of oil-water impacting a superhydrophobic mesh, the mesh strongly
attracts oils. The arrow show the movement of oil onto the mesh, while retaining the
ball of water sitting on top.
157
Figure 7.02 Schematic showing the interaction of water and oil with hydrophobic/oleophilic
surfaces upon roughening.
158
Figure 7.03 SEM image showing copper gauze (as received). Wire diameter is 190 μm and pore
dimensions of 251 μm.
159
Figure 7.04 AACVD reactor containing the copper mesh during the elastomer deposition. 160
Figure 7.05 Schematic showing the tilted flow separation set-up. The pipette is 20 mm above the
copper mesh and 20 mm to the right of the mesh edge. The tilted copper mesh is
curved to allow directed flow down the gradient, and is secured at its edges by clamp
and clamp stand.
161
Figure 7.06 Schematic showing the horizontal dual-layer separation set-up. The pipette is 20 mm
above the copper mesh.
162
Figure 7.07 SEM image of copper mesh (pore dimension 251 μm) coated with Sylgard 184 using
AACVD at a 360°C deposition temperature. The surface microstructure is similar to
that deposited onto flat substrates (Chapter 2), however additional surface roughness
is afforded by the structure of the mesh.
163
Figure 7.08 Image showing 3 mL water droplets on copper mesh with 251 μm pores – (A)
untreated, θ = 135° and (B) coated with Sylgard 184 via AACVD, θ = 168°.
164
Table 7.1 Water contact angle/tilt angle data for coated and uncoated copper meshes. 164
Table 7.2 Separation efficiencies of tilted flow set-up. Toluene impurity states the amount
toluene recovered from the water receptor.
165
Table 7.3 Separation efficiencies of horizontal dual-layered set-up. Toluene impurity states the
amount toluene recovered from the water receptor.
166
Chapter 8 - Conclusions
Figure 8.01 Photograph showing water droplets sitting on a superhydrophobic Lotus leaf. 168

List of Abbreviations
25
List of Abbreviations
AACVD Aerosol Assisted Chemical Vapour Deposition
AAO Anodic Aluminium Oxide
AFM Atomic Force Microscopy
AKD Alkyl Ketene Dimer
APCVD Atmospheric Pressure Chemical Vapour Deposition
b.p. Boiling Point
BHI Brain Heart Infusion
CNT Carbon Nanotube
CVD Chemical Vapour Deposition
DAK Dialkylketone
DMF Dimethylformamide
E. coli Escherichia coli
EDX Energy Dispersive X-ray
FAS Fluoroalkylsilane
HMDS Hexamethyldisilazane
IR Infra-Red
MIBK Methyl Isobutyl Ketone
MWCNT Multi-walled Carbon Nanotube
PBS Phosphate Buffered Saline
PDMS Polydimethylsiloxane
PECVD Plasma Enhanced Chemical Vapour Deposition
PPG Polypropylene Glycol
PTFE Polytetrafluoroethylene
r Roughness Factor
S. aureus Staphylococcus aureus
SEM Scanning Electron Microscopy
SPR Surface Plasmon Resonance
TEOS Tetraethyl Orthosilicate
THF Tetrahydrofuran

List of Abbreviations
26
TMS Trimethylsiloxane
TOAB Tetraoctylammonium Bromide
UV/VIS Ultra-Violet/Visible Light
XRD X-ray Diffraction
θ Water Contact Angle
θA Advancing Water Contact Angle
θD Apparent Water Contact Angle
θR Receding Water Contact Angle
θt Water Tilt Angle
Φs Fraction of Solid-liquid Contact

Chapter 1 Introduction
27
Chapter 1
Introduction
Figure 1.01. A superhydrophobic disk prevents wetting of the surface, a water droplet is placed static in the
centre.1

Chapter 1 Introduction
28
1. Introduction
The interaction of water with matter has been the subject of fascination for mankind throughout the
ages – from falling rain drops to the flow of rivers and streams. The manner with which water can
interact with the extensive array of surfaces in existence is broad and varied2/3
. The surface
characteristics which dictate the mode of contact with water stem from surface composition and
structure4. This is addressed in the introduction, with examples from the natural world considered in
addition to a quantitative characterisation of surfaces. The design and construction of water repellent
(hydrophobic) surfaces is an area of huge diversity and innovation5. This wide range of surface types
will be explored. Chemical vapour deposition (CVD) as the main technique for surface fabrication
during this project will be briefly discussed, and its role in hydrophobic surface generation
summarised. The fundamental routes toward hydrophobic surfaces are then identified, and the
introduction is concluded by investigating their commercial implementation.
The CVD of hydrophobic surfaces is fundamentally challenging. This owes to the requirement
for a highly roughened microstructure and the tendency for CVD to provide flat uniform coatings.
This work addresses methods in overcoming inherent complications and explores novel routes in
doing so. Exploration of superhydrophobic functional properties is also reported, from bacteria
adhesion to Lotus effect self-cleaning.
1.1. The Lotus Effect
A water droplet can interact with a surface in a variety of ways. The nature of the contact is related to
the energy of water’s interaction with the surface. It ranges from superhydrophilic6, in which the water
can fully wet a surface to form a flat puddle due to a strong water–surface interaction, through to
superhydrophobic, in which water is effectively repelled from the surface to form a near-spherical
droplet7 and in which there is a weak water–surface interaction.
Superhydrophobic surfaces are observed in nature, the Lotus effect (named after the Lotus
plant, Nelumbo nucifera), describes the self-cleaning action of some leaf surfaces. If the leaf shows
high enough hydrophobicity, water will form near-spherical droplets that roll across the surface
instead of sliding (Figure 1.02). The droplets rolling action facilitates foreign bodies to be picked up,
with rougher surfaces tending to have a greater self-cleaning action.8 The Lotus leaf is a surface that
demonstrates this mechanism – the leaves themselves have a waxy surface coating which acts to repel
water, surface protrusions make the waxy surface highly rough9 (Figure 1.03). Both of these surface
features combine and allow water droplets to roll10
. The surface features possess rough, nanoscale,
hair-like structures (Figure 1.03) which act to trap air underneath the water droplets, further enabling
the rolling motion4. Those leaves which possess waxy coatings but do not have a highly rough
microstructure are less efficient at self-cleaning6. Plants both with waxy coatings and rough surfaces

Chapter 1 Introduction
29
have far superior self-cleaning properties than those with comparable smooth waxy surfaces.
Hierarchical micro- and nanoscale roughness has been shown to significantly contribute to Lotus
effect self-cleaning in hydrophobic surfaces via enabling the rolling mechanism11
.
Figure 1.02. Diagram showing
the interaction of water droplets
with (a) hydrophobic and (b)
superhydrophobic surfaces.
“Lotus effect” self-cleaning on
superhydrophobic surfaces
allows for dirt and bacteria to be
carried away from the under
action of water.
Figure 1.03. Scanning electron
microscope (SEM) image of
Nelumbo nucifera (Lotus) leaf
exhibiting a highly rough surface
microstructure, with additional
smaller scale roughness on the
protrusions. Scale bar shows 50
μm.12
Extreme hydrophobicity in nature also includes water strider legs (Figure 1.04), these have a
highly defined microstructure and are coated by a layer of secreted wax13
. The wings of some insects
also show hydrophobic properties, brought about by surface microstructure and composition14
. These
include some butterfly wings, which have been observed to employ a network of microstructured
scales on the wings surface, this directs rolling of water away from the body of the butterfly keeping it
dry15
. These surface characteristics, in addition to other examples in nature, have provided inspiration
for the design of artificial hydrophobic surface. One of the most directly related fabrications of a
hydrophobic surface is the direct casting of a Lotus leaf surface by imprinting with polymers16
.
Chapter 1 Introduction
30
Figure 1.04. SEM images of a water
striders leg. Spindle-like structures
emanating off the leg have a nano-
grooved structure, providing dual-scale
roughness to the leg. A secreted wax acts
to repel water. Scale bars – left = 20 μm
and right = 200 nm.13
1.2. Surface Models and Characterisation
1.2.1 Surface Models
In order to help predict and explain the way water will interact with a surface, models are used. The
two most commonly employed are the Wenzel17
and the Cassie–Baxter18
models. The measurement
used to gauge a surfaces hydrophobicity in both models is the water contact angle (θ) (Figure 1.05),
which is the angle subtended by the droplet and the surface. If a surface has a contact angle with water
that is greater than 90° it is classed as hydrophobic, if the contact angle is less than 90° the surface is
hydrophilic. The higher the contact angle, the more hydrophobic, or water-repellent, a surface is. The
maximum contact angle is 180° for which a water droplet would be completely spherical. When water
contact angles approaches 0° water would sheet over the whole surface, this is termed a
superhydrophilic coating.19
Figure 1.05. The water contact
angle (θ) – this is the angle made
between the plane of a surface and
the tangent from which the droplet
makes contact with the surface.
Surface (specific) energy: This is the measurement of how a water droplet will interact with a surface
material. If a droplet is in equilibrium, that is, if the contact angle is invariant, then the interfacial
tensions (γSL, γLV and γSV) must be balanced. Where γSL, γLV and γSV are the interfacial tensions
between the solid and the liquid, the liquid and the vapour, and the solid and the vapour respectively.
These tensions can be related by Young’s equation; γSL + γLVcosθ = γSV, where θ is the water contact
angle. As γSV (solid surface energy) decreases the equilibrium θ value must become larger to balance

Chapter 1 Introduction
31
the interfacial tensions. This change in water contact angle indicates an increase in the hydrophobicity
of the surface, which relates directly to the surface energy.17
Surface roughness: The roughness of a surface can be defined by looking at the difference between
the actual surface area, including peaks and valleys of surface morphology, and the planar or
geometric area. The latter is the area of contact the water droplet makes with the surface assuming a
totally smooth surface, whereas the actual surface area takes into account the protrusions. Both of
these surfaces are used to calculate the roughness factor:
The roughness factor is incorporated directly into the Wenzel model17
, whereas the Cassie–Baxter
model uses a related measurement. The two models are comparable as they contain similar features
and deal with the same type of interactions, there are however some fundamental differences.17
Advancing (θA) and receding (θR) water contact angles are used by the Cassie–Baxter model.
These measurements describe the dynamic wetting of the surface and are related to the angle of tilt
required to move a static water droplet. They can be observed in experiments that use tilted surfaces.
An alternate method derives the angles from altering the volume of a water droplet as it rests on a
horizontal surface. The receding contact angle is measured by removing some of the water from the
droplet and noting the water contact angle at the point where the area of water-surface contact begins
to decrease. Advancing contact angles can also be measured by adding to the droplet’s volume and
noting the water contact angle when the area of contact starts to increase (Figure 1.06).4
Figure 1.06. Methods for measuring advancing (θA) and receding (θR) water contact angles. (a) Shows a tilted
surface, the water droplet on-top is at the point where it will begin to move across the surface. (b) Volume can
also be added (θA) or taken away (θR) from a droplet at rest on a horizontal surface, the point where the droplet’s
diameter at the point of contact changes provides the advancing/receding water contact angle.
1.2.1.1 Wenzel Model17
The major premise of this model is that the water makes full contact with the surface, with no air
trapped underneath a droplet. This model uses the surface tension of the solid and the water–solid
Chapter 1 Introduction
32
interfacial tension. The roughness of the surface is considered by using the roughness factor (r) as
described previously, such that if a surface with constant surface tension has its roughness factor
doubled, the energy of the surface per unit geometric structure will also double. The Wenzel model
uses force vectors to represent the change in surface properties when r is incorporated. The force
vectors are represented by S1 and S12 and their difference is the adhesion tension A, such that A= S1 -
S12 (Figure 1.07). The surface tension of the liquid (S2), the contact angle (θ) and the adhesion tension
(A) can be related by:
Combining these two equations gives:
Applying surface roughness gives:
( ) (Figure 1.07)
Surfaces that adopt a Wenzel-type wetting allow water to make total contact at the solid-liquid
interface. The Wenzel model predicts that a surface will have its properties magnified when the
roughness factor is increased. This means that a hydrophobic surface (θ > 90°) will have its water
contact angle increased when roughened, whereas a hydrophilic surface (θ < 90°) will have its water
contact angle reduce upon roughening. Another result of the wetting mechanism is a maximisation of
frictional force between the surface and any water that makes contact. The frictional forces render
Wenzel-type surfaces relatively sticky as there is no trapped air under a water droplet on the surface.
Figure 1.07. Diagram
showing forces involved in
the Wenzel model; S1, S2
and S12 represent the force
vectors included in the
adhesion tensions. The
specific energy of the
interface is represented by
area a,b,c,d. Upon
roughening, the area
representing the specific
energy of the surface is
condensed to e,f,g,h.
Chapter 1 Introduction
33
1.2.1.2 Cassie–Baxter Model18/20
This model was developed after the Wenzel model. It considers that the water droplet sits atop any
surface protrusions and air is trapped underneath the droplet, residing in the surface porosity (Figure
1.08). This model can be related back to the Wenzel model when considering flat materials. The
Cassie–Baxter model considers the interaction with the surface in terms of interface areas and
interfacial energies; f1 is the total solid–liquid interface area, f2 is the total liquid–air interface area
beneath the droplet for a unit geometric area. The energies are represented as γ, in which γLS is the
solid–liquid interfacial energy, γSA is the solid–air interfacial energy and γLA is the liquid–air
interfacial energy. The products of the area and the energies will give the energy for that area. The net
energy, ED, of the model is expressed as:
( )
Introducing the contact angle then gives:
In which θD is the apparent contact angle and θE is the static contact angle for the solid–liquid
interface. In the same way, equations for the advancing and receding contact angle can be derived21
.
The equation reduces to Wenzel’s model when f2 = 0.
Figure 1.08. Diagram showing the
geometries used in the calculations of the
Cassie-Baxter model, the calculation uses
the cross-section of two fibres, however
can be extended to different surfaces. The
surfaces can be considered as repeating
units of OA, the positions O, A, B, C, D
can be used to calculate the interfacial
energies (f1 and f2). The Cassie-Baxter
model has air trapped underneath the water
droplet between the surface protrusions.
Both models can be extremely successful in describing the interaction between water and a
surface, with neither wholly superior due to the range of behaviours observed on different surfaces.
The relative success of each model depends on the nature of wetting observed in each surface
considered22
. The key Cassie-Baxter equation reduces to Wenzel’s when looking at rough but not
porous surfaces, where f2 = 0 and f1 = r 18
.

Chapter 1 Introduction
34
The Cassie-Baxter equation can be simplified further23
. This is done by considering the area of
contact at the liquid-surface interface as flat, with water only wetting the very tops of any surface
protrusions. In making this assumption, the total areas of contact f1 + f2 = 1. These areas can now be
regarded as fractions of the total planar contact between water and the surface, where f1 = Φs and f2 =
1 - Φs. Φs is termed the fraction of solid-liquid contact. The simplified Cassie-Baxter equation then
appears as; cosθD = ΦscosθE + Φs – 1 (Figure 1.09).23
Figure 1.09. Diagram of Wenzel and simplified Cassie-Baxter approaches with key equations, in which θDC/W
is
the apparent contact angle assuming each theory, θe is the equilibrium contact angle on a flat surface, r is the
roughness factor and Φs is the fraction of solid–liquid contact of the total water surface interface (where 1 - Φs =
fraction of liquid-air contact).
The movement of water across a surface is also affected by the wetting nature of the surface.
A Wenzel-type wetting mechanism means that there is complete contact between the surface and
water droplet at any point of coverage (Figure 1.09), with no air trapped underneath. The greater area
of contact between water and surface renders water movement across the surface relatively hard. A
Cassie–Baxter surface, not only has a lesser water-surface contact but air is trapped underneath the
water, which makes the surface “slippery” (with respect to water). A Wenzel-type surface is “sticky” a
water droplet has a low probability rolling across the surface; Lotus-type self-cleaning is thus less
likely on this type of surface. Cassie-Baxter surfaces can allow water droplets to move across them
easily, with a rolling action more likely to be observed; it is thus this type of surface that is required
for Lotus effect self-cleaning.4
1.2.1.3 Intermediate States
The Wenzel model is aimed at surfaces at which the water droplet makes contact with all parts of the
surface (Figure 1.09), whereas the simplified Cassie–Baxter model uses a fraction of contact between
the droplet and the surface, with flat points of contact. However, a pure form of either model may not

Chapter 1 Introduction
35
be the case for some surfaces, that is, those that have no flat area of contact with the water droplet
(Figure 1.10). If both Wenzel and simplified Cassie-Baxter models are combined, then both the
roughness factor (r) and the fraction of solid–liquid contact area can be used in an equation to describe
such surfaces (Figure 1.10).24
This approach can also be applied using the full Cassie-Baxter model.18
Figure 1.10. Diagram showing a Cassie–
Baxter/Wenzel intermediate state with the key
equation, in which θDcw
is the apparent contact
angle, θe is the equilibrium contact angle on
the flat surface and Φscw
is the fraction of
solid-liquid contact above the total projected
surface-water interface plane. The protrusions
of the surface only partially penetrate the
water droplet. The equation combines the
approaches of each surface model.24
The transition between the two wetting states is a subject of much study, small changes in the
dimensions of surface features (i.e. protrusion height, size and separation) provide large differences in
water contact angle, but this can also affect the ‘stickiness’ of a surface25/26
. The air trapped under the
water drops in the Cassie–Baxter mechanism not only renders the surface slippery but greatly
increases water contact angle. Air trapped by the surface remains under the droplets as the penetration
of water into the surface porosity is energetically disfavoured. This is either because the water is
repelled by the surface material and/or because the air cannot easily flow through the surface
microstructure if displaced (i.e., the surface microstructure is not sinusoidal). The introduction of
surface microstructure with a particular arrangement of features can render hydrophilic materials (i.e.
θ < 90° with flat surface) hydrophobic. Air trapped under the droplet is maintained by non-sinusoidal
surface structure, this air acts to improve the surfaces resultant hydrophobicity27
. Designing surfaces
with these principles in mind can produce interesting results; a directional roughness (e.g., stripes
across a surface in one direction) can allow preferential movement (sliding) of water in the direction of
the stripes, with water droplet rolling preferred when travelling perpendicular to the stripes. Surfaces
demonstrating this property have also been constructed to repel alkanes in a similar way using hexane
droplets on a textured surface. Large difference in contact angles were observed depending on the
orientation droplet upon measurement.28
The evaporation of water on a surface can give an indication of the type of wetting mechanism
that occurs29
. Surfaces that are wetted in a Wenzel fashion are sticky in nature, so when the droplet
reduces in volume through evaporation the area of contact remains the same but the contact angle is
reduced. On slippery Cassie–Baxter surfaces, the area of contact decreases as the droplet reduces in
volume and in consequence the contact angle remains unchanged until a very low droplet volume is

Chapter 1 Introduction
36
reached (an alternate method for accessing the receding water contact angle). The transition from
Cassie–Baxter wetting to Wenzel wetting can be achieved by addition of agents to the surface.30
1.2.2 Superhydrophobicity
A superhydrophobic surface is usually classified as one that repels water to such an extent that the
water contact angles exceed 150°,31
but it has also been less commonly adopted as 140°.32
Superhydrophobic surfaces are formed by successful combination of low surface energy and high
surface roughness. The highest water contact angle achieved on smooth low-energy surfaces are
around 110° to 120°. Alkyl and fluorinated alkyl groups (in addition to others21/33
) have very low
energies of interaction with water and can be used to construct superhydrophobic surfaces as a strong
repulsion to water results in a large water contact angle34
. Table 1.1 shows the relative
hydrophobicities of such surfaces for purely flat surfaces; if surface roughness is introduced these
composition types can exhibit superhydrophobic properties dependant on magnitude of roughening.
The angle of tilt, from the horizontal, required to move a water droplet may also be considered when
categorising a surface as superhydrophobic. This tilt angle is typically less than 10° and also suggests
the surface undergoes Lotus effect self-cleaning effect.35
Surface Terminal Group θ (°)
CH2 94
CH3 111
CF2 108
CF3 120
Table 1.1. Calculated water contact angles (θ) for planar surfaces composed pure arrays of CF3, CF2, CH3 and
CH2 terminal groups. Calculations were made by considering surface energies.34
The water contact angle is the most commonly observed property used to gauge the
hydrophobicity of a surface. It is however known that the method of measurement used, the water
contact angle may appear to differ2. It has been shown that Young’s law holds when a water droplet is
affected by gravity, and so deformation of water droplets due to gravity will not affect this
relationship36
. However if the analysis method does not follow Young’s calculations (e.g. spherical
fitting by analysis of droplet radius), or the water contact angle is manually assigned then an effect of
droplet size may be observed. The method of water droplet analysis also strongly determines the
‘observed’ contact angle. In one reported case, analysis of an image showing the same 5 μL droplet
gave water contact angles varying from 152° to over 179° (Figure 1.11)2. The highest water contact
angle stems from Laplace-Youngs fitting; this is substantially different from the other calculations as
the main component used is the radius of the droplet and this can be subject to greater error. Given this

Chapter 1 Introduction
37
result, it can be said that only droplets measured using the same analysis system and droplet volume
can be directly compared, if either droplet volume and/or analysis techniques varies then a direct
comparison between two different surfaces cannot be made with any conviction. These factors must be
considered when comparing results from a range of sources, as differences in reported water contact
angle may not be due to a variation in surface hydrophobicity, but may be due to the methods
implemented to collect the results. Many articles state which apparatus was used to measure the water
contact angles but fewer state the computational method used to analyse the droplets. Further
complications can also influence the proposed success of a hydrophobic surface measurement, when
stating the average37
or maximum contact angle values is not made clear, with the variation of the
results often not provided. The water contact angle values stated in this thesis introduction suffer from
the inconsistencies mentioned above, and so must be considered when any comparison is made.
Figure 1.11. Water contact angle measurement disparities – Duplicated images of a 5 μL water droplet on a
superhydrophobic surface analysed by using a) ellipse fitting; b) circle fitting; c) tangent searching and d)
Laplace–Young fitting (uses radius of the droplet). The result shows that the same water droplet can give a range
of results depending on the method of analysis. The overlaid lines show horizontal baselines or shape simulation
lines used to calculate the water contact angle.2
Chapter 1 Introduction
38
1.3. The Construction of Hydrophobic Surfaces
This section reviews various methods used in the synthesis of hydrophobic and superhydrophobic
surfaces. The key factors responsible for variation in surface hydrophobicities are rationalised in each
case.
1.3.1 Fluoroalkylsilane (FAS) coatings
FAS molecules can interact with water in a hydrophobic/non-wetting and a hydrophilic/wetting
manner depending on which end of the molecule is considered. Figure 1.12 shows an example of a
commercially available FAS molecule; the trichlorosilane part of the molecule is hydrophilic whereas
the CF3-terminated chain is hydrophobic. The trichloro-(tridecafluorooctyl) silane molecule cannot
directly form hydrophobic surface as it has both hydrophobic and hydrophilic properties. However,
modifying this type of molecule by polymerisation (via a hydration reaction) can allow the hydrophilic
part of the molecule to react with some surface species38
. An example of this is shown in Figure 1.13;
the hydrated siloxy-chains possess hydroxyl groups which then bind to surface hydroxyls through
dehydration reactions. The hydrophilic part of the molecule is bound to the surface and the
hydrophobic fluorinated chains exposed on the surface repel water.39
Figure 1.12. FAS molecular structure.
Fluorinated portions of the molecule
shield attractive interactions with water
(hydrophobic). The silicon terminated
end possesses polarised bonds (Si-Cl)
which interact strongly with water
(hydrophilic).
Figure 1.13. Proposed
condensation reaction
of surface (hydroxyl
groups) with a
hydroxylated FAS
molecule; R represents
a hydrophobic alkyl
chain.

Chapter 1 Introduction
39
A study carried out by J. Bico et al. uses silicon wafer substrates and FAS molecules are
applied40
. The FAS (F(CF2)10(CH2)2SiCl3) was put on to the substrate and grafted to it by heating to
1100°C for 2 hours. The results clearly show that a flat FAS coating can be roughened to greatly
change the water contact angle, which was increased from less than 118° to 167° on a spiked surface.
The surfaces were created by moulding; an image of the created structure is provided in Figure 1.14.39
Figure 1.14. SEM image of a spiked FAS surface
designed to maximise the attainable contact angle. The
surface protrusions allow for less water-surface contact,
using the Cassie-Baxter wetting model a water contact
angle of 167° is expected, this is achieved by the
surface.40
Surfaces constructed using similar techniques and following the same synthesis steps have
been constructed. This method varies by the addition of an acrylic polymer to the reaction mixture and
results in agglomeration of the FAS molecules and a resultant change in the microstructure is observed
(Figure 1.15). Water contact angles of up to 152° were achieved on this surface.41
The use of FAS
molecules to coat surfaces has also been carried out by grafting onto already roughened substrates42
.
Figure 1.15. SEM image of a surface made
from an FAS / acrylic polymer blend; the
surface microstructure allows for air to be
trapped underneath any water on the surface
maximising surface hydrophobicity for large
water contact angles.41

Chapter 1 Introduction
40
1.3.2 Poly(tetrafluoroethylene) (PTFE) surfaces:
The chemical composition of PTFE provides an intrinsically very low surface energy, due to a
deficiency in favourable orientations for water molecules on the polymers surface (Figure 1.16).43
PTFE has a high molecular weight, it is a solid at room temperature but can be shaped quite easily by
heating, making roughening effective in increasing the hydrophobicity of this surface type. Although
there are many strategies imaginable for the modification of PTFE, the basic principles remain the
same – to allow the formation of a highly rough surface while maintaining the hydrophobicity of the
composite materials.44
Figure 1.16. Basic chemical structure of a
PTFE chain. The polymer molecules are
very hydrophobic as they do not interact
with water due to no substantial access to
the polarised C-F bonds.
The use of plasma has been employed in the alteration of flat PTFE substrates43
. Oxygen
plasma was used to treat flat PTFE, and resultant surfaces showed an increase in water contact angle
from 118° to 131°. Addition of a fluorinated molecule (1H, 1H, 2H, 2H-heptadecafluorodecyl
acrylate) into the oxygen plasma resulted in a further increase to 148°. The action of the oxygen
plasma was shown to have a roughening effect on the flat substrate, confirmed by atomic force
microscopy (AFM), however an introduction of foreign particles was also detected. This increased
surface energy and lowered water contact angles. When the plasma was combined with the fluorinated
acrylate it facilitated the coating of foreign particles with fluorinated material, and enabled a further
increase in the hydrophobicity.43
Recent developments in the plasma treatment of PTFE surface has
resulted in controllable roughening of surfaces and increased contact angles to superhydrophobic
magnitudes (≈ 162°)45
. The use of plasma as a surface roughening method can be extended to other
polymers, such as poly(L-lactic acid), in which increased hydrophobicity across a substrate has been
achieved.46
Additionally, silica microspheres have been used to mould highly rough PTFE surfaces
(Figure 1.17). The experiment involved sintering silica beads of various diameters onto a flat
substrate, gaps between these spheres were subsequently filled with PTFE. Sintering of a microsphere
template (diameter 850 nm) at 970°C resulted in a rough PTFE surface with water contact angles of
154° after removal of the silica.47
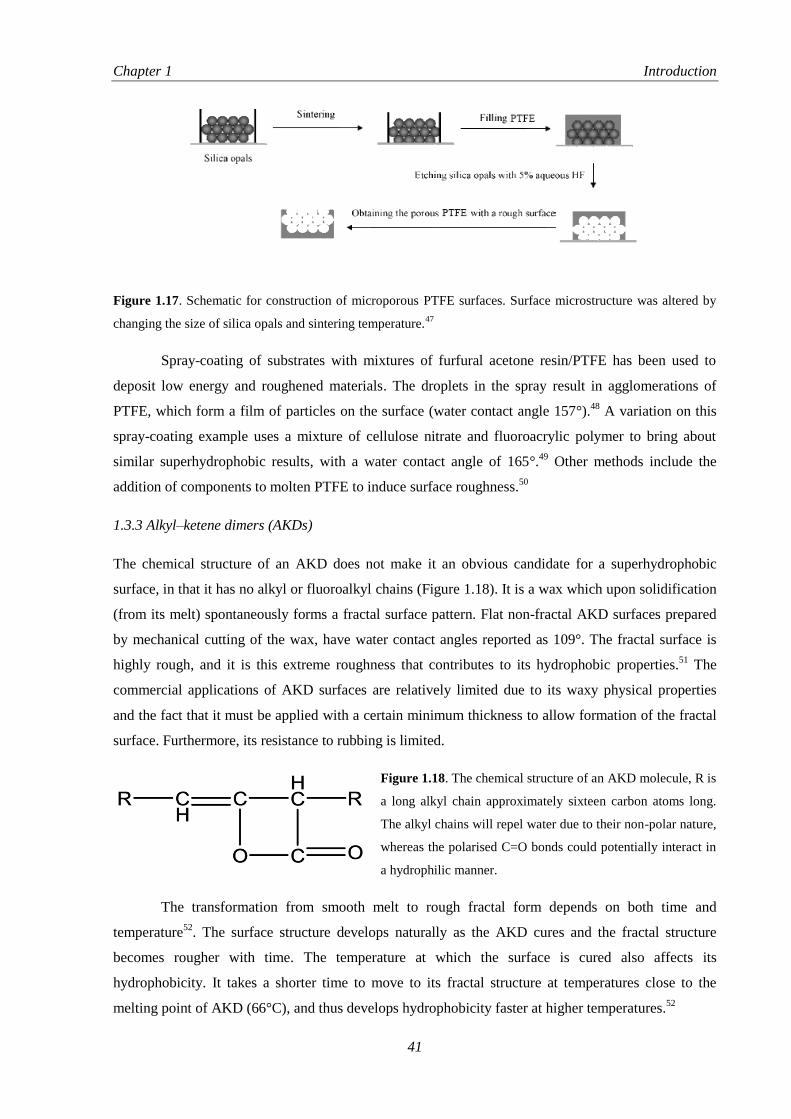
Chapter 1 Introduction
41
Figure 1.17. Schematic for construction of microporous PTFE surfaces. Surface microstructure was altered by
changing the size of silica opals and sintering temperature.47
Spray-coating of substrates with mixtures of furfural acetone resin/PTFE has been used to
deposit low energy and roughened materials. The droplets in the spray result in agglomerations of
PTFE, which form a film of particles on the surface (water contact angle 157°).48
A variation on this
spray-coating example uses a mixture of cellulose nitrate and fluoroacrylic polymer to bring about
similar superhydrophobic results, with a water contact angle of 165°.49
Other methods include the
addition of components to molten PTFE to induce surface roughness.50
1.3.3 Alkyl–ketene dimers (AKDs)
The chemical structure of an AKD does not make it an obvious candidate for a superhydrophobic
surface, in that it has no alkyl or fluoroalkyl chains (Figure 1.18). It is a wax which upon solidification
(from its melt) spontaneously forms a fractal surface pattern. Flat non-fractal AKD surfaces prepared
by mechanical cutting of the wax, have water contact angles reported as 109°. The fractal surface is
highly rough, and it is this extreme roughness that contributes to its hydrophobic properties.51
The
commercial applications of AKD surfaces are relatively limited due to its waxy physical properties
and the fact that it must be applied with a certain minimum thickness to allow formation of the fractal
surface. Furthermore, its resistance to rubbing is limited.
Figure 1.18. The chemical structure of an AKD molecule, R is
a long alkyl chain approximately sixteen carbon atoms long.
The alkyl chains will repel water due to their non-polar nature,
whereas the polarised C=O bonds could potentially interact in
a hydrophilic manner.
The transformation from smooth melt to rough fractal form depends on both time and
temperature52
. The surface structure develops naturally as the AKD cures and the fractal structure
becomes rougher with time. The temperature at which the surface is cured also affects its
hydrophobicity. It takes a shorter time to move to its fractal structure at temperatures close to the
melting point of AKD (66°C), and thus develops hydrophobicity faster at higher temperatures.52

Chapter 1 Introduction
42
An example of AKD synthesis uses stearoyl chloride (CH3(CH2)16COCl) and triethylamine
(Figure 1.19).51
The AKD was isolated from the reaction mixture, then melted and left to solidify on a
glass plate. The formation of the fractal surface during solidification occurred in an unprompted
process. The AKD is susceptible to hydrolysis and formation of dialkylketone (DAK) impurity (Figure
1.19), and the amount of this impurity could also be used to control the hydrophobicity of the surface.
The surface constructed from a 98% AKD melt gives a water contact angle of 174° (Figure 1.20). The
change in the water contact angle on flat (109°) compared to a rough surface highlights the huge effect
the extreme roughness has on the hydrophobic properties of this material.50
Figure 1.19. The dimerisation of RCH2COCl reaction gives AKD after removal of HCl. AKDs react with water
forms dialkylketone (DAK) impurity after loss of carbon dioxide. R = alkyl group - ((CH2)15CH3).51
Figure 1.20. AKD surfaces at different magnifications (SEM images). Surfaces were left to solidify for 3 days
under an inert nitrogen atmosphere at room temperature.
The addition of surfactants to the AKD melt has also been investigated.52
It has been shown
that, regardless of surfactant polarity, the addition decreased the water contact angle from the
maximum achieved value for an unaltered surface. The decrease in hydrophobicity is due to the ionic
component of the surfactant interacting with the water, attracting it toward the surface. It was however
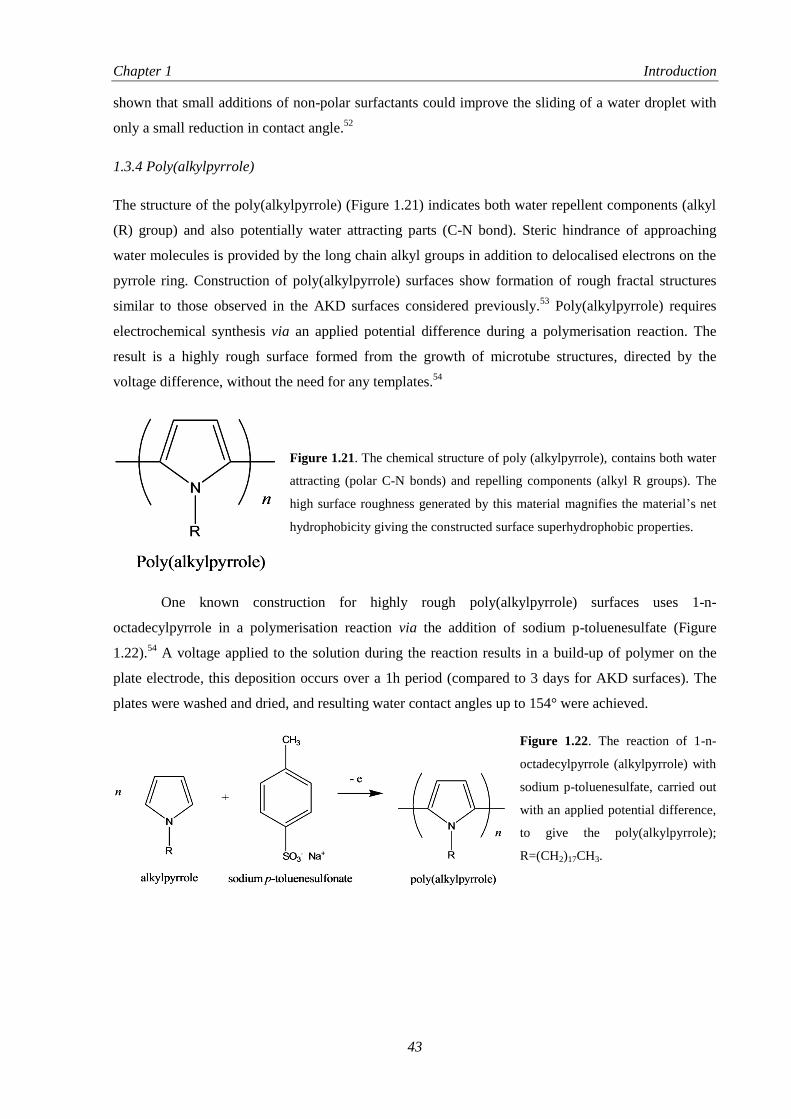
Chapter 1 Introduction
43
shown that small additions of non-polar surfactants could improve the sliding of a water droplet with
only a small reduction in contact angle.52
1.3.4 Poly(alkylpyrrole)
The structure of the poly(alkylpyrrole) (Figure 1.21) indicates both water repellent components (alkyl
(R) group) and also potentially water attracting parts (C-N bond). Steric hindrance of approaching
water molecules is provided by the long chain alkyl groups in addition to delocalised electrons on the
pyrrole ring. Construction of poly(alkylpyrrole) surfaces show formation of rough fractal structures
similar to those observed in the AKD surfaces considered previously.53
Poly(alkylpyrrole) requires
electrochemical synthesis via an applied potential difference during a polymerisation reaction. The
result is a highly rough surface formed from the growth of microtube structures, directed by the
voltage difference, without the need for any templates.54
Figure 1.21. The chemical structure of poly (alkylpyrrole), contains both water
attracting (polar C-N bonds) and repelling components (alkyl R groups). The
high surface roughness generated by this material magnifies the material’s net
hydrophobicity giving the constructed surface superhydrophobic properties.
One known construction for highly rough poly(alkylpyrrole) surfaces uses 1-n-
octadecylpyrrole in a polymerisation reaction via the addition of sodium p-toluenesulfate (Figure
1.22).54
A voltage applied to the solution during the reaction results in a build-up of polymer on the
plate electrode, this deposition occurs over a 1h period (compared to 3 days for AKD surfaces). The
plates were washed and dried, and resulting water contact angles up to 154° were achieved.
Figure 1.22. The reaction of 1-n-
octadecylpyrrole (alkylpyrrole) with
sodium p-toluenesulfate, carried out
with an applied potential difference,
to give the poly(alkylpyrrole);
R=(CH2)17CH3.

Chapter 1 Introduction
44
The coating exhibited no change in contact angle when treated with organic solvents or oils,
due to a particularly high chemical stability and a stable geometric structure (Figure 1.23).
Figure 1.23. SEM image of
the electrodeposited
poly(alkylpyrrole) surface.
The microstructure both acts
to magnify the material’s
hydrophobicity in addition to
trapping air underneath any
water lying on the surface.
Inset: A view of a water
droplet on the super-
hydrophobic surface.54
1.3.5 Chemically altered metal surfaces
Unaltered metal surfaces do not generally display hydrophobic characteristics.55
Most metals can be
shaped mechanically, with surface structure design and manufacture carried out with a great deal of
accuracy, however due to the inherent hydrophilic nature of most metals the roughening typically
brings about enhanced hydrophilicity.10
Metals must be chemically altered before they can be used in
the design of decidedly hydrophobic surfaces. This is usually achieved by roughening the metal and
then coating the surface with a hydrophobic material/species.
Copper substrates have been modified to render them superhydrophobic56
. This process
commenced with a pre-treatment of copper metal substrates with an aqueous solution of K2S2O8 and
KOH, this oxidise the surface to form a thin layer of copper oxide. The resultant surface morphology
is highly rough (Figure 1.24), this was coated in a hydrophobic material (polydimethylsiloxane
(PDMS)), and the surface was rendered superhydrophobic. The methyl groups on the PDMS provide a
low energy interaction with water, flat PDMS has reported contact angles approximately 95°.57
When
applied to a rough surface, the hydrophobic nature of the PDMS is magnified, which allows for a
significant increase in water contact angle to 158°. Plain roughened copper had a contact angle of 23°.
It is thus the application of the PDMS that makes it hydrophobic. The PDMS coated copper surface is
stable over a range of pH values (1–14), with hydrophobicity maintained over these pH values.

Chapter 1 Introduction
45
Figure 1.24. SEM
images of an oxidised
copper surface before
the application of
PDMS. The high
surface roughness of the
uncoated hydrophilic
surface gives water
contact angles of 23°.
When the surface is
coated with PDMS
water contact angles rise
to 158°. Scale bars are
shown at each
magnification.56
The use of electrodeposition techniques has been utilised to grow wire-like structures on
copper substrates58
. Deposited copper nanowires were thermally oxidised to form a copper oxide layer,
which render them hydrophobic. Flat copper oxide films have been reported to have water contact
angles greater than 100°. The nanowire film resulted in a very high water contact angle of 171°.
Electrodeposition onto copper has also been used on pre-roughened copper (by etching); in this case
electrodeposition of fluorinated polymers was carried out to give superhydrophobic surfaces.59
Further
depositions of copper include the spray-coating on to various substrates with copper alkylcarboxylates.
These long-chain molecules act to lower the surface energy with spray-coating process facilitating the
fabrication of high surface roughness.60
Platinum nanowires have been formed by electrodeposition onto Ti/Si substrates.
Chloroplatinic acid (H2PtCl6) was used as a platinum source while anodic aluminium oxide (AAO)
acted as a porous template.61
After removal of the template a network of nanowires was formed
generating a highly rough surface structure. The nanowires themselves are hydrophilic, with water
contact angles below 90°, so functionalisation is required to lower the surface energy. The nanowires
were modified by the addition of a FAS molecule (CF3(CF2)7CH2CH2Si(OCH3)3), which lowers
surface energy and increases hydrophobicity. The combination of high surface roughness with the low
energy FAS gives a contact angle of 158° (Figure 1.25).61
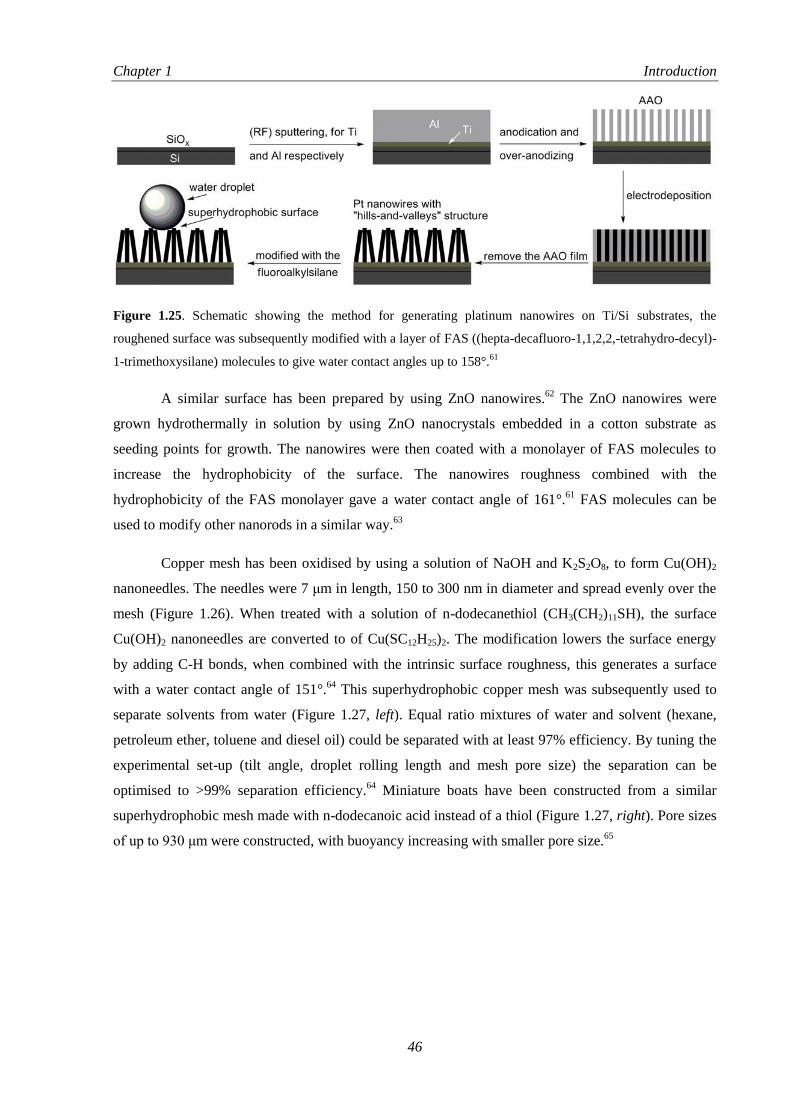
Chapter 1 Introduction
46
Figure 1.25. Schematic showing the method for generating platinum nanowires on Ti/Si substrates, the
roughened surface was subsequently modified with a layer of FAS ((hepta-decafluoro-1,1,2,2,-tetrahydro-decyl)-
1-trimethoxysilane) molecules to give water contact angles up to 158°.61
A similar surface has been prepared by using ZnO nanowires.62
The ZnO nanowires were
grown hydrothermally in solution by using ZnO nanocrystals embedded in a cotton substrate as
seeding points for growth. The nanowires were then coated with a monolayer of FAS molecules to
increase the hydrophobicity of the surface. The nanowires roughness combined with the
hydrophobicity of the FAS monolayer gave a water contact angle of 161°.61
FAS molecules can be
used to modify other nanorods in a similar way.63
Copper mesh has been oxidised by using a solution of NaOH and K2S2O8, to form Cu(OH)2
nanoneedles. The needles were 7 μm in length, 150 to 300 nm in diameter and spread evenly over the
mesh (Figure 1.26). When treated with a solution of n-dodecanethiol (CH3(CH2)11SH), the surface
Cu(OH)2 nanoneedles are converted to of Cu(SC12H25)2. The modification lowers the surface energy
by adding C-H bonds, when combined with the intrinsic surface roughness, this generates a surface
with a water contact angle of 151°.64
This superhydrophobic copper mesh was subsequently used to
separate solvents from water (Figure 1.27, left). Equal ratio mixtures of water and solvent (hexane,
petroleum ether, toluene and diesel oil) could be separated with at least 97% efficiency. By tuning the
experimental set-up (tilt angle, droplet rolling length and mesh pore size) the separation can be
optimised to >99% separation efficiency.64
Miniature boats have been constructed from a similar
superhydrophobic mesh made with n-dodecanoic acid instead of a thiol (Figure 1.27, right). Pore sizes
of up to 930 μm were constructed, with buoyancy increasing with smaller pore size.65

Chapter 1 Introduction
47
Figure 1.26. SEM image of the uniform coverage
of Cu(OH)2 nanoneedles on the copper substrate
prior to modification with n-dodecanethiol. The
nano-roughness combined with microstructure of
the copper mesh, and the low surface energy
provided by the C-H bonds of the thiol gave water
contact angles of 151°.64
Figure 1.27. Left: Experimental set-up of water–solvent mixture separation. The mixtures were added at a rate of
1 drop per second onto the superhydrophobic copper mesh which prevented water falling through the mesh and
rolled into a separate vessel, whereas the solvent permeated the mesh and fell through, not travelling down the
tilted surface. Right: A weighted miniature boat (dimensions: 4 x 2 x 1 cm) constructed from superhydrophobic
copper mesh, prevents water from passing through the pores and thus the boat floats on water.64/65
Iron–platinum nanoparticles have also been used for surface roughening. The nanoparticles
were prepared by using platinum acetylacetonate and [Fe(CO)5] in the presence of both long-chain
carboxylic acids and thiols. The surface-bound ligating groups were then exchanged for hydrophobic
molecules through substitution reactions (Figure 1.28). Suspensions of particles were spread onto
silicon substrates and the solvent was allowed to evaporate. The resultant surface structure was well
developed, combined with the low energy of the fluorinated thiol and carboxylic acids ligating groups,
allowed for water contact angles of 160° to be obtained.66
The use of long-chain molecules is a well-
defined method for lowering surface energy.67
An example of this involves the reaction of a long chain
carboxylic acids to Co3O4 nanoscale powders modified by using steric acid. These surfaces possess
water contact angle up to 155°.68
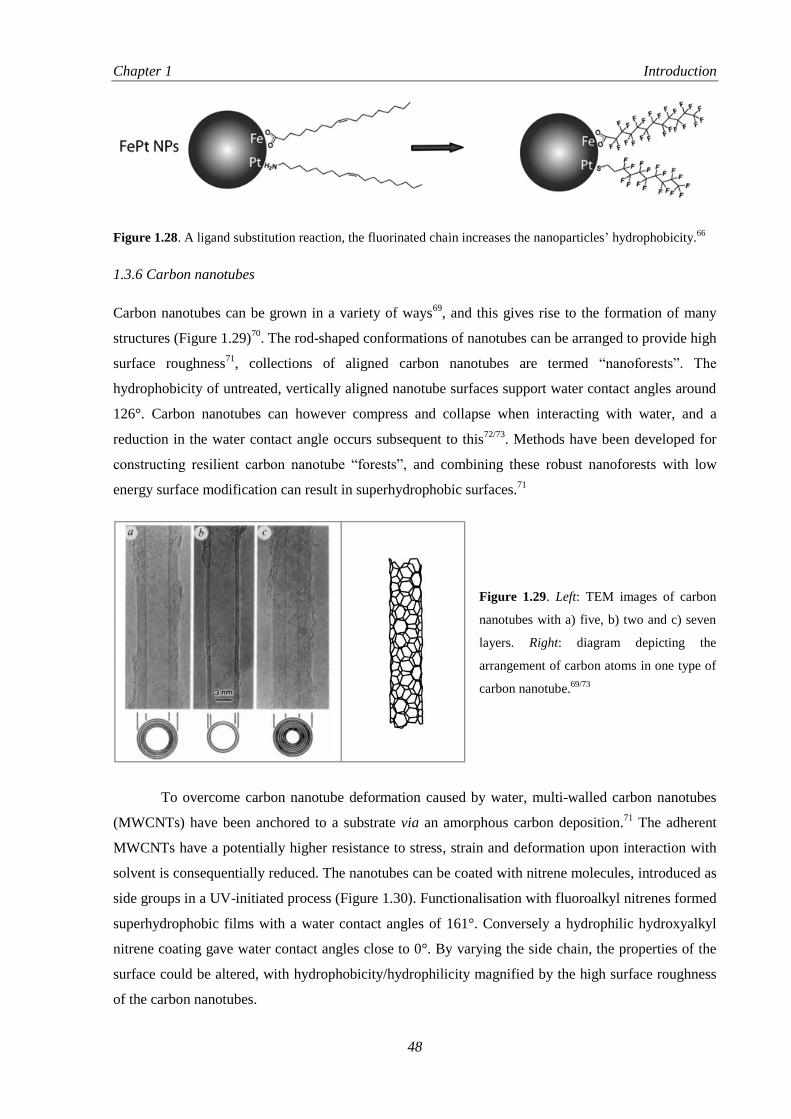
Chapter 1 Introduction
48
Figure 1.28. A ligand substitution reaction, the fluorinated chain increases the nanoparticles’ hydrophobicity.66
1.3.6 Carbon nanotubes
Carbon nanotubes can be grown in a variety of ways69
, and this gives rise to the formation of many
structures (Figure 1.29)70
. The rod-shaped conformations of nanotubes can be arranged to provide high
surface roughness71
, collections of aligned carbon nanotubes are termed “nanoforests”. The
hydrophobicity of untreated, vertically aligned nanotube surfaces support water contact angles around
126°. Carbon nanotubes can however compress and collapse when interacting with water, and a
reduction in the water contact angle occurs subsequent to this72/73
. Methods have been developed for
constructing resilient carbon nanotube “forests”, and combining these robust nanoforests with low
energy surface modification can result in superhydrophobic surfaces.71
Figure 1.29. Left: TEM images of carbon
nanotubes with a) five, b) two and c) seven
layers. Right: diagram depicting the
arrangement of carbon atoms in one type of
carbon nanotube.69/73
To overcome carbon nanotube deformation caused by water, multi-walled carbon nanotubes
(MWCNTs) have been anchored to a substrate via an amorphous carbon deposition.71
The adherent
MWCNTs have a potentially higher resistance to stress, strain and deformation upon interaction with
solvent is consequentially reduced. The nanotubes can be coated with nitrene molecules, introduced as
side groups in a UV-initiated process (Figure 1.30). Functionalisation with fluoroalkyl nitrenes formed
superhydrophobic films with a water contact angles of 161°. Conversely a hydrophilic hydroxyalkyl
nitrene coating gave water contact angles close to 0°. By varying the side chain, the properties of the
surface could be altered, with hydrophobicity/hydrophilicity magnified by the high surface roughness
of the carbon nanotubes.

Chapter 1 Introduction
49
Figure 1.30. Left: Attachment of functionalised nitrenes to MWCNTs changes the wetting nature of the surface.
Right: An etched surface of vertically aligned nanotubes attached to the tops of protrusions.71
MWCNTs have also been deposited on pre-patterned surfaces.75
A silicon substrate was spin-
coated with a photoresist, exposed to UV light etching portions of the surface not covered by the
photoresist. The remaining photoresist was removed with acetone and the surface pattern developed
(Figure 1.31). Electron-beam evaporation was then used to form a layer of Al/Fe catalyst (10 nm Al, 2
nm Fe), used for the carbon nanotube deposition, over the entire surface. MWCNTs were then grown
on the catalyst in a water-assisted thermal chemical vapour deposition process carried out at 750–
800°C (Figure 1.31).
Figure 1.31. Left: Summary of the process used to generate the patterned surface and the growth of the
MWCNTs. Right: An SEM of the patterned, nanotube coated surface.75
The water contact angle achieved increased from 163° to 165°, a relatively small change. The
angle at which water droplets began to slide on the surface was however significantly altered. Un-
patterned MWCNT surfaces were able to hold a 2 μL water droplet at a 90° tilt and even upside-down.
Comparing this with the patterned surface, which had an average sliding angle of around 8°, it can be
seen that alteration of large scale roughness causes the surfaces to wet in a very different ways. The
low sliding angle for the patterned surface suggests a full Cassie–Baxter type wetting mechanism,
whereas the sticky nature of the un-patterned surface suggests a Wenzel mechanism. Substantial voids
introduced by the large scale roughness of the pattern cause air to be trapped underneath water
droplets, and this allows water to move across the surface with less resistive force.75
Silica

Chapter 1 Introduction
50
microspheres have also been used to introduce roughness to a substrate, greater than that achievable
with solely carbon nanotubes76
. Plasma action on aligned carbon nanotubes has also been carried out
to render the tips of the nanotubes amorphous which increased surface hydrophobicity77
.
1.3.7 Modified silica-based surfaces
Silica materials generally have extensive coverage of hydroxyl (silanol) groups on their surfaces. A
favourable interaction of water with these groups occurs through hydrogen bonding which renders
most silica surfaces hydrophilic.78
To decrease this interaction with water, the surface can be heated
and hydroxyl groups removed78
; alternatively the surface groups can be functionalised79
. Hydrophobic
silica is achievable by the lowering of surface energy and lowering the extent of interaction with water
(Figure 1.32). In order to greatly enhance the surface hydrophobicity via these methods surface
roughness must be introduced. Superhydrophobic modification of surface silanol groups is commonly
done by using FAS molecules80-83
, in which the functionalisation is combined with roughening.
Figure 1.32. Schematic showing the functionalisation of silica surface hydroxyl groups. Treatment of a flat silica
substrate with these groups lowers the surface energy and renders the surface hydrophobic.79
Fumed silica is made up of nanoparticulate SiO2 with particle diameters of approximately 10
nm, and is formed by pyrolysis of SiCl4 in the presence of oxygen and hydrogen gas. The
nanoparticulate silica agglomerate together at higher temperatures, the small particle size provides a
large surface area to mass ratio (> 100 m2g
-1), which can be adjusted by varying the amount of
agglomeration.84
The inherent roughness of agglomerated particles in addition to potential
functionalisation of surface silanol groups makes fumed silica an excellent template for
superhydrophobic surface generation. Sol-gel techniques have been used to embed silica nanoparticles
in an organosilane network via spin-coating onto glass85
. The fumed silica was functionalised by using
hexamethyldisilazane (HMDS) to give surface groups of trimethylsiloxane (TMS) (Figure 1.33). The
rough and functionalised silica surfaces were extremely water repellent with a maximum water contact
angle of 168° reported, and tilt angles of less than 3°. The hydrophobicity of the films degraded after
exposure to water as the top layers of the fumed silica were removed. The rate of degradation was
slowed by varying the amount of HMDS used in the sol-gel processing. The silica films were also

Chapter 1 Introduction
51
transparent (optical transmittance of around 92%) providing potential for self-cleaning window
coatings.
Figure 1.33. SEM image showing a
fumed silica film on glass obtained
by spin-coating a solution of 5 wt%
trimethylsiloxane and silica
nanoparticles, in methyl isobutyl
ketone solvent. The silica particles
diameters are approximately 10 nm;
the agglomeration of these particles
gives rise to the high surface
roughness. The functionalisation
with surface trimethylsiloxane
groups lowers the surfaces energy.
Scale bar shows 200 nm.85
The use of agglomerated silica nanoparticles for surface roughening can provide a solid
structure that can be altered to lower surface energy86
. This alteration can be made either by
functionalising surface silanol groups87/88
or by forming a thin layer of hydrophobic material to cover
the hydrophilic silica89
. This method of surface formation can be carried out at low temperature
allowing cotton fibres and other temperature sensitive materials to be coated and rendered
superhydrophobic90
. A variation of this method uses colloidal zinc hydroxide, with functionalisation of
the surface hydroxyl groups by using bulky stearate groups lowers surface energy. The modified zinc
particles were then embedded in a silica network by spray-coating a silica sol-gel. The result is a
highly rough surface with a low energy of interaction with water, water contact angle of 165° were
achieved.91
A technique for the formation of silica is the acid hydrolysis of tetraethylorthosilicate
(TEOS).92
Rough silica surfaces have been constructed by combining the hydrolysed TEOS with
polypropylene glycol (PPG). Subsequent pyrolysis of the resulting solid material results in
decomposition of the PPG and surface roughening. Varying the amount of PPG in the starting
materials network provides a different degree of roughening through differing amounts of
decomposing material. Modification of the roughened surfaces was carried out by a reaction with
HMDS that resulted in surface TMS groups (Figure 1.34). Water contact angles of around 160° were
recorded on the roughest surfaces. Optical transparency could be introduced through changing the pH
of the reaction mixture and the ratio of TEOS to PPG, and was raised to higher than 97% (from less
than 30%). However, water contact angle were reduced to 156°. Silica formation by using TEOS as a

Chapter 1 Introduction
52
precursor has also been implemented as a support for silicon carbide nanowires, another route toward
a superhydrophobic surface.93
Figure 1.34. Schematic for
the preparation of a
roughened silica surface.
Microstructure is generated
by pyrolysis of a surface
template material, this is
followed by surface
functionalisation with TMS
groups which lowers surface
energy.92
1.3.8 Miscellaneous surfaces
1.3.8.1 Lithographic Imprinting
Lithography is a method for depositing material onto a surface by means of a direct or indirect transfer
from a mould or template; such a technique has been used using natural Lotus leaves (Figure 1.35). An
imprint was made by creating a Lotus leaf cast using PDMS pre-polymer. After the polymer cured it
was separated from the leaf giving a negative imprint of the Lotus leaf structure. The cast was then
used to mould an ink (Figure 1.35) into the Lotus leaf-type structure, which was then dried in vacuum
and remove from the cast. The resultant surface gave a water contact angle of 155°.94
The ink (BP-AZ-
CA) used was a long-chain polymer (Figure 1.35), the structure of which is not completely made up
wholly of water-repelling components (i.e., alkyl or fluoroalkyl chains); it is thus the high surface
roughness of the Lotus-like surface that contributes to its superhydrophobicity. The ink molecule was
required to have some degree of polarity so it could be easily removed from the PDMS cast when
stamped.94
Figure 1.35. Lotus leaf imprinting: 1)
A PDMS stamp is prepared by placing
it on the surface of the leaf; 2) the
stamp is pressed onto the ink; 3) the
stamp is peeled off and dried to give an
inverse Lotus leaf-type surface. Lower
image shows chemical structure of the
ink (BP-AZ-CA) used for imprinting.94

Chapter 1 Introduction
53
Low-density polyethylene has also been used to cast the Lotus leaf,95
the result was the
replication of Lotus leaf microstructure, using a low-energy material. The rough polyethylene surface
was capable of achieving a 154° water contact angle. Polystyrene is a low energy material that has also
been used in casting methods, in this instance a honeycomb structure was formed. The top layer of this
honeycomb was then peeled away, leaving a spike where the two layers (top and bottom) were
connected. The spiked low energy surface was reported to achieve a water contact angle of 165°.96
PDMS is a low-energy material that can be roughened to form superhydrophobic surfaces97
,
however it can also be used as a substrate in order to minimise possible substrate interaction with
water. Deposition of silica spheres has been carried out by a pressure transfer from a silicon plate
(Figure 1.36).98
In this case there was no mould used, however the silica spheres were used as a
template for functionalisation. The silica spheres were coated in silver nanoparticles by action of
[Ag(NH3)2]+ ions, the silver was then chemically modified with perfluorodecanethiol which lowered
the surface energy. The combination of the rough silica spheres and low surface energy allowed for
water contact angles of 156° to be achieved. The PDMS substrates remained flexible and somewhat
transparent, these superhydrophobic sheets can be applied to other surfaces.
Figure 1.36. Schematic showing the soft lithography of silica spheres, once moulded to the surface the sphere
were functionalised with silver nanoparticles which were then treated with perfluorodecanethiol, lowering
surface energy.98
1.3.8.2 Electro-spinning of Polystyrene
Electro-spinning utilises electrical charge to draw fibres from a liquid. Nature has inspired the
generation of extremely rough surfaces. One example uses the silver ragwort leaf99
, as its structure
exhibits intricate nanostructured protrusions100-102
. Application of a voltage to polystyrene solutions
produced fibres which were deposited in a collector. The polystyrene solutions contained varying
compositions of tetrahydrofuran (THF) and N,N-dimethylformamide (DMF) as solvents. The surface
structures generated were extremely rough and porous (Figure 1.37), with the most hydrophobic
surface giving a water contact angle of 159.5°.99

Chapter 1 Introduction
54
Figure 1.37. Electro-spun polystyrene – Left: SEM image of the polystyrene fibres (THF/DMF ratio of 1:3).
Right: A surface profile cross section gained by atomic force microscopy (AFM).99
The surface hydrophobicity was found to be able to be controlled by the solvent ratio used,
with a ratio of 1:3 of THF/DMF giving an optimised surface. Air trapped beneath any water droplets
on the surface, reduced the amount of liquid–surface contact providing a superhydrophobic Cassie-
Baxter type surface. The microstructure (Figure 1.37) was observed to resemble that of the silver
ragwort leaf.99
Electro-spinning of poly(vinylidene fluoride) solutions has also been used in a similar
process103
. The energy of the resultant surfaces could be lowered further by the addition of an FAS
compound, which has also been used as a precursor in electro-spinning experiments104
. This method
can be applied to many other hydrophobic compounds100-102
.
This section has covered many of the methods used to form superhydrophobic surfaces. The
key principle in superhydrophobic surface construction is the generation of surface roughness, while
maintaining a surface chemistry with a low energy of interaction with water. To generate surfaces that
demonstrate Lotus effect self-cleaning, a Cassie-Baxter wetting mechanism must be adopted, requiring
a porous surface morphology capable of trapping air. The main experimental technique used in this
project is chemical vapour deposition (CVD). The following sections will review the facets of this
technique and explore examples of hydrophobic surfaces deposited via CVD.
1.4. Chemical Vapour Deposition
CVD is a technique used to deposit a solid product onto a substrate by means of a gas phase or surface
reaction. There are many forms of CVD each with their own particular reaction routes, however a
general mechanism (Figure 1.38) can be described.105
Primarily the precursors are vaporised, if not
already in the gas phase. Vaporisation techniques include; sonic action on a solution106
, thermal
heating107
and reduction of pressure108
. The reactions can commence in the gas phase, with deposited
films usually of high purity and uniformity. After vaporisation the reactants may require some
activation to react, this is commonly done by heating106-108
, however other methods include
electromagnetic radiation109
and plasma activation110
. Once activated, the reactant mixture comes into
contact with the substrate a deposition is made onto its surface. Molecules which are not deposited can
be lost from the activated complex and extracted as waste gas. The physisorbed atoms left at the
substrate move around to chemically bind at favourable positions on the surface. Variation in

Chapter 1 Introduction
55
vaporisation technique as well as the method of precursor activation determines the category of the
CVD taking place.105
Figure 1.38. Schematic showing a general CVD mechanism – (1) vaporisation of precursors, (2) transfer to
substrate where reaction can take place on the surface (some pre-reaction usually takes place at this step), (3)
loss of gaseous molecules from reaction that are then transferred to exhaust as waste, (4) physisorption of
reaction products onto substrate surface, (5) chemisorption of atoms in ideal surface environment and film
formation.
1.5. Hydrophobic Surfaces via Chemical Vapour Deposition
The general mechanism for CVD tends to result in flat and chemically homogenous films. The
uniformity of the deposited films can allow for a consistently low energy across the surface. The
surface based reaction of many CVD processes hinders the growth of a highly rough microstructure in
many cases.105
Surface roughness can be introduced by altering elements of a typical CVD process;
this is most commonly done by using precursors that contain preformed particles which then go on to
give the deposited film its microstructure111
. The deposition of hydrophobic films by using CVD is
currently an area of great interest112
. This section gives examples of some of the most successful
methods for forming superhydrophobic coatings using CVD.
1.5.1 Carbon Nanotubes (CNTs)
The use of CNTs in CVD depositions can result in a highly rough structure due to the shape of the
CNTs themselves113/114
. Previous examples of CNT functionalisation to lower surface energy enable
very hydrophobic surfaces to be constructed71
. Untreated CNTs are slightly hydrophilic, with water
contact angles between 70-80°.115
Compounds such as CF4 can be used in a CVD process to allow
fluorination of CNTs and results in an increase in hydrophobicity, with water contact angles as large
as 165° recorded116
.
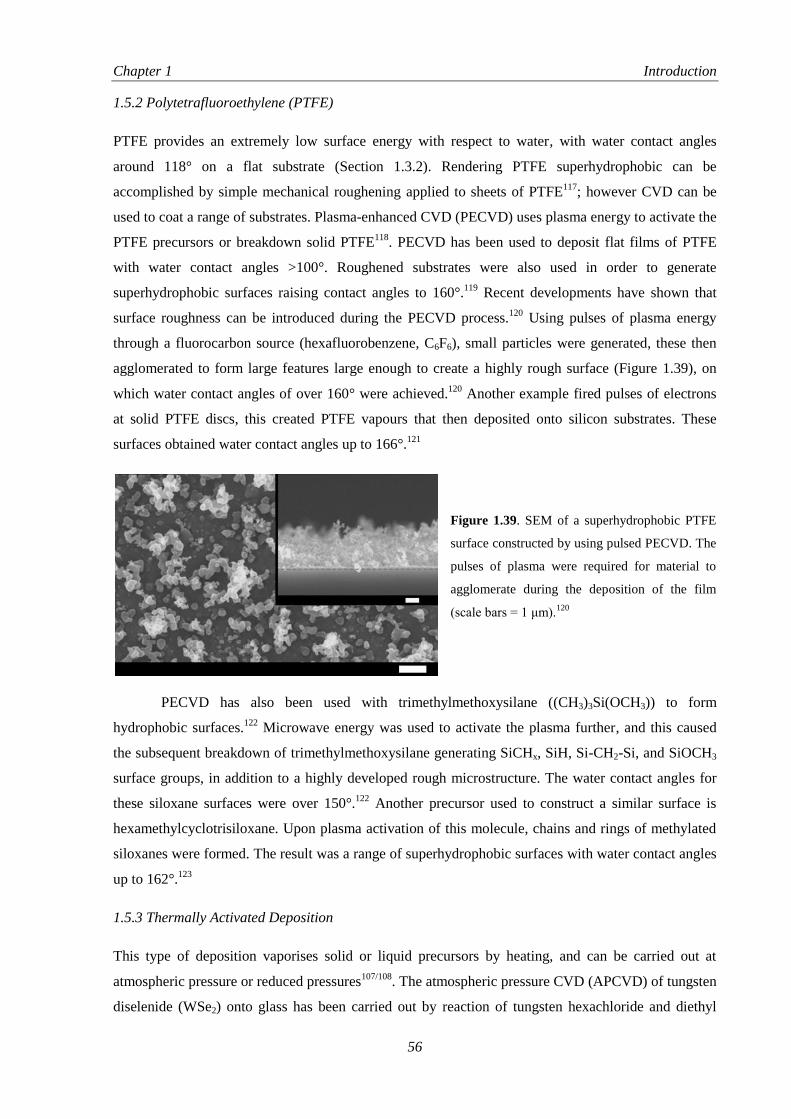
Chapter 1 Introduction
56
1.5.2 Polytetrafluoroethylene (PTFE)
PTFE provides an extremely low surface energy with respect to water, with water contact angles
around 118° on a flat substrate (Section 1.3.2). Rendering PTFE superhydrophobic can be
accomplished by simple mechanical roughening applied to sheets of PTFE117
; however CVD can be
used to coat a range of substrates. Plasma-enhanced CVD (PECVD) uses plasma energy to activate the
PTFE precursors or breakdown solid PTFE118
. PECVD has been used to deposit flat films of PTFE
with water contact angles >100°. Roughened substrates were also used in order to generate
superhydrophobic surfaces raising contact angles to 160°.119
Recent developments have shown that
surface roughness can be introduced during the PECVD process.120
Using pulses of plasma energy
through a fluorocarbon source (hexafluorobenzene, C6F6), small particles were generated, these then
agglomerated to form large features large enough to create a highly rough surface (Figure 1.39), on
which water contact angles of over 160° were achieved.120
Another example fired pulses of electrons
at solid PTFE discs, this created PTFE vapours that then deposited onto silicon substrates. These
surfaces obtained water contact angles up to 166°.121
Figure 1.39. SEM of a superhydrophobic PTFE
surface constructed by using pulsed PECVD. The
pulses of plasma were required for material to
agglomerate during the deposition of the film
(scale bars = 1 μm).120
PECVD has also been used with trimethylmethoxysilane ((CH3)3Si(OCH3)) to form
hydrophobic surfaces.122
Microwave energy was used to activate the plasma further, and this caused
the subsequent breakdown of trimethylmethoxysilane generating SiCHx, SiH, Si-CH2-Si, and SiOCH3
surface groups, in addition to a highly developed rough microstructure. The water contact angles for
these siloxane surfaces were over 150°.122
Another precursor used to construct a similar surface is
hexamethylcyclotrisiloxane. Upon plasma activation of this molecule, chains and rings of methylated
siloxanes were formed. The result was a range of superhydrophobic surfaces with water contact angles
up to 162°.123
1.5.3 Thermally Activated Deposition
This type of deposition vaporises solid or liquid precursors by heating, and can be carried out at
atmospheric pressure or reduced pressures107/108
. The atmospheric pressure CVD (APCVD) of tungsten
diselenide (WSe2) onto glass has been carried out by reaction of tungsten hexachloride and diethyl

Chapter 1 Introduction
57
selenide124
. Water contact angles up to 145° were achieved (Figure 1.40), and the surface structures
were found to be made up of thin needles oriented predominantly perpendicular to the plane of the
substrate. The high roughness of the film facilitated the maximisation of the water contact angle. The
films did not exhibit Cassie-Baxter wetting, since water droplets on the surface did not roll or slide
even at high tipping angles. This suggests a Wenzel wetting type with no air trapped beneath the
droplet. Water droplets of up to 100 mg were stationary at a 90° tip angle. Other diselenide systems
did not show similar wetting behaviours (TiSe2125
, VSe2126
, NbSe2127
, MoSe2128
).
Figure 1.40. Shows water droplets (1 mg) sitting on a tungsten–selenide film deposited via APCVD, tip angles
of 0° (left), 90° (centre) and even suspended upside down (right) could not remove the water droplet. This
clearly demonstrates the effect of Wenzel-type surface wetting on the nature of interaction between water and a
surface.
The formation of poly-p-xylylenes is a contrasting example that did form a Cassie–Baxter
wetting surface. These films were formed by the evaporation of aromatic and fluorinated precursors
that gave a gas-phase reaction which formed a poly-p-xylylene surface with a water contact angle of
153°.129
1.6. Routes to Hydrophobicity
The techniques explored in superhydrophobic surface formation have led to the development of four
main routes to construct extremely hydrophobic surfaces. In the design of superhydrophobic surfaces,
there are two main features that must be focussed on: a low surface energy so a flat surface has a
contact angle above 90° and a high surface roughness to amplify the hydrophobicity of the surface and
trap air in the surface porosity. Surface roughness can be introduced while depositing a low-energy
material120
or each can be introduced separately40
, the result of which is a one-step construction (laying
down a rough and low energy surface) or a two-step construction (introducing surface roughness and
then lowering the surface energy), see Figure 1.41. Surface roughness can also be introduced to a low-
energy material, such as PTFE40
, or a low-energy material can be applied to a substrate and
roughening performed subsequently (e.g. AKD application).130

Chapter 1 Introduction
58
Figure 1.41. Schematic showing four main mechanisms (1a, 1b, 2a, 2b) for the construction of a hydrophobic
surface.
In order to carry out each route different issues must be considered. Route 1a requires the use
of low-energy material that has good adherence to the substrate. If it has no adherence, the film will be
powdery and would have limited use. Route 1b requires only the use of a low-energy material that can
be roughened with the material’s hydrophobicity maintained after the roughening process has taken
place. The two-step formation, 2a, needs a strong attraction force between the material used for
roughening and the hydrophobic reagent. If there is no adherence, the hydrophobic coating would
degrade and the surface’s hydrophobicity is reduced. A variation of the two-step technique, 2b, has the
deposition of a substantial amount of hydrophobic material first which is then followed by roughening.
This route (analogous with 1b) requires the low energy to be maintained upon roughening, in addition
to a constant adherence to the original substrate.
Hydrophobic surfaces can be constructed from inherently hydrophilic materials.131
This is
brought about by forming highly rough surfaces that trap air with a lot of force, forming a Cassie-
Baxter surface from a high-energy material. Although this can be achieved, the most hydrophobic
surfaces use low energy materials for construction or a low-energy functionalisation.2-5
1.7. Commercial Application of Hydrophobic Surfaces
The Lotus effect can allow the self-cleaning of surfaces. However hydrophobic surfaces have many
other applications in a wide number of fields. The following section will focus on the range of uses of
such surfaces, including self-cleaning.

Chapter 1 Introduction
59
1.7.1 Lotus Effect Self-cleaning (Anti-biofouling)
It has been demonstrated that surface coatings can be designed to remove particles when treated with
water, by duplicating the Lotus effect. Figure 1.42 shows a Formica sheet, one side was unaltered and
the other coated with superhydrophobic PTFE, both sides were dusted with soot particles. Upon action
of water, the particles were completely removed from the PTFE-treated side, whereas the untreated
sheet did not demonstrate the Lotus effect and did not self-clean.132
Commercial paints have been
developed (Sto AG) which dries to form a superhydrophobic coating and possesses significant self-
cleaning attributes.132
Figure 1.42. Soot-coated Formica plates. The side of the left plate is untreated and shows no Lotus-effect self-
cleaning and soot removal with action of water is inefficient. The right side of the plate is coated with
micropowdered PTFE giving the surface superhydrophobic properties, from which soot is easily removed with
water.132
A substantial area of research is currently focussed toward transparent superhydrophobic self-
cleaning coatings. Transparent films applied to optically transmitting glasses and plastics could be
utilised in many industries including automotive developments, buildings and solar panels.
Superhydrophobicity would insure transparency is maintained due to self-cleaning under the action of
water. Superhydrophobic surfaces require a rough microstructure.133
To generate a transparent coating
the light which passes through must not interact the coating itself or the substrate used to deposit onto,
to ensure this the features of the surfaces microstructure must have dimensions less than the
wavelength of visible light (< 380 nm).134
In constructing transparent films the surface microstructure
must be carefully considered.
Despite these factors, there is a wide range of products on the market aimed toward
transparent hydrophobic applications developed by Pilkington, Saint-Gobain and PPG Industries in
addition to others.135-137
Hydrophobic surfaces can prevent adhesion of bacteria to surfaces138
. An
example of this is a commercially available spray for ship hulls limits biofouling by reducing the

Chapter 1 Introduction
60
ability of bacteria to stick to the surface139
. Hydrophobic coatings for windows (domestic and
vehicular) are also available135/140
. The coatings act to keep the glass free of water marks by preventing
water droplet adhesion with self-cleaning properties also apparent. With respect to car windscreens,
products aim to make the glass slippery and allow the fast removal of water so windscreen wipers may
not have to be operated.141/142
Spectacles are also an area of commercial exploitation for hydrophobic
coatings.143
1.7.2 Surface protection
A superhydrophobic surface limits the contact between water and a surface, this principle can be
applied to a metal surface which would reduce possible corrosion. Copper surfaces oxidised then post-
treated with a functionalisation gave rise to superhydrophobic properties, and corrosion was shown to
be hugely reduced.144
This technology could be applied to other surfaces in order to protect against
water. Hydrophobic surfaces not only repel water droplets but also show resistance to humidity.
Fluorinated silanes have been used to coat paper, and as the paper was already rough the surface was
rendered superhydrophobic and resistant to humidity, with tensile strength maintained up to extremely
high humidity.145
1.7.3 Textiles
Natural fibres and textiles such as cotton have an inherently rough microstructure, the lowering of
surface energy could render them superhydrophobic. Treatments on cotton fibre146/147
in addition to
paper sheets145
have been carried out to create water repellent materials. Transforming textiles from a
natural hydrophilic state to superhydrophobic not only keeps the fabric dry, but there is also a chance
for the flexibility and insulating properties of the original material to be maintained. Figure 1.43 shows
cotton fibres that have been coated by using a sol–gel method. Nanoparticulate silver was also
incorporated into the coating to give a potential antimicrobial activity. The inherent roughness of the
fibres used in textile design means that water-repellent fibres can be treated with a low energy material
in order to magnify the surfaces hydrophobicity. The development of hydrophobic textiles is a widely
explored area, and countless products are available commercially.148/149
Figure 1.43. An SEM image of superhydrophobic
cotton fabric coated with a fluoroalkyl siloxane. The
cotton fibres provide an inherent surface roughness, and
coating the fabric with a low energy material increases
hydrophobicity.147
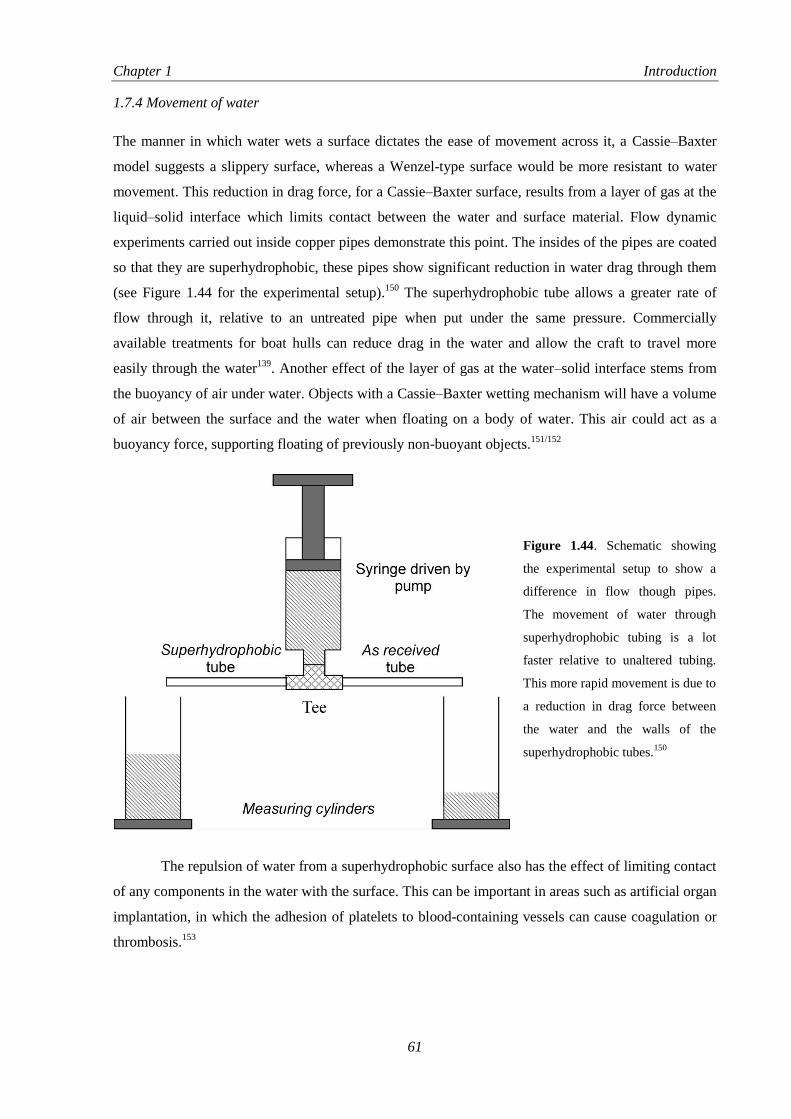
Chapter 1 Introduction
61
1.7.4 Movement of water
The manner in which water wets a surface dictates the ease of movement across it, a Cassie–Baxter
model suggests a slippery surface, whereas a Wenzel-type surface would be more resistant to water
movement. This reduction in drag force, for a Cassie–Baxter surface, results from a layer of gas at the
liquid–solid interface which limits contact between the water and surface material. Flow dynamic
experiments carried out inside copper pipes demonstrate this point. The insides of the pipes are coated
so that they are superhydrophobic, these pipes show significant reduction in water drag through them
(see Figure 1.44 for the experimental setup).150
The superhydrophobic tube allows a greater rate of
flow through it, relative to an untreated pipe when put under the same pressure. Commercially
available treatments for boat hulls can reduce drag in the water and allow the craft to travel more
easily through the water139
. Another effect of the layer of gas at the water–solid interface stems from
the buoyancy of air under water. Objects with a Cassie–Baxter wetting mechanism will have a volume
of air between the surface and the water when floating on a body of water. This air could act as a
buoyancy force, supporting floating of previously non-buoyant objects.151/152
Figure 1.44. Schematic showing
the experimental setup to show a
difference in flow though pipes.
The movement of water through
superhydrophobic tubing is a lot
faster relative to unaltered tubing.
This more rapid movement is due to
a reduction in drag force between
the water and the walls of the
superhydrophobic tubes.150
The repulsion of water from a superhydrophobic surface also has the effect of limiting contact
of any components in the water with the surface. This can be important in areas such as artificial organ
implantation, in which the adhesion of platelets to blood-containing vessels can cause coagulation or
thrombosis.153

Chapter 1 Introduction
62
1.7.5 Microfluidics
Recent developments in superhydrophobic surface construction allows for movement of water on a
microscale. It has been shown that by altering the wetting properties of a surface on an incredibly
small scale, allows for water droplets to be moved by controlling a surfaces microstructure.154/155
Water movement at the microscale is important in areas such as biofluid transport156
, in which wetting
behaviour and water movement can be controlled by small external forces such as application of a
voltage or change in temperature.154
1.7.6 Oil–water separation
Water-repellent molecules such as long alkyl chains are oleophilic. Their use to coat a rough surface to
render them superhydrophobic could also give superoleophilic properties to that surface.64
A copper
mesh modified to be superhydrophobic would support water and prevent it from passing through the
pores in the mesh, and water droplets would also roll off when the surface was tilted. Substances such
as hexane, petroleum ether, toluene and diesel oil were not repelled like the water and slip through the
mesh upon contact. Mixtures of water and oily substances were then separated up to and above 99%
efficiency. Superhydrophobic nanoporous polymers have been investigated and have been found to be
very effective absorbers of organic compounds.157
These materials could act to absorb any oil-like
products and leave water behind; these materials could be implemented in the clean-up of oil spillages
at sea.
1.8 Summary
A large number of methods have been used to make hydrophobic surfaces as shown in this
introduction. The use of CVD to construct a superhydrophobic surface is inherently difficult due to the
flat-uniform structures observed in most CVD reactions. Exceptionally hydrophobic surfaces not only
need to be constructed from low energy materials, they require a highly developed surface
microstructure which acts to magnify surface hydrophobicity, in addition to trapping air in the porosity
of the surface in order to increase hydrophobicity further. Examples of hydrophobic surfaces made via
CVD, explored within this introduction, suggest that preformation of potential surface features must
be accomplished (or commenced) prior to contact with a substrate.
The following work in this thesis details novel routes toward hydrophobic surfaces via CVD,
and methods for overcoming inherent complications in generating surface roughness. Other issues
handled will include the interaction of bacteria with superhydrophobic surfaces, in addition to
investigating new methods for assessing surface hydrophobicity. The early chapters focus on
synthesising new hydrophobic surfaces, and chapter 2 starts this by detailing the aerosol assisted
chemical vapour deposition (AACVD) of polymers, in which highly rough and water-repellent
Chapter 1 Introduction
63
surfaces are deposited in a one-step process. The hybrid CVD and functionalisation of silica
microparticles is covered in Chapter 3; this is a two-step deposition in which rough surfaces are
subsequently functionalised to render them extremely hydrophobic. Chapter 4 deals with the AACVD
of copper and copper oxide films, these are flat uniform coatings that can be roughened and
functionalised in post-treatments. The bacterial adhesion to superhydrophobic surfaces is discussed in
Chapter 5, with potential future developments in anti-microbial surface design identified. Chapter 6
covers the dynamic behaviour of water when interacting with a surface, which also leads to a new
definition of superhydrophobicity through water bouncing. The design of a device to separate mixtures
of oil and water is the last experimental chapter (Chapter 7). Chapter 8 concludes the main points
addressed in the thesis.
1.9 References
1. B. D’Urso and J. T. Simpson, Appl. Phys. Lett., 2007, 90, 044102.
2. X. Zhang, F. Shi, J. Niu, Y. Jiang and Z. Wang, J. Mater. Chem., 2008, 18, 621.
3. X. Li, D. Reinhoudt and M. Crego-Calama, Chem. Soc. Rev., 2007, 36, 1350.
4. G. McHale, N. J. Shirtcliffe and M. I. Newton, Langmuir, 2004, 20, 10146.
5. M. L. Ma and R. M. Hill, Curr. Opin. Colloid Interface Sci., 2006, 11, 193.
6. W. Att, N. Hori, F. Iwasa, M. Yamada, T. Ueno and T. Ogawa, Biomaterials, 2009, 30, 4268.
7. Z. Cui, L. Yin, Q. Wanga, J. Ding and Q. Chen, J. Colloid Interface Sci., 2009, 337, 531.
8. W. Barthlott and C. Neinhuis, Planta, 1997, 202, 1.
9. Y. Cheng and D. E. Rodak, Appl. Phys. Lett., 2005, 86, 144101.
10. Z. Burton and B. Bhushan, Ultramicroscopy, 2006, 106, 709.
11. B. Bhushan, Y. C. Jung, Prog. Mater. Sci., 2011, 56, 1–108.
12. C. Neinhuis and W. Barthlott, Ann. Bot., 1997, 79, 667.
13. X. Gao and L. Jiang, Nature, 2004, 432, 36.
14. M. Sun, G. S. Watson, Y. Zheng, J. A. Watson and A. Liang, J. Exp. Biol., 2009, 212, 3148.
15. Y. Zheng, X. Gao and L. Jiang, Soft Matter, 2007, 3, 178.
16. S. Lee and T. H. Kwon, Nanotechnology, 2006, 17, 3189.
17. R. N. Wenzel, Ind. Eng. Chem., 1936, 28, 988.
18. A. B. D. Cassie and S. Baxter, Trans. Faraday Soc., 1944, 40, 546.
19. V. Rico, P. Romero, J. L. Hueso, J. P. Espinós and A. R. González-Elipe, Catal. Today, 2009, 143, 347.
20. A. B. D. Cassie, Discuss. Faraday Soc., 1948, 3, 11.
21. J. Kim, H. Sugimura and O. Takai, Vacuum, 2002, 66, 379.
22. A. Marmur, Langmuir, 2003, 19, 8343.
23. D. Quéré and M. Reyssat, Phil. Trans. R. Soc. A, 2008, 366, 1539.
24. P. Roach, N. J. Shirtcliffe and M. I. Newton, Soft Matter, 2008, 4, 224.
25. A. M. Peters, C. Pirat, M. Sbragaglia, B. M. Borkent, M. Wessling, D. Lohse and R. G. H. Lammertink,
Eur. Phys. J. E, 2009, 29, 391.
26. S. M. Lee, C. Y. Park, S. Bae, J. S. Go, B. Shin and J. S. Ko, Jpn. J. Appl. Phys., 2009, 48, 095504.

Chapter 1 Introduction
64
27. J. Liu, X. Feng, G. Wang and S. Yu, J. Phys. Condens. Matter, 2007, 19, 356002.
28. W. Choi, A. Tuteja, J. M. Mabry, R. E. Cohen and G. H. McKinley, J. Colloid Interface Sci., 2009, 339,
208.
29. S. A. Kulinich and M. Farzaneh, Appl. Surface Sci., 2009, 255, 4056.
30. F. Chang, S. Hong, Y. Sheng and H. Tsao, Appl. Phys. Lett., 2009, 95, 064102.
31. S. Wang and L. Jiang, Adv. Mater., 2007, 19, 3423.
32. G. J. Toes, K. W. van Muiswinkel, W. van Oeveren, A. J. H. Suurmeijer, W. Timens, I. Stokroos and J. J.
A. M. van den Dungen, Biomaterials, 2002, 23, 255.
33. A. M. Almanza-Workman, S. Raghavan, S. Petrovic, B. Gogoi, P. Deymier, D. J. Monk and R. Roop, Thin
Solid Films, 2003, 423, 77.
34. E. L. Decker and S. Garoff, Langmuir, 1997, 13, 6321.
35. K. Koch, B Bhushan, Y. C. Jung and W. Barthlott, Soft Matter, 2009, 5, 1386.
36. E. M. Blockhuis, Y. Shilkrot and B. Widom, Mol. Phys., 1995, 86, 891.
37. W. Wu, X. Wang, X. Liu and F. Zhou, Appl. Mater. Interfaces, 2009, 1, 1656.
38. Y. Akamatsu, K. Makita, H. Inaba and T. Minami, Thin Solid Films, 2001, 389, 138.
39. M. Mostefa, Y. Auriac, M. E. R. Shanahan, J. Bressan and A. Meslif, Int. J. Adhes. Adhes., 2000, 20, 257.
40. J. Bico, C. Marzolin and D. Quere, Europhys. Lett., 1999, 47, 220.
41. A. Nakajima, K. Abe, K. Hashimoto and T. Watanabe, Thin Solid Films, 2000, 376, 140.
42. J. Lu, Y. Yu, J. Zhou, L. Song, X. Hub and A. Larbot, Appl. Surface Sci., 2009, 255, 9092.
43. S. R. Coulson, I. Woodward, J. P. S. Badyal, S. A. Brewer and C. Willis, J. Phys. Chem. A, 2000, 104,
8836.
44. E. Bormashenko, V. Goldshtein, R. Barayev, T. Stein, G. Whyman, R. Pogreb, Z. Barkay and D. Aurbach,
Polym. Adv. Technol., 2009, 20, 650.
45. A. Milella, R. Di Mundo, F. Palumbo, P. Favia, F. Fracassi and R. d’Agostino, Plasma Processes Polym.,
2009, 6, 460.
46. W. Song, D. D. Veiga, C. A. Custdio and J. F. Mano, Adv. Mater., 2009, 21, 1830.
47. J. Li, J. Fu, Y. Cong, Y. Wu, L. Xue and Y. Han, Appl. Surface Sci., 2006, 252, 2229.
48. J. Yang, Z. Zhang, X. Men and X. Xu, J. Macromol. Sci. Part A, 2009, 46, 997.
49. I. S. Bayer, A. Steele, P. J. Martorana, E. Loth and L. Miller, Appl. Phys. Lett., 2009, 94, 163902.
50. L. Yan, K. Wang and L. Ye, J. Mater. Sci. Lett., 2003, 22, 1713.
51. S. Shibuichi, T. Onda, N. Satoh and K. Tsujii, J. Phys. Chem., 1996, 100, 19512.
52. R. Mohammadi, J. Wassink and A. Amirfazli, Langmuir, 2004, 20, 9657.
53. H. Yan, H. Shiga, E. Ito, T. Nakagaki, S. Takagi, T. Ueda and K. Tsujii, Colloids Surf., 2006, 284, 490.
54. H. Yan, K. Kurogi, H. Mayama and K. Tsujii, Angew. Chem., 2005, 117, 3519; Angew. Chem. Int. Ed.,
2005, 44, 3453.
55. R. Wang, L. Cong and M. Kido, Appl. Surface Sci., 2002, 191, 74.
56. Z. Guo, W. Liu and B. Su, Appl. Phys. Lett., 2008, 92, 063104.
57. M. Jin, X. Feng, J. Xi, J. Zhai, K. Cho, L. Feng and L. Jiang, Macromol. Rapid Commun., 2005, 26, 1805.
58. F. Mumm, A. T. J. van Helvoort and P. Sikorski, ACS Nano, 2009, 3, 2647.
59. Z. Kang, Q. Ye, J. Sang and Y. Li, J. Mater. Process. Technol., 2009, 209, 4543.

Chapter 1 Introduction
65
60. W. Wu, X. Wang, X. Liu and F. Zhou, Appl. Mater. Interfaces, 2009, 1, 1656.
61. M. Qu, G. Zhao, Q. Wang, X. Cao and J. Zhang, Nanotechnology, 2008, 19, 055707.
62. B. Xu and Z. Cai, Appl. Surface Sci., 2008, 254, 5899.
63. D. Tian, Q. Chen, F. Nie, J. Xu, Y. Song and L. Jiang, Adv. Mater., 2009, 21, 3744.
64. Q. M. Pan, M. Wang and H. B. Wang, Appl. Surface Sci., 2008, 254, 6002.
65. Q. M. Pan and M. Wang, ACS Appl. Mater. Interfaces, 2009, 1, 420.
66. Y. Ofir, B. Samanta, P. Arumugam and V. M. Rotello, Adv. Mater., 2007, 19, 4075.
67. F. Zhang, L. Zhao, H. Chen, S. Xu, D. G. Evans and X. Duan, Angew. Chem., 2008, 120, 2500; Angew.
Chem. Int. Ed., 2008, 47, 2466.
68. Z. Yuan, H. Chen, C. Li, L. Huang, X. Fu, D. Zhao and J. Tang, Appl. Surface Sci., 2009, 255, 9493.
69. S. Iijima, Nature, 1991, 354, 56.
70. M. Paradise and T. Goswami, Mater. Des., 2007, 28, 1477.
71. S. J. Pastine, D. Okawa, B. Kessler, M. Rolandi, M. Llorente, A. Zettl and J. M. J. Frchet, J. Am. Chem.
Soc., 2008, 130, 4238.
72. C. T. Wirth, S. Hofmann and J. Robertson, Diamond Relat. Mater., 2008, 17, 1518.
73. J. S. Lee, J. Ryu and C. B. Park, Soft Matter, 2009, 5, 2717.
74. M. S. Dresselhaus, G. Dresselhaus, J. C. Charlier and E. Hernandez, Philos. Trans. R. Soc. A, 2004, 362,
2065.
75. Z. Wang, N. Koratkara, L. Ci and P. M. Ajayan, Appl. Phys. Lett., 2007, 90, 143117.
76. L. Zhang and D. E. Resasco, Langmuir, 2009, 25, 4792.
77. M. Shakerzadeh, H. E. Teo, C. Tan and B. K. Tay, Diamond Relat. Mater., 2009, 18, 1235.
78. J. Laskowski and J. A. Kitchener, J. Colloid Interface Sci., 1969, 29, 670.
79. Q. Wei, Y. Wang, Z. Nie, C. Yu, Q. Li, J. Zou and C. Li, Microporous Mesoporous Mater., 2008, 111, 97.
80. X. Liu and J. He, Langmuir, 2009, 25, 11822.
81. Q. F. Xu, J. N. Wang, I. H. Smith and K. D. Sanderson, J. Mater. Chem., 2009, 19, 655.
82. T. Saison, C. Peroz, V. Chauveau, S. Berthier, E. Sondergard and H. Arribart, Bioinspiration Biomimetics,
2008, 3, 046004.
83. Q. F. Xua and J. N. Wang, New J. Chem., 2009, 33, 734.
84. N. Auner and J. Weis, Organosilicon Chemistry II: From Molecules to Materials, Wiley, New York, 1996,
p. 761.
85. M. Manca, A. Cannavale, L. De Marco, A. S. Aricò, R. Cingolani and G. Gigli, Langmuir, 2009, 25, 6357.
86. C. Liao, C. Wang, H. Lin, H. Chou and F. Chang, Langmuir, 2009, 25, 3359.
87. P. N. Manoudis, A. Tsakalof, I. Karapanagiotis, I. Zuburtikudis and C. Panayiotou, Surf. Coat. Technol.,
2009, 203, 1322.
88. Z. Qian, Z. Zhang, L. Song and H. Liu, J. Mater. Chem., 2009, 19, 1297.
89. Z. Cui, L. Yin, Q. Wanga, J. Ding and Q. Chen, J. Colloid Interface Sci., 2009, 337, 531.
90. G. Y. Bae, B. G. Min, Y. G. Jeong, S. C. Lee, J. H. Jang and G. H. Koo, J. Colloid Interface Sci., 2009,
337, 170.
91. R. V. Lakshmi and B. J. Basu, J. Colloid Interface Sci., 2009, 339, 454.
92. K. Chang, Y. Chen, H. Chen, Surf. Coat. Tech., 2008, 202, 3822.

Chapter 1 Introduction
66
93. J. J. Niu and J. N. Wang, J. Phys. Chem. B, 2009, 113, 2909.
94. B. Liu, Y. He, Y. Fan and X. Wang, Macromol. Rapid Commun., 2006, 27, 1859.
95. J. Feng, M. Huang and X. Qian, Macromol. Mater. Eng., 2009, 294, 295.
96. W. Ting, C. Chen, S. A. Dai, S. Suen, I. Yang, Y. Liu, F. M. C. Chenad and R. Jeng, J. Mater. Chem.,
2009, 19, 4819.
97. S. J. Hwang, D. J. Oh, P. Gu Jung, S. M. Lee, J. S. Go, J. Kim, K. Hwang and J. S. Ko, J. Micromech.
Microeng., 2009, 19, 095010.
98. T. Yao, C. Wang, Q. Lin, X. Li, X. Chen, J Wu, J. Zhang, K. Yu and B. Yang, Nanotechnology, 2009, 20,
065304.
99. Y. Miyauchi, B. Ding and S. Shiratori, Nanotechnology, 2006, 17, 5151.
100. D. Reneker and I. Chun, Nanotechnology, 1996, 7, 216.
101. D. Li and Y. N. Xia Y, Nano. Lett., 2004, 4, 933.
102. H. Q. Liu and Y. L. Hsieh, J. Polym. Sci. Part B, 2002, 40, 2119.
103. Y. Chen and H. Kim, Appl. Surface Sci., 2009, 255, 7073.
104. T. Ogawa, B. Ding, Y. Sone and S. Shiratori, Nanotechnology, 2007, 18, 165607.
105. R. Gordon, J. Non-Cryst. Solids., 1997, 218, 81.
106. S. O’Brien, M. G. Nolan, M. Çopuroglu, J. A. Hamilton, I. Povey, l. Pereira, R. Martins, E. Fortunato and
M. Pemble, Thin Solid Films, 2010, 518, 4515.
107. G. Shi, T. Franzke, W. Xia, M. D. Sanchez and M. Muhler, Chem. Vap. Deposition, 2011, 17, 162.
108. N. Licausi, S. Rao and I. Bhat, J. Electron. Mater., 2011, 40, 1668.
109. V. Santucci, F. Maury and F. Senocq, Thin Solid Films, 2010, 518, 1675.
110. Z. Wang, M. Shoji and H. Ogata, Appl. Surf. Sci., 2011, 257, 9082.
111. S. Wang, Y. Li, X. Fei, M. Sun, C. Zhang, Y. Li, Q. Yang and X. Hong, J. Colloid Interface Sci., 2011,
359, 380.
112. Z. Guo, W. Liu and B. Su, J. Colloid Interface Sci., 2011, 353, 335.
113. S. A. Miller, V. Y. Young and C. R. Martin, J. Am. Chem. Soc., 2001, 123, 12335.
114. T. Kyotani, L. Tsai and A. Tomita, Chem. Mater., 1995, 7, 1427.
115. D. Mattia, M. P. Rossi, B. M. Kim, G. Korneva, H. H. Bau and Y. Gogotsi, J. Phys. Chem. B, 2006, 110,
9850.
116. Y. C. Hong, D. H. Shin and H. S. Uhm, Surf. Coat. Technol., 2007, 201, 5025.
117. M. A. Nilsson, R. J. Daniello and J. P. Rothstein, J. Phys. D: Appl. Phys., 2010, 43, 045301.
118. J. Wang, F. Liu, H. Chen and D. Chen, Appl. Phys. Lett., 2009, 95, 084104.
119. D. J. Balazs, C. Hollenstein and H. J. Mathieu, Plasma Processes Polym., 2005, 2, 104.
120. S. H. Yang, C. Liu, W. Hsu and H. Chen, Surf. Coat. Technol., 2009, 203, 1379.
121. S. Gupta, A. C. Arjunan, S. Deshpande, S. Seal, D. Singh and R. K. Singh, Thin Solid Films, 2009, 517,
4555.
122. Y. Wu, M. Kouno, N. Saito, F. A. Nae, Y. Inoue and O. Takai, Thin Solid Films, 2007, 515, 4203.
123. M. C. Kim and C.-P. Klages, Surf. Coat. Technol., 2009, 204, 428.
124. N. D. Boscher, C. J. Carmalt and I. P. Parkin, J. Mater. Chem., 2006, 16, 122.
125. N. D. Boscher, C. J. Carmalt and I. P. Parkin, Chem. Vap. Deposition, 2006, 12, 54.

Chapter 1 Introduction
67
126. N. D. Boscher, C. S. Blackman, C. J. Carmalt, I. P. Parkin and A. G. Prieto, Appl. Surface Sci., 2007, 253,
6041.
127. N. D. Boscher, C. J. Carmalt and I. P. Parkin, Eur. J. Inorg. Chem., 2006, 1255.
128. N. D. Boscher, C. J. Carmalt, R. G. Palgrave, J. J. Gil-Tomas and I. P. Parkin, Chem. Vap. Deposition,
2006, 12, 692.
129. Y. Elkasabi, H. Nandivada, H. Chen, S. Bhaskar, J. D’Arcy, L. Bondarenko and J. Lahann, Chem. Vap.
Deposition, 2009, 15, 142.
130. T. Minami, H. Mayama and K. Tsujii, J. Phys. Chem. B, 2008, 112, 14620.
131. C. Guo, L. Feng, J. Zhai, G. Wang, Y. Song and L. Jiang and D. Zhu, Chem. Phys. Chem., 2004, 5, 750.
132. A. Solga, Z. Cerman, B. F. Striffler, M. Spaeth and W. Barthlott, Bioinspiration Biomimetics, 2007, 2,
S126.
133. J. Fresnais, J. P. Chapel and F. Poncin-Epaillard, Surf. Coat. Technol., 2006, 200, 5296.
134. A. Nakajima, J. Ceram. Soc. Jpn., 2004, 112, 533.
135. http://www.saint-gobain-sekurit.com/EN/?nav1=PR&id=360. (Date accessed: 31/08/2011)
136. http://www.opticalcoatings.com/processes/hydrophobic.html. (Date accessed: 31/08/2011)
137. http://www.diamonfusion.com/en/products/applications.aspx. (Date accessed: 31/08/2011)
138. D. P. Bakker, F. M. Huijs, J. de Vries, J. W. Klijnstra, H. J. Busscher and H. C. van der Mei, Colloids Surf.
B, 2003, 32, 179.
139. http://www.auroramarine.com/aurora/catalog/01250/. (Date accessed: 31/08/2011)
140. http://www.nanoprotect.co.uk/nanofor-car.html. (Date accessed: 31/08/2011)
141. http://www.rainx.co.uk/. (Date accessed: 31/08/2011)
142. http://www.aquapel.com/. (Date accessed: 31/08/2011)
143. http://www.mayerandmayer.com/more_info.asp?current_id=84. (Date accessed: 31/08/2011)
144. X. H. Chen, G. B. Yang, L. H. Kong, D. Dong, L. G Yu, J. M. Chen and P. Y. Zhang, Cryst. Growth Des.,
2009, 9, 2656.
145. H. Yang and Y. Deng, J. Colloid. Interface Sci., 2008, 325, 588.
146. S. C. Cho, Y. C. Hong, S. G. Cho, Y. Y. Ji, C. S. Han and H. S. Uhm, Curr. Appl. Phys., 2009, 9, 1223.
147. B. Tomšič, B. Simončič, B. Orel, L. Černe, P. F. Tavčer, M. Zorko, I. Jerman, A. Vilčnik and J. Kovac, J.
Sol-Gel Sci., Technol. 2008, 47, 44.
148. http://www.velouk.com/. (Date accessed: 31/08/2011)
149. http://www.salclear.com/DWR.htm. (Date accessed: 31/08/2011)
150. N. J. Shirtcliffe, G. McHale, M. I. Newton and Y. Zhang, App. Mater. Inter., 2009, 1, 1316.
151. Y. Zhou, M. Li, B. Su and Q. Lu, J. Mater. Chem., 2009, 19, 3301.
152. M. S. Żbik, J. Du, R. A. Pushkarova and R. St. C. Smart, J. Colloid Interface Sci., 2009, 336, 616.
153. T. Sun, H. Tan, D. Han, Q. Fu and L. Jiang, Small, 2005, 1, 959.
154. T. Saitoh, A. Sekino and M. Hiraide, Anal. Chim. Acta, 2005, 536, 179.
155. J. Yang, J. C. Chen, K. Huang and J. A. Yeh, J. Microelectromech. Syst., 2006, 15, 697.
156. P. Bayiati, A. Tserepi, P. S. Petrou, K. Misiakos, S. E. Kakabakos, E. Gogolides and C. Cardinaud,
Microelectron. Eng., 2007, 84, 1677.

Chapter 1 Introduction
68
157. Y. Zhang, S. Wei, F. Liu, Y. Du, S. Liu, Y. Ji, T. Yokoi, T. Tatsumi and F. Xiao, Nano Today, 2009, 4,
135.
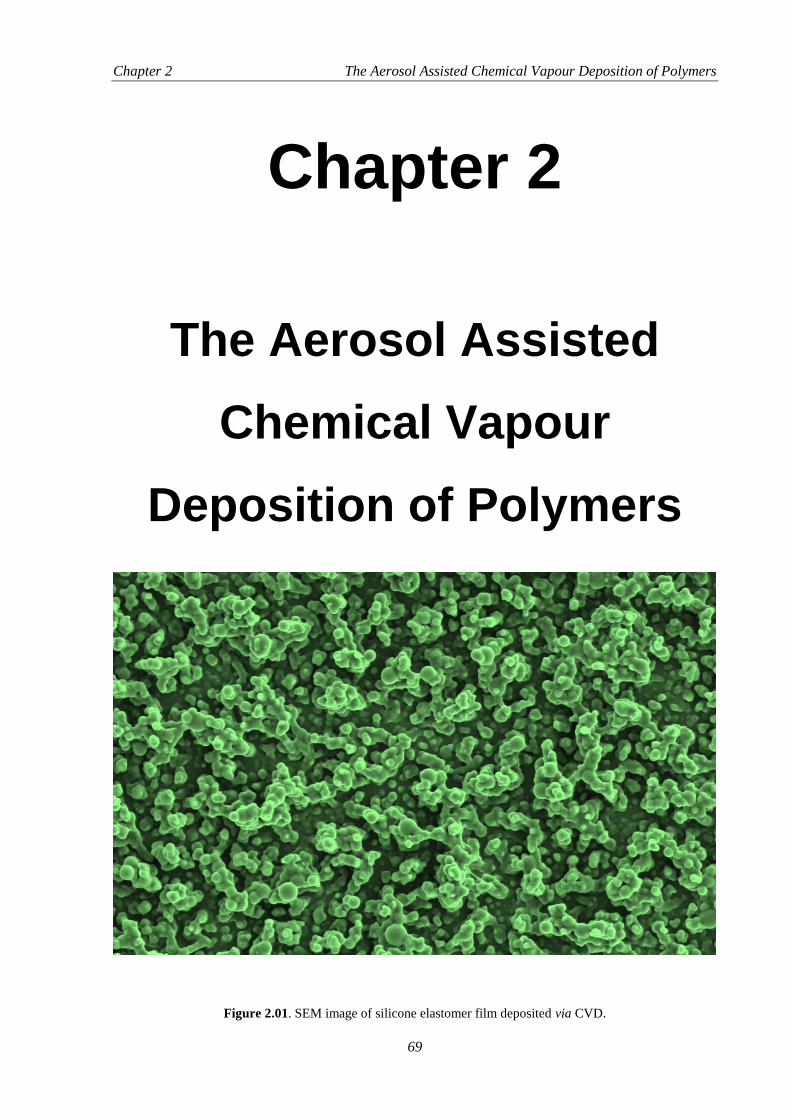
Chapter 2 The Aerosol Assisted Chemical Vapour Deposition of Polymers
69
Chapter 2
The Aerosol Assisted
Chemical Vapour
Deposition of Polymers
Figure 2.01. SEM image of silicone elastomer film deposited via CVD.

Chapter 2 The Aerosol Assisted Chemical Vapour Deposition of Polymers
70
2. The Aerosol Assisted Chemical Vapour Deposition of Polymers
2.1. Introduction
Polymers are one of the most widely implemented materials used to construct hydrophobic surfaces1.
Polymers are large molecular chains, formed from repeating structural units. The species able to form
polymeric molecules are wide and varied2, and the majority of materials used in hydrophobic surface
generation are based on organic or silicone units3-6
. These types of polymer materials are highly
suitable for the assembly of superhydrophobic surfaces as the two main features required in a
superhydrophobic surface can easily be generated:
Low Surface Energy – Repeating units of polymer molecules provide a regular chemical
structure which interacts with water in a similar manner along the whole length of the polymer
chain. Hydrophobic units can provide a uniformly low energy surface, with no areas of
attraction across the polymer surface.7
High Surface Roughness – Many polymers are flexible and/or mouldable, and can be
manipulated into shape and permanently fixed into position. Highly rough microstructures can
easily be produced by means of very basic etching or moulding techniques.8
Low energy polymers such as PTFE9, polyethylene
10 and PDMS
11 exhibit a high-level of surface
hydrophobicity, with water contact angles of 110°, 100°, and 95° achieved respectively on flat solid
surfaces of each polymer. When the inherently hydrophobic material is roughened the hydrophobicity
of the material magnified greatly12
. With the construction of surfaces wetting with a Cassie-Baxter
mechanism is easily accomplished given the ease of manipulation of the polymer materials13
.
2.1.1 Thermosoftening vs. Thermosetting Polymers
Polymers can be placed into two main groups – thermosoftening (thermoplastic/non-curing)14
and
thermosetting (curing)15
polymers. Amorphous thermosoftening polymers begin to melt when their
temperature is increased, and resolidify when cooled sufficiently. Softening of polymers in this class
occurs as the molecular chains making up the material are attracted by relatively weak forces, which
are interrupted by heating and so melting occurs (Figure 2.02).14
Thermosetting polymers are those
that cure irreversibly and are usually liquids prior to a curing process. The polymer chains within the
starting material contain reactive species which can be activated by heat, addition of a catalyst or
electromagnetic irradiation, in addition to other methods. Reaction of the species on the precursor
chains binds them together in a cross-linking reaction. Propagation of the cross-linking reaction
greatly increases the molecular weight throughout the material and results in solidification. This
solidification is permanent as much of the structure is interlinked with strong covalent bonds (Figure
2.02); any further heating may lead to decomposition of the material.15

Chapter 2 The Aerosol Assisted Chemical Vapour Deposition of Polymers
71
Figure 2.02. Schematic showing a representation of inter-chain bonding in thermosoftening and thermosetting
polymers. Thermosoftening polymer chains have weak attractions, mainly electrostatic, which are lessened by
high temperatures and so the polymers melt upon heating. The covalently bonded chains in thermosetting
polymers are not readily broken, and excessive heating may cause decomposition.
2.1.2 Aerosol Assisted Chemical Vapour Deposition
Aerosol assisted chemical vapour deposition (AACVD), uses solutions of precursors as starting
materials for thin films. The precursor solutions are vaporised by transforming them into an aerosol.
This can be carried out by an ultra-sonic vibration and atomiser devices.16-18
The resulting aerosol of
the precursor solution is made up of microdroplets of the starting solution small enough to be
suspended in air for a given period. The diameter of the aerosol microdroplets depends on the method
of vaporisation and solution used. For example there is an indirect relationship between the diameter
of droplet and frequency of ultrasonic aerosol generation. Once aerosols are formed they are passed
into a heater reactor, the AACVD reaction chamber.16-18
Forming solutions of CVD precursors affords many advantages over the use of the same
precursor in its pure form, especially in the case of polymers. In other CVD processes vaporisation of
precursors is carried out by heating or a reduction in pressure19
, and these methods require reactants to
have relatively high vapour pressures; with the most successful precursors existing as liquids at room
temperature. Polymers (both thermosoftening and thermosetting) consist of very large molecular units,
and so ambient vapour pressures are typically extremely low20
. This, in addition to the susceptibility of
polymers, such as PTFE, polyethylene and PDMS, toward degradation at high temperatures means
most hydrophobic polymers would be poorly suited to a vapour pressure driven precursor delivery.
The aerosol droplets of precursor solutions are able to transport the large polymer molecules to a
reaction chamber, and this negates the need for a volatile CVD precursor19
. This chapter details the
AACVD of hydrophobic polymers and explains the need for curing agents during the reactions
through a rationalisation of the deposition mechanism. The microstructure of films deposited is
analysed, with changes in hydrophobicities related back to the surface structure and type of polymer
used. Some of the deposited films are enhanced by incorporation of light activated antimicrobial
agents, in addition to routes for improving the hydrophobicity and adhesion of the deposited films.
The deposition of a hydrophilic curing polymer (melamine-formaldehyde resin) resulted in films of

Chapter 2 The Aerosol Assisted Chemical Vapour Deposition of Polymers
72
similar microstructures, giving Cassie-Baxter wetting surfaces that were hydrophobic. The work
covered in this chapter was the first reported use of polymers to form superhydrophobic surfaces.
2.2. Experimental Details
2.2.1 Materials
With the exception of Sylgard 184 Silicone Elastomer which was purchased from R. W. Greeff, NuSil
Med-4850 which was obtained from UCL Eastman Dental Institute and Dyneon FC-2120
Fluoroelastomer which was provided by Dyneon™ UK office, all chemicals used in this investigation
were purchased from Sigma-Aldrich Chemical Co; including chloroform, methylene blue, ethanol,
acetone, 4-methyl-2-pentanone (MIBK), butan-2-one, melamine, 37 wt.% formaldehyde aqueous
solution and triethanolamine.
Sylgard 184 and NuSil Med-4850 are both two-part silicone elastomers consisting of base and
curing agent, and their main components are dimethyl siloxanes. The curing process for both polymers
uses a platinum catalyst cross-linker:
With variations in the viscosity of precursor material and the base:curing agent ratios. The Dyneon
FC-2120 fluoroelastomer’s main component is a mixture of polyvinylidene fluoride and
polyhexafluoropropylene, there is also a presence of bisphenol AF. Bisphenol AF acts as a curing
agent in the presence of an acid acceptor (e.g. MgO). However the sample provided did not contain
any acid acceptor thus no curing occurred.
2.2.2 AACVD Precursor Solutions
The two components of Sylgard 184 (0.5 g) were dissolved in chloroform (50 mL) with rapid stirring
for 5 min. NuSil Med-4850 (0.50 g, two components) was also dissolved in chloroform (80 mL) with
rapid stirring for 10 min. Concentration and stirring time was chosen to ensure the highest solubility.
To prevent premature curing, the mixtures were used immediately after stirring for deposition studies.
Dyneon FC-2120 Fluoroelastomer (0.125 g) was cut into small portions with a scalpel and
placed into a ketone (MIBK, butan-2-one and acetone):ethanol mixture (19:1 ratio, 50 mL) and stirred
rapidly until the polymer completely dissolved (approximately 45 min).
2.2.2.1 Melamine Precursors
Spin/Dip-coating solution. 0.5 g of melamine and 1.28 g formaldehyde solution were added to 50 ml
of deionised water. The mixture was adjusted to pH 8.5 using triethanolamine and stirred at 70°C.

Chapter 2 The Aerosol Assisted Chemical Vapour Deposition of Polymers
73
When the solution appeared transparent it was left stirring/heating for a further 10 min, and then the
solution was cooled and filtered. The filtered solution was subsequently used in dip-coating.
AACVD solution. 0.25 g of melamine and 0.64 g formaldehyde solution were added to 50 ml of
deionised water. The same steps were followed as above (spin/dip-coating solution). The filtered
solution was subsequently used in the AACVD deposition.
2.2.3 Dip-coating/Spin-coating of Polymer Solutions
Concentrated solutions of each polymer were prepared to dip-coat substrates. One volume equivalent
of Sylgard 184 was diluted with two equivalents of chloroform. NuSil Med-4850 dip-coat solutions
were made from a 1:3 polymer:chloroform mixture. Solutions of Dyneon FC-2120 were prepared by
dissolving one mass equivalent of polymer into four equivalents of a MIBK: ethanol mixture (19:1)
(solvent mixture was determined as optimum by the polymer supplier).
Coupons of SiO2 coated barrier glass (dimensions: 45 x 45 x 5 mm; barrier thickness 50 nm)
supplied by Pilkington NSG were used to form dip-coated films of polymers. The glass portions were
submerged in a solvent: polymer mixture and withdrawn at an arbitrary rate (ca. 0.5 mm/s). The
coated substrates were laid horizontally in a vacuum desiccator kept at room temperature and left to
cure for 48 hours. The upward-facing side of the coated glass was subsequently used in any further
analysis.
2.2.3.1 Dip-coating/Spin-coating of Melamine-formaldehyde Resin
VWR cut edged glass microscope slides (dimensions: 76 x 25 x 1 mm) were used for spin/dip-coating.
The slides to be spin-coated were placed on a centrifuge stage (NE-010G Clifton Centrifuge), a film of
pre-polymer solution was added over the whole surface of the slide. The centrifuge was then spun for
5 seconds at 2800 rpm. The spin-coating process was repeated 5 times on each slide to achieve a
consistent film. Dip-coated slides were prepared by immersing the pre-polymer solution and
withdrawing at a constant speed of 0.2 cm/s. After full withdrawal the slides were held horizontally
until the excess liquid had flowed down the glass. Both sets of slides were then cured at 250°C for 1 h.
A third evaporation method for coating the microscope slides was also carried out, this
involved coating a horizontal microscope slide in a film of the pre-polymer solution.
2.2.4 Spray-Coating
Only Sylgard 184 was used in spray coating experiments. The depositions were carried out on SiO2
coated barrier glass (dimensions: 95 x 130 x 5 mm). Substrate temperature was set to 300°C on a
horizontal flat carbon block heater. A spray head was passed up and down the substrate 210 mm above
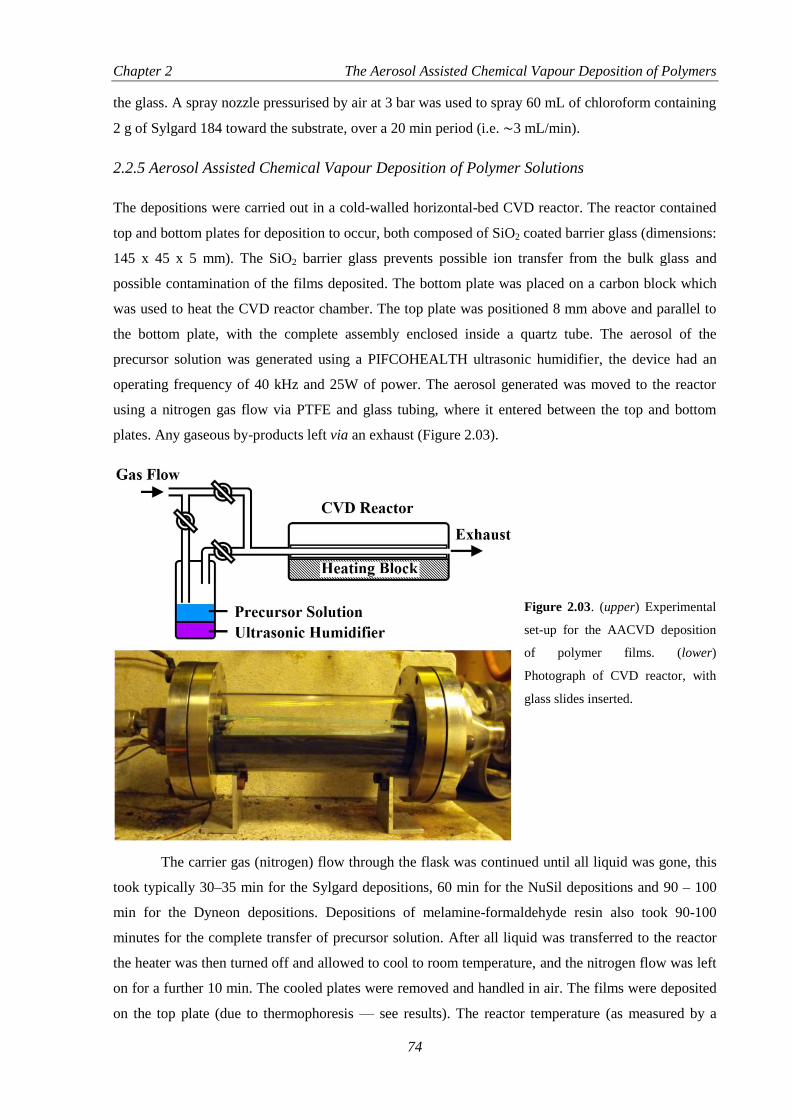
Chapter 2 The Aerosol Assisted Chemical Vapour Deposition of Polymers
74
the glass. A spray nozzle pressurised by air at 3 bar was used to spray 60 mL of chloroform containing
2 g of Sylgard 184 toward the substrate, over a 20 min period (i.e. ∼3 mL/min).
2.2.5 Aerosol Assisted Chemical Vapour Deposition of Polymer Solutions
The depositions were carried out in a cold-walled horizontal-bed CVD reactor. The reactor contained
top and bottom plates for deposition to occur, both composed of SiO2 coated barrier glass (dimensions:
145 x 45 x 5 mm). The SiO2 barrier glass prevents possible ion transfer from the bulk glass and
possible contamination of the films deposited. The bottom plate was placed on a carbon block which
was used to heat the CVD reactor chamber. The top plate was positioned 8 mm above and parallel to
the bottom plate, with the complete assembly enclosed inside a quartz tube. The aerosol of the
precursor solution was generated using a PIFCOHEALTH ultrasonic humidifier, the device had an
operating frequency of 40 kHz and 25W of power. The aerosol generated was moved to the reactor
using a nitrogen gas flow via PTFE and glass tubing, where it entered between the top and bottom
plates. Any gaseous by-products left via an exhaust (Figure 2.03).
Figure 2.03. (upper) Experimental
set-up for the AACVD deposition
of polymer films. (lower)
Photograph of CVD reactor, with
glass slides inserted.
The carrier gas (nitrogen) flow through the flask was continued until all liquid was gone, this
took typically 30–35 min for the Sylgard depositions, 60 min for the NuSil depositions and 90 – 100
min for the Dyneon depositions. Depositions of melamine-formaldehyde resin also took 90-100
minutes for the complete transfer of precursor solution. After all liquid was transferred to the reactor
the heater was then turned off and allowed to cool to room temperature, and the nitrogen flow was left
on for a further 10 min. The cooled plates were removed and handled in air. The films were deposited
on the top plate (due to thermophoresis — see results). The reactor temperature (as measured by a

Chapter 2 The Aerosol Assisted Chemical Vapour Deposition of Polymers
75
thermocouple in the carbon heater block) was varied between 90°C and 420°C to find the optimum
deposition temperatures.
2.2.5.1 Modifications and Enhancements of AACVD Process
The following treatments were only carried out on the Sylgard 184 elastomer.
Dip-coating of CVD Substrates Prior to Deposition. Silica glass, used in the AACVD process, was
dip-coated in a similar fashion as discussed in Section 2.2.3. The coated glass was then used in the
AACVD process as a top-plate substrate. All other AACVD parameters were kept the same.
Swell Encapsulation of Methylene Blue. Swell encapsulation of methylene blue was carried out by
submerging the films, still attached to glass, in a solution of methylene blue (8 mM) dissolved in an
equal part water-acetone mixture (v/v) for 2 hours. The films were subsequently removed from the
solution rinsed well with water and left to dry in air for 24 hours.
Incorporation of Gold Nanoparticles. The AACVD deposition of gold nanoparticles was carried out
prior to that of Sylgard elastomer. Precursor solutions of gold nanoparticles were synthesised using a
Brust two-phase chemical reduction method carried out in toluene. Two solutions were prepared;
HAuCl4.3H2O (99%, 0.17 g) dissolved in distilled water (15 mL) and tetraoctylammonium bromide
(TOAB) (99%, 1.04 g) dissolved in toluene (40 mL). These two solutions were stirred together. A
NaBH4 (0.19 g) solution in distilled water (25 mL) was added drop-wise over a 30 min period with
rapid stirring; yielding a dark red organic layer. The dark red organic layer was separated and washed
with dilute aqueous H2SO4 and water, dried using Na2SO4 and diluted to 100 mL with toluene. Each
solution was prepared the same day it was used for AACVD deposition.
The gold nanoparticles were deposited using the same AACVD method as described in this
section onto silica barrier glass. The volume of precursor solution used was 30 mL and a deposition
time of 55 min was typical. The flow rate of 1.0 L/min was used. The deposition of nanoparticles
always occurred on the top plate; the substrate temperature was kept constant at 450ºC. The deposition
of Sylgard was carried out immediately after the deposition of nanoparticles without cooling the
reactor to room temperature.
Atomiser Assisted Deposition of Sylgard 184. Solutions of silicone elastomer were made using 400
mL of Chloroform and varying amounts of Sylgard 184 (10 g, 20 g and 30 g). Upon addition of the
elastomer to chloroform, the mixture was stirred vigorously for 5 minutes and used immediately for
deposition. The depositions were carried out in the same CVD reactor, using the same glass substrates.
The precursor aerosol was generated using a Model 2076 Constant Output Atomiser, in which sub-
micrometre aerosols were used to atomise the solution. Compressed air was expanded through an
orifice to form a high velocity jet. The solvent was drawn into the atomising section of the apparatus

Chapter 2 The Aerosol Assisted Chemical Vapour Deposition of Polymers
76
where it was atomised by the jet. The aerosol generated was moved to the reactor using the air flow
generated from the atomiser via PTFE and steel tubing, where it entered between the top and bottom
plates. The reactor waste gas left via an exhaust.
The air flow carried the vapour from the flask for 1 hour once the reactor reached the
deposition temperature. The heater was then turned off after this period and allowed to cool to room
temperature. The cooled plates were removed and handled in air, with the top plate having the
deposited film. The reactor temperature, as measured by a thermocouple in the carbon heater block,
was maintained at 360°C.
2.2.6 Film Characterisation
The films were analysed as deposited onto the SiO2 barrier glass substrate unless otherwise stated.
Subsections (ca 1 x 1 cm) of the samples were gold-sputtered and analysed using field emission
scanning electron microscopy (SEM) using a Jeol JSM-6301F operating at 5 kV. Energy dispersive X-
ray (EDX) analyses of carbon-sputtered samples were measured using the same machine. Powder X-
ray diffraction (XRD) patterns were measured on a Brucker D8 discovery instrument using
monochromated Cu Kα radiation (λ = 1.5406 Å) in the reflection mode. Atomic force microscopy
(AFM) measurements were performed in air on a Veeco Dimension 3100 in a contact operating mode
(cantilever model; Veeco MSNL-10). Infrared (IR) spectroscopy was employed over the range of
2200–4000 cm−1
using a Perkin Elmer FT-IR (Fourier transform infrared) Spectrum RX1 instrument.
Raman measurements were made using a Renishaw 1000 spectrometer which used a 632.8 nm laser.
UV–visible absorption spectra were taken using a Perkin Elmer Lambda 25 UV/VIS Spectrometer
single beam instrument over a range of 300–1000 nm. Elemental analysis experiments were carried
out using an EA-440 horizontal load analyser supplied by Exeter Analytical. For analysis the dip/spin-
coated samples were easily delaminated and the AACVD films scraped off the glass substrates using a
scalpel. Adherence tests were carried out by applying Scotch Home and Office masking tape to the
deposited films with even pressure applied by hand, followed by removal in one swift motion. Any
difference in the film appearance was noted. Scratch tests were also carried out by observing the
action of a metal scalpel being dragged across a surface.
2.2.7 Surface Hydrophobicity Measurements
Water contact angle measurements were carried out using an FTA-1000 drop shape instrument; 3 μL
water droplets were used to minimise any gravitational effects. The water droplet images were
analysed using a digital protractor to obtain the water contact angles on the surface. A range of points
across the substrates were tested, with 12 measurements made on each film. Water slip angles were
also measured, noting the angle to the horizontal at which 3 μL water droplets moved on the surface.
Many positions across the substrates were tested.

Chapter 2 The Aerosol Assisted Chemical Vapour Deposition of Polymers
77
2.3. Results and Discussion
2.3.1 The Deposition of Thermosoftening Polymers
The following section details the dip-coating and AACVD of the ketone soluble Dyneon FC-2120
Fluoroelastomer (structure shown below, Figure 2.04).
Figure 2.04. Component molecules of
the Dyneon FC-2120 Co-polymer. Both
the C-F and C-H bonds act to lower the
surface energy by their strong repulsion
of water.
2.3.1.1 Dip-coated Films of Dyneon FC-2120 on Glass
The as-received Dyneon polymer was a solid off-white block of material. Once portions of the
polymer were dissolved, the solutions appeared clear in colour. After the dip-coating treatment, the
dried films were hazy. They did however allow approximately 75% visible light to be transmitted. The
coatings were well adhered to the glass substrate but delamination of the polymer was possible by
action with a scalpel. Images of the dip-coated surfaces (Figure 2.05) show a very flat microstructure,
with AFM measurements confirming no surface features over 40 nm in height. The flat dip-coated
fluoroelastomer surface gave hydrophobic water contact angles of 99°, with this relatively high angle
for a flat surface stemming form the presence of C-F/C-H bonds (verified by Raman measurements).
Introducing surface roughness would magnify the low energy of the elastomer and increase the water
contact angle achieved.
Figure 2.05. AFM image of a dip-coated film of Dyneon FC-2120 fluoroelastomer on glass, (a) 2D and (b) 3D.
Surface feature height confirmed as less than 40 nm by AFM measurements. Scale bar is shown. Viewing area is
25 x 25 μm.
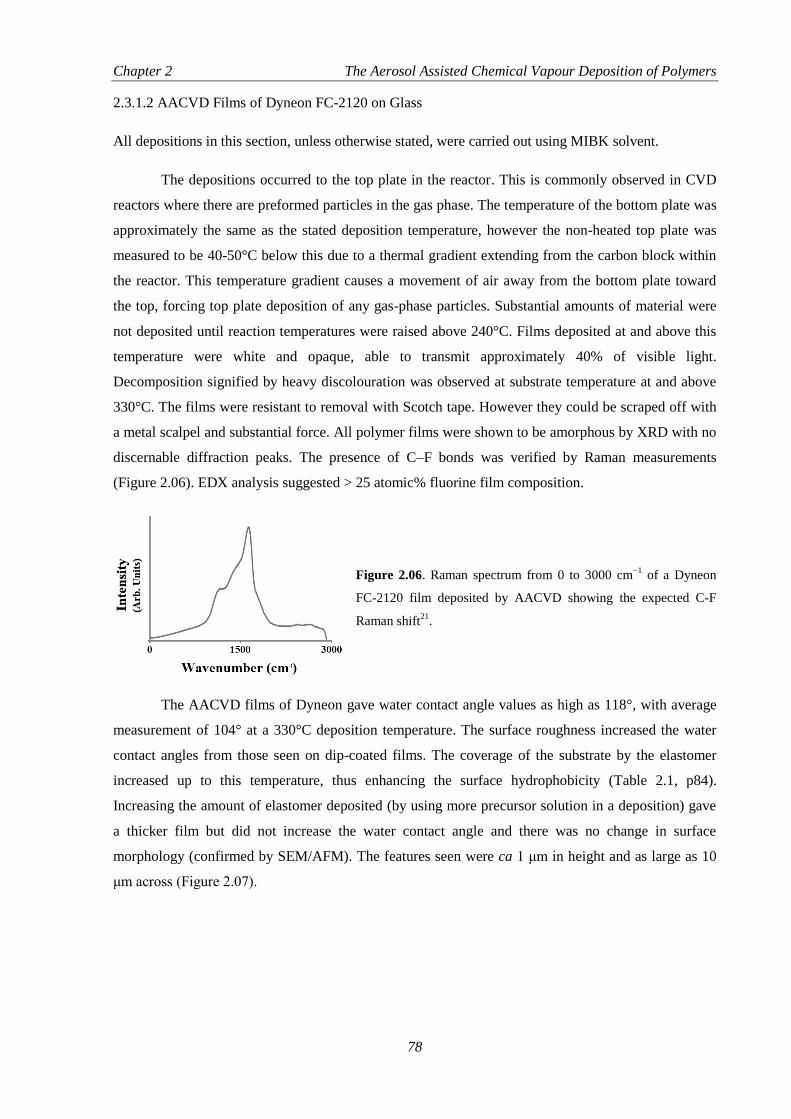
Chapter 2 The Aerosol Assisted Chemical Vapour Deposition of Polymers
78
2.3.1.2 AACVD Films of Dyneon FC-2120 on Glass
All depositions in this section, unless otherwise stated, were carried out using MIBK solvent.
The depositions occurred to the top plate in the reactor. This is commonly observed in CVD
reactors where there are preformed particles in the gas phase. The temperature of the bottom plate was
approximately the same as the stated deposition temperature, however the non-heated top plate was
measured to be 40-50°C below this due to a thermal gradient extending from the carbon block within
the reactor. This temperature gradient causes a movement of air away from the bottom plate toward
the top, forcing top plate deposition of any gas-phase particles. Substantial amounts of material were
not deposited until reaction temperatures were raised above 240°C. Films deposited at and above this
temperature were white and opaque, able to transmit approximately 40% of visible light.
Decomposition signified by heavy discolouration was observed at substrate temperature at and above
330°C. The films were resistant to removal with Scotch tape. However they could be scraped off with
a metal scalpel and substantial force. All polymer films were shown to be amorphous by XRD with no
discernable diffraction peaks. The presence of C–F bonds was verified by Raman measurements
(Figure 2.06). EDX analysis suggested > 25 atomic% fluorine film composition.
Figure 2.06. Raman spectrum from 0 to 3000 cm−1
of a Dyneon
FC-2120 film deposited by AACVD showing the expected C-F
Raman shift21
.
The AACVD films of Dyneon gave water contact angle values as high as 118°, with average
measurement of 104° at a 330°C deposition temperature. The surface roughness increased the water
contact angles from those seen on dip-coated films. The coverage of the substrate by the elastomer
increased up to this temperature, thus enhancing the surface hydrophobicity (Table 2.1, p84).
Increasing the amount of elastomer deposited (by using more precursor solution in a deposition) gave
a thicker film but did not increase the water contact angle and there was no change in surface
morphology (confirmed by SEM/AFM). The features seen were ca 1 μm in height and as large as 10
μm across (Figure 2.07).

Chapter 2 The Aerosol Assisted Chemical Vapour Deposition of Polymers
79
Figure 2.07. AFM image of Dyneon FC-2120 deposited by AACVD onto glass substrate carried out at 300°C,
(a) 2D and (b) 3D. Viewing area is 25 x 25 μm, scale bars are shown.
Dyneon FC-2120 was confirmed to be soluble in 3 ketones (acetone, butan-2-one and MIBK).
Using acetone as a carrier solvent (b.p. - 56-57°C) resulted in a very volatile aerosol, the solvent
evaporated before reaching the CVD reactor, and no deposition was observed over a range of
temperatures. The use of butan-2-one (b.p. - 80°C) did not result in any detectable change in the
surface structure compared to using MIBK (b.p. - 117-118°C) (SEM) or the observed water contact
angles. This suggests a similar mechanism for deposition while using MIBK or butan-2-one, and was
not noticeably affected by the boiling point of the solvent.
2.3.2 The Deposition of Thermosetting Polymers
The following section details the dip-coating and AACVD of two chloroform soluble silicone
polymers Sylgard 184 and NuSil Med-4850. Sylgard 184 is a two part silicone elastomer which
comprises a 10:1 ratio of silicone base: curing agent. Both parts are viscous liquids, and when
combined they cure into a rubber-like solid. The curing process is accelerated by increased
temperature. The silicone chain comprises alkylated side chains that act to repel water (Figure 2.08).
NuSil Med-4850 is also a two part silicone elastomer (1:1, silicone base: curing agent) which is also
thermally cured. The latter polymer had a more viscous pre-reactive consistency and also required a
greater amount of solvent to facilitate the formation of an aerosol.
Figure 2.08. Chemical structure of the main component used in
the silicone base portion of Sylgard 184. Chain cross-linking is
accomplished through a platinum based cure system which links
the unsaturated ends of the chains. Hydrophobic methyl side
chains repel water and lower the surface energy of the material.

Chapter 2 The Aerosol Assisted Chemical Vapour Deposition of Polymers
80
2.3.2.1 Dip-coated Films of Sylgard 184 and NuSil Med-4850 on Glass
Both silicone polymers were transparent prior to curing, with solutions of the polymers also clear. The
dip-coated films were also transparent letting more than 90% of visible light (λ = 380-760 nm) to
transmit through the films. The adhesion of the coating was similar to that observed for the Dyneon
fluoroelastomer as they were well adhered to the glass substrate. The surfaces were near featureless
with an observed microstructure similar to that seen in figure 2.05. Both flat elastomer films were
hydrophobic with water contact angles of 95° in each case, brought about by water repelling C-H
groups on the surface (verified by infra-red measurements). The 95° water contact angle was less than
the 94° - 111° expected for a surface constructed from -CH2/-CH3 groups (Section 1.2.2), due to
possible surface rearrangement of dangling C-H bonds.
2.3.2.2 AACVD Films of Sylgard 184 and NuSil Med-4850 on Glass
Aerosol assisted deposition of the Sylgard elastomer resulted in substantial deposition between 240
and 360°C, with decomposition occurring at temperatures above this temperature. Depositions of
NuSil elastomer were observed up to 420°C without discolouration of the films. The thickest films,
indicated by UV–visible spectroscopy, were observed at 360°C (Sylgard) and 420°C (NuSil) with
visible light transmission as low as 12% and 8% respectively. The opaque-white thin films were well
adhered to the substrate with the polymer material no longer having a tacky consistency as in the pre-
set form. Both film sets showed the presence of C-H bonds in the IR spectra which matched spectra
taken of dip-coated films of the appropriate polymer (Figure 2.09). EDX analysis gave a 2:1 (O:Si)
ratio for the thickest part of the film, with no presence of chlorine detected - ruling out contamination
by chloroform. Both film sets were not removed by Scotch tape and were difficult to rub-off, the films
could however be readily marked with a steel scalpel. However the highest temperature depositions
using NuSil Med-4850 were noticeably more resistant to the scalpel scratching but were still able to be
removed.
Figure 2.09. Infra-red spectrum across a
range of 3500 to 2500 cm−1
of Sylgard 184
deposited by AACVD showing the expected
C-H vibrations.

Chapter 2 The Aerosol Assisted Chemical Vapour Deposition of Polymers
81
Film morphology, analysed by SEM, showed that the films deposited over the range of
temperatures from both Sylgard and NuSil polymers consisted of agglomerates on the glass substrate.
Low temperature depositions (at and below 240°C) showed some surface roughness, which consisted
of globules with some agglomeration (Figure 2.10) which increased with temperature. Raising the
temperature above 270°C resulted in very rough surfaces made up of interlocking spheres, Figure
2.11.These spheres formed a network across the surface and contained a high degree of porosity (side-
on SEM, Figure 2.11). The size of the spheres was around 0.5–1 μm. Both film roughness and
deformation of the spheres increased as the deposition temperature was raised. AFM of the high
temperature films could not be successfully completed as intense surface roughness meant the
limitations of the instrument were met and exceeded. These factors indicate the mechanism by which
spherical particles of the polymer is deposited (Figure 2.12). The microdroplets of polymer precursor
solution enter the reactor where the solvent is evaporated leaving spheres of liquid elastomer, the
polymer curing is accelerated by the elevated temperature of the reactor and the particles begin to cure.
The spherical particles are deposited onto the top plate, a result of thermophoresis (caused by the
temperature gradient across the reactor), which forces the partially cured polymer particles toward the
top plate. The particles land on the top plate where they stack up onto of each other forming the
observed surface roughness. This mechanism was not observed with the Dyneon polymer as there was
no curing taking place and thus no formation of spherical particles.
Figure 2.10. SEM image of a Sylgard 184 film
deposited by deposited by AACVD onto glass
substrate at a 240°C substrate temperature. Scale
bar shown.

Chapter 2 The Aerosol Assisted Chemical Vapour Deposition of Polymers
82
Figure 2.11. SEM images of films deposited by AACVD using Sylgard 184 using a deposition temperature of
(A/BSide-on) 270°C, (C) 300°C and (D) 360°C, and NuSil Med-4850 deposited at (E/FSide-on) 420°C. The particle
agglomeration increased with deposition temperatures (A > C > D), with deformation of the spherical elastomer
particles also increasing (probably due to increased decomposition). The NuSil particles have a smaller average
diameter (~0.5 μm) in comparison to the Sylgard particles (~1 μm). Side-on SEM images (B/F) show the
porosity of the polymer thin films. The thickness of the highest temperature depositions for Sylgard/NuSil are
3.2/1.5 μm respectively.
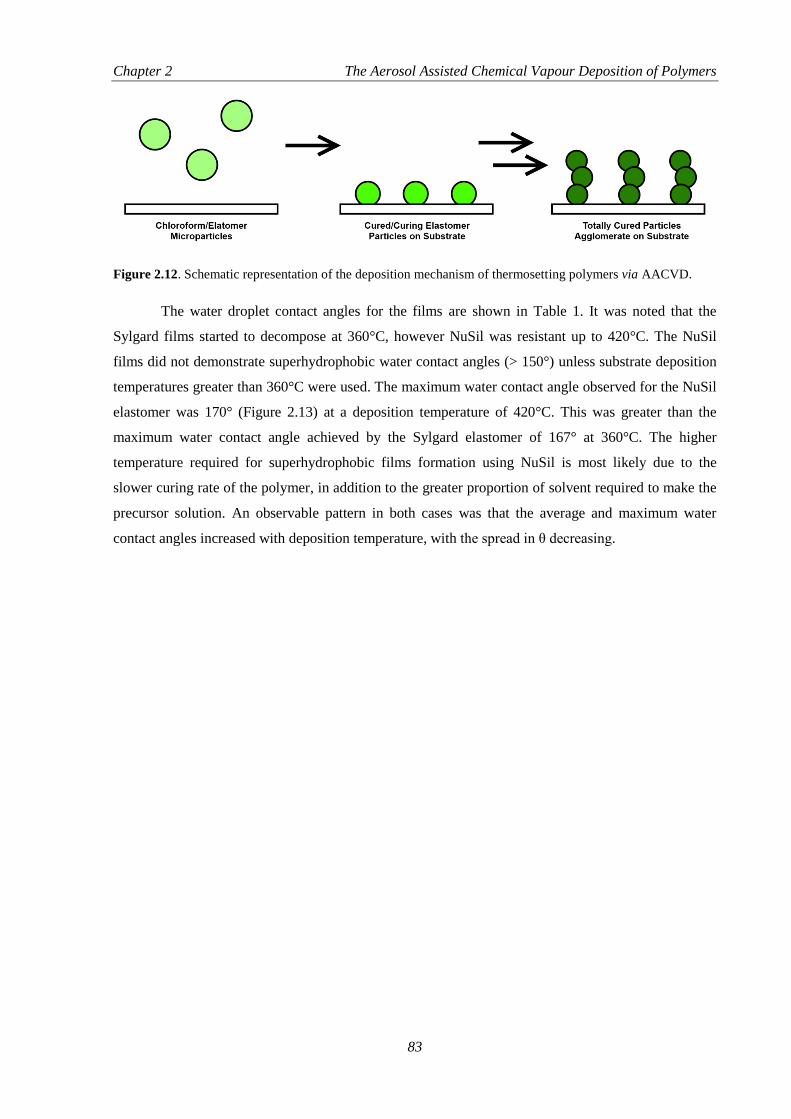
Chapter 2 The Aerosol Assisted Chemical Vapour Deposition of Polymers
83
Figure 2.12. Schematic representation of the deposition mechanism of thermosetting polymers via AACVD.
The water droplet contact angles for the films are shown in Table 1. It was noted that the
Sylgard films started to decompose at 360°C, however NuSil was resistant up to 420°C. The NuSil
films did not demonstrate superhydrophobic water contact angles (> 150°) unless substrate deposition
temperatures greater than 360°C were used. The maximum water contact angle observed for the NuSil
elastomer was 170° (Figure 2.13) at a deposition temperature of 420°C. This was greater than the
maximum water contact angle achieved by the Sylgard elastomer of 167° at 360°C. The higher
temperature required for superhydrophobic films formation using NuSil is most likely due to the
slower curing rate of the polymer, in addition to the greater proportion of solvent required to make the
precursor solution. An observable pattern in both cases was that the average and maximum water
contact angles increased with deposition temperature, with the spread in θ decreasing.

Chapter 2 The Aerosol Assisted Chemical Vapour Deposition of Polymers
84
Deposition
Method
Water Contact Angle (°)
Dyneon FC-2120 Sylgard 184 NuSil Med-4850
Average Maximum ± Average Maximum ± Average Maximum ±
Dip-Coated 99 - 0.9 95 - 0.9 95 - 0.8
AACVD
(240°C) 99 107 3.2 156 162 3.9 110 125 4.2
AACVD
(270°C) 101 110 3.3 158 165 3.6 118 133 4.8
AACVD
(300°C) 104
116 4.0 160
166 3.4 126 143 4.2
AACVD
(330°C) 104*
118* 4.8 160
167 3.0 140 156 3.9
AACVD
(360°C) - - - 160*
167* 3.0 152 160 3.4
AACVD
(390°C) - - - - - - 160
167 2.8
AACVD
(420°C) - - - - - - 162*
170* 2.7
Table 2.1. Water contact angles (at least ten separate measurements) for Dyneon FC-2120, Sylgard 184 and
NuSil Med-4850 films deposited on glass substrates by AACVD. (*) Indicates films with significant
discolouration, (–) indicates films with decomposition of the polymer. Temperatures indicated are those of the
carbon block used while the AACVD deposition was carried out. All films were deposited onto the top plate
which was measure to be ca 50°C lower. (±) Presents 95% confidence intervals using Student’s t-test
distributions)

Chapter 2 The Aerosol Assisted Chemical Vapour Deposition of Polymers
85
Figure 2.13. Images showing 10 μL water droplets on Dyneon, Sylgard and NuSil surfaces (from left to right)
deposited via AACVD 330, 360 and 420°C respectively. Images chosen represent average water contact angles
on each surface (104°, 160° and 162°).
The water droplet slip angles for the most hydrophobic NuSil deposition were recorded, the
average being 6°, with some points on the surface only requiring a tilt angle of 2° for the water droplet
to slip off. Sylgard films deposited at 360°C had water droplet slip angles averaging 9°, and a lowest
result of 5°. Both of the highest temperature depositions for Sylgard and NuSil films showed the
lowest slipping angles. The generally low slip angles indicate classical Cassie–Baxter type wetting,
analogous in properties to those reported for the Lotus effect.
2.3.2.3 Spray-coating of Sylgard 184
The spray-coating process has many of the facets of AACVD, such as precursor solutions, droplet
formation, transport through air and delivery to a heated substrate. The spray coating system however
creates larger droplets and the substrate is not enclosed inside a CVD reactor.
The spray-coated films were more transparent than the Sylgard films formed by AACVD,
letting approximately 60% of visible light transmit through them. SEM images of the deposited films
show very wide surface features (approximately 10 – 20 µm across, Figure 2.14), where individual
polymer agglomerations are spread over the substrate and not upward in tower like structures
(AACVD). The surface feature heights (confirmed by AFM measurements) average between 2 – 3
µm; however this is not as rough as AACVD films. The hydrophobicity of the surfaces was measured
with a maximum water contact angle of 115° and an average of 102°.

Chapter 2 The Aerosol Assisted Chemical Vapour Deposition of Polymers
86
Figure 2.14. SEM image of a Sylgard 184 spray-
coated glass surface. The substrate temperature
during coating was 300°C. Feature heights were
confirmed as 2 – 3 µm high with the surface
achieving an average water contact angle of
102°.
The feature shape indicates the deposition mechanism of the polymer. The spray process
creates large solvent droplets ( > 200 μm in diameter, compared to those in the aerosol ~ 35 μm)22
which fall on the heated substrate, and not carried across it by a gas. The large droplets contain more
solvent and need more energy in order to evaporate this. There is also a greater amount of polymer,
which requires a greater amount of energy to fully cure. The process from diluted polymer to cured
product takes more time in the spray process, with a smaller area for the evaporation to take place.
This leads to the smoother microstructure (with respect to AACVD), and thus the resultant water
contact angle is reduced.
2.3.3 Comparing the AACVD of Thermosoftening and Thermosetting Elastomers
2.3.3.1 Substrate Adhesion
The greatest adherence to the substrates was observed on the Dyneon fluoroelastomer films. This is
due to a greater area of contact between elastomer agglomerates and substrate, brought about by
melting of the polymer particles on the hot glass. The second most adherent films were found when
NuSil elastomer was deposited at 420°C; the high temperature of the deposition and partial
decomposition of the polymer allowed for a strong connection between polymer and substrate. Sylgard
depositions had a faster curing rate which allowed for the formation of spherical particles more
rapidly. The spheres of cured/curing elastomer made the least effective bind with the surface due to
their shape and the likelihood that they were almost fully hardened by the time they made contact with
the surface. The most adhesive Sylgard films were seen at 360°C, when partial decomposition was
observed.
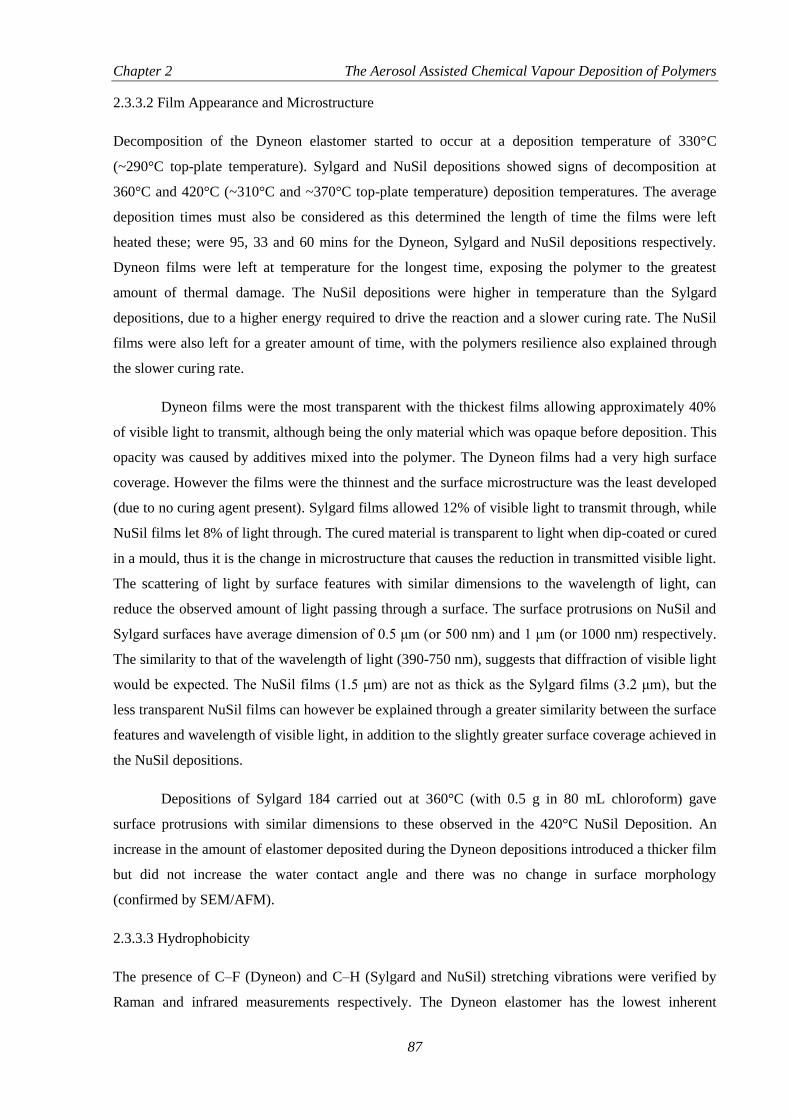
Chapter 2 The Aerosol Assisted Chemical Vapour Deposition of Polymers
87
2.3.3.2 Film Appearance and Microstructure
Decomposition of the Dyneon elastomer started to occur at a deposition temperature of 330°C
(~290°C top-plate temperature). Sylgard and NuSil depositions showed signs of decomposition at
360°C and 420°C (~310°C and ~370°C top-plate temperature) deposition temperatures. The average
deposition times must also be considered as this determined the length of time the films were left
heated these; were 95, 33 and 60 mins for the Dyneon, Sylgard and NuSil depositions respectively.
Dyneon films were left at temperature for the longest time, exposing the polymer to the greatest
amount of thermal damage. The NuSil depositions were higher in temperature than the Sylgard
depositions, due to a higher energy required to drive the reaction and a slower curing rate. The NuSil
films were also left for a greater amount of time, with the polymers resilience also explained through
the slower curing rate.
Dyneon films were the most transparent with the thickest films allowing approximately 40%
of visible light to transmit, although being the only material which was opaque before deposition. This
opacity was caused by additives mixed into the polymer. The Dyneon films had a very high surface
coverage. However the films were the thinnest and the surface microstructure was the least developed
(due to no curing agent present). Sylgard films allowed 12% of visible light to transmit through, while
NuSil films let 8% of light through. The cured material is transparent to light when dip-coated or cured
in a mould, thus it is the change in microstructure that causes the reduction in transmitted visible light.
The scattering of light by surface features with similar dimensions to the wavelength of light, can
reduce the observed amount of light passing through a surface. The surface protrusions on NuSil and
Sylgard surfaces have average dimension of 0.5 μm (or 500 nm) and 1 μm (or 1000 nm) respectively.
The similarity to that of the wavelength of light (390-750 nm), suggests that diffraction of visible light
would be expected. The NuSil films (1.5 μm) are not as thick as the Sylgard films (3.2 μm), but the
less transparent NuSil films can however be explained through a greater similarity between the surface
features and wavelength of visible light, in addition to the slightly greater surface coverage achieved in
the NuSil depositions.
Depositions of Sylgard 184 carried out at 360°C (with 0.5 g in 80 mL chloroform) gave
surface protrusions with similar dimensions to these observed in the 420°C NuSil Deposition. An
increase in the amount of elastomer deposited during the Dyneon depositions introduced a thicker film
but did not increase the water contact angle and there was no change in surface morphology
(confirmed by SEM/AFM).
2.3.3.3 Hydrophobicity
The presence of C–F (Dyneon) and C–H (Sylgard and NuSil) stretching vibrations were verified by
Raman and infrared measurements respectively. The Dyneon elastomer has the lowest inherent

Chapter 2 The Aerosol Assisted Chemical Vapour Deposition of Polymers
88
hydrophobicity, with water contact angles averaging 99°. Both Sylgard and NuSil had water contact
angles of 95° on dip-coated samples. Films formed via AACVD had highest water contact angles of
118° (330°C), 167° (360°C) and 170° (420°C) for Dyneon, Sylgard and NuSil elastomers respectively.
The low change in water contact angle observed in the Dyneon elastomer was due to a slight increase
in surface roughness, caused by melting of the polymer on the substrate and not curing. This
magnified the surfaces hydrophobicity but did not render it superhydrophobic. Superhydrophobic
surfaces formed by Sylgard and NuSil polymers were made possible by the formation of extreme
surface roughness. Low tilt angles confirmed a Cassie-Baxter wetting mechanism on these surfaces
with the successful trapping of air underneath water droplets within the film porosity. The higher
surface hydrophobicity seen in the NuSil depositions was a result of grater deformation of silicone
particles on the substrate, in addition to a smaller scale of surface roughness which was more efficient
at trapping air underneath the surface – this was shown not only by the higher water contact angles but
also the lowest slip angles were found on the NuSil surfaces.
2.3.4 Surface Modifications and Enhancements
The polymeric materials used in CVD depositions discussed in this section can be altered or
added to in order to change their functional properties. This section details the variation or
modification of AACVD depositions of Sylgard 184.
2.3.4.1 Dip-coating of CVD Substrates Prior to the AACVD of Sylgard 184
As the highly rough elastomer surfaces formed by AACVD facilitate a Cassie-Baxter wetting
mechanism, there should be no contact with the underlying substrate. The random nature of the
AACVD deposition mechanism however leaves opportunity for small regions of the film to have less
coverage, relative to a machined surface with regular patterned microstructure. An area of lower
surface coverage, even in the smallest area would result in water making contact with a hydrophilic
glass substrate. This contact would have two major local effects – a reduction in water contact angle
and an area of Wenzel-like wetting causing water to stick to that region, in-turn raising the slip angle.
Coating the hydrophilic glass with hydrophobic Sylgard 184 elastomer prior to AACVD deposition
could minimise the effect of that contact and the surface hydrophobicity on the deposited surface
would be maximised.
The physical appearance of the polymer coated substrates was very similar to glass substrates,
except for a slight rubber-like texture when handled. The surface morphology of the dip-coated glass
was extremely flat (no surface features larger than 50 nm, AFM), with the films observed to be 60 μm
thick with SEM imaging. When Sylgard 184 was deposited on top of the dip-coated films using
AACVD the films appeared very similar showing no observable differences upon visible inspection.
On closer examination the deposited elastomer particles were observed to agglomerate to the

Chapter 2 The Aerosol Assisted Chemical Vapour Deposition of Polymers
89
underlying substrate (Figure 2.15). The coating’s physical robustness was also greatly improved on
previous work using an ultrasonic aerosol, surviving the application of Scotch tape and only being
removed with a scalpel when the underlying polymer film was cut from the glass.
Figure 2.15. SEM image of a Sylgard 184 surface deposited via AACVD onto a glass substrate dip-coated with
a layer of the same elastomer. Image shows agglomeration between deposited material and the dip-coated under-
layer. Deposition was carried out at 360°C. Scale bar inset.
The water contact angle measurements on the films gave significantly consistent results, with
angles averaging 169° and showing less than 1° of variation over the substrate (Figure 2.16). The
major factor for this improvement was reducing the effect made by regions of lower surface coverage,
which would previously result in contact with the hydrophilic glass substrate.
Figure 2.16. Photograph showing a 3 μL water droplet in a Sylgard 184
surface deposited via AACVD onto a glass substrate dip-coated with a
layer of the same elastomer. The elastomer coated substrate provides
highly consistent water contact angle measurement (average 169°).
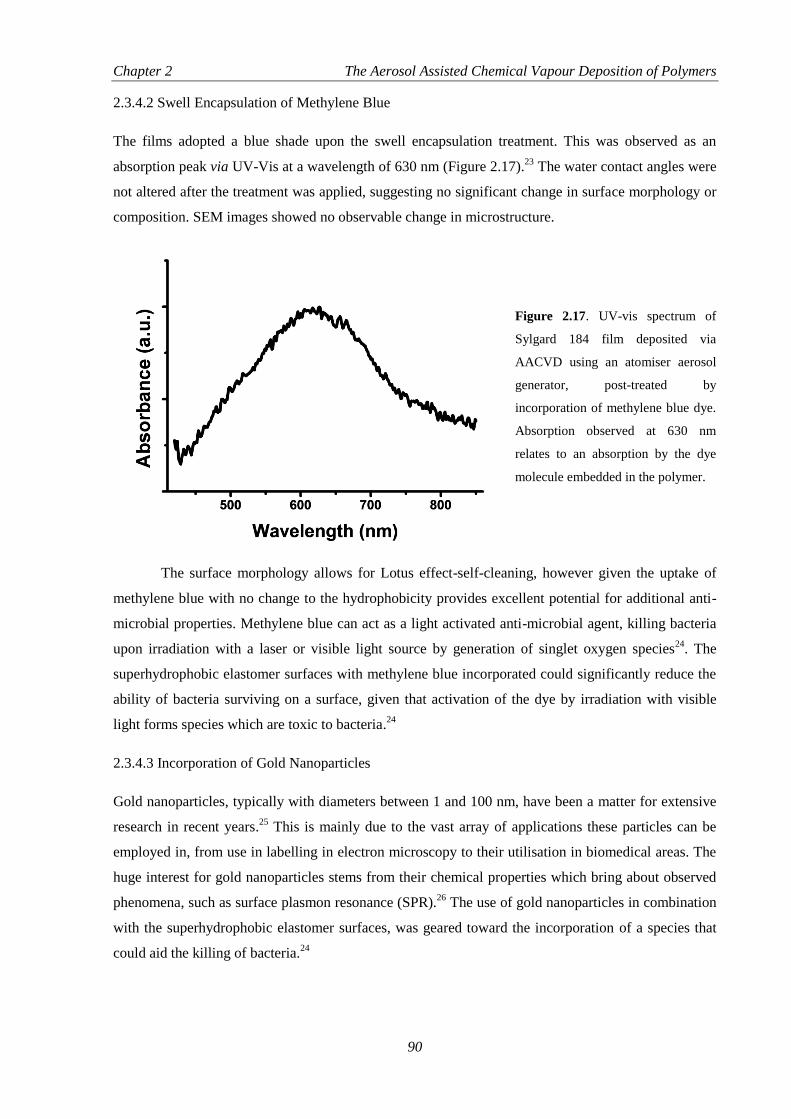
Chapter 2 The Aerosol Assisted Chemical Vapour Deposition of Polymers
90
2.3.4.2 Swell Encapsulation of Methylene Blue
The films adopted a blue shade upon the swell encapsulation treatment. This was observed as an
absorption peak via UV-Vis at a wavelength of 630 nm (Figure 2.17).23
The water contact angles were
not altered after the treatment was applied, suggesting no significant change in surface morphology or
composition. SEM images showed no observable change in microstructure.
Figure 2.17. UV-vis spectrum of
Sylgard 184 film deposited via
AACVD using an atomiser aerosol
generator, post-treated by
incorporation of methylene blue dye.
Absorption observed at 630 nm
relates to an absorption by the dye
molecule embedded in the polymer.
The surface morphology allows for Lotus effect-self-cleaning, however given the uptake of
methylene blue with no change to the hydrophobicity provides excellent potential for additional anti-
microbial properties. Methylene blue can act as a light activated anti-microbial agent, killing bacteria
upon irradiation with a laser or visible light source by generation of singlet oxygen species24
. The
superhydrophobic elastomer surfaces with methylene blue incorporated could significantly reduce the
ability of bacteria surviving on a surface, given that activation of the dye by irradiation with visible
light forms species which are toxic to bacteria.24
2.3.4.3 Incorporation of Gold Nanoparticles
Gold nanoparticles, typically with diameters between 1 and 100 nm, have been a matter for extensive
research in recent years.25
This is mainly due to the vast array of applications these particles can be
employed in, from use in labelling in electron microscopy to their utilisation in biomedical areas. The
huge interest for gold nanoparticles stems from their chemical properties which bring about observed
phenomena, such as surface plasmon resonance (SPR).26
The use of gold nanoparticles in combination
with the superhydrophobic elastomer surfaces, was geared toward the incorporation of a species that
could aid the killing of bacteria.24

Chapter 2 The Aerosol Assisted Chemical Vapour Deposition of Polymers
91
The deposition of gold nanoparticles prior to the AACVD of elastomer gave films a purple
shade. The hydrophobicity of the Sylgard films was unaffected by pre-treatment of the substrate with
gold nanoparticles with water contact angles averaging 160°. SEM images of the films showed the
presence of the nanoparticles underneath the deposited elastomer (Figure 2.18). The gold particles
were typically 50-100 nm in diameter and were weakly adhered to a surface when not coated with
polymer, however most particles were now embedded under the surface protrusions. The presence of
the nanoparticles was also observed in UV-Vis spectroscopy. The particles undergo surface plasmon
resonance, and this is observed in the spectra as an absorption band around 538 nm. This method of
embedding particles has possible application as a light activated antimicrobial agent, akin to
methylene blue.
Figure 2.18. SEM image showing gold nanoparticles (50-100 nm diameter) deposited by AACVD at 450°C, the
nanoparticles are embedded in a Sylgard 184 polymer also deposited by AACVD but at 360°C.
2.3.4.4 Atomiser Assisted Deposition of Sylgard 184
Depositions took place on the top plate inside the reactor similar to AACVD depositions, with the
deposition temperature maintained at 360°C. The films deposited at all concentrations appeared white
and opaque, with the most transparent films formed using the lowest concentration of elastomer
(above 65% visible light transmission, observed by UV-Vis spectroscopy). The films were very
physically robust (more robust than the AACVD Sylgard films), remaining intact after action with
Scotch tape and requiring a substantial amount of pressure to be removed with a scalpel. Infra-red

Chapter 2 The Aerosol Assisted Chemical Vapour Deposition of Polymers
92
spectroscopy showed typical absorption frequencies associated with C-H bonds (2950-2860 cm-1
).
EDX analysis showed a 2:1 O/Si ratio, with no other contaminants detected.
The surface microstructure (shown in Figure 2.19) was highly developed for depositions of all
concentrations of precursor, however roughness did increase with elastomer concentration. The
surface protrusions were made up of agglomerations of elastomer particles akin to AACVD
depositions, originating from the spherical nature of the atomised aerosol droplets. All depositions
formed similar microstructures with varying magnitudes, with average feature size increasing with
concentration. Average agglomerate protrusion diameter was 2.6 μm, 3.1 μm and 3.5 μm for
depositions using 10 g, 20 g and 30 g of the precursor Sylgard 184 dissolved in 400 mL chloroform,
with the average size for individual polymer particles smaller than 1 μm. A greater surface coverage
could also be observed at higher concentration suggesting that an increased amount of precursor
reached the substrate. The surface protrusions appear very similar to those deposited AACVD, albeit
on a smaller scale. Surface roughness analysis was attempted by AFM; however the surfaces extreme
roughness meant instrumental limitations were exceeded and substantial surface analysis could not be
made.
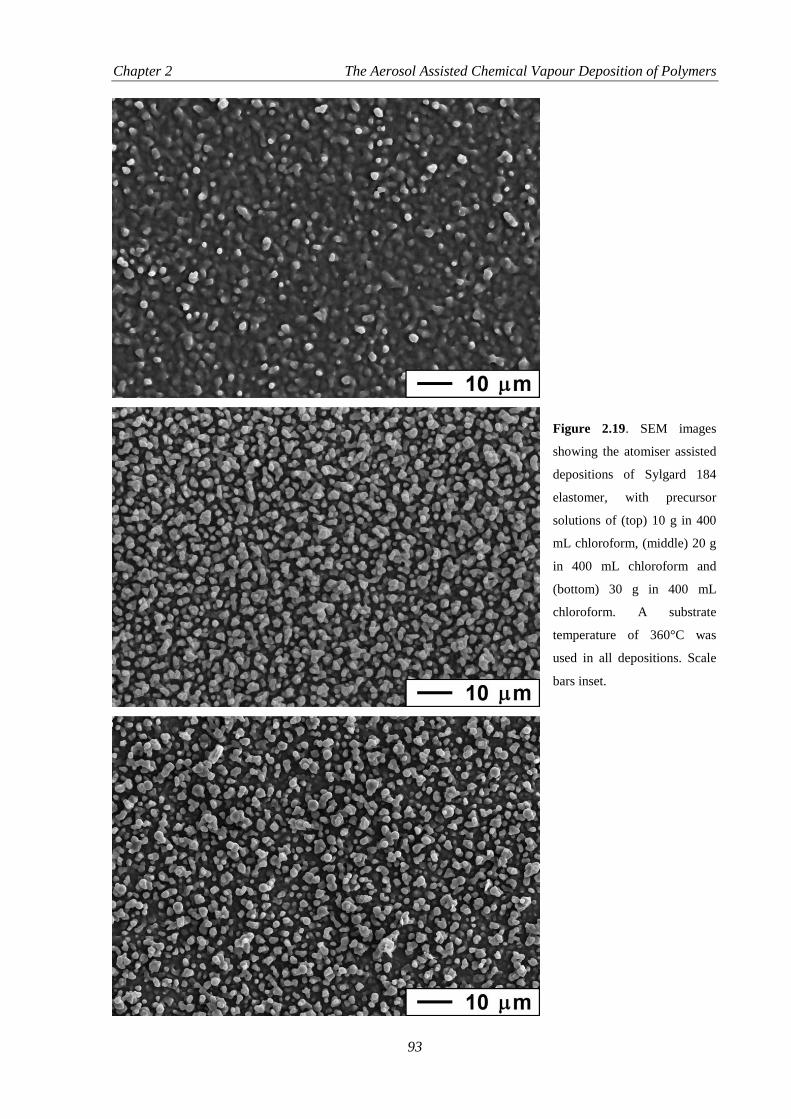
Chapter 2 The Aerosol Assisted Chemical Vapour Deposition of Polymers
93
Figure 2.19. SEM images
showing the atomiser assisted
depositions of Sylgard 184
elastomer, with precursor
solutions of (top) 10 g in 400
mL chloroform, (middle) 20 g
in 400 mL chloroform and
(bottom) 30 g in 400 mL
chloroform. A substrate
temperature of 360°C was
used in all depositions. Scale
bars inset.
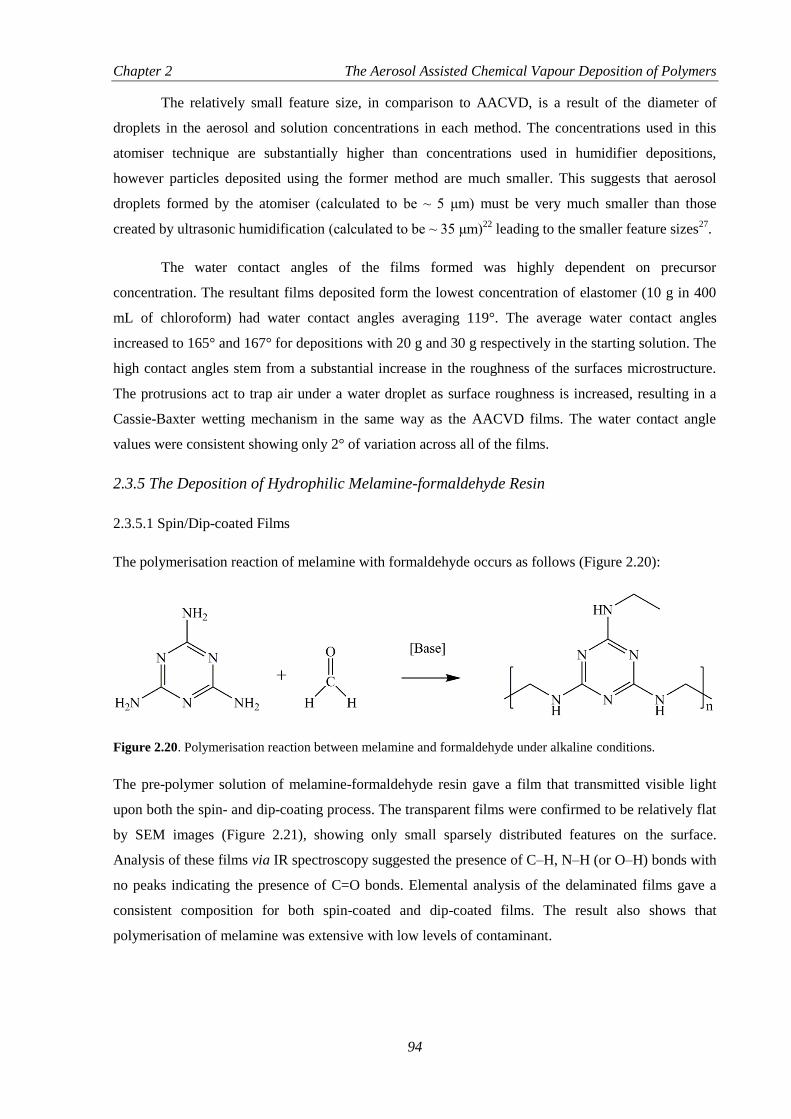
Chapter 2 The Aerosol Assisted Chemical Vapour Deposition of Polymers
94
The relatively small feature size, in comparison to AACVD, is a result of the diameter of
droplets in the aerosol and solution concentrations in each method. The concentrations used in this
atomiser technique are substantially higher than concentrations used in humidifier depositions,
however particles deposited using the former method are much smaller. This suggests that aerosol
droplets formed by the atomiser (calculated to be ~ 5 μm) must be very much smaller than those
created by ultrasonic humidification (calculated to be ~ 35 μm)22
leading to the smaller feature sizes27
.
The water contact angles of the films formed was highly dependent on precursor
concentration. The resultant films deposited form the lowest concentration of elastomer (10 g in 400
mL of chloroform) had water contact angles averaging 119°. The average water contact angles
increased to 165° and 167° for depositions with 20 g and 30 g respectively in the starting solution. The
high contact angles stem from a substantial increase in the roughness of the surfaces microstructure.
The protrusions act to trap air under a water droplet as surface roughness is increased, resulting in a
Cassie-Baxter wetting mechanism in the same way as the AACVD films. The water contact angle
values were consistent showing only 2° of variation across all of the films.
2.3.5 The Deposition of Hydrophilic Melamine-formaldehyde Resin
2.3.5.1 Spin/Dip-coated Films
The polymerisation reaction of melamine with formaldehyde occurs as follows (Figure 2.20):
Figure 2.20. Polymerisation reaction between melamine and formaldehyde under alkaline conditions.
The pre-polymer solution of melamine-formaldehyde resin gave a film that transmitted visible light
upon both the spin- and dip-coating process. The transparent films were confirmed to be relatively flat
by SEM images (Figure 2.21), showing only small sparsely distributed features on the surface.
Analysis of these films via IR spectroscopy suggested the presence of C–H, N–H (or O–H) bonds with
no peaks indicating the presence of C=O bonds. Elemental analysis of the delaminated films gave a
consistent composition for both spin-coated and dip-coated films. The result also shows that
polymerisation of melamine was extensive with low levels of contaminant.

Chapter 2 The Aerosol Assisted Chemical Vapour Deposition of Polymers
95
Figure 2.21. SEM images of melamine-formaldehyde resin films formed via; (left) spin-coating and (right)
evaporation of the pre-polymer material. Both films were heated at 250°C for 1 hour for evaporation/curing.
Scale bar shown is consistent for both images.
The water contact angles achieved on the dip/spin-coated melamine-formaldehyde resin films
averaged 34°. The SEM images of these films show a flat surface, this suggests that the resultant
melamine-formaldehyde surface is a high-energy material for water, i.e. it is hydrophilic when flat.
The film produced by evaporation of the pre-polymer solution on a microscope slide gave a roughened
film of the same material (Figure 2.21). These roughened surfaces gave a higher contact angle upon
addition of the water droplet, and an average contact angle of approximately 50° was obtained in the
first moments after addition. When left for approximately 5 seconds the droplet further wets the
surface reducing the water contact angle to between 15 and 20°. This shows that the wetting of the
surface porosity is gradual and that the roughened surface does decrease the water contact angle,
which corresponds to the intrinsic hydrophilicity of the melamine-formaldehyde resin.
2.3.5.2 AACVD Deposited Films
All the films in this section were deposited onto the top plate in the CVD reactor. Deposition on the
top plate in a CVD process indicates that the thermophoretic effect is prevalent. The melamine-
formaldehyde films were most adherent at a 250°C deposition temperature. The film were scratched
by a scalpel, however they were resistant to Scotch tape.
Combustion elemental analysis of a delaminated portion of the film gave a very similar
composition of films deposited via AACVD to those using spin/dip-coating. XRD measurements gave
no definable sharp peaks, suggesting an amorphous film. Raman measurements gave similar peaks to
the IR spectra of the spin/dip-coated films, with peaks in C–H, N–H (or O–H) regions present, and no
presence of C=O stretches (Figure 2.22). The spectrum is identical to those for the polymer resin.

Chapter 2 The Aerosol Assisted Chemical Vapour Deposition of Polymers
96
Figure 2.22. Raman spectrum of melamine-formaldehyde resin film deposited via AACVD at 250°C.
SEM images of the melamine-formaldehyde resin surfaces deposited by AACVD revealed a
highly developed surface microstructure (Figure 2.23). Spherical particles of melamine-formaldehyde
resin, ranging from 200 to 800 nm diameter were seen agglomerated into tower-like configurations up
to 5 μm thick. The particles deposit as spheres because the AACVD process involves the formation of
aerosol droplets of the precursor solution, when the solvent is evaporated in the CVD reactor the
polymer precursor reacts and cures at the elevated temperatures. The spherical aerosol droplets
(calculated to be approximately 35 μm in diameter22
) thus become smaller spherical polymer particles
(~ 300 nm diameter) which are subsequently deposited onto the substrate. The surface microstructure
extends across the whole substrate. However the films were thinner closest to the reactor inlet and the
coating was incomplete. For the same set of conditions the film thickness was maximised at 200°C. At
a deposition temperature of 250°C the amount of the material deposited decreased due to an increase
in the thermophoretic repulsion from the bottom plate which forced the particles around the top plate
onto the top of the reactor. The deposited films showed signs of decomposition at 350°C, denoted by a
yellow/brown tint on the film, with almost complete decomposition at 400°C.

Chapter 2 The Aerosol Assisted Chemical Vapour Deposition of Polymers
97
Figure 2.23. Top-down SEM image
of melamine-formaldehyde resin,
deposited using AACVD at a
reactor temperature of 250°C,
showing a highly developed
microstructure. Scale bar shown.
The high-energy material and the highly developed surface microstructure suggest that there
should be a decrease in the contact angle, relative to the flat melamine-formaldehyde surface.
However the AACVD deposition at 250°C, gave an average water contact angle of 115° (standard
deviation (σ) = 16.1°). Most of the contact angles values however occurred between 120° and 135°,
for over 90% of the film area, the average water contact angle for this region was 124° (σ = 5.9°).
Regions of lower polymer surface coverage, in the region closest to the reactor inlet (less than 10% of
the total substrate), gave the lower contact angles below 90° for some droplets, shown in Figure 2.24.
The water droplets in this region gradually wet the surface, taking approximately 2–3 s to come to the
equilibrium contact angle, reducing from an initially higher angle. The water contact angle results
suggest a Cassie–Baxter wetting mechanism, as the roughening of a Wenzel type wetting surface
would lower the contact angle (from 34° achieved on a flat surface).
Figure 2.24. Contact angle images used in the analysis of wetting properties on a film deposited using AACVD
at a deposition temperature of 250°C. Images show droplets on the surface on a; (left) a region of the highest
surface coverage (water contact angle = 133°), (right) a region of low surface coverage (water contact angle =
92°).

Chapter 2 The Aerosol Assisted Chemical Vapour Deposition of Polymers
98
A hydrophobic Wenzel type surface must be constructed from a material which when flat
gives a contact angle greater than 90°. The same is not true however for Cassie–Baxter wetting
surfaces. A few studies have been carried out to show that superhydrophobic surfaces can indeed be
generated from using high-energy materials using multi-step and mechanical roughening routes. The
work reported in this paper gives an example of a Cassie–Baxter wetting mechanism constructed using
a high-energy material. It indicates that the air under the water droplet between the surface
protrusions, increases surface hydrophobicity. The air underneath the droplet cannot flow through the
surface porosity due to the arrangement of the surface protrusions, thus the air is trapped and the water
sits on top of this air.28
A water droplet sitting on air would in theory have a contact angle of 180° (if
wind distortion is negated), so the high energy melamine-formaldehyde resin film reported in this
paper is rendered hydrophobic because parts of the water droplet are “sitting on air”, increasing the
contact angle of a flat surface from 34° to above 120°. The theoretical area fraction of solid–liquid
contact made (Φs) can be calculated from these results, for a simplified Cassie–Baxter model:
Rearranges to:
Where
Gives:
θe is the equilibrium water contact angle for the flat surface, θce is the equilibrium water contact angle
for the Cassie–Baxter surface and Φs is the area fraction of solid–liquid contact.
This indicates that if a pure Cassie–Baxter model is supposed then 16% of the water droplet is
calculated to be in contact with the film protrusions and the remaining 84% in contact with air trapped
under the water droplet. Penetration of the surface by water droplets was observed in regions of low
surface coverage, thus a wholly Cassie–Baxter wetting mechanism is unlikely, however the magnitude
of contact between the surface and water droplets can be envisaged using this calculation.
Side-on SEM images show the variation in the surface coverage (Figure 2.25). Areas of low
surface coverage (close to the reactor inlet) are confirmed to have a thickness around 1.5 μm; these
areas gave water contact angles below 90°. Areas where water contact angles were around 120°–135°,
were shown to be 2–3 μm thick. Longer AACVD deposition times led to the generation of very
hydrophilic portions of the deposited films (water contact angles less than 10°); these areas were
shown to be over 4 μm thick. The areas of low coverage can allow the water droplet to touch the
substrate and result in further wetting of the surface, which reduces the proportion of air trapped
underneath the water droplet and thus reduces hydrophobicity. Regions of medium coverage, allow for
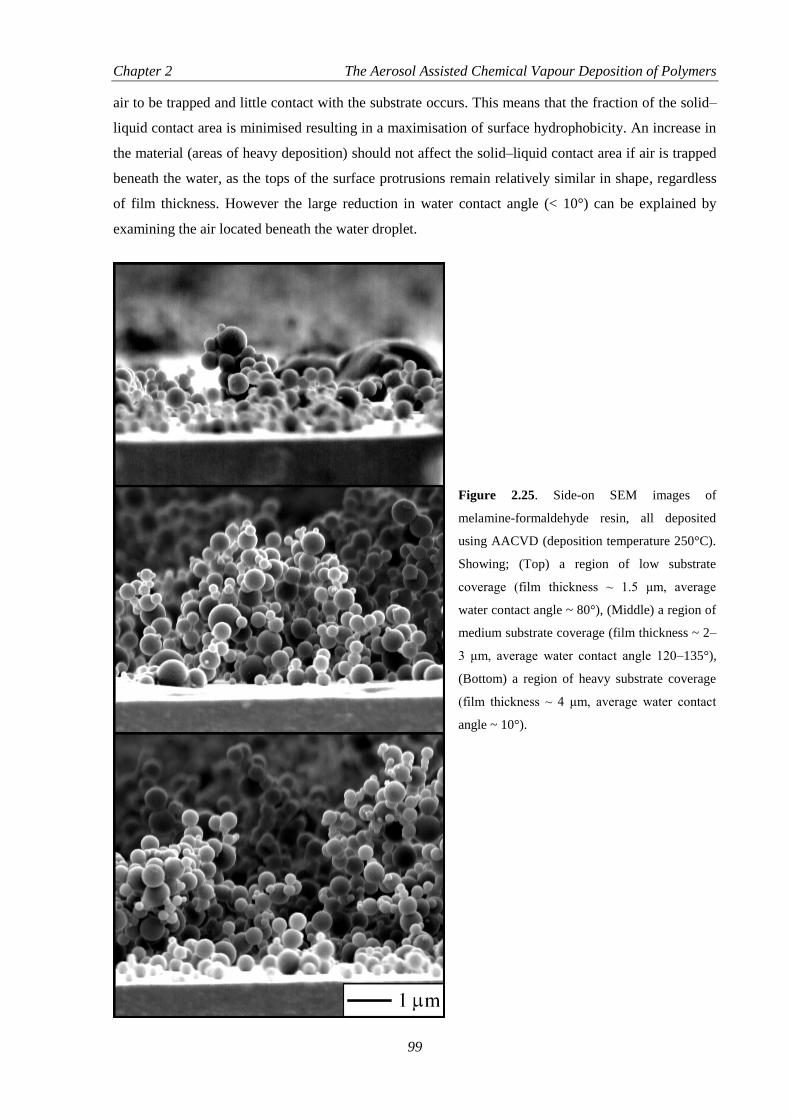
Chapter 2 The Aerosol Assisted Chemical Vapour Deposition of Polymers
99
air to be trapped and little contact with the substrate occurs. This means that the fraction of the solid–
liquid contact area is minimised resulting in a maximisation of surface hydrophobicity. An increase in
the material (areas of heavy deposition) should not affect the solid–liquid contact area if air is trapped
beneath the water, as the tops of the surface protrusions remain relatively similar in shape, regardless
of film thickness. However the large reduction in water contact angle (< 10°) can be explained by
examining the air located beneath the water droplet.
Figure 2.25. Side-on SEM images of
melamine-formaldehyde resin, all deposited
using AACVD (deposition temperature 250°C).
Showing; (Top) a region of low substrate
coverage (film thickness ~ 1.5 μm, average
water contact angle ~ 80°), (Middle) a region of
medium substrate coverage (film thickness ~ 2–
3 μm, average water contact angle 120–135°),
(Bottom) a region of heavy substrate coverage
(film thickness ~ 4 μm, average water contact
angle ~ 10°).

Chapter 2 The Aerosol Assisted Chemical Vapour Deposition of Polymers
100
2.3.5.3 Comparison with Low Surface Energy Materials
The deposition mechanism of the AACVD process is similar to that for the deposition of silicone
elastomers, described throughout this chapter. The silicone elastomers had a water contact angle of 95°
when flat, which increase to 167° when deposited via AACVD. The surface microstructure formed in
both the silicone elastomer and the melamine polymer reported in this section is very similar, a greater
amount of particle agglomeration is seen in the AACVD of silicone elastomers. An increase in the
material deposited in the AACVD process resulted in no observed change in the silicone elastomers
contact angle. However upon increasing the deposition amount, the melamine-formaldehyde resin film
became very hydrophilic in the area of thickest deposition, giving a contact angle as low as 5°. This
change can be rationalised by considering air underneath a water droplet; in areas where there is a 2–3
μm film thickness, there is a smaller volume of ‘trapped air’, Figure 2.26. The very low contact angles
achieved in thicker areas of deposition (film thickness ~ 4 μm) are explained through a change in the
wetting mechanism, from a Cassie–Baxter to a Wenzel mechanism. The greater film thicknesses allow
a greater volume of air underneath the droplet which is not only more easily compressed but also
facilitates movement through the film porosity. The water droplet could thus not be supported by the
air beneath it and the water will penetrate the microstructure. This mechanism would result in water
becoming exposed to more of the high-energy melamine-formaldehyde resin instead of resting on air,
reducing the surface hydrophobicity severely. The silicone elastomer equivalent would not be affected
by this due to the greater agglomeration of particles and the elastomer’s inherently high water
repellence.
Figure 2.26. Schematic representation of a cross-section through; (a) a normal deposition with air trapped
between the surface protrusions and glass, and (b) a heavier deposition showing more space for air to travel and
so the air is not trapped beneath a water droplet.
The movement of water across the surface is a good indication of the surface wetting
mechanism. Films of melamine-formaldehyde resin formed by AACVD had a high water droplet slip
angle, the parts of the films with the highest contact angle were able to hold 30 μL water droplets at
90° tilt. If water droplets were dropped onto a surface already tilted (~45°) the water droplets bounce
Chapter 2 The Aerosol Assisted Chemical Vapour Deposition of Polymers
101
on the surface, this indicates an immediate repulsion from air trapped in the film. Advancing/receding
contact angle measurements showed a large difference (large angle of hysteresis), and water droplets
that spent a longer time on the surface gave a larger difference. These results points toward a
progressive wetting mechanism which begins as a slippery Cassie–Baxter mechanism which moves
toward an intermediate state as a water droplet is left on the surface, thus becoming stickier. The
intermediate state will give points on the films where there is strong attraction between water and the
surface material, resulting in parts of the water droplet remaining after the bulk of the droplet is
removed (i.e. low receding contact angle)29
. This contrasts with the silicone elastomer AACVD
depositions where there is a low slip angle, which is due to the low energy material preventing any
penetration of surface protrusions in to the water droplet.
2.4. Conclusions
The deposition of polymers via an aerosol route is a successful method for forming exceptionally
rough-superhydrophobic surfaces. The key factors of the process are:
Microdroplets of polymer precursor solution. These are small enough to be transferred in
the gas phase to a heated reactor. Evaporation of the solvent in the droplets results in spherical
particles of polymers, preformed in the gas phase.
Thermosetting polymer. Once the microparticles of polymer have entered the heated
reactor, they can either be cured or melted. Thermosoftening polymers melt and contact with a
substrates results in molten mounds of the material. Thermosetting polymers begin to harden
with heat, subsequent contact with the substrate allows for assembling of microparticle
agglomerated which form networks of intense microstructure.
Process Enhancements. The hydrophobicity of the highly rough polymer films can be subject
to enhancement. This has been done by varying the type of polymer used (Sylgard vs. NuSil),
Changing the aerosol generation method and pre-treating the substrates with a flat film of
elastomer. Photo active species have also been embedded into the films, either by swell
encapsulation (methylene blue) or forming an intermediate layer between substrate and
elastomer (gold nanoparticles).
Surface Wetting Mechanism. The deposition route resulted in a highly rough microstructure
for all curing polymers. The wetting of the polymer surfaces occurred with air becoming
trapped under water on the surface (a Cassie-Baxter mechanism). Depositions of a hydrophilic
polymer (θ = 34° for a flat surface) allowed the formation of a Cassie-Baxter wetting surface.
By control of the deposition conditions it was shown that changes in surface microstructure
and material coverage could enable the same material to be tailored between superhydrophilic,
hydrophilic, hydrophobic to near superhydrophobic.
Chapter 2 The Aerosol Assisted Chemical Vapour Deposition of Polymers
102
The methods used to form superhydrophobic films from polymers can entail expensive and time
consuming apparatus or procedure. The AACVD polymers explored in this chapter is an inexpensive,
fast and versatile one-step method for forming superhydrophobic surfaces that was previously
unexplored.
2.5. References
1. Z. Guo, W. Liu, B. Su, J. Colloid Interface Sci., 2011, 353, 335.
2. D. J. Crisp, J. Colloid Sci., 1946, 1, 161.
3. X. Zhang, F. Shi, J. Niu, Y. Jiang and Z. Wang, J. Mater. Chem., 2008, 18, 621.
4. X. Li, D. Reinhoudt and M. Crego-Calama, Chem. Soc. Rev., 2007, 36, 1350.
5. G. McHale, N. J. Shirtcliffe and M. I. Newton, Langmuir, 2004, 20, 10146.
6. M. L. Ma and R. M. Hill, Curr. Opin. Colloid Interface Sci., 2006, 11, 193.
7. E. L. Decker and S. Garoff, Langmuir, 1997, 13, 6321.
8. J. Bico, C. Marzolin and D. Quere, Europhys. Lett., 1999, 47, 220.
9. Z. J. Yu, E. T. Kang, K. G. Neoh, C. Q. Cui and T. B. Lim, J. Adhesion, 2000, 73, 417.
10. K. M. Forward, A. L. Moster, D. K. Schwartz and D. J. Lacks, Langmuir, 2007, 23, 5255.
11. R. A. Lawton, C. R. Price, A. F. Runge, W. J. Doherty III, S. S. Saavedra, Colloid. Surface. A, 2005, 253,
213.
12. R. N. Wenzel, Ind. Eng. Chem., 1936, 28, 988.
13. A. B. D. Cassie and S. Baxter, Trans. Faraday Soc., 1944, 40, 546.
14. M. Heckele and W. K. Schomburg, J. Micromech. Microeng., 2004, 14, R1.
15. B. S. Hayes and J. C. Seferis, Polym. Compos., 2001, 22, 451.
16. S. Basharat, C. J. Carmalt, R. Binions, R. Palgrave and I. P. Parkin, Dalton Trans., 2008, 591.
17. J. Akhtar, M. A. Malik, P. O’Brien and M. Helliwell, J. Mater. Chem., 2010, 20, 6116.
18. T. Ogi, D. Hidayat, F. Iskandar, A. Purwanto and K. Okuyama, Adv. Powder Technol., 2009, 20, 203.
19. R. Gordon, J. Non-Cryst. Solids., 1997, 218, 81.
20. M. R. Zaghloul, J. Appl. Phys., 2004, 95, 3339.
21. D. S. Kummli, H.-M. Frey and S. Leutwyler, Chem. Phys., 2010, 367, 36.
22. R. J. Lang, J. Acoust. Soc. Am., 1961, 34, 6.
23. G. J. Smith, A. Harriman, A. D. Woolhouse, T. G. Haskelll and T. H. Barnes, Photochem. Photobiol., 1998,
67, 101.
24. S. Noimark, C. W. Dunnill, M. Wilson and I. P. Parkin, Chem. Soc. Rev., 2009, 38, 3435.
25. T. K. Sau, A. Pal, N. R. Jana, Z. L. Wang and T. Pal, J. Nanopart. Res., 2001, 3, 257.
26. J. Jung, K. Na, J. Lee, K. Kim and J. Hyun, Anal. Chim. Acta., 2009, 651, 91.
27. G. G. Nasr, A. J. Yule and L. Bending, Industrial Sprays and Atomization, Springer, 2002.
28. J. Liu, X. Feng, G. Wang and S. Yu, J. Phys. Condens. Matter, 2007, 19, 356002.
29. P. S. H. Forsberg, C. Priest, M. Brinkmann, R. Sedev and J. Ralston, Langmuir, 2010, 26, 860.

Chapter 3 The Hybrid CVD and Functionalisation of Silica Microparticles
103
Chapter 3
The Hybrid CVD and
Functionalisation of Silica
Microparticles
Figure 3.01. SEM image of a silica microparticle surface deposited using CVD, with an image of a water droplet
on the surface subsequent to functionalisation.

Chapter 3 The Hybrid CVD and Functionalisation of Silica Microparticles
104
3. The Hybrid CVD and Functionalisation of Silica Microparticles
3.1. Introduction
Silicon dioxide (silica) is found in both crystalline structures and amorphous phases1. It is the
structural versatility and malleability of silica that render it a popular choice to construct structured
and subsequently superhydrophobic surfaces2/3
.
3.1.1 The Hydrophobicity of Silica
The surface of silica materials is readily hydrolysed in ambient conditions (Figure 3.02)4. It is the
extent of this hydrolysis and the resulting amount of surface silanol groups which dictate the
hydrophobicity of a silica surface4, with water contact angles of around 45° for silica glass stored at
room temperature. The surface silanol groups form hydrogen bounds with water, the more of these
groups present the more hydrophilic a surface will become. The silanol groups are removed upon
heating4, with hydrophobic water contact angles achieved when the same silica sample is heated.
Figure 3.02. The hydrolysis of a silica surface when left at room temperature in ambient conditions, leads to the
production of water attracting surface silanol groups. The reverse transformation occurs upon heating.
The surface silanol groups attract water, and so their presence is unfavourable when
considering the construction of hydrophobic surfaces. These groups can be functionalised in order to
lower the energy of interaction with water and thus surface energy5/6
. The most common routes for
silanol functionalisation is the use of alkylsilanes7 and FAS
8 with the addition of these molecules
resulting in water contact angles up to 100° being reported for flat surfaces. The roughening of surface
microstructure can be readily accomplished through use of silica beads9 or high temperature sintering
of silica surfaces6. These steps fulfil the requirements for extreme hydrophobicity (low surface energy
and high surface roughness).

Chapter 3 The Hybrid CVD and Functionalisation of Silica Microparticles
105
3.1.2 The CVD of Silica-based Thin Films
CVD requires gaseous or soluble precursors in order to form thin films10
. One of the most
commonly used precursors used to construct silica films is tetraethylorthosilicate (TEOS)11
, in addition
to tetramethylorthosilicate and other similarly structured compounds.12
The frequent application of this
compound type is a result of their ease of activation toward forming silica products and also their
relatively high volatilities. TEOS is quite thermally stable, requiring temperatures above 700°C to
begin decomposition.10
Existing CVD routes must reach temperatures exceeding this or incorporate
another form of activation, which include exposure to plasma energy13
and ultra-violet light14
. The
molecular nature of these CVD reactions means that relatively flat and uniform films are formed10
,
with roughened silica usually obtained by further etching15
.
The previous chapter discussed using AACVD to generate high surface roughness. This
chapter utilises a similar deposition process to form rough silica textured surfaces. The deposition of
silica microparticles via a hybrid CVD is detailed in this chapter, and the key aspects of the deposition
route will be discussed with important factors in particle formation identified. The microstructure of
the surfaces deposited will be characterised, showing that the size and amount of particles deposited
can be varied by the reaction conditions used. A post-treatment was used to functionalise surface
groups and lower surface energy. This allows for the superhydrophilic silica surface to be converted to
a superhydrophobic one. The hydrophobicities of both unmodified and modified films were analysed.
3.2. Experimental Details
3.2.1 Materials
All chemicals used in this investigation were purchased from Sigma-Aldrich Chemical Co; including
TEOS, hydrochloric acid, toluene and hexamethyldisilazane (HMDS).
3.2.2 Hybrid CVD of Silica Microparticles
The form of hybrid CVD used is a combination of AACVD and atmospheric pressure CVD (APCVD)
and is best represented in a schematic (Figure 3.03). The depositions were carried out in a cold-walled
horizontal CVD reactor. The reactor contained a top and bottom silica barrier layer glass for
deposition (dimensions: 145 x 45 x 5 mm; barrier thickness 50 nm), provided by Pilkington NSG. The
barrier layer prevented any ion transfer from the bulk glass. The CVD reactor was heated using a
carbon block, which the bottom plate was placed on. The top plate was positioned 8 mm above and
parallel to the bottom plate, the complete assembly was enclosed in a quartz tube. The aerosol of
aqueous acid (1 M HCl) was formed using a PIFCOHEALTH ultrasonic humidifier, operating at a
frequency of 40 kHz and 25 W of power. The generated aerosol was moved into a cylindrical mixing
chamber (length: 180 mm diameter: 35 mm) using a nitrogen gas flow via PTFE

Chapter 3 The Hybrid CVD and Functionalisation of Silica Microparticles
106
(polytetrafluoroethylene) and glass tubing. The aerosol then passed through the mixing chamber and
subsequently into the CVD reactor. TEOS was carried from a heated bubbler using preheated nitrogen
(passed through a 300°C tube furnace), brought together in the mixing chamber, mixing with the
aerosol and passed into the heated reactor (over a range of temperatures, 450–600°C). The bubbler
temperature was maintained at 80°C to keep the vapour pressures constant. All of the lines to and from
the bubblers were maintained at 150°C, including the mixing chamber. The nitrogen flow rate from
the bubblers and aerosol was maintained at 0.5 L/min. Depositions were carried out for a logged
period of time and nitrogen flow was left on for a further 10 min (at heated temperature, including line
heaters), the reactor’s heater was also switched off after 10 min and was allowed to cool. The cooled
plates were removed from the reactor and handled in air.
Figure 3.03. Schematic of the hybrid CVD setup.
3.2.3 Functionalisation of Silica Microparticle Surface
Portions of the deposited films were totally immersed in a solution of HMDS (10% v/v in toluene)
inside a large crystallisation dish. The solution was stirred at 40°C for 24 h. The plates were removed
from the solution and then placed in a 100°C oven for an hour to dry. Once cooled the films were
stored in air.

Chapter 3 The Hybrid CVD and Functionalisation of Silica Microparticles
107
3.2.4 Films Characterisation
The films were analysed as coatings on the barrier glass substrate. SEM images were taken from gold-
sputtered small subsections (ca. 1 x 1 cm) cut from the substrates. Analysis was carried out using a
field emission scanning electron microscope (SEM), a Jeol JSM-6301F operating at 5 kV. Energy
Dispersive X-ray (EDX) analysis was also carried out on the same machine using an operating
frequency of 10 kV. Powder X-ray diffraction (XRD) patterns were measured on a Bruker D8
discovery instrument using monochromated Cu-Kα radiation (λ = 1.5406 Å) in the reflection mode.
Raman measurements were made using a Renishaw 1000 spectrometer which used a 632.8 nm laser.
UV–visible absorption spectra were taken using a Perkin Elmer Lambda 25 UV/VIS Spectrometer
single beam instrument over a range of 300–1000 nm. Adherence tests were carried out, done by
applying Scotch Home and Office masking tape to the surface followed by its removal. Scratch tests
were also carried out by observing the action of a metal scalpel being dragged across a surface.
3.2.5 Surface Hydrophobicity Measurements
Water contact angle measurements were carried out using an FTA-1000 drop shape instrument; 3 μL
water droplets were used to minimise any gravitational effects. The water droplet images were
analysed using a digital protractor to obtain the water contact angles on the surface. A range of points
across the substrates were tested, with 12 measurements made on each film. Water slip angles were
also measured, noting the angle to the horizontal at which 3 μL water droplets moved on the surface.
Many positions across the substrates were tested.
3.3. Results and Discussion
3.3.1 The Deposition of Silica Microparticles via Hybrid CVD
3.3.1.1 Preliminary Depositions
Preliminary hybrid CVD depositions were carried out over a 5 minute period. It was found that
substantial deposition of material only occurred at and above a deposition temperature of 450°C, these
depositions occurred to the top substrate plate. The highest deposition temperature used was 600°C,
limited by the melting of the glass substrates. The films were white and hazy in appearance with the
thickest deposition found to occur at 550°C. It was also found (confirmed by SEM) that the average
deposited particle size varied with deposition temperature: 450°C (300 nm), 500°C (500 nm), 550°C
(650 nm) and 600°C (750 nm) (Table 3.1, p113), with a variation in particle sizes exhibited at all
temperatures (Figure 3.04). A Si:O ratio of 1:2 was also obtained from EDX analysis. The pre-mixing
of the reactants in the mixing chamber was found to be vital to a deposition taking place. Depositions
with no mixing chamber, where reactants entered and mixed in the heated reactor, gave no deposition
at any temperature used. The necessity to pre-mix TEOS and aerosol, and the fact that depositions
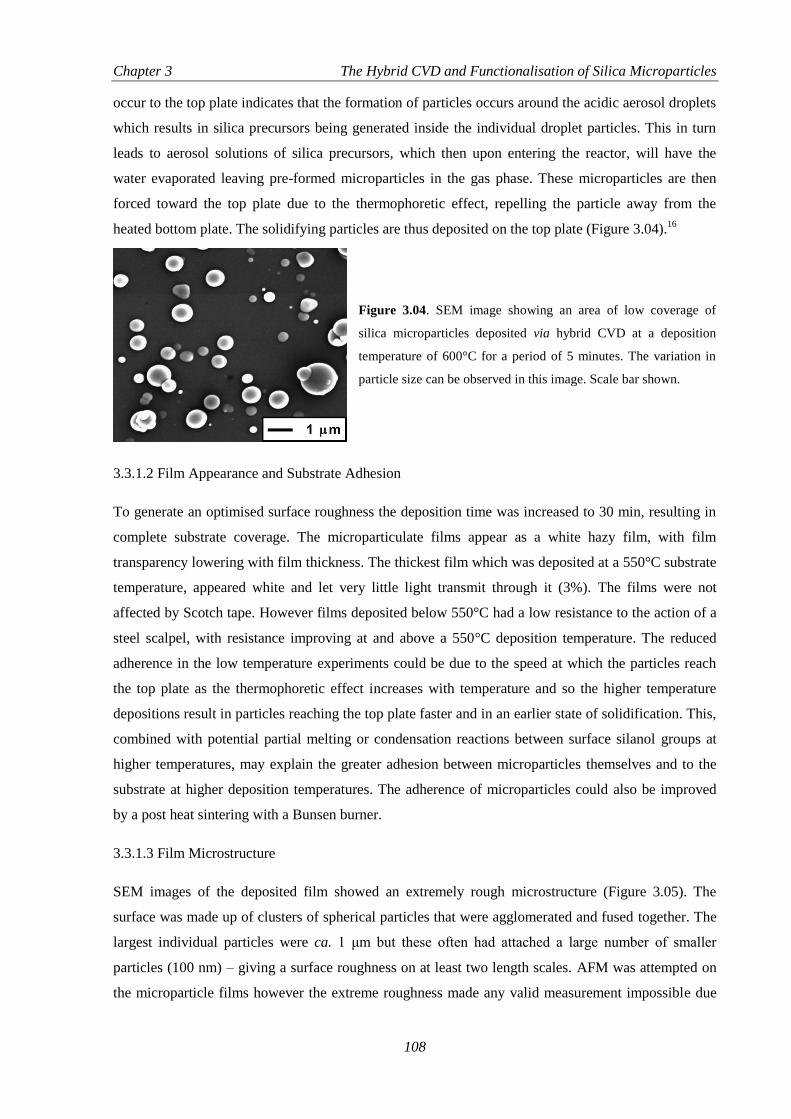
Chapter 3 The Hybrid CVD and Functionalisation of Silica Microparticles
108
occur to the top plate indicates that the formation of particles occurs around the acidic aerosol droplets
which results in silica precursors being generated inside the individual droplet particles. This in turn
leads to aerosol solutions of silica precursors, which then upon entering the reactor, will have the
water evaporated leaving pre-formed microparticles in the gas phase. These microparticles are then
forced toward the top plate due to the thermophoretic effect, repelling the particle away from the
heated bottom plate. The solidifying particles are thus deposited on the top plate (Figure 3.04).16
Figure 3.04. SEM image showing an area of low coverage of
silica microparticles deposited via hybrid CVD at a deposition
temperature of 600°C for a period of 5 minutes. The variation in
particle size can be observed in this image. Scale bar shown.
3.3.1.2 Film Appearance and Substrate Adhesion
To generate an optimised surface roughness the deposition time was increased to 30 min, resulting in
complete substrate coverage. The microparticulate films appear as a white hazy film, with film
transparency lowering with film thickness. The thickest film which was deposited at a 550°C substrate
temperature, appeared white and let very little light transmit through it (3%). The films were not
affected by Scotch tape. However films deposited below 550°C had a low resistance to the action of a
steel scalpel, with resistance improving at and above a 550°C deposition temperature. The reduced
adherence in the low temperature experiments could be due to the speed at which the particles reach
the top plate as the thermophoretic effect increases with temperature and so the higher temperature
depositions result in particles reaching the top plate faster and in an earlier state of solidification. This,
combined with potential partial melting or condensation reactions between surface silanol groups at
higher temperatures, may explain the greater adhesion between microparticles themselves and to the
substrate at higher deposition temperatures. The adherence of microparticles could also be improved
by a post heat sintering with a Bunsen burner.
3.3.1.3 Film Microstructure
SEM images of the deposited film showed an extremely rough microstructure (Figure 3.05). The
surface was made up of clusters of spherical particles that were agglomerated and fused together. The
largest individual particles were ca. 1 μm but these often had attached a large number of smaller
particles (100 nm) – giving a surface roughness on at least two length scales. AFM was attempted on
the microparticle films however the extreme roughness made any valid measurement impossible due

Chapter 3 The Hybrid CVD and Functionalisation of Silica Microparticles
109
to instrument limitations. Films deposited at lower substrate temperatures gave similar surface
features, however they were made up of different sized particles. The thicker films of microparticles
were also subjected to EDX analysis which gave a 1:2 (Si:O) ratio, confirming a composition
consistent with that of silica. The crystal structure of the particles was also confirmed to have no long
range order with XRD patterns showing only very broad peaks.
Figure 3.05. SEM
image of a silica
microparticle film
deposited via hybrid
CVD, using a substrate
temperature of 550°C
over a period of 30 min.
The particles are of
similar size to those
deposited over a shorter
period. Scale bar shown.
The deposition mechanism, described for preliminary depositions, supports the microstructure
observed in the extended runs. This is seen more clearly from side-on SEM images by the formation of
particle towers (Figure 3.06), a result of the solidifying particles landing on-top of those already on the
surface. Similar microstructures were observed for films deposited at other deposition temperature,
albeit with their respective particle sizes and film thicknesses (Table 3.1, p113).
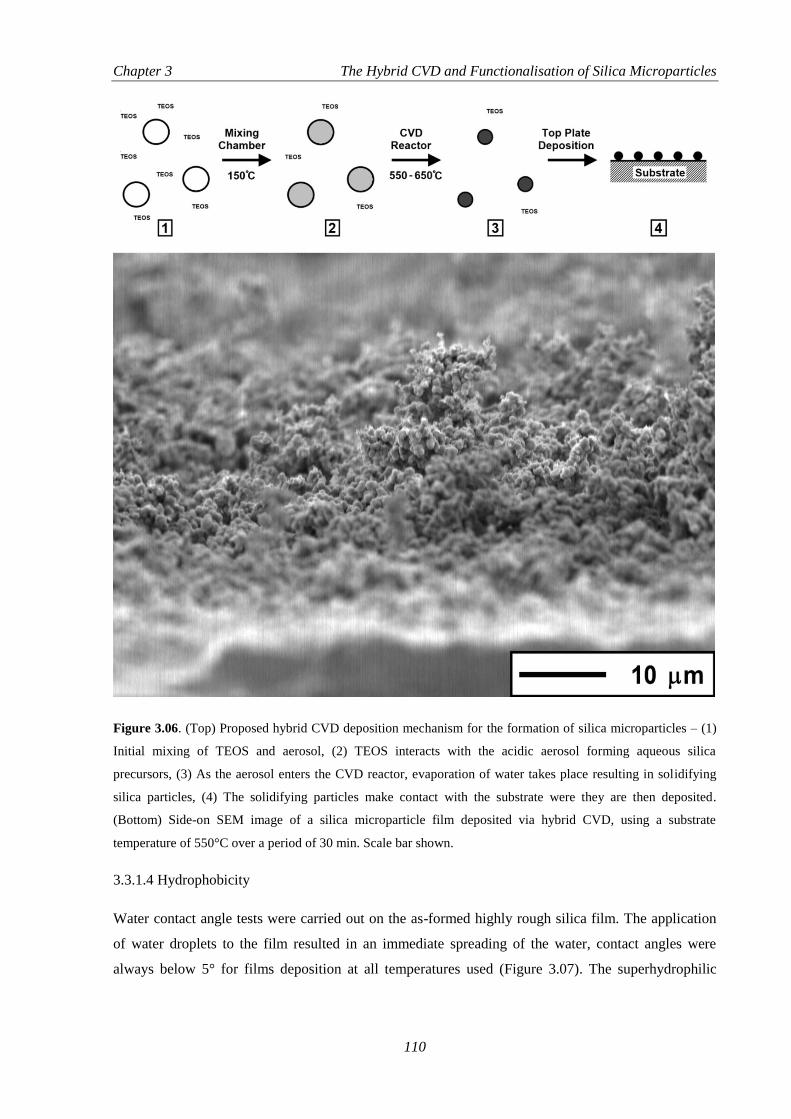
Chapter 3 The Hybrid CVD and Functionalisation of Silica Microparticles
110
Figure 3.06. (Top) Proposed hybrid CVD deposition mechanism for the formation of silica microparticles – (1)
Initial mixing of TEOS and aerosol, (2) TEOS interacts with the acidic aerosol forming aqueous silica
precursors, (3) As the aerosol enters the CVD reactor, evaporation of water takes place resulting in solidifying
silica particles, (4) The solidifying particles make contact with the substrate were they are then deposited.
(Bottom) Side-on SEM image of a silica microparticle film deposited via hybrid CVD, using a substrate
temperature of 550°C over a period of 30 min. Scale bar shown.
3.3.1.4 Hydrophobicity
Water contact angle tests were carried out on the as-formed highly rough silica film. The application
of water droplets to the film resulted in an immediate spreading of the water, contact angles were
always below 5° for films deposition at all temperatures used (Figure 3.07). The superhydrophilic

Chapter 3 The Hybrid CVD and Functionalisation of Silica Microparticles
111
nature of the film confirms a Wenzel-type wetting mechanism, where water penetrates all of the
surface porosity resulting in a strong attraction to the surface.
Figure 3.07. Image of a 3 μL droplet on a
silica microparticle film deposited via
hybrid CVD, using a substrate temperature
of 550°C. The high roughness of the
microparticle surface magnifies the
intrinsic hydrophilicity of the silica
material deposited resulting in a water
contact angle around 4°.
3.3.2 Functionalisation of Silica Microparticle Surface
The surface of the silica microparticle film as formed is markedly hydrophilic; the presence of surface
silanol groups is directly linked to its attraction to water (i.e. more silanol groups leads to a greatly
amount of hydrogen bonding to water). The superhydrophilic films were treated with HMDS, with the
aims of forming trimethylsiloxane (TMS) groups in place of silanol bonds, rendering them
hydrophobic (Figure 3.08)17
. The treatment was also carried out on the flat silica barrier layer CVD
substrates, whose ordinary water contact angle is 45°; this was increased to 84° upon treatment with
HMDS. The surface microstructure, as well as other physical properties of any the films treated was
not noticeably altered by the functionalisation process. TMS groups were not observed by Raman or
EDX analysis, this could be due to TMS being present only present as a monolayer on the surface after
functionalisation and so cannot be detected above any background readings.
Figure 3.08. Scheme shows surface functionalisation of silanol groups, exchanging for low energy TMS groups.
The reaction was carried out in toluene solvent, the conditions are also shown.

Chapter 3 The Hybrid CVD and Functionalisation of Silica Microparticles
112
3.3.2.1 Hydrophobicity of Functionalised Silica Film
All of the silica microparticle films were rendered extremely superhydrophobic after functionalisation,
with all achieving water contact angles that approached 180° (Figure 3.09). There was very little
variation of water contact angles exhibited by the films deposited at different temperatures (Table 3.1).
Calculation of the fraction of solid-liquid contact of water (Φs) using the Cassie-Baxter model could
not be carried-out because the hydrophobicity of an equivalent flat functionalised surface not being
able to be attained, as the silica particles were formed during the CVD process. The films were also
extremely slippery relative to water, requiring tilt angles less than 1° for even very small water
droplets (3 μL). Advancing/receding contact angles (θA/θR) were measured, no variation was observed
showing θA = θR ≈ 180°. The high water contact angles, as well as the low slip angles, suggests a
Cassie-Baxter type wetting mechanism. As a water droplet moved across the surface it would roll and
spin giving this surface an ideal Lotus effect self-cleaning mechanism. The microparticles are
rounded, and allow for a reduction in contact pinning with sharp edges; this facilitates smooth travel of
water over the surface18
. Any tilt of the surface, even minuscule and virtually undetectable tilt, resulted
in lateral movement in the direction of surface tilt.
Figure 3.09. Photograph
showing a 5 μL droplet of water
on the modified silica
microparticle film, deposited by
hybrid CVD at a substrate
temperature of 550°C. The
water droplets would roll on the
surface, even at very low tilt
angles.
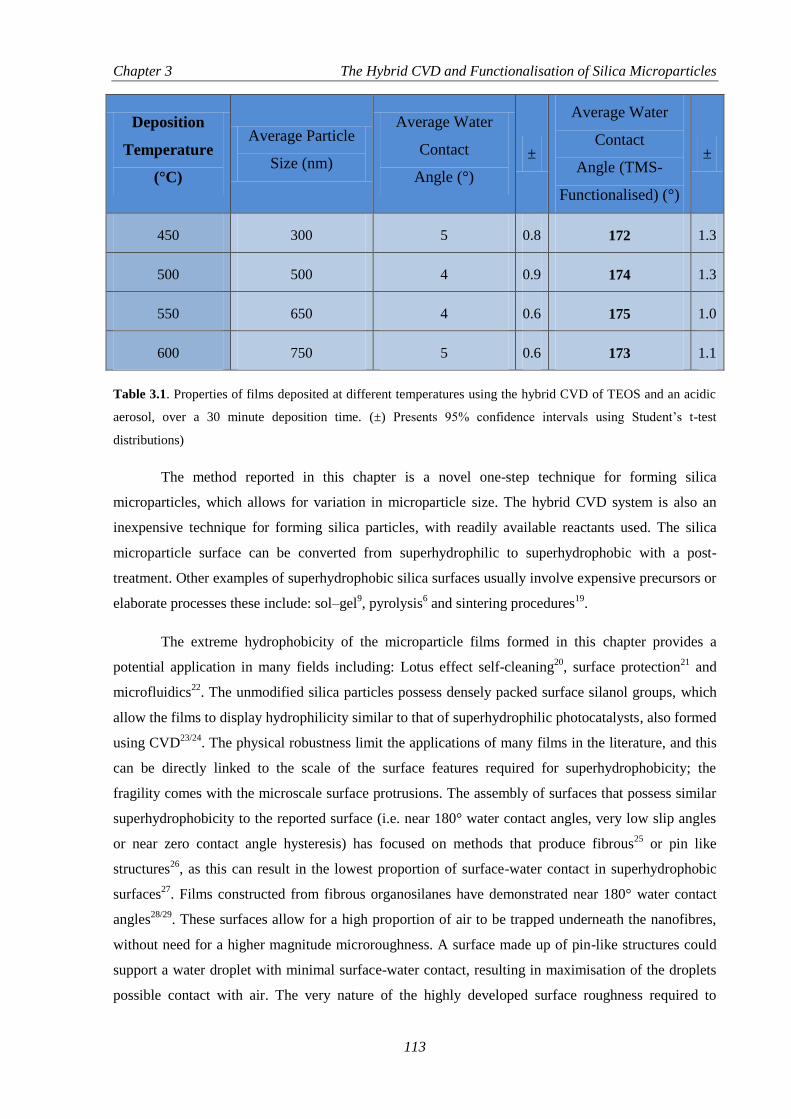
Chapter 3 The Hybrid CVD and Functionalisation of Silica Microparticles
113
Deposition
Temperature
(°C)
Average Particle
Size (nm)
Average Water
Contact
Angle (°)
±
Average Water
Contact
Angle (TMS-
Functionalised) (°)
±
450 300 5 0.8 172 1.3
500 500 4 0.9 174 1.3
550 650 4 0.6 175 1.0
600 750 5 0.6 173 1.1
Table 3.1. Properties of films deposited at different temperatures using the hybrid CVD of TEOS and an acidic
aerosol, over a 30 minute deposition time. (±) Presents 95% confidence intervals using Student’s t-test
distributions)
The method reported in this chapter is a novel one-step technique for forming silica
microparticles, which allows for variation in microparticle size. The hybrid CVD system is also an
inexpensive technique for forming silica particles, with readily available reactants used. The silica
microparticle surface can be converted from superhydrophilic to superhydrophobic with a post-
treatment. Other examples of superhydrophobic silica surfaces usually involve expensive precursors or
elaborate processes these include: sol–gel9, pyrolysis
6 and sintering procedures
19.
The extreme hydrophobicity of the microparticle films formed in this chapter provides a
potential application in many fields including: Lotus effect self-cleaning20
, surface protection21
and
microfluidics22
. The unmodified silica particles possess densely packed surface silanol groups, which
allow the films to display hydrophilicity similar to that of superhydrophilic photocatalysts, also formed
using CVD23/24
. The physical robustness limit the applications of many films in the literature, and this
can be directly linked to the scale of the surface features required for superhydrophobicity; the
fragility comes with the microscale surface protrusions. The assembly of surfaces that possess similar
superhydrophobicity to the reported surface (i.e. near 180° water contact angles, very low slip angles
or near zero contact angle hysteresis) has focused on methods that produce fibrous25
or pin like
structures26
, as this can result in the lowest proportion of surface-water contact in superhydrophobic
surfaces27
. Films constructed from fibrous organosilanes have demonstrated near 180° water contact
angles28/29
. These surfaces allow for a high proportion of air to be trapped underneath the nanofibres,
without need for a higher magnitude microroughness. A surface made up of pin-like structures could
support a water droplet with minimal surface-water contact, resulting in maximisation of the droplets
possible contact with air. The very nature of the highly developed surface roughness required to
Chapter 3 The Hybrid CVD and Functionalisation of Silica Microparticles
114
achieve a near 180° contact angle results in many of the techniques involving complex reaction steps30
or surface etching31
. The technique reported in this chapter utilises an inexpensive and facile method
for producing highly robust films of silica microparticles – facilitated by the aerosol directed
deposition mechanism, with a straightforward post treatment which renders the particles extremely
hydrophobic.
3.4. Conclusions
The acid catalysed hydrolysis of TEOS was carried out using hybrid CVD, a combination of an acidic
aerosol and thermally vaporised precursors. The result was formation of silica microparticles in the
gas phase, the particles were then deposited onto a glass substrate where they undergo further
condensation to form a rugged film. The surface microstructure observed in the silica depositions
(stacks of microparticles) show similarities to that observed in the AACVD depositions described in
chapter 2. It is the common aerosol component of each deposition that allows for the production of
intense surface roughness. The size of particles deposited could be varied with deposition temperature,
with largest particle forming at the higher deposition temperatures. The greatest amount of material
deposited at 550°C. Upon extended depositions the particles piled on together forming a film with a
highly developed microstructure, higher temperature depositions also cause partial melting of
microparticles, providing increased physical robustness. The unmodified films were superhydrophilic
with water contact angles less than 5° achieved. Functionalisation of surface silanol groups with
hydrophobic TMS groups rendered the microparticle film extremely hydrophobic with water contact
angles approaching 180°. A tilt of less than 1° was required to move even very small water droplets,
with droplets rolling as they moved across the surface. Water contact angle hysteresis was near zero,
showing advancing/receding contact angles that were indistinguishable from static water droplets. This
extreme hydrophobicity as well as the variability of surface features provides potential applications in
Lotus effect type self-cleaning.
3.5. References
1. W. B. Fowler and A. H. Edwards, Radiat. Eff. Defects Solids, 1998, 146, 11.
2. X. Yao, Y. Song and L. Jiang, Adv. Mater., 2011, 23, 719.
3. C. Xue, S. Jia, J. Zhang and J. Ma, Sci. Technol. Adv. Mater., 2010, 11, 033002.
4. A. S. D’Souza, C. G. Pantan and K. M. R. Kallur, J. Vac. Sci. Technol. A, 1997, 15, 526.
5. Q. Wei, Y. Wang, Z. Nie, C. Yu, Q. Li, J. Zou and C. Li, Microporous Mesoporous Mater., 2008, 111, 97.
6. K. Chang, Y. Chen, H. Chen, Surf. Coat. Tech., 2008, 202, 3822.
7. A. B. Gurav, S. S. Latthe, C. Kappenstein, S. K. Mukherjee, A. V. Rao and R. S. Vhatkar, J. Porous.
Mater., 2011, 18, 361.
8. X. Liu and J. He, Langmuir, 2009, 25, 11822.
9. M. Manca, A. Cannavale, L. De Marco, A. S. Aricò, R. Cingolani and G. Gigli, Langmuir, 2009, 25, 6357.
Chapter 3 The Hybrid CVD and Functionalisation of Silica Microparticles
115
10. R. Gordon, J. Non-Cryst. Solids., 1997, 218, 81.
11. K. G. Sharp, J. Mater. Chem., 2005, 15, 3812.
12. H. Guo, B. N. Nguyen, L. S. McCorkle, B. Shonkwiler and M. B. Meador, J. Mater. Chem., 2009, 19,
9054.
13. C. Vallée, A. Goullet, A. Granier, A. van der Lee, J. Durand and C. Marliére, J. Non-Cryst. Solids, 2000,
272, 163.
14. J. Lin, X. Zeng and Y. Hou, Polym. Plast. Technol., 2008, 47, 1297.
15. M. Zhu, H. Gao, H. Li, J. Xu and Y. Chen, J. Solid State Chem., 2010, 183, 595.
16. S. Ashraf, C. S. Blackman, G. Hyett and I. P. Parkin, J. Mater. Chem., 2006, 16, 3575.
17. Q. F. Xu, J. N. Wang, I. H. Smith and K. D. Sanderson, J. Mater. Chem., 2009, 19, 655.
18. M. Nosonovsky and B. Bhushan, Microsyst. Technol., 2005, 11, 535.
19. J. Li, J. Fu, Y. Cong, Y. Wu, L. Xue and Y. Han, Appl. Surf. Sci., 2006, 252, 2229.
20. D. Kim, J. Kim, H. C. Park, K. Lee and W. Hwang, J. Micromech. Microeng., 2008, 18, 015019.
21. P. N. Manoudis, A. Tsakalof, I. Karapanagiotis, I. Zuburtikudis and C. Panayiotou, Surf. Coat. Technol.,
2009, 203, 1322.
22. C. J. Teo and B. C. Khoo, Microfluid. Nanofluid., 2010, 9, 499.
23. A. Kafizas, S. Kellici, J. A. Darr and I. P. Parkin, J. Photochem. Photobiol. A, 2009, 204, 183.
24. A. Kafizas and I. P. Parkin, J. Mater. Chem., 2010, 20, 2157.
25. T. Wang, X. Hu and S. Dong, Chem. Commun., 2007, 1849.
26. E. Hosono, S. Fujihara, I. Honma and H. Zhou, J. Am. Chem. Soc., 2005, 127, 13458.
27. S. M. Lee, C. Y. Park, S. I. Bae, J. S. Go, B. Shin and J. S. Ko, Jpn. J. Appl. Phys., 2009, 48, 095504.
28. L. Gao and T. J. McCarthy, J. Am. Chem. Soc., 2006, 128, 9052.
29. L. Gao and T. J. McCarthy, Langmuir, 2008, 24, 362.
30. A. Borras and P. Gröning, Langmuir, 2010, 26, 1487.
31. S. Hsu and W. M. Sigmund, Langmuir, 2010, 26, 1504.

Chapter 4 The AACVD and Functionalisation of Copper (0) and Copper (I) Oxide Thin Films
116
Chapter 4
The Aerosol Assisted Chemical
Vapour Deposition and
Functionalisation of Copper (0)
and Copper (I) Oxide Thin Films
Figure 4.01. Scheme showing the deposition of copper onto a glass substrate and subsequent functionalisation,
with resultant water contact angles also shown.

Chapter 4 The AACVD and Functionalisation of Copper (0) and Copper (I) Oxide Thin Films
117
4. The Aerosol Assisted Chemical Vapour Deposition and Functionalisation of Copper
(0) and Copper (I) Oxide Thin Films
4.1. Introduction
The fabrication of metallic thin films has been of great technological importance in microelectronics
and related areas1, with thin coatings of copper metal acting as interconnecting material within current
circuit boards. Deposition of the copper films has been carried out via decomposition of copper
containing compounds, such as copper acetylacetonates2 in addition to others
3. The relatively high
temperatures required for these decompositions result in many routes resulting in oxide formation,2/4
with pure copper metal acquired after a reductive post treatment5. In-situ prevention of copper oxide
formation usually involves incorporating hydrogen gas or other reducing agent into the decomposition
process6. The production of Cu2O and CuO thin films is an area of huge significance due to their
semiconducting properties, Cu2O and CuO are both p-type semiconductors with a 2.0 eV and 1.21-
1.51 eV band gaps with cubic and monoclinic crystal structures respectively.7 Methods for the
generation of Cu2O and CuO thin films include – thermal oxidation3, CVD
8, sputtering
9, electrolysis
10,
as well as others11/12
. Most of these techniques result in a mixture of copper metal and oxides with only
a limited amount of control over what copper species is formed.
4.1.1 Thin Films of Copper via CVD
Many forms of CVD have been used to deposit metal oxide films13/14
– including atmospheric pressure
CVD15
, aerosol assisted CVD (AACVD)16
, plasma assisted CVD17
and hybrid CVD18
. The CVD of
metal oxide films is readily achieved as the activation of precursors is usually a thermal process, with
the high temperatures directing the synthesis toward the thermodynamically stable oxidised films.19
Metallic films can be formed via similar CVD methods with the use of less reactive metal species20/21
,
the use of low temperatures22/23
or the introduction of reducing agents during depositions5/6
. Copper
organometallics such as copper acetylacetonates are among the most commonly used CVD precursors
to deposit copper films. These types of precursors are frequently utilised as they are readily available,
easy to handle and relatively volatile.24-31
The use of these precursors can result in the deposition of
copper films with mixed or hard to control oxidation states32/33
. Copper salts, including CuI2 and
[Cu(NO3)2], have been used for CVD depositions (as volatile precursors). However due to the high
temperatures required for vaporisation or decomposition copper oxides were readily formed.34/35
4.1.2 Copper in Hydrophobic Surfaces
The modification of copper substrates with oxidising reagents is an established route to forming highly
rough surfaces. The post treatment of these modified surfaces with long-chain thiols renders the
surfaces exceptionally hydrophobic by lowering the surface energy.36-38
It is the combination of the

Chapter 4 The AACVD and Functionalisation of Copper (0) and Copper (I) Oxide Thin Films
118
surface roughness and lowering of surface energy (with respect to water) that result in the extremely
high water repellency.39/40
This chapter describes the deposition of copper metal and cuprous oxide via a single step
AACVD process, with thin film composition able to be altered by varying reaction conditions. The
thin films morphology, phase and deposition route were all investigated. The metallic copper films
generated were also rendered superhydrophobic after they were roughened and functionalised via a
post-treatment with reducing agent and fluorinated thiol. In essence a three-step variation of two-step
routes discussed in Chapter 1.
4.2. Experimental Details
4.2.1 Materials
All chemicals used in this investigation were purchased from Sigma-Aldrich Chemical Co; including
copper nitrate trihydrate, potassium persulfate, sulphuric acid, methanol and ethanol.
4.2.2 Precursor Solutions
Copper nitrate trihydrate ([Cu(NO3)2.3H2O], 0.5 g) was added to 50 mL of solvent (methanol, ethanol
or water). Upon addition, the mixture was left to stir for 5 minutes and used immediately for the
AACVD deposition.
4.2.3 AACVD of [Cu(NO3)2.3H2O] Solutions
The depositions were carried out in a cold-walled horizontal-bed CVD reactor. The reactor contained a
top and bottom plate for deposition to occur, both composed of SiO2 barrier glass (dimensions: 145 x
45 x 5 mm) supplied by Pilkington NSG. Deposition was carried out on the barrier layer to prevent
possible ion transfer from the bulk glass. A carbon block under the bottom plate heated the CVD
reactor. The top plate was positioned 8 mm above and parallel to the bottom plate, the complete
assembly was enclosed within a quartz tube. The aerosol of the precursor solution was generated using
a PIFCOHEALTH ultrasonic humidifier with an operating frequency of 40 kHz and 25 W of power.
The aerosol generated was moved to the reactor using a nitrogen gas flow via PTFE and glass tubing,
where it entered between the top and bottom plate. The reactor waste gas left via an exhaust.
The flow of nitrogen carrier gas transported the vapour from the flask until all liquid was
spent; this took typically 60 min. The flow of nitrogen was maintained at 1.0 L/min. The reactor’s
heating was continued for a further 10 min after the deposition and then switched off, the flow of
nitrogen was continued until cool. The cooled plates were removed and handled in air. The film
deposition occurred on the bottom plate. The temperature of the bottom plate was varied between 300–
550°C with corresponding changes in film composition determined.

Chapter 4 The AACVD and Functionalisation of Copper (0) and Copper (I) Oxide Thin Films
119
4.2.4 Film Characterisation
The films were analysed while adhered to the glass substrate. Field emission SEM analysis of the
films was carried out using a Jeol JSM- 6301F operating at 5kV. EDX analysis was also carried out on
the same machine using an operating frequency of 10 kV. Powder X-ray diffraction (XRD) patterns
were measured on a Brucker D8 discovery instrument using monochromated Cu Kα radiation (λ =
1.5406 Å) in the reflection mode. Raman spectra were taken over the range 400-4000 cm-1
on a
Renishaw Raman System 1000 using a helium-neon laser (λ = 532 nm) calibrated against the emission
lines of neon. UV-vis spectra were taken using a Perkin Elmer Lambda 25 UV/VIS Spectrometer
single beam instrument over a range of 300-1000 nm. Adherence/Scratch tests were carried out using
Scotch Home and Office masking tape and a metal scalpel.
4.2.5 Functionalisation of Copper Metal Films
Copper films were submerged in dilute HCl for 2 mins. The samples were then immersed in an
aqueous solution of potassium persulfate (0.06 M) and sulphuric acid (1.2 M) for 20 mins and then
washed with water and air dried. The resulting films were then submerged in a solution of
perfluorodecanethiol (0.025 M) in toluene. This thiol was chosen as it is a fluorinated equivalent of a
widely used species to modify similar copper surfaces36
. The samples were removed from the solution,
washed with toluene and air dried. This process was also carried out on 2 mm thick copper plate for
comparison.
4.2.6 Surface Hydrophobicity Measurements
Water contact angles were measured using an FTA-100-B Automated Drop Shape Analyzer, 3 μL
water droplets were used to minimise any gravitational effects. The water droplet images were
analysed using a digital protractor to obtain the contact angles on the surface. The surfaces were tested
from a range of areas over the substrate plate. Water slip angles were also measured by noting the
angle to the horizontal at which a water droplet of known volume moved on the surface. Spots from
many positions were measured from each surface.
4.3. Results and Discussion
4.3.1 AACVD of [Cu(NO3)2.3H2O] in Methanol
4.3.1.1 Film Appearance and Substrate Adhesion
All films were uniformly deposited over the bottom substrate, and all were well adhered to the
substrate remaining attached after the action of Scotch tape, with minimal damage observed after the
use of a scalpel on films deposited at 300°C and 350°C. Films deposited at 300°C and 350°C appeared

Chapter 4 The AACVD and Functionalisation of Copper (0) and Copper (I) Oxide Thin Films
120
red/brown in reflected light (Figure 4.02). Transmitted light passing through the films transmitted
green. The deposition carried out at 350°C reflected more light and appeared less transparent and was
also less green in transmittance (relative to that deposited at 300°C). Films deposited at and above
400°C were transparent and appeared yellow/brown in reflected light (Figure 4.02).
Figure 4.02. Photograph showing films deposited using [Cu(NO3)2.3H2O] in methanol at a deposition
temperature of 350°C (left) and 450°C (right). Scale bar shown.
4.3.1.2 Surface Microstructure
SEM was used to image the films (Figure 4.03), the surface structure depended strongly on the
deposition temperature. The low temperature (300°C /350°C) depositions showed large surface
features indicating an island growth mechanism in these conditions. At higher deposition temperatures
the surface features became smaller in size and these particles were less distinct. This change in
surface morphology may be due to the deposited material having a different crystal structure (vide
infra).
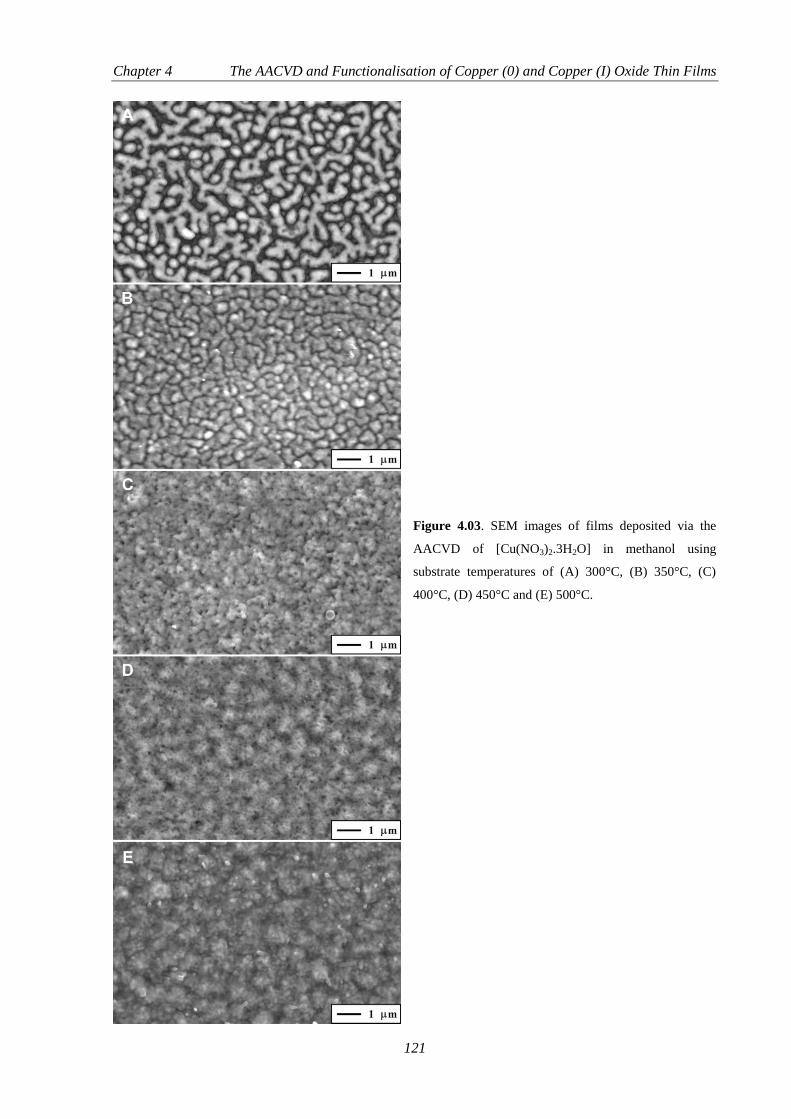
Chapter 4 The AACVD and Functionalisation of Copper (0) and Copper (I) Oxide Thin Films
121
Figure 4.03. SEM images of films deposited via the
AACVD of [Cu(NO3)2.3H2O] in methanol using
substrate temperatures of (A) 300°C, (B) 350°C, (C)
400°C, (D) 450°C and (E) 500°C.

Chapter 4 The AACVD and Functionalisation of Copper (0) and Copper (I) Oxide Thin Films
122
4.3.1.3 Phases Deposited
The elemental composition of the films deposited could be controlled by simply varying the substrate
temperature (Figure 4.04). Substantial deposition only occurred above 300°C, with a mixture of
copper metal and Cu2O being formed at this temperature. A film of copper metal was obtained at a
temperature of 350°C, and was also shown to be electrically conductive (less than 2Ω resistance
registered on an ammeter). A slight presence of Cu2O was observed using XRD, but this could
however be due to reaction at the boundary with the glass substrate41
. EDX analysis confirmed copper
metal and a very low proportion of Cu2O, less than 2%. The Cu2O character of the film increased with
deposition temperature, CuO did not appear in any depositions. Reflections relating to copper metal
were not apparent in the depositions at 450°C and 500°C.
Figure 4.04. XRD of films deposited via the AACVD of [Cu(NO3)2.3H2O] in methanol at the associated
substrate temperatures. Peaks positions relating to Cu and Cu2O are marked.
The deposition of metallic copper films usually takes place at lower temperature than those
achieved via the method described in this chapter42
, with elevated temperature resulting in oxide
formation (Cu2O/ CuO).35/43
The formation of Cu2O at 350°C was prevented by the flow of nitrogen
through the reactor during substrate cooling, when nitrogen flow was terminated prior to cool-down
Cu2O films would result due to the heated copper film oxidising once exposed to air (Figure 4.05). The
hydrophobicities of the films were also tested with copper metal surfaces formed at 350°C, the water

Chapter 4 The AACVD and Functionalisation of Copper (0) and Copper (I) Oxide Thin Films
123
contact angles averaged 87° prior to any alteration. All other films gave more hydrophilic water
contact angles; between 30-75°.
Figure 4.05. XRD of films deposited via the AACVD of [Cu(NO3)2.3H2O] using a 350°C substrate
temperatures, (lower) in ethanol with nitrogen (middle), in methanol with nitrogen and (upper) in methanol with
no nitrogen gas flowing through the reactor during cooling of the substrates.
4.3.2 AACVD of [Cu(NO3)2.3H2O] in Ethanol and Water
The films deposited using ethanol as a solvent were carried out using exactly the same conditions as
the methanol CVD experiments. All films generated appeared brown/yellow in appearance; films
showed a partial redness for films deposited at 300°C/350°C. The adherence of the films was
relatively poor compared to the methanol depositions, surviving action by Scotch tape. However the
films were removed with the action of the scalpel. The surface morphologies (examined by SEM)
were similar to those observed in the depositions that used methanol. The glancing angle XRD of the
films confirmed them to be Cu2O. The presence of copper metal was observed for depositions taking
place at 300°C/350°C (Figure 4.05).

Chapter 4 The AACVD and Functionalisation of Copper (0) and Copper (I) Oxide Thin Films
124
The generation of copper metal films at 350°C substrate temperature suggests a reducing
environment. In-situ hydrogen generation has been reported via decomposition of methanol over
copper44
:
Formation of copper metal was highly unexpected, as methanol is commonly used as a solvent in
AACVD depositions as a successful oxygen source for many depositions.45-47
The expected
thermodynamic product of copper nitrate decomposition would be CuxO. The combination of a low
temperature deposition and a potentially reducing atmosphere allows for the formation of copper
metal. The failure to generate metallic copper in great abundance at 350°C while using ethanol
suggests a less reducing atmosphere. The catalytic breakdown of ethanol to form hydrogen has been
shown to be less efficient than that of methanol.48
A more reducing atmosphere during the reactions
occurs while using methanol solvent, due to a more efficient production of hydrogen, as a result
predominantly copper metal films are formed.
4.3.3 Functionalisation of Copper (0) Films
4.3.3.1 Film Properties
The treatment of copper metal films formed by AACVD with the NaOH/K2S2O8 solution resulted in
uniform coverage of the coatings with nanoscale crystals, approximately 200 nm in length and 50 nm
in diameter (Figure 4.06). The crystals were confirmed to be Cu(OH)2 by XRD. The formation of the
nano-crystal films had an effect on the films robustness, as they survived Scotch tape; however they
were removed by the action of a scalpel. The surfaces reflected green light upon oxidation, and
showed no further visible change upon functionalisation with perfluorodecanethiol. The surface
features are relatively small when compared to the same treatment when applied to 2 mm thick copper
plates (Figure 4.06). The causes of differences observed in surface structures stem from the thickness
of the deposited material, confirmed to be approximately 400 nm at the thickest part of the metallic
films (cross-sectional SEM), in addition to the microstructure of copper film deposited driving small
crystallite growth. The treatment of copper plates provided a substantial amount of material and no
grain boundaries which facilitated the formation of large surface features. However the lack of
material and microstructure of the films on the AACVD substrates limited the growth of Cu(OH)2
crystals and thus surface features are relatively small.

Chapter 4 The AACVD and Functionalisation of Copper (0) and Copper (I) Oxide Thin Films
125
Figure 4.06. SEM image of Cu(OH)2 nano-crystals formed by immersing copper metal surfaces in
NaOH/K2S2O8 solution for 20 mins – (left) copper deposited by AACVD and (right) copper plate. Scale bars
inset.
4.3.3.2 Hydrophobicity
Upon formation of Cu(OH)2 nano-crystals the water contact angle decreased to approximately 10°,
from the 87° observed on the copper metal films. Functionalisation of the nano-crystals with thiol
resulted in a surface that demonstrated near perfect hydrophobicity – water contact angles approached
180° (Figure 4.07) and tilt angles were less than 1°. The highly rough nano-structure of the coating
allows air to be trapped under the water droplet as it lies on the surface; this minimises any water-
surface contact. The perfluorodecanethiol lowers the energy of interaction at any points where contact
is made (Figure 4.08). The combination of highly rough surface and very low energy of interaction
results in a surface that is highly water repellent, requiring a particularly level surface to support a
static water droplet. The surface facilitates elastic bouncing of water droplets which is exhibited by
extremely hydrophobic surfaces. Depositions on substrates via CVD usually occur in a conformal
manner, coating all the substrate uniformly; the deposition route discussed in this chapter demonstrates
an island growth pattern (Figure 4.03). Subsequent functionalisation of copper films could be
employed on substrates with pre-existing microscale roughness, and would provide dual-scale
roughness upon nano-crystal synthesis which would elevate surface hydrophobicity even further.49
Figure 4.07. Water droplets (3μL) on copper deposited by AACVD, Cu(OH)2 nano-crystals formed by oxidising
copper and thiol-functionalised Cu(OH)2 nano-crystal films.

Chapter 4 The AACVD and Functionalisation of Copper (0) and Copper (I) Oxide Thin Films
126
Figure 4.08. Schematic showing the deposition and functionalisation steps of copper coating. (i) AACVD of
[Cu(NO3)2.3H2O] using a substrate temperature of 350°C, (ii) Oxidation of copper with potassium persulfate and
sulphuric acid solution and (iii) functionalisation of surface using a toluene solution of perfluorodecanethiol.
4.4. Conclusions
Near perfect superhydrophobic films were synthesised via a simple solution-based functionalisation of
copper metal films deposited using AACVD. In-situ decomposition of alcohols during the CVD
process provided a reducing atmosphere facilitating the formation of copper metal films from copper
nitrate precursors. The compositions of copper films could be controlled by the substrate temperature
and solvent used, with copper metal or Cu2O films deposited. The employed technique is a facile
method for generating copper films with potential applications in metallic of semiconductor coatings,
dependant on deposition conditions. The conformal coverage of CVD depositions combined with
depositions on roughened substrates would provide a dual-scale roughness and improved
hydrophobicity.
4.5. References
1. R. Becker, A. Devi, J. Weiß, U. Weckenmann, M. Winter, C. Kiener, H. Becker and R. A. Fischer,
Chem. Vap. Deposition, 2003, 9, 149.
2. B. Wisniewski, J. Durand and L. Cot, J. Phys. II, 1991, 1, 389.
3. B. T. Collins, W. Desisto, R. Kershaw, K. Dwight and A. Wold, J. Less Common Met., 1989, 156, 341.
4. Z.H. Gan, G. Q. Yu, B. K. Tay, C. M. Tan, Z. W. Zhao and Y. Q. Fu, J. Phys. D: Appl. Phys., 2004,
37, 81.
5. D. R. Sparks and G. M. Vest, Thin Solid Films, 2001, 200, 77.
6. H. Ko, J. Jhin, D. Byun, J. Lee and D. Park, IEEE Trans. Compon. Packag. Technol., 2005, 28, 781.
7. G. Papadimitropoulos, N. Vourdas, V. Em Vamvakas and D. Davazoglou, J. Phys. Conf. Ser., 2005,
10, 182.
8. X. Lin, Q. Wang, S. Wu and Z. Liu, J. Electrochem. Soc., 2006, 153, C142.
9. G. Correa and R. Almanza, Sol. Energy, 2004, 76, 111.
10. M. R. Madjidi, K. Asadpour-Zeynali and B. Hafezi, Int. Electrochem. Sci., 2011, 6, 162.
11. H. Y. H. Chan, C. G. Takoudis and M. J. Weaver, J. Phys. Chem. B, 1999, 103, 357.
12. S. W. Ko, T. Dechakupt, C. A. Randall, S. Trolier-McKinstry, M. Randall and A. Tajuddin, J.
Electroceram., 2010, 24, 161.
13. R. Gordon, J. Non-Cryst. Solids, 1997, 218, 81.

Chapter 4 The AACVD and Functionalisation of Copper (0) and Copper (I) Oxide Thin Films
127
14. K. L. Choy, Prog. Mater. Sci., 2003, 48, 57.
15. A. Kafizas and I. P. Parkin, J. Mater. Chem., 2010, 20, 2157.
16. M. R. Waugh, G. Hyett and I. P. Parkin, Chem. Vap. Deposition, 2008, 14, 366.
17. J. A. Babcock, S. G. Balster, A. Pinto, C. Dirnecker, P. Steinmann, R. Jumpertz and B. El-Kareh, IEEE
Electron Device Lett., 2001, 22, 230.
18. R. Binions, C. Piccirillo, R. G. Palgrave and I. P. Parkin, Chem. Vap. Deposition, 2008, 14, 33.
19. P. A. Williams, A. C. Jones, N. L. Tobin, P. R. Chalker, S. Taylor, P. A. Marshall, J. F. Bickley, L. M.
Smith, H. O. Davies and G. W. Critchlow, Chem. Vap. Deposition, 2003, 9, 309.
20. R. G. Palgrave and I. P. Parkin, Chem. Mater., 2007, 19, 4639.
21. A. Grodzicki, I. Łakomska, P. Piszczek, I. Szymańska and E. Szłyk, Coord. Chem. Rev., 2005, 249,
2232.
22. D. W. Sheel and J. L. Hodgkinson, Plasma Processes Polym., 2007, 4, 537.
23. N. Bahlawane, P. A. Premkumar, Z. Tian, X. Hong, F. Qi and K. Kohse-Höinghaus, Chem. Mater.,
2010, 22, 92.
24. P. Piszczek, I. Szymańska, W. Bała, K. Bartkiewicz, E. Talik and J. Heiman, Thin Solid Films, 2008,
516, 3924.
25. P. A. Premkumar, N. Bahlawane and K. Kohse-Höinghaus, Chem. Vap. Deposition, 2007, 13, 219.
26. P. A. Premkumar, N. Bahlawane, G. Reiss and K. Kohse-Höinghaus, Chem. Vap. Deposition, 2007, 13,
227.
27. F. Maury, S. Vidal and A. Gleizes, Adv. Mater. Opt. Electron., 2000, 10, 123.
28. W. Zhuang, L. J. Charneski, D. R. Evans, S. T. Zhu, Z. Tang and A. M. Guloy, J. Phys. IV, 2001, 11,
553.
29. J. A. T. Norman, J. Phys. IV, 2001, 11, 497.
30. R. Becker, J. Weiß, A. Devi and R. A. Fischer, J. Phys. IV, 2001, 11, 569.
31. R. Becker, A. Devi, J. Weiß, U. Weckenmann, M.Winter, C. Kiener, H. Becker and R. A. Fischer,
Chem. Vap. Deposition, 2003, 9, 149.
32. D. Barreca, A. Gasparotto, C. Maccato, E. Tondello, O. I. Lebedev and G. Van Tondello, Cryst.
Growth Des., 2009, 9, 2470.
33. J. Medina-Valtierra, J. Ramírez-Ortiz, V. M. Arroyo-Rojas, P. Bosch and J. A. de los Reyes, Thin Solid
Films, 2002, 405, 23.
34. M. Ottosson and J. Carlsson, Surf. Coat. Technol., 1996, 78, 263.
35. H. M. Yates, L. A. Brook, D. W. Sheel, I. B. Ditta, A. Steele and H. A. Foster, Thin Solid Films, 2008,
517, 517.
36. Q. Pan, M. Wang and H. Wang, Appl. Surf. Sci., 2008, 254, 6002.
37. C. Wang, T. Yao, J. Wu, C. Ma, Z. Fan, Z. Wang, Y. Cheng, Q. Lin and B. Yang, ACS Appl. Mater.
Interfaces, 2009, 1, 2613.
38. X. Wu and G. Shi, J. Phys. Chem. B, 2006, 110, 11247.
39. R. N. Wenzel, Ind. Eng. Chem., 1936, 28, 988.
40. A. B. D. Cassie and S. Baxter, Trans. Faraday Soc., 1944, 40, 546.
41. G. P. Schwartz, J. E. Griffiths and G. J. Gualtier, Thin Solid Films, 1982, 94, 213.

Chapter 4 The AACVD and Functionalisation of Copper (0) and Copper (I) Oxide Thin Films
128
42. W. Xu, J. S. Yang and T. J. Lu, Mater. Des., 2011, 32, 154.
43. A. Y. Oral, E. Menşur, M. H. Aslan and E. Başaran, Mater. Chem. Phys., 2004, 83, 140.
44. S. D. Jackson, D. S. Anderson, G. J. Kelly, T. Lear, D. Lennon and S. R. Watson, Top. Catal., 2003, 22,
173.
45. C. Edusi, G. Hyett, G. Sankar and I. P. Parkin, Chem. Vap. Deposition, 2011, 17, 30.
46. S. Ashraf, C. S. Blackman, R. G. Palgrave, S. C. Naisbitt and I. P. Parkin, J. Mater. Chem., 2007, 17,
3708.
47. A. A. Tahir, K. G. U. Wijayantha, M. Mazhar and V. McKee, Thin Solid Films, 2010, 518, 3664.
48. S. R. Segal, K. A. Carrado, C. L. Marshall and K. B. Anderson, Appl. Catal., A, 2003, 248, 33.
49. B. Cortese, S. D’Amone, M. Manca, I. Viola, R. Cingolani and G. Gigli, Langmuir, 2008, 24, 2712.

Chapter 5 Bacterial Adhesion to Superhydrophobic Polymer Surfaces
129
Chapter 5
Bacterial Adhesion to
Superhydrophobic
Polymer Surfaces
Figure 5.01. Schematic showing the interaction of a bacterial suspension and a superhydrophobic surface.
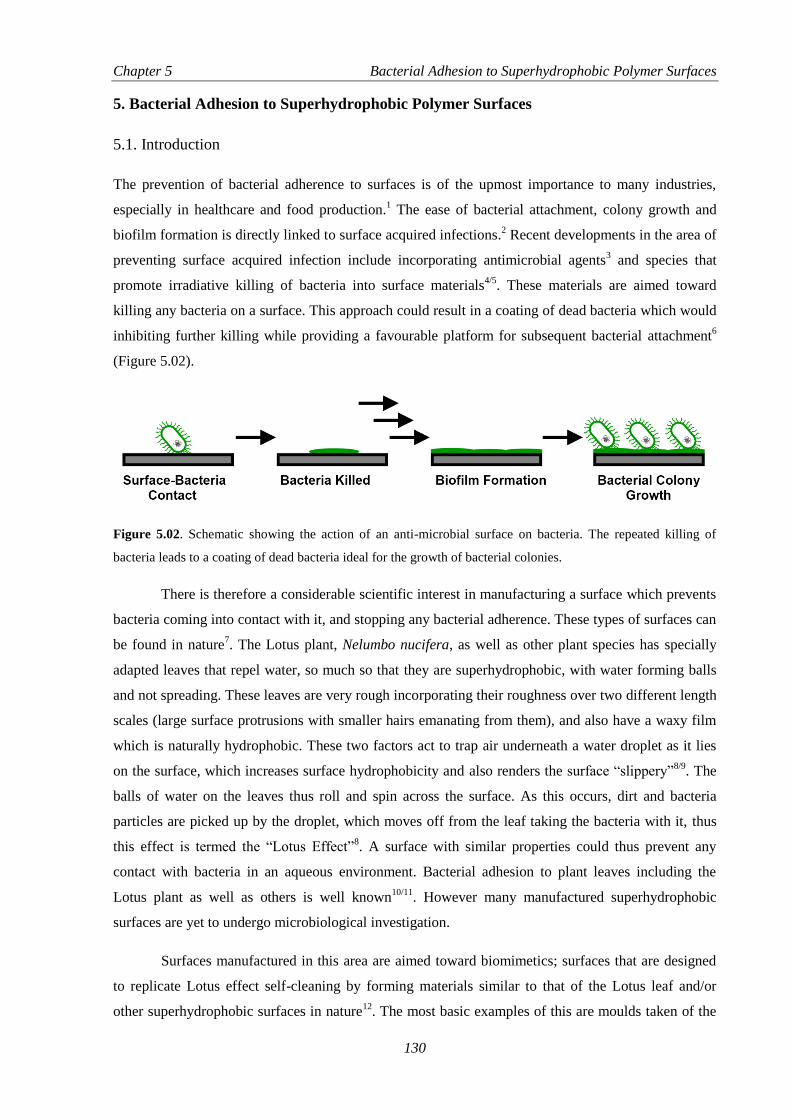
Chapter 5 Bacterial Adhesion to Superhydrophobic Polymer Surfaces
130
5. Bacterial Adhesion to Superhydrophobic Polymer Surfaces
5.1. Introduction
The prevention of bacterial adherence to surfaces is of the upmost importance to many industries,
especially in healthcare and food production.1 The ease of bacterial attachment, colony growth and
biofilm formation is directly linked to surface acquired infections.2 Recent developments in the area of
preventing surface acquired infection include incorporating antimicrobial agents3 and species that
promote irradiative killing of bacteria into surface materials4/5
. These materials are aimed toward
killing any bacteria on a surface. This approach could result in a coating of dead bacteria which would
inhibiting further killing while providing a favourable platform for subsequent bacterial attachment6
(Figure 5.02).
Figure 5.02. Schematic showing the action of an anti-microbial surface on bacteria. The repeated killing of
bacteria leads to a coating of dead bacteria ideal for the growth of bacterial colonies.
There is therefore a considerable scientific interest in manufacturing a surface which prevents
bacteria coming into contact with it, and stopping any bacterial adherence. These types of surfaces can
be found in nature7. The Lotus plant, Nelumbo nucifera, as well as other plant species has specially
adapted leaves that repel water, so much so that they are superhydrophobic, with water forming balls
and not spreading. These leaves are very rough incorporating their roughness over two different length
scales (large surface protrusions with smaller hairs emanating from them), and also have a waxy film
which is naturally hydrophobic. These two factors act to trap air underneath a water droplet as it lies
on the surface, which increases surface hydrophobicity and also renders the surface “slippery”8/9
. The
balls of water on the leaves thus roll and spin across the surface. As this occurs, dirt and bacteria
particles are picked up by the droplet, which moves off from the leaf taking the bacteria with it, thus
this effect is termed the “Lotus Effect”8. A surface with similar properties could thus prevent any
contact with bacteria in an aqueous environment. Bacterial adhesion to plant leaves including the
Lotus plant as well as others is well known10/11
. However many manufactured superhydrophobic
surfaces are yet to undergo microbiological investigation.
Surfaces manufactured in this area are aimed toward biomimetics; surfaces that are designed
to replicate Lotus effect self-cleaning by forming materials similar to that of the Lotus leaf and/or
other superhydrophobic surfaces in nature12
. The most basic examples of this are moulds taken of the

Chapter 5 Bacterial Adhesion to Superhydrophobic Polymer Surfaces
131
leaves which are then used to cast replica surfaces from hydrophobic (low energy) materials13
. Most
manufactured materials take only the main principles from examples found in nature14/15
, making
surfaces from a low energy material with a highly developed microstructure, and some incorporating
two different length scales in roughness16/17
.
The previous chapters describe the synthesis of hydrophobic surfaces. The surfaces
investigated in this chapter were constructed from the curable silicone elastomer (Sylgard 184) as
described in Chapter 2 using AACVD (Section 2.1). The elastomer is inherently hydrophobic, with a
water contact angle of 95° being achieved on a flat surface. The AACVD depositions allow the
formation of a network of polymer surface protrusions approximate 3 μm in height. The surface
protrusions allow water to sit on them, thus trapping air underneath, resulting in a surface that mimics
the Lotus leaf surface and Lotus effect self-cleaning. This investigation looks specifically at bacterial
adhesion on the surface compared to control materials.
5.2. Experimental Details
5.2.1 Materials
The chemicals used in this investigation were acquired as follows; purchased from Sigma-Aldrich
Chemical Co; chloroform and phosphate buffered saline (PBS). Columbia Blood Agar Base and Brain
Heart Infusion (BHI) Broth were both purchased from Oxoid Ltd. BacLight Bacterial Viability Stain
was purchased from Invitrogen Ltd. Sylgard 184 Silicone Elastomer was purchased from R. W.
Greeff.
5.2.2 Sylgard 184 Precursor Solutions
Sylgard 184 (0.50 g) was dissolved in chloroform (50 mL) with rapid stirring for 5 min. In order to
prevent premature curing the mixture was used immediately after stirring for deposition studies.
5.2.3 Dip-coating of Microscope Slides
Cut-edged microscope slides purchased from VWR International (71 x 21 x 1 mm) were cut into three
equally sized portions (23.6 x 21 x 1 mm). Each of these glass slide portions was submerged in a
chloroform: Sylgard 184 mixture (2:1) and withdrawn at an arbitrary rate (ca. 0.5 mm/s). The coated
substrates were laid horizontally in a vacuum desiccator kept at room temperature and left to cure for
48 h. The upward-facing side of the coated glass was subsequently used in the AACVD process or
underwent bacterial adherence tests.

Chapter 5 Bacterial Adhesion to Superhydrophobic Polymer Surfaces
132
5.2.4 AACVD of Sylgard 184 onto Polymer-Coated Microscope Slides
The AACVD depositions were carried out in a cold-walled horizontal-bed CVD reactor. The reactor
contained top and bottom glass plates, both with SiO2 coated barrier glass (dimensions: 145 x 45 x 5
mm; barrier thickness 50 nm) supplied by Pilkington NSG. A carbon block on which the bottom plate
was placed heated the CVD reactor. The top plate was positioned 8 mm above and parallel to the
bottom plate, the complete assembly was enclosed within a quartz tube. Dip-coated glass slides were
pressed onto the top plate, placed 35 mm away from the reactor inlet to ensure conformal coverage of
all portions, the slides were held in place by the natural adhesiveness of the cured elastomer
(schematic shown in Figure. 5.03). The aerosol of the precursor solution was generated using a PIFCO
HEALTH ultrasonic humidifier operating with a frequency of 40 kHz and with 25 W of power. The
generated aerosol was moved to the reactor using a nitrogen gas flow via PTFE and glass tubing,
where it entered between the top and bottom plates. The reactor waste gas left via an exhaust.
Figure 5.03. Schematic of the AACVD apparatus, shown is the position of the polymer coated microscope
slides. The edge of the first slide is positioned 35 mm away from the reactor inlet, in the middle of the top plate.
The nitrogen flow carried the vapour from the flask until all liquid was gone, typically taking
30–35 min for a deposition. The heater was then turned off and allowed to cool to room temperature,
the nitrogen flow was left on for a further 10 min. The cooled plates were removed and handled in air,
the film was deposited on the top plate and the attached microscope slides. The reactor temperature, as
measured by a thermocouple in the carbon heater block was maintained at 360°C. Each experiment
provided three microscope slide portions, these were removed from the top plate using a scalpel,
which was slid between the two pieces of glass (Figure 5.04). These AACVD coated glass slides were
used for bacterial adherence assays.

Chapter 5 Bacterial Adhesion to Superhydrophobic Polymer Surfaces
133
Figure 5.04. Schematic showing the film deposition process of microscope slide portions. The AACVD slide
was removed from the top plate prior to microbiological testing.
5.2.5 Film Characterisation
The elastomer films were analysed as coatings on the microscope glass slide. Subsections (ca 1 x 1
cm) of the samples were gold-sputtered and analysed using field emission scanning electron
microscopy (SEM) using a Jeol JSM-6301F operating at 5 kV. IR spectroscopy was employed over
the range of 2200–4000 cm−1
using a Perkin Elmer FT-IR (Fourier transform infrared) Spectrum RX1
instrument. Raman measurements were made using a Renishaw 1000 spectrometer which used a 632.8
nm laser. UV–visible absorption spectra were taken using a Perkin Elmer Lambda 25 UV/VIS
Spectrometer single beam instrument over a range of 300–1000 nm. Adherence tests were carried out,
done by applying Scotch Home and Office masking tape to the surface followed by its removal.
Scratch tests were also carried out by observing the action of a metal scalpel being dragged across a
surface.
5.2.6 Surface Hydrophobicity Measurements
Water contact angle measurements were also taken using a FTA-1000 drop shape instrument, 3 μL
water droplets was used to minimise any gravitational effects. The water droplet images were analysed
using a digital protractor to obtain the contact angles on the surface. Points from across the slides were
tested from a range of areas over the substrate plate.
5.2.7 Bacterial Strains
The bacterial strains used in this study were Escherichia coli (ATCC 25922) and Methicillin-resistant
Staphylococcus aureus (eMRSA-16). Both were maintained by weekly subculture on Columbia blood
agar. For experimentation, a single colony was taken from a culture plate and inoculated into 10 mL of
BHI broth and cultured overnight at 37 °C in air with constant rotation (200 rpm).
5.2.8 Bacterial Attachment Assay
For determining the ability of AACVD deposited surfaces to prevent or reduce bacterial adhesion, a
live/dead attachment assay was developed. All standard microbiological-safety precautions were taken
during the assessment of bacterial attachment. Bacteria from overnight BHI broth cultures were

Chapter 5 Bacterial Adhesion to Superhydrophobic Polymer Surfaces
134
centrifuged (8000 x g, 1 min) to collect cells and the pellet resuspended in an equal amount of PBS.
The OD600 of this cell suspension was adjusted to an absorbance of 0.05 to give an approximate titre of
1×10⁷ colony-forming unit/mL. Adjusted cell suspensions were aliquoted (30 mL) into sterile Petri
dishes and a single glass slide of each type (uncoated, dip-coated and AACVD coated), placed into
each 30 mL of bacterial suspension. Duplicate slides of each type were used per assay. Bacteria were
allowed to statically attach to each surface in suspension for 1 hour, upon which time each slide was
removed and serially washed twice in 50 mL of PBS by inversion to remove any non-adherent
transient bacteria. Washed slides were placed into 30 mL of BacLight Bacterial Viability Stain at
ambient temperature in the dark for 15 min. BacLight Bacterial Viability Stain was prepared by adding
3 μL each of component A and component B per 10 mL of PBS.
5.2.9 Fluorescence Microscopy
Bacteria attached to glass slides (uncoated, dip-coated and CVD coated) were visualized by
fluorescence microscopy using an Olympus BX51 microscope equipped with a Chroma 61000v2
D/F/R C73315 DAPI, FITC and TRITC triple bandpass fluorescence mirror unit, excited using an
Olympus U-RFL-T Mercury burner and a 60x water lens. Using this fluorescence filter, live bacteria
fluoresce green while membrane compromised (dead) bacteria fluoresce red. Images of the field of
view were taken using a QImaging MicroPublisher 5.0RTV camera and Simple PCI (Compix Inc.
Imaging systems) image capturing software. For each slide type, 5–7 images of field of view were
taken at incremental points along the length of the slide. The numbers of live and dead bacteria were
enumerated per field of view for each image taken.
5.3. Results and Discussion
5.3.1 AACVD of Sylgard 184
The AACVD depositions were carried out in the same way as described in Chapter 2, with microscope
slides introduced to facilitate the generation of consistent films for microbiological analysis (films
deposited over larger barrier layer glass substrates showed a larger variation in film properties). The
AACVD depositions occurred on the top plate inside the CVD reactor, which meant the slides had to
be held in place. Methods of physical attachment such as clips caused patches of uncoated substrate at
the securing points. However using dip-coated glass facilitated the natural stickiness of the elastomer
to hold microscope slide portions in place on the top plate. The dip-coated slides had their backs (the
sides which made contact with the vacuum desiccator during curing) pressed onto the top plate,
applying slight pressure while in place, a residual amount of elastomer film was enough to adhere the
slides. Upon heating during the depositions, the elastomer hardened slightly and the microscope slides
became stuck to the top plate, they were however able to be removed via separation with a scalpel.

Chapter 5 Bacterial Adhesion to Superhydrophobic Polymer Surfaces
135
The elastomer pre-treatment was already shown to increase the physical robustness of the
superhydrophobic films deposited via AACVD (Chapter 2). The physical appearance of the films on
the microscope slide glass did not change relative to those deposited on silica barrier layer glass
(confirmed by UV–Visible spectroscopy), appearing as a hazy white film. The infra-red spectroscopy
also remained consistent with the films deposited on barrier layer glass, giving no indication of major
alterations caused by ion migration from the microscope slide glass. The films were imaged using
SEM, the images gained showed no noticeable differences from the films deposited onto silica barrier
layer glass (Figure 5.05). The surface features, deposited via AACVD, did show a degree of
integration into the elastomer coating the substrate. This increased attachment to the underlying
substrate is most likely the reason for the observed greater physical resistance of the films, when
compare to depositions on plain glass.
Figure 5.05. SEM images of a Sylgard 184 film deposited using AACVD using a deposition temperature of
360°C onto glass microscope slide substrates pre-treated with a dip-coated layer of the same elastomer, (left)
from above (right) side-on. Partial integration of features deposited during AACVD into the elastomer coated
substrate can be seen. Scale bar shown.
Water contact angle measurements of the microscope slides coated via AACVD were made
prior to bacteria adherence testing (photograph of water droplet on the surface is shown in Figure
5.06). The average water contact angle achieved was 165° (with standard deviation = 1.31°), similar to
the results observed on pre-coated barrier layer glass. All substrates gave consistent measurements
independent of the microscope slide portion in the reactor. The consistently higher hydrophobicity was
afforded by the pre-treated microscope slides. The interaction of water with the underlying substrate
would be reduced due to the lower energy surface provided by the dip-coated polymer surface (water
contact angle ~95°), relative to plain glass (water contact angle ~60°). Any faults in the protrusions on
the surface may provide an opening for water to make contact with the surface. Therefore lessening
the energy of this interaction has made the water contact angles more consistent.
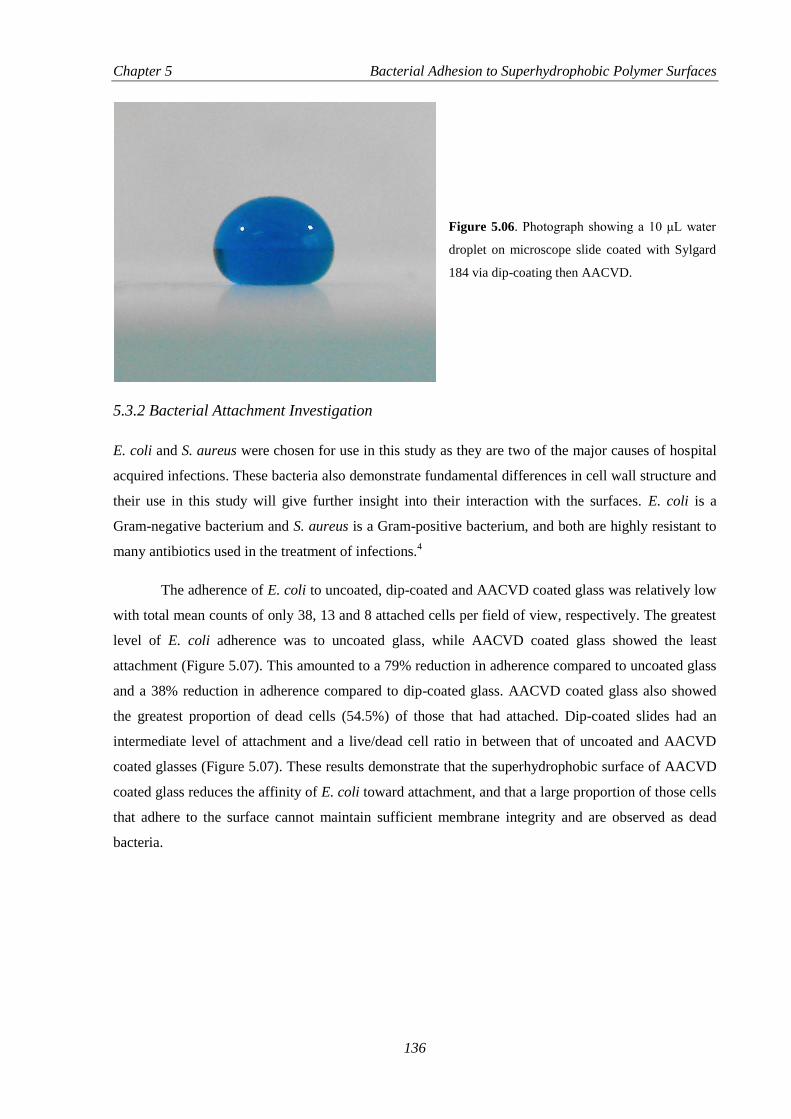
Chapter 5 Bacterial Adhesion to Superhydrophobic Polymer Surfaces
136
Figure 5.06. Photograph showing a 10 μL water
droplet on microscope slide coated with Sylgard
184 via dip-coating then AACVD.
5.3.2 Bacterial Attachment Investigation
E. coli and S. aureus were chosen for use in this study as they are two of the major causes of hospital
acquired infections. These bacteria also demonstrate fundamental differences in cell wall structure and
their use in this study will give further insight into their interaction with the surfaces. E. coli is a
Gram-negative bacterium and S. aureus is a Gram-positive bacterium, and both are highly resistant to
many antibiotics used in the treatment of infections.4
The adherence of E. coli to uncoated, dip-coated and AACVD coated glass was relatively low
with total mean counts of only 38, 13 and 8 attached cells per field of view, respectively. The greatest
level of E. coli adherence was to uncoated glass, while AACVD coated glass showed the least
attachment (Figure 5.07). This amounted to a 79% reduction in adherence compared to uncoated glass
and a 38% reduction in adherence compared to dip-coated glass. AACVD coated glass also showed
the greatest proportion of dead cells (54.5%) of those that had attached. Dip-coated slides had an
intermediate level of attachment and a live/dead cell ratio in between that of uncoated and AACVD
coated glasses (Figure 5.07). These results demonstrate that the superhydrophobic surface of AACVD
coated glass reduces the affinity of E. coli toward attachment, and that a large proportion of those cells
that adhere to the surface cannot maintain sufficient membrane integrity and are observed as dead
bacteria.

Chapter 5 Bacterial Adhesion to Superhydrophobic Polymer Surfaces
137
Figure 5.07. Adherence of E. coli and S. Aureus to uncoated, dip-coated and AACVD coated glass surfaces
measured by fluorescence live/dead staining assay. Bars represent the mean adherent E. coli/S. Aureus and
standard error of the mean per microscope field of view. Results are from 2 experiments performed in duplicate.
S. aureus gave a greater level of adherence relative to that of E. coli with mean counts of 245,
281 and 103 adherent cells per field of view for uncoated, dip-coated and AACVD coated glass
respectively. Unlike E. coli, the greatest level of adherence was for dip-coated glass (Figure 5.07),
while uncoated glass had the greatest proportion of dead cells (29.6%) and the highest total numbers
of dead cells. However, AACVD coated glass still showed the least S. aureus attachment (Figure 5.07)
confirming the ability of the superhydrophobic surface to reduce bacterial adhesion. The reductions of
attachment to the AACVD coating amounted to 58% and 63% relative to the uncoated and dip-coated
glasses, respectively. Figure 5.08 shows representative images of a section of microscope field of view
demonstrating the variations in S. Aureus adherence observed for each surface type. Colonisation of
the superhydrophobic films was restricted to the tips of the surface protrusions for both bacteria used.
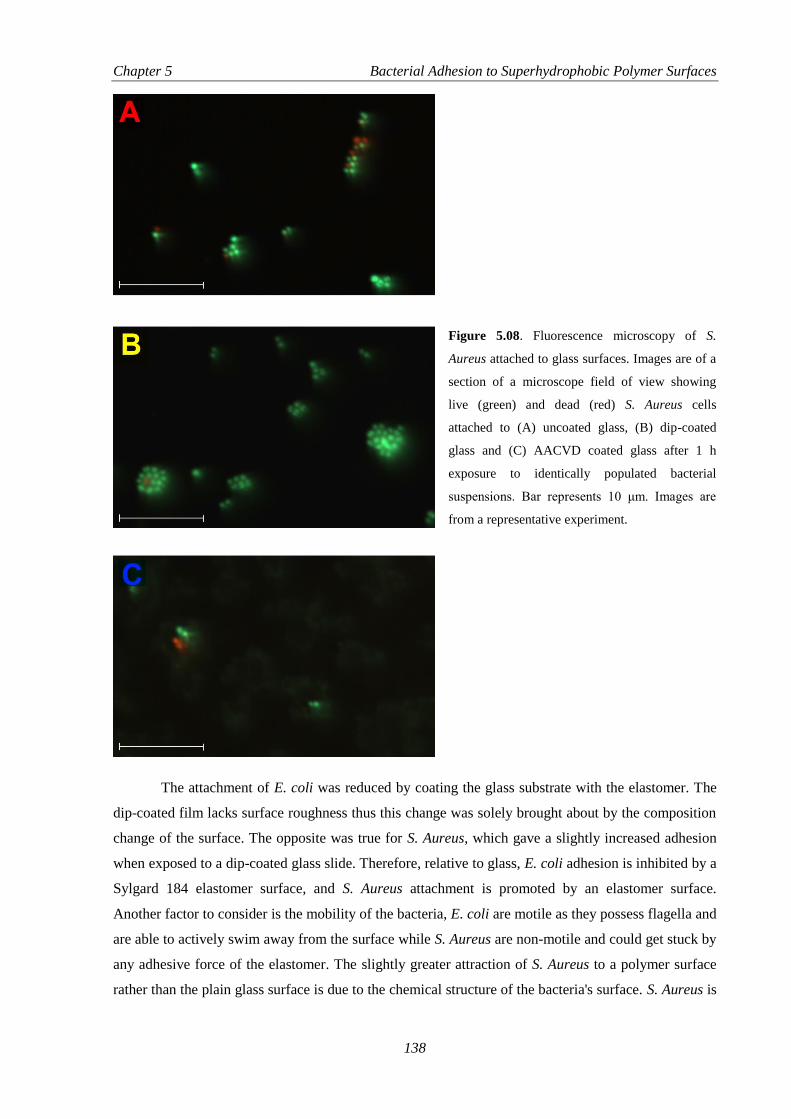
Chapter 5 Bacterial Adhesion to Superhydrophobic Polymer Surfaces
138
Figure 5.08. Fluorescence microscopy of S.
Aureus attached to glass surfaces. Images are of a
section of a microscope field of view showing
live (green) and dead (red) S. Aureus cells
attached to (A) uncoated glass, (B) dip-coated
glass and (C) AACVD coated glass after 1 h
exposure to identically populated bacterial
suspensions. Bar represents 10 μm. Images are
from a representative experiment.
The attachment of E. coli was reduced by coating the glass substrate with the elastomer. The
dip-coated film lacks surface roughness thus this change was solely brought about by the composition
change of the surface. The opposite was true for S. Aureus, which gave a slightly increased adhesion
when exposed to a dip-coated glass slide. Therefore, relative to glass, E. coli adhesion is inhibited by a
Sylgard 184 elastomer surface, and S. Aureus attachment is promoted by an elastomer surface.
Another factor to consider is the mobility of the bacteria, E. coli are motile as they possess flagella and
are able to actively swim away from the surface while S. Aureus are non-motile and could get stuck by
any adhesive force of the elastomer. The slightly greater attraction of S. Aureus to a polymer surface
rather than the plain glass surface is due to the chemical structure of the bacteria's surface. S. Aureus is
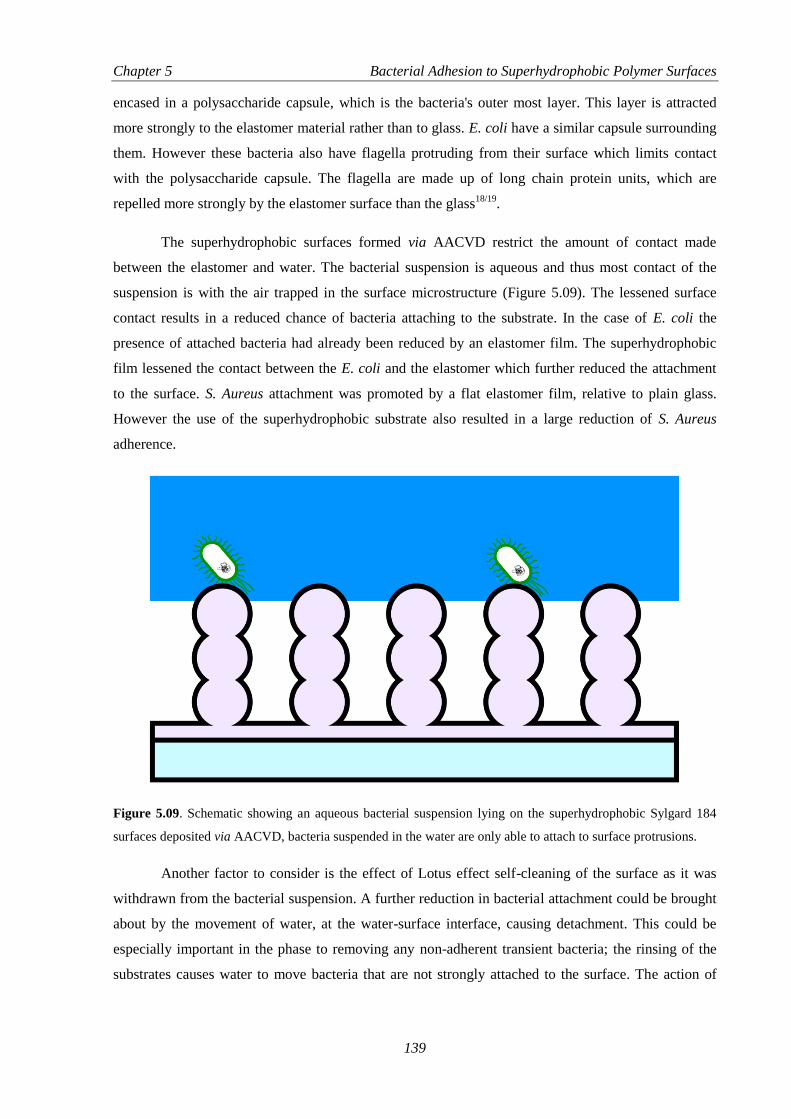
Chapter 5 Bacterial Adhesion to Superhydrophobic Polymer Surfaces
139
encased in a polysaccharide capsule, which is the bacteria's outer most layer. This layer is attracted
more strongly to the elastomer material rather than to glass. E. coli have a similar capsule surrounding
them. However these bacteria also have flagella protruding from their surface which limits contact
with the polysaccharide capsule. The flagella are made up of long chain protein units, which are
repelled more strongly by the elastomer surface than the glass18/19
.
The superhydrophobic surfaces formed via AACVD restrict the amount of contact made
between the elastomer and water. The bacterial suspension is aqueous and thus most contact of the
suspension is with the air trapped in the surface microstructure (Figure 5.09). The lessened surface
contact results in a reduced chance of bacteria attaching to the substrate. In the case of E. coli the
presence of attached bacteria had already been reduced by an elastomer film. The superhydrophobic
film lessened the contact between the E. coli and the elastomer which further reduced the attachment
to the surface. S. Aureus attachment was promoted by a flat elastomer film, relative to plain glass.
However the use of the superhydrophobic substrate also resulted in a large reduction of S. Aureus
adherence.
Figure 5.09. Schematic showing an aqueous bacterial suspension lying on the superhydrophobic Sylgard 184
surfaces deposited via AACVD, bacteria suspended in the water are only able to attach to surface protrusions.
Another factor to consider is the effect of Lotus effect self-cleaning of the surface as it was
withdrawn from the bacterial suspension. A further reduction in bacterial attachment could be brought
about by the movement of water, at the water-surface interface, causing detachment. This could be
especially important in the phase to removing any non-adherent transient bacteria; the rinsing of the
substrates causes water to move bacteria that are not strongly attached to the surface. The action of

Chapter 5 Bacterial Adhesion to Superhydrophobic Polymer Surfaces
140
bacterial removal can be magnified by the Lotus effect self-cleaning mechanism, which the flat
surfaces did not have20
.
5.3.3 Bacterial Interaction with Superhydrophobic Surfaces
The study of the Lotus leaf and other superhydrophobic self-cleaning surfaces has been an area of
extensive research. The main focus of many experiments however is the adhesion of particulate matter
to the surface7/8/21
. Particles of differing size/composition are dusted onto the surface and then rinsing
with water determines the effectiveness of the self-cleaning. These experiments do not take into
account the attachment of microorganisms. They however do show that the self-cleaning mechanism
becomes more efficient with increased hydrophobicity. Plant surfaces with most efficient self-cleaning
have multiple scales of roughness, usually large protrusions (micrometres), combined with small hairs
or crystallites (nanometres)22
. It has been shown that an increased hydrophobicity can reduce bacterial
adhesion to the surface of a leaf11
.
Surface features also play a role in the ability of bacteria to attach to a surface23
. Investigations
carried out on steel substrates show a high surface roughness allowed more bacteria to colonise the
surface24
. This colonisation concentrated in the grooves of the material as this provides more surface
area for the bacteria to maximise efficiency of attachment. A superhydrophobic material limits the
contact of an aqueous bacterial suspension to the protrusions of the surface, allowing no contact with
the grooves of the material, preventing access to the most viable place for bacterial adhesion. Any
attachment of bacteria must thus come from the small fraction of area where the aqueous suspension
and surface protrusions make contact. This can be seen in the fluorescence images (Figure 5.08, p138)
which show the attachment of bacteria to the top of the surface feature and not in the grooves of the
structure.
Surfaces constructed to mimic the dual-scale roughness of the Lotus leaf have shown that
combining micro-scale and nano-scale roughness results in a higher contact angle, a lower slip angle
and a lower adhesive force between the water and the surface17/25
. Polysiloxane pillars with a
nanostructure composed of wax molecules demonstrate this principle17
. The dual-scale roughness
allows for a higher proportion of water to be trapped under the water droplet, increasing
hydrophobicity and also reduces the adhesive force, between the surface and water droplet, making the
surface more slippery. Surfaces designed with the same principles, demonstrate similar findings26-28
.
The surface deposited in this experiment does not show an obvious dual-scale roughness
(nano/microscale), however there is a large variation in particle size over the substrate (Figure 5.05),
so there is some deviation from strictly one magnitude of roughness. The surface microstructure of the
superhydrophobic elastomer film does draw some similarities to a Lotus leaf surface. However the
incorporation of specialised nano-roughness could reduce bacterial adherence to the peaks of the

Chapter 5 Bacterial Adhesion to Superhydrophobic Polymer Surfaces
141
protrusions further. Although many investigations deal with the self-cleaning aspect of hydrophobic
surfaces (via particle removal), most do not incorporate bacterial adhesion. This is a key consideration
when dealing with the antimicrobial surfaces that do not include a chemical action (biocidal
chemicals) on bacteria. The removal of dirt and bacteria from a surface by Lotus effect self-cleaning
will only occur when water flow over the surface occurs (e.g. rinsing with water or rain). It is therefore
expected that bacteria will have a period of time on the surface where attachment can be made. This
investigation has aimed to replicate these conditions and has demonstrated that superhydrophobic
surfaces can limit bacterial attachment. A surface aimed at self-cleaning/antimicrobial applications
must have bacterial attachment carried out on it. This investigation has shown that limited contact of
bacterial with the grooves limit attachment to solely the protrusions of the superhydrophobic surface.
Further research in this area is required to reach a comprehensive conclusion. Additional experiments
could gauge the effect of single-scale vs. dual/multi-scale roughness on the adhesion of bacteria. This
is an important issue when dealing with surfaces designed for biomedical and catering industries1.
The elastomer surfaces used in this investigation have potential for a wide scope of
applications. The polymer used has been used in swell encapsulation processes, incorporating light
activated antimicrobial molecules29/30
, with potential for other types of antimicrobial agents to be
incorporated using this technique31
. The AACVD deposition can be varied in order to improve
durability and also transparency, and this could include varying the type of elastomer used (Chapter
2).
5.4. Conclusions
The superhydrophobic films used in this investigation were deposited via the AACVD of the two-part
curable silicone elastomer (Sylgard 184), which was reported in Chapter 2. The polymer is
hydrophobic with flat films giving a 95° water contact angle. The AACVD process facilitates a highly
developed microstructure, via particle agglomerations during the deposition. The microscope glass
substrates used were pre-coated with a thick film of the elastomer, and the resultant AACVD
deposition over this gave a film with a consistently high water contact angle (averaging 165°). The slip
angle of the surface was below 5°, suggesting a Cassie-Baxter wetting mechanism and potential for
Lotus effect self-cleaning.32-34
The bacterial attachment to superhydrophobic surfaces is a vastly unexplored area, with much
literature focus dedicated to removal of particulate matter in order to demonstrate the Lotus effect.
This article has attempted to explore the prevention of bacterial attachment. The bacterial attachment
assay involved E. coli and methicillin-resistant S. aureus. The experiments showed that after a 1 hour
submersion in a bacterial suspension, the superhydrophobic elastomer films greatly reduced the
attachment of both types of bacteria, relative to plain glass and dip-coated Sylgard 184 surfaces. The

Chapter 5 Bacterial Adhesion to Superhydrophobic Polymer Surfaces
142
investigation also detailed that while attachment was hindered by a flat polymer surface, attachment of
S. Aureus was promoted by the elastomer surface. The main attachment areas on the superhydrophobic
films were the tops of the surface protrusions. This was explained by the Cassie-Baxter wetting
mechanism only allowing contact between the tops of the protrusions and the aqueous bacterial
suspension, due to trapped air underneath the water in between the surface features. The elastomer
surface thus has potential for application as antimicrobial surfaces that do not involve the action of
chemical disinfection.
4.5. References
1. E. A. Araújo, N. J. de Andrade, L. H. M. da Silva, A. F. de Carvalho, C. A. de Sá Silva and A. M. Ramos,
Food Bioprocess Technol., 2010, 3, 321.
2. A. P. A. Hendrickx, M. J. M. Bonten, M. van Luit-Asbroek, C. M. E. Schapendonk, A. H. M. Kragten and
R. J. L. Willems, Microbiology, 2008, 154, 3212.
3. N. Fong, A. Simmons and L. A. Poole-Warren, Acta Biomater., 2010, 6, 2554.
4. S. Noimark, C. W. Dunnill, M. Wilson and I. P. Parkin, Chem. Soc. Rev., 2009, 38, 3435.
5. A. Kafizas, S. Kellici, J. A. Darr and I. P. Parkin, J. Photochem. Photobiol. A, 2009, 204, 183.
6. O. Öztürk, M. Sudagidan and U. Türkan, J. Biomed. Mater. Res. A, 2007, 81a, 663.
7. C. Neinhuis and W. Barthlott, Ann. Bot. Lond., 1997, 79, 667.
8. W. Barthlott and C. Neinhuis, Planta, 1997, 202, 1.
9. P. Wagner, R. Fürstner, W. Barthlott and C. Neinhuis, J. Exp. Bot., 2003, 54, 1295.
10. D. Knoll and L. Schreiber, Microb. Ecol., 2000, 41, 33.
11. L. M. Marcell and G. A. Beattie, Mol. Plant-Microbe Interact., 2002, 15, 1236.
12. B. Bhushan, Philos. Trans. R. Soc. A, 2009, 367, 1445.
13. B. Liu, Y. He, Y. Fan and X. Wang, Macromol. Rapid Commun., 2006, 27, 1859.
14. X. Zhang, F. Shi, J. Niu, Y. Jiang and Z. Wang, J. Mater. Chem., 2008, 18, 621.
15. C. M. Magin, S. P. Cooper and A. B. Brennan, Mater. Today, 2010, 13, 36.
16. M. Nosonovsky and B. Bhushan, Adv. Funct. Mater., 2008, 18, 843.
17. B. Bhushan, K. Koch and Y. C. Jung, Appl. Phys. Lett., 2008, 93, 093101.
18. M. Silverman and M. I. Simon, Ann. Rev. Microbiol., 1977, 31, 397.
19. K. Page, M. Wilson and I. P. Parkin, J. Mater. Chem., 2009, 19, 3819.
20. A. Solga, Z. Cerman, B. F. Striffler, M. Spaeth and W. Barthlott, Bioinspir. Biomim., 2007, 2, S126.
21. B. Bhushan, Y. C. Jung and K. Koch, Langmuir, 2009, 25, 3240.
22. K. Koch, H. F. Bohn and W. Barthlott, Langmuir, 2009, 25, 14116.
23. T. R. Scheuerman, A. K. Camper and M. A. Hamilton, J. Colloid Interface Sci., 1998, 208, 23.
24. E. Medilanski, K. Kaufmann, L. Y. Wick, O. Wanner and H. Harms, Biofouling, 2002, 18, 193.
25. M. Nosonovsky and B. Bhushan, J. Phys. Condens. Matter, 2008, 20, 225009.
26. Q. Pan, M. Wang and H. Wang, Appl. Surf. Sci., 2008, 254, 6002.
27. S. J. Pastine, D. Okawa, B. Kessler, M. Rolandi, M. Llorente, A. Zettl and J. M. J. Fréchet, J. Am. Chem.
Soc., 2008, 130, 4238.

Chapter 5 Bacterial Adhesion to Superhydrophobic Polymer Surfaces
143
28. T. Yao, C. Wang, Q. Lin, X. Li, X. Chen, J. Wu, J. Zhang, K. Yu and B. Yang, Nanotechnology, 2009, 20,
065304.
29. S. Perni, C. Piccirillo, J. Pratten, P. Prokopovich, W. Chrzanowski, I. P. Parkin and M. Wilson,
Biomaterials, 2009, 30, 89.
30. S. Perni, P. Prokopovich, C. Piccirillo, J. Pratten, I. P. Parkin and M. Wilson, J. Mater. Chem., 2009, 19,
2715.
31. R. M. Gant, Y. Hou, M. A. Grunlan and G. L. Cote, J. Biomed. Mater. Res. A, 2009, 90a, 695.
32. C. W. H. Dunnill, Z. A. Aiken, J. Pratten, M. Wilson, D. J. Morgan and I. P. Parkin, J. Photochem.
Photobiol. A, 2009, 207, 244.
33. A. Kafizas, S. Kellici, J. A. Darr and I. P. Parkin, J. Photochem. Photobiol. A, 2009, 204, 183.
34. C. W. Dunnill, Z. A. Aiken, J. Pratten, M. Wilson and I. P. Parkin, Chem. Vap. Depos., 2010, 16, 50.
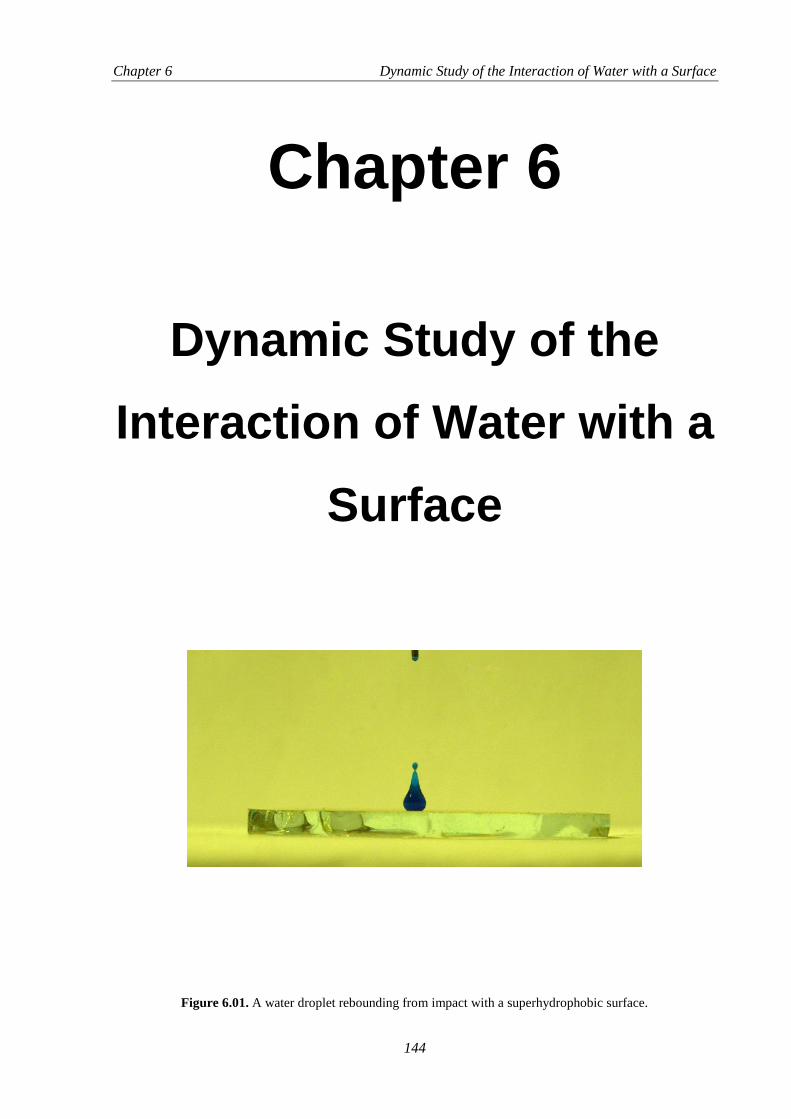
Chapter 6 Dynamic Study of the Interaction of Water with a Surface
144
Chapter 6
Dynamic Study of the
Interaction of Water with a
Surface
Figure 6.01. A water droplet rebounding from impact with a superhydrophobic surface.

Chapter 6 Dynamic Study of the Interaction of Water with a Surface
145
6. Dynamic Study of the Interaction of Water with a Surface
6.1. Introduction
6.2.1 The Comparison of Water Contact Angles and Tilt Angles
The water contact angle is a hugely valuable measurement in accessing the hydrophobicity of
a surface. When dealing with superhydrophobic surfaces however, there is a greater amount of error
when reading large water contact angles.1 This error can be introduced through gravitational bowing of
water droplets2, caused when using a relatively large droplet volume (Figure 6.02), and the analysis of
the droplet shape by computer programs can also cause large differences in results1 (Section 1.2.2).
Given this, in order to meaningfully compare the water contact angles of two different surfaces the
analysis method must be consistent, i.e. droplet volume, dispensing method and analysis method. This
cannot always be achieved given the variation of options within different software packages, in
addition to the difficulty with consistent contact angle image analysis.3-7
Figure 6.02. Schematic showing the dispensing of a water droplet on a superhydrophobic surface (A), with the
edges of the droplet deforming the water droplet and increasing the apparent water contact angle (B > C). The
extent of droplet bowing increases with the volume of the droplet.
Water tilt angles (the angle at which a water droplet begins to move when the surface is tilted)
can also give an indication of the hydrophobicity of a surface, as low tilt angles usually relate to a low
energy of interaction between water and the surface.8 This measurement can be related to the
advancing and receding water contact angles but use of these can result in similar complications as
described above. The tilt angle itself is partially a gravitational effect and so is dependent on the
volume of the water droplets used, with high mass/volume droplets moving before those with lower
mass/volume in most cases, for the same surface9. With factors such as tilt method (tilting with
incremental or smooth movement) which must also be considered. In order to render the tilt angle
results comparable then all the above factors must also be considered, with the same droplet volume
and tilting method used in each case.

Chapter 6 Dynamic Study of the Interaction of Water with a Surface
146
6.2.2 Factors Affecting the Behaviour of Water on a Surface
There are three main factors that influence the dynamic interaction between water and a surface10/11
:
Surface Hydrophobicity – A surface with greater hydrophobicity (i.e. a surface with higher
water contact angle), has a larger repulsive force toward water. This gives a greater likelihood
of displaying dynamic effects such as Lotus effect self-cleaning and water bouncing.
Wetting Mechanism – The amount of air under water as it lies on a surface affects the amount
of frictional force felt between the surface and the water. This is reflected primarily by a
difference in tilt angle, where low tilt angle surfaces are more likely to exhibit dynamic
effects.
Surface Microstructure – The surface microstructure can have other effects on the interaction
with water other than the wetting mechanism. Water pinning (the local adhesion of water to
specific points on the surface) is promoted by surfaces with microstructures with sharp edges,
such as square edged columns (Figure 6.03). This effect creates additional adhesion to the
surface when the water on the surface begins to move away, thus lessening the likelihood of
dynamic effects. The amount of water pinning on a surface can be reduced by creating
rounded surface features that allow the gradual release of water from a surface.
Figure 6.03. Schematic showing the removal of water from Cassie-Baxter surfaces with differing microstructure
types - [1] Rounded and [2] Sharpened edges. Different stages of detachment are shown – (i) Partial - Droplet is
more effectively held by pinning to surface type [2] and (ii) Full – Droplets that were pinned leave behind traces
of water on the surface making the surface stickier on subsequent bounces.
Chapter 6 Dynamic Study of the Interaction of Water with a Surface
147
6.2.3 Water Bouncing Studies
Extensive studies have been carried out into water bouncing, and this has enabled the dynamic
behaviour to be well classified12/13
. The various modes of water droplet-surface impact (deposition,
splash, break-up and rebound) have been related to droplet volume, impact velocity and surface
properties. In addition, by studying different liquids, changes in behaviour can be tracked and related
to the physical properties of the liquid.14/15
Other properties of droplet bouncing such as water-surface
contact time, droplet morphology and bounce elasticity have also been studied.16
The experiments
used to analyse the full extent of water droplet bouncing usually require extremely high speed video
cameras (capturing at > 104 frames per second
13), this equipment is not only expensive but setting-up
these experiments could be time consuming and would be an inefficient analysis technique for
research groups who focus on superhydrophobic surface synthesis.
Water droplet movement/bouncing on a surface is highly dependent on multiple factors. The
ambiguity and frailties of current methods toward cross-comparison of results, in addition to inability
of static measurements not fully characterising a surfaces hydrophobicity drives the need for a
dynamic analysis technique which is able to be compared with unambiguous results. In this chapter a
definition of superhydrophobicity based on the ability of water to bounce on a surface is proposed, as
water bouncing incorporates analysis of multiple surface properties in one measurement. These
include: the surface’s fundamental hydrophobicity (indication of θ), the ability to prevent penetration
of surface protrusions (wetting mechanism, θAdvancing/θReceding) and dynamic interaction with that surface
(water pinning and self-cleaning). The method used in this chapter is focused toward facile and
unequivocal results that can be replicated without the disparity caused by water contact angle
measurements, while providing an indication of multiple surface properties simultaneously. It is
shown that the bouncing characteristics are related to the surface microstructure. Furthermore for
superhydrophobic surfaces with a similar microstructure it is shown that there is a linear relationship
between number of bounces on the surface and the static water contact angle. The surface
hydrophobicity measuring technique utilises the number of water bounces, a relatively simple property
to measure, and this requires less expensive equipment as a relatively low capture rate is required (>
500 frames per second). The set-up is a more accessible analysis technique that provides results that
can be directly compared between research groups, while ruling out error in water contact angle
measurement.
6.2. Experimental Details
6.2.1 Materials
With the exception of Sylgard 184 Silicone Elastomer which was purchased from R. W. Greeff, sand
paper and dispensing tips which were purchase from Onecall and PTFE sheets which were purchased

Chapter 6 Dynamic Study of the Interaction of Water with a Surface
148
from Alfa Aesar, all chemicals used in this investigation were purchased from Sigma-Aldrich
Chemical Co; including chloroform, methylene blue, TEOS, hydrochloric acid, toluene, HMDS,
copper plate, copper nitrate trihydrate, potassium persulfate, sulphuric acid, methanol and ethanol.
6.2.2 Surface Materials
6.2.2.1 Pre-prepared Surfaces
Glass. Portions of silica barrier layer glass provided by Pilkington NSG, used for previous CVD
depositions, were washed with water and acetone and dried at 80°C for 10 minutes. Some portions
were subsequently heated in an oven at 500°C for 1 hour.
Copper. Copper plates (1 mm thick) were tested after rinsing with acetone and drying at 80°C for 10
minutes.
6.2.2.2 Titanium Dioxide
Silica barrier layer glass was used to deposit titanium dioxide films via atmospheric pressure CVD,
from gaseous TiCl4 and ethyl acetate precursors at a 500°C deposition temperature using the same
method used by Hyett et al.17
6.2.2.3 Silicone Elastomer
Surfaces were deposited via AACVD as described in Section 2.2.5. The variation on hydrophobicity
was brought about by changing the amount of precursor deposited. Films showing a high variation in
water contact angle were formed by reducing the flow rate of the nitrogen carrier gas to 0.5 L/min.
6.2.2.4 Functionalised Silica Microparticles
Surfaces were deposited via hybrid CVD as described in Section 3.2.2. Only films deposited at 550°C
were used in this study.
6.2.2.5 Functionalised Copper Hydroxide
Surfaces were deposited via AACVD as described in Section 4.2.3, in addition to the oxidation and
functionalisation of copper sheets treated using the same method.
6.2.2.6 Polytetrafluoroethylene
PTFE sheets (1.6 mm) thick were used as received. Roughening was also carried out by action of sand
paper (abrasive grade – P36 and P50) moved by hand over varying periods of time up to 1 minute.

Chapter 6 Dynamic Study of the Interaction of Water with a Surface
149
6.2.3 Static Surface Hydrophobicity Measurement
Static water contact angles images were obtained using an FTA 1000B Automated Drop Shape
Analyser using 3 μL water droplets, surface baselines and subsequent tangents at the point of droplet
contact were assigned manually to prevent error caused by image analysis software. For surface where
averages were taken, a number of measurements were made across the films and the average values
taken (average ten measurements). Spot testing was also carried out on films with varying thickness,
where one measurement was made and position of measurement marked on the reverse of the
substrates.
6.2.4 Water Bouncing Measurement
The water droplet bouncing experiments were studied using a Vision Research Phantom v710 high
speed camera equipped with a Nikon 24-85 mm F2.8 macro zoom lens with images captured at 3000
frames per second. Water droplets were dropped from a height of 20 mm (tip to surface) using a
microsyringe fitted with a 27 gauge dispensing tip (unless otherwise stated). Droplets impacted the
surface at approximately 0.34 m/s (estimated by gravimetric calculation) and the water droplets from
this tip were 8 μL in size and were left to detach under their own weight (Figure 6.04). This set-up was
varied to examine the effect of droplet impact velocity and volume. Methylene blue was added to the
water to aid visualisation, this did not change the behaviour of the water droplets on the surface. The
stage which held the substrates was made level using a spirit level, and was accurate to within 0.2°.
Figure 6.04. Schematic showing the water bounce
experimental set-up. The variable of the experiments are (A)
Drop height – this determines the velocity of droplet impact,
(B) Dispensing tip – this determines the droplet volume and
(C) Substrate – this dictates the nature of the water-surface
interaction. The optimum set-up was (A) 20 mm and (B) 27
Gauge (internal diameter – 0.203 mm) with a level substrate
(C).
Chapter 6 Dynamic Study of the Interaction of Water with a Surface
150
A second (inexpensive) camera was used to repeat some experiments – Casio HS EX-FH25
using a capture rate of 1000 frames per second.
6.2.5 Water Droplet Rolling Observation
Motion of droplets was studied using the Vision Research Phantom v710 high speed camera equipped
with a Nikon 24-85 mm F2.8 macro zoom lens with images captured at 3000 frames per second.
Droplets of water (~15 μL volume) were dropped onto tilted superhydrophobic silica films (18° from
horizontal, Section 6.2.2.4), coloured plastic particles used for craftwork (~1 mm2) were suspended in
the water and dispensed using a syringe. Particles were added to aided visualisation of rolling motion.
6.3. Results and Discussion
6.3.1 Water Droplet Bouncing
6.3.1.1 Effect of Water Impact Speed and Droplet Volume
The dropping height determined the velocity of impact, and the optimum height was decided as the
maximum height for the droplet to suffer no fragmentation upon impacting with the surface, insuring
maximum droplet momentum, and the maximum number of potential bounces was achieved. The ideal
droplet volume was decided as the smallest droplet dispensable, without lateral movement becoming a
factor, as small droplets would give more bounces; however smaller droplets still are more likely to be
affected by minute levelling issues or air movement. The 8 μL droplet volume and 20 mm dropping
height (tip to surface) was found to be optimum (Figure 6.05). The droplet could easily be replicated
and fell under its own weight when dropped from a 27 gauge dispensing tip (internal diameter – 0.203
mm). Larger droplets, dispensed from wider tips (gauge 25 and below), resulted in fragmentation and
required a lower drop height which subsequently reduced the maximum number of bounces achieved.
Smaller water droplets (from gauge 30 dispensing tips) allowed for higher drop heights without
fragmentation and also increased the maximum number of bounces observed (14 bounces were
achieved on a surface with a water contact angle of 175° from a height of 20 mm). However lateral
movement of droplets was also increased during bouncing even for surfaces that registered perfectly
horizontal by a spirit level. This became greater at higher θ, and rendered accurate bouncing
measurements difficult – for example fifteen repeat experiments were required for just one run in
which the droplet remained in the field of view.
6.3.1.2 Water Bouncing on Surfaces with a Rounded Microstructure
A wide range of surfaces with relatively flat or rounded microstructures were tested possessing static
water contact angles between 0-175° and included silica, copper, titanium dioxide, flat PDMS surfaces
and various rough-rounded silica and PDMS polymer surfaces (Figure 6.05). A series of spot testing

Chapter 6 Dynamic Study of the Interaction of Water with a Surface
151
experiments was also carried out on rounded elastomeric surfaces. This involved forming a surface
with variable hydrophobicity across a substrate, testing water contact angles (θ) at various positions
over the film and performing water dropping experiments at positions with a known θ (Figure 6.06). It
was noted that water droplets did not bounce under these conditions unless static water contact angles
of 151° or greater were achieved on a surface. The number of bounces on the surface was defined as
the sum of instances the droplet had a defined air gap between the surface and the water droplet after
initial contact. It was found that the number of bounces for surfaces with rounded microstructure
(Figure 6.07) increased linearly with θ above 151° with the maximum number observed for an 8 μL
droplet as twelve (Figure 6.06). It was empirically found that a simple linear relationship existed
between under these conditions, with the relationship holding for a surface with rounded surface
features, this is given below:
Where B is the number of bounces and θ is the static water contact angle on the surface in degrees.
Figure 6.05. Series of photographs of an 8 μL water droplet dropped from a height of 20 mm (tip to surface) and
bouncing on substrates with a range of water contact angles. The droplets velocity at point of impact was 0.34
m/s. Water droplets were coloured with methylene blue to aid visualisation; this did not alter the bouncing
behaviour on the surface.

Chapter 6 Dynamic Study of the Interaction of Water with a Surface
152
Figure 6.06. Plot showing number of bounces of a water droplet dropped from a 27 gauge dispensing tip from a
height of 20 mm (tip to surface). Surfaces chosen demonstrated a range of hydrophobicities and all possessed
rounded or flat microstructures. Spot testing measurements were carried out on silicone elastomer surfaces
deposited via AACVD. Water bouncing only occurred on surfaces with water contact angle over 151°.
Water tilt angles (θt) on a surface provide a direct measurement of a waters adhesion to a
surface - this is the angle from horizontal at which a droplet started to move on a surface. Comparing
the number of bounces observed on the superhydrophobic surfaces and θt, gave three classes of
behaviour – θt > 70° did not show any water bouncing, θt = 7-70° had B = 1-5 and surfaces with θt <
7° showed the largest number of bounces B = 5-12.
6.3.1.3 Varying Surface Microstructure
Surfaces with spiky/sharp ridged microstructures (PTFE roughened with sandpaper, functionalised
copper hydroxide nanoneedles, Figure 6.07) required a larger static water contact angle of ≥ 156° to
observe a water bounce. The sharp features can promote water pinning on their surface (Figure 6.03).
The maximum number of bounces seen for a θ = 172° sharp microstructure surface was twelve under
our standard conditions, indicating that for extremely high θ water pinning became less significant.
This, in effect, shifted the linear relationship displayed by surfaces with rounded surface features, and
so bouncing on surfaces with microstructures that promote water pinning begins at a higher θ.

Chapter 6 Dynamic Study of the Interaction of Water with a Surface
153
However the maximum number of bounces still reached 12 at particularly high θ due to a substantial
reduction in solid-liquid contact.
Figure 6.07. SEM images of superhydrophobic surfaces - Rounded (A) Sylgard 184 elastomer agglomerations, θ
= 165° / B = 7 and (B) functionalised silica microparticles, θ = 175° / B = 12, in addition to sharp-edged (C)
sandpaper roughened PTFE, θ = 158° / B = 2, and (D) thiol-functionalised copper hydroxide nano-needles, θ =
172° / B = 12. Scale bars inset.
6.3.1.4 Superhydrophobic Water Bouncing
The data shows a connection between water contact angle and the ability of water to bounce on a
surface, provided the microstructure type remains consistent. Shifting of the relationship occurs when
testing surfaces which possess a microstructure capable of pinning water. The areas of water pinning
increase the adhesive force between surface and water, which lessens the rebound momentum of the
water droplet and reduces the chance of loss of contact with the surface. Exceptionally hydrophobic
surfaces which pin water can reduce the efficiency of Lotus-effect self-cleaning and even prevent
water rolling as it moves over a surface, even if water contact angles are over 150°. Given this,
surfaces with water contact angles over 150° can thus be deemed as non-superhydrophobic due to their
lack of ability to facilitate Lotus-effect self-cleaning. The discrepancy between water contact angle
and the dynamic behaviour of water on a surface (measured by water bouncing) means single static
measurements (θ, θAdvancing, θReceding or θt) are insufficient in measuring superhydrophobicity for the
purpose of cross field comparisons of differing surface morphology types. In addition, the disparity
caused by distinct methods of water contact angle measurement (drop shape analysis) used by

Chapter 6 Dynamic Study of the Interaction of Water with a Surface
154
different research groups, requires the implementation of the same techniques in order to allow direct
comparison – even though the water contact angle may not reflect the true nature of the surface’s
hydrophobicity.
The water bouncing experiments discussed in this chapter examines the effect of multiple-key
properties (θ, θt and water pinning) which denote a surface as superhydrophobic, in a single
measurement. It can thus be said that a superhydrophobic surface will display a certain ability to
facilitate water bouncing. As the bouncing on rounded surfaces commenced at 151° it was thus
concluded that a surface capable of achieving one or more bounces (given the described parameters)
can be judged to be superhydrophobic. The number of water droplet bounces increased linearly with
water contact angle for surfaces with similar microstructures with this relationship shifted for surfaces
with different microstructures. A new scale of superhydrophobicity has thus been established, based
simply on the number of water bounces. Not only does this technique provide a universal indication of
a surfaces superhydrophobicity, through analysing a combination of multiple surface features which
dictate superhydrophobicity, but it also avoids the potential disparity in measuring the static water
contact angle.
6.3.2 Rolling Motion of Water Droplets
The movement of water was tracked by the addition of polymer particles (insoluble in water)
suspended within a droplet; methylene blue dye did not allow the visualisation of water movement.
The circular rolling motion of particles could be clearly observed with particles on the outer edge
moving faster (Figure 6.08). The rolling motion of water droplets suggests that Lotus effect self-
cleaning can take place on the surface. The superhydrophobic state is related to Lotus effect self-
cleaning18
, by studying this movement in-depth the mechanism of water travelling across a surface
(sliding or rolling) can be assigned. The rolling motion associated with the Lotus-effect self-cleaning
mechanism as a contributing factor of a surfaces superhydrophobicity can be confirmed.
Figure 6.08. Schematic showing a water droplet (~15 μL) moving down a tilted superhydrophobic
functionalised silica surface deposited via Hybrid CVD. The rolling motion of the droplet can be seen by
tracking the movement of plastic particles suspended within the droplet – the same particle is circled in each
image.
Chapter 6 Dynamic Study of the Interaction of Water with a Surface
155
6.4. Conclusions
The question of superhydrophobicity should not be restricted to the water contact angle achieved on a
surface, or even tilt angle. This chapter shows the effect of surface hydrophobicity and microstructure
on the dynamic behaviour of water on a surface. Water bouncing experiments performed on
hydrophobic surfaces showed that the ability of water to bounce (given specific parameters) was
limited to surfaces with water contact angles greater than 151°. Surfaces that promoted water pinning,
through sharp surface microstructures, did not facilitate water bouncing until water contact angles
exceeded 156°. As the results correlate with the superhydrophobic contact angle (150°), it is suggested
that surfaces capable of facilitating at least one bounce are superhydrophobic. Through a linear rise in
number of bounces with water contact angle demonstrated by surfaces with similar microstructures a
new scale of superhydrophobicity was established, through the relationship which is shifted with a
change in microstructure type. The water bouncing technique is facile and unambiguous, allowing for
direct comparison of a surfaces superhydrophobicity while avoiding potential disparity of different
water contact angle analysis.
A technique for studying the internal movement of water droplets moving across a surface was
also developed, allowing the visualisation of droplet rolling. The rolling mechanism is a key attribute
of Lotus effect self-cleaning with its confirmation providing additional insight into the hydrophobicity
of a surface. This chapter has confirmed the importance of dynamic studies on hydrophobic surfaces,
with static measurements not being able to provide a comprehensive description of surface
hydrophobicity.
6.5. References
1. X. Zhang, F. Shi, J. Niu, Y. Jiang and Z. Wang, J. Mater. Chem., 2008, 18, 621.
2. S. D. Hong, M. Y, Ha and S. Balachandar, J. Colloid Interface Sci., 2009, 339, 187.
3. M. Nosonovsky and B. Bhushan, Microsyst. Technol., 2005, 11, 535.
4. X. Zhang, F. Shi, J. Niu, Y. Jiang and Z. Wang, J. Mater. Chem., 2008, 18, 621.
5. J. W. Krumpfer and T. J. McCarthy, Faraday Discuss., 2010, 146, 103.
6. S. Wang and L. Jiang, Adv. Mater., 2007, 19, 3423.
7. H. F. Hoefnagels, D. Wu, G. de With and W. Ming, Langmuir, 2007, 23, 13158.
8. K. Koch, B Bhushan, Y. C. Jung and W. Barthlott, Soft Matter, 2009, 5, 1386.
9. T. Furuta, M. Sakai, T. Isobe, S. Matsushita and A. Nakajima, Langmuir, 2011, 27, 7307.
10. S. Suzuki, A. Nakajima, M. Sakai, Y. Sakurada, N. Yoshida, A. Hashimoto, Y. Kameshima and K. Okada,
Chem. Lett., 2008, 37, 58.
11. P. F. Hao, Z. H. Yao and X. W. Zhang, Sci. China Phys. Mech. Astron., 2011, 54, 675.
12. M. Callies and D. Quéré, Soft Matter, 2005, 1, 55.
13. D. Quéré, Nature, 2005, 435, T168.
14. A. L. Yarin, Annu. Fluid Mech., 2006, 38, 159.

Chapter 6 Dynamic Study of the Interaction of Water with a Surface
156
15. A. Biance, F. Chevy, C. Clanet, G. Lagubeau and D. Quéré, J. Fluid Mech., 2006, 554, 47.
16. D. Richard, C. Clanet and D. Quéré, Nature, 2002, 417, 881.
17. G. Hyett, J. A. Darr, A. Mills and I. P. Parkin, Chem. Eur. J., 2010, 16, 10546.
18. Z. Guo, W. Liu and B. Su, J. Colloid Interface Sci., 2011, 353, 335.

Chapter 7 Separation of Oil-Water Mixtures
157
Chapter 7
Separation of Oil-Water
Mixtures
Figure 7.01. Mixed droplet of oil-water impacting a superhydrophobic mesh, the mesh strongly attracts oils. The
arrow show the movement of oil onto the mesh, while retaining the ball of water sitting on top.

Chapter 7 Separation of Oil-Water Mixtures
158
7. Separation of Oil-Water Mixtures
7.1. Introduction
Major incidents of ocean oil spillages have been reported in the media since the start of large
scale ocean oil drilling1. Recent events in the Gulf of Mexico outline the need for the clean, portable
and efficient methods for separating oil from water2. Current methods employed for the use in large
scale oil spillages into water include skimming the top layer of water for removal of particulates, in
addition to the use of oil absorbing materials to remove liquid substituents3. Inefficiencies of these
methods are as follows: top layer removal techniques only remove material from the depths they reach
physically, and materials used to absorb oil must be subsequently removed and later destroyed.3
Hydrophobic materials containing alkyl groups can also act to attract oils (oleophilic)4.
Materials such as flat PTFE surfaces will achieve water contact angles around 100°5, these
demonstrate contact angles with hexane which are near 0°.6 The oleophilicity of a material can be
magnified in the same way as hydropilicity, and so by increasing surface roughness the contact angles
with oils will decrease further (assuming a Wenzel-type interaction)7. This means that
superhydrophobic surface constructed from alkyl containing materials have the potential for being
extremely oleophilic (superoleophilic) (Figure 7.02).
Figure 7.02. Schematic showing the interaction of water and oil with hydrophobic/oleophilic surfaces upon
roughening.
The superhydrophobic/superolephilic surfaces can be extended to separating oil and water,
due to the extreme difference of interaction with each liquid. Placing small amounts of an oil-water
mixture on a surface with superhydrophobic/superolephilic properties would result in the sheeting of
oil component across the surface, and balling-up of water within the mixture, in effect separating the
mixture. If this was extended to large quantities of liquid, this would be an ineffective separation
technique. There have been some recent developments in the use of superhydrophobic surfaces to
separate oil and water, most examples include the use of mesh to aid separation.8-10
Previous chapters have focused on solely water’s interaction with superhydrophobic surfaces;
this chapter will deal with the design and implementation of devices to separate oil-water mixtures,
using superhydrophobic meshes. The meshes are coated with Sylgard 184 polymer via AACVD, this
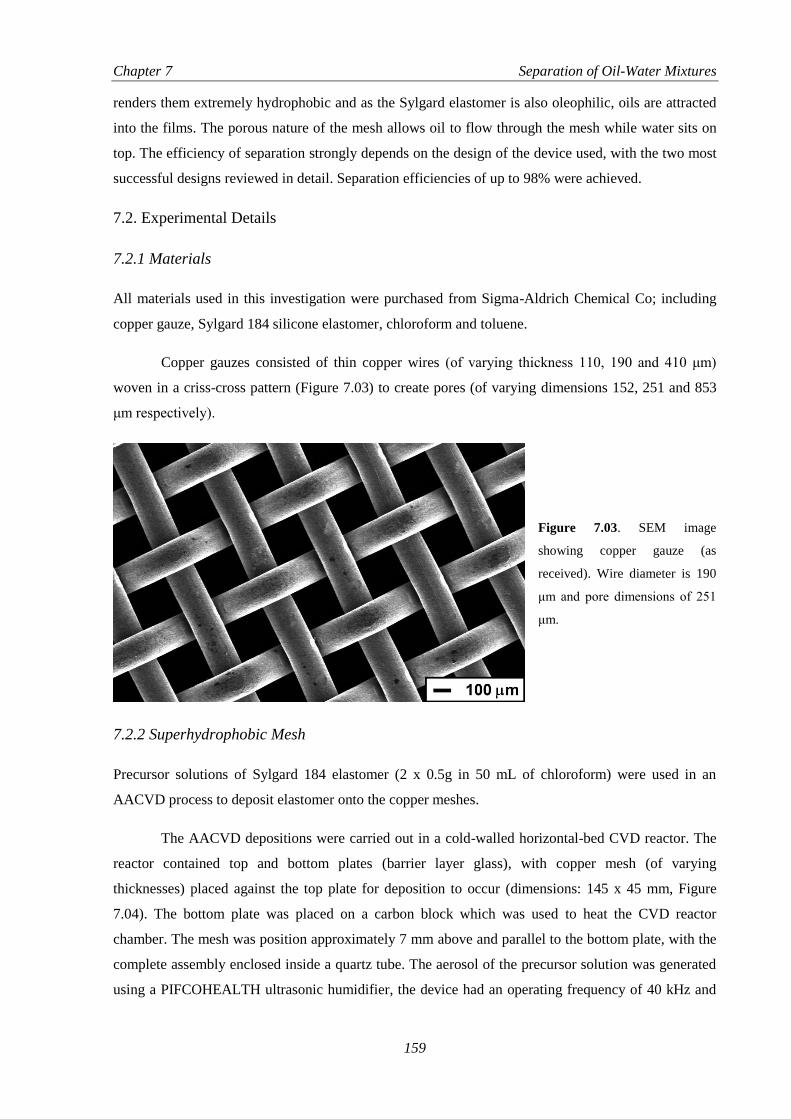
Chapter 7 Separation of Oil-Water Mixtures
159
renders them extremely hydrophobic and as the Sylgard elastomer is also oleophilic, oils are attracted
into the films. The porous nature of the mesh allows oil to flow through the mesh while water sits on
top. The efficiency of separation strongly depends on the design of the device used, with the two most
successful designs reviewed in detail. Separation efficiencies of up to 98% were achieved.
7.2. Experimental Details
7.2.1 Materials
All materials used in this investigation were purchased from Sigma-Aldrich Chemical Co; including
copper gauze, Sylgard 184 silicone elastomer, chloroform and toluene.
Copper gauzes consisted of thin copper wires (of varying thickness 110, 190 and 410 μm)
woven in a criss-cross pattern (Figure 7.03) to create pores (of varying dimensions 152, 251 and 853
μm respectively).
Figure 7.03. SEM image
showing copper gauze (as
received). Wire diameter is 190
μm and pore dimensions of 251
μm.
7.2.2 Superhydrophobic Mesh
Precursor solutions of Sylgard 184 elastomer (2 x 0.5g in 50 mL of chloroform) were used in an
AACVD process to deposit elastomer onto the copper meshes.
The AACVD depositions were carried out in a cold-walled horizontal-bed CVD reactor. The
reactor contained top and bottom plates (barrier layer glass), with copper mesh (of varying
thicknesses) placed against the top plate for deposition to occur (dimensions: 145 x 45 mm, Figure
7.04). The bottom plate was placed on a carbon block which was used to heat the CVD reactor
chamber. The mesh was position approximately 7 mm above and parallel to the bottom plate, with the
complete assembly enclosed inside a quartz tube. The aerosol of the precursor solution was generated
using a PIFCOHEALTH ultrasonic humidifier, the device had an operating frequency of 40 kHz and

Chapter 7 Separation of Oil-Water Mixtures
160
25 W of power. The aerosol generated was moved to the reactor using a nitrogen gas flow via PTFE
and glass tubing, where it entered between the top and bottom plates. Any gaseous by-products left via
an exhaust.
Figure 7.04. AACVD
reactor containing the
copper mesh during the
elastomer deposition.
The reactor temperature (as measured by a thermocouple in the carbon heater block) was
maintained at 360°C. The carrier gas (nitrogen) flow through the flask was continued until all liquid
was depleted, this took typically 30–35 min. After all liquid was transferred to the reactor the heater
was then turned off and allowed to cool to room temperature, and the nitrogen was flowed
continuously. The cooled mesh was reversed and the deposition process was repeated, in order to
cover both sides of the mesh. After the second deposition the cooled meshes were removed and
handled in air.
7.2.3 Device Designs
For each design, mixtures of toluene and water (1 : 1 cm3) were prepared in Pasteur pipettes, the
pipettes were then vibrated using a Vortex-Genie 2, 230V (Scientific Industries). The dispersed
mixtures were immediately used in the separation experiments where the mixtures were released at 1
drop/second from the pipette.
7.2.3.1 Tilted Flow Separation
The elastomer-covered meshes were trimmed to remove any uncoated sections (dimensions: 120 x 45
mm), and the meshes were curved slightly along the primary axis to facilitate the flow of water along
the mesh. The trimmed meshes were positioned with a 12° tilt angle. Solvent mixtures were released at
the top of the substrates, 20 mm away from the top-edge in the centre, and 20 mm above from the
mesh. An organic solvent collection vessel was placed directly beneath the dropping pipette, below the
mesh. Water was collected using another collection vessel place at the end of the tilted mesh (Figure
7.05). A device was constructed for each of the meshes used.
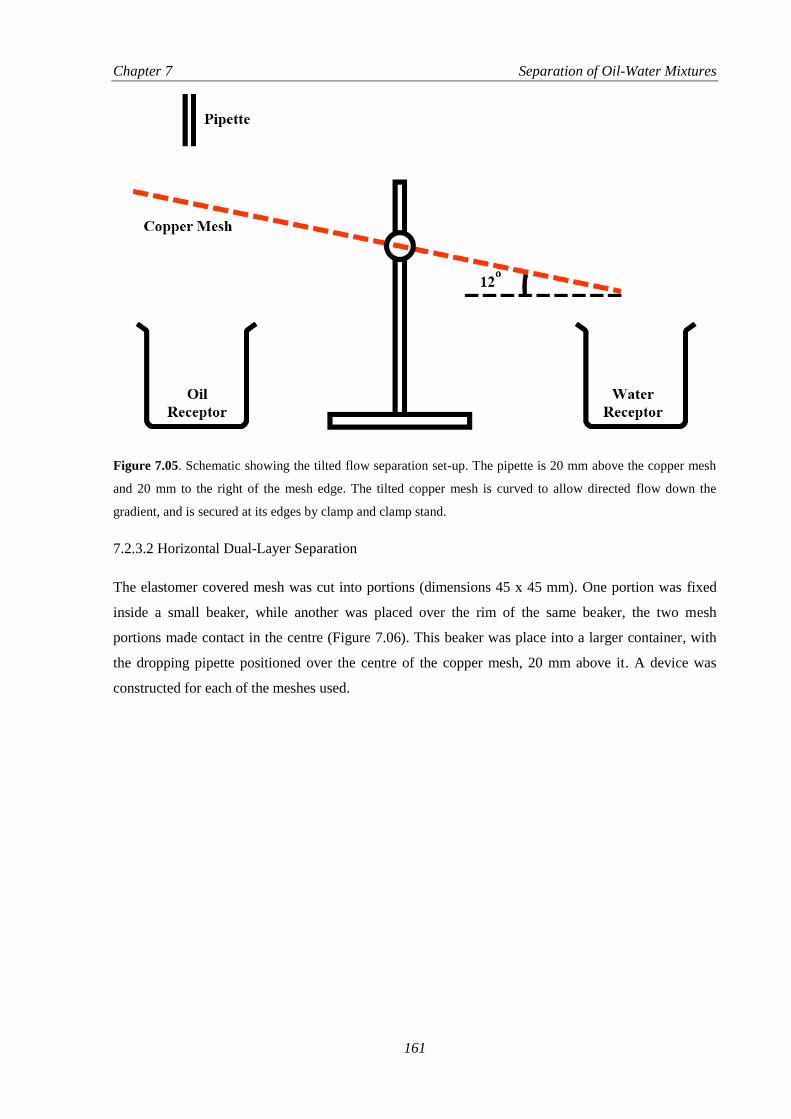
Chapter 7 Separation of Oil-Water Mixtures
161
Figure 7.05. Schematic showing the tilted flow separation set-up. The pipette is 20 mm above the copper mesh
and 20 mm to the right of the mesh edge. The tilted copper mesh is curved to allow directed flow down the
gradient, and is secured at its edges by clamp and clamp stand.
7.2.3.2 Horizontal Dual-Layer Separation
The elastomer covered mesh was cut into portions (dimensions 45 x 45 mm). One portion was fixed
inside a small beaker, while another was placed over the rim of the same beaker, the two mesh
portions made contact in the centre (Figure 7.06). This beaker was place into a larger container, with
the dropping pipette positioned over the centre of the copper mesh, 20 mm above it. A device was
constructed for each of the meshes used.

Chapter 7 Separation of Oil-Water Mixtures
162
Figure 7.06. Schematic showing the horizontal dual-layer
separation set-up. The pipette is 20 mm above the copper
mesh.
7.2.4 Film Characterisation
The films were analysed as deposited onto the copper meshes. Subsections (ca 1 x 1 cm) of the
samples were gold-sputtered and analysed using field emission scanning electron microscopy (SEM)
using a Jeol JSM-6301F operating at 5 kV. Energy dispersive X-ray (EDX) analyses of carbon-
sputtered samples were measured using the same machine. Raman measurements were made using a
Renishaw 1000 spectrometer which used a 632.8 nm laser. Adherence tests were carried out, done by
applying Scotch Home and Office masking tape to the deposited films, removed and any difference in
film appearance noted. Scratch tests were also carried out by observing the action of a metal scalpel
being dragged across a surface.
Water contact angle measurements were carried out using an FTA-1000 drop shape
instrument, 3 μL water droplets were used to minimise any gravitational effects. The water droplet
images were analysed using a digital protractor to obtain the water contact angles on the surface. A
range of points across the substrates were tested, with 12 measurements made on each mesh. Water
slip angles were also measured, noting the angle to the horizontal at which 3 μL water droplets moved
on the surface. Many positions across the substrates were tested.
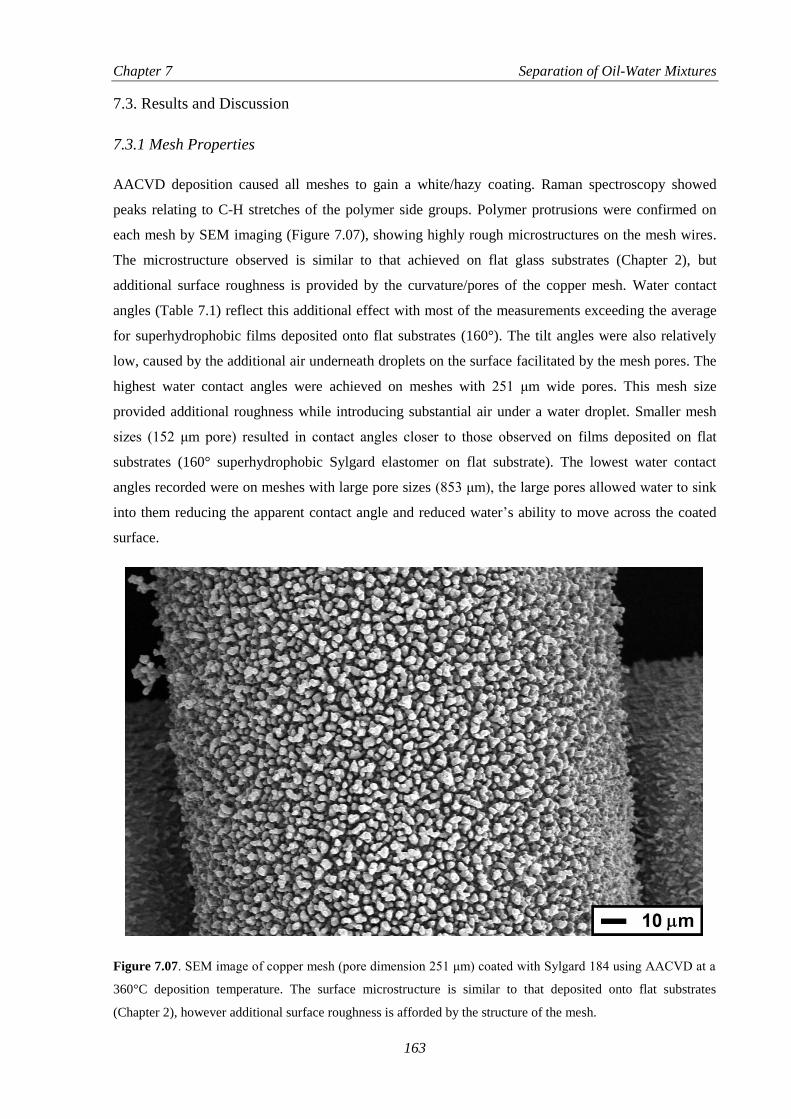
Chapter 7 Separation of Oil-Water Mixtures
163
7.3. Results and Discussion
7.3.1 Mesh Properties
AACVD deposition caused all meshes to gain a white/hazy coating. Raman spectroscopy showed
peaks relating to C-H stretches of the polymer side groups. Polymer protrusions were confirmed on
each mesh by SEM imaging (Figure 7.07), showing highly rough microstructures on the mesh wires.
The microstructure observed is similar to that achieved on flat glass substrates (Chapter 2), but
additional surface roughness is provided by the curvature/pores of the copper mesh. Water contact
angles (Table 7.1) reflect this additional effect with most of the measurements exceeding the average
for superhydrophobic films deposited onto flat substrates (160°). The tilt angles were also relatively
low, caused by the additional air underneath droplets on the surface facilitated by the mesh pores. The
highest water contact angles were achieved on meshes with 251 μm wide pores. This mesh size
provided additional roughness while introducing substantial air under a water droplet. Smaller mesh
sizes (152 μm pore) resulted in contact angles closer to those observed on films deposited on flat
substrates (160° superhydrophobic Sylgard elastomer on flat substrate). The lowest water contact
angles recorded were on meshes with large pore sizes (853 μm), the large pores allowed water to sink
into them reducing the apparent contact angle and reduced water’s ability to move across the coated
surface.
Figure 7.07. SEM image of copper mesh (pore dimension 251 μm) coated with Sylgard 184 using AACVD at a
360°C deposition temperature. The surface microstructure is similar to that deposited onto flat substrates
(Chapter 2), however additional surface roughness is afforded by the structure of the mesh.

Chapter 7 Separation of Oil-Water Mixtures
164
Mesh Pore
Dimensions (μm)
Water Contact
Angle, Uncoated (°)
Water Contact
Angle, Coated (°)
Tilt Angle, Coated
(°)
152 100 163 7
251 135 168 < 2
853 85 132 ~ 30
Table 7.1. Water contact angle/tilt angle data for coated and uncoated copper meshes.
Figure 7.08. Image showing 3 mL water droplets on copper mesh with 251 μm pores – (A) untreated, θ = 135°
and (B) coated with Sylgard 184 via AACVD, θ = 168°.
7.3.2 Tilted Flowing Separation
The expected mechanism of separation for this design was for the mixture of water to make contact
with the mesh above the oil receptor. The toluene in the droplets is absorbed into the mesh and passes
through it, dropping into the oil receptor. Water remaining on the mesh surface, repelled by the mesh,
is directed to roll down the 12° gradient into the water receptor. The efficiency of each mesh was
judged by calculating the amount of oil removed from the water-oil mixture. The 12° tilt angle gave
the best results for separation; lower tilt angles resulted in slower movement of droplets, which
allowed for droplets combing on the mesh surface and a greater amount of toluene was dragged into
the water receptor. Higher tilt angles directed the spread of toluene into the water receptor, lowering
separation efficiencies.
Meshes with 853 μm pore sizes did not act to separate the water: toluene mixtures, since drops
of the mixtures would almost completely fall through the mesh into the oil receptor, with small
amounts of water trapped in the pores of the mesh. Some toluene was observed to spread across the
mesh. The mesh used with 152 μm pores did not let any water through into the oil receptor with all
water dropped travelling into the water receptor. However there was major spreading of toluene
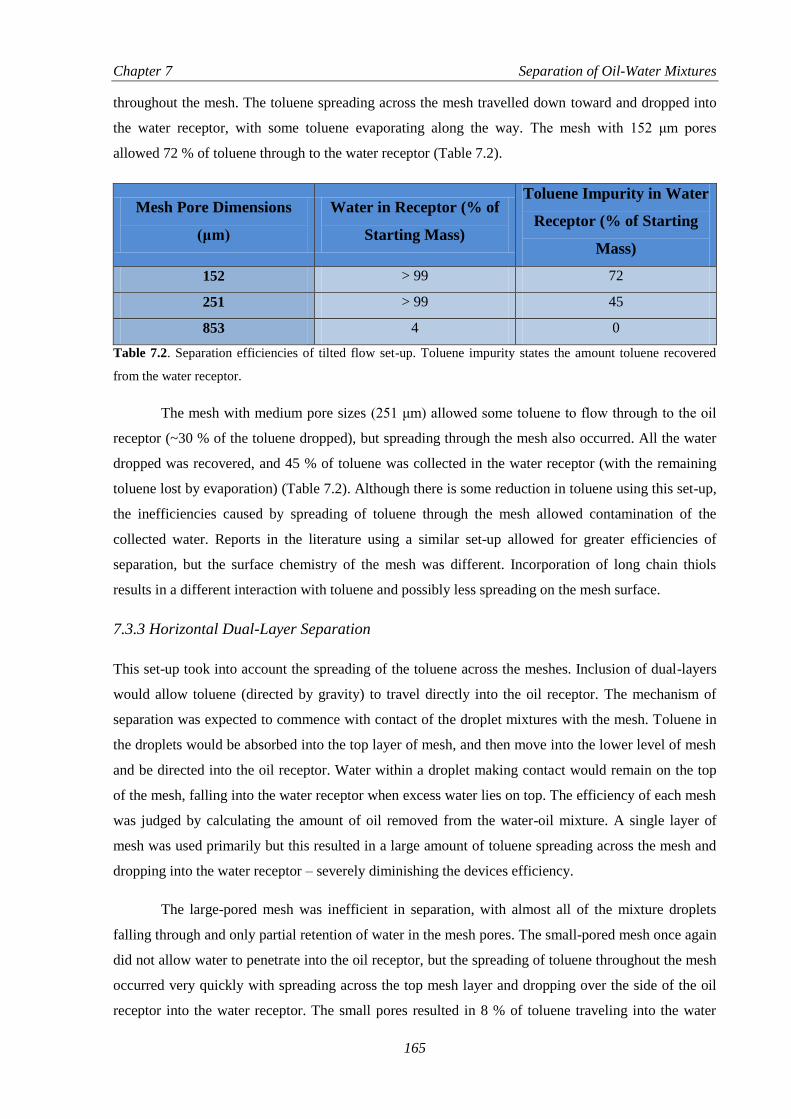
Chapter 7 Separation of Oil-Water Mixtures
165
throughout the mesh. The toluene spreading across the mesh travelled down toward and dropped into
the water receptor, with some toluene evaporating along the way. The mesh with 152 μm pores
allowed 72 % of toluene through to the water receptor (Table 7.2).
Mesh Pore Dimensions
(μm)
Water in Receptor (% of
Starting Mass)
Toluene Impurity in Water
Receptor (% of Starting
Mass)
152 > 99 72
251 > 99 45
853 4 0
Table 7.2. Separation efficiencies of tilted flow set-up. Toluene impurity states the amount toluene recovered
from the water receptor.
The mesh with medium pore sizes (251 μm) allowed some toluene to flow through to the oil
receptor (~30 % of the toluene dropped), but spreading through the mesh also occurred. All the water
dropped was recovered, and 45 % of toluene was collected in the water receptor (with the remaining
toluene lost by evaporation) (Table 7.2). Although there is some reduction in toluene using this set-up,
the inefficiencies caused by spreading of toluene through the mesh allowed contamination of the
collected water. Reports in the literature using a similar set-up allowed for greater efficiencies of
separation, but the surface chemistry of the mesh was different. Incorporation of long chain thiols
results in a different interaction with toluene and possibly less spreading on the mesh surface.
7.3.3 Horizontal Dual-Layer Separation
This set-up took into account the spreading of the toluene across the meshes. Inclusion of dual-layers
would allow toluene (directed by gravity) to travel directly into the oil receptor. The mechanism of
separation was expected to commence with contact of the droplet mixtures with the mesh. Toluene in
the droplets would be absorbed into the top layer of mesh, and then move into the lower level of mesh
and be directed into the oil receptor. Water within a droplet making contact would remain on the top
of the mesh, falling into the water receptor when excess water lies on top. The efficiency of each mesh
was judged by calculating the amount of oil removed from the water-oil mixture. A single layer of
mesh was used primarily but this resulted in a large amount of toluene spreading across the mesh and
dropping into the water receptor – severely diminishing the devices efficiency.
The large-pored mesh was inefficient in separation, with almost all of the mixture droplets
falling through and only partial retention of water in the mesh pores. The small-pored mesh once again
did not allow water to penetrate into the oil receptor, but the spreading of toluene throughout the mesh
occurred very quickly with spreading across the top mesh layer and dropping over the side of the oil
receptor into the water receptor. The small pores resulted in 8 % of toluene traveling into the water

Chapter 7 Separation of Oil-Water Mixtures
166
receptor, while 60 % of toluene was recovered in the oil receptor, with the rest lost to evaporation
(Table 7.3).
Mesh Pore Dimensions
(μm)
Water in Receptor (% of
Starting Mass)
Toluene Impurity in Water
Receptor (% of Starting
Mass)
152 > 99 40
251 > 99 2
853 11 2
Table 7.3. Separation efficiencies of horizontal dual-layered set-up. Toluene impurity states the amount toluene
recovered from the water receptor.
Mesh with medium pore sizes allowed for the most efficient separation. No water was allowed
through the mesh into the oil receptor. The spreading of toluene occurred less rapidly with only 2 % of
toluene traveling into the water receptor – thus providing a separation efficiency of 98 % (Table 7.3).
The success of a medium pore size over large pores is readily apparent, the large pores were unable to
retain water effectively and thus separation could not be achieved. Water droplets that sit on the small
pored mesh possess a reduced amount of air under the water droplets (relative to the other meshes
used), this decreases hydrophobicity affording the coated mesh similar properties to those observed on
flat substrates. Spreading of toluene occurred more rapidly, which resulted in the contamination of the
water gathered. The medium sized pores gave a reduction in toluene spread, while still supporting
water to sit on top of the mesh.
7.4. Conclusions
The superhydrophobic coating on copper mesh greatly improved the hydrophobicity of the Sylgard
184 films, relative to those deposited on flat substrates. The introduction of additional air under the
water droplets, caused by the pores of the mesh, facilitates higher water contact angles. The meshes
were incorporated into two device designs, with the use of dual-layers of superhydrophobic mesh
proving to greatly increase separation efficiencies. Separation efficiencies of up to 98 % were
achieved using this design, due to the directed spreading of toluene throughout the mesh. Further
improvements would focus on tuning the pore size of the mesh and varying the dimensions of the
functional portions of mesh used in the horizontal dual-layer separation set-up.
7.5. References
1. A. Jernelöv, Ambio, 2010, 39, 353.
2. J. R. Skalski, D. A. Coats and A. K. Fukuyama, Environ. Manage., 2001, 28, 9.
3. A. H. Hammoud and M. F. Khalil, P. I. Mech. Eng. E - J. Pro., 2003, 217, 49.
Chapter 7 Separation of Oil-Water Mixtures
167
4. C. Su, App. Surf. Sci., 2009, 256, 1413.
5. Z. J. Yu, E. T. Kang, K. G. Neoh, C. Q. Cui and T. B. Lim, J. Adhesion, 2000, 73, 417.
6. H. Tavana, F. Simon, K. Grundke, D. Y. Kwok, M. L. Hair and A. W. Neumann, J. Colloid Interface Sci.,
2005, 291, 497.
7. S. M. M. Ramos, A. Benyagoub, B. Canut and C. Jamois, Langmuir, 2010, 26, 5141.
8. T. Lim and X. Huang, J. Hazard. Mater., 2006, B137, 820.
9. Q. Wang, Z. Cui, Y. Xiao and Q. Chen, App. Surf. Sci., 2007, 253, 9054.
10. L. Feng, Z. Zhang, Z. Mai, Y. Ma, B. Liu, L. Jiang and D. Zhu, Angew. Chem. Int. Ed., 2004, 43, 2012.

Chapter 8 Conclusions
168
Chapter 8
Conclusions
Figure 8.01. Photograph showing water droplets sitting on a superhydrophobic Lotus leaf.1

Chapter 8 Conclusions
169
8. Conclusions
8.1. The Development of New Routes to Superhydrophobic Surfaces
The aims of this of this research were to construct superhydrophobic surfaces via novel methods using
CVD as a technique. The inherent complications of depositing superhydrophobic surfaces via CVD
were identified in Chapter 1. Conventional CVD methods follow a molecular surface based reaction,
generally resulting in the formation of flat uniform thin films, a deviation from the requirement of high
surface roughness in superhydrophobic surfaces. The initial experimental chapters deal with
overcoming this complication.
The deposition of polymers via AACVD was covered in Chapter 2. This was the first reported
use of polymers to form superhydrophobic surfaces using AACVD. The need for a thermosetting
polymer precursor was identified, and was rationalised through in-situ curing leading to the formation
of polymer microparticles in the gas phase. The result was a one-step process for the deposition of a
superhydrophobic surface, facilitated by the low energy of the elastomers used. Previous work in the
use of polymers to generate superhydrophobic surfaces, included the action of plasma on PTFE2, in
addition to the breakdown of fluorocarbons3 using a similar plasma route. The method discovered
during this research is not only a simple one-step route, but it can also be applied to almost any
substrate able to survive the 300-360°C deposition temperature.
In-situ polymer formation was also used to form silica surfaces (Chapter 3). The novel
deposition of silica microparticles utilised a solution-based reaction which allowed for the acid-
catalysed breakdown of TEOS precursor; this began at 450°C. This is much less than the thermal
decomposition temperature of TEOS which occurs above 700°C4, which would be required for any
CVD route which used thermal vaporisation of precursors. The curing of these silica precursors gave
microparticles was analogous to those observed in the previous chapter. A post-treatment to lower
surface energy the microparticle surfaces rendered them exceptionally superhydrophobic.
The use of particle preformation to gain surface roughness described in these two chapters
utilises the thermophoretic effect in order to deposit preformed particles. Further investigation is
required into the reasons why no detectable amount of material was deposited onto the bottom plate of
the CVD reactor. This research would include possible calculation and simulation of conditions inside
the CVD reactor, in addition to deposition of particles of known sizes. Improvements to the outline
techniques will also be attempted; these include the use of different polymers as well as
microbiological testing on enhanced polymer surfaces.
The deposition of copper and copper (I) oxide films from copper (II) nitrate (Chapter 4) is an
example of a conventional CVD deposition. The deposition of copper metal at 350°C was very

Chapter 8 Conclusions
170
unexpected, as depositions of Cu(0) had only been reported at temperatures lower than this or under an
atmosphere containing reducing agents5. The formation of copper metal was rationalised through the
in-situ production of hydrogen through the breakdown of methanol solvent. The benefit of carrying
out a deposition that follows a conventional CVD mechanism is that conformal coverage of a substrate
is achieved. Conformal coverage would allow for uniform coating of pre-roughened substrates and the
generation of microroughness (substrate) as well as nanoroughness (thin film) leading to magnification
of the post-functionalisation surface hydrophobicities afforded by either length scale individually.
Further analysis is required in order to confirm the production of gas phase hydrogen. In
addition to this the use of pre-roughened substrates will also be carried-out to form surfaces with
greater hydrophobicities.
8.2. The Anti-microbial Application of Superhydrophobic Surfaces
A bacterial attachment experiment was developed in order to examine the ability of bacteria to attach
to superhydrophobic surfaces (Chapter 5). The range of current examination of antimicrobial testing
on these highly water-repelling surfaces rarely extends further than the removal of particulate material
under the action of water6. The attachment assay not only tested Lotus-effect self-cleaning but also
revealed preferential point of attachment. The submersion experiments revealed that positions of
bacterial attachment was limited to the peaks of surface protrusions, which had not been reported
previously. Further testing of bacterial adhesion on these surfaces could offer further insight into
producing surface coatings aimed toward reduced surface transferred infections.
8.3. Utilising the Dynamic Interaction of Water
The work carried out during this thesis has resulted in a wide range of surfaces being synthesised, each
with a specific type of interaction with water. The ability to synthesis a surface with a definite
roughness and surface chemistry facilitated a large investigation into the nature of water bouncing on
hydrophobic surfaces (Chapter 6). A relationship was established between water contact angle, surface
roughness and number of bounces achieved. Conclusions from the investigation included a new
definition for superhydrophobicity and a new scale of superhydrophobicity; which was based on the
ability of a surface to facilitate water bouncing. A technique was also developed to monitor the
internal motion within a water droplet moving across a surface.
The water bouncing technique was developed in order to expand the range of testing available
to those who synthesis superhydrophobic surfaces. Further experimentation is required to test the
results gained from the technique. Confirmative studies must be carried out to justify wider uptake of
this new technique. Further work will also be carried-out which examines the boundary between 0 and
1 bounce, and also tackle the issue of ‘When is a bounce, a bounce?’.

Chapter 8 Conclusions
171
The facets of superhydrophobic surfaces were extended to the separation of toluene and water.
By considering the hydrophobic/oleophilic nature of the materials used to construct superhydrophobic
surfaces, the simultaneous repulsion of water and attraction of toluene was achieved. This lead to the
design and testing of devises which successfully achieved the separation of toluene and water. This
was done by altering the process of the AACVD of polymers, by deposition onto mesh instead of a flat
substrate. The separation experiments will be extended to a wider range of organic solvents, with
further aims geared toward scaling-up the experiments to separate larger amounts of liquids.
The main goal of the project was to synthesise hydrophobic surfaces using CVD, this meant
overcoming inherent complications of the technique and would require the development of novel
routes. A further aim was to explore the functional properties of the synthesised surfaces. The large
number of hydrophobic surfaces generated in this project was allowed primarily through
understanding of the surface features required for high surface hydrophobicity. Through exploration of
existing methods, general routes to forming hydrophobic surfaces were drafted. The principle
established in Chapter 1 allowed for the design of exceptionally hydrophobic surface coating, these
were formed using multiple techniques. Given the range of surfaces synthesised further investigation
into the nature of surface hydrophobicity was made possible.
8.4. References
1. http://pgtnaturegarden.org/2011/05/water-drops-on-a-lotus-leaf/
2. S. H. Yang, C. Liu, W. Hsu and H. Chen, Surf. Coat. Technol., 2009, 203, 1379.
3. D. J. Balazs, C. Hollenstein and H. J. Mathieu, Plasma Processes Polym., 2005, 2, 104.
4. R. Gordon, J. Non-Cryst. Solids., 1997, 218, 81.
5. H. Ko, J. Jhin, D. Byun, J. Lee and D. Park, IEEE Trans. Compon. Packag. Technol., 2005, 28, 781.
6. A. Solga, Z. Cerman, B. F. Striffler, M. Spaeth and W. Barthlott, Bioinspiration Biomimetics, 2007, 2,
S126.

Appendices
172
Appendices

Appendices
173
Appendices
A.1 List of Publications
1. C. R. Crick and I. P. Parkin, ‘CVD of Copper and Copper Oxide Thin Films via the in-situ
Reduction of Copper (II) Nitrate — A Route to Conformal Superhydrophobic Coatings’, J.
Mater. Chem., DOI: 10.1039/c1jm11955a.
2. C. R. Crick and I. P. Parkin, ‘Superhydrophobic Silica Films on Glass Formed by Hydrolysis
of an Acidic Aerosol of Tetraethylorthosilicate’, J. Mater. Chem., 2011, 21, 9362.
3. C. R. Crick, S. Ismail, J. Pratten and I. P. Parkin, ‘An Investigation into Bacterial Attachment
to an Elastomeric Superhydrophobic Surface Prepared via Aerosol Assisted Deposition’, Thin
Solid Films, 2011, 519, 3722.
4. C. R. Crick and I. P. Parkin, ‘Aerosol Assisted Deposition of Melamine-formaldehyde Resin:
Hydrophobic Thin Films from a Hydrophilic Material’, Thin Solid Films, 2011, 519, 2181.
5. A. Kafizas, C. R. Crick, I. P. Parkin, J. Photoch. Photobio. A, 2010, 216, 156.
6. C. R. Crick and I. P. Parkin, ‘Superhydrophobic Polymer Films via Aerosol Assisted
Deposition — Taking a Leaf Out of Nature's Book’, Thin Solid Films, 2010, 518, 4328.
7. C. R. Crick and I. P. Parkin, ‘Preparation and Characterisation of SuperHydrophobic
Surfaces’, Chem. Eur. J., 2010, 16, 3568.
8. C. R. Crick and I. P. Parkin, ‘A Single-step Route to Superhydrophobic Surfaces Through
Aerosol Assisted Deposition of Rough Polymer Surfaces: Duplicating the Lotus Effect’, J.
Mater. Chem., 2009, 19, 1074.
9. C. R. Crick and I. P. Parkin, ‘Water Droplet Bouncing – A Definition for Superhydrophobic
Surfaces’, submitted to Chem. Comm., 01/08/2011.
10. C. R. Crick and I. P. Parkin, ‘Advances in the Aerosol Assisted Depositions of Polymers’, J.
Nanosci. Nanotechnol., To be presented at EuroCVD 2011.

Appendices
174
A.2 Water Contact Angle/Water Bouncing - Full Data Set
The following data details the bouncing of water droplets on various surfaces, 8μL droplets were
dropped from a height of 20 mm (dispensing tip to surface). ['Surface average' data provides water contact angle and water bouncing averages on each surface type (10 spots
for each surface), 'spot testing' uses water droplets bouncing on a point with known water contact angle.]
Surface Averages
CA (°)
No. Bounces
Material Roughness
Type
5 0 UV-Irradiated Titania Flat
30 0 Non-Irradiated Titania Flat
45 0 Glass Flat
71 0 Heat Treated Glass Flat
90 0 Copper Metal Flat
95 0 Flat Sylgard 184 Elastomer Flat
99 0 Flat Dyneon FC-2120 Fluoroelastomer Flat
110 0
AACVD Coating of Dyneon FC-2120 Fluoroelastomer on Glass
Rounded
129 0
AACVD Coating of Sylgard 184 Elastomer on Glass
Rounded
130 0
AACVD Coating of Sylgard 184 Elastomer on Glass
Rounded
152 1.2
AACVD Coating of Sylgard 184 Elastomer on Glass
Rounded
156 2.5
AACVD Coating of Sylgard 184 Elastomer on Glass
Rounded
156 2.5
AACVD Coating of Sylgard 184 Elastomer on Glass
Rounded
156 3
AACVD Coating of Sylgard 184 Elastomer on Glass
Rounded
157 4
AACVD Coating of Sylgard 184 Elastomer on Glass
Rounded
161 5
AACVD Coating of Sylgard 184 Elastomer on Glass
Rounded
165 7
AACVD Coating of Sylgard 184 Elastomer on Glass
Rounded
169 9
AACVD Coating of Sylgard 184 Elastomer on Elastomer Substrate
Rounded
171 12
Thiol-functionalised Copper Hydroxide Nanoneedles
Sharp (Needles)
172 12
Fluorinatedthiol-functionalised Copper Hydroxide Nanoneedles
Sharp (Needles)
175 12
Trimethylsiloxane Functionalised Silica Microparticles Deposited by Hybrid CVD
Rounded

Appendices
175
Spot Testing
CA (°)
No. Bounces
Material Roughness
Type
120.3 0
AACVD Coating of Sylgard 184 Elastomer on Glass
Rounded
120.8 0
AACVD Coating of Sylgard 184 Elastomer on Glass
Rounded
121.5 0
AACVD Coating of Sylgard 184 Elastomer on Glass
Rounded
121.9 0
AACVD Coating of Sylgard 184 Elastomer on Glass
Rounded
123.2 0
AACVD Coating of Sylgard 184 Elastomer on Glass
Rounded
123.3 0
AACVD Coating of Sylgard 184 Elastomer on Glass
Rounded
125.7 0
AACVD Coating of Sylgard 184 Elastomer on Glass
Rounded
127.3 0
AACVD Coating of Sylgard 184 Elastomer on Glass
Rounded
127.4 0
AACVD Coating of Sylgard 184 Elastomer on Glass
Rounded
127.6 0
AACVD Coating of Sylgard 184 Elastomer on Glass
Rounded
128.8 0
AACVD Coating of Sylgard 184 Elastomer on Glass
Rounded
128.8 0
AACVD Coating of Sylgard 184 Elastomer on Glass
Rounded
130.7 0
AACVD Coating of Sylgard 184 Elastomer on Glass
Rounded
132.4 0
AACVD Coating of Sylgard 184 Elastomer on Glass
Rounded
132.6 0
AACVD Coating of Sylgard 184 Elastomer on Glass
Rounded
133.6 0
AACVD Coating of Sylgard 184 Elastomer on Glass
Rounded
134.7 0
AACVD Coating of Sylgard 184 Elastomer on Glass
Rounded
140.2 0
AACVD Coating of Sylgard 184 Elastomer on Glass
Rounded
142.0 0
AACVD Coating of Sylgard 184 Elastomer on Glass
Rounded
142.3 0
AACVD Coating of Sylgard 184 Elastomer on Glass
Rounded
144.0 0
AACVD Coating of Sylgard 184 Elastomer on Glass
Rounded
147.4 0
AACVD Coating of Sylgard 184 Elastomer on Glass
Rounded
148.5 0
AACVD Coating of Sylgard 184 Elastomer on Glass
Rounded
149.6 0
AACVD Coating of Sylgard 184 Elastomer on Glass
Rounded
149.7 0
AACVD Coating of Sylgard 184 Elastomer on Glass
Rounded
150.4 0
AACVD Coating of Sylgard 184 Elastomer on Glass
Rounded
150.8 0
AACVD Coating of Sylgard 184 Elastomer on Glass
Rounded

Appendices
176
151.1 1
AACVD Coating of Sylgard 184 Elastomer on Glass
Rounded
151.2 0
AACVD Coating of Sylgard 184 Elastomer on Glass
Rounded
151.3 1
AACVD Coating of Sylgard 184 Elastomer on Glass
Rounded
151.4 1
AACVD Coating of Sylgard 184 Elastomer on Glass
Rounded
151.4 1
AACVD Coating of Sylgard 184 Elastomer on Glass
Rounded
151.4 1
AACVD Coating of Sylgard 184 Elastomer on Glass
Rounded
151.4 1
AACVD Coating of Sylgard 184 Elastomer on Glass
Rounded
151.6 1
AACVD Coating of Sylgard 184 Elastomer on Glass
Rounded
151.7 1
AACVD Coating of Sylgard 184 Elastomer on Glass
Rounded
151.7 1
AACVD Coating of Sylgard 184 Elastomer on Glass
Rounded
151.7 1
AACVD Coating of Sylgard 184 Elastomer on Glass
Rounded
151.8 1
AACVD Coating of Sylgard 184 Elastomer on Glass
Rounded
151.8 1
AACVD Coating of Sylgard 184 Elastomer on Glass
Rounded
151.9 1
AACVD Coating of Sylgard 184 Elastomer on Glass
Rounded
151.9 0
AACVD Coating of Sylgard 184 Elastomer on Glass
Rounded
151.9 1
AACVD Coating of Sylgard 184 Elastomer on Glass
Rounded
152.0 1
AACVD Coating of Sylgard 184 Elastomer on Glass
Rounded
152.1 0
AACVD Coating of Sylgard 184 Elastomer on Glass
Rounded
152.1 1
AACVD Coating of Sylgard 184 Elastomer on Glass
Rounded
152.1 1
AACVD Coating of Sylgard 184 Elastomer on Glass
Rounded
152.2 1
AACVD Coating of Sylgard 184 Elastomer on Glass
Rounded
152.3 1
AACVD Coating of Sylgard 184 Elastomer on Glass
Rounded
152.4 0
AACVD Coating of Sylgard 184 Elastomer on Glass
Rounded
152.5 1
AACVD Coating of Sylgard 184 Elastomer on Glass
Rounded
152.8 0
AACVD Coating of Sylgard 184 Elastomer on Glass
Rounded
152.8 2
AACVD Coating of Sylgard 184 Elastomer on Glass
Rounded
153.0 2
AACVD Coating of Sylgard 184 Elastomer on Glass
Rounded
153.1 0
AACVD Coating of Sylgard 184 Elastomer on Glass
Rounded
153.2 0
AACVD Coating of Sylgard 184 Elastomer on Glass
Rounded
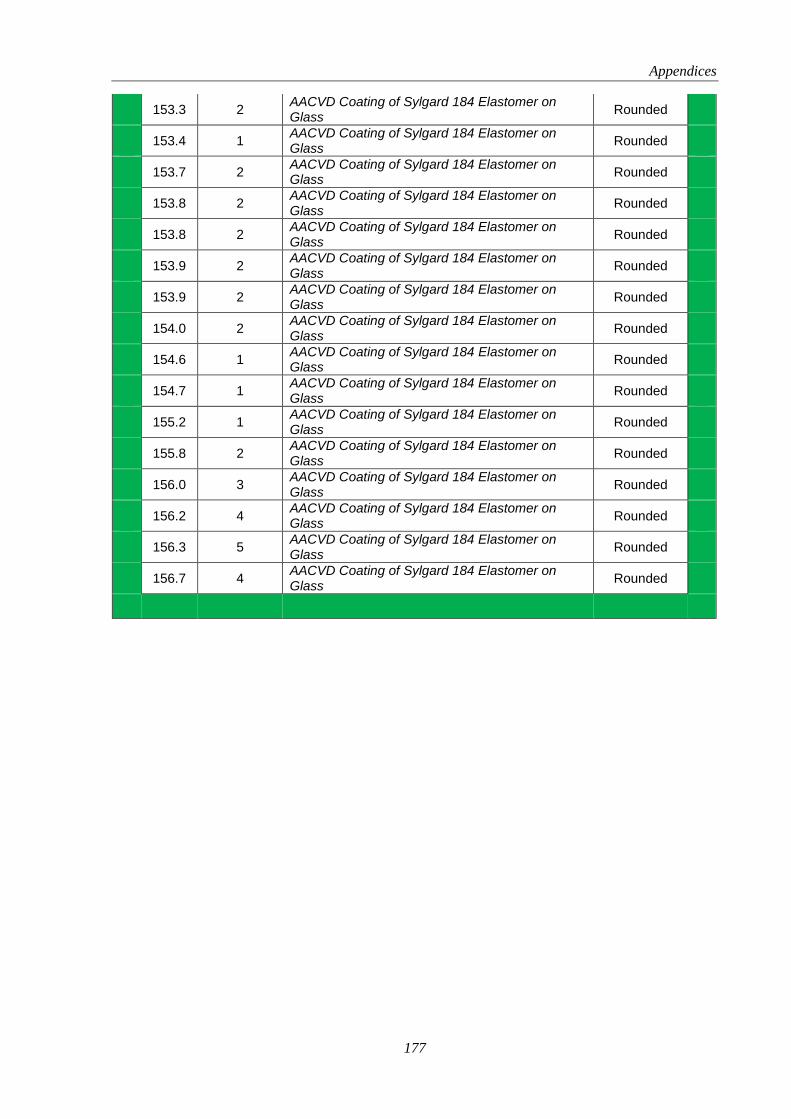
Appendices
177
153.3 2
AACVD Coating of Sylgard 184 Elastomer on Glass
Rounded
153.4 1
AACVD Coating of Sylgard 184 Elastomer on Glass
Rounded
153.7 2
AACVD Coating of Sylgard 184 Elastomer on Glass
Rounded
153.8 2
AACVD Coating of Sylgard 184 Elastomer on Glass
Rounded
153.8 2
AACVD Coating of Sylgard 184 Elastomer on Glass
Rounded
153.9 2
AACVD Coating of Sylgard 184 Elastomer on Glass
Rounded
153.9 2
AACVD Coating of Sylgard 184 Elastomer on Glass
Rounded
154.0 2
AACVD Coating of Sylgard 184 Elastomer on Glass
Rounded
154.6 1
AACVD Coating of Sylgard 184 Elastomer on Glass
Rounded
154.7 1
AACVD Coating of Sylgard 184 Elastomer on Glass
Rounded
155.2 1
AACVD Coating of Sylgard 184 Elastomer on Glass
Rounded
155.8 2
AACVD Coating of Sylgard 184 Elastomer on Glass
Rounded
156.0 3
AACVD Coating of Sylgard 184 Elastomer on Glass
Rounded
156.2 4
AACVD Coating of Sylgard 184 Elastomer on Glass
Rounded
156.3 5
AACVD Coating of Sylgard 184 Elastomer on Glass
Rounded
156.7 4
AACVD Coating of Sylgard 184 Elastomer on Glass
Rounded
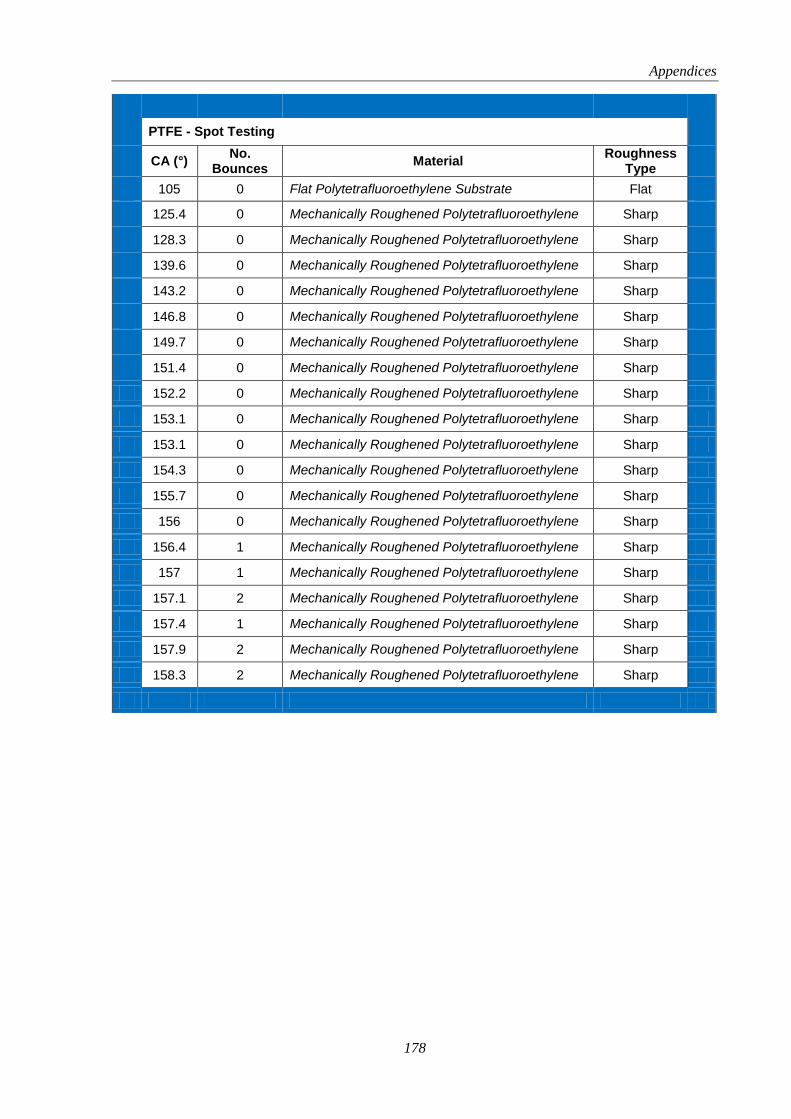
Appendices
178
PTFE - Spot Testing
CA (°)
No. Bounces
Material Roughness
Type
105 0 Flat Polytetrafluoroethylene Substrate Flat
125.4 0 Mechanically Roughened Polytetrafluoroethylene Sharp
128.3 0 Mechanically Roughened Polytetrafluoroethylene Sharp
139.6 0 Mechanically Roughened Polytetrafluoroethylene Sharp
143.2 0 Mechanically Roughened Polytetrafluoroethylene Sharp
146.8 0 Mechanically Roughened Polytetrafluoroethylene Sharp
149.7 0 Mechanically Roughened Polytetrafluoroethylene Sharp
151.4 0 Mechanically Roughened Polytetrafluoroethylene Sharp
152.2 0 Mechanically Roughened Polytetrafluoroethylene Sharp
153.1 0 Mechanically Roughened Polytetrafluoroethylene Sharp
153.1 0 Mechanically Roughened Polytetrafluoroethylene Sharp
154.3 0 Mechanically Roughened Polytetrafluoroethylene Sharp
155.7 0 Mechanically Roughened Polytetrafluoroethylene Sharp
156 0 Mechanically Roughened Polytetrafluoroethylene Sharp
156.4 1 Mechanically Roughened Polytetrafluoroethylene Sharp
157 1 Mechanically Roughened Polytetrafluoroethylene Sharp
157.1 2 Mechanically Roughened Polytetrafluoroethylene Sharp
157.4 1 Mechanically Roughened Polytetrafluoroethylene Sharp
157.9 2 Mechanically Roughened Polytetrafluoroethylene Sharp
158.3 2 Mechanically Roughened Polytetrafluoroethylene Sharp