Embed Size (px)
Citation preview
The chemical multiversePreparing for quantum changes in the global chemical industry
Global Manufacturing Industry GroupNovember 2010
Table of contents
Deloitte refers to one or more of Deloitte Touche Tohmatsu Limited, a UK private company limited by guarantee, and its network of member firms, each of which is a legally separate and independent entity. Please see www.deloitte.com/about for a detailed description of the legal structure of Deloitte Touche Tohmatsu Limited and its member firms.
Deloitte provides audit, tax, consulting, and financial advisory services to public and private clients spanning multiple industries. With a globally connected network of member firms in more than 140 countries, Deloitte brings world-class capabilities and deep local expertise to help clients succeed wherever they operate. Deloitte’s approximately 170,000 professionals are committed to becoming the standard of excellence.
This publication contains general information only, and none of Deloitte Touche Tohmatsu Limited, any of its member firms or any of the foregoing’s affiliates (collectively the “Deloitte Network”) are, by means of this publication, rendering accounting, business, financial, investment, legal, tax, or other professional advice or services. This publication is not a substitute for such professional advice or services, nor should it be used as a basis for any decision or action that may affect your finances or your business. Before making any decision or taking any action that may affect your finances or your business, you should consult a qualified professional adviser. No entity in the Deloitte Network shall be responsible for any loss whatsoever sustained by any person who relies on this publication.
© 2010 Deloitte Global Services Limited
The need for multi-dimensional thinking 1
Lessons from The decade ahead 3
Scenarios: planning for uncertainty 6
Three possibilities 7
Understanding the starting point 9
Moving ahead, seeking opportunity 20
Practical strategies for the next decade 28
The road ahead 34
Contacts 35
Acknowledgements 36

1
An in-depth examination of the state of the global chemical industry reveals anything but a cohesive picture of an industry on a linear path. It remains the case that chemical products will play vital roles in solving many of the world’s problems over the next 10 years and well into the future. What is less clear is how those problems will be solved. More than ever, individual companies are redefining and refining the roles they currently play and the roles they expect to play in the future. They are shifting their strategies. They are seeking to understand their own capabilities and channel them into solutions for the specific, fast-changing needs of their customers. Ultimately, they are looking to make the right choices to ensure their success.
While some companies have grasped this uncertain reality and put themselves in a position to succeed over the past 12 years, many others are struggling. The goal of The chemical multiverse: Preparing for quantum changes in the global chemical industry (The chemical multiverse) is to help companies find a profitable place in the industry by bringing their thinking in line with the successful minority (see sidebar
“Multiverse defined”). Drawing on research and analysis of corporate performance over the past 12 years, this report also includes valuable insights from working sessions with more than 150 chemical industry executives. It begins with a review of the current industry landscape and offers a new approach for companies to better analyze and understand their place in it, providing a solid starting point for further strategizing.
Traditional approaches to increasing profitability are outdated and relying too much on incremental progress and too little on structural change to be truly effective. Looking forward, the next decade will likely be characterized by a number of massive cultural and market changes currently underway that are referred to in this document as “megatrends.” Each presents an excellent opportunity for companies that are able to make the necessary structural changes to put themselves in the best position to take advantage as these megatrends unfold.
Yet global economic uncertainty is a significant obstacle facing the entire industry over the next few years. This fact underlines the message of the Deloitte Touche Tohmatsu Limited (DTTL) Global Manufacturing Industry Group’s report The decade ahead: Preparing for an unpredictable future in the global chemical industry (The decade ahead), which analyzed the performance of industry companies last decade, modeled the evolving balance of supply and demand, and recommended planning for a number of economic scenarios. With this scenario-planning approach, the goal of that report was to help prepare companies to capitalize on emerging trends and respond to nascent threats.
To thrive (and, in some cases, survive) over the next decade, companies need to sharpen their business models and be open to constant refinements that will allow them to react to and capitalize on these exciting changes. Companies will be compelled to free up investment capital, prepared to deal with new markets, develop new products, and deliver new solutions to eager and demanding customers.
The need for multi-dimensional thinking
Multiverse definedThe term “multiverse” aptly describes the state of the chemical industry by suggesting the many discrete and unique sets of circumstances that will characterize chemical companies for the next 10 years and more. Any company’s progress will be determined by the following factors:
Its starting point•The economic environment•Megatrends•Its strategies and actions•
Each of these variables encompasses several other variables — the economic environment in one country may differ from that of another, for example — which virtually ensures that no pathways will be alike for any two chemical companies. And, based on the position of each company, do not be surprised if some companies make quantum changes and, along the way, reshape the industry.
Source: DTTL’s Global Manufacturing Industry Group analysis.
The chemical multiverse 2
As companies develop strategies for the coming decade, scenario planning is important, but so is the need for companies to take a realistic view of where they currently stand. An important finding of the Global Manufacturing Industry Group’s analysis was the limited consequences for companies that underperformed. Understanding why these companies survived and why leaders outperformed feeds into an examination of where companies and the industry are starting from as we enter the next decade. This report offers new and different approaches to determine that starting point.
The analysis also revealed that success stories of the past 12 years consistently involved companies that acted. They made structural changes based on a focused strategy, managed their portfolios with discipline, understood and concentrated on their business models, and continued to believe in their capacity to innovate and grow. Conversely, consistent and emphatic data show that a significant percentage of companies saw their performance suffer over the last decade, mostly due to financial and structural constraints that limited their ability to act. The lesson is clear: it is expensive and potentially value destroying for companies to remain inactive while waiting for a rebound that may be slow in coming.
The Global Manufacturing Industry Group’s research shows strong evidence that this will be a pivotal decade for the chemical industry, a decade marked by unprecedented transformation. The industry will no doubt look very different in 2020. However, by understanding three key dimensions — the current starting point, the possible economic scenarios, and the drivers of strategic change — companies can prepare for the challenges ahead. For the majority of these companies, this will be the beginning of a lengthy process of structural evolution.
3
In a previous report, The decade ahead (see sidebar “Genesis for The chemical multiverse”), the Global Manufacturing Industry Group examined past performance in the chemical industry as a way of preparing for what is expected to be a volatile future. From an analysis of the performance of 228 chemical companies since 1998, a picture emerged of an industry under significant structural pressure and on the precipice of profound transformation. The report concluded that most companies in the chemical industry will find it increasingly difficult to achieve profitable growth (see sidebar “Key findings from The decade ahead”). For a meaningful percentage of
companies, the more immediate challenge is to survive and develop positive momentum.
While all companies want to eliminate profit-limiting legacy strategies and assets, only a few have been successful in their efforts to date. In this next decade, the need to respond innovatively to large changes in customer needs will require companies to adopt the right model and focus their investments on those key areas that can realistically and profitably serve their customers. Areas that cannot be served by older models should receive less attention. Moreover, any company subject to shareholder expectations will be under scrutiny to prove itself an effective steward of existing assets and demonstrate its ability to maximize value in its existing portfolio. However, for the companies that have performed well and have worked hard to establish a position for future growth, the road ahead holds both exciting opportunities and unfamiliar challenges.
Some hard truthsFrom certain angles the global chemical industry seems powerful, resilient, and full of potential. Yet, a large proportion of the companies studied should be on the verge of a full-scale shakeout or should have gone through one already. The contributing factors to current difficulties have been building for several decades, and hard times have been falsely predicted as imminent before. So far, all but a few companies have stayed above water, but this could be the decade of the Category 5 storm that has been brewing for much of the industry for at least 25 years. Has the time come for those chemical companies that have not already to face hard truths? Will those that do not be more severely punished than in the past decade? Will the small but important group of companies that have successfully managed their circumstances and become industry leaders break away even further from the pack?
Underlying these challenges is a potentially scarce and erratic flow of capital, diminishing returns on equity, and a potentially smaller public investment pool — especially for underperforming companies. Historically, traditional thinkers in the chemical industry have strived to manage the industry cycle, achieve capital discipline, and maintain gross margins. As a result, great improvements in this area were made in the last decade.
Lessons from The decade ahead
Genesis for The chemical multiverseThe decade ahead, first in a series of three reports, was developed to help understand the landscape of the global chemical industry using scenario planning. The chemical multiverse, second in the series, was initiated to validate, and at times, challenge the content of the first report.
With over 150 candid discussions with chemical executives from around the globe and an additional 20 with industry, the Global Manufacturing Industry Group team was able to use these valuable insights to develop a practical and simple approach to help global chemical companies prepare for the decade ahead. Primary and secondary research was also used as a foundational tool to help formulate and develop a unique strategies and solutions framework. When DTTL’s Global Manufacturing Industry Group research began for The decade ahead, 231 companies were evaluated. Due to recent acquisitions, the present analysis includes 228 companies.
Through the many conversations Deloitte had while developing this report, it was clear that executives in the global chemical industry are well aware of the uncertainties facing the industry and the challenges associated with an underperforming company. The chemical multiverse will help guide chemical leaders to the appropriate and most applicable solutions that can help them navigate and prepare for the future.
Source: DTTL’s Global Manufacturing Industry Group analysis.

The chemical multiverse 4
However, just at the point when the industry seemed to have acquired capital discipline, state-owned enterprises, and other deep-pocketed investors changed the game. The resulting overcapacity was exacerbated by the economic crisis that still lingers, and companies were forced into survival mode. As uncertainty in the economic environment persists and the industry continues to experience depressed return on equity (compared with other industries), access to capital and the price paid for it could become a new obstacle for certain companies.
A harder operational truth is that gross margins were compressed over the last decade, and there may be more pressure to come. Worldwide electricity consumption and demand for transportation fuels are leading to forecasts of increased petroleum prices, which will raise input costs for many companies. Feedstock choices may also become difficult in an evolving supply/demand picture. Chemical product pricing did not keep up with increases in input costs over the last decade, and it may not be possible to offer much relief from any further gross margin erosion by passing along higher costs to customers. This will be especially true given the ongoing trend of commoditization and the availability of substitutes in key chemical and material end markets.
Further but different pressure on pricing is also expected in the wake of the significant capacity buildup caused by alliances between traditional competitors, oil majors, non-traditional state-owned enterprises, as well as other government-directed investments in China and the Middle East. The scale of some new plants is unprecedented. China has escalated its chemical production in an effort to meet the needs of its growing middle class, stimulate its economy, and meet export demands. Middle Eastern countries, seeking to monetize their prime resources of oil and natural gas and boost employment, have also embarked on a similar plant-building and downstream strategy. The resulting overcapacity, coupled with demand shifts to the East, leaves many mature players with an expensive and subscale legacy infrastructure devoted to producing uncompetitive products. Despite the efforts of many companies to address structural cost problems, a large percentage of the 228 companies analyzed by the Global Manufacturing Industry Group are experiencing
lower margins, underperforming assets, and declines in performance versus competitors and peers.
The effects of more difficult operating conditions on individual company performance were highlighted in the Global Manufacturing Industry Group’s analysis, which
Key findings from The decade aheadGross margin eroded from 1998–2009:•
(15%) for commodities –(7%) for integrated –7% for specialties –
Commoditization and cyclicality now prevalent •across all segments.High variability in performance was not explained •by segmentation.Rise of the chemical industry in the developing •world has led to unprecedented supply-demand imbalances.Innovation has been a challenging task leading •many to cut investment.Chronic talent and employee demographic issues •across the industry.Over 60 companies not making cost of capital.•State-owned enterprise investments are radically •changing industry dynamics.
For further information, visit www.deloitte.com/thedecadeahead.
The decade aheadPreparing for an unpredictable future in the global chemical industry
A report by the Deloitte Touche Tohmatsu Chemical Group
and Deloitte Research (United States)
Source: DTTL’s Global Manufacturing Industry Group analysis.

5
showed high variability in returns and value across all traditional segments (i.e., commodity, integrated, and specialty). This variability was especially pronounced in the specialty segment, which had previously been characterized by consistently strong, non-cyclical performance.
The increasing role of certain governments via industry regulation is also likely to have a larger impact on competition and costs than in previous decades. This impact will be felt on two fronts. First, the chemical industry will have to deal with new environmentally focused regulations and take positions on issues, such as climate change. Companies may also consider opportunities in areas, such as sustainability and alternative energy. Second, the race for talent is closely linked to the stance a company takes on the environment, as numerous studies have shown that the next generation of employees is more conscious than ever about their employer’s brand and reputation.
Conventional wisdom points to innovation as an obvious solution to the industry’s challenges, both present and future. Yet an in-depth analysis of industry innovation as it relates to yield and investment found that, by most measures, innovation has been on the decline and has not been delivering the same impact it once did. Although many companies have explored innovation as a way to spur new growth, the majority have not succeeded.
More than a return to a strong economy will be needed to reverse the fate of the growing number of troubled chemical companies. Without real structural change and more discipline and focus, companies will find it increasingly difficult to function effectively in a global industry that is ever more competitive, commoditized, and cyclical.
Looking forward There were hopeful signs in the analysis: It clearly identified a tight group of leading companies that had improved their performance in the last decade. How did they do it? They began by realistically assessing their current position and learning from past mistakes. When confronted with unfavorable circumstances, this group reacted not with denial, but by making difficult yet necessary structural changes. They isolated and addressed poorly performing
businesses and product lines, narrowed their investments to those with the highest potential for value creation, and made the appropriate portfolio and organizational changes. For example, many allocated more resources to critical markets like China and filled skill and leadership gaps. These companies have been planning for the decade ahead for three to five years, and this planning is reflected in their performance, value, and direction.
Moving forward, should other companies seek to emulate this successful formula? In most cases, the answer is yes, but much depends on the actions companies are willing to take and how prepared they are for a changing environment. Much also depends on the strengths and limitations of their current position. As a result, more structural change lies in the industry’s future, even among the success stories. Businesses that have a negative value contribution will need to be dealt with. Companies will be forced to examine expenditures on core processes relative to the benefits produced. Those that do not work effectively should be phased out altogether or replaced by 21st-century methods and tools.
Answers to critical questions can be found in other industries where companies have operated successfully for years under different competitive environments, business models, and innovation challenges. But time is short for those companies that need to realistically assess their current position and take appropriate action. Even the companies that successfully navigated the past decade will be challenged to sustain their gains without acting, particularly now that state-owned chemical companies are part of the competitive landscape.
Considerably less leeway will mark the global competitive environment in the years ahead, despite an ambiguous future economic environment. A practical, executable way forward is called for. The Global Manufacturing Industry Group’s approach plots a given chemical company’s current position, and then tests different strategy hypotheses and options under alternative scenarios. Through this approach, chemical companies can move beyond survival mode and into a position of strength.
The chemical multiverse 6
Currently, there is considerable uncertainty over where global markets are heading, with well-documented predictions about the future often presenting contradictory positions. Some economists, academics, think-tank scholars, financial analysts, and political leaders contend that Asia is in a renaissance and that Western domination is fading.1 In contrast, others insist that Asia is still subject to significant weaknesses and vulnerabilities.2
Yet businesses have to plan and manage strategic risk regardless of conflicting outlooks. Chemical companies therefore need to incorporate scenarios into their strategic planning. As part of the Global Manufacturing Industry Group’s analysis in The decade ahead, clashing views about market dynamics were organized into three scenarios that depict alternative futures for the period 2010–2020 (see Figure 1).
Scenarios: Planning for uncertainty
Figure 1: Scenarios for future market dynamics
Scenario three: ResilienceA strong recovery is attributed to astute government management of national economies while the policy pendulum swings away from reliance on market forces. China, Europe, and the U.S. become increasingly competitive but accept a set of uniform rules and mechanisms to deal with commercial disputes and limit geopolitical frictions. Public opinion favors more stringent global EHS standards. Renewables and nanotechnology benefit from various forms of government support.
Scenario one: TransitionThe West’s global domination deteriorates as North America and Europe are unable to contain the inflation that erupts after the recent recession. Boom-and-bust cycles persist throughout the decade. Developing nations are more adept at managing growth and they decouple from the West in favor of a China-centered bloc. Concerns about energy reserves grow as it becomes more difficult and expensive to produce enough oil and gas to meet demand. Given the economic turmoil, efforts designed to raise environmental, health, and safety (EHS) standards take a backseat to protecting jobs, finding new energy sources, and cutting energy use.
Scenario two: DislocationIn developed nations, a decade of lackluster economic performance means coping with dispirited consumers, wary investors, and disgruntled voters. In Asia and the Middle East, the falloff in foreign export demand has further adverse repercussions — growth is curtailed; domestic social and political unrest is intensified; and international frictions flare into conflicts. Turmoil in some developing-world nations intermittently affects global oil markets, but generally resource prices are low due to reduced demand and excess capacity. Regulatory policy and research and development (R&D) support during the decade are uneven thanks to the turbulence of the times.
Source: DTTL’s Global Manufacturing Industry Group analysis.
1 Kishore Mahbubani, The New Asian Hemisphere: The Irresistible Shift of Global Power to the East, 2008; Fareed Zakaria, The Post-American World, 2008; Martin Jacques, When China Rules the World: The End of the Western World and the Birth of a New World Order, 2009.
2 George Friedman, The Next 100 Years: A Forecast for the 21st Century, 2009; Edward Chancellor, “China’s Red Flags,” GMO Whitepaper, March 2010; Martin Wolf, “Wen is Right to Worry About China’s Growth,” 21 September 2010.
7
Scenario planning provides a means for analyzing and addressing divergent strategic assumptions. It helps define multiple perspectives, and offers a method to work with and plan for various outcomes. The three scenarios identified in The decade ahead were meant to be more illustrative than definitive, but also captured many key issues (see sidebar “Scenario planning: Why three?”).
Scenario one: TransitionIn this scenario, economic growth shifts from West to East, and energy efficiency is emphasized—not because of concerns over climate change, but rather because of fears that oil production has peaked. In the West, inconsistent government policies fail to promote economic stability, and boom-and-bust cycles persist throughout the decade. For workers, the volatility causes uncertainty about job security, career alternatives, and whether their pay will stay ahead of the cost of living. Developing nations manage growth and boost employment, and they decouple from the West in favor of a China-centered bloc. When this happens, Western companies are deprived of attractive markets and placed at a disadvantage when competing for talent. This scenario best reflects the path of the chemical industry from 2006 to 2010.
Scenario two: DislocationDislocation involves a slowdown in both developed and developing economies. Unemployment remains high for several years in developed nations, with many workers losing their skills due to prolonged periods out-of-the-job market. The developing world suffers when demand for its exports declines. In Asia and the Middle East — where energy prices are depressed due to the fast rise of shale gas production — millions see their chance to enter the middle class slipping away, leading to social and political unrest. In response, political leaders could very well seek to deflect discontent by focusing on international disputes and confrontations. United States and other Western employers attract top talent from the developing world due to reduced opportunities at home, although restrictive immigration rules associated with protectionism inhibit cross-border labor mobility. The negative impact of this scenario could reveal just how dependent the chemical industry has become on the growth of developing economies, with potentially traumatic results.
Three possibilities
Scenario-planning: Why three?Scenario-based planning is very much an art rather than a science. There are strong views on both sides about methodology. The exception, however, is the number of scenarios to be analyzed; there is agreement that two to five is the most appropriate and manageable range. As part of Deloitte’s research, three scenarios were chosen to best capture key issues and possibilities, but it must be noted that they are meant to be illustrative and not definitive. To that end, how companies define what’s important to them and their strategic vision should influence how they develop scenarios.
The economy-regulation-technology triad underpinning the scenarios emerged from the research showing that there is deep disagreement on these issues among equally well-qualified people. Stated simply, support for each of the components of each of the three scenarios can be found in business publications, academic and scientific journals, interest group websites, and think-tank reports in any given week. There is no magic in the three scenarios and, while they are valid, another company may have equally valid reasons based on its strategies and markets for focusing on other factors.
There are a number of methodologies that can be used to develop scenarios, such as using a process that determines which developments are merely novel and outside normal industry thinking, yet are still sufficiently plausible to include in scenarios versus what is too far outside the realm of credibility. Again, what one management team considers a stretch, others may consider plausible.
Regardless of how scenarios are determined, the question remains, “How would we win if we found ourselves in x, y, or z world?” At both the company-wide and business-unit levels, this question can be used to analyze strategies to see where they are not well-suited to dealing with certain aspects of a scenario. At that point it should be assessed what assets and capabilities are available should the marketplace move in the direction of one of the uncovered scenarios.
Source: DTTL’s Global Manufacturing Industry Group analysis.

The chemical multiverse 8
Scenario three: ResilienceAfter some turbulence at the beginning of the decade, this scenario has the world enjoying a period of moderate economic growth and low unemployment. Governments play a lead role in managing their economies and favor sectors that they deem important to national competitiveness. Central banks around the world coordinate their efforts and manage to keep inflation at bay. Likewise, political leaders craft compromises that maintain the flow of cross-border trade and investment, despite the strains that accompany the rise of new powers in the developing world. Also, green technology benefits from government policies that limit emissions and put a price on carbon.
The drastic, yet effective, changes made by many businesses in response to the recent financial crisis — which left several with a remarkable excess of cash on their balance sheets — is a contributing factor to this scenario. Nonetheless, these employers vie for people who are able to handle the challenges inherent in a market that is global, multidisciplinary, and highly competitive. There is also additional competition for some categories of talent from the public sector given its expanding role and significance.
The value of scenariosThese scenarios highlight the range of conditions that may lie on the horizon. Depending on which scenario the future most resembles, demand could be robust or weak, regulatory policy could be strict or lenient, markets abroad could be open or closed. Some scenarios call for energy and feedstock supplies to be tight, and others, abundant. The commercialization of new technologies could accelerate or languish, while sustainability could be a priority or an afterthought. And depending on which scenario comes to pass, the labor market could favor either employees or employers. Companies using scenarios such as these in their strategic planning would extend analysis beyond the macro level to explore the effects on particular products and geographic markets and thus on individual businesses.
After the events of the past decade, the benefits of this type of inquiry are apparent. The assumptions about marketplace dynamics undergirding strategic commitments should be balanced by an awareness of the alternative paths the future might take. Devoting attention to different scenarios — even some that seem unlikely or undesirable — can equip chemical companies with valuable insights and help them confirm decisions about where their capital should be spent and resources assigned. Just as important, scenario-based planning offers preparation for potential developments that might otherwise go unrecognized and unappreciated, but can turn out to be tomorrow’s opportunity or risk.
9
Do the traditional segments still apply?Sixty of the companies studied in The decade ahead failed to return the cost of capital over much, if not all, of the last decade. Conventional logic suggests that this underperformance should have led to more closings, bankruptcies, and break-up sales than in fact occurred. This lack of consequences raises the question of whether the traditional industry segments — commodity, integrated, and specialty — really apply anymore. Similarly, it brings under scrutiny how companies are evaluated by the industry and capital markets.
The decade ahead and this study both challenge these conventional methods of segmentation and highlights gaps in the accuracy of company classification. Is return on debt a better measure for some than for others? How can publicly traded companies be compared with state-controlled enterprises, especially from the investment perspective? What does it mean to have returns in excess of the cost of capital? How does the industry cycle come into play? Does profitability really matter in this reshaped global industry?
The limited consequences of underperformance over the past decade may not translate to the same stability in future years. The chemical industry may very well be facing a pivotal decade of accelerated shakeout. Early evidence can be found in substantial capacity imbalances, as well as the value erosion many companies are experiencing due to the challenging environment.
To better understand the industry’s future options and limitations, the DTTL Global Manufacturing Industry Group developed an in-depth analysis of the momentum of individual companies. A company’s “starting point,” or initial conditions entering the next decade, was established. By taking a broader look than traditional valuation measures allow, and extending the analysis to consider strategic elements related to segmentation, more can be gleaned about each company while simultaneously considering the following three industry issues:
Is it necessary to earn the cost of capital to survive in an •industry growing in the low single digits and undergoing a significant global shift?
What will be the impact of the recent rise of large, often •state-controlled, chemical entities that are driven more by national objectives (such as job creation) rather than the profit goals typical of Western companies?Does financial advantage over one’s competitors have •the same meaning in the global chemical industry as it does in other industries?
After looking at the 228 companies included in the Global Manufacturing Industry Group study, the analysis concluded that, absent a government subsidy, relative financial performance does matter for the vast majority of companies. And, while past performance may not predict future outcomes, it nevertheless allows a company to clearly see which options are really viable and then select the best of them.
The data show that the strongest players gained ground in the last decade and, as a result, are poised to gain further relative financial advantage in the decade ahead. For the many companies with a disadvantaged starting point, the outcome is not preordained, but the way forward may require significant changes to their current course.
Resolving the commodity versus specialty argumentAccording to many seasoned industry executives, the traditional chemical industry segments — commodity, integrated, and specialty — are not useful, especially when trying to assess the portfolio of a company with a mix of these segments (although the labels may still be useful at the business-unit level). Most companies today are not pure plays, but a collection of commodity and specialty businesses with some integration that can contribute more or less to the overall profitability and value of the company.
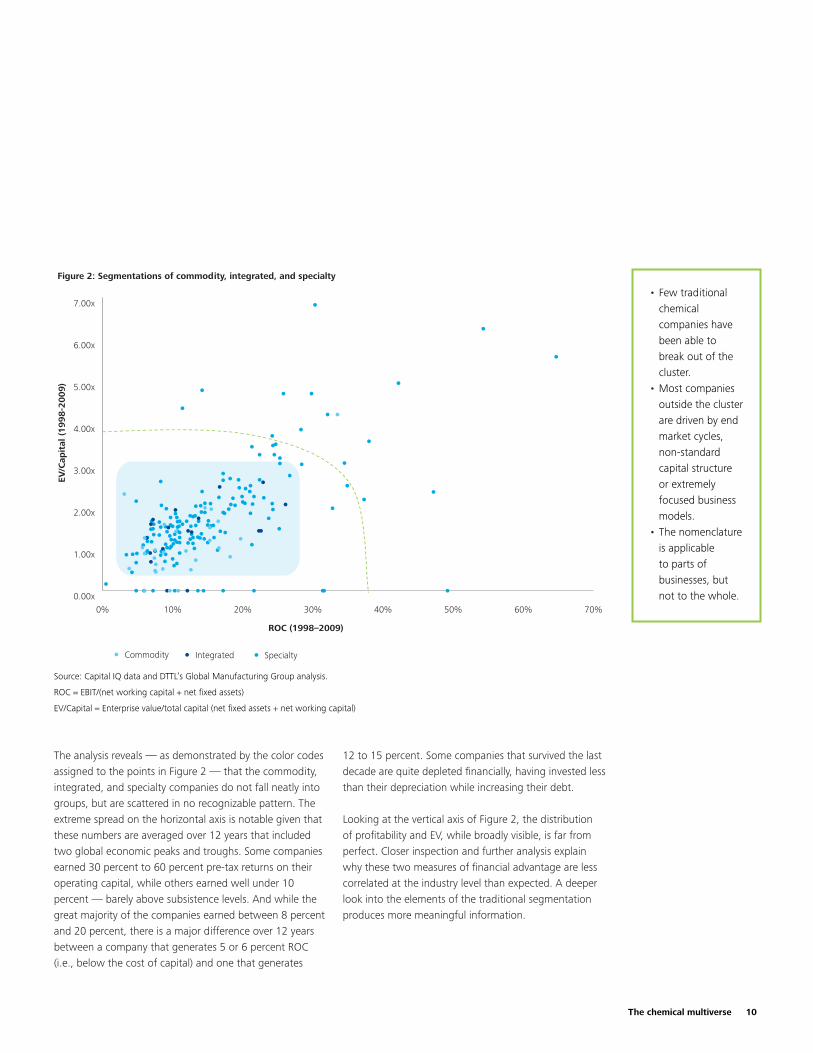
To test this point of view, two important measures were plotted — enterprise value (EV) and profitability — for each of the companies in the study over the 12-year period 1998–2009 (see Figure 2) due to the correlation between these parameters per unit of capital invested. In this case, a ratio of EV divided by operating capital employed (net working capital plus net fixed assets) was used as a proxy for value, and pre-tax operating return on capital (ROC) earnings before interest and taxes (EBIT) divided by operating capital was employed as a proxy for profitability.
Understanding the starting point
The chemical multiverse 10
The analysis reveals — as demonstrated by the color codes assigned to the points in Figure 2 — that the commodity, integrated, and specialty companies do not fall neatly into groups, but are scattered in no recognizable pattern. The extreme spread on the horizontal axis is notable given that these numbers are averaged over 12 years that included two global economic peaks and troughs. Some companies earned 30 percent to 60 percent pre-tax returns on their operating capital, while others earned well under 10 percent — barely above subsistence levels. And while the great majority of the companies earned between 8 percent and 20 percent, there is a major difference over 12 years between a company that generates 5 or 6 percent ROC (i.e., below the cost of capital) and one that generates
12 to 15 percent. Some companies that survived the last decade are quite depleted financially, having invested less than their depreciation while increasing their debt.
Looking at the vertical axis of Figure 2, the distribution of profitability and EV, while broadly visible, is far from perfect. Closer inspection and further analysis explain why these two measures of financial advantage are less correlated at the industry level than expected. A deeper look into the elements of the traditional segmentation produces more meaningful information.
Figure 2: Segmentations of commodity, integrated, and specialty
Commodity Integrated Specialty
0% 10% 20% 30% 40% 50% 60% 70%0.00x
1.00x
2.00x
3.00x
4.00x
5.00x
6.00x
7.00x
ROC (1998–2009)
EV/C
apit
al (
1998-2
009)
Source: Capital IQ data and DTTL’s Global Manufacturing Group analysis.
ROC = EBIT/(net working capital + net fixed assets)
EV/Capital = Enterprise value/total capital (net fixed assets + net working capital)
Few traditional •chemical companies have been able to break out of the cluster.Most companies •outside the cluster are driven by end market cycles, non-standard capital structure or extremely focused business models.The nomenclature •is applicable to parts of businesses, but not to the whole.
11
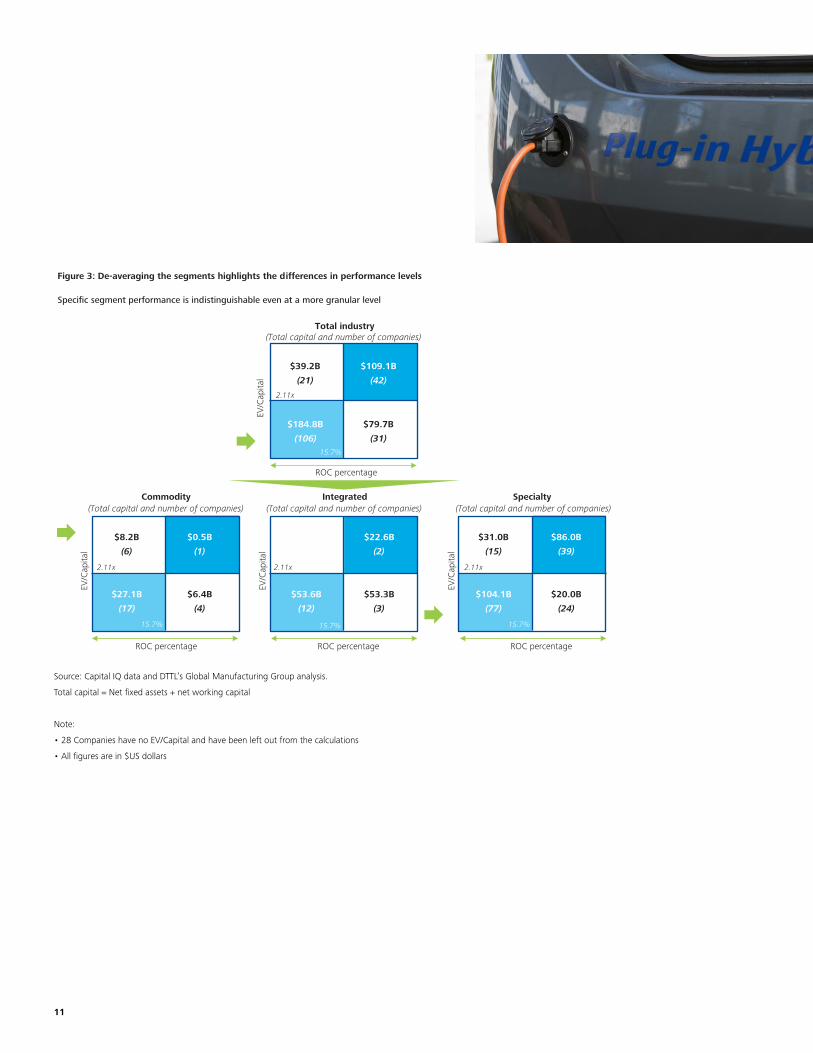
Figure 3: De-averaging the segments highlights the differences in performance levels
Specific segment performance is indistinguishable even at a more granular level
ROC percentage
ROC percentage ROC percentage ROC percentage
Total industry(Total capital and number of companies)
Integrated(Total capital and number of companies)
Commodity(Total capital and number of companies)
Specialty(Total capital and number of companies)
15.7%
2.11x
15.7%
2.11x
15.7%
2.11x
15.7%
2.11x
$8.2B
(6)
$27.1B
(17)
$0.5B
(1)
$6.4B
(4)
$53.6B
(12)
$22.6B
(2)
$53.3B
(3)
$31.0B
(15)
$104.1B
(77)
$86.0B
(39)
$20.0B
(24)
$39.2B
(21)
$184.8B
(106)
$109.1B
(42)
$79.7B
(31)
EV/C
apita
l
EV/C
apita
l
EV/C
apita
l
EV/C
apita
l
Source: Capital IQ data and DTTL’s Global Manufacturing Group analysis.
Total capital = Net fixed assets + net working capital
Note:
•28CompanieshavenoEV/Capitalandhavebeenleftoutfromthecalculations
•Allfiguresarein$USdollars

The chemical multiverse 12
The diagrams in Figure 3 are all similarly defined. On the vertical axis, the midpoint of the average ratio of EV to operating capital across the entire industry over 12 years is 2.11. This means that for every unit of capital invested, stock markets paid 2.11 times that amount in EV. On the horizontal axis, the average operating ROC across the entire industry over 12 years is 15.7 percent, comfortably above the cost of capital in these low-inflation years.
In Figure 3, the diagram for Total industry shows average operatingcapitaloverthelast12yearswasUS$413.32billion. Classical value theory would predict that most of the companies would be found in the low-return/low-value (lower left) or high-return/high-value (upper right) quadrants. Indeed, 44 percent of the industry’s capital is indeed found in the low-return/low-value portion (lower left) of the chart and 27 percent is in the high-return/high-value (upper right) quadrant. However, 10 percent of the capital is found in the high-value/low-return (upper left) quadrant and 19 percent in the low-value/high-return (lower right) quadrant. Thus while 71 percent of the capital is valued as predicted, 29 percent is not — a fact that drove further analysis to explain these outliers.
One reason could be the stock markets these outliers are listed on. The majority of the outlying group is traded on small or illiquid markets, while majority of the predictable group (i.e., upper right and lower left) trades on large liquid markets, like those in the United States and the United Kingdom.
For the commodity, integrated, and specialty segments, the largest capital concentration is in the lower left box in each of the three diagrams (low return and low value). Perhaps even more notable is that the so-called specialty companies have 56 percent of their capital in the two low-return quadrants, versus 54 percent for the entire industry. This finding is especially surprising since many companies across the industry have announced acquisitions or acquisition strategies to increase their mix of specialty business.
Approach to starting point analysis Deloitte weighted various financial and operational metrics to analyze a company’s starting point in the industry. The approach is based on two measures: availability of financial resources and quality of business. Each measure comprises multiple factors, as detailed below:
Availability of financial resources A score based on the following:
Cash on hand: Cash and marketable securities based on balance sheet as of 31 •December 2009Cash flow from operations (F2009 year-end): Operating cash flow •Unlevered free cash flow (FCF) (F2009 year-end): EBIT – tax – capital expenditure + •depreciation – net working capital Interest coverage ratio (F2007–F2009 year-end): EBIT/interest expense •EBIT/depreciation (F2009 year-end)•EV – debt (F2009 year-end)•
Quality of business A score based on the sum of the following:
R&D spend as a percentage of revenue (1998–2009)•Cash returns (1998–2009): Net income + depreciation and amortization + dividends – •capital expenditure/gross total capital (0.5 x gross fixed assets + net working capital)Return on assets (1998–2009): Net income/total equity •Earnings before interest, taxes, depreciation, and amortization (EBITDA) growth •(2006–2009)Pre-tax return on capital (1998–2009): EBIT/total capital (net fixed assets + net •working capital)Execution effectiveness: Qualitative score of execution based on historical •performance
Scoring for each of these metrics is based on thresholds using appropriate statistical methods. In cases where there was significant correlation, a linear line fit was used to calculate scores. In cases where the correlation was weak, thresholds were set based on a normal curve fit using a step function scoring system.
Other financial metrics used in the analysis include:Net working capital: Current assets (less of cash and marketable securities) – current •liabilities (less of current debt and capital lease obligations)Net fixed assets: Net property, plant, and equipment (PP&E) charge•Gross fixed assets: Gross PP&E charge•Investment potential: 3 times EBITDA – net debt – 0.5 x gross PP&E + net PP&E•Net debt: Total debt – cash and marketable securities•EV/capital: Enterprise value/total capital (net fixed assets + net working capital)•
Source: DTTL’s Global Manufacturing Industry Group analysis.

13
An alternative to the traditional segmentsWith traditional segmentation proving to be inadequate, a new way of analyzing or assessing companies in the industry is needed to understand challenges to performance. Five new and distinct categories for the industry were developed using a proprietary and comprehensive analysis that weighs a company’s current financial capability to act (availability of financial resources) and then plots it against its weighted financial performance over the past 12 years (quality of business). Combined, they represent a company’s relative financial advantage (see sidebar “Approach to starting point analysis”).
Availability of financial resources captures those resources that are static and can only be spent once, such as a company’s cash, pre-paid assets, or unused debt capacity. The quality of business is determined by weighing profitability parameters and growth parameters along with a multi-factor assessment of a company’s execution capability. Profitability parameters are cash profitability, return on assets, and operating ROC, while growth parameters are EBITDA and R&D spending that helps sustain it. Although execution capability was weighted at just 15 percent, companies with higher levels of execution skill are more likely to sustain relative financial advantage.
Classification based on this analysis better identifies a company’s current position within the industry and provides insight into both its future options and the implicit strategic actions it may need to take. The resulting five categories are deep pockets, strategic leaders, limited options, middle ground, and strong options. The diagrams in Figures 4 and 5 show these categories and how companies currently fit into them.
Strategic leaders
Quality of business
Limited options Strong options
Ava
ilab
ility
of
finan
cial
res
ourc
es
Low High
High
Deep pockets
Middleground
Strategic leaders
Quality of business
Limitedoptions
Strategic leaders
Strong options
Ava
ilab
ility
of
finan
cial
res
ourc
es
Deep pockets
Middleground
2 3 4 51
2
3
4
5
Figure 4: New categorizations
Figure 5: Global chemical companies plotted on the new categorization grid
Source: DTTL’s Global Manufacturing Industry Group analysis.
Source: Capital IQ data and DTTL’s Global Manufacturing Group analysis. Note: Analysis based on DTTL’s Global Manufacturing Industry Group index definitions for availability of strategic options.
The chemical multiverse 14
Deep pocketsThese entities can be state-owned companies and companies with strong geopolitical interests that are not constrained by the same financial comparisons as public chemical companies. Alternatively, they may be part of a larger entity, like an oil or agriculture company, that carries significant weight on its own; such chemical businesses do not publish financial statements independent from those of their parent company. These companies can affect the industry simply by hedging their bets or establishing footholds consistent with their scale. With their access to large amounts of cash and their strong balance sheets, they can also venture and partner relatively easily, invest in long-term emerging technology, and accept long lead-time programs. Capacity utilization is not an immediate priority for this group. They can generally afford to simply build what they need, when they choose. This ease of movement allows for large, nonlinear moves — the source of this group’s disruptive nature.
While the human capital at companies in the deep pockets space is usually highly proficient in operations, it can be less skilled in serving the broad range of end markets of the chemical industry. The deep pockets company also tends to be opportunistic and infrequently innovative. But, in reality, the only real constraints for companies in this group are the need to maintain alignment with their government and to present a consistent story about the company to stakeholders.
Strategic leadersWhile strategic leaders have scale and money, they also tend to have mature, legacy assets to maintain. They are expected to continue to lead and produce returns and growth commensurate with their leadership status. By generating ongoing large amounts of FCF flow, strategic leaders have the ability to fund many of their own programs and have sufficient access to capital markets to meet a broad array of other needs.
Most importantly, these strategic leaders have an abundance of choices to either strengthen their core competencies or remake themselves and thus play an important role in reshaping the global chemical industry as a whole. They can deepen their presence in any geography and move into adjacent markets. They can change their core businesses over time to maintain their growth trajectories, as well as venture and partner relatively easily. Those with cash flow advantages will also be able to sustain and invest in longer-term solutions and emerging technologies.
Being a leader also has its challenges. As high-profile and often publicly owned companies, these leaders may find every choice scrutinized. They have more responsibility to a greater variety of stakeholders and could have particularly demanding shareholders. They also have environmental and safety responsibilities and are pressured to produce the best global operating standards. Quite often, as long-time players in the industry, these giants find themselves with cumbersome capital structures, aging plants, legacy benefit obligations, and a dearth of profitable growth options. In the last decade, however, many of these leaders met their challenges and improved their positions.

15
Limited optionsWith very limited cash to work with, below-average profitability, and high leverage, limited options companies have very little freedom. They cannot afford to stand still, but must make hard decisions if they want to survive. Not only are they subject to the same pressures as the rest of the industry, they are also contending with a potentially disadvantaged starting point. For those that are publicly traded, the difficult road ahead includes structural changes, addressing negative value, and coping with constrained capital (if they are going to win back the confidence of shareholders). For some, avoiding bankruptcy could be a real challenge.
Not surprisingly, limited options entities may also be reaching the end of their capacity to borrow, particularly at affordable rates. They may also have a difficult time attracting and retaining top talent. Retrenching could involve withdrawal from markets and regions where these players cannot earn acceptable returns, and they may be forced to forgo expansion until returns improve. It is also critical that they consider monetizing the company as much as possible while it still has value, especially if the alternative is bankruptcy. However, monetizing efforts could well be constrained by mature or uncompetitive businesses, burdensome environmental liabilities, benefit obligations, poor cash-generating ability, and excessive debt levels. These realities will also curtail the ability of companies in this group to pursue potential opportunities.
Middle groundThis category is home to those companies that are poised to either move over into the strong options group or descend into the limited options category. Doing nothing is an unacceptable alternative for most of these entities because inaction will cause further decline. As they aggressively pursue the finite moves they still have left, they will need as much knowledge as they can develop and as much hustle as they can muster. This involves attacking negative value, focusing on what they can do well and profitably, and using the scarce capital available to them extremely wisely. Momentum will be key, and the sooner they act on their strategies the better.
Strong optionsThe diverse companies in the strong options category are selectively focused on market spaces where they can compete and win. The strongest players lead their industry segments and produce outsized returns. They typically reward shareholders by maintaining higher and more profitable growth rates than industry peers. Except for major acquisitions, these companies are generally capable of funding their deals with existing reserves, but their targets may be limited by their narrower market focus.
Their human capital needs are also quite specific (focusing on key skill sets, such as technical sales) and their business models can be quite differentiated. Their focus usually yields a strong, internally developed company culture. This culture can become a stumbling block when new and advanced capabilities need to be added, such as when strategies call for acquisitions in adjacent markets or operating in new ways or with new people.
In terms of choices, most strong options companies have the ability to enter any geographic market that needs their solutions and will pay for performance. It may be harder, however, to move into adjacent markets for the cultural reasons cited above and due to concerns about diversification diluting their performance and business focus. Although this category of companies has recently demonstrated that they can sustain their profit growth when growth slows, challenges may arise as significant business model changes become necessary. Most, if not all, of the companies occupying this space are publicly owned, and the performance, as well as the simplicity and focus, of many businesses in the group has made them attractive to shareholders. Executive teams in this group will rightly be very focused on what to do next and to be honest with themselves about their ability to expand beyond their core and to sustain historical growth rates.
The chemical multiverse 16
Who has options?Once executives of individual companies acknowledge their starting points, the strategic paths and choices open to them will become clearer. Since not all options will be available to all companies, management can focus on developing and implementing successful plans without wasting time and scarce resources on dead ends.
When profiling the group averages within the whole industry, the magnitude of the distinction between categories becomes even more evident. But while the category averages are helpful in clarifying the relative size of the defined groups, they provide only partial insight. A more granular analysis of the companies within each group reveals that “de-averaged” patterns also support the significance of the starting point for company strategies over the next decade. Comparisons are made using a 12-year view of the data, encompassing two cycles that incorporate the numerous ups and downs of these years, and thus allow for a long-term understanding of each group’s circumstances.
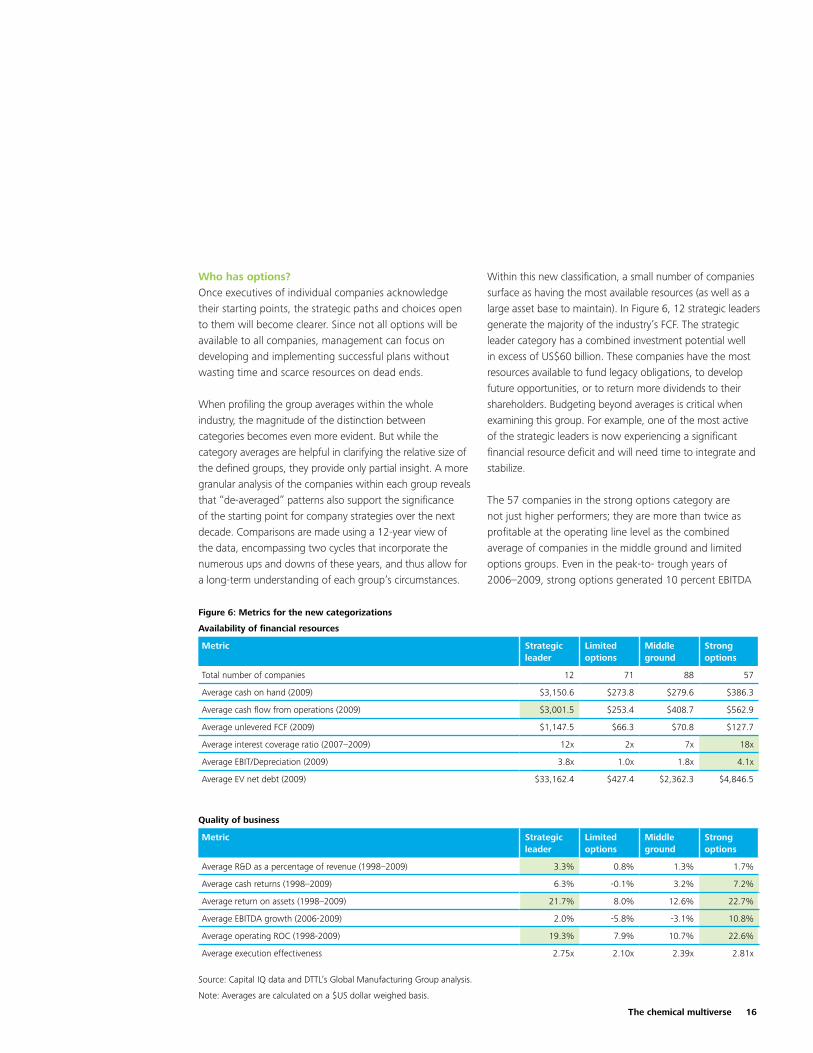
Within this new classification, a small number of companies surface as having the most available resources (as well as a large asset base to maintain). In Figure 6, 12 strategic leaders generate the majority of the industry’s FCF. The strategic leader category has a combined investment potential well inexcessofUS$60billion.Thesecompanieshavethemostresources available to fund legacy obligations, to develop future opportunities, or to return more dividends to their shareholders. Budgeting beyond averages is critical when examining this group. For example, one of the most active of the strategic leaders is now experiencing a significant financial resource deficit and will need time to integrate and stabilize.
The 57 companies in the strong options category are not just higher performers; they are more than twice as profitable at the operating line level as the combined average of companies in the middle ground and limited options groups. Even in the peak-to- trough years of 2006–2009, strong options generated 10 percent EBITDA
Availability of financial resources
Metric Strategic leader
Limited options
Middle ground
Strong options
Total number of companies 12 71 88 57
Average cash on hand (2009) $3,150.6 $273.8 $279.6 $386.3
Average cash flow from operations (2009) $3,001.5 $253.4 $408.7 $562.9
Average unlevered FCF (2009) $1,147.5 $66.3 $70.8 $127.7
Average interest coverage ratio (2007–2009) 12x 2x 7x 18x
Average EBIT/Depreciation (2009) 3.8x 1.0x 1.8x 4.1x
Average EV net debt (2009) $33,162.4 $427.4 $2,362.3 $4,846.5
Quality of business
Metric Strategic leader
Limited options
Middle ground
Strong options
Average R&D as a percentage of revenue (1998–2009) 3.3% 0.8% 1.3% 1.7%
Average cash returns (1998–2009) 6.3% -0.1% 3.2% 7.2%
Average return on assets (1998–2009) 21.7% 8.0% 12.6% 22.7%
Average EBITDA growth (2006-2009) 2.0% -5.8% -3.1% 10.8%
Average operating ROC (1998-2009) 19.3% 7.9% 10.7% 22.6%
Average execution effectiveness 2.75x 2.10x 2.39x 2.81x
Source: Capital IQ data and DTTL’s Global Manufacturing Group analysis.
Note:Averagesarecalculatedona$USdollarweighedbasis.
Figure 6: Metrics for the new categorizations
17
growth while middle ground and limited options were experiencing declining growth. And with the unused debt capacity implied by interest coverage of 18 times its current interest costs, the strong options group has large reserves of available resources.
Strong options companies should remain strong performers despite the stress of the recession. Although a few companies in this group have lost ground on ROC, hampered by a few high-return companies with low investment potential, the overall picture is healthy. However, any sense of business as usual for these powerful companies should be moderated by the significant resources of the large-cap strategic leaders — a group that will likely rely on acquisitions to maintain momentum and shape its portfolio. Companies in the strong options group, therefore need to maintain their momentum.
With scarcity of capital a major issue for nearly all companies, strategic leaders and strong options companies — whose shares trade, by and large, at a premium to their peers — will be pressured to provide continual value-contributing investments and core improvements for shareholders. There also could be pressure on some strong options companies to sell to strategic leaders before they lose steam and end up with reduced access to the capital they need to grow.
The 88 companies in the middle ground group are materially better off than those in the limited options group. Middle ground’s interest coverage of debt is three times higher than that of limited options companies, and their cash return is high enough to finance some growth, albeit just barely. Although a few have improved their position, the majority of middle ground companies are suffering from lower ROC and one-third have no current resources to fund repositioning. Given the large number of companies, this group seems weaker than the averages indicate.
The limited option companies, as suggested in Figure 6, are disadvantaged even when compared with the middle ground group, which is facing challenges itself, and particularly when compared with the strong options group. The data emphasizes a pattern in which the 71 limited option companies can just barely cover their interest costs, have as much depreciation as EBIT, and have negative long-term cash profitability. Some in this group face severe deficits that may require external resources and potential reorganization to reposition themselves. This group represents 30 percent of the companies studied, yet it represented just 3 percent of the market capitalization of the industry in 2009.
But limited option companies are not as disadvantaged today as the 12-year view might suggest. Several companies appear to have substantial reserves to fund restructuring or make value-accretive acquisitions. Like the majority of entities in the middle ground category, limited options companies need to generate sufficient cash flow to maintain operations and reduce debt.
Based on this analysis, many companies will need to drive change not only to achieve or maintain success but also to avoid slipping into a less valuable position. Companies with restricted resources and strategic options to grow also need to develop value-improving strategies. It is also possible that actions taken by some global chemical companies could be significant enough to ripple across, and even renew, the entire industry. However, all of these expected changes will be a function of the way each company deals with its own starting point.

The chemical multiverse 18
Assessing momentumWhen examining how companies have performed over time in order to develop a sense of their momentum, the findings reveal a tale of two cycles. Of the 228 companies, 180 increased their operating ROC in the 2004–2009 cycle from the 1998–2003 cycle. Some companies made very strong improvements, as the industry as a whole raised the bar between 2004 and 2009, with an average ROC of 19 percent, compared with a 13 percent average ROC in 1998–2003 (see Figure 7).
The fact that 75 percent of the companies improved their average profitability during a period that included the “great recession” is consistent with results across many other industries. The chemical industry’s 46 percent increase in profitability in the last six years seems surprising. However, interviews conducted
for the study suggest that these changes were purposeful, as chemical companies made improving ROC a priority in recent years. The remaining companies have seen their profitability decrease, and their momentum appears to be slowing.
Of course, this more dynamic picture raises a question: how many companies have current levels of profitability or access to financing in line with their multi-cycle, 12-year categorization? To address this question, the study focused on two measures: the availability of financial resources and quality of business.
The proxy for the availability of financial resources is based on two factors. For each of the 228 companies, unused debt capacity was calculated, assuming a debt-to-EBITDA ratio of three times. Then a measure that captures the condition of their fixed capital base was added or
Figure 7: ROC improvement since the last decade
0% 10% 20% 30% 40% 50% 60%0%
10%
20%
30%
40%
50%
Strong optionsStrategic leader Middle groundLimited options
ROC (2004–2009)
RO
C (
1998–2
003)
Average ROC 19%
Average ROC 13%
Positivemomentum
Negativemomentum
Source: Capital IQ data and DTTL’s Global Manufacturing Group analysis.
ROC = Earnings before taxes and interest (EBIT)/(net working capital + net fixed assets)
Over the past 10 years, the ROC improved for 75 percent (or 180) of the global chemical companies, indicating a positive momentum.
19
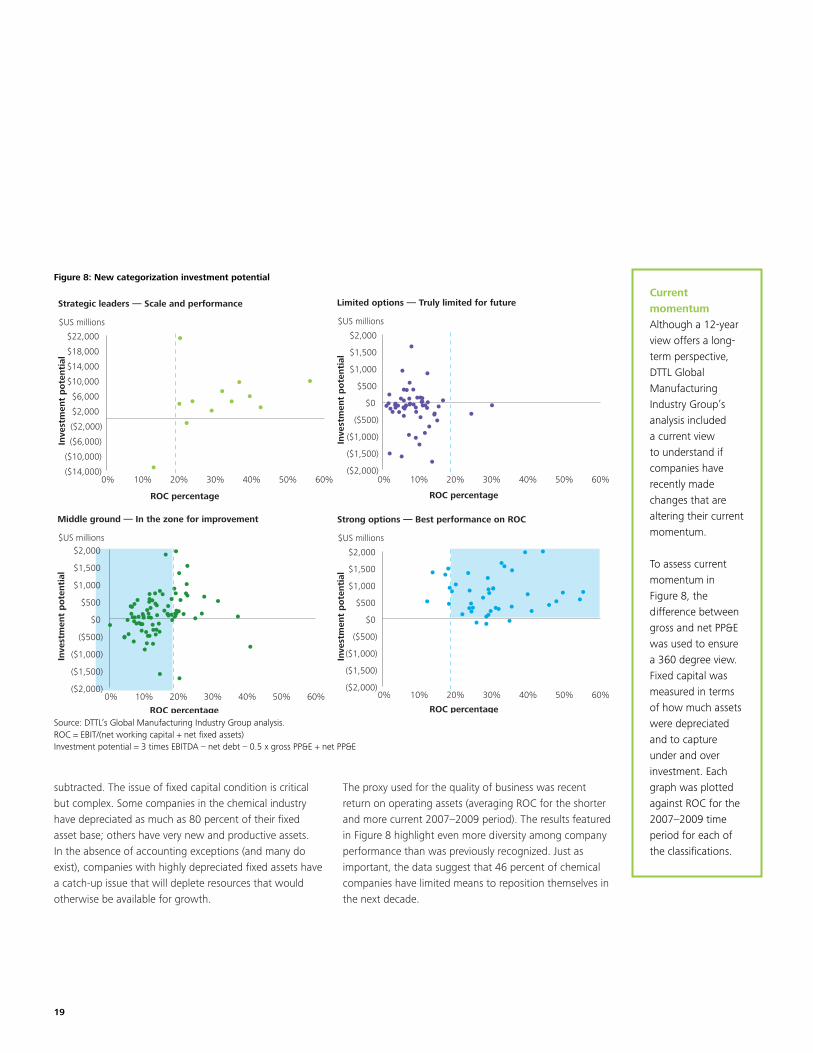
subtracted. The issue of fixed capital condition is critical but complex. Some companies in the chemical industry have depreciated as much as 80 percent of their fixed asset base; others have very new and productive assets. In the absence of accounting exceptions (and many do exist), companies with highly depreciated fixed assets have a catch-up issue that will deplete resources that would otherwise be available for growth.
The proxy used for the quality of business was recent return on operating assets (averaging ROC for the shorter and more current 2007–2009 period). The results featured in Figure 8 highlight even more diversity among company performance than was previously recognized. Just as important, the data suggest that 46 percent of chemical companies have limited means to reposition themselves in the next decade.
Limited options — Truly limited for future
ROC percentage
Inve
stm
ent
po
tenti
al
0% 10% 20% 30% 40% 50% 60%($2,000)
($1,500)
($1,000)
($500)
$0
$500
$1,000
$1,500
$2,000
$US millions
Strong options — Best performance on ROC
ROC percentage
Inve
stm
ent
po
tenti
al
0% 10% 20% 30% 40% 50% 60%($2,000)
($1,500)
($1,000)
($500)
$0
$500
$1,000
$1,500
$2,000
$US millions
Strategic leaders — Scale and performance
ROC percentage
Inve
stm
ent
po
tenti
al
0% 10% 20% 30% 40% 50% 60%($14,000)
($10,000)
($6,000)
($2,000)
$2,000
$6,000
$10,000
$14,000
$18,000
$22,000
$US millions
Middle ground — In the zone for improvement
ROC percentage
Inve
stm
ent
po
tenti
al
$US millions
0% 10% 20% 30% 40% 50% 60%($2,000)
($1,500)
($1,000)
($500)
$0
$500
$1,000
$1,500
$2,000
Figure 8: New categorization investment potential
Current momentumAlthough a 12-year view offers a long- term perspective, DTTL Global Manufacturing Industry Group’s analysis included a current view to understand if companies have recently made changes that are altering their current momentum.
To assess current momentum in Figure 8, the difference between gross and net PP&E was used to ensure a 360 degree view. Fixed capital was measured in terms of how much assets were depreciated and to capture under and over investment. Each graph was plotted against ROC for the 2007–2009 time period for each of the classifications.
Source: DTTL’s Global Manufacturing Industry Group analysis.ROC = EBIT/(net working capital + net fixed assets)Investment potential = 3 times EBITDA – net debt – 0.5 x gross PP&E + net PP&E
The chemical multiverse 20
Overall, the analysis above demonstrates that challenges exist for all players regardless of which new category they occupy. These categories, however, provide deeper insight into which companies have momentum, which are most at risk, and which have the most or the fewest options over the next decade.
Yet the starting point is just that — a place to start. Where a company goes next can very well lead to the next success story. Success will largely depend on execution, the choices made, as well as how and where companies take advantage of and target opportunities in their value chains. By choosing wisely and capitalizing on opportunities, companies can create footholds for future growth while developing and implementing plans using drivers of strategic change.
In the past decade, a few companies have improved both profitability and growth. What do these successful stories have in common? These companies trusted the facts, did their homework, and acted decisively. The rewards for their efforts go beyond profits. By reacting to prevailing conditions with structural change and better use of existing technologies, these companies also captured an advantage for a future that is being increasingly characterized by the emergence of certain megatrends.
Megatrends — such as an increased focus on sustainability or the rise of the middle class in China and India — are the forces that are going to drive changes in the chemical industry in the near future. Some have been incubating for two or three decades. Others are more recent. But the next ten years are likely to determine which of them will remain lastingly significant and which will fade into historical obscurity.
The companies that will enjoy the most success over the next decade will be those that not only identify the durable megatrends but understand their current position well enough to align their growth strategies to the most appropriate trend for their company. Successful companies must design and execute a strategy that will not only take advantage of the opportunity, but that is also flexible enough to adjust to changes in conditions, prospects, or thinking. Predictions always entail an element of risk; being wrong about the future is understandable, but not forgivable unless contingency strategies are built into the original strategy.
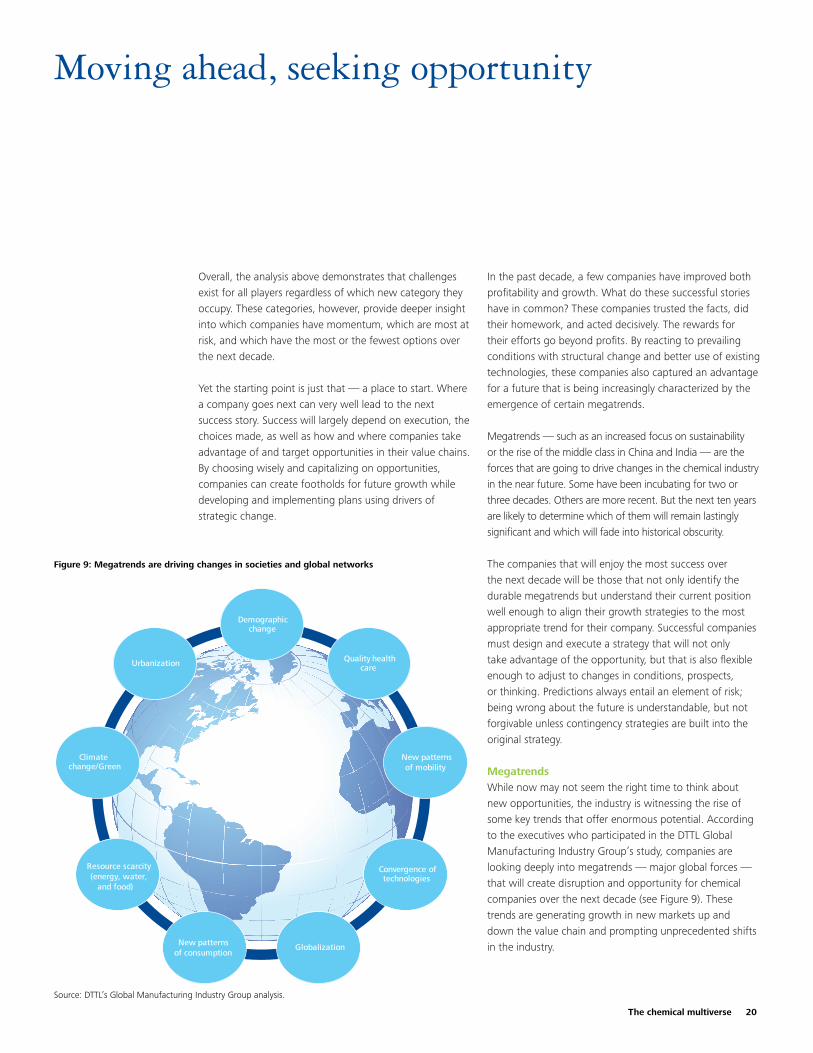
MegatrendsWhile now may not seem the right time to think about new opportunities, the industry is witnessing the rise of some key trends that offer enormous potential. According to the executives who participated in the DTTL Global Manufacturing Industry Group’s study, companies are looking deeply into megatrends — major global forces — that will create disruption and opportunity for chemical companies over the next decade (see Figure 9). These trends are generating growth in new markets up and down the value chain and prompting unprecedented shifts in the industry.
Moving ahead, seeking opportunity
Demographic change
Quality health care
New patternsof mobility
Convergence of technologies
GlobalizationNew patterns of consumption
Resource scarcity(energy, water,
and food)
Climate change/Green
Urbanization
Figure 9: Megatrends are driving changes in societies and global networks
Source: DTTL’s Global Manufacturing Industry Group analysis.
21
The Global Manufacturing Industry Group’s study identified major market trends and their macroeconomic impact, concentrating on those that the chemical industry has particular exposure to and those that have potential to reshape marketplaces. The megatrends that will have the most significant impact are:
Demographic change•Quality health care•New patterns of mobility•Convergence of technologies•Globalization•New patterns of consumption•Resource scarcity (energy, water, and food)•Climate change/green•Urbanization•
These trends are already having an impact on patterns in demand and will play a greater role in determining demand for new materials. They are driving new developments
in technology and influencing changes to standards and regulations. Most importantly, they will shape how a company identifies and pursues its options.
But while these trends could drive real growth, they also have the potential to be enormously disruptive — for good or for bad. A key part of planning involves assessment of both opportunities and risks. Each company will need to assess, at a granular level, the impacts on its products and markets.
The DTTL Global Manufacturing Industry Group’s research saw evidence of this assessment process in several chemical companies, including many of the last decade’s leaders in structural change and repositioning. Their early experiences, combined with the growing number of government policies focusing on economic investment, provide some insights into how and where chemical companies might select a trend or combination of trends to drive growth. The Global Manufacturing Industry Group also saw evidence of companies influencing government to set standards and regulations, which is another option to consider.
Uncertainty and the industry’s strategic driversExecutives who took part in the study confirmed the unchanged importance of certain factors. These are identified by the DTTL Global Manufacturing Industry Group and confirmed in the study as a set of especially relevant strategic drivers for the industry in the next decade (see sidebar “Strategic drivers at-a-glance”).
There was also strong agreement that, as companies assemble their strategies, they need to address gaps in five capabilities representing pieces of future solutions:
World-class marketing strategy and execution to 1. capture value and detect when it migrates to other parts of the value chain Global business management2. Open-source innovation and execution, and 3. collaborative problem-solvingSerial acquisitions and integration 4. Step-change improvement in financial discipline5.
Closing these capability gaps for most companies is critically important and will enable top performance along
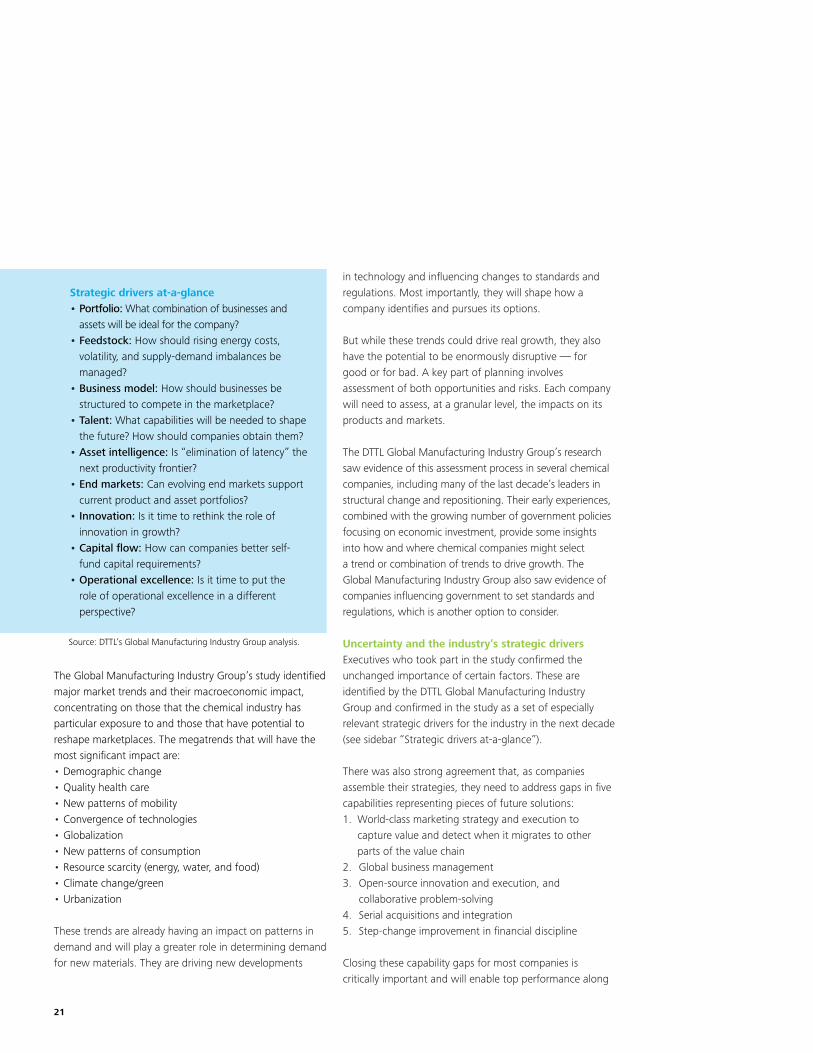
Strategic drivers at-a-glancePortfolio:• What combination of businesses and assets will be ideal for the company?Feedstock:• How should rising energy costs, volatility, and supply-demand imbalances be managed?Business model: • How should businesses be structured to compete in the marketplace?Talent:• What capabilities will be needed to shape the future? How should companies obtain them?Asset intelligence:• Is “elimination of latency” the next productivity frontier? End markets: • Can evolving end markets support current product and asset portfolios?Innovation:• Is it time to rethink the role of innovation in growth?Capital flow: • How can companies better self-fund capital requirements?Operational excellence: • Is it time to put the role of operational excellence in a different perspective?
Source: DTTL’s Global Manufacturing Industry Group analysis.
The chemical multiverse 22
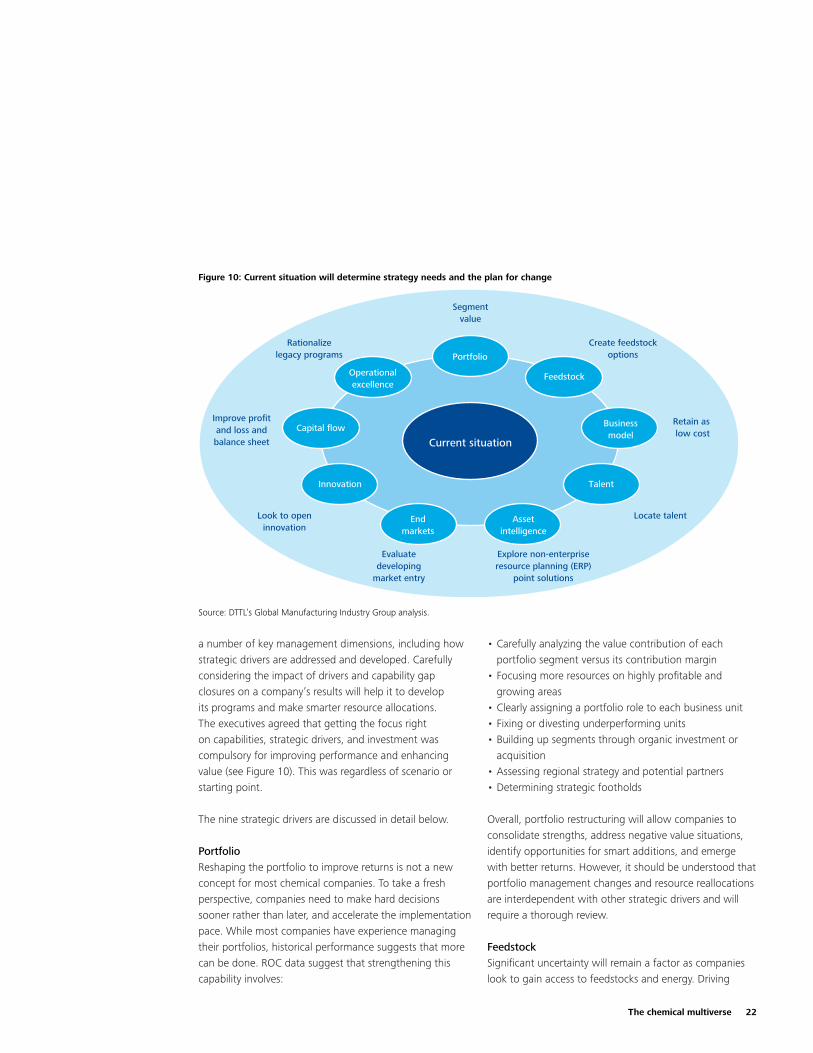
a number of key management dimensions, including how strategic drivers are addressed and developed. Carefully considering the impact of drivers and capability gap closures on a company’s results will help it to develop its programs and make smarter resource allocations. The executives agreed that getting the focus right on capabilities, strategic drivers, and investment was compulsory for improving performance and enhancing value (see Figure 10). This was regardless of scenario or starting point.
The nine strategic drivers are discussed in detail below.
Portfolio Reshaping the portfolio to improve returns is not a new concept for most chemical companies. To take a fresh perspective, companies need to make hard decisions sooner rather than later, and accelerate the implementation pace. While most companies have experience managing their portfolios, historical performance suggests that more can be done. ROC data suggest that strengthening this capability involves:
Carefully analyzing the value contribution of each •portfolio segment versus its contribution margin Focusing more resources on highly profitable and •growing areasClearly assigning a portfolio role to each business unit•Fixing or divesting underperforming units•Building up segments through organic investment or •acquisitionAssessing regional strategy and potential partners•Determining strategic footholds •
Overall, portfolio restructuring will allow companies to consolidate strengths, address negative value situations, identify opportunities for smart additions, and emerge with better returns. However, it should be understood that portfolio management changes and resource reallocations are interdependent with other strategic drivers and will require a thorough review.
FeedstockSignificant uncertainty will remain a factor as companies look to gain access to feedstocks and energy. Driving
Portfolio
Current situation
Feedstock
Businessmodel
Talent
Assetintelligence
Endmarkets
Innovation
Capital flow
Operationalexcellence
Segmentvalue
Create feedstockoptions
Retain as low cost
Locate talent
Explore non-enterpriseresource planning (ERP)
point solutions
Evaluatedeveloping
market entry
Look to openinnovation
Improve profitand loss andbalance sheet
Rationalizelegacy programs
Figure 10: Current situation will determine strategy needs and the plan for change
Source: DTTL’s Global Manufacturing Industry Group analysis.

23
this uncertainty is a confluence of issues that are both controllable and uncontrollable, including:
Decoupling of crude and gas prices. • AnalmostUS$10spread (per million British thermal units) between gas and crude oil creates favorable ethylene economics and places stress on other chains, such as aromatics.Significant capacity buildup.• Potentially closer to demand in the East, capacity buildup may force major Western producers and their capacities further to the right on supply curves, with a resulting worldwide impact on the economics of complexes and downstream assets. Global disparity in dealing with energy security •issues. Solutions range from adding more ethanol into the gasoline pool in the United States, to supporting the development of electric vehicles in China.Increased focus on carbon footprints. • Such a focus can lead to consideration of alternatives, such as cap and trade in the United States. Other carbon management practices could increase the cost of energy and change the economics for petrochemicals.No clear, commercially viable alternative in sight. •The current range of feedstock alternatives includes biomass, coal-to-liquid, on-demand chemical production pathways, such as propane to benzene, and others. The challenge lies in the volatility of oil prices, which causes the economics of these alternatives to swing from wildly favorable to unfavorable. Significant capital is required to prove the viability and scalability of any new technology.
Given prevailing uncertainty, the next decade will be primarily about managing a portfolio of conventional sources and alternative options for feedstocks and energy. Long-term feedstock and energy strategies must be clearly defined and executed to ensure supply security while mitigating price volatility. Furthermore, companies
may need to take multiple options on their alternative feedstocks while improving processes to reduce energy consumption. An understanding of core competencies and the nature of requirements is required to ensure the right options are exercised. Three components could be essential to mitigating risks associated with feedstocks:
Managing conventional sources. • Developing an integrated value chain, building strategic relationships through long-term agreements, tolling arrangements, and capacity reservations. Creating options on alternatives for advantage. •Seeking out alternative and advantaged feedstock sources while investing in or adopting emerging feedstock technologies.Minimizing volatility. • Using practices, such as geographic arbitrage and increased use of spot markets to gain improved pricing and profit from the volatility of the commodity.
Business modelAs companies adjust to new customer needs and competition, business models may need to be redesigned to improve effectiveness and value. Some key questions to consider:
How long has it been since the business model was •reviewed? How conscious is the decision-making in certain end •markets? Is marketing viewed as a critical component to winning? •Can the current business models adapt to faster •changes? How do various segments contribute to value and how •do they impact the balance sheet?Are the costs to serve customers clear and are resources •shared well?Are innovation investments generating acceptable •returns?
It is not clear that these questions or a specific focus on business needs are management priorities among chemical companies. Companies interviewed for the study have a definite interest in getting better at targeting value and taking advantage of it. For many, a focus on business models has been a neglected discipline.

The chemical multiverse 24
TalentChanging demographics in the global workforce demand a comprehensive talent management response. Chemical companies in the developed world have been downsizing for years, shrinking the talent pool, while still not actively recruiting from universities. In some cases, entire teams with expertise in specific chemistry or manufacturing processes are preparing to leave the workforce in the next five years. Executives discussed the need to identify and attract high-potential candidates earlier in their careers, as well as the need to be even more disciplined in developing and managing succession plans for high-potential leaders. Chemical industry executives also expressed an interest in exploring new models for flexible and personalized rewards used by other industries. An individual company’s reputation and brand image can contribute to human resources policies, and a recent study revealed that successful companies all used the following approaches to enhance their brand and attract top talent:3
Promoting exciting products, interesting challenges, and •the draw of working to solve the world’s problems Broadening their spectrum of innovation opportunities •and enhancing the novelty of products, processes, and services generated by R&D Recruiting widely experienced, multidisciplined, and •multicultural talent Addressing the issue of a mature workforce•
It is critical that companies develop processes and systems to capture and make available institutional knowledge. Currently, institutional knowledge is not gathered, documented, or archived but rather remains stored in employees’ heads.
Innovative processes can also be used to create a new generation of work environments (including virtual environments), offering support for work-life balance, visibility of future leaders, and platforms for cross-functional and cross-geographic teams.
Asset intelligenceImproving execution relies ultimately on real-time business decisions and the removal of latency from critical business processes. Technology is likely to continue to make major strides in the coming years to enable a more real-time world. This could increase the availability of discretionary investment in a chemical industry where much of the cost is currently assumed to be fixed. To realize the benefits of asset and decision intelligence, companies outside of the chemical industry have embraced the following real-time and latency-reducing concepts:
Turning organizational assets into signaling assets that •collect data Identifying efficiencies and cost reductions with the •goal of eliminating latency from the system to create more value Migrating asset intelligence technology across functions •to achieve multiple and reinforcing competitive advantagesAchieving gains in operations/supply chains, including •customer responsiveness, receivables collection, strategy execution, and other issues hindered by the inaccessibility of real-time data
Companies that implement asset intelligence projects report that they obtain a high return on investments applied to current assets and find that multiple projects performed in parallel can offer synergies. The elimination of latency is a potential future frontier of productivity improvement that is increasingly applied in other industries. It remains to be seen whether these tools and concepts will be adopted in the chemical industry, and if so, how broadly.
3 Deloitte Development LLP, The Manufacturing Institute, and Oracle [Inc.], “People and profitability: A time for change. A 2009 people management practices survey of the manufacturing industry,” 30 September 2009.
25
End marketsConsumption patterns are diverging globally. Beginning with the recent economic downturn, spending in Western countries has been reset at lower levels. At the same time, spending in developing countries, with their growing middle classes, is rising. Responding to these trends will involve building marketing experience and discipline to make use of a company’s wealth of customer data. In addition, shifting customer needs and behaviors in both developed and developing markets can be a basis for targeting product development.
Several end markets are also changing, both globally and locally. The global automotive market, for example, is involved in a tectonic shift, due to such forces as clean technology, changes in end-market demand, and labor-cost imbalances. Construction in many parts of the developed world is slowing or stopping — or, like residential housing in the United States, only beginning to improve again.
Change in end markets has implications for all chemical industry players. The misalignment of regional demand and capacities means that exports will continue to be important. In recent years, companies that had significant participation in Asia and China outperformed peers with less of a presence there. Those with heavy exposure to Western markets have had to retrench. And those with high concentrations of customers in battered, mature end markets like automotive, construction, and luxury goods are rethinking their strategies. Varying currency exchange rates are also contributing to this changing landscape. For example, the U.S. dollar to euro exchange rate recently rose almost 20 percent and then declined below its starting point, causing pricing issues, margin compression, contraction of volume, and cost-to-serve problems. (see sidebar “Coming soon: Deloitte’s report focused on end markets in the global chemical industry).
Coming soon: Deloitte’s report focused on end markets in the global chemical industry Deloitte will publish a third report on end markets in the global chemical industry. The report’s key message will complement the findings revealed in The decade ahead and The chemical multiverse. The end market report will analyze 17 end markets across approximately 70 different segments, feature both primary and secondary research, and answer the following questions:
Where is the momentum heading in end markets? •Where are the highest margins and growth rates?What is the value contribution of the chemical •industry to end markets?What trends are affecting end markets? What •shifts are having an impact including those from a geographic perspective? How will end markets benefit from megatrends •and the resulting opportunities for the chemical industry? How can the chemical industry accelerate the advancement of megatrends to gain profitability?
In addition, the report will incorporate perspectives from executives in the global chemical industry as well as those serving in other sectors. This insight will be used to understand the direction end markets are heading and their future. Included in the report will be two unique indexes: the first will be created to measure the dynamics of end markets. The second will focus on the attractiveness of end markets for the global chemical industry.
Source: DTTL’s Global Manufacturing Industry Group analysis.

The chemical multiverse 26
Innovation According to executives interviewed for this study, successful, innovative cultures are usually driven from the top. Leaders consciously spend time talking about, participating in, and trying to influence their organization’s innovation efforts; they also focus on how to support this type of culture through various functions. These leaders understand that there is no such thing as an innovation department, and carefully choose enhancement metrics and apply them broadly. While innovation certainly involves creativity, companies with track records of growth through innovation have also shown profound execution discipline and focus.
Product and services innovation is still viewed as central to the mission of most chemical companies. In spite of the dearth of recent breakthroughs, declining yields, reduced budgets, and low tolerance for trial and error, industry leaders believe that innovation is an essential strategic pillar and a defining element of a company’s culture. However, the study found that investors will carefully monitor companies when they take on large, expensive, and risky investments.
Despite this, executives and chemical investment analysts alike commented on the importance of growth and current market opportunities as a means of greater profitability. They were especially interested in nanotechnology and biotechnology among the newer technology platforms. As for the expense and risk of product and service innovation — particularly in the areas of new properties, materials science, and materials engineering — many executives were anxious to learn more about open innovation (see sidebar “Open innovation”).
Equally intense were executives’ reactions when discussing innovation in execution. In practical terms, innovation in execution means finding improved ways of operating across all internal functions, developing and assimilating new skills, capabilities, and tools, and embedding improvements in management processes. It also involves operating in other areas of the value chain, potentially in partnership with others, to bring new solutions forward and augment value.
It should be noted that innovation in execution applies to growth prospects, as well as profitability. Innovative execution is as critical to attacking legacy costs, improving the profitability of the core business, and eliminating latency as it is to solving 21st-century problems with new products, services, and solutions.
Open innovationCompanies today acknowledge it takes a collective effort of highly skilled resources to drive value across the organization and execute corporate strategies. Many organizations are now turning again to open innovation, a concept that uses a collaborative approach including external and internal participants to foster and accelerate advances in technology. Historically, open innovation has been viewed as risky and difficult to manage and govern in key areas including intellectual property (IP). The revival of open innovation is a result of gaps in resources and capabilities, scarcity of investment capital, and challenges solving problems that require cross-disciplinary skills and demand total solutions.
Global chemical companies can use open innovation to help bring products and technologies to market, especially when there is desirable demand. The method unites practitioners with specialty knowledge that one company alone could not support with the available human capital. There is an initial investment to bring organizations together, thus creating a shared risk. However, the financial requirement can help to drive productivity enabling an efficient and effective working relationship. It is paramount that the group involved in the concept has a leadership team and common governing system. Over time with the right synergy and organizational direction, the team will develop and mature into a trusted working relationship.
Source: DTTL’s Global Manufacturing Industry Group analysis.
27
Capital flowExecutives interviewed during the study understood the need for financial discipline and found The decade ahead to be an accurate portrayal of the industry, including the deterioration of financial fundamentals during the last 12 years. Investment analysts and other financial professionals covering chemicals and materials science also viewed the data as an honest reflection of the industry, but were more cautious than chemical executives about the implications of below-average performance going forward. The message is clear: Given unpredictable capital markets, chemical companies need to limit negative financial exposure by becoming increasingly self-funded over the next 5 to 10 years. This necessitates monetizing assets and increasing cash from operations as well as reducing debt. Of particular importance is dealing with overcapacity by possibly closing uncompetitive facilities.
The need for self-funding also applies to strategic leaders and strong options companies. They must keep developing superior projects to sustain their growth and profitability momentum and to assure continued access to competitively priced capital when needed for operations or transactional activities. Many are also likely to encounter a more stringent shareholder environment, including tougher investor standards for growth, returns, and the balance sheet. From a risk perspective, the cash-rich chemical companies will need to find smart ways to put that resource to work and avoid value-destroying acquisitions, overbuilding, or placing assets in the wrong regions. They should also consider reinvesting for organic growth only in promising end markets or in shorter-cycle innovation projects. Otherwise, some companies could face pressure to return more cash to shareholders through special dividends and share buybacks.
Operational excellenceThe study found that quality programs and their offshoots, such as just-in-time (JIT) inventory and total quality management (TQM), are having only incremental impact at a time when step change is needed by many. These programs are often large and have been functioning for a number of years even though they are challenged by diminishing returns. Without new sources of benefits to compete with these approaches, the legacy programs continue to be funded in the annual budget.
Although a company needs to remain attentive to operational excellence, it also has to focus on the increasingly efficient deployment and use of assets, investments, and human resources. Companies are looking for approaches that optimize the flow of materials and information, while increasing the use of virtual teams and corporate networking systems. They will most likely focus on advanced supply-chain optimization and balance sheet metrics to satisfy investors with higher standards and to complement today’s largely P&L focus.
Source: DTTL’s Global Manufacturing Industry Group analysis.
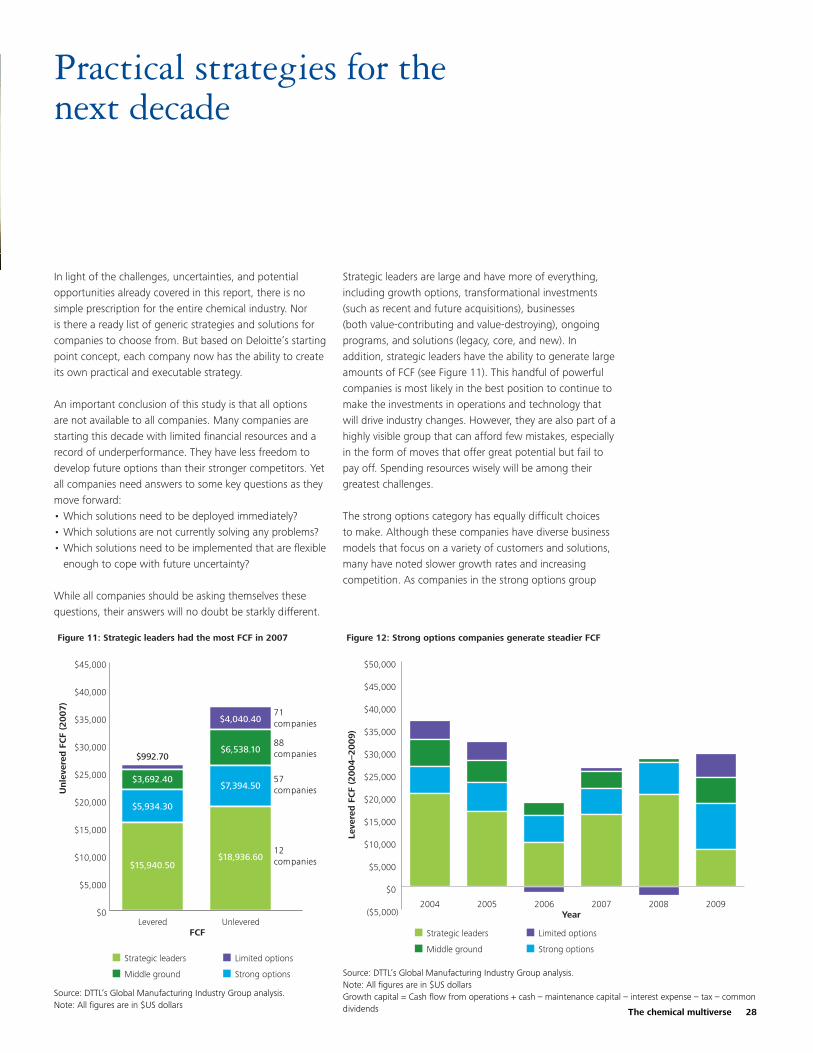
The chemical multiverse 28
In light of the challenges, uncertainties, and potential opportunities already covered in this report, there is no simple prescription for the entire chemical industry. Nor is there a ready list of generic strategies and solutions for companies to choose from. But based on Deloitte’s starting point concept, each company now has the ability to create its own practical and executable strategy.
An important conclusion of this study is that all options are not available to all companies. Many companies are starting this decade with limited financial resources and a record of underperformance. They have less freedom to develop future options than their stronger competitors. Yet all companies need answers to some key questions as they move forward:
Which solutions need to be deployed immediately? •Which solutions are not currently solving any problems? •Which solutions need to be implemented that are flexible •enough to cope with future uncertainty?
While all companies should be asking themselves these questions, their answers will no doubt be starkly different.
Strategic leaders are large and have more of everything, including growth options, transformational investments (such as recent and future acquisitions), businesses (both value-contributing and value-destroying), ongoing programs, and solutions (legacy, core, and new). In addition, strategic leaders have the ability to generate large amounts of FCF (see Figure 11). This handful of powerful companies is most likely in the best position to continue to make the investments in operations and technology that will drive industry changes. However, they are also part of a highly visible group that can afford few mistakes, especially in the form of moves that offer great potential but fail to pay off. Spending resources wisely will be among their greatest challenges.
The strong options category has equally difficult choices to make. Although these companies have diverse business models that focus on a variety of customers and solutions, many have noted slower growth rates and increasing competition. As companies in the strong options group
Figure 12: Strong options companies generate steadier FCF
($5,000)
$0
$5,000
$10,000
$15,000
$20,000
$25,000
$30,000
$35,000
$40,000
$45,000
$50,000Limited options
Deep pockets
Strong core
Strategic leaders
200920082007200620052004
Strategic leaders
Strong optionsMiddle ground
Limited options
Leve
red
FC
F (2
004–2
009)
Year
Source: DTTL’s Global Manufacturing Industry Group analysis.Note:Allfiguresarein$USdollarsGrowth capital = Cash flow from operations + cash – maintenance capital – interest expense – tax – common dividends
Figure 11: Strategic leaders had the most FCF in 2007
$0
$5,000
$10,000
$15,000
$20,000
$25,000
$30,000
$35,000
$40,000
$45,000Limited options
Deep pockets
Strong core
Strategic leaders
UnleveredLevered
$18,936.60$15,940.50
$7,394.50
$6,538.10
$4,040.40
$5,934.30
$3,692.40
$992.70
Strategic leaders
Strong optionsMiddle ground
Limited options
Unle
vere
d F
CF
(200
7)
FCF
12companies
57companies
88companies
71companies
Source: DTTL’s Global Manufacturing Industry Group analysis.Note:Allfiguresarein$USdollars
Practical strategies for the next decade
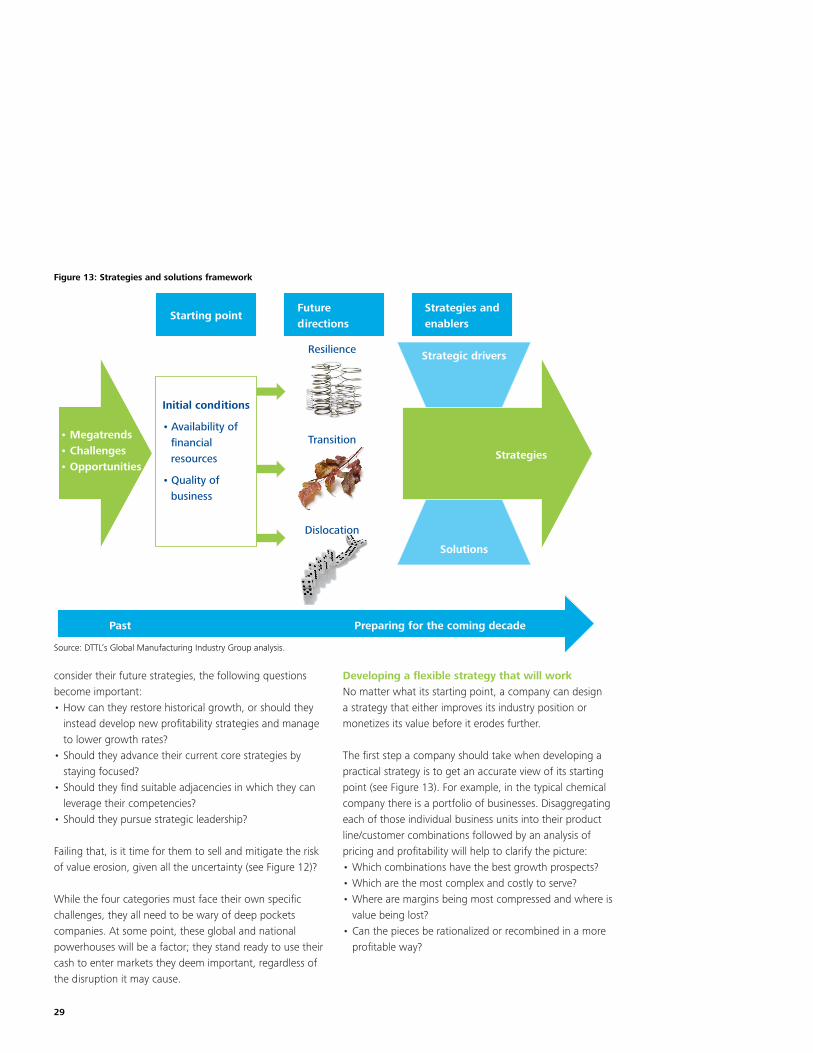
29
consider their future strategies, the following questions become important:
How can they restore historical growth, or should they •instead develop new profitability strategies and manage to lower growth rates?Should they advance their current core strategies by •staying focused? Should they find suitable adjacencies in which they can •leverage their competencies? Should they pursue strategic leadership? •
Failing that, is it time for them to sell and mitigate the risk of value erosion, given all the uncertainty (see Figure 12)?
While the four categories must face their own specific challenges, they all need to be wary of deep pockets companies. At some point, these global and national powerhouses will be a factor; they stand ready to use their cash to enter markets they deem important, regardless of the disruption it may cause.
Developing a flexible strategy that will workNo matter what its starting point, a company can design a strategy that either improves its industry position or monetizes its value before it erodes further.
The first step a company should take when developing a practical strategy is to get an accurate view of its starting point (see Figure 13). For example, in the typical chemical company there is a portfolio of businesses. Disaggregating each of those individual business units into their product line/customer combinations followed by an analysis of pricing and profitability will help to clarify the picture:
Which combinations have the best growth prospects? •Which are the most complex and costly to serve? •Where are margins being most compressed and where is •value being lost? Can the pieces be rationalized or recombined in a more •profitable way?
Strategies
Preparing for the coming decadePast
Starting pointFuture directions
Strategies andenablers
Initial conditions
• Availability of financialresources
• Quality of business
Resilience
Transition
Dislocation
Strategic drivers
Solutions
• Megatrends• Challenges• Opportunities
Figure 13: Strategies and solutions framework
Source: DTTL’s Global Manufacturing Industry Group analysis.
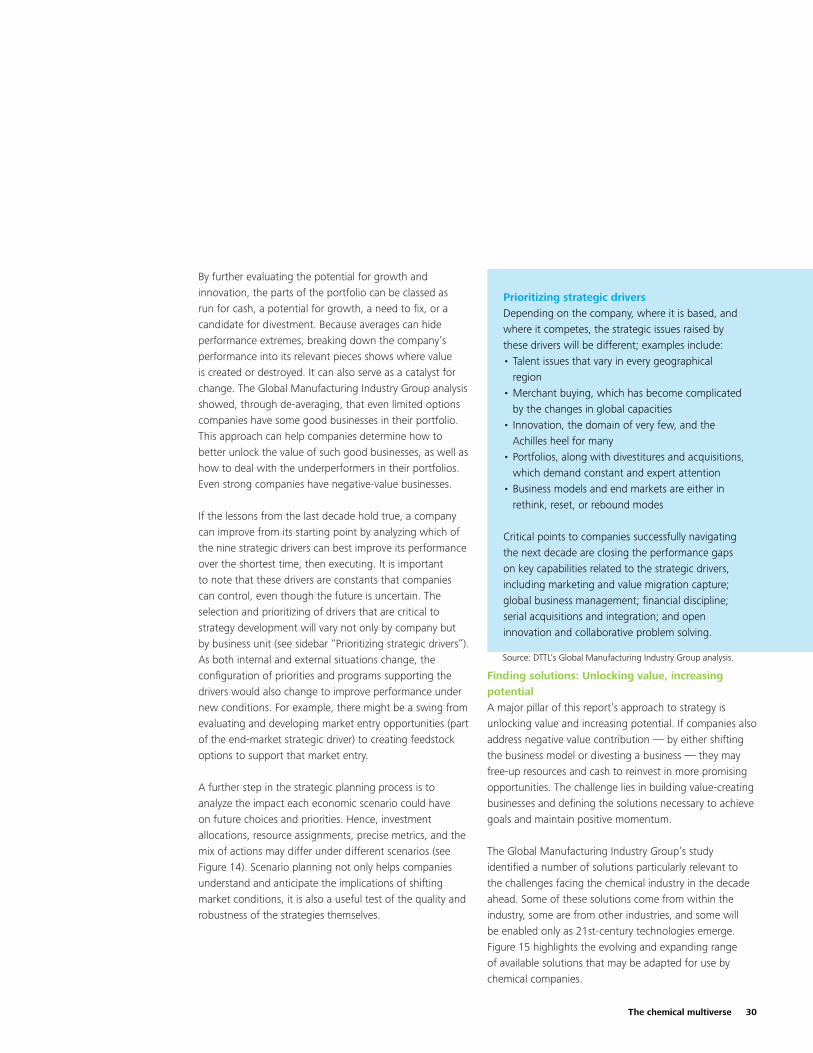
The chemical multiverse 30
By further evaluating the potential for growth and innovation, the parts of the portfolio can be classed as run for cash, a potential for growth, a need to fix, or a candidate for divestment. Because averages can hide performance extremes, breaking down the company’s performance into its relevant pieces shows where value is created or destroyed. It can also serve as a catalyst for change. The Global Manufacturing Industry Group analysis showed, through de-averaging, that even limited options companies have some good businesses in their portfolio. This approach can help companies determine how to better unlock the value of such good businesses, as well as how to deal with the underperformers in their portfolios. Even strong companies have negative-value businesses.
If the lessons from the last decade hold true, a company can improve from its starting point by analyzing which of the nine strategic drivers can best improve its performance over the shortest time, then executing. It is important to note that these drivers are constants that companies can control, even though the future is uncertain. The selection and prioritizing of drivers that are critical to strategy development will vary not only by company but by business unit (see sidebar “Prioritizing strategic drivers”). As both internal and external situations change, the configuration of priorities and programs supporting the drivers would also change to improve performance under new conditions. For example, there might be a swing from evaluating and developing market entry opportunities (part of the end-market strategic driver) to creating feedstock options to support that market entry.
A further step in the strategic planning process is to analyze the impact each economic scenario could have on future choices and priorities. Hence, investment allocations, resource assignments, precise metrics, and the mix of actions may differ under different scenarios (see Figure 14). Scenario planning not only helps companies understand and anticipate the implications of shifting market conditions, it is also a useful test of the quality and robustness of the strategies themselves.
Finding solutions: Unlocking value, increasing potentialA major pillar of this report’s approach to strategy is unlocking value and increasing potential. If companies also address negative value contribution — by either shifting the business model or divesting a business — they may free-up resources and cash to reinvest in more promising opportunities. The challenge lies in building value-creating businesses and defining the solutions necessary to achieve goals and maintain positive momentum.
The Global Manufacturing Industry Group’s study identified a number of solutions particularly relevant to the challenges facing the chemical industry in the decade ahead. Some of these solutions come from within the industry, some are from other industries, and some will be enabled only as 21st-century technologies emerge. Figure 15 highlights the evolving and expanding range of available solutions that may be adapted for use by chemical companies.
Prioritizing strategic driversDepending on the company, where it is based, and where it competes, the strategic issues raised by these drivers will be different; examples include:
Talent issues that vary in every geographical •regionMerchant buying, which has become complicated •by the changes in global capacitiesInnovation, the domain of very few, and the •Achilles heel for manyPortfolios, along with divestitures and acquisitions, •which demand constant and expert attentionBusiness models and end markets are either in •rethink, reset, or rebound modes
Critical points to companies successfully navigating the next decade are closing the performance gaps on key capabilities related to the strategic drivers, including marketing and value migration capture; global business management; financial discipline; serial acquisitions and integration; and open innovation and collaborative problem solving.
Source: DTTL’s Global Manufacturing Industry Group analysis.
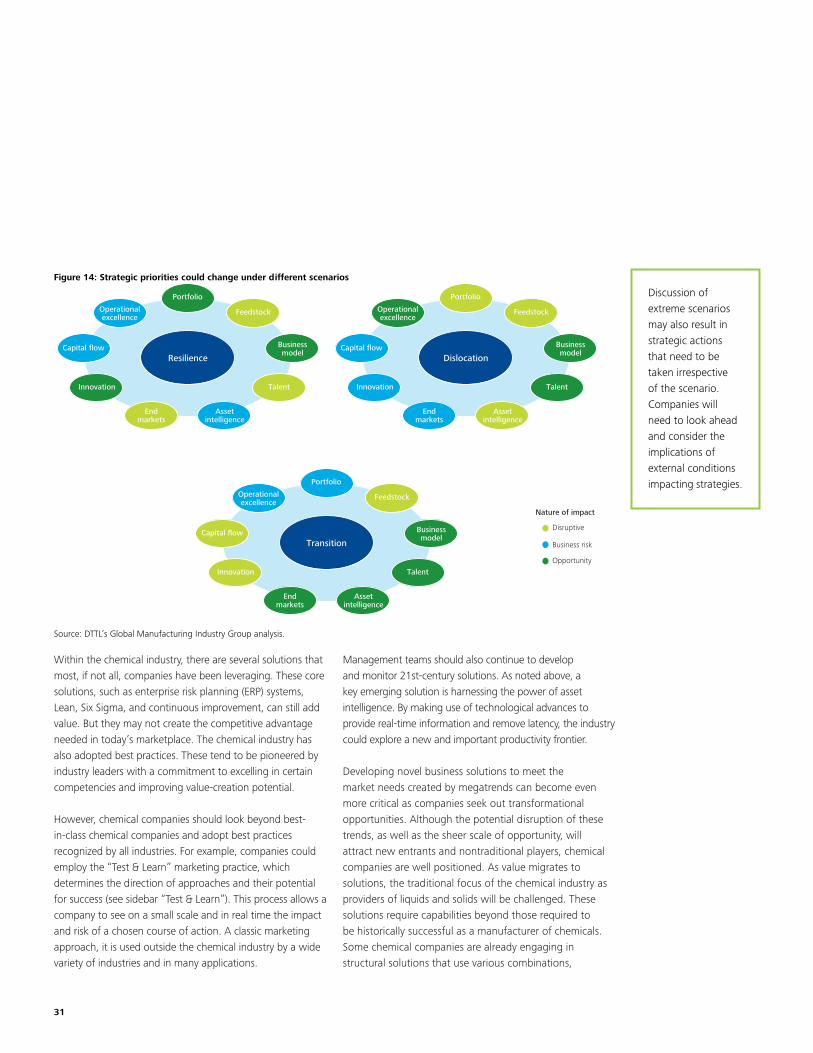
31
Within the chemical industry, there are several solutions that most, if not all, companies have been leveraging. These core solutions, such as enterprise risk planning (ERP) systems, Lean, Six Sigma, and continuous improvement, can still add value. But they may not create the competitive advantage needed in today’s marketplace. The chemical industry has also adopted best practices. These tend to be pioneered by industry leaders with a commitment to excelling in certain competencies and improving value-creation potential.
However, chemical companies should look beyond best-in-class chemical companies and adopt best practices recognized by all industries. For example, companies could employ the “Test & Learn” marketing practice, which determines the direction of approaches and their potential for success (see sidebar “Test & Learn”). This process allows a company to see on a small scale and in real time the impact and risk of a chosen course of action. A classic marketing approach, it is used outside the chemical industry by a wide variety of industries and in many applications.
Management teams should also continue to develop and monitor 21st-century solutions. As noted above, a key emerging solution is harnessing the power of asset intelligence. By making use of technological advances to provide real-time information and remove latency, the industry could explore a new and important productivity frontier.
Developing novel business solutions to meet the market needs created by megatrends can become even more critical as companies seek out transformational opportunities. Although the potential disruption of these trends, as well as the sheer scale of opportunity, will attract new entrants and nontraditional players, chemical companies are well positioned. As value migrates to solutions, the traditional focus of the chemical industry as providers of liquids and solids will be challenged. These solutions require capabilities beyond those required to be historically successful as a manufacturer of chemicals. Some chemical companies are already engaging in structural solutions that use various combinations,
Portfolio
Resilience
Feedstock
Businessmodel
Talent
Assetintelligence
Endmarkets
Innovation
Capital flow
Operationalexcellence
Portfolio
Dislocation
Feedstock
Businessmodel
Talent
Assetintelligence
Endmarkets
Innovation
Capital flow
Operationalexcellence
Portfolio
Transition
Feedstock
Businessmodel
Talent
Assetintelligence
Endmarkets
Innovation
Capital flow
Operationalexcellence
Nature of impact
Disruptive
Business risk
Opportunity
Discussion of extreme scenarios may also result in strategic actions that need to be taken irrespective of the scenario. Companies will need to look ahead and consider the implications of external conditions impacting strategies.
Figure 14: Strategic priorities could change under different scenarios
Source: DTTL’s Global Manufacturing Industry Group analysis.

The chemical multiverse 32
Test & LearnThe chemical industry has a long, successful history in applying the principles of design of experiments in production facilities; however, the “signal-to-noise” problem has made this idea impractical in much less controlled sales and marketing environments. Applied Predictive Technologies (APT) has pioneered the extension of the experimental method to market-facing activities.
A Test & Learn capability helps companies answer key questions about shareholder value, such as:
Should we change or unbundle pricing by account •or ship-to? How far can we raise prices before we put account retention at risk?Should we extend payment terms to 45 days? •Should we add 100 basis points in the penalty period?Should we increase or decrease account service •levels? For which accounts?Should we introduce this new part of account •servicing technology? For which accounts?Should we introduce this new product? How •much of its sales will be cannibalized, versus true new-to-system sales? How should we price it?Should we introduce this new rep incentive plan? •Should we move to a true franchise model?
Test & Learn software is the foundation of an institutionalized capability:
RolloutCreate hypothesis
Designtest
Executetest
Analyzetest
Planrollout
APT’sTest &Learn cycle
Learning library
Source: APT
Core solutions
Best practices:Chemical industry
Best practices:All industries
21st-century solutions
R&D stagegate
ERP systems
Processoptimization
Lean, Six Sigma,continuous
improvements
Openexecution
Supply chainoptimization
Tacticalpricing
Value-basedpricing
Test &Learn
Openinnovation
Flexible workingarrangements
Advancedsupply chainoptimization
Cloudcomputing
Alternativefeedstocksand energy
Decisionintelligence
Asset intelligence
Nanotechnologyplatforms
Figure 15: Relevant solutions to the challenges facing the next decade
Source: DTTL’s Global Manufacturing Industry Group analysis.
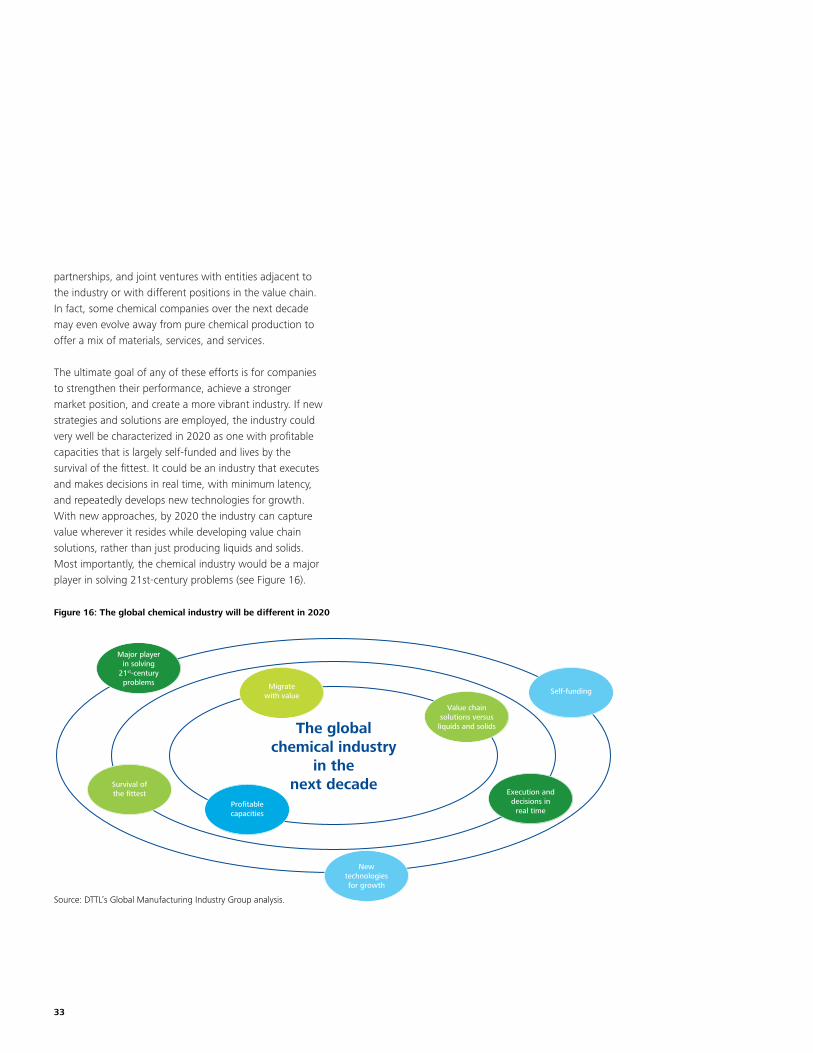
33
partnerships, and joint ventures with entities adjacent to the industry or with different positions in the value chain. In fact, some chemical companies over the next decade may even evolve away from pure chemical production to offer a mix of materials, services, and services.
The ultimate goal of any of these efforts is for companies to strengthen their performance, achieve a stronger market position, and create a more vibrant industry. If new strategies and solutions are employed, the industry could very well be characterized in 2020 as one with profitable capacities that is largely self-funded and lives by the survival of the fittest. It could be an industry that executes and makes decisions in real time, with minimum latency, and repeatedly develops new technologies for growth. With new approaches, by 2020 the industry can capture value wherever it resides while developing value chain solutions, rather than just producing liquids and solids. Most importantly, the chemical industry would be a major player in solving 21st-century problems (see Figure 16).
Major playerin solving
21st-centuryproblems Migrate
with valueSelf-funding
Newtechnologiesfor growth
Execution anddecisions in
real time
Value chainsolutions versusliquids and solids
Survival ofthe fittest
Profitablecapacities
The globalchemical industry
in thenext decade
Figure 16: The global chemical industry will be different in 2020
Source: DTTL’s Global Manufacturing Industry Group analysis.
The chemical multiverse 34
The chemical industry will undoubtedly be different in 2020. Yet there are valid reasons to believe that this industry can return to vibrancy if difficult but achievable steps are taken. The choices each company will need to make will be uniquely theirs, and not all options will be available to everyone. Choosing the right model for growth or otherwise realizing value is vital. Companies will need to target and capture the value in their operations and properly address the hardest problems within the industry.
The chemical industry has proven resilient in the past, and its importance in the future will not diminish, especially in light of emerging megatrends and global movements. Developing new capabilities, using 21st-century solutions, and taking advantage of the opportunities created by these trends could be the quantum leap the industry needs. Many of these approaches are not new, and have been effectively deployed both by a select few chemical companies and by many companies outside of the industry; some approaches will be completely new. However, all companies will be on a path of change to meet the demands of the future and to stay ahead of the competition.
So, the road ahead is challenging, and taking on those challenges will necessitate hard work. But a lack of preparation can entail even harder work and presents a real risk: circumstances may not be as forgiving as in the past. Companies inside and outside of the chemical industry have successfully navigated similarly tough circumstances. Chemical companies that acknowledge their current position, and adopt a flexible strategic approach that plans for a variety of scenarios, stand the best chance of successfully reshaping their industry over the next decade.
The road ahead

35
Tim HanleyGlobal Chemical industry group leader Deloitte Touche Tohmatsu Limited [email protected] Tel: +1 414 977 2520
Duane DicksonPrincipal Deloitte United States (Deloitte Consulting LLP) [email protected] Tel: +1 203 905 2633
Dwight AllenDirector, Deloitte Research Deloitte United States (Deloitte Services LP)[email protected]: +1 703 251 3625
Contacts
The chemical multiverse 36
Acknowledgements
The DTTL Global Manufacturing Industry Group wishes to acknowledge the many professionals worldwide from Deloitte member firms and outside organizations who contributed to the research, writing, and production of the report. Duane Dickson, principal, Deloitte United States (Deloitte Consulting LLP), led the development of the report along with Tim Hanley, DTTL Global Chemical leader, Dwight Allen, director of Deloitte Research, Deloitte United States (Deloitte Services LP), and Jim Guill, senior manager, Deloitte United States (Deloitte Services LP). Duane’s strong leadership, collaborative approach, and strategic vision helped lead the Deloitte team to explore, hypothesize, and analyze the future of the global chemical industry.
A sincere thanks to Ed Varian, principal, ESV Business Consulting LLC, and Arthur Wienslaw, independent consultant, who served as contributing authors and knowledge associates. Both Ed and Arthur provided continuous support, invaluable industry insights, and sound advice. Additional special gratitude is extended to Walker Lewis, chairman, Devon Value Advisors, who served both as a contributing author and mentor to the DTTL Global Manufacturing Industry Group team providing analytical, strategic, and insightful wisdom. Walker’s contribution was exemplary and he continues to serve as a trusted long-term business advisor.
A team from Deloitte United States (Deloitte Consulting LLP) was instrumental in the research which served as a foundation for the strategic analysis. This team includes Krishna Venkatesh Raghavan, Robert Dickson, Pooja
Natarajan, Jim Manocchi, Nadia Johnson, Charles Tsang, Tanya Ivushkina, and RJ Krawiec. In addition, practitioners from Deloitte member firms also made a significant contribution on the research in the report. This team includes Kai Goebel, Deloitte Germany; Willem Vaessen, Deloitte Netherlands; and Sam Vaseghi, Deloitte Germany.
Special thanks to Deloitte United States intern Alex Dickson for his analytic knowledge and to Charlotte Porteneuve, former Deloitte United States (Deloitte Consulting LLP) practitioner, for her insights and contributions.
The DTTL Global Manufacturing Industry Group team is appreciative of the support from the many industry colleagues that provided critical analysis and wise counsel including Mark Gulley, Soleil Securities Corporation; Carmichael Roberts, Northbridge Venture Partners; Raj Iyer, independent consultant; and Dr. Ken Spall, Earth, Wind and Solar.
Special acknowledgements go to a Deloitte United States team including Barry Phillips, advisor; and Suzannah Carrington, graphic design; and a DTTL team including Elizabeth Henry, writing support; and Jennifer McHugh, marketing and production. In addition, special thanks to Andrea Lekushoff and Bruce Geddes from Broad Reach Communications for their writing support.

Deloitte Touche Tohmatsu Limited Global Manufacturing Industry GroupThe Global Manufacturing Industry Group is comprised of more than 750 Deloitte Touche Tohmatsu Limited member firm partners and 12,000 industry professionals in over 45 countries. The group’s deep industry knowledge, service line experience, and thought leadership allows them to solve complex business issues with member firm clients in every corner of the globe. Deloitte member firms attract, develop, and retain the very best professionals and instill a set of shared values centered on integrity, value to clients, and commitment to each other and strength from diversity. Deloitte member firms provide professional services to 80% of the manufacturing industry companies on the Fortune Global 500®. For more information about the Global Manufacturing Industry Group, please visit www.deloitte.com/manufacturing.
About Deloitte Deloitte refers to one or more of Deloitte Touche Tohmatsu Limited, a UK private company limited by guarantee, and its network of member firms, each of which is a legally separate and independent entity. Please see www.deloitte.com/about for a detailed description of the legal structure of Deloitte Touche Tohmatsu Limited and its member firms.
Deloitte provides audit, tax, consulting, and financial advisory services to public and private clients spanning multiple industries. With a globally connected network of member firms in more than 140 countries, Deloitte brings world-class capabilities and deep local expertise to help clients succeed wherever they operate. Deloitte’s approximately 170,000 professionals are committed to becoming the standard of excellence.
Deloitte ResearchDeloitte Research, a part of Deloitte Services LP, identifies, analyzes, and explains the major issues driving today’s business dynamics and shaping tomorrow’s global marketplace. From provocative points of view about strategy and organizational change to straight talk about economics, regulation, and technology, Deloitte Research delivers innovative, practical insights companies can use to improve their bottom-line performance. Operating through a network of dedicated research professionals, senior consulting practitioners of various member firms of Deloitte Touche Tohmatsu Limited, academics, and technology specialists, Deloitte Research exhibits deep industry knowledge, functional understanding, and commitment to thought leadership. In boardrooms and business journals, Deloitte Research is known for bringing new perspective to real-world concerns.
DisclaimerThis publication contains general information only, and none of Deloitte Touche Tohmatsu Limited, any of its member firms or any of the foregoing’s affiliates (collectively the “Deloitte Network”) are, by means of this publication, rendering accounting, business, financial, investment, legal, tax, or other professional advice or services. This publication is not a substitute for such professional advice or services, nor should it be used as a basis for any decision or action that may affect your finances or your business. Before making any decision or taking any action that may affect your finances or your business, you should consult a qualified professional adviser. No entity in the Deloitte Network shall be responsible for any loss whatsoever sustained by any person who relies on this publication.
© 2010 Deloitte Global Services Limited