Embed Size (px)
Citation preview

The changing face of agriculture and food trade: The role of global value chains Jared Greenville
Trade and Agriculture Directorate
Information session for the Committee on
Agriculture, WTO
8 June 2017, Geneva
2
Trade and Agriculture Directorate | Organisation for Economic Co-operation and Development (OECD) | www.oecd.org/tad | [email protected]
Today’s talk
Focus is on trade within GVCs and the policy influences that impact it • Interested in whether changes in the way trade is done
have implications for international agro-food trade policy
But the concept of GVC used may differ from past studies • Not a specific value chain/niche market perspective • Broad global story of how trade is organised
Interested in exploring policies that allow countries to get the most from international markets • Concept of domestic value added

3
Trade and Agriculture Directorate | Organisation for Economic Co-operation and Development (OECD) | www.oecd.org/tad | [email protected]
Agro-food trade is growing
0
500
1000
1500
2000
2500
3000
3500
1988 1990 1992 1994 1996 1998 2000 2002 2004 2006 2008 2010 2012 2014
USD bn (real)
US GDP deflator Food price deflator

4
Trade and Agriculture Directorate | Organisation for Economic Co-operation and Development (OECD) | www.oecd.org/tad | [email protected]
Trade in agro-food products is increasingly ‘global’
• Sectors producing food source in inputs internationally • Production processes buy from GVCs
• Agro-food products also get used in the production of
other food products • Exports are sold into ongoing into GVCs
• Interconnections mean policies have wider impacts on
markets • Trade barriers and NTMs
5
Trade and Agriculture Directorate | Organisation for Economic Co-operation and Development (OECD) | www.oecd.org/tad | [email protected]
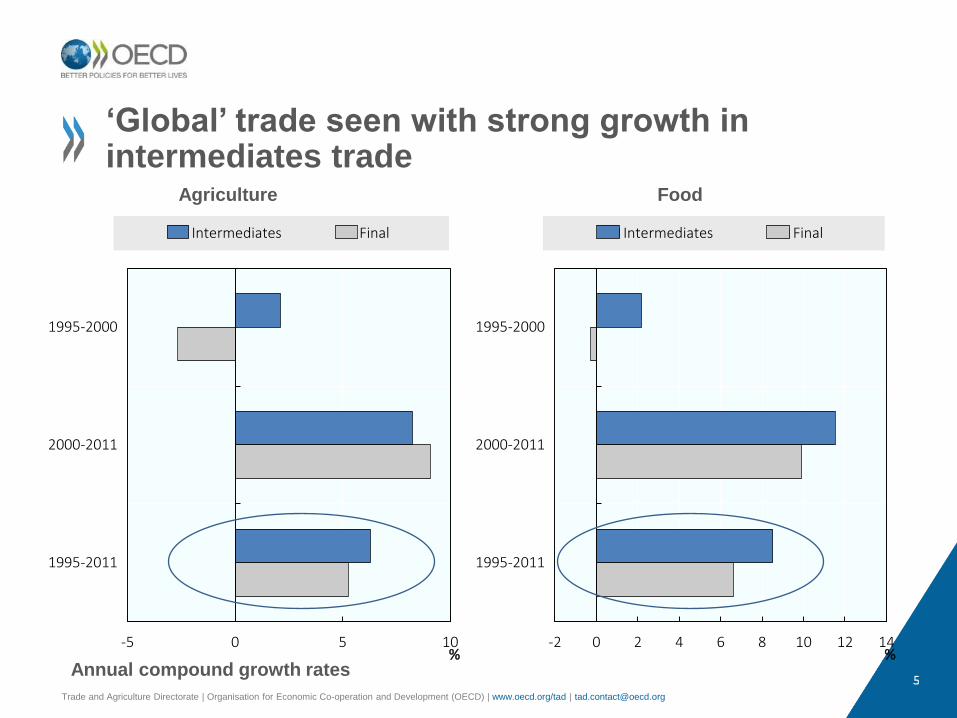
‘Global’ trade seen with strong growth in intermediates trade
-5 0 5 10
1995-2000
2000-2011
1995-2011
%
Intermediates Final
-2 0 2 4 6 8 10 12 14
1995-2000
2000-2011
1995-2011
%
Intermediates Final
Agriculture Food
Annual compound growth rates
6
Trade and Agriculture Directorate | Organisation for Economic Co-operation and Development (OECD) | www.oecd.org/tad | [email protected]
GVCs – what are they?
Value chains: describe a production process for a final
good
• Full range of activities from concept to final good
• Represent all the links between industries
Global value chains focus on the international
linkages relate to trade
• But there are also significant domestic linkages
• And products are often delivered to final demand
7
Trade and Agriculture Directorate | Organisation for Economic Co-operation and Development (OECD) | www.oecd.org/tad | [email protected]
How do we measure GVCs?
Measured from country-industry perspective
• We look first at the links for an industry in a given country
• Look at the breakdown of value added in exports
Track trade in value added flows between countries
• And see where it is used and potentially re-exported
• Computed from Inter-Country Input-Output tables

INSIGHTS INTO VALUE ADDED
8

9
Trade and Agriculture Directorate | Organisation for Economic Co-operation and Development (OECD) | www.oecd.org/tad | [email protected]
Which sectors contribute to agro-food final value? Broad players in the value chain
0
1
2
3
4
5
6
0 10 20 30 40 50 60 70 80 90
% of countries and regions
Share of final agro-food value added
Agriculture Food Industry Services
Shows the distribution of shares in agro-food final value of specific sectors
Service share greater than industrial
Most from ag and food – wider distribution in ag
10
Trade and Agriculture Directorate | Organisation for Economic Co-operation and Development (OECD) | www.oecd.org/tad | [email protected]
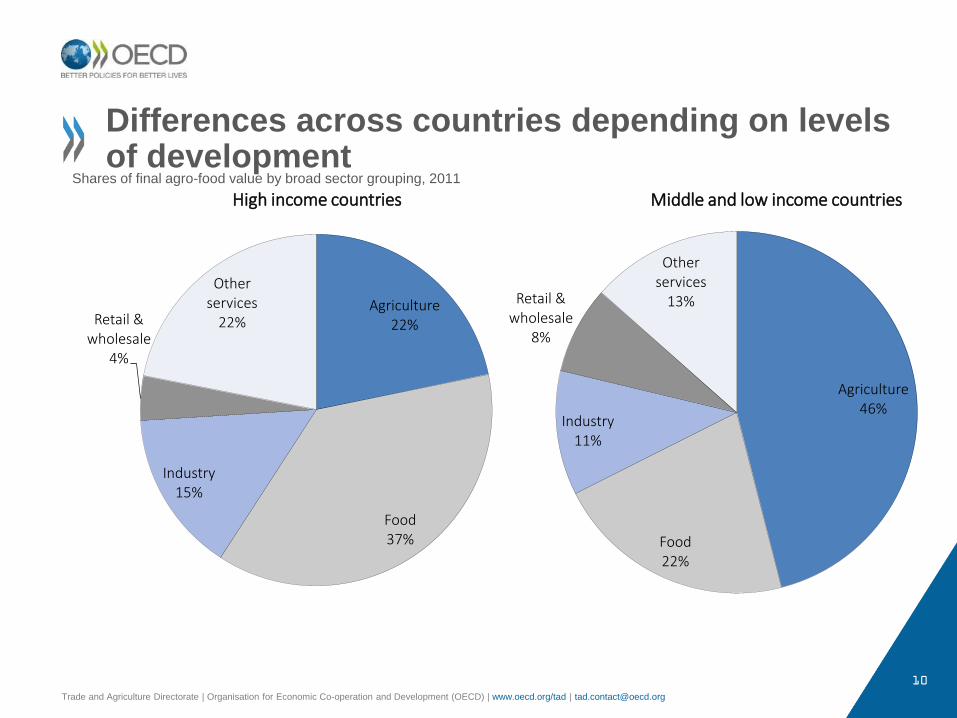
Differences across countries depending on levels of development
Agriculture 22%
Food 37%
Industry 15%
Retail & wholesale
4%
Other services
22%
High income countries
Agriculture 46%
Food 22%
Industry 11%
Retail & wholesale
8%
Other services
13%
Middle and low income countries Shares of final agro-food value by broad sector grouping, 2011
SOME RESULTS ON AGRO-FOOD GVCs
11

12
Trade and Agriculture Directorate | Organisation for Economic Co-operation and Development (OECD) | www.oecd.org/tad | [email protected]
How important are GVCs? Ratio of value added trade in intermediates to final goods
0
2
4
6
8
10
12
14
16
18
20
0
10
20
30
40
50
60
70
(Left hand axis) (Right hand axis)
Ratio less than 1
Ratio of value added trade in intermediates to final goods

13
Trade and Agriculture Directorate | Organisation for Economic Co-operation and Development (OECD) | www.oecd.org/tad | [email protected]
China Japan ASEAN Canada USA India EU28 Sth America Africa
China 1860 5931 567 2478 591 9353 617 878
Japan 299 389 25 103 14 340 16 38
ASEAN 2953 772 212 1002 401 3476 193 532
Canada 573 191 279 1070 22 790 111 60
USA 3384 632 2065 1533 76 2658 353 387
India 1127 110 1479 76 336 1544 67 246
EU28 1409 405 1214 367 1123 163 377 1116
Sth America 3843 486 2351 408 1086 98 7900 830
Africa 990 118 901 115 386 146 4473 65
Agro-food GVC hubs: EU, China followed by ASEAN, USA
Column shows source of foreign value added in own exports: Buying from GVCs
Row shows how exported value added is used in other country exports: Selling to GVCs
What does the agro-food GVC landscape look like?
14
Trade and Agriculture Directorate | Organisation for Economic Co-operation and Development (OECD) | www.oecd.org/tad | [email protected]
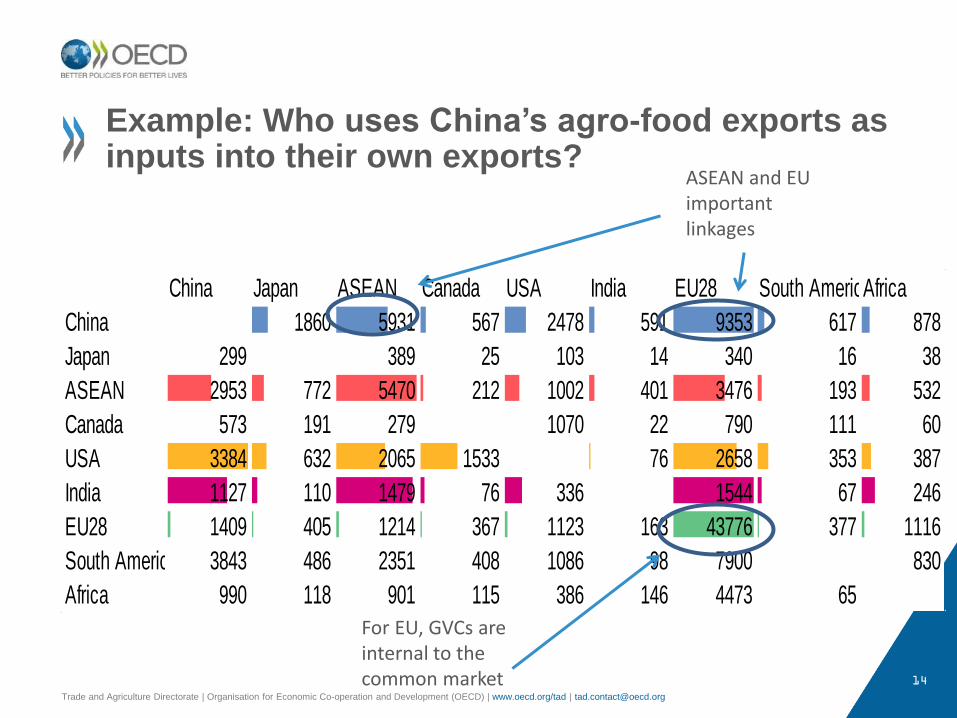
China Japan ASEAN Canada USA India EU28 South AmericaAfrica
China 1860 5931 567 2478 591 9353 617 878
Japan 299 389 25 103 14 340 16 38
ASEAN 2953 772 5470 212 1002 401 3476 193 532
Canada 573 191 279 1070 22 790 111 60
USA 3384 632 2065 1533 76 2658 353 387
India 1127 110 1479 76 336 1544 67 246
EU28 1409 405 1214 367 1123 163 43776 377 1116
South America 3843 486 2351 408 1086 98 7900 830
Africa 990 118 901 115 386 146 4473 65
ASEAN and EU important linkages
For EU, GVCs are internal to the common market
Example: Who uses China’s agro-food exports as inputs into their own exports?
15
Trade and Agriculture Directorate | Organisation for Economic Co-operation and Development (OECD) | www.oecd.org/tad | [email protected]
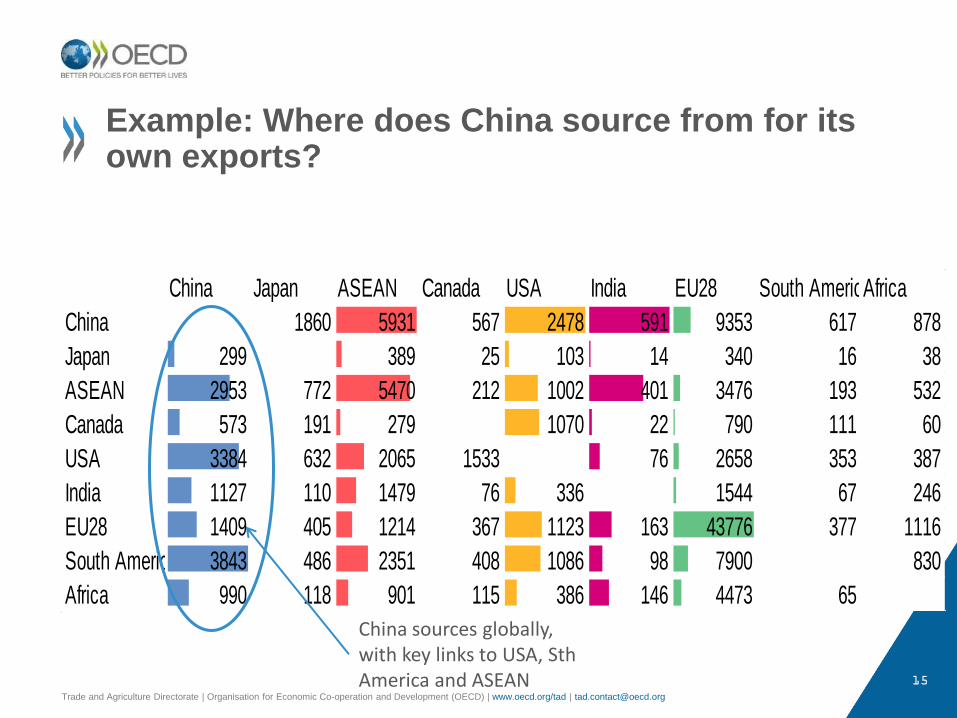
China Japan ASEAN Canada USA India EU28 South AmericaAfrica
China 1860 5931 567 2478 591 9353 617 878
Japan 299 389 25 103 14 340 16 38
ASEAN 2953 772 5470 212 1002 401 3476 193 532
Canada 573 191 279 1070 22 790 111 60
USA 3384 632 2065 1533 76 2658 353 387
India 1127 110 1479 76 336 1544 67 246
EU28 1409 405 1214 367 1123 163 43776 377 1116
South America 3843 486 2351 408 1086 98 7900 830
Africa 990 118 901 115 386 146 4473 65
China sources globally, with key links to USA, Sth America and ASEAN
Example: Where does China source from for its own exports?

16
Trade and Agriculture Directorate | Organisation for Economic Co-operation and Development (OECD) | www.oecd.org/tad | [email protected]
Looking more closely at backward and forward linkages
Backward linkages: buying from GVCs
• Measures the amount of foreign value added embodied in
exports
• Comes through intermediate input usage
Forward linkages: selling into GVCs
• Measures the amount of domestic value added that forms part
of another country’s exports
• So picks up the ongoing value chain
• Domestic value exported can be either direct (own exports) or
indirect (exports from other domestic industries that make use
of the outputs produced, eg processing sector exports using
agricultural production as inputs)

17
Trade and Agriculture Directorate | Organisation for Economic Co-operation and Development (OECD) | www.oecd.org/tad | [email protected]
0 0.2 0.4 0.6 0.8 1 1.2 1.4 1.6
Oilseeds
Plant-based fibers
Wheat
Other grains
Livestock
Other crops
Bovine meat
Wool & silk
Other animal products
Sugar
Vegetables, fruit & nuts
Beverages & tobacco
Dairy
Vegetable oils & fats
Other meat products
Processed rice
Other food products
Forward Backward
Forward and backward indicators across sectors
Mostly food
products with lower
rates of forward
participation, but
with higher
backward

18
Trade and Agriculture Directorate | Organisation for Economic Co-operation and Development (OECD) | www.oecd.org/tad | [email protected]
Position and total participation across sectors
Position
shows
how
relatively
forward or
backward
a sector is.
Greater
than 0
more
forward,
less than 0
more
backward
Other animal products
Bev & tob
Livestock Bovine meat
products
Other grains
Other crops
Dairy products
Other food
Other meat
Oil seeds
Plant-based fibers
Processed rice
Sugar
Vegetable oils & fats
Vegetables, fruit, nuts
Wheat
Wool & silk
-0.2
-0.1
0
0.1
0.2
0.3
0.4
0.5
0 0.2 0.4 0.6 0.8 1 1.2 1.4 1.6 1.8
Position
Total participation
By sector

19
Trade and Agriculture Directorate | Organisation for Economic Co-operation and Development (OECD) | www.oecd.org/tad | [email protected]
Forward and backward indicators across countries
0
0.5
1
1.5
2
2.5
3
3.5
4
4.5
0
0.2
0.4
0.6
0.8
1
1.2
CHN IDN JPN KOR VNM NOR THA NLD LUX KHM BEL CHE EGY PAK UKR … ETH BRA USA ARG LKA
Backward (right hand axis) Forward (right hand axis) Backward (left hand axis) Forward (left hand axis)
Top 15
Bottom 5
GETTING THE MOST FROM GVCs: IMPLICATIONS FOR
MULTILATERAL REFORMS?
20

21
Trade and Agriculture Directorate | Organisation for Economic Co-operation and Development (OECD) | www.oecd.org/tad | [email protected]
Getting the most from GVCs: domestic value added creation
Domestic value added represents the returns from
participation….
• The benefits to an economy from being involved in trade
• It represents the returns to labour and capital, along with
taxes paid to governments (but less subsidies)
• It picks up the benefits to the entire economy from the
activity
• Both within the sector and to all who contribute
• Directly links to jobs and growth
22
Trade and Agriculture Directorate | Organisation for Economic Co-operation and Development (OECD) | www.oecd.org/tad | [email protected]
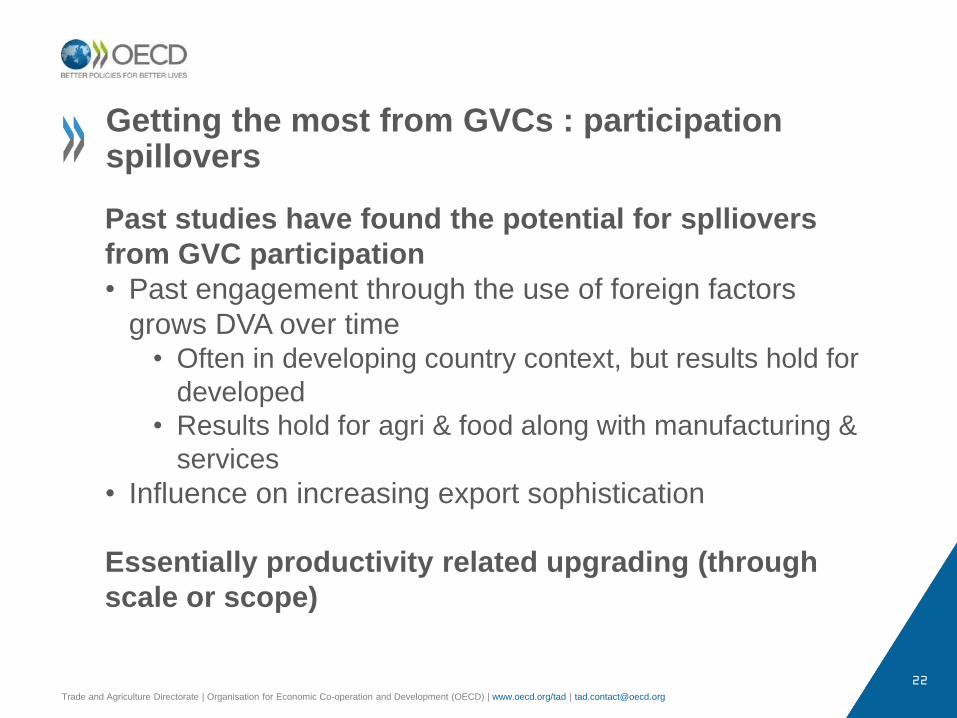
Getting the most from GVCs : participation spillovers
Past studies have found the potential for splliovers
from GVC participation
• Past engagement through the use of foreign factors
grows DVA over time • Often in developing country context, but results hold for
developed
• Results hold for agri & food along with manufacturing &
services
• Influence on increasing export sophistication
Essentially productivity related upgrading (through
scale or scope)
23
Trade and Agriculture Directorate | Organisation for Economic Co-operation and Development (OECD) | www.oecd.org/tad | [email protected]
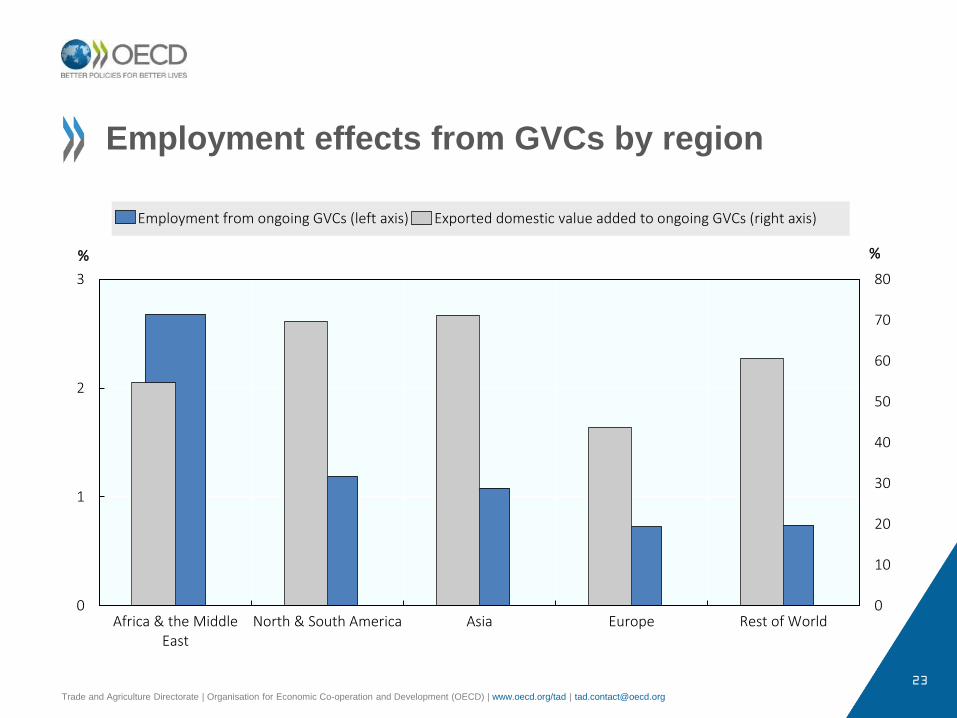
Employment effects from GVCs by region
0
10
20
30
40
50
60
70
80
0
1
2
3
Africa & the MiddleEast
North & South America Asia Europe Rest of World
% %
Employment from ongoing GVCs (left axis) Exported domestic value added to ongoing GVCs (right axis)
24
Trade and Agriculture Directorate | Organisation for Economic Co-operation and Development (OECD) | www.oecd.org/tad | [email protected]
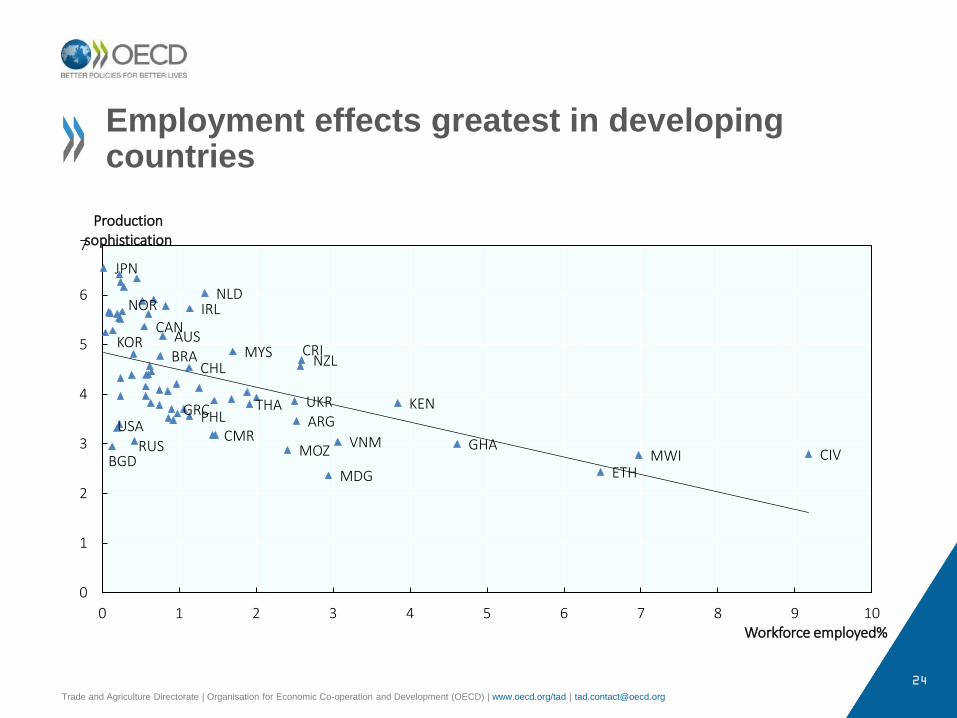
Employment effects greatest in developing countries
CIV MWI ETH
GHA
KEN
VNM
MDG
NZL CRI
ARG UKR
MOZ
THA
MYS
CMR
NLD IRL
PHL
CHL
GRC
AUS BRA
CAN
RUS
NOR
USA
BGD
KOR
JPN
0
1
2
3
4
5
6
7
0 1 2 3 4 5 6 7 8 9 10
Production sophistication
Workforce employed%

25
Trade and Agriculture Directorate | Organisation for Economic Co-operation and Development (OECD) | www.oecd.org/tad | [email protected]
Policy influences on GVC participation
OECD Trade and Agriculture Directorate 25
-0.04 -0.02 0 0.02 0.04
Distance
GDP/capita
Tariffs charged
Ag Land (sq. km)
SPS charged (L1)
TBT charged (L3)
RTA export share
RTA import share
Finance
Primary edu
Transport infrast.
Food safety
Ag R&D intensity
FDI (inflow)
Customs
Backward
-0.5 0 0.5 1
GDP/capita
Ag R&D intensity
Tariffs faced
TBT faced (L2)
SPS faced (L1)
Distance
RTA import share
Finance
Food safety
RTA export share
Transport infrast.
Primary edu
Customs
Ag Land (sq. km)
FDI (outflow)
Forward
Market size increases domestic sourcing and shift to final products
Trade facilitation important
Trade policies important
So too are aspects of the enabling environment
Effect on standardised coefficients: direction of effect is important, not size
26
Trade and Agriculture Directorate | Organisation for Economic Co-operation and Development (OECD) | www.oecd.org/tad | [email protected]
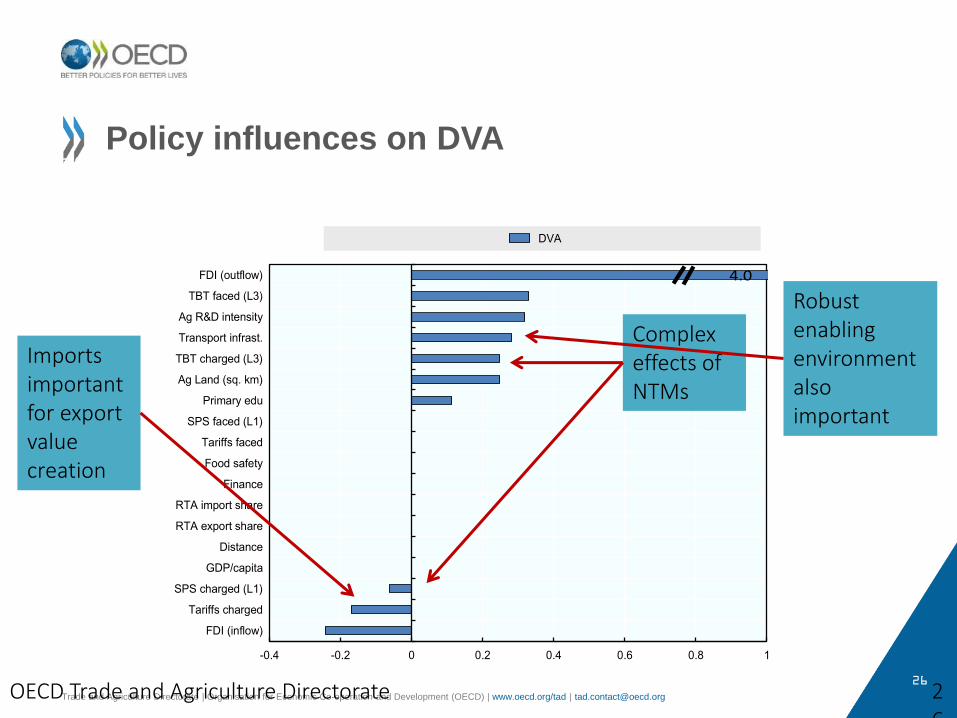
Policy influences on DVA
OECD Trade and Agriculture Directorate 26
Effect on standardised coefficients: direction of effect is important, not size
4.0
-0.4 -0.2 0 0.2 0.4 0.6 0.8 1
FDI (inflow)
Tariffs charged
SPS charged (L1)
GDP/capita
Distance
RTA export share
RTA import share
Finance
Food safety
Tariffs faced
SPS faced (L1)
Primary edu
Ag Land (sq. km)
TBT charged (L3)
Transport infrast.
Ag R&D intensity
TBT faced (L3)
FDI (outflow)
DVA
Imports important for export value creation
Complex effects of NTMs
Robust enabling environment also important

27
Trade and Agriculture Directorate | Organisation for Economic Co-operation and Development (OECD) | www.oecd.org/tad | [email protected]
Which sectors contribute to agro-food exports?
OECD Trade and Agriculture Directorate
0
0.01
0.02
0.03
0.04
0.05
0.06
0.07
0.08
0.09
0.1
-0.2 0 0.2 0.4 0.6 0.8 1 1.2
Services share Own industry share Industrial share Other agriculture share Other food share
Contribution to value added in exports
Proportion of total country-sectors
Negative value added in ag and food = policy risk
Shows the distribution of shares in agro-food export value of domestic value added created by specific sectors
Most usually generated in the industry itself
Other ag and other food industries next most important
Service share greater than industrial
Share of export DVA
28
Trade and Agriculture Directorate | Organisation for Economic Co-operation and Development (OECD) | www.oecd.org/tad | [email protected]
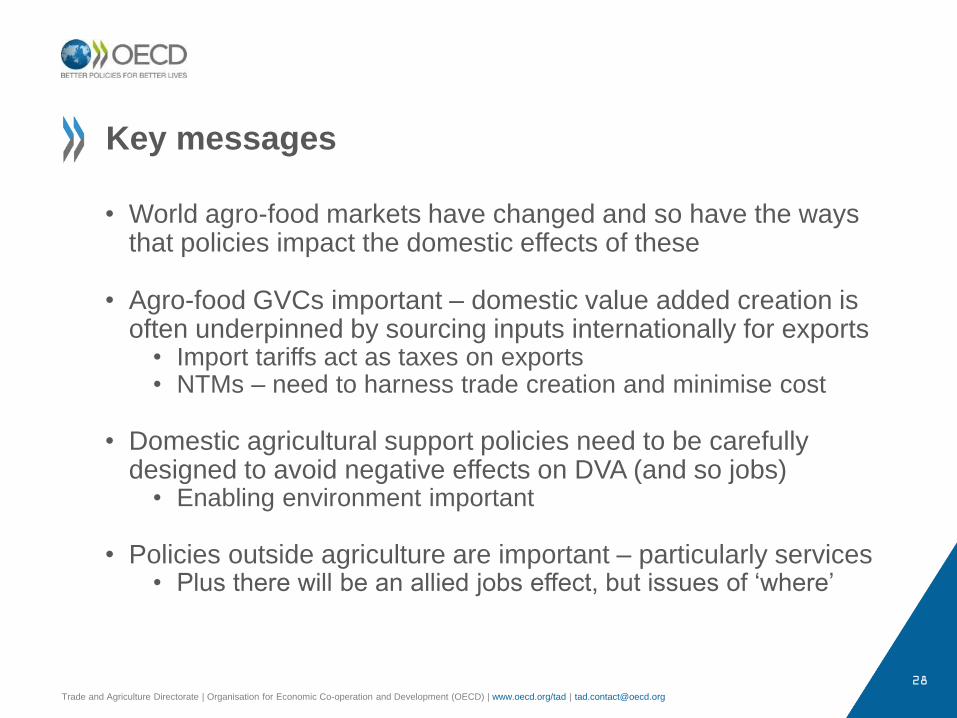
Key messages
• World agro-food markets have changed and so have the ways that policies impact the domestic effects of these
• Agro-food GVCs important – domestic value added creation is often underpinned by sourcing inputs internationally for exports
• Import tariffs act as taxes on exports • NTMs – need to harness trade creation and minimise cost
• Domestic agricultural support policies need to be carefully
designed to avoid negative effects on DVA (and so jobs) • Enabling environment important
• Policies outside agriculture are important – particularly services
• Plus there will be an allied jobs effect, but issues of ‘where’

29 29 29
Trade and Agriculture Directorate | Organisation for Economic Co-operation and Development (OECD) | www.oecd.org/tad | [email protected]
Access all of the
information from the
Trade & Agriculture
Directorate at:
www.oecd.org/tad
You can reach us via
e-mail by sending your
message to the following
address:
We invite you to connect
with us on Twitter by
following:
@OECDagriculture
We look forward to hearing from you!
Contact us