Embed Size (px)
Citation preview

Values Compatibility Analysis: Integrating Landscape Values and Special Places in a National Forest Planning Decision Support System
Extended Abstract
Greg Brown and Pat Reed1
The challenge of national forest decision-making: National forest planning is a process often marked by conflicting values and ambiguous or contested goals at multiple scales of analysis. The traditional rational-comprehensive forest planning model has not often performed well under these conditions, particularly when such values have no ready means of quantification. The U.S. Forest Service, responsible for developing and implementing national forest plans, currently lacks formal protocols to cope with these “wicked” value-related, and often place-based planning issues. Since inception of the requirement to develop forest management plans under the National Forest Management Act (1976), there has been little, if any, practical advancement in (1) systematic inventory and mapping of place-specific values the public attaches to national forests, or (2) rigorous and replicable quantitative analysis of place-specific value data in spatial modeling to assess forest plan decisions for consistency with public values—much less in a manner that is helpful to most forest planners and capable of withstanding legal challenges in the NEPA process.
Review of previous work: In the late 1990’s, social researchers developed public participatory geographic information system (PPGIS) methods (see Sieber, 2006 for PPGIS review) to explicitly measure the spatial distribution of various landscape values using a variety of spatial techniques (Brown, 2005). In an early application, Brown and Reed (2000) asked individuals to identify to the location of landscape values such as aesthetic, recreation, economic, and ecological values, in addition to more indirect, and symbolic landscape values such as spiritual and intrinsic values as part of the Chugach National Forest (U.S.A.) forest plan planning process. The set of spatial attributes to measure was based on a forest values typology adapted from Rolston and Coufal (1991). Reed and Brown (2003) subsequently developed a quantitative modeling approach using the PPGIS mapped landscape values data to determine whether forest plan management alternatives were generally consistent, and more important, place-consistent with publicly held forest values (see Kruger 2008 GTR for summary of Chugach case study). This method was initially called “values suitability analysis” in deference to its conceptual similarity to traditional physical land suitability analysis but was later called “values compatibility analysis” (VCA) as applied to national forest planning.
Based on the initial success of the landscape values data collection method and the promise of VCA modeling, additional PPGIS research was conducted by Brown and colleagues in a number of studies in Alaska and Australia. The second application focused on marine and coastal areas in Prince William Sound (Alaska). The purpose of this study was to help NGOs develop a conservation strategy for protection of the Sound by identifying conservation “hotspots”. Subsequent analysis of the spatial values data provided opportunities to compare “expert” with “lay” or public conservation priorities (Brown et al., 2004).
Additional applications of the PPGIS methods identified the location of highway corridor values in Alaska to assist in the designation, planning, and management of national scenic byways (Brown, 2003), the measurement of landscape values and special places in Kenai
1 Greg Brown is Environmental Studies Program Director, Central Washington University, Ellensburg, WA 98926. Pat Reed is Alaska Region Social Scientist, USDA Forest Service, 3301 C Street, Anchorage, AK 99503.

Peninsula coastal areas in Alaska to identify “coupled social-ecological” hotspots (SES) where human and biophysical systems are closely linked (Alessa et al., 2008), the measurement of preferences for tourism and residential development on Kangaroo Island, a popular tourism destination in South Australia (Brown, 2006), the identification of priority areas for conservation in the Otways Region of Victoria, Australia (Raymond and Brown, 2007) and the Murray River corridor in Australia (Pfeuller et al., 2006), and the measurement of park and open space values in Anchorage, Alaska for the purposes of park and open space planning (Brown, 2008). Additional PPGIS studies that mapped landscape values and special place methodology were completed by doctoral students Nielsen-Pincus (cite ISSRM abstract) and Jessica Clements (cite ISSRM abstract) at the University of Idaho and Colorado State University respectively.
Using the Brown (2005) landscape value spatial mapping method as a model, researchers with the Canadian Forest Service designed and developed the first internet-based participatory mapping application to collect data on the locations of forest landscape values across a 2.4 million ha study area in the province of Alberta, Canada (Beverly et al., 2008). Three additional internet-based PPGIS landscape value and special place mapping studies were completed for national forests in the western U.S. in 2006 and 2007 (Landscape Values Institute, 2008).
While the PPGIS methods that map landscape values and special places are best characterized as applied research for land use and forest planning, the method has also contributed to theory development and validation. For example, the method has been used to validate the presence of spatial discounting of environmental resources (Brown et al., 2002), the development of a theory of urban park geography (Brown, 2008), and the development of proxy measures and indices for scale-based place attachment (see Williams and Vaske, 2003) that provide place-based information to assess the risk associated with landscape modification (Brown and Raymond, 2007).
Landscape values and special places operationalizaton. The human valuing process is complex with multiple meanings of the “value” concept. Brown (1984) classified the realm of values into three categories: held values, relationship values, and assigned values with preference relationships providing a linkage between held and assigned values. In the operationalization of landscape values and special places through PPGIS, individuals express preference relationships that link their held values with values assigned to the study landscape such as a national forest. Brown’s (1984) conception of the human valuing process appears consistent with the transactional concept of human-landscape relationships (Zube 1987) where humans are active participants in the landscape—thinking, feeling and acting—leading to the attribution of meaning and the valuing of specific landscapes and places. In the PPGIS process, we have not attempted to parse the influence of held values (based on life experiences) from assigned values (based on object attributes) as the process of mapping landscape values and special places through PPGIS is best viewed as holistic. The landscape value and special place maps that result from aggregated public or interest group responses represent a mix of preferential values that exhibit some degree of collective, spatial consistency, despite a high degree of spatial variation on an individual basis. The analogy of Surowiecki’s (2004) “wisdom of crowds” is appropriate here in observing that that a diverse collection of independently-deciding individuals in the PPGIS process can produce collective spatial information that is better than individuals or even experts.
The values compatibility analysis (VCA) process. The analysis of landscape values can be schematically mapped into five domains (see Figure 1): 1) the relationship among landscape values, 2) the relationship between landscape values and forest management activities and/or policies, 3) the modeling of compatibility with existing or prospective forest plans, 4) the
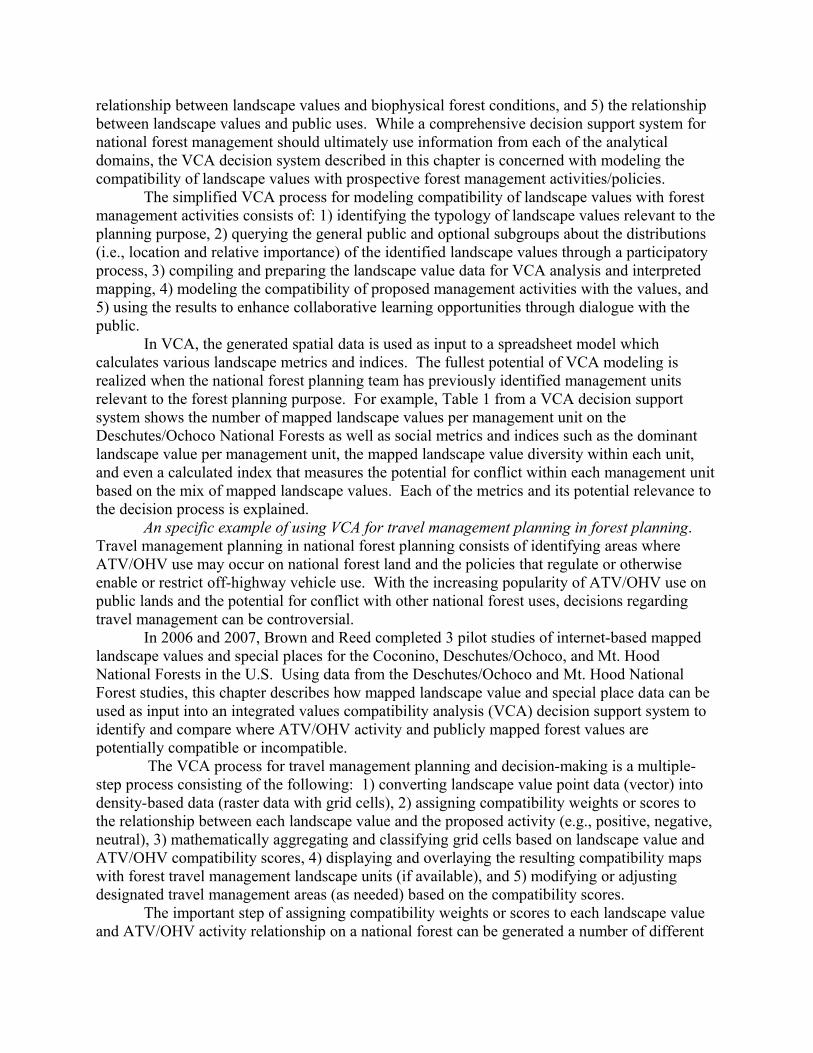
relationship between landscape values and biophysical forest conditions, and 5) the relationship between landscape values and public uses. While a comprehensive decision support system for national forest management should ultimately use information from each of the analytical domains, the VCA decision system described in this chapter is concerned with modeling the compatibility of landscape values with prospective forest management activities/policies.
The simplified VCA process for modeling compatibility of landscape values with forest management activities consists of: 1) identifying the typology of landscape values relevant to the planning purpose, 2) querying the general public and optional subgroups about the distributions (i.e., location and relative importance) of the identified landscape values through a participatory process, 3) compiling and preparing the landscape value data for VCA analysis and interpreted mapping, 4) modeling the compatibility of proposed management activities with the values, and 5) using the results to enhance collaborative learning opportunities through dialogue with the public.
In VCA, the generated spatial data is used as input to a spreadsheet model which calculates various landscape metrics and indices. The fullest potential of VCA modeling is realized when the national forest planning team has previously identified management units relevant to the forest planning purpose. For example, Table 1 from a VCA decision support system shows the number of mapped landscape values per management unit on the Deschutes/Ochoco National Forests as well as social metrics and indices such as the dominant landscape value per management unit, the mapped landscape value diversity within each unit, and even a calculated index that measures the potential for conflict within each management unit based on the mix of mapped landscape values. Each of the metrics and its potential relevance to the decision process is explained.
An specific example of using VCA for travel management planning in forest planning. Travel management planning in national forest planning consists of identifying areas where ATV/OHV use may occur on national forest land and the policies that regulate or otherwise enable or restrict off-highway vehicle use. With the increasing popularity of ATV/OHV use on public lands and the potential for conflict with other national forest uses, decisions regarding travel management can be controversial.
In 2006 and 2007, Brown and Reed completed 3 pilot studies of internet-based mapped landscape values and special places for the Coconino, Deschutes/Ochoco, and Mt. Hood National Forests in the U.S. Using data from the Deschutes/Ochoco and Mt. Hood National Forest studies, this chapter describes how mapped landscape value and special place data can be used as input into an integrated values compatibility analysis (VCA) decision support system to identify and compare where ATV/OHV activity and publicly mapped forest values are potentially compatible or incompatible.
The VCA process for travel management planning and decision-making is a multiple-step process consisting of the following: 1) converting landscape value point data (vector) into density-based data (raster data with grid cells), 2) assigning compatibility weights or scores to the relationship between each landscape value and the proposed activity (e.g., positive, negative, neutral), 3) mathematically aggregating and classifying grid cells based on landscape value and ATV/OHV compatibility scores, 4) displaying and overlaying the resulting compatibility maps with forest travel management landscape units (if available), and 5) modifying or adjusting designated travel management areas (as needed) based on the compatibility scores.
The important step of assigning compatibility weights or scores to each landscape value and ATV/OHV activity relationship on a national forest can be generated a number of different

ways—by forest planning personnel, by “expert” panels such as a group of District Rangers, or by a survey of the general public. The resulting maps based on the value/activity compatibility scores show areas on the national forest where ATV activity appears compatible or incompatible with perceived landscape values. This modeling process can be repeated for most of the prospective uses of national forest land. Figure 2 below shows the type of compatibility map that can be generated for national forest units. In this case, the map in Figure 2 shows ATV/OHV compatibility for the Deschutes/Ochoco National Forest in Oregon based on a set of perceived landscape value and ATV/OHV compatibility relationships. The compatibility scores used to generate Figure 2 were based on analyst judgment, but the compatibility scores can and should be derived from a variety on sources including Forest Service personnel, interest groups, and the general public. The use of color in mapping is helpful to show the continuum or gradient of activity/value compatibility scores. Figure 3 shows an aggregate ATV/OHV compatibility map for the Mt. Hood national forest that is based on value/activity perceptions solicited from Forest Service personnel (n=28) collected at a series of training workshops. Forest service personnel were asked to rate the general compatibility of ATV/OHV use with each landscape value on a scale that ranged from -5 (highly incompatible) to +5 (high incompatible). A score of 0 would indicate no obvious relationship between the landscape value and ATV/OHV activity.
Figure 4 shows color-coded, aggregate landscape compatibility scores overlaid with two proposed ATV/OHV designated areas on the Mt. Hood national forest, “Rock Creek” and “McCubbins”. Landscape value compatibility scores are color-coded from reds (incompatible) to greens (compatible). The potential value of such a compatibility map is immediately apparent from the overlay map. There appear to be few obvious value/activity compatibility concerns within the McCubbins designated ATV/OHV area. However, in the proposed Rock Creek area, ATV/OHV activity appears compatible with the mix of landscape values in the eastern reach of the unit, but incompatible with landscape values in the western reach of the unit. Forest planners should attempt to more fully understand the nature of the incompatibility relationship by examining the specific quantity and mix of landscape values and forest features located in the eastern section of the area. A decision to allow ATV/OHV use could result in significant forest user conflict, depending on the specific sources of the landscape value incompatibility scores. Assumptions about the landscape value/forest activity relationships used in the VCA decision support system can be easily changed to perform sensitivity analysis to show how widely the model results may—or may not—vary by value/activity assumptions, by geographic area, community, population demographic, or management unit of analysis. The VCA decision support system can operate at multiple spatial scales.
Applications and constraints of VCA as decision-support system. Decision support systems based on systematic mapping of landscape values and special places provide forest planners, local communities, first nations, special interest groups, and other stakeholders a useful starting point for a participatory and iterative planning process to develop and revise forest plans. Because the VCA decision support system provides data that is place-specific, includes both tangible and intangible forest values, accounts for local and regional ‘sense of place’ values, it offers significant advantages over the present, ad hoc system of soliciting place-based values through forest planning participatory process that is non-systematic, voluntary, and non-representative of the multiple publics that have an interest in national forest management outcomes.
But the development and implementation of national forest system-wide protocol for mapping landscape values and special faces some formidable constraints that appear more

administrative and political than technical. The list of constraints includes, but is not limited to the lack of specific agency directives, the cost of developing and implementing the VCA protocol, the Office of Management and Budget (OMB) review process for collecting data, the lack of agency experience in working with landscape value and special place data, the public acceptability of using this type of data for forest planning, and the uncertain legal implications of planning decisions that reference landscape value data. Each of the constraints will be examined in detail.
We conclude with a discussion of important questions about the use of PPGIS in a national forest decision support system. These questions sustain and explicate a line of critique about PPGIS methods in general: who are the participants and what is their level of access to the process; is the GIS technology culturally appropriate and does it capture the type of knowledge that is essential to the forest management decision(s) to be made; and how inclusive, representative, and scale-appropriate is the forest management decision process?

References
Alessa, N., Kliskey, A., and G. Brown. 2008. Social-ecological hotspots mapping: a spatial approach for identifying coupled social-ecological space. Landscape and Urban Planning. 85(1):27-39.
Beverly, Jennifer L., Uto, Kinga, Wilkes, J. and P. Bothwell. 2008. Assessing spatial attributes of forest landscape values: an internet-based participatory mapping approach. Canadian Journal of Forest Research. 38:289-303.
Brown, G. and P. Reed. 2000. Validation of a forest values typology for use in national forest planning. Forest Science 46(2):240-247.
Brown, G., P. Reed, and C.C. Harris. 2002. Testing a Place-Based Theory for Environmental Evaluation: an Alaska Case Study. Applied Geography. 22(1):49-77.
Brown, G. 2003. A Method for Assessing Highway Qualities to Integrate Values in Highway Planning. Journal of Transport Geography 11(4):271-283.
Brown, G., C. Smith, L. Alessa, and A. Kliskey. 2004. A comparison of perceptions of biological value with scientific assessment of biological importance. Applied Geography 24(2):161-180.
Brown, G. 2005. Mapping Spatial Attributes in Survey Research for Natural Resource Management: Methods and Applications. Society & Natural Resources 18(1):1-23.
Brown, G. and L. Alessa. 2005. A GIS-based Inductive Study of Wilderness Values. International Journal of Wilderness 11(1):14-18.
Brown, G. 2006. Mapping Landscape Values and Development Preferences: A Method for Tourism and Residential Development Planning. International Journal of Tourism Research 8:101-113.
Brown, G. and C. Raymond. 2007. The relationship between place attachment and landscape values: Toward Mapping Place Attachment. Applied Geography. 27:89-111.
Brown, G. 2008. A theory of urban park geography. Accepted for publication in Journal of Leisure Research. Expected publication 4th issue 2008.
Brown, T.C. 1984. The concept of value in resource allocation. Land Economics. 60(3):231-246.
Landscape Values Institute. 2008. www.landscapevalues.org
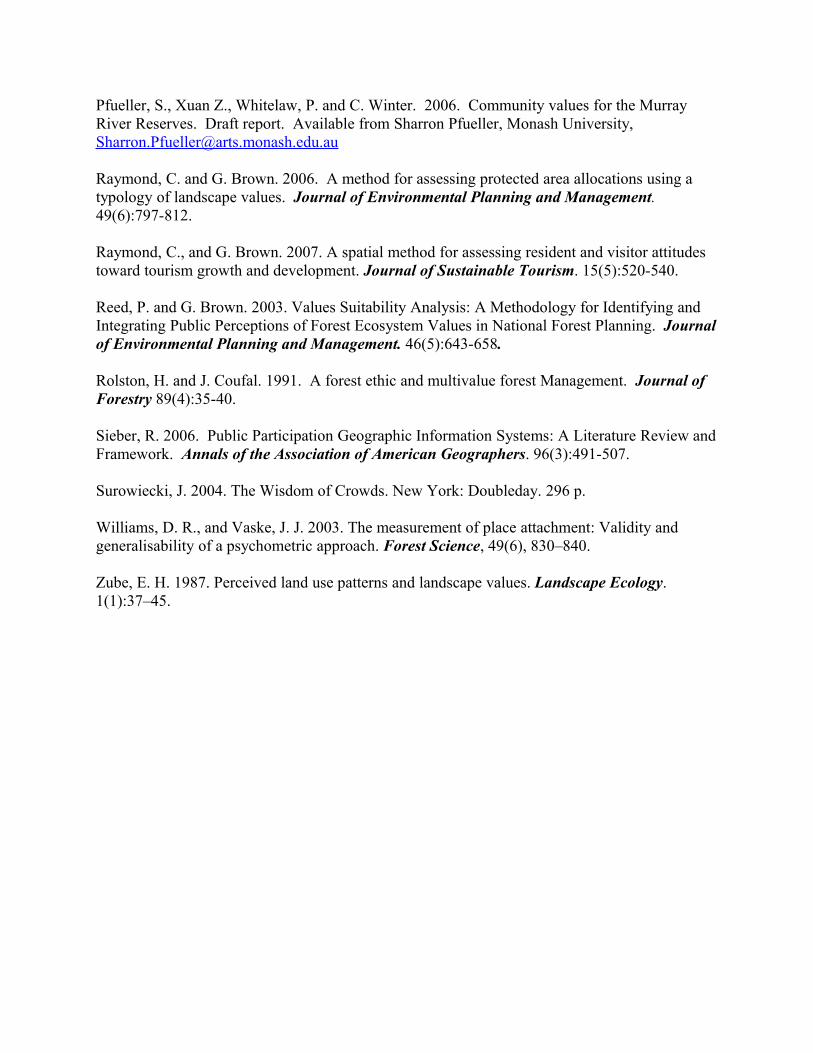
Pfueller, S., Xuan Z., Whitelaw, P. and C. Winter. 2006. Community values for the Murray River Reserves. Draft report. Available from Sharron Pfueller, Monash University, [email protected]
Raymond, C. and G. Brown. 2006. A method for assessing protected area allocations using a typology of landscape values. Journal of Environmental Planning and Management. 49(6):797-812.
Raymond, C., and G. Brown. 2007. A spatial method for assessing resident and visitor attitudes toward tourism growth and development. Journal of Sustainable Tourism. 15(5):520-540.
Reed, P. and G. Brown. 2003. Values Suitability Analysis: A Methodology for Identifying and Integrating Public Perceptions of Forest Ecosystem Values in National Forest Planning. Journal of Environmental Planning and Management. 46(5):643-658.
Rolston, H. and J. Coufal. 1991. A forest ethic and multivalue forest Management. Journal of Forestry 89(4):35-40.
Sieber, R. 2006. Public Participation Geographic Information Systems: A Literature Review and Framework. Annals of the Association of American Geographers. 96(3):491-507.
Surowiecki, J. 2004. The Wisdom of Crowds. New York: Doubleday. 296 p.
Williams, D. R., and Vaske, J. J. 2003. The measurement of place attachment: Validity and generalisability of a psychometric approach. Forest Science, 49(6), 830–840.
Zube, E. H. 1987. Perceived land use patterns and landscape values. Landscape Ecology. 1(1):37–45.

Table 1. Display of VCA decision support system landscape value metrics by landscape unit for Deschutes/Ochoco National Forest. VCA ACCOUNTANT LITE © 2007Deschutes-Ochoco Natl Forest OregonTravel Management PlanP. Reed 6/13/2007TABLE C--DIAGNOSTIC STATISTICS BY LANDSCAPE UNIT
(Weighted) n = 322Note:
Landscape Unit
Value Sum (Absolute)
Value Sum Percent (P1)
Index of Total Possible
Points
Value Sum Percent (P2)
Index of Total Sample Points Dominant Value
Value Dominance (D1) Index (Absolute)
Value Frequency (F) Index
(Relative to Mean)
Value Density (D2) Index (Absolute)
Value Identity (I) Index
(Absolute)
Value Diversity (D3) Index (Absolute)
(D3 Index Pct "More/Less
Diverse" than Mean D3)
Value Conflict Potential (C)
Index (Absolute)
Value Uniqueness
(U) Index (Relative)
Composite Values At Risk
(R1) Index
Pct of Total 0.000 = Min 1.000 = Mean Points 0.000 = Min 0.000 = Min 0.000 = Min 0.000 = Min 0.000 = Min
Landscape Unit Acreage Hectares Sq MilesPct of Total
Acreage 1.000 = Max per Acre 1.000 = Max 1.000 = Max 1.000 = Max 1.000 = Max 1.000 = Max
1 Crescent 233,428 94,238 365 10.8 604 2.605 7.879 Recreation 0.125 1.418 0.00259 0.927 0.952 -1.2 0.571 0.618 0.4582 East Fort Rock Trail 111,941 45,192 175 5.2 259 1.117 3.379 Recreation 0.122 0.608 0.00231 0.862 0.939 -4.3 0.568 0.676 0.0003 East Sisters 45,146 18,226 71 2.1 160 0.690 2.087 Economic 0.045 0.376 0.00354 0.859 0.968 2.4 0.501 0.882 0.000
4 Grassland East 78,097 31,529 122 3.6 310 1.337 4.044 Recreation 0.175 0.728 0.00397 0.942 0.984 6.4 0.560 0.618 0.0425 Grassland West 18,028 7,278 28 0.8 194 0.837 2.531 Recreation 0.276 0.456 0.01076 0.888 0.982 5.7 0.597 0.676 0.000
6 Hole in the Ground 195,902 79,088 306 9.0 120 0.518 1.565 Historic 0.400 0.282 0.00061 0.857 0.976 4.3 0.567 0.882 0.000
7 Horse Butte 95,633 38,608 149 4.4 114 0.492 1.487 Recreation 0.125 0.268 0.00119 0.912 0.977 4.7 0.561 0.618 0.0008 Lakes 411,859 166,273 644 19.0 1,259 5.430 16.423 Recreation 0.239 2.956 0.00306 0.923 0.956 -0.3 0.550 0.647 0.5009 Lava Cast 50,063 20,211 78 2.3 96 0.414 1.252 Learning 0.077 0.225 0.00192 0.896 0.981 5.6 0.567 0.941 0.000
10 Maurys 61,772 24,938 97 2.8 277 1.195 3.613 Prim Recreation 0.086 0.650 0.00448 0.909 0.989 7.5 0.591 0.765 0.00011 Meadow Lakes 22,617 9,131 35 1.0 122 0.526 1.591 Recreation 0.529 0.286 0.00539 0.802 0.903 -11.9 0.510 0.559 0.000
12 Monument 55,123 22,254 86 2.5 484 2.088 6.314 Recreation 0.242 1.136 0.00878 0.842 0.944 -3.2 0.508 0.647 0.37513 North Sisters 104,097 42,025 163 4.8 957 4.128 12.484 Wilderness 0.171 2.247 0.00919 0.917 0.971 3.1 0.553 0.853 0.50014 Ochoco East 366,461 147,945 573 16.9 1,226 5.288 15.993 Prim Recreation 0.251 2.879 0.00335 0.930 0.962 1.0 0.578 0.735 0.500
15 Ochoco West 157,753 63,687 246 7.3 545 2.351 7.109 Prim Recreation 0.053 1.280 0.00345 0.907 0.971 3.1 0.617 0.824 0.37516 River Group 1,585 640 2 0.1 229 0.988 2.987 Recreation 0.220 0.538 0.14448 0.867 0.946 -2.5 0.479 0.676 0.00017 Sunflower 26,852 10,841 42 1.2 41 0.177 0.535 Economic 0.125 0.096 0.00153 0.762 0.899 -12.6 0.522 0.853 0.00018 Three Creeks 131,654 53,151 206 6.1 669 2.886 8.727 Aesthetic 0.143 1.571 0.00508 0.885 0.937 -4.7 0.588 0.853 0.4581920
2122232425
Total 2,168,011 875,257 3,388 100.0 7,666 33.066 100.000 Recreation 3.405 18.000 0.21570 --- --- --- --- --- ---Mean 120,445 48,625 188 5.6 426 1.837 5.556 --- 0.189 1.000 0.01198 0.883 0.958 0.0 0.555 0.740 0.178Maximum 411,859 166,273 644 19.0 1,259 5.430 16.423 --- 0.529 2.956 0.14448 0.942 0.989 7.5 0.617 0.941 0.500Minimum 1,585 640 2 0.1 41 0.177 0.535 --- 0.045 0.096 0.00061 0.762 0.899 -12.6 0.479 0.559 0.000Range 410,274 165,633 641 18.9 1,218 5.254 15.888 --- 0.484 2.860 0.14387 0.180 0.090 20.1 0.139 0.382 0.500Acreage-Value Sum Rank Correlation 0.638 Critical r value: 0.591
All Groups
By Community Locale Group

Figure 2. Model of ATV use compatibility with mapped forest landscape values and special places on Deschutes and Ochoco National Forests (Oregon). Compatibility scores range from compatible (dark blue) to incompatible (dark red).

Figure 3. Model of ATV use compatibility with mapped forest landscape values and special places on Mt. Hood National Forest (Oregon). Compatibility scores range from compatible (dark green) to incompatible (dark red).
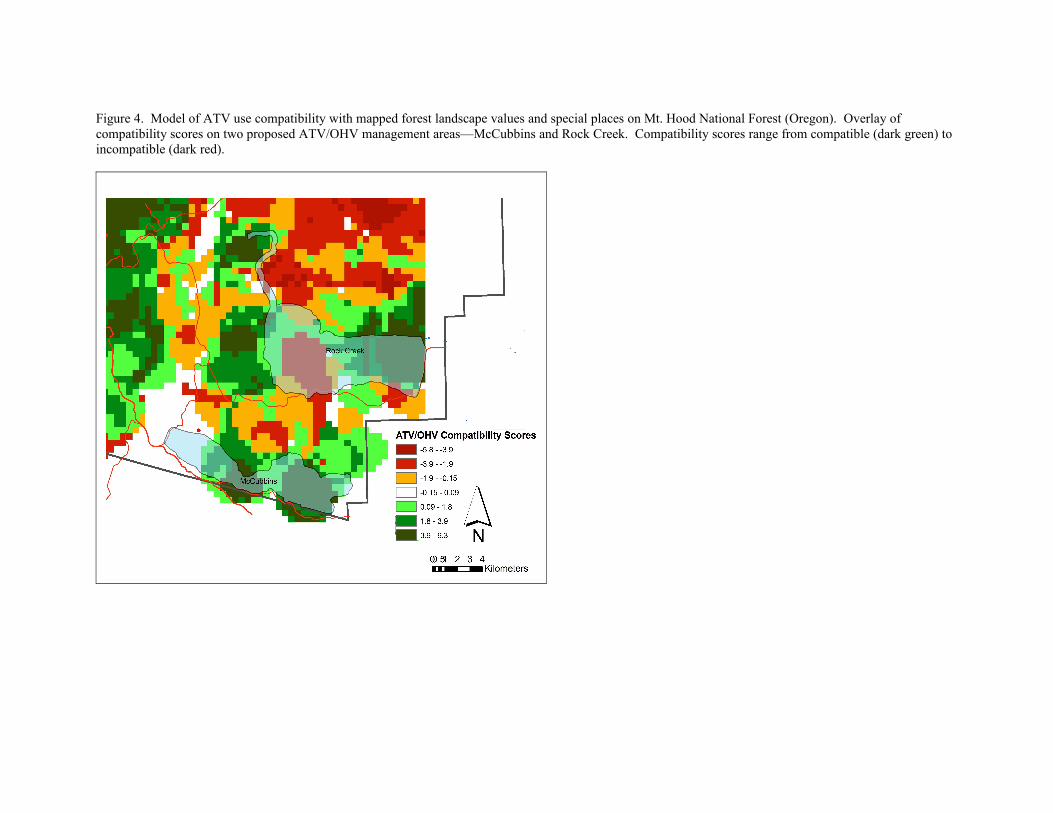
Figure 4. Model of ATV use compatibility with mapped forest landscape values and special places on Mt. Hood National Forest (Oregon). Overlay of compatibility scores on two proposed ATV/OHV management areas—McCubbins and Rock Creek. Compatibility scores range from compatible (dark green) to incompatible (dark red).

Figure 1. Schematic diagram of landscape values analysis.