Embed Size (px)
Citation preview
Inclusive and Sustainable Industrial Development Working Paper Series WP 18 | 2019
THE CHALLENGE OF DIGITALIZATION FOR FIRMS IN DEVELOPING COUNTRIES

DEPARTMENT OF POLICY, RESEARCH AND STATISTICS
WORKING PAPER 18/2019
The challenge of digitalization for firms in developing
countries
Mario Pianta Scuola Normale Superiore, Dipartimento di scienze politico-sociali, Firenze
UNITED NATIONS INDUSTRIAL DEVELOPMENT ORGANIZATION
Vienna, 2019

Acknowledgments
Section 3 of this paper is based on ongoing work with Antonello Zanfei and Andrea Coveri of the
University of Urbino on FDI patterns and digitalization using the FDImarkets database (Zanfei,
Coveri, Pianta, 2019). Section 4 draws on joint work with Jelena Reljic on the World Bank
Innovation Surveys. I thank Nicola Cantore and UNIDO staff for comments and suggestions
throughout the work for this paper.
This is a Background Paper for the UNIDO Industrial Development Report 2020: Industrializing
in the Digital Age.
The designations employed, descriptions and classifications of countries, and the presentation of the
material in this report do not imply the expression of any opinion whatsoever on the part of the Secretariat
of the United Nations Industrial Development Organization (UNIDO) concerning the legal status of any
country, territory, city or area or of its authorities, or concerning the delimitation of its frontiers or
boundaries, or its economic system or degree of development. The views expressed in this paper do not
necessarily reflect the views of the Secretariat of the UNIDO. The responsibility for opinions expressed
rests solely with the authors, and publication does not constitute an endorsement by UNIDO. Although
great care has been taken to maintain the accuracy of information herein, neither UNIDO nor its member
States assume any responsibility for consequences which may arise from the use of the material. Terms
such as “developed”, “industrialized” and “developing” are intended for statistical convenience and do not
necessarily express a judgment. Any indication of, or reference to, a country, institution or other legal entity
does not constitute an endorsement. Information contained herein may be freely quoted or reprinted but
acknowledgement is requested. This report has been produced without formal United Nations editing.

iii
Table of Contents
1 Digitalization in global industry ............................................................................................... 1
1.1 The rise of Industry 4.0 ...................................................................................................... 1
1.2 Industry 4.0, technology and emerging countries .............................................................. 4
2 Technological capabilities and the trajectories of firms in emerging countries ....................... 5
2.1 Mapping the capabilities of firms in emerging countries .................................................. 5
2.2 Evidence on innovation in emerging countries .................................................................. 8
2.3 Stylized facts on innovation in emerging countries ......................................................... 10
2.4 From innovation to Industry 4.0 ...................................................................................... 12
2.5 A typology of emerging country firms in the face of digitalization ................................ 13
3 Foreign direct investment in emerging countries ................................................................... 16
3.1 Foreign direct investment projects in highly innovative and digital activities in emerging
countries ........................................................................................................................... 16
3.2 The distribution of FDI projects by region, industry, business activity ........................... 20
3.3 The specialization of regions in highly innovative and digital activities ......................... 26
3.4 FDI originating from emerging countries ........................................................................ 31
3.5 Summary of the evidence ................................................................................................ 34
4 Innovation and digitalization in emerging country firms ....................................................... 35
4.1 Grouping of firms based on their innovation and digital activities .................................. 37
4.2 Size and industry characteristics of the group of firms .................................................... 45
4.3 Technological and employment performance of firm grouping ...................................... 51
4.4 Innovation and digitalization in India .............................................................................. 56
4.5 Matching innovation and enterprise surveys ................................................................... 59
4.6 Summing up the evidence ................................................................................................ 72
5 Conclusions ............................................................................................................................ 72
5.1 Insights from the analysis of FDI projects and innovation surveys ................................. 72
5.2 The prospects for emerging country firms in the face of digitalization ........................... 75
Bibliography ................................................................................................................................ 79
Appendix ..................................................................................................................................... 86

iv
List of Figures
Figure 1: Two trajectories of technological capabilities: R&D and acquisition of new machinery
in selected countries .................................................................................................... 10
Figure 2: A typology of firms in emerging countries. Their position in the global economy and in
technological development ........................................................................................... 15
Figure 3: ICT intensity in industries............................................................................................ 18
Figure 4: Grouping of firms with innovative and digital activities ............................................. 40
Figure 5: High-technology exports for selected countries .......................................................... 44
Figure 6: ICT intensity in industries............................................................................................ 47
Figure 7: Share of firms introducing product innovations in Europe, ranking of industries ....... 48
Figure 8: Innovation groupings by share of firms in digital industries and size in India ............ 61
Figure 9: Innovation groupings by share of firms in digital industries and share of firms with
patents in India ............................................................................................................ 63
Figure 10: Innovation groupings by share of firms with patents and share of firms with foreign
technology licensing in India .................................................................................... 63
Figure 11: Innovation groupings by share of firms in digital industries and share of exporting
firms in India ............................................................................................................. 64
Figure 12: Innovation groupings by share of firms with foreign technology licensing and share of
exporting firms in India ............................................................................................. 65
Figure 13: Innovation groupings by share of firms in digital industries and share of firms where
product innovation has led to an increase in high and low skill employees in India 67
Figure 14: Innovation groupings by share of firms with foreign technology licensing and share of
firms in which product innovation has led to an increase in high skilled labour in India
................................................................................................................................... 68
Figure 15: Innovation groupings by share of exporting firms and share of firms in which product
innovation has led to an increase in skilled employees in India ................................ 69
Figure 16: Innovation groupings by share of firms in digital industries and level of exports per
employee in India ...................................................................................................... 70
Figure 17: Innovation groupings by share of exporting firms and level of exports per employee in
India ........................................................................................................................... 71
Figure 18: Innovation and FDI performance in India ................................................................. 74
Figure 19: Relationship between typology of emerging country firms and the analysis of FDI and
innovative activities ................................................................................................... 76

v
List of Tables
Table 1: Definition of technologies of the 4th Industrial Revolution............................................ 2
Table 2: The sectoral breakdown of FDI projects in digital-intensive industries ....................... 19
Table 3: Number of FDI projects by industry and region of FDI destination ............................. 22
Table 4: Capital investment of FDI projects by industry and region of FDI destination, in USD
million ......................................................................................................................................... 23
Table 5: Number of FDI projects by type of activity and region of FDI destination .................. 24
Table 6: Capital investment of FDI projects by type of activity and region of FDI destination . 25
Table 7: Number of FDI projects by industry. Specialization indexes of regions of FDI destination
..................................................................................................................................................... 27
Table 8: Number of FDI projects by type of activity, Specialization indexes of regions of FDI
destination ................................................................................................................................... 29
Table 9: FDI projects in emerging countries by type of activity and by industry ....................... 30
Table 10: FDI projects from emerging countries by industry and region of FDI destination ..... 32
Table 11: FDI projects from emerging countries by type of activity and region of FDI destination
..................................................................................................................................................... 33
Table 12: Grouping of firms with innovative and digital activities in emerging countries ......... 41
Table 13: Grouping of firms with innovative and digital activities in manufacturing only ........ 43
Table 14: Firms in the innovation and digital group by size ....................................................... 45
Table 15: Firms in the innovation and digital groupings by industry ......................................... 50
Table 16: Patents for new products by firms in the innovation and digital firm groups ............. 52
Table 17: Impact on skilled employment among firms as a consequence of product innovation54
Table 18: Impact on unskilled employment among firms as a consequence of product innovation
..................................................................................................................................................... 55
Table 19: India, digitalization and innovative activities ............................................................. 57
Table 20: List of variables for enterprise analysis, India, 2013-2014 ......................................... 60
Table 21: Innovation and digital groupings, average values of selected variables, India, 2013-
2014 ............................................................................................................................................. 61
Table 22: Innovation and digital groupings, number and share of firms in each industry in India
..................................................................................................................................................... 86
Table 23: Industry classification ISIC Rev. 3.1 .......................................................................... 88
Table 24: The NACE classification of economic activities, Rev.2, 2-digit level ........................ 89
vi
Abstract
The challenge of digitalization and Industry 4.0 for firms in emerging countries is examined in
this paper, considering technological trajectories and the degree of integration in the global
economy. A conceptual framework is proposed, with a typology of emerging countries’ firms
based on their technological capabilities, their potential for digitalization, their presence in global
markets and global value chains, and their involvement with foreign direct investment. Two
empirical investigations are carried out. The first concerns the flows of FDI projects in emerging
countries—based on the FDImarkets database—in digital-related industries and in high skill
activities – R&D, design, ICTs. The second analysis investigates the patterns of innovation in a
group of emerging economies using World Bank data on Innovation Surveys that allow
identifying different groups of firms on the basis of their technological capabilities, innovative
activities and their potential for digitalization.
The findings highlight the technological hierarchy among emerging countries’ firms and the
opportunities for upgrading and moving closer to digitalization and Industry 4.0. The rather large
number of product innovating firms in emerging economies represents the base for the emergence
of enterprises with greater technological competences, potential entrants in global markets.
Highly innovative firms, which have reached the first stage of digitalization with new products,
new processes, automation of production and R&D activities, are empirically identified; they tend
to be insider firms in the global economy, active in both incoming and outgoing FDI. Leading
digital firms combine the above qualities with extensive ICT use in all business activities; they
are a selected group of dynamic firms in emerging countries at the top of the hierarchy, and
include global players in technology, production and investment flows.
Keywords: Innovation, digitalization, foreign direct investment, emerging countries

1
1 Digitalization in global industry
1.1 The rise of Industry 4.0
Over the last few years, Industry 4.0 has been identified as a new phase of technological
development, building on the previous diffusion of information and communication technologies
(ICTs). A set of advanced digital technologies—including industrial robots, additive
manufacturing and 3D printing, big data and cloud computing, computer aided design and
computer aided manufacturing (CAD/CAM), artificial intelligence and machine learning—have
emerged in advanced countries, offering opportunities for drastic changes in production activities,
linking firms in global networks, integrating manufacturing and related services, shortening
product cycles, increasing flexibility and variety, reducing costs and employment (Roland Berger,
2016; OECD, 2017; UNIDO, 2017). A definition of Industry 4.0 technologies is provided in Table
1. They can be perceived as a pyramid, rising against the backdrop of advanced digitalization of
the economy, with industrial automation as the first step and the operation of ‘smart factories’ as
the final outcome.
Industry 4.0, in fact, must be perceived in the context of the development of technologies that is
best understood as a succession of techno-economic paradigms (Freeman and Louca, 2001).
Building on the work of Kondratieff and Schumpeter, we argue that capitalist development is
characterized by a succession of techno-economic paradigms based on a cluster of core
technologies with a major diffusion potential across the economy and at rapidly reducing costs.
Steam power and the textile machines of the first industrial revolution were the key elements of
the first techno-economic paradigm; the present one emerged in the 1980s and is based on
information and communication technologies (ICTs), with a current acceleration in digitalization,
networks and the automation of production and Industry 4.0 technologies.
In the context of Industry 4.0, large firms and government policies invest in the acceleration of
digitalization and the automation of manufacturing and services, with important measures in the
areas of robotization, ‘big data’, the ‘Internet of Things’, ‘cloud computing’ and the ‘platform
economy’. This model of digitalization and automation entails major challenges for the future of
economic activities in terms of business strategies and the location of production, quantity and
quality of jobs, education and training, employment contracts, etc.
2
Table 1: Definition of technologies of the 4th Industrial Revolution
Technology Attributes
Industrial robots
Industrial robots are automatically controlled, reprogrammable, multipurpose
manipulators programmable in three or more axes, which may be either fixed
in place or mobile for use in industrial automation applications. They largely
rely on algorithms driven by software, which may be enabled to communicate
with other machines through the Internet of Things and to engage in self-
learning and autonomous reprogramming through artificial intelligence.
Industrial robots tend to substitute routine tasks in workers’ occupations.
Additive
manufacturing
(3D printing)
3D printers build products by adding materials in layers. Using 3D modelling
software (e.g. CAD), machine equipment and layering material, additive
manufacturing equipment reads data from CAD files and lays downs or adds
layers of liquid, powder, sheet material or other to fabricate a 3D object. This
reduces the time, material use and number of workers involved in design,
prototyping and product layout (all of which are created digitally) and
facilitates product customization.
Big data and
cloud computing
Big data analytics refers to a set of techniques that allows voluminous amounts
of machine-readable data to be rapidly generated, accessed, processed and
analysed. These processes are often undertaken through cloud computing that
substantially increases the availability and affordability of computing services
by using servers, storage, databases, networking, software, analytics, etc. over
the internet (i.e. the “cloud”). Machine learning systems can employ these data
and recommend product features by predicting what customers will like.
Computer aided
design and
computer aided
manufacturing
(CAD/CAM)
techniques
Software used to design and manufacture prototypes, finished products and
production runs. CAD systems allow an engineer to view a design from any
angle with the push of a button and to zoom in or out for close ups and long
distance views. In addition, the computer keeps track of design dependencies
so that when the engineer changes one value, all other values that depend on it
are automatically modified accordingly, first in building designs in blueprints,
and then in creating or assembling physical products and parts using computer
controlled equipment.
Artificial
intelligence and
machine learning
Algorithms allowing computers and machines embodying or linked to
computers to learn from data and to mimic and predict human behaviour.
Source: Mayer (2018, p.5).
For advanced countries, the promise of Industry 4.0 is to achieve a ‘leap’ in the development and
use of advanced digital technologies, increasing control over labour, global supply chains and
markets; this is expected to increase growth, product diversity, productivity, flexibility and at the
same time lowering production, transaction, communication and labour costs. Lower production
and labour costs may create conditions for a ‘reshoring’ of production in advanced countries,

3
reducing the opportunities of less developed economies to be integrated in international
production systems. Little connection with sustainable development has so far been made in
advanced countries.
For emerging countries, the challenge of Industry 4.0 is ‘leapfrogging’ in their growth trajectory,
using the new technologies as a way to catch up faster with technological ‘leaders’. At the same
time, there is a risk of losing high value added activities—including research, production and
marketing—that may be further concentrated in advanced countries; in this case, emerging
countries could be left in a state of ‘premature deindustrialization’ (Rodrik, 2016).
The concept of Industry 4.0 originated in Germany to support the digital transformation of
production, challenging U.S. monopoly in digital networks and platforms. The governments of
many advanced countries, particularly in Europe, have identified the specific goal of spreading
advanced digital technologies such as robotics and automation, cloud computing, big data, sensors
and 3D printers, and have introduced a wide range of measures. Policies generally include
incentives for R&D, investment in 4IR machinery, venture capital benefits, high-tech
infrastructures and university and secondary education support (European Commission, 2017).
These policies have played a positive role in bringing attention to the technological upgrading of
industry and the need for an innovative leap; they have favoured a significant increase in demand
for automation equipment and advanced industrial machinery, stimulating a rise in investment
patterns that have generally been stagnant since the 2008 crisis (for the case of Italy, see Nascia
and Pianta, 2018). ‘Industry 4.0’ programmes have a positive modernization effect and have
provided a stimulus to business investment. It remains to be seen whether these effects reach
beyond the most advanced group of manufacturing firms and foster a broader technological
upgrading of industry. These concerns apply even more to emerging countries, where the group
of ‘leading’ technology-based firms tends to be smaller and the bulk of firms have more limited
technological capabilities.
The first concern is that the focus on digital technologies and advanced automation could be
relevant for a rather limited number of companies, either in advanced or in emerging countries;
these firms tend to be large companies, technologically advanced and may be in less need of
government support. Conversely, the main challenge is to increase the number of innovative firms
that may not have the internal capabilities, structures and skills—including a significant number
of employees with a university education—to venture on the uncertain ground of digitalization.
4
A second concern is that Industry 4.0 programmes are inspired by a model of far reaching
automation that might reduce the need for human labour and competences and concentrate control
over complex processes within a few large companies. This trajectory of technological change
may have limited coherence with national industrial structures where small and medium sized
firms tend to be prevalent, including in the industrial automation sector, and where the supply of
labour is abundant. There is a risk that such a policy may lead to a more polarized industrial
structure, lower employment and higher inequalities (Pianta, 2018; Guellec and Paunov, 2017).
1.2 Industry 4.0, technology and emerging countries
The rise of Industry 4.0 generates new challenges for emerging countries. They must be viewed
in the context of the novel attention that has recently been focussed on the role of technology in
development. Over the last decades, the ability to introduce new technologies has been recognised
by most emerging economies as being a crucial element in the process of industrialization.
Choices in technology adoption in emerging economies are related to the countries’ development
strategies, relying on particular advantages in terms of knowledge base, capital stock, absorption
capabilities, institutional and infrastructural setting, low labour costs, social and environmental
conditions, etc. The technological solutions, the resulting economic activities—private or public,
market or non-market—the combinations required for the quantity and quality of capital and
labour employed, the economic and social outcomes are the results of the decisions of key
economic players and government policies.
A large number of studies and reports by international organizations have addressed the role of
technology in the development of emerging countries (UNIDO, 2015). More recent studies focus
on the challenges of digitalization and Industry 4.0 for emerging countries (World Bank, 2016;
Lopez-Gomez et al., 2017; Sturgeon, 2017; ILO, 2018; Mayer, 2018). Other studies explore the
potential impact of digitalization on employment in emerging countries (Chang and Huynh, 2016;
Hallward-Driemeier and Nayyar, 2017). Industry 4.0 policies of emerging countries’ governments
are reviewed by Santiago (2018).
Major policy efforts in these directions have included measures to encourage firms to introduce
new products and processes, to attract foreign direct investment (FDI) from multinational
corporations (MNCs), to imitate frontier innovators, to adopt new capital equipment and
production technologies and to diffuse the use of new goods and services. This process is
highlighted by the success of some Asian countries (China and India in particular) in shifting from
a paradigm of technology adoption to one of domestic knowledge generation (Altenburg et al.,
5
2008), although the ability of other countries to follow the same path has been questioned (Perez,
2008).
However, the question of digitalization and its impact must be set in the context of the broader
role technology plays in the development and industrialization of emerging countries, which is
reviewed in the next section. A conceptual framework will be developed to link a country’s
technological capabilities and its position in the global economy, identifying a typology of firms
of emerging countries. Empirical investigations are described in Sections 3 and 4. The results of
the analyses are presented in the conclusions.
2 Technological capabilities and the trajectories of firms in emerging countries
Digitalization and Industry 4.0 are quite remote from emerging countries’ current capabilities,
which have advanced along a more incremental path and have limited points of entry to advanced
digitalization. Consideration of the various and complementary capabilities that are of relevance
for firms in emerging countries will allow us to highlight the key conditions for entering the digital
era.
2.1 Mapping the capabilities of firms in emerging countries
A large body of literature addresses the importance of capabilities in firms to determine their
ability to operate with efficiency, increase output and employment and to upgrade their
technological competences (Lall, 1992; Cimoli et al., 2009; Bogliacino et al., 2012). This
approach is of particular importance for firms in emerging countries and is crucial for identifying
the possibilities of moving closer to digitalization.
A firm’s main capabilities can be divided between capabilities internal to the firm and capabilities
provided by national innovation systems.
2.1.1 Capabilities internal to the firm
a) Capabilities for innovation in products, processes, organization, automation, ICT use
and R&D
Capabilities internal to the firm encompass the core competence of firm organization and of the
individuals operating in the firm at different levels of responsibility. They are dynamic in nature
as they provide the learning processes required to upgrade and innovate all business activities. In
emerging countries, the development of technological capabilities is a crucial factor for
industrialization; this can be achieved through the acquisition and adaptation of foreign
technologies; participation in global production networks organized by multinational firms; and
the development of a domestic knowledge base and innovative potential. Complementarities or
6
trade-offs may emerge between the acquisition of foreign technology and efforts for developing
internal R&D and innovative capabilities. Moreover, gaps in these capabilities often exist in
emerging countries due to the lack of resources in firms, the ‘brain drain’ of highly skilled
workers, engineers and researchers who leave the country, the lack of accumulation of internal
competences and weak R&D activities. These capabilities are crucial for digitalization, as they
are a necessary precondition for rethinking current production processes in the new context of
digitalization and Industry 4.0.
Section 4 of this paper presents empirical documentation of such capabilities based on World
Bank Innovation and Enterprise Surveys. Four groups of firms with different levels of internal
capabilities are identified and their technological and economic performance is explored.
b) Capabilities in management, skilled labour, production and exports
Such capabilities are associated with the ability to manage the production process, using suitably
skilled labour and finding appropriate markets, for export in particular. They are a central asset
of firms, shaping the overall management, quality of labour used, the efficiency of production,
the ability to export and gain market power. Firms in emerging countries—especially those active
in global markets and involved in GVCs—have been able to rapidly develop such capabilities
through the replication of models of advanced countries and through the effects of FDIs.
Digitalization may, however, significantly influence their relevance and how they are developed
and used in the Industry 4.0 context.
c) Financial capabilities
Access to and availability of financial resources is a key requirement for the operation of firms.
Emerging countries encounter greater difficulties due to the smaller size of their firms, the poor
relationship between finance and industry and institutional factors. Digitalization requires
extensive capital resources and a long-term perspective, which is necessary for developing new
knowledge and technological capabilities.
2.1.2 Capabilities external to the firm
a) Infrastructure provision
Basic infrastructure—transport, water, electricity, waste disposal, etc.—are an often disregarded
necessary precondition for economic activities, which is often lacking or is unreliable in emerging
countries. Over the last two decades, ICTs have become an indispensable infrastructure for
economic activity, with the cabling of businesses and households, fast internet access, mobile
communication systems, etc. The presence of an adequate public ICT infrastructure is now a basic
7
requirement for digitalization. Some of these high-tech infrastructures (such as mobile
communications) have developed rapidly in emerging economies while others are still inadequate,
such as cabling and internet access.
b) The national innovation system
Firms must operate within a network of diversified, complementary firms—either as suppliers,
partners or customers—with the support and guidance of public actors. In addition, public creation
of knowledge and education is necessary for the technological development of firms and the
availability of skilled workers. Furthermore, the financial system must provide resources for long-
term investment in capital and immaterial assets. These factors make up the national innovation
system, providing material and immaterial inputs for the technological development of firms. The
national innovation systems of emerging countries are often characterized by structural and
institutional weaknesses. In the context of digitalization and Industry 4.0, these complementarities
play an increasingly important role and emerging countries face major challenges in providing
them.
Emerging countries’ capabilities are very uneven. The firms in some large countries, specifically
China and India, possess the necessary capabilities to be ‘integrated’ in the Industry 4.0 model,
or have the capacity to develop their capabilities in a different direction (for instance, focussing
less on labour replacement and more on diffusion or on sustainable development). In other
emerging countries, the presence of such capabilities is limited. Firms are trying to develop them
in an incremental ‘localized’ way, focussing on the production processes currently in place,
relying on market outlets in GVCs and export markets. The pace of development of these
capabilities may therefore be uneven, preventing broader access to digital technologies.
How can the presence of such capabilities, particularly capabilities for innovation in products,
processes, organization, automation, ICT use and R&D, be documented in firms? Aside from the
conventional science and technology indicators—R&D expenditure and patents—innovation
surveys have emerged in recent decades as the most suitable tool for documenting the extent of
these capabilities in firms. We rely on some of the evidence drawn from innovation surveys to
develop the conceptual framework to conduct the empirical investigation in Section 4.

8
2.2 Evidence on innovation in emerging countries
A large body of empirical literature has recently addressed the contributions of technological
change and innovation to economic development in emerging countries (see Zanello, 2016;
Bogliacino et al., 2012). This body of work largely relied on new sources of evidence.
First, the innovation survey on firms pioneered in Europe has been extended to include emerging
countries (OECD, 2018). The documentation of science and technological activities goes beyond
traditional indicators, such as R&D and patents, which are unsuited for emerging countries
(Archibugi and Pianta, 1996). Innovation surveys provide quantitative and qualitative information
on the activities, expenditure, aims and outcomes of firms’ innovative efforts, documenting the
presence of innovation in products, processes and organization.
Second, the World Bank Enterprise Surveys (www.enterprisesurveys.org) in emerging countries
includes specific innovation surveys for selected countries, providing information that is
consistent with the approach of innovation surveys. In addition, the World Bank database releases
firm-level data that have been used by a large number of studies on innovation and firm
performance. These data are used for the empirical investigation in Section 4.
Third, data on the spread of information and communication technologies (ICTs) have been
collected by several organizations—including the OECD—providing methodological tools
(Calvino et al., 2018) and evidence on the progress of new technologies and digitalization.
However, in spite of these important data collection efforts, including surveys on ICT usage and
intangibles, no comprehensive set of indicators on digitalization with reliable information on the
progress of digitalization and Industry 4.0 across countries is available.
Fourth, databases on large firms and their FDI make it possible to investigate firms’ business
strategies to determine their research, production and marketing activities at the global level and
to identify the emergence of patterns of international production characterized by global value
chains (Milberg and Winkler, 2013). These data—in aggregate terms—are used in the empirical
investigation in Section 3.
Considering the extent of efforts and research that have been expended for innovation surveys in
advanced and emerging countries, we begin this section by summarizing the results of these
studies. The complex and multi-dimensional nature of technological change in firms and its
industry specificity (Dosi, 1982; Pavitt, 1984; Bogliacino and Pianta, 2016) has been documented
by innovation surveys that provide a variety of indicators on inputs, outputs, sources, objectives
and obstacles.
9
A detailed investigation has reviewed and compared the evidence from innovation surveys in
emerging countries for the period 2002 to 2006 (Bogliacino et al., 2012). The EU-15 countries
(no innovation survey was carried out in the U.S. during that period) outperform emerging
countries in terms of innovative performance. The performance of a few Asian countries—such
as the Republic of Korea—is comparable or higher than that of the EU-15. The innovative output
of the majority of emerging countries and of recent EU member states lie below EU-15 levels. A
few countries lag behind by a substantial margin.
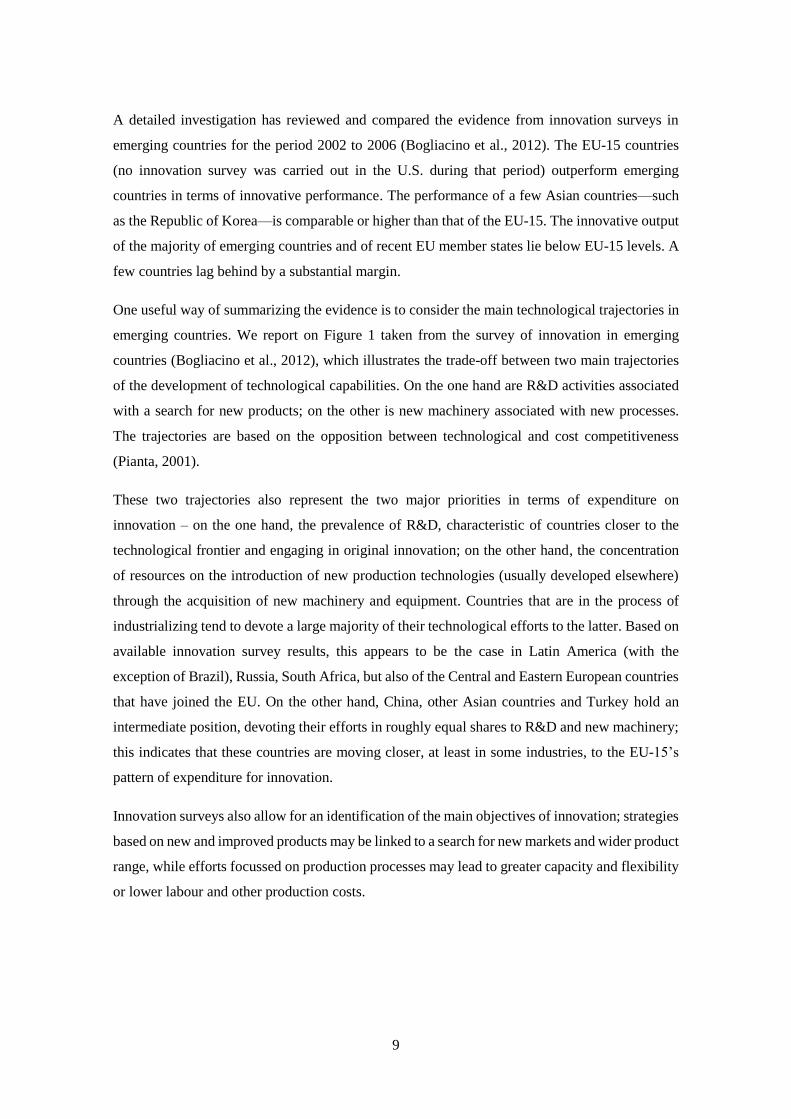
One useful way of summarizing the evidence is to consider the main technological trajectories in
emerging countries. We report on Figure 1 taken from the survey of innovation in emerging
countries (Bogliacino et al., 2012), which illustrates the trade-off between two main trajectories
of the development of technological capabilities. On the one hand are R&D activities associated
with a search for new products; on the other is new machinery associated with new processes.
The trajectories are based on the opposition between technological and cost competitiveness
(Pianta, 2001).
These two trajectories also represent the two major priorities in terms of expenditure on
innovation – on the one hand, the prevalence of R&D, characteristic of countries closer to the
technological frontier and engaging in original innovation; on the other hand, the concentration
of resources on the introduction of new production technologies (usually developed elsewhere)
through the acquisition of new machinery and equipment. Countries that are in the process of
industrializing tend to devote a large majority of their technological efforts to the latter. Based on
available innovation survey results, this appears to be the case in Latin America (with the
exception of Brazil), Russia, South Africa, but also of the Central and Eastern European countries
that have joined the EU. On the other hand, China, other Asian countries and Turkey hold an
intermediate position, devoting their efforts in roughly equal shares to R&D and new machinery;
this indicates that these countries are moving closer, at least in some industries, to the EU-15’s
pattern of expenditure for innovation.
Innovation surveys also allow for an identification of the main objectives of innovation; strategies
based on new and improved products may be linked to a search for new markets and wider product
range, while efforts focussed on production processes may lead to greater capacity and flexibility
or lower labour and other production costs.

10
Figure 1: Two trajectories of technological capabilities: R&D and acquisition of new machinery in
selected countries
Note: Data are expressed as a share of total innovation expenditure.
Source: Bogliacino et al. (2012) based on data from countries’ innovation surveys.
2.3 Stylized facts on innovation in emerging countries
Building on existing literature, in particular Lall (1992), Freeman and Louça (2001) and on our
previous extensive work on innovation in emerging countries (Bogliacino et al., 2012), we can
identify a number of stylized facts that can now be updated and extended, providing a conceptual
foundation for understanding technological development and the conditions for the rise of
digitalization.
a) A technological hierarchy can be found in emerging countries’ firms
As regards technological development, leading firms in the largest and more dynamic emerging
countries have moved closer to those firms in advanced countries. If well-organized national
innovation systems and technology infrastructure are available, these firms can build strong R&D
capabilities, thereby moving closer to digitalization.
A second group of firms in emerging countries has developed significant technological
capabilities, carrying out R&D and design activities as well as product and process innovation,
using patenting and other tools of protection of IPRs.
11
Technology in a third group of firms—the largest one—primarily comes in the form of acquisition
of new machinery and imitation of products and processes developed elsewhere. Both technology
adoption and imitation can spread rapidly among firms in emerging countries, with benefits
typical of the catching-up process.
b) Institutions and the national innovation system matter
In emerging countries, the weaknesses of institutions and of the national system of innovation can
pose a problem, with a lack of integration between firms in the production system, the financial
sector, research and education activities and the policies of the public sector. Evidence from
innovation surveys on the sources of knowledge and obstacles to innovation points towards the
importance of a coherent innovation system.
c) Industrialization and global markets drive technological development
On the supply side, innovation is closely linked to the process of industrialization, as
demonstrated by the importance of technology adoption and the acquisition of new machinery in
emerging countries. On the demand side, countries with strong economic growth and integration
in international markets and GVCs are able to rapidly diffuse modern production competences
adopting new process technologies and new machinery, and to find expanding markets for
products that either imitate those of advanced countries, or are produced within the requirements
of GVCs. Industrialization with technology adoption and growing markets with imitation appear
as highly complementary developments in those countries that are most successful in the catching
up process. The possibility of a mismatch between the supply and demand dynamics may
constrain the development process.
d) Large firms are important technology drivers, with exceptions
The Schumpeterian hypothesis on the importance of large firms in innovation is generally also
confirmed in emerging countries, where the polarization of the industrial structure tends to be
stronger than elsewhere. On the one hand, the capital intensive nature of innovation—namely the
significance of investment in new machinery—implies that large firms maintain their relevance.
Digitalization, on the other hand, increases the knowledge intensity in activities with lower capital
intensity, and network structures may partly compensate for size. Still, market power together
with a larger size allow firms to better benefit from innovative products and services.

12
e) International integration stimulates technological capabilities
Firms involved in global markets, exporting products or integrated in GVCs, tend to have greater
incentives to improve their technological capabilities compared to firms serving the domestic
market alone, as several empirical studies indicate. Market openness on its own, however, is
insufficient to further technological development, as domestic firms may simply be put out of
business by more efficient foreign competitors if domestic capabilities are inadequate and
dynamic scale economies have not yet been reached. National industrial policies should search
for a trade-off between these opportunities and risks (see Cimoli et al., 2009).
f) FDI moves technologies
The amount of innovative activities tend to be higher in the affiliates of multinational corporations
than the national average in emerging countries. This also applies in advanced countries
(Castellani and Zanfei, 2006), and is linked to intra-firm knowledge flows and to the strategies of
foreign firms aiming to exploit their competences and technologies in local markets. In emerging
countries, however, the integration between foreign affiliates and local firms and the spillover
effects may be limited, and FDI may be concentrated in production rather than on the development
of novel technological capabilities.
g) The cost of technology and the lack of finance are major obstacles
The major obstacles for innovation reported by firms in emerging countries—as well as in many
advanced ones—include the high costs and the lack of finance. This is attributable to the
prevalence of small and medium sized enterprises in many economies, which possess modest
internal financial resources. The presence of forward-looking financial systems ready to fund
long-term technology projects is an important (but rare) component of national innovation
systems in emerging countries.
2.4 From innovation to Industry 4.0
How have the capabilities and characteristics of firms in emerging countries discussed so far been
affected by the emergence of digitalization and Industry 4.0? The literature on the analysis of
capabilities and innovation has largely shifted from an understanding of the role of ICTs as the
current technological paradigm, including their implications for innovation, to the rise of
networks, automation, international production and global markets. Industry 4.0 can be
understood as an acceleration of the technological trajectory of ICTs in one possible direction –
moving from industrial automation and labour-replacing robots to the ‘smart factory’ using
artificial intelligence and machine learning. As mentioned in Section 1, the aim of the Industry
4.0 strategy being implemented in Europe is to expand the advantage of its stronger economies,
13
and may not be a suitable strategy for emerging countries’ industries, as many of the requirements
are missing in weaker economies.
In emerging economies, there is extensive evidence of ‘localized’ automation, with CAD/CAM
use and new processes, machinery and robots replacing human labour and assuring greater
reliability and quality of output within the more technologically advanced firms, many of them
owned by MNCs originating from advanced countries. There is less diffusion of ‘networked’
automation linking different production activities and plants with ‘intelligent’ learning systems;
the use of big data and cloud computing is also less widespread than in advanced countries.
An empirical investigation of these developments entails major challenges, as detailed, reliable
data on most attributes of Industry 4.0—from the number and impact of robots to the use of
CAD/CAM, 3D printing, big data—are simply unavailable. Industry 4.0 technologies are rooted
in a set of digital activities that are associated with strong innovative capabilities, automation,
increase of skilled labour, ability to export, etc. In this regard, digitalization can be understood as
an enabler and precondition of Industry 4.0. We can assess several dimensions of digitalization
using the available information on innovation and investment performance. The empirical
investigations in Sections 3 and 4 explore digital activities –using a variety of approaches and
variables as a precondition and complementary technology to Industry 4.0. We identify the
industries, business activities and innovation strategies in which digitalization is more important
and widespread, and in which firms may be closer to adopting and developing Industry 4.0
technologies.
2.5 A typology of emerging country firms in the face of digitalization
Building on the importance of capabilities, the stylized facts and the links between innovation,
digitalization and Industry 4.0, we propose a tentative typology of firms in emerging countries as
a conceptual tool to understand the position and possible trajectory of the evolution of firms.
Firms in emerging countries can be tentatively grouped on the basis of their position in this
development as follows:
a. Global players. A selected group of firms in emerging countries has the potential to play a
relevant, independent role in the development of Industry 4.0 and digital technologies as
competitors or (almost) equal partners of northern multinational corporations. They may become
‘leaders’ in some niches of digital technologies and take advantage of the opportunity to ‘leapfrog’
facilitated by digitalization and Industry 4.0 technologies. They have the competences and
resources to develop independent technological capabilities in a trajectory characterized by
internal innovative capabilities (from R&D to design) and by the successful adaptation of foreign

14
know-how, leading to new products for the local and international markets, and the ability to
compete with advanced countries in at least some product groups and industries.
b. Insider firms. A larger group of firms in emerging countries has some Industry 4.0 and digital
capabilities and is integrated in global supply chains controlled by northern multinational
corporations. They include domestic firms of large affiliates of foreign corporations, ‘imitators’
and ‘supplier partners’ of technological ‘leaders’ of other countries. Their integration in
international technology networks is the main channel for acquiring technological capabilities.
They operate in open, export-oriented economies, with close links with foreign owned domestic
firms and the system of international production of multinational firms. Specific channels for
acquiring new capabilities include the transfer of technologies, production capabilities and
participation in innovative activities, primarily through the acquisition of new machinery. This
may lead to positive innovative performance, but with limited consolidation of the domestic
knowledge base. Key decisions on the types of technologies used and the mode of implementation
of digitalization may remain in the hands of the multinational firms controlling international
production. Conversely, the presence of a large domestic market and the ability to expand market
outlets parallel to global value chains could be an asset for strengthening these insider firms.
Recent evidence includes cases, for example, Foxconn and Nike, of advanced robotization
strategies that might replicate the large labour displacing effects witnessed in advanced economies
in emerging countries.
c. Potential entrants. A large share of firms in emerging countries has some capabilities and a
potential for investing in digital technologies, adopting either a strategy of entering global supply
chains controlled by northern firms based on technology or cost advantages or adopting a
domestic/regional strategy of more independent development, perhaps in particular industry
niches, with a possible differentiation in terms of the direction digitalization might take. They
include ‘imitators’ and ‘adopters/adaptors’ of digital technologies developed by foreign ‘leading’
firms.
This group of firms tends to rely on imported technological capabilities through the acquisition
of new machinery and learning processes, leading to new products, but with no innovative
capabilities. This pattern is characteristic of economies that are resource intensive, commodity
exporting or at the initial stages of offshore production; they tend to be unable to build a critical
mass of domestic knowledge base. The acquisition of machinery may allow some catching up in
terms of productivity levels; however, alongside machinery, they might import the same labour
saving bias typical of advanced countries in very different employment contexts.
15
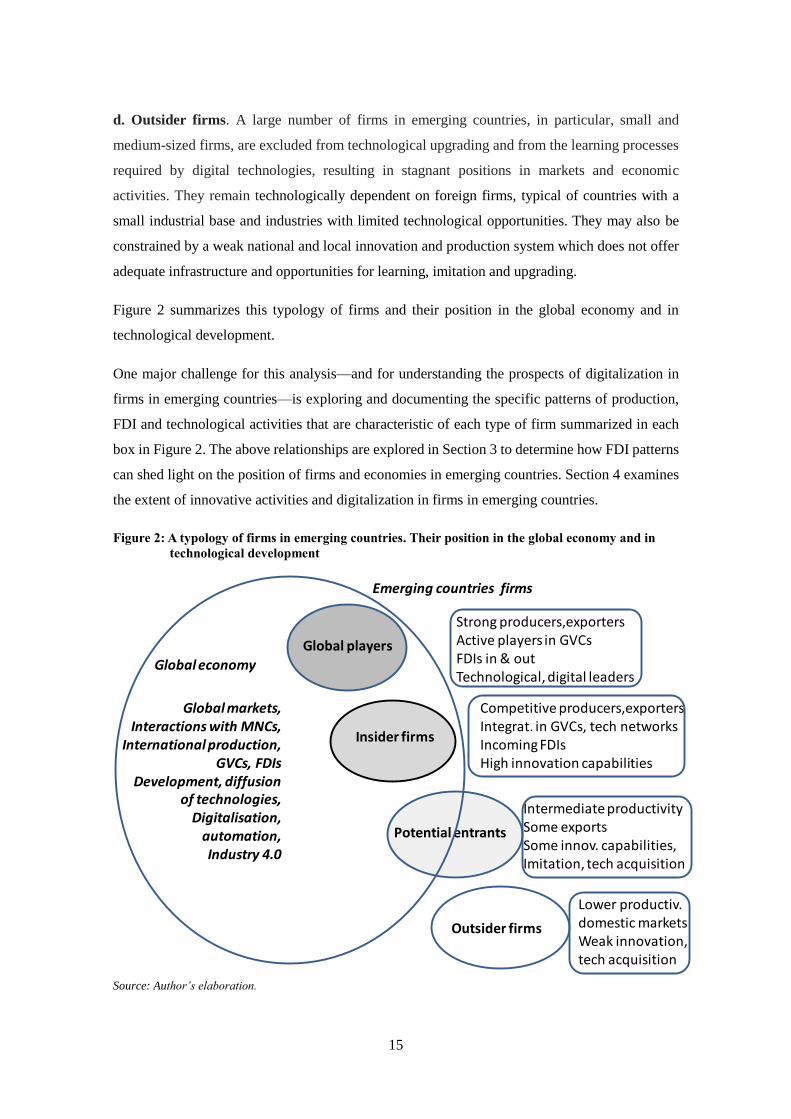
d. Outsider firms. A large number of firms in emerging countries, in particular, small and
medium-sized firms, are excluded from technological upgrading and from the learning processes
required by digital technologies, resulting in stagnant positions in markets and economic
activities. They remain technologically dependent on foreign firms, typical of countries with a
small industrial base and industries with limited technological opportunities. They may also be
constrained by a weak national and local innovation and production system which does not offer
adequate infrastructure and opportunities for learning, imitation and upgrading.
Figure 2 summarizes this typology of firms and their position in the global economy and in
technological development.
One major challenge for this analysis—and for understanding the prospects of digitalization in
firms in emerging countries—is exploring and documenting the specific patterns of production,
FDI and technological activities that are characteristic of each type of firm summarized in each
box in Figure 2. The above relationships are explored in Section 3 to determine how FDI patterns
can shed light on the position of firms and economies in emerging countries. Section 4 examines
the extent of innovative activities and digitalization in firms in emerging countries.
Figure 2: A typology of firms in emerging countries. Their position in the global economy and in
technological development
Source: Author’s elaboration.
Global players
Global players
Insider firms
Potential entrants
Outsider firms
Emerging countries firms
Global economy
Strong producers,exportersActive players in GVCsFDIs in & outTechnological, digital leaders
Competitive producers,exportersIntegrat. in GVCs, tech networksIncoming FDIsHigh innovation capabilities
Intermediate productivitySome exportsSome innov. capabilities,Imitation, tech acquisition
Lower productiv.domestic marketsWeak innovation,tech acquisition
Global markets,Interactions with MNCs,
International production, GVCs, FDIs
Development, diffusionof technologies,
Digitalisation, automation,Industry 4.0

16
3 Foreign direct investment in emerging countries
The conceptual framework developed in the previous section and the typology of firms in
emerging countries is the foundation for empirical investigations that highlight some of the issues
to be explored. Unfortunately, we face serious challenges, namely:
the ability of available sources of information to document the extent of digitalization and
the development of Industry 4.0 in firms in emerging countries;
the ability of existing innovation surveys to account for firms’ most sophisticated
technological capabilities;
the possibility of linking and integrating information on technology, economic
performance and FDI of firms;
the coverage and comparability of emerging countries in the available surveys.
In the remainder of this paper, we explore the potential of two new data sources for providing
information on innovation and digitalization in firms in emerging countries. In this section, we
use the FDImarkets database to investigate the investment environment within which emerging
countries operate, considering in particular relevant industries, R&D, design and ICT activities.
In Section 4, we use the World Bank Innovation Surveys for selected emerging countries to
document the quality and quantity of technological capabilities of firms and their relevance for
their prospects of digitalization.
3.1 Foreign direct investment projects in highly innovative and digital activities in
emerging countries
This section investigates a new source of empirical evidence on technology based on foreign
direct investment (FDI) projects in emerging countries and in highly innovative activities that
create the conditions for digitalization. We report aggregate data from the FDImarkets database
compiled by the Financial Times, summarizing the evidence of ongoing work carried out with
Antonello Zanfei and Andrea Coveri of the University of Urbino who have a license to use
FDImarkets data (Zanfei, Coveri and Pianta, 2019).
Data are available for MNCs based in all countries and investing in all countries. Variables include
the number of projects announced and the estimated value of the capital investment. They cover
the 2003-2014 period.
FDI projects are important as they map the development of new greenfield investments that
change the technological competences and production capacity of emerging countries. We break
down FDI data along four main dimensions.

17
a) Countries of FDI destination
First, we consider the destination of total FDI based on a detailed breakdown of emerging
countries by region, including the following countries:
Advanced economies (including North America, the European Union, Japan, the
four ‘Asian Tigers’, Australia and New Zealand)
Emerging economies: Non-EU Europe (excluding Norway and Switzerland,
which are included in the EU group above), Russia, China, India, Rest of Asia,
Middle East and Northern Africa, sub-Saharan Africa, Latin America
b) Industries
Second, FDI projects directed towards industries in which digital activities play a more important
role indicating an expansion of firms’ capabilities towards greater innovation and digitalization.
As suggested in Section 2 above, this may point to a greater potential for adoption and
development of Industry 4.0 technologies. We therefore focus our analysis on the manufacturing
and service industries where technological activities are more intense and digitalization is more
relevant. We rely on OECD studies (Calvino et al., 2018) and on the findings of innovation
surveys in other countries to identify these industries; the ISIC Rev. 3.1 classification (reported
in Table 2 in the Appendix), or the similar NACE classification (reported in Table 3 in the
Appendix) are usually adopted for such analyses; however, the classification of FDImarkets
differs in some cases from these standard industry classifications.
Figure 3 summarizes the evidence on the most relevant ICTs in industries based on the NACE
classification; we use data from the Sectoral Innovation Database (SID) developed at the
University of Urbino where information on a large number of economic and innovation variables
is available using the NACE Rev.1 and Rev.2 classifications (data cover the six largest European
economies for the period 1995-2018, see Pianta et al., 2019). Figure 3 shows the importance of
ICT investment per employee for the average of the six major EU countries (Germany, France,
UK, Italy, the Netherlands, Spain) for the period 2009-2014. The NACE classifications of
information technology services and electronics have the highest values. The electronics sector
includes the subsectors of office, accounting and computing machinery; electrical machinery and
apparatus; radio, television and communication equipment; the IT services industry includes
computer and related activities; post and telecommunications has by far the highest ICT intensity
with most of its investments in ICT activities. The ranking of industries is stable across countries,
in both advanced and in emerging countries.

18
Figure 3: ICT intensity in industries
ICT investment per employee, average 2009-2014, averages for major European countries: DE,
FR, ES, IT, NL, UK
Note: Industries are based on the NACE industry classification. ICT investment is the sum of investments in computing
equipment, communication equipment, software and databases, which are all part of gross fixed capital formation,
divided by the number of employees, in millions of euros at current prices. Average over the period 2009-2014 for
Germany, France, UK, Italy, the Netherlands, Spain.
Source: Author’s elaboration based on the Sectoral Innovation Database (SID), University of Urbino.
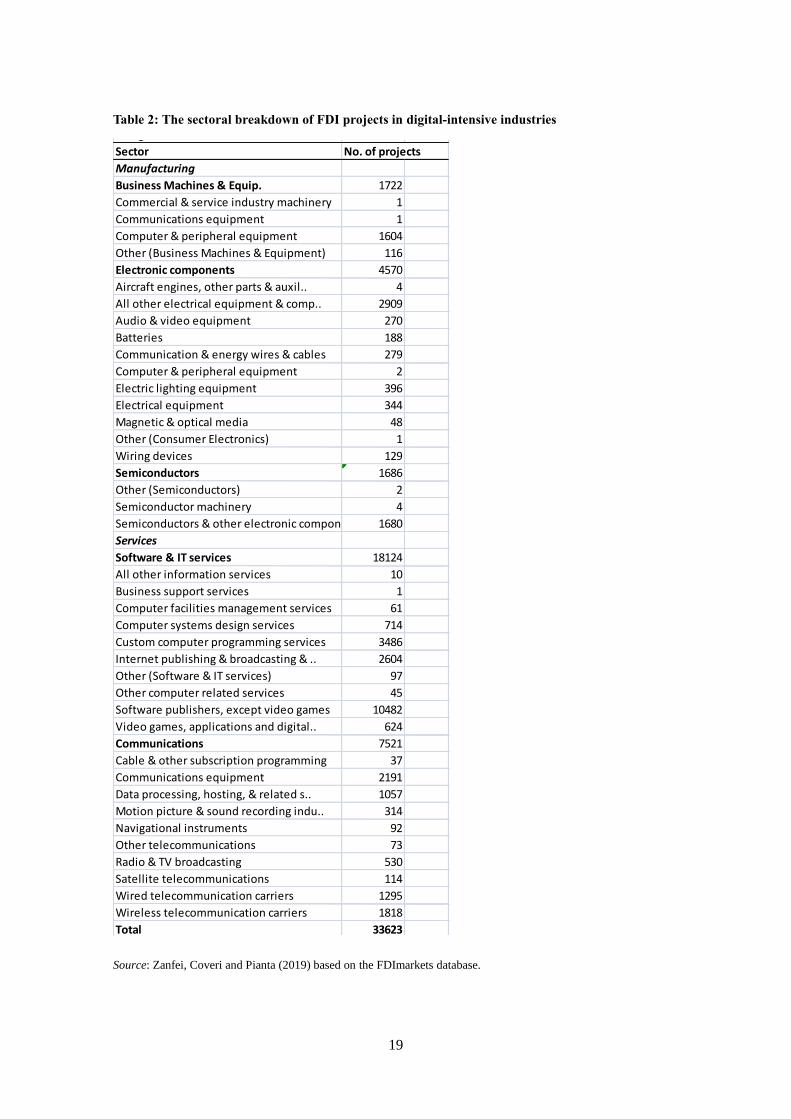
Table 2 lists the sectors and subsectors of the FDImarkets database, with the number of total FDI
projects that closely correspond to the above standard industry classifications. The NACE
classification of electronics includes the FDImarkets classification business machines, electronic
components and semiconductors. The IT services industry largely corresponds to the FDImarkets
classification of software and IT services. The post and telecommunications industry includes a
large part of the FDImarkets classification of communications, although some of these services
are present in other industry groups. Sectors identified by the ISIC classification are very similar
to those in the NACE classifications (see Tables 2 and 3 in the Appendix).
0
5
10
15
20
25
30
C10
-C1
2
C13
-C1
5
C16
C17
C18
C19
C20
C21
C22
C23
C24
C25
C26
C27
C28
C29
C30
C31
-C3
2
C33
G4
5
G4
6
G4
7
H49
H50
H51
H52
H53
I
J61
J62
-J63
Average ICT investment per employee
Telecomm.J61
IT services J62-J63
ElectronicsC26-C27
Machinery C28
19
Table 2: The sectoral breakdown of FDI projects in digital-intensive industries
Source: Zanfei, Coveri and Pianta (2019) based on the FDImarkets database.
Table 3.1
The sectoral breakdown of Foreign direct investment projects
in digital-intensive industries
Sector No. of projects
Manufacturing
Business Machines & Equip. 1722
Commercial & service industry machinery 1
Communications equipment 1
Computer & peripheral equipment 1604
Other (Business Machines & Equipment) 116
Electronic components 4570
Aircraft engines, other parts & auxil.. 4
All other electrical equipment & comp.. 2909
Audio & video equipment 270
Batteries 188
Communication & energy wires & cables 279
Computer & peripheral equipment 2
Electric lighting equipment 396
Electrical equipment 344
Magnetic & optical media 48
Other (Consumer Electronics) 1
Wiring devices 129
Semiconductors 1686
Other (Semiconductors) 2
Semiconductor machinery 4
Semiconductors & other electronic components 1680
Services
Software & IT services 18124
All other information services 10
Business support services 1
Computer facilities management services 61
Computer systems design services 714
Custom computer programming services 3486
Internet publishing & broadcasting & .. 2604
Other (Software & IT services) 97
Other computer related services 45
Software publishers, except video games 10482
Video games, applications and digital.. 624
Communications 7521
Cable & other subscription programming 37
Communications equipment 2191
Data processing, hosting, & related s.. 1057
Motion picture & sound recording indu.. 314
Navigational instruments 92
Other telecommunications 73
Radio & TV broadcasting 530
Satellite telecommunications 114
Wired telecommunication carriers 1295
Wireless telecommunication carriers 1818
Total 33623
Source: Zanfei, Coveri, Pianta (2019). Data from fDi Markets database.

20
On the basis of this evidence, we consider the FDImarkets classifications listed above to be
digital-intensive industries and focus our analysis on their relevance in FDI flows to emerging
countries.
a) Business activities
A third dimension we consider in this section is the type of business activities within each
industry. The FDImarkets database breaks down FDI projects on the basis of their ‘content’,
ranging from manufacturing to construction, to retail, etc.; the business activities that are more
relevant for innovation and digitalization include the following:
Research & Development (R&D): The discovery, design, or development of a product –
technical design centres.
Design, development & testing: Projects that involve the design, development or testing
of a product. Software companies that establish development centres are usually also
involved in testing. To be included in R&D activities, the firm must carry out pure
research.
ICT & internet infrastructure: Providing infrastructure for the ICT industry – broadband
infrastructure, internet data centres, data recovery centres, etc.
b) FDI originating from emerging countries
A fourth dimension is FDI that originates in emerging countries, in keeping with the same regional
grouping listed above; this allows us to understand the relevance, content and direction of
technological investments by emerging countries, highlighting their specific strategies in these
sectors.
3.2 The distribution of FDI projects by region, industry, business activity
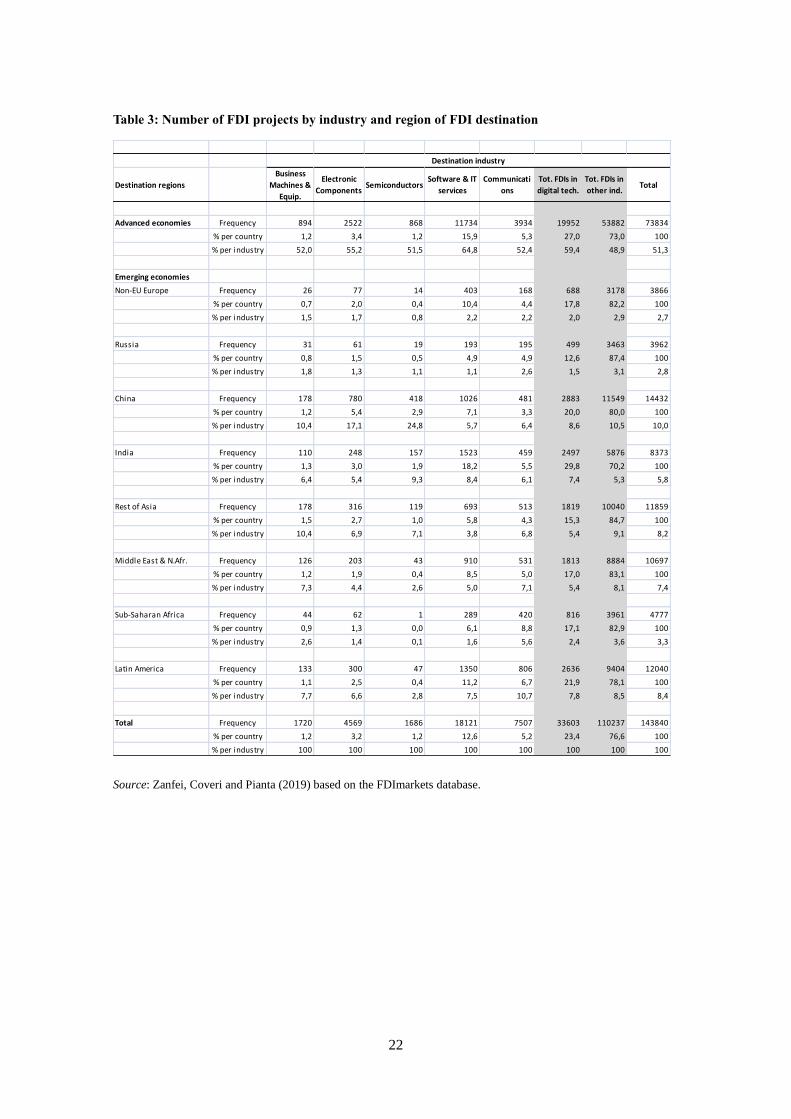
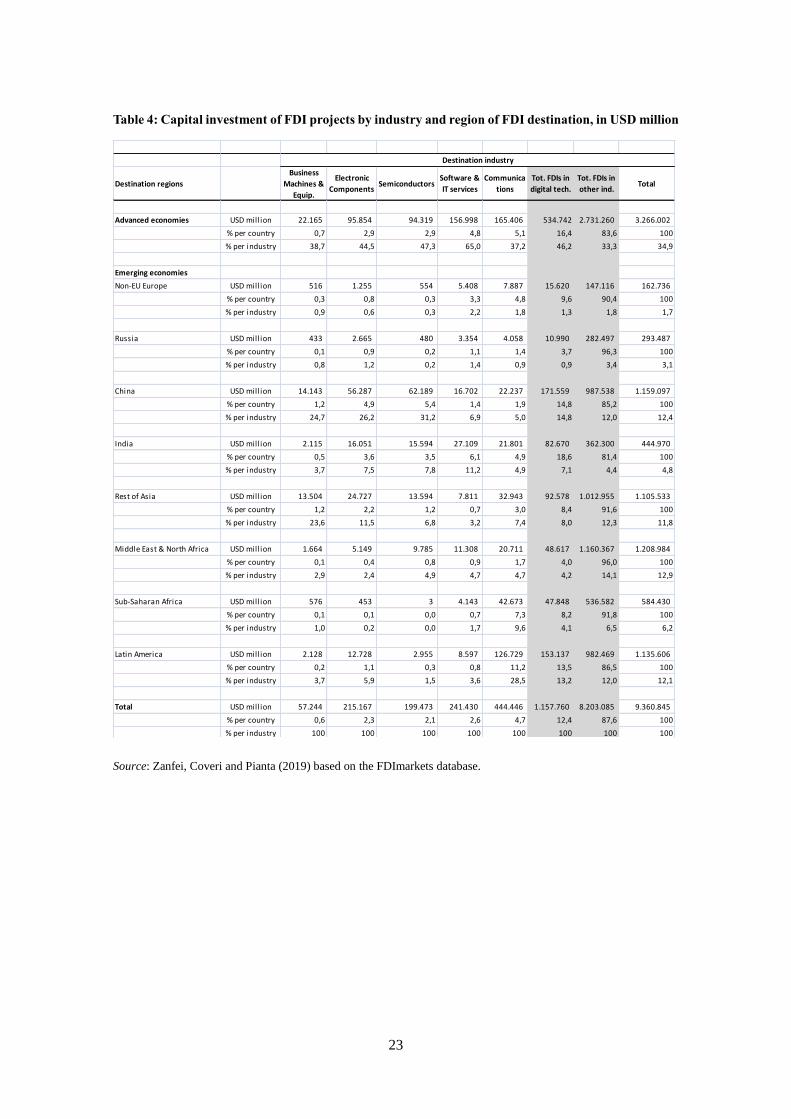
Table 3 presents the number of FDI projects by industry and region of FDI destination, with
absolute numbers, percentages by row (regions) and column (industry)1. Table 4 presents the same
FDI projects in terms of their estimated capital investment.
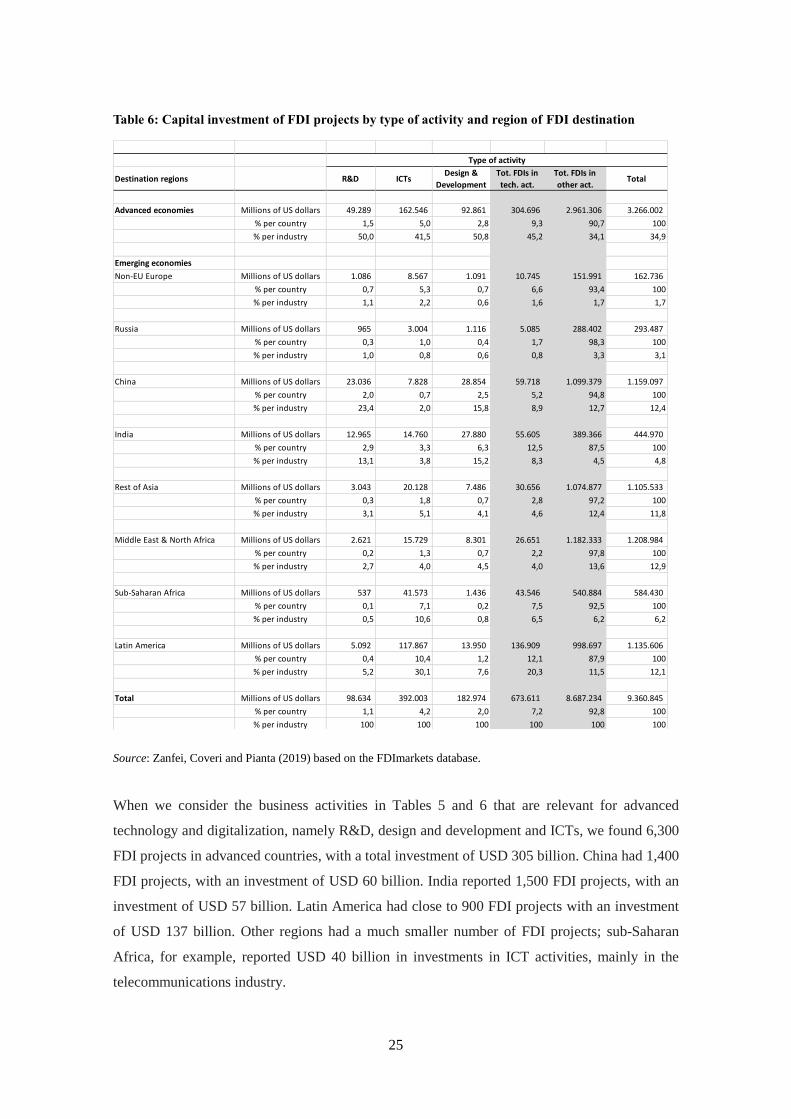
Table 5 shows the number of FDI projects by type of activity—R&D, ICT, design and
development—and region of FDI destination. Table 6 reports the same breakdown for their
estimated capital investment. The evidence reveals the following:
1 The minor differences in the totals compared to Table 2 are due to projects where not all of the required information
was available.

21
For the period 2003-2014, a large number of total FDI projects was recorded—nearly 150,000—
with a very large planned investment of USD10 trillion. There is broad coherence between the
distribution by region and industry of data on the number of projects and data on the estimated
capital investment. The total number of global FDI projects in digital-related industries is 34,000,
with an investment of USD 1,200 billion; the share of total FDI is 23 per cent for the number of
projects and 12 per cent for capital investment. Technology intensive projects tend to entail a
smaller average investment than the rest of the industries where large production projects in
capital intensive industries play a major role.
The largest recipients of FDI are advanced countries themselves, with 74,000 projects, 20,000 of
which target digital industries, with a total investment of USD 3,300 billion. Several emerging
countries, however, are becoming major players. The number of FDI projects to China was
14,000, 2,900 of which targeted digital industries, with a total investment of USD 1,200 billion.
India has been the destination of 8,400 FDI projects, 2,500 of which targeted digital industries,
with a total investment of USD 445 billion. The number of FDI projects to Latin America was
12,000, 2,600 of which targeted digital industries, with a total investment of USD 1,100 billion.
There were close to 12,000 FDI projects to the rest of Asia, but only 1,800 targeted digital
industries, with a total investment of USD 1,100 billion. Data for the Middle East and Northern
Africa are included as well. Other regions have much smaller FDI activities.
22
Table 3: Number of FDI projects by industry and region of FDI destination
Source: Zanfei, Coveri and Pianta (2019) based on the FDImarkets database.
Destination regions
Business
Machines &
Equip.
Electronic
ComponentsSemiconductors
Software & IT
services
Communicati
ons
Tot. FDIs in
digital tech.
Tot. FDIs in
other ind.Total
Advanced economies Frequency 894 2522 868 11734 3934 19952 53882 73834
% per country 1,2 3,4 1,2 15,9 5,3 27,0 73,0 100
% per industry 52,0 55,2 51,5 64,8 52,4 59,4 48,9 51,3
Emerging economies
Non-EU Europe Frequency 26 77 14 403 168 688 3178 3866
% per country 0,7 2,0 0,4 10,4 4,4 17,8 82,2 100
% per industry 1,5 1,7 0,8 2,2 2,2 2,0 2,9 2,7
Russia Frequency 31 61 19 193 195 499 3463 3962
% per country 0,8 1,5 0,5 4,9 4,9 12,6 87,4 100
% per industry 1,8 1,3 1,1 1,1 2,6 1,5 3,1 2,8
China Frequency 178 780 418 1026 481 2883 11549 14432
% per country 1,2 5,4 2,9 7,1 3,3 20,0 80,0 100
% per industry 10,4 17,1 24,8 5,7 6,4 8,6 10,5 10,0
India Frequency 110 248 157 1523 459 2497 5876 8373
% per country 1,3 3,0 1,9 18,2 5,5 29,8 70,2 100
% per industry 6,4 5,4 9,3 8,4 6,1 7,4 5,3 5,8
Rest of Asia Frequency 178 316 119 693 513 1819 10040 11859
% per country 1,5 2,7 1,0 5,8 4,3 15,3 84,7 100
% per industry 10,4 6,9 7,1 3,8 6,8 5,4 9,1 8,2
Middle East & N.Afr. Frequency 126 203 43 910 531 1813 8884 10697
% per country 1,2 1,9 0,4 8,5 5,0 17,0 83,1 100
% per industry 7,3 4,4 2,6 5,0 7,1 5,4 8,1 7,4
Sub-Saharan Africa Frequency 44 62 1 289 420 816 3961 4777
% per country 0,9 1,3 0,0 6,1 8,8 17,1 82,9 100
% per industry 2,6 1,4 0,1 1,6 5,6 2,4 3,6 3,3
Latin America Frequency 133 300 47 1350 806 2636 9404 12040
% per country 1,1 2,5 0,4 11,2 6,7 21,9 78,1 100
% per industry 7,7 6,6 2,8 7,5 10,7 7,8 8,5 8,4
Total Frequency 1720 4569 1686 18121 7507 33603 110237 143840
% per country 1,2 3,2 1,2 12,6 5,2 23,4 76,6 100
% per industry 100 100 100 100 100 100 100 100
Source: Zanfei, Coveri, Pianta (2019). Data from fDi Markets database.
Destination industry
23
Table 4: Capital investment of FDI projects by industry and region of FDI destination, in USD million
Source: Zanfei, Coveri and Pianta (2019) based on the FDImarkets database.
Destination regions
Business
Machines &
Equip.
Electronic
ComponentsSemiconductors
Software &
IT services
Communica
tions
Tot. FDIs in
digital tech.
Tot. FDIs in
other ind.Total
Advanced economies USD mill ion 22.165 95.854 94.319 156.998 165.406 534.742 2.731.260 3.266.002
% per country 0,7 2,9 2,9 4,8 5,1 16,4 83,6 100
% per industry 38,7 44,5 47,3 65,0 37,2 46,2 33,3 34,9
Emerging economies
Non-EU Europe USD mill ion 516 1.255 554 5.408 7.887 15.620 147.116 162.736
% per country 0,3 0,8 0,3 3,3 4,8 9,6 90,4 100
% per industry 0,9 0,6 0,3 2,2 1,8 1,3 1,8 1,7
Russia USD mill ion 433 2.665 480 3.354 4.058 10.990 282.497 293.487
% per country 0,1 0,9 0,2 1,1 1,4 3,7 96,3 100
% per industry 0,8 1,2 0,2 1,4 0,9 0,9 3,4 3,1
China USD mill ion 14.143 56.287 62.189 16.702 22.237 171.559 987.538 1.159.097
% per country 1,2 4,9 5,4 1,4 1,9 14,8 85,2 100
% per industry 24,7 26,2 31,2 6,9 5,0 14,8 12,0 12,4
India USD mill ion 2.115 16.051 15.594 27.109 21.801 82.670 362.300 444.970
% per country 0,5 3,6 3,5 6,1 4,9 18,6 81,4 100
% per industry 3,7 7,5 7,8 11,2 4,9 7,1 4,4 4,8
Rest of Asia USD mill ion 13.504 24.727 13.594 7.811 32.943 92.578 1.012.955 1.105.533
% per country 1,2 2,2 1,2 0,7 3,0 8,4 91,6 100
% per industry 23,6 11,5 6,8 3,2 7,4 8,0 12,3 11,8
Middle East & North Africa USD mill ion 1.664 5.149 9.785 11.308 20.711 48.617 1.160.367 1.208.984
% per country 0,1 0,4 0,8 0,9 1,7 4,0 96,0 100
% per industry 2,9 2,4 4,9 4,7 4,7 4,2 14,1 12,9
Sub-Saharan Africa USD mill ion 576 453 3 4.143 42.673 47.848 536.582 584.430
% per country 0,1 0,1 0,0 0,7 7,3 8,2 91,8 100
% per industry 1,0 0,2 0,0 1,7 9,6 4,1 6,5 6,2
Latin America USD mill ion 2.128 12.728 2.955 8.597 126.729 153.137 982.469 1.135.606
% per country 0,2 1,1 0,3 0,8 11,2 13,5 86,5 100
% per industry 3,7 5,9 1,5 3,6 28,5 13,2 12,0 12,1
Total USD mill ion 57.244 215.167 199.473 241.430 444.446 1.157.760 8.203.085 9.360.845
% per country 0,6 2,3 2,1 2,6 4,7 12,4 87,6 100
% per industry 100 100 100 100 100 100 100 100
Source: Zanfei, Coveri, Pianta (2019). Data from fDi Markets database.
Destination industry

24
Table 5: Number of FDI projects by type of activity and region of FDI destination
Source: Zanfei, Coveri and Pianta (2019) based on the FDImarkets database.
Destination regions R&DDesign &
DevelopmentICTs
Tot. FDIs in
tech. act.
Tot. FDIs in
other act.Total
Advanced economies Frequency 1465 3387 1515 6367 67467 73834
% per country 2,0 4,6 2,1 8,6 91,4 100
% per activity 56,0 51,7 56,7 53,8 51,1 51,3
Emerging economies
Non-EU Europe Frequency 26 84 90 200 3666 3866
% per country 0,7 2,2 2,3 5,2 94,8 100
% per activity 1,0 1,3 3,4 1,7 2,8 2,7
Russia Frequency 42 82 59 183 3779 3962
% per country 1,1 2,1 1,5 4,6 95,4 100
% per activity 1,6 1,3 2,2 1,5 2,9 2,8
China Frequency 421 842 90 1353 13079 14432
% per country 2,9 5,8 0,6 9,4 90,6 100
% per activity 16,1 12,9 3,4 11,4 9,9 10,0
India Frequency 327 1128 96 1551 6822 8373
% per country 3,9 13,5 1,2 18,5 81,5 100
% per activity 12,5 17,2 3,6 13,1 5,2 5,8
Rest of Asia Frequency 100 301 166 567 11292 11859
% per country 0,8 2,5 1,4 4,8 95,2 100
% per activity 3,8 4,6 6,2 4,8 8,6 8,2
Middle East & N.Afr. Frequency 103 258 100 461 10236 10697
% per country 1,0 2,4 0,9 4,3 95,7 100
% per activity 3,9 3,9 3,7 3,9 7,8 7,4
Sub-Saharan Africa Frequency 19 73 185 277 4500 4777
% per country 0,4 1,5 3,9 5,8 94,2 100
% per activity 0,7 1,1 6,9 2,3 3,4 3,3
Latin America Frequency 111 394 370 875 11165 12040
% per country 0,9 3,3 3,1 7,3 92,7 100
% per activity 4,3 6,0 13,9 7,4 8,5 8,4
Total Frequency 2614 6549 2671 11834 132006 143840
% per country 1,8 4,6 1,9 8,2 91,8 100
% per activity 100 100 100 100 100 100
Source: Zanfei, Coveri, Pianta (2019). Data from fDi Markets database.
Type of activity
25
Table 6: Capital investment of FDI projects by type of activity and region of FDI destination
Source: Zanfei, Coveri and Pianta (2019) based on the FDImarkets database.
When we consider the business activities in Tables 5 and 6 that are relevant for advanced
technology and digitalization, namely R&D, design and development and ICTs, we found 6,300
FDI projects in advanced countries, with a total investment of USD 305 billion. China had 1,400
FDI projects, with an investment of USD 60 billion. India reported 1,500 FDI projects, with an
investment of USD 57 billion. Latin America had close to 900 FDI projects with an investment
of USD 137 billion. Other regions had a much smaller number of FDI projects; sub-Saharan
Africa, for example, reported USD 40 billion in investments in ICT activities, mainly in the
telecommunications industry.
Destination regions R&D ICTsDesign &
Development
Tot. FDIs in
tech. act.
Tot. FDIs in
other act.Total
Advanced economies Millions of US dollars 49.289 162.546 92.861 304.696 2.961.306 3.266.002
% per country 1,5 5,0 2,8 9,3 90,7 100
% per industry 50,0 41,5 50,8 45,2 34,1 34,9
Emerging economies
Non-EU Europe Millions of US dollars 1.086 8.567 1.091 10.745 151.991 162.736
% per country 0,7 5,3 0,7 6,6 93,4 100
% per industry 1,1 2,2 0,6 1,6 1,7 1,7
Russia Millions of US dollars 965 3.004 1.116 5.085 288.402 293.487
% per country 0,3 1,0 0,4 1,7 98,3 100
% per industry 1,0 0,8 0,6 0,8 3,3 3,1
China Millions of US dollars 23.036 7.828 28.854 59.718 1.099.379 1.159.097
% per country 2,0 0,7 2,5 5,2 94,8 100
% per industry 23,4 2,0 15,8 8,9 12,7 12,4
India Millions of US dollars 12.965 14.760 27.880 55.605 389.366 444.970
% per country 2,9 3,3 6,3 12,5 87,5 100
% per industry 13,1 3,8 15,2 8,3 4,5 4,8
Rest of Asia Millions of US dollars 3.043 20.128 7.486 30.656 1.074.877 1.105.533
% per country 0,3 1,8 0,7 2,8 97,2 100
% per industry 3,1 5,1 4,1 4,6 12,4 11,8
Middle East & North Africa Millions of US dollars 2.621 15.729 8.301 26.651 1.182.333 1.208.984
% per country 0,2 1,3 0,7 2,2 97,8 100
% per industry 2,7 4,0 4,5 4,0 13,6 12,9
Sub-Saharan Africa Millions of US dollars 537 41.573 1.436 43.546 540.884 584.430
% per country 0,1 7,1 0,2 7,5 92,5 100
% per industry 0,5 10,6 0,8 6,5 6,2 6,2
Latin America Millions of US dollars 5.092 117.867 13.950 136.909 998.697 1.135.606
% per country 0,4 10,4 1,2 12,1 87,9 100
% per industry 5,2 30,1 7,6 20,3 11,5 12,1
Total Millions of US dollars 98.634 392.003 182.974 673.611 8.687.234 9.360.845
% per country 1,1 4,2 2,0 7,2 92,8 100
% per industry 100 100 100 100 100 100
Source: Zanfei, Coveri, Pianta (2019). Data from fDi Markets database.
Type of activity

26
3.3 The specialization of regions in highly innovative and digital activities
One effective way of summarizing these patterns is to calculate the indexes of specialization of
emerging countries in digital-related industries and in business activities associated with high-
technology industries. The index of specialization is a standard tool used in the analysis of trade
patterns, and has been extended to technology (see Archibugi and Pianta (1992) for a detailed
analysis of the theory, methods and results). Countries with a high relative concentration of trade
in a given industry (as a share of their total trade) are ‘specialized’ in that particular industry if
the share of the industry lies above the share recorded for total world trade. The same index can
be calculated for production, patenting and FDI attraction.
We calculate the index as the ratio between the share of a region’s FDI projects in a given industry
(or activity) and the share of the industry (or activity) in world FDI in all activities. The index is
0 when no FDI is present; it is equal to 1 when the relevance of the industry (or activity) is equal
to the world’s total, and greater than 1 if a relative specialization of the region in these industries
(or activities) is evident. Table 7 presents the specialization indexes of all regions for the industries
included in our study. A breakdown of the years before and after the 2008 crisis is also provided
to determine whether the patterns of FDI were affected by the financial crisis and any ensuing
instability. Table 8 shows the specialization indexes of all regions based on the business activities
identified above. The results can be summarized as follows: the rankings of the region’s
specialization indexes in industries and business activities are similar when we consider capital
investment instead of the number of FDI projects.
The specialization patterns of FDI projects show the strong advantage advanced countries have
in digital-related industries. Japan and the four Asian Tigers are the most specialized economies
in these activities, dominating FDI in all relevant sectors. North America and the EU have limited
positive specialization, attributable to their strength in software and IT services. Among the
emerging countries, India is the only economy with an overall positive digital specialization, with
strengths in software, office machines and communications. China has extensive FDI activity in
other manufacturing sectors, and emerges with a positive specialization in high-tech
manufacturing, namely semiconductors, electronic components and office machinery. In the
communication industry, a strong relative specialization of FDI has moved to Latin America and
sub-Saharan Africa. The rest of Asia is specialized in office machinery. The flows of FDI appear
to be consistent with the production specialization of emerging countries; China and India show
an important diversification in most industries related to digitalization.

27
If we break down the FDI projects into two periods 2003-2008 and 2009-2014 to reflect FDI
before the financial crisis and after 2008, we find that the relevance of digital technologies in
emerging countries weakened in the majority of cases. In terms of FDI destination, most emerging
economies record a reduction in their specialization indexes, including China and India, while
their activities in other industries become relatively more important. Conversely, North America
and Europe have increased the concentration of FDI in digital technologies. The crisis of 2008
may have reinforced the technological hierarchy in FDI and slowed down the catching up process
of emerging countries.
This finding has important policy implications. Market-oriented approaches—inspired by
Ricardo’s trade theory—have long argued that the ‘efficient’ operation of market processes leads
countries to become more specialized in the activities in which they are (relatively) ‘better’ than
others. In this case, we can expect that countries with already existing production and trade
specialization in the relevant industries and activities will attract FDI.
Table 7: Number of FDI projects by industry. Specialization indexes of regions of FDI destination
Entire period 2003-2014
Destination regions
Business
Machines &
Equip.
Electronic
ComponentsSemiconductors
Software & IT
services
Communicati
ons
Tot. FDIs in
digital tech.
Tot. FDIs in
other ind.Total
Advanced economies
North America 0,77 0,99 0,67 1,19 0,94 1,06 0,98 1
EU28+Norw+Swiz 1,03 1,07 0,67 1,20 0,96 1,10 0,97 1
Japan 1,50 1,46 3,71 1,88 1,33 1,77 0,77 1
Four Asian Tigers 1,28 1,45 3,46 1,35 1,27 1,45 0,86 1
Australia & New Zealand 1,07 0,47 0,21 1,90 1,55 1,50 0,85 1
Emerging economies
Non-EU Europe 0,56 0,63 0,31 0,83 0,83 0,76 1,07 1
Russia 0,65 0,49 0,41 0,39 0,95 0,54 1,14 1
China 1,03 1,70 2,47 0,56 0,64 0,86 1,04 1
India 1,10 0,93 1,60 1,44 1,05 1,28 0,92 1
Rest of Asia 1,26 0,84 0,86 0,46 0,83 0,66 1,11 1
Middle East & North Africa 0,99 0,60 0,34 0,67 0,95 0,73 1,08 1
Sub-Saharan Africa 0,77 0,41 0,02 0,48 1,68 0,73 1,08 1
Latin America 0,92 0,78 0,33 0,89 1,28 0,94 1,02 1
Source: Zanfei, Coveri, Pianta (2019). Data from fDi Markets database.
Destination industry

28
Pre-crisis period 2003-2008
Post-crisis period 2009-2014
Source: Zanfei, Coveri and Pianta (2019) based on the FDImarkets database.
However, not all industries are equal in terms of learning processes, technological intensity,
digital potential, and the emerging countries specializing in less dynamic, low-technology
industries are likely to end up with slower overall performances and more difficulties catching
up.
Specialization indeces of regions of destination (based on number of FDIs from the World by industry), 2003-2008 (pre-crisis period)
Destination regions
Business
Machines &
Equip.
Electronic
ComponentsSemiconductors
Software & IT
servicesCommunications
Tot. FDIs in
digital tech.
Tot. FDIs in
other ind.Total
Advanced economies
North America 0,71 0,83 0,79 1,10 0,98 0,99 1,00 1
EU28+Norw+Swiz 0,92 1,06 0,59 1,16 0,90 1,03 0,99 1
of which from outside Europe: 1,59 1,17 0,91 1,64 1,13 1,41 0,88 1
Japan 1,61 1,03 3,35 1,87 1,45 1,77 0,77 1
Four Asian Tigers 1,42 1,92 3,98 1,34 1,43 1,64 0,81 1
Australia & New Zealand 0,84 0,24 0,16 1,97 1,58 1,45 0,87 1
Emerging economies
Non-EU Europe 0,63 0,59 0,08 0,41 0,93 0,54 1,14 1
Russia 0,68 0,40 0,20 0,37 0,75 0,46 1,16 1
China 0,97 1,73 2,13 0,64 0,74 0,94 1,02 1
India 1,10 0,92 1,69 1,87 1,25 1,55 0,83 1
Rest of Asia 1,44 0,84 0,84 0,48 0,90 0,70 1,09 1
Middle East & North Africa 1,20 0,48 0,37 0,69 1,01 0,74 1,08 1
Sub-Saharan Africa 0,74 0,22 0,04 0,47 1,34 0,61 1,12 1
Latin America 1,01 0,64 0,34 0,89 1,36 0,92 1,02 1
Destination industry
Specialization indeces of regions of destination (based on number of FDIs from the World by industry), 2009-2014 (post-crisis period)
Destination regions
Business
Machines &
Equip.
Electronic
ComponentsSemiconductors
Software & IT
servicesCommunications
Tot. FDIs in
digital tech.
Tot. FDIs in
other ind.Total
Advanced economies
North America 0,88 1,07 0,68 1,21 0,90 1,09 0,97 1
EU28+Norw+Swiz 1,12 1,05 0,79 1,27 1,01 1,16 0,95 1
of which from outside Europe: 1,63 1,16 1,16 1,69 1,08 1,46 0,86 1
Japan 1,33 1,82 4,29 1,89 1,23 1,77 0,76 1
Four Asian Tigers 1,18 1,15 2,90 1,35 1,18 1,32 0,90 1
Australia & New Zealand 1,32 0,59 0,35 1,84 1,53 1,53 0,84 1
Emerging economies
Non-EU Europe 0,38 0,63 0,45 0,51 0,68 0,56 1,14 1
Russia 0,53 0,60 0,97 0,42 1,21 0,65 1,11 1
China 1,04 1,71 2,70 0,50 0,53 0,76 1,07 1
India 1,02 0,95 1,13 1,08 0,86 1,01 1,00 1
Rest of Asia 1,06 0,83 0,92 0,45 0,78 0,62 1,12 1
Middle East & North Africa 0,78 0,68 0,32 0,66 0,91 0,71 1,09 1
Sub-Saharan Africa 0,90 0,49 0,00 0,47 1,86 0,80 1,06 1
Latin America 0,90 0,86 0,39 0,88 1,23 0,95 1,02 1
Destination industry

29
Conversely, policies that emphasize the need for a long-term national development strategy based
on backward and forward linkages and diversification (Cimoli et al., 2009; Hausman et al. 2007)
highlight the importance of entering—and specializing—in high-technology, high growth
industries. Given the significance of digitalization, this analysis sheds light on the ability of some
emerging countries to move out of traditional specialization and develop capabilities and
economic activities in digital-intensive activities.
Table 8: Number of FDI projects by type of activity, Specialization indexes of regions of FDI
destination
Source: Zanfei, Coveri and Pianta (2019) based on the FDImarkets database.
In terms of business activities (R&D, design and development, ICTs), the same relative patterns
of specialization generally emerge, with a few novelties. In advanced countries, surprisingly,
North America and the EU have values just below 1, suggesting a weakening of FDI flows in the
most advanced technological activities. Japan and the Asian Tigers again show a strong positive
specialization in all these activities. India shows very high specialization, driven by FDI in design
and R&D, a pattern that is followed at a distance by China. There is a relative concentration of
FDI in ICTs in sub-Saharan Africa and Latin America, associated with the telecommunication
infrastructure and services industry, a pattern non-EU Europe follows as well. The rest of Asia
and Latin America have much lower FDI values in these activities in comparison with the
previous industry-based picture; these countries appear to concentrate on production activities,
with fewer capabilities in R&D and design.
Destination regions R&DDesign &
DevelopmentICTs
Tot. FDIs in
tech. act.
Tot. FDIs in
other act.Total
Advanced economies
North America 1,03 1,05 0,68 0,96 1,00 1
EU28+Norw+Swiz 1,01 0,94 1,07 0,98 1,00 1
Japan 1,43 1,20 1,88 1,40 0,97 1
Four Asian Tigers 1,83 1,36 1,64 1,53 0,95 1
Australia & New Zealand 0,71 0,81 2,08 1,07 0,99 1
Emerging economies
Non-EU Europe 0,37 0,48 1,25 0,63 1,03 1
Russia 0,59 0,45 0,80 0,56 1,04 1
China 1,61 1,28 0,34 1,14 0,99 1
India 2,15 2,96 0,62 2,25 0,89 1
Rest of Asia 0,46 0,56 0,75 0,58 1,04 1
Middle East & North Africa 0,53 0,53 0,50 0,52 1,04 1
Sub-Saharan Africa 0,22 0,33 2,09 0,71 1,03 1
Latin America 0,51 0,72 1,65 0,88 1,01 1
Source: Zanfei, Coveri, Pianta (2019). Data from fDi Markets database.
Type of activity

30
This breakdown of FDI provides new insights on the ability of emerging countries to move into
production in highly innovative industries and to move up in the type of business activities
necessary for expanding technological capabilities. It appears that for firms in emerging countries,
the barriers to entry are higher for knowledge intensive business functions, namely R&D and
design, than for high-technology industries as such, where emerging country firms could be
integrated in GVCs or engage in subcontracting activities, even in a context of low investments
in advanced technological activities.
Table 9: FDI projects in emerging countries by type of activity and by industry
Source: Zanfei, Coveri and Pianta (2019) based on the FDImarkets database.
FDI projects in Emerging countries by type of activity
Percentages by industry(percentage values, %)
Destination industry R&D
Design &
Developm
ent
ICTsTot. FDIs in
tech. act.
Tot. FDIs in
other act.Total
Business Machines & Equipment 1,7 1,1 0,1 1,0 1,2 1,2
Electronic Components 3,6 2,9 0,1 2,5 3,0 2,9
Semiconductors 5,0 6,9 0,2 5,1 0,8 1,2
Software & IT services 17,8 40,6 14,5 30,3 7,3 9,1
Communications 9,3 9,9 82,8 25,3 3,4 5,1
Other sectors 62,6 38,6 2,4 35,9 84,3 80,5
Total 100 100 100 100 100 100
FDI projects in Emerging countries by industry
Percentages by type of activity(percentage values, %)
Destination industry R&D
Design &
Developm
ent
ICTsTot. FDIs in
tech. act.
Tot. FDIs in
other act.Total
Business Machines & Equipment 2,3 4,2 0,1 6,6 93,4 100
Electronic Components 2,0 4,5 0,0 6,6 93,4 100
Semiconductors 7,1 26,5 0,2 33,9 66,1 100
Software & IT services 3,2 20,1 2,6 26,0 74,0 100
Communications 3,0 8,7 27,0 38,6 61,4 100
Other sectors 1,3 2,2 0,0 3,5 96,5 100
Total 1,6 4,5 1,7 7,8 92,2 100
Source: Zanfei, Coveri, Pianta (2019). Data from fDi Markets database.
Type of activity
Type of activity

31
Table 9 provides additional insights into the activities at the technological edge in emerging
countries. FDI projects in digital-related industries are matched with the high-tech business
activities discussed above (R&D, ICT and design and development). These data allow us to better
understand how FDI moves into industries and business functions, mapping the technological
trajectories affecting firms in emerging countries. The first part of the table shows that two-thirds
of FDI in emerging countries go to non-high-tech industries, as they are more likely to upgrade
large production capabilities in more traditional or medium-technology manufacturing industries.
Software and IT services is the only industry that has attracted a substantial amount of FDI in
R&D (one-sixth of total FDI in R&D). Investments in ICT are mostly concentrated in
telecommunication infrastructure and services as well as software. Design and development
occurs primarily in software and IT services, and in non-high-tech industries.
The second part of the table presents the same data but with a focus on the relative importance of
business activities in each industry. Ninety per cent of FDI projects went to production,
distribution, marketing and other business activities in office machines, electronic components
and other industries, disregarding high-tech activities in emerging country firms. Conversely,
semiconductors and software attracted significant shares of FDI for design and development
activities, and—following at a distance—for R&D. The significance of ICT activities in the
telecommunications industry is again confirmed.
3.4 FDI originating from emerging countries
Finally, Tables 10 and 11 presents data of FDI originating from emerging countries, and look at
their distribution by region, industry and business activity. The first part of Table 10 shows that
25 per cent of total FDI projects went to Europe, and around 13 per cent went to the Middle East,
North Africa and to the rest of Asia. Latin America’s share of 9 per cent of total FDI is similar to
that of the U.S. and Canada. India and China did not attract large shares of FDI projects from
other emerging countries.
Looking at industry composition, the second part of Table 10 reveals that a high amount of FDI
from emerging countries went to digital activities in Latin America (25 per cent of total FDI,
mainly for IT and software), while other emerging countries accounted for between 8 per cent and
16 per cent of total FDI projects. The share of FDI in digitally intensive industries in advanced
countries ranges from 25 per cent to 33 per cent, mainly targeting IT and software.
Table 11 presents the same data with a breakdown by business activity. Europe attracted the
majority of FDI in R&D, followed by North America; the share of FDI in China and India
amounted to 10 per cent, while the other regions were of little relevance. The findings for FDI
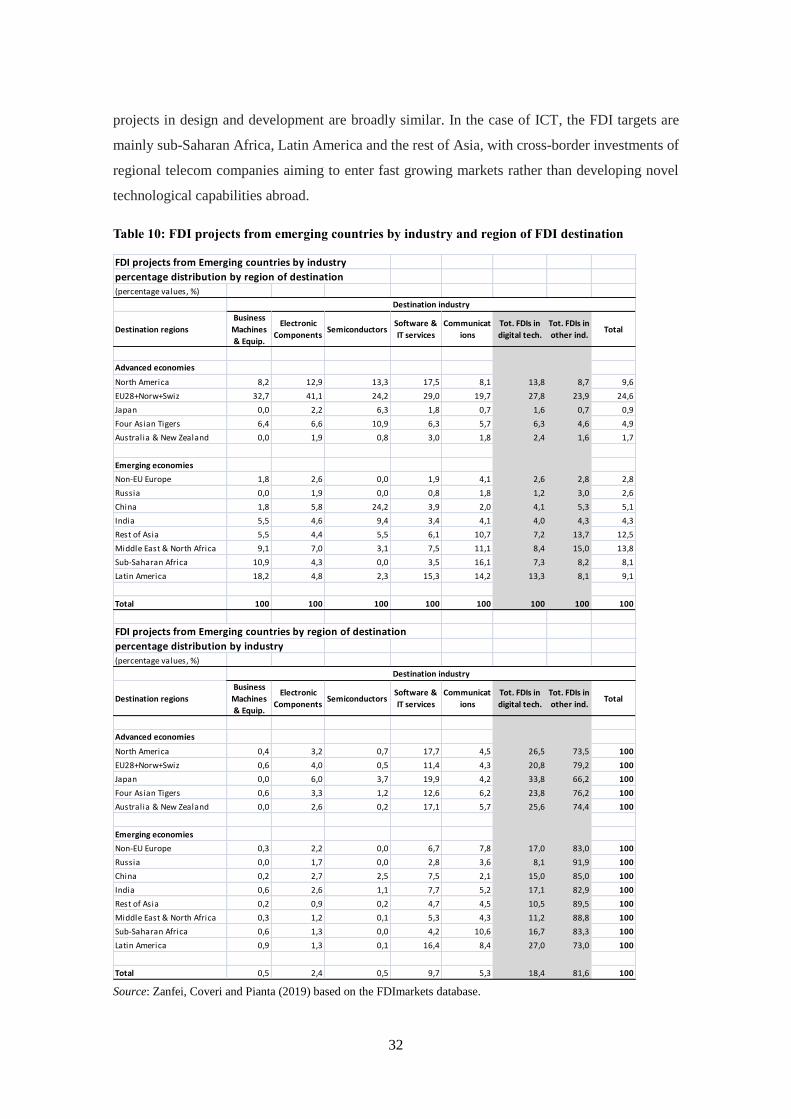
32
projects in design and development are broadly similar. In the case of ICT, the FDI targets are
mainly sub-Saharan Africa, Latin America and the rest of Asia, with cross-border investments of
regional telecom companies aiming to enter fast growing markets rather than developing novel
technological capabilities abroad.
Table 10: FDI projects from emerging countries by industry and region of FDI destination
Source: Zanfei, Coveri and Pianta (2019) based on the FDImarkets database.
FDI projects from Emerging countries by industry
percentage distribution by region of destination
(percentage values, %)
Destination regions
Business
Machines
& Equip.
Electronic
ComponentsSemiconductors
Software &
IT services
Communicat
ions
Tot. FDIs in
digital tech.
Tot. FDIs in
other ind.Total
Advanced economies
North America 8,2 12,9 13,3 17,5 8,1 13,8 8,7 9,6
EU28+Norw+Swiz 32,7 41,1 24,2 29,0 19,7 27,8 23,9 24,6
Japan 0,0 2,2 6,3 1,8 0,7 1,6 0,7 0,9
Four Asian Tigers 6,4 6,6 10,9 6,3 5,7 6,3 4,6 4,9
Australia & New Zealand 0,0 1,9 0,8 3,0 1,8 2,4 1,6 1,7
Emerging economies
Non-EU Europe 1,8 2,6 0,0 1,9 4,1 2,6 2,8 2,8
Russia 0,0 1,9 0,0 0,8 1,8 1,2 3,0 2,6
China 1,8 5,8 24,2 3,9 2,0 4,1 5,3 5,1
India 5,5 4,6 9,4 3,4 4,1 4,0 4,3 4,3
Rest of Asia 5,5 4,4 5,5 6,1 10,7 7,2 13,7 12,5
Middle East & North Africa 9,1 7,0 3,1 7,5 11,1 8,4 15,0 13,8
Sub-Saharan Africa 10,9 4,3 0,0 3,5 16,1 7,3 8,2 8,1
Latin America 18,2 4,8 2,3 15,3 14,2 13,3 8,1 9,1
Total 100 100 100 100 100 100 100 100
FDI projects from Emerging countries by region of destination
percentage distribution by industry
(percentage values, %)
Destination regions
Business
Machines
& Equip.
Electronic
ComponentsSemiconductors
Software &
IT services
Communicat
ions
Tot. FDIs in
digital tech.
Tot. FDIs in
other ind.Total
Advanced economies
North America 0,4 3,2 0,7 17,7 4,5 26,5 73,5 100
EU28+Norw+Swiz 0,6 4,0 0,5 11,4 4,3 20,8 79,2 100
Japan 0,0 6,0 3,7 19,9 4,2 33,8 66,2 100
Four Asian Tigers 0,6 3,3 1,2 12,6 6,2 23,8 76,2 100
Australia & New Zealand 0,0 2,6 0,2 17,1 5,7 25,6 74,4 100
Emerging economies
Non-EU Europe 0,3 2,2 0,0 6,7 7,8 17,0 83,0 100
Russia 0,0 1,7 0,0 2,8 3,6 8,1 91,9 100
China 0,2 2,7 2,5 7,5 2,1 15,0 85,0 100
India 0,6 2,6 1,1 7,7 5,2 17,1 82,9 100
Rest of Asia 0,2 0,9 0,2 4,7 4,5 10,5 89,5 100
Middle East & North Africa 0,3 1,2 0,1 5,3 4,3 11,2 88,8 100
Sub-Saharan Africa 0,6 1,3 0,0 4,2 10,6 16,7 83,3 100
Latin America 0,9 1,3 0,1 16,4 8,4 27,0 73,0 100
Total 0,5 2,4 0,5 9,7 5,3 18,4 81,6 100
Source: Zanfei, Coveri, Pianta (2019). Data from fDi Markets database.
Destination industry
Destination industry
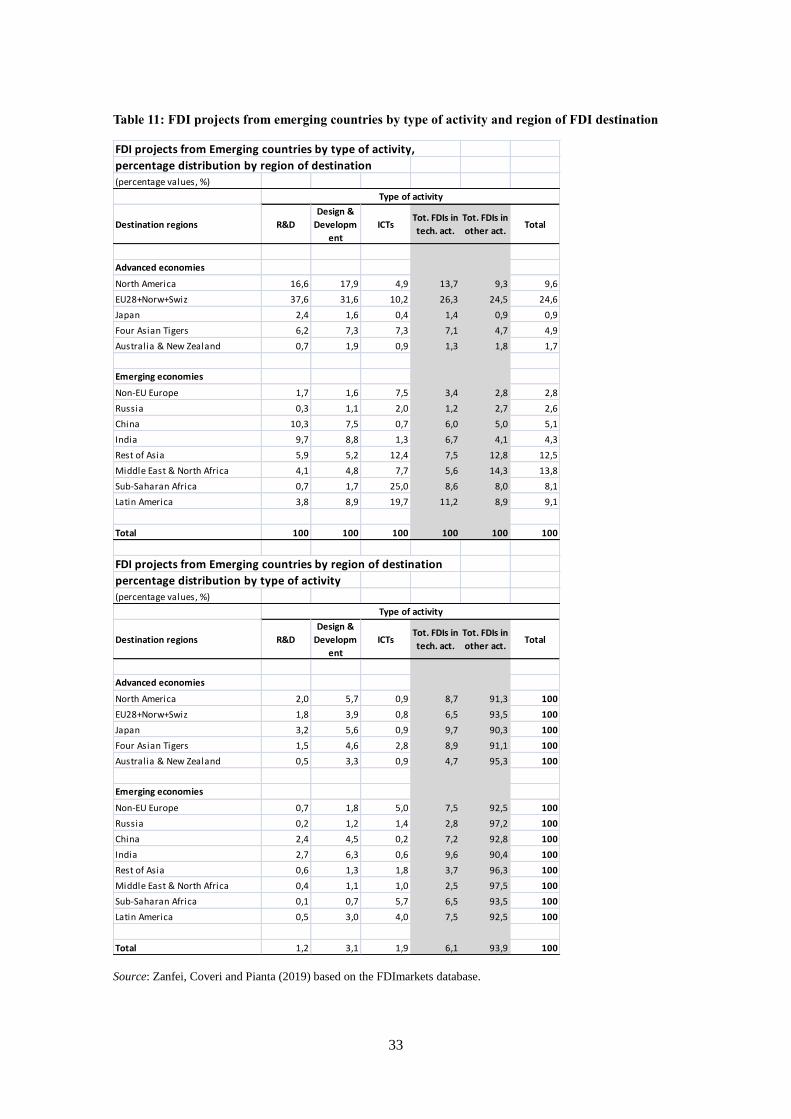
33
Table 11: FDI projects from emerging countries by type of activity and region of FDI destination
Source: Zanfei, Coveri and Pianta (2019) based on the FDImarkets database.
FDI projects from Emerging countries by type of activity,
percentage distribution by region of destination
(percentage values, %)
Destination regions R&D
Design &
Developm
ent
ICTsTot. FDIs in
tech. act.
Tot. FDIs in
other act.Total
Advanced economies
North America 16,6 17,9 4,9 13,7 9,3 9,6
EU28+Norw+Swiz 37,6 31,6 10,2 26,3 24,5 24,6
Japan 2,4 1,6 0,4 1,4 0,9 0,9
Four Asian Tigers 6,2 7,3 7,3 7,1 4,7 4,9
Australia & New Zealand 0,7 1,9 0,9 1,3 1,8 1,7
Emerging economies
Non-EU Europe 1,7 1,6 7,5 3,4 2,8 2,8
Russia 0,3 1,1 2,0 1,2 2,7 2,6
China 10,3 7,5 0,7 6,0 5,0 5,1
India 9,7 8,8 1,3 6,7 4,1 4,3
Rest of Asia 5,9 5,2 12,4 7,5 12,8 12,5
Middle East & North Africa 4,1 4,8 7,7 5,6 14,3 13,8
Sub-Saharan Africa 0,7 1,7 25,0 8,6 8,0 8,1
Latin America 3,8 8,9 19,7 11,2 8,9 9,1
Total 100 100 100 100 100 100
FDI projects from Emerging countries by region of destination
percentage distribution by type of activity
(percentage values, %)
Destination regions R&D
Design &
Developm
ent
ICTsTot. FDIs in
tech. act.
Tot. FDIs in
other act.Total
Advanced economies
North America 2,0 5,7 0,9 8,7 91,3 100
EU28+Norw+Swiz 1,8 3,9 0,8 6,5 93,5 100
Japan 3,2 5,6 0,9 9,7 90,3 100
Four Asian Tigers 1,5 4,6 2,8 8,9 91,1 100
Australia & New Zealand 0,5 3,3 0,9 4,7 95,3 100
Emerging economies
Non-EU Europe 0,7 1,8 5,0 7,5 92,5 100
Russia 0,2 1,2 1,4 2,8 97,2 100
China 2,4 4,5 0,2 7,2 92,8 100
India 2,7 6,3 0,6 9,6 90,4 100
Rest of Asia 0,6 1,3 1,8 3,7 96,3 100
Middle East & North Africa 0,4 1,1 1,0 2,5 97,5 100
Sub-Saharan Africa 0,1 0,7 5,7 6,5 93,5 100
Latin America 0,5 3,0 4,0 7,5 92,5 100
Total 1,2 3,1 1,9 6,1 93,9 100
Source: Zanfei, Coveri, Pianta (2019). Data from fDi Markets database.
Type of activity
Type of activity

34
The lower part of the table presents the same data organized by region of destination. Ninety per
cent to 97 per cent of FDI from emerging countries went to production, distribution and marketing
that lie outside the knowledge intensive business activities (R&D, ICT and design and
development). The largest technology-based FDI projects went to Asia—India, Japan, China, the
Asian Tigers—for design, and to the U.S. and Canada. The FDI directed at Latin America and
non-EU Europe targeted ICT activities. Japan, India and China attracted some FDI in R&D as
well.
3.5 Summary of the evidence
The evidence highlights the environment within which emerging country firms find themselves
in in terms of FDI flows to industries and activities that are relevant for advanced technological
capabilities and digitalization. The overall picture for emerging countries has different shades.
The positive factors are the large number of FDI projects and investments their economies have
attracted, in innovative manufacturing and services industries as well, which are relevant for
digitalization. Firms from emerging countries have surfaced as new players in FDI.
The findings that are more problematic for the prospects of emerging countries include the
prevalence of production-oriented FDI in both incoming as well as outgoing investments from
emerging countries, with less attention being paid to R&D, design and ICT activities. A country’s
production capabilities must be built up before it can move into learning processes and high
innovation activities; emerging countries appear to follow a well-established technological
trajectory in this regard.
The speed of their expansion in manufacturing production is much higher than their current
capability to ‘move up’ and enter high-tech business functions.
China and India represent special cases of success in terms of attracting FDI flows in
technological activities as well, building a diversified industrial system and important innovative
capabilities. Many of their firms have become global technological players. Studies on China have
explored the rise of its knowledge economy (Rodriguez-Pose and Wilkie, 2016), and the country’s
policies for industry modernization, automation and digitalization are outlined in its plan for
manufacturing 2025 (Li, 2018; European Union Chamber of Commerce in China, 2017). In the
case of India, more detailed evidence is provided in Section 4.
Conversely, the evidence on FDI flows to other emerging countries suggests that the technological
gap is likely to remain substantial; the economies of the rest of Asia experienced strong growth
in industrial production, but they lag behind with regard to digital industries and business

35
activities; in Latin America, modernization has mainly taken place in the telecom industry, and a
similar prevalence of the telecom industry is also evident in the Middle East and North Africa, as
well as in sub-Saharan Africa, Russia and non-EU Europe.
The patterns of technological flows, the opportunities for learning and catching up, the potential
of digital technologies and Industry 4.0 are therefore likely to be highly differentiated within
emerging countries, with a significant number of firms becoming global players in FDI as well as
in GVCs and in technology networks, but with persisting hierarchies in high-tech activities that
are closer to the digital frontier.
To explore the developments at firm level in more detail, we turn our focus on innovation patterns
in the firms of selected emerging countries.
4 Innovation and digitalization in emerging country firms
This section presents a firm-level analysis, and investigates the range of innovative activities of
firms, the presence and impact of ICT use, the distribution across industries and firm size groups,
and the impact on firms’ technological and employment dynamics.
This analysis helps identify the capabilities of firms in emerging countries, their position in the
hierarchy of technological competences, the extent of their digital activities and the potential for
becoming full players in the development of Industry 4.0. The findings are then related to the
typology of business strategies identified in Section 2.
The empirical analysis uses the World Bank Innovation Follow-up 2013-2014. This is a well-
established source of microdata on emerging countries, based on a common questionnaire, which
has been used by a large number of empirical studies (Seker, 2011; Saliola and Seker, 2011; Cirera
and Sabetti, 2016; Cirera et al., 2016).
Countries with an innovation survey for the years 2013-2014 include Bangladesh, Congo, Ghana,
India, Kenya, Malawi, Namibia, Nepal, Nigeria, Pakistan, South Sudan, Sudan, Tanzania, Uganda
and Zambia. All countries have been considered in a preliminary analysis on the importance of
firms with innovative and digital activities (see Table 12).
Questions addressed in the survey include basic data on the firm (size, industry, etc.) and a wide
range of information on their activities. The data that are more consistently present across firms
and countries include the following key variables: the presence of innovation in products; the
presence of innovation in processes (broken down into production, distribution and logistics,
support and management); whether the new process has led to automation of production; the
36
presence of internal or external R&D activities; the extent of ICT use with a detailed set of
questions; the presence of patent applications on new products; and the impact of the innovation
on skilled and unskilled employment. An extension of the analysis links these variables with
economic characteristics and performances.
The evidence from innovation surveys allows us to identify a set of specific capabilities that are
associated with technological activities, the potential for digitalization and Industry 4.0, and for
higher economic performance. The key dimensions explored in this section include the
capabilities that were discussed in Section 2, namely:
a) Capabilities for innovation in products, processes, organization, automation, ICT use
and R&D
Innovation surveys provide information on these activities, including the type of innovation
introduced, the presence of R&D activities and the impact on automation. These variables
document a range of sophisticated capabilities leading to successful innovation and digitalization.
They are combined below to identify four groups of firms that exhibit different degrees of
capabilities in this regard.
b) Technological capabilities from external and internal sources
One important specification of such capabilities is whether innovative activities are the result of
external or internal sources of know-how. This can be documented using the available surveys.
Enterprise surveys provide information on the presence of technology licensing agreements with
a foreign firm; this external technology acquisition is often the first step for firms in emerging
countries to improve their know-how and technological capabilities.
Innovation surveys provide information on the presence of patent applications in firms, which is
a key indicator of significant internal capabilities in the development, use and protection of
technological inventions. This, in turn, requires substantial capabilities in R&D, engineering and
product development. These two variables effectively summarize the trajectories of technological
development—based on either external or internal sources—of firms in emerging countries.
c) Capabilities in management, skilled labour, production and exports
For this set of capabilities discussed in Section 2, we can provide empirical documentation on the
following two types of capabilities:

37
Export capabilities
A firm’s ability to enter and grow in international markets is an important factor that is often
based on specific technological capabilities and, in turn, stimulates greater innovative activities
to improve the firm’s competitiveness. Operating in international markets requires specific
managerial and marketing capabilities. Enterprise surveys provide information on the presence
and amount of exports that can be related to the number of the firm’s employees. This is an
important performance indicator that highlights the success of innovative efforts and the relevance
of capabilities to enter international markets.
a) Skilled labour capabilities
Capabilities and knowledge are embodied in people and organizations; therefore, the presence
and growth of skilled workers in firms is a necessary condition for success in all of the above
activities. Innovation surveys provide information on the impact of new products on the
employment of skilled and unskilled workers. Enterprise surveys provide information on the level
of employment. This sheds light on the presence of skilled labour capabilities in firms that
complement the presence of capabilities in technology, innovation and export. This also allows
us to identify the trajectory of technological change and its impact on labour; a large body of
literature finds that innovation can either be associated with a strategy of technological
competitiveness based on new products and leading to growth and higher skill jobs, or it can be
used to achieve cost competitiveness by reducing unskilled employment and wages (Pianta,
2018).
The presence of such capabilities in firms can be associated with a ‘virtuous circle’ of growth and
better performance. This mechanism is at the root of the rise of emerging countries’ firms which
may bring them closer to automation and digitalization.
To operationalize these concepts, we develop groups of firms based on their innovation and digital
activities, which is then empirically investigated for several emerging countries.
4.1 Grouping of firms based on their innovation and digital activities
A preliminary analysis of the survey data for the countries considered reviews descriptive
statistics and the general consistency of responses. Building on our extensive experience in the
analysis of innovation survey data and on the trajectories typical of firms and industries (see
Bogliacino et al., 2012; Crespi and Pianta, 2008; Bogliacino and Pianta, 2016; Pianta, 2018), we
focus on the extent of innovation and digital activities in firms, identifying a set of characteristics
that best allow us to identify capabilities and performance relevant for digitalization in emerging
country firms. We identify the following four groups of firms on this basis.

38
a) Firms not engaged in product innovation
These are firms that answered “no” to the question whether they had introduced a new product or
service in the previous three years. The firm may have introduced a new process or new
organizational arrangement, but this was achieved with limited efforts and does not qualify the
firm as being technologically dynamic. These firms have the lowest level of technological
activity, are likely to be over-represented among small firms and in traditional and low-
technology industries, generally playing the role of ‘outsiders’ in global production systems.
b) Firms engaged in product innovation
These firms answered “yes” to the question whether they had introduced a new product or service
in the previous three years. The innovation literature and evidence from innovation surveys (see
Section 2) have long shown that the ability to introduce a new product is a key factor that allows
differentiating between firms with real innovative capabilities and firms with modest
technological activities. The introduction of a new process is clearly a relevant complementary
factor, but firms that only introduce new processes may in fact just be acquiring new machinery
or a computer, with a limited impact on their overall technological capabilities. A large share of
product innovators has also introduced new processes. This group is therefore a good proxy for
firms with relevant technological capabilities. The introduction of a new product is a significant
outcome of the innovative process, which requires the presence of several factors – adequate
knowledge, capital, production systems, qualified personnel as well as some market power.
Product innovators tend to have better performance in terms of productivity levels, growth of
output, exports and employment. We can therefore assume that the group of product innovators
is a group of firms with significant capabilities and dynamism, which—using the typology
introduced in Section 2—have moved from being ‘outsider firms’ to becoming ‘potential entrants’
or even ‘insiders’ in efficient production systems and in global value chains.
c) Highly innovative firms
A set of demanding conditions applies to firms defined as highly innovative. The necessary
conditions for belonging to this group are the following:
introduction of a new product or service
introduction of a new process – either in production, distribution or support activities
the innovative process must have led to automated manual processes, partially or fully
either internal or external R&D has been conducted.
This set of requirements identifies firms that have strong, systematic technological capabilities in
all major dimensions of innovation. Besides the ability to launch new products and services, they

39
have the structures and resources to carry out R&D, a fundamental activity that is required for
learning processes, the accumulation of competences and the interaction with technological
leaders, either domestic or foreign. They also have the ability to innovate in processes—in
different business activities—demonstrating that the necessary complementarities in innovative
efforts exist. Moreover, the new processes have allowed automation to be introduced with the
replacement of manual processes of production. These demanding characteristics imply that
highly innovative firms much stronger technological capabilities than product innovators, and that
they are likely to be ‘insiders’ in global value chains, playing a dynamic role in terms of learning,
investment and innovation. In short, these firms are active at the first ‘level’ of the ‘digitalization
pyramid’ with automation and technological competences.
a) Digital leaders
To identify firms with stronger digital capabilities, we review the responses of firms to the
question on use of ICTs in addition to the criteria for highly innovative firms. Firms that meet the
conditions of highly innovative firms and, in addition, have the following characteristics belong
to an ‘elite’ group of digital leaders:
large share of employees who use computers
purchase or in-house development of software
presence of employees working with IT
use of computer consultants
use of the internet for all business activities, including emails with clients and suppliers,
communication between employees, online purchases of inputs, online sales, inventory
management, marketing and R&D activities.
This set of requirements identifies firms that are strong digital players, building on a solid
foundation of advanced technological capabilities. Their ability to introduce new products and
processes, to automate and carry out R&D is supported by widespread digital activities that
promote interaction with foreign technological leaders. Meeting these very demanding
characteristics, digital leaders are firms with the strongest technological capabilities, likely to be
‘global players’ not only in global value chains, but also in the global process of digitalization
and the development of Industry 4.0; they are moving higher in the ‘digitalization pyramid’ with
automation, digital competences and broad technological activities.
A summary of the definition of these three groups of firms in emerging countries is provided in
Figure 4, indicating the possible links with the typology of emerging country firms discussed in
Section 2.
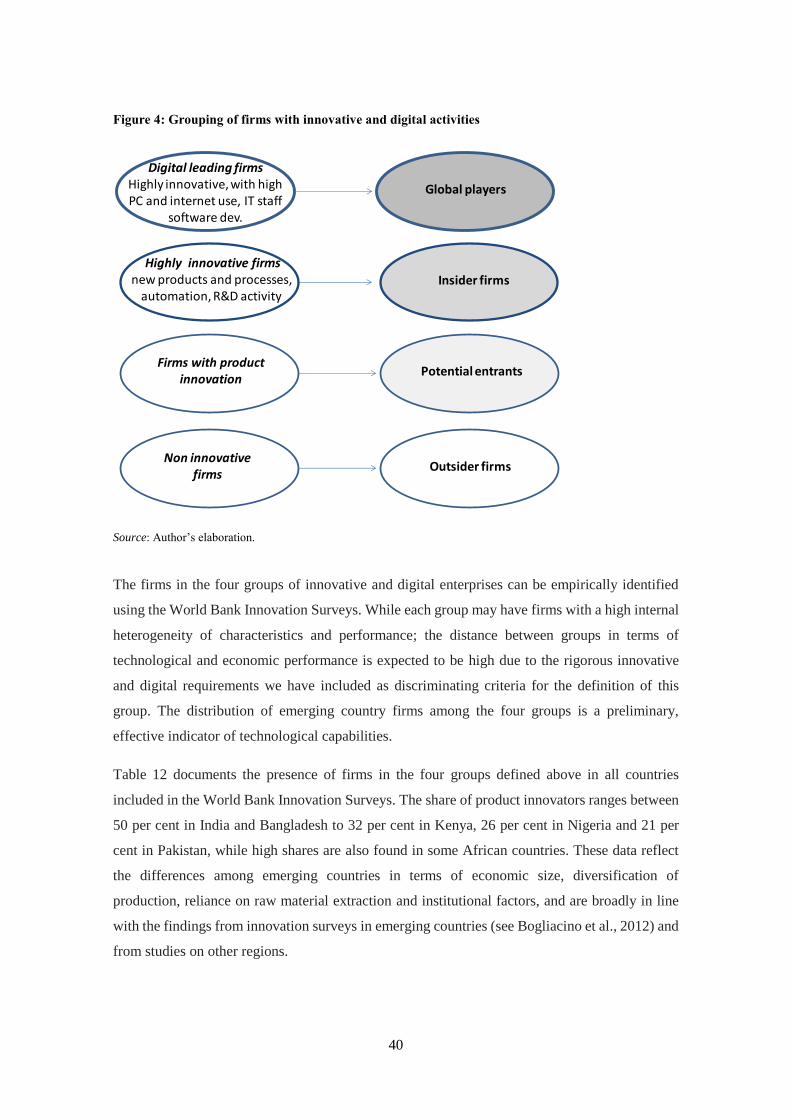
40
Figure 4: Grouping of firms with innovative and digital activities
Source: Author’s elaboration.
The firms in the four groups of innovative and digital enterprises can be empirically identified
using the World Bank Innovation Surveys. While each group may have firms with a high internal
heterogeneity of characteristics and performance; the distance between groups in terms of
technological and economic performance is expected to be high due to the rigorous innovative
and digital requirements we have included as discriminating criteria for the definition of this
group. The distribution of emerging country firms among the four groups is a preliminary,
effective indicator of technological capabilities.
Table 12 documents the presence of firms in the four groups defined above in all countries
included in the World Bank Innovation Surveys. The share of product innovators ranges between
50 per cent in India and Bangladesh to 32 per cent in Kenya, 26 per cent in Nigeria and 21 per
cent in Pakistan, while high shares are also found in some African countries. These data reflect
the differences among emerging countries in terms of economic size, diversification of
production, reliance on raw material extraction and institutional factors, and are broadly in line
with the findings from innovation surveys in emerging countries (see Bogliacino et al., 2012) and
from studies on other regions.
Non innovative firms
Firms with product innovation
Highly innovative firmsnew products and processes,
automation, R&D activity
Digital leading firmsHighly innovative, with high PC and internet use, IT staff
software dev.
Global players
Global players
Insider firms
Potential entrants
Outsider firms
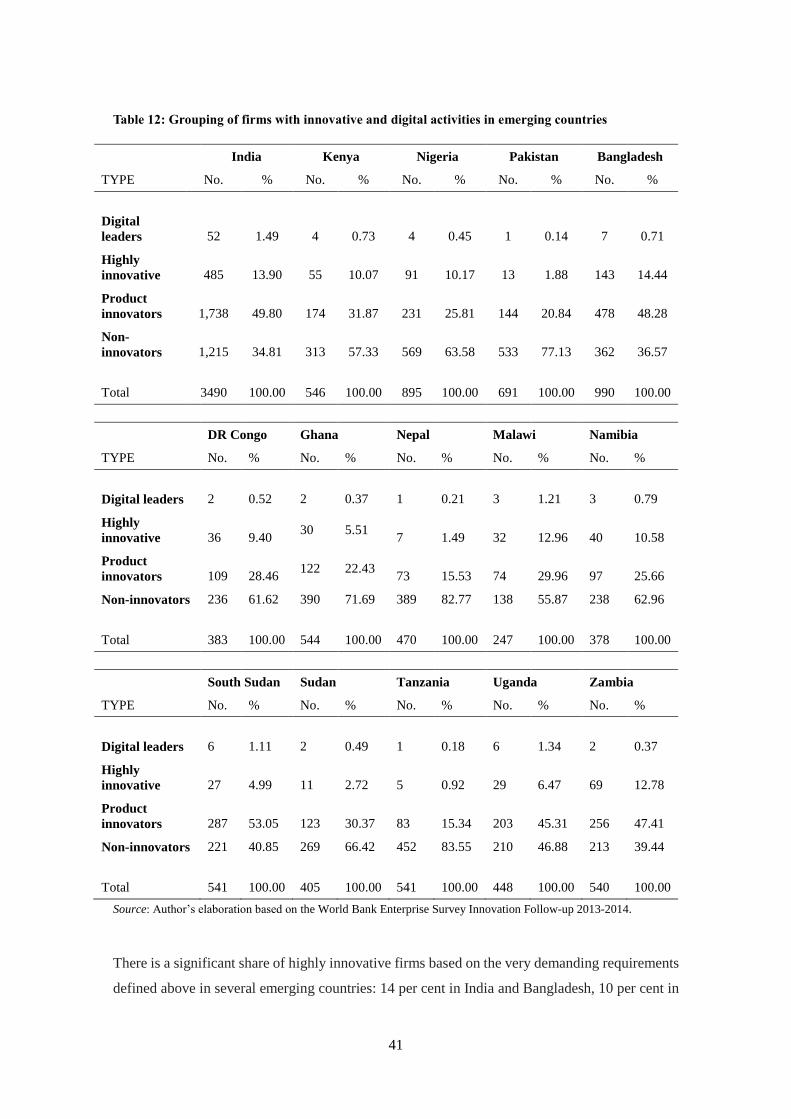
41
Table 12: Grouping of firms with innovative and digital activities in emerging countries
India Kenya Nigeria Pakistan Bangladesh
TYPE No. % No. % No. % No. % No. %
Digital
leaders 52 1.49 4 0.73 4 0.45 1 0.14 7 0.71
Highly
innovative 485 13.90 55 10.07 91 10.17 13 1.88 143 14.44
Product
innovators 1,738 49.80 174 31.87 231 25.81 144 20.84 478 48.28
Non-
innovators 1,215 34.81 313 57.33 569 63.58 533 77.13 362 36.57
Total 3490 100.00 546 100.00 895 100.00 691 100.00 990 100.00
DR Congo Ghana Nepal Malawi Namibia
TYPE No. % No. % No. % No. % No. %
Digital leaders 2 0.52 2 0.37 1 0.21 3 1.21 3 0.79
Highly
innovative 36 9.40 30 5.51
7 1.49 32 12.96 40 10.58
Product
innovators 109 28.46 122 22.43
73 15.53 74 29.96 97 25.66
Non-innovators 236 61.62 390 71.69 389 82.77 138 55.87 238 62.96
Total 383 100.00 544 100.00 470 100.00 247 100.00 378 100.00
South Sudan Sudan Tanzania Uganda Zambia
TYPE No. % No. % No. % No. % No. %
Digital leaders 6 1.11 2 0.49 1 0.18 6 1.34 2 0.37
Highly
innovative 27 4.99 11 2.72 5 0.92 29 6.47 69 12.78
Product
innovators 287 53.05 123 30.37 83 15.34 203 45.31 256 47.41
Non-innovators 221 40.85 269 66.42 452 83.55 210 46.88 213 39.44
Total 541 100.00 405 100.00 541 100.00 448 100.00 540 100.00
Source: Author’s elaboration based on the World Bank Enterprise Survey Innovation Follow-up 2013-2014.
There is a significant share of highly innovative firms based on the very demanding requirements
defined above in several emerging countries: 14 per cent in India and Bangladesh, 10 per cent in
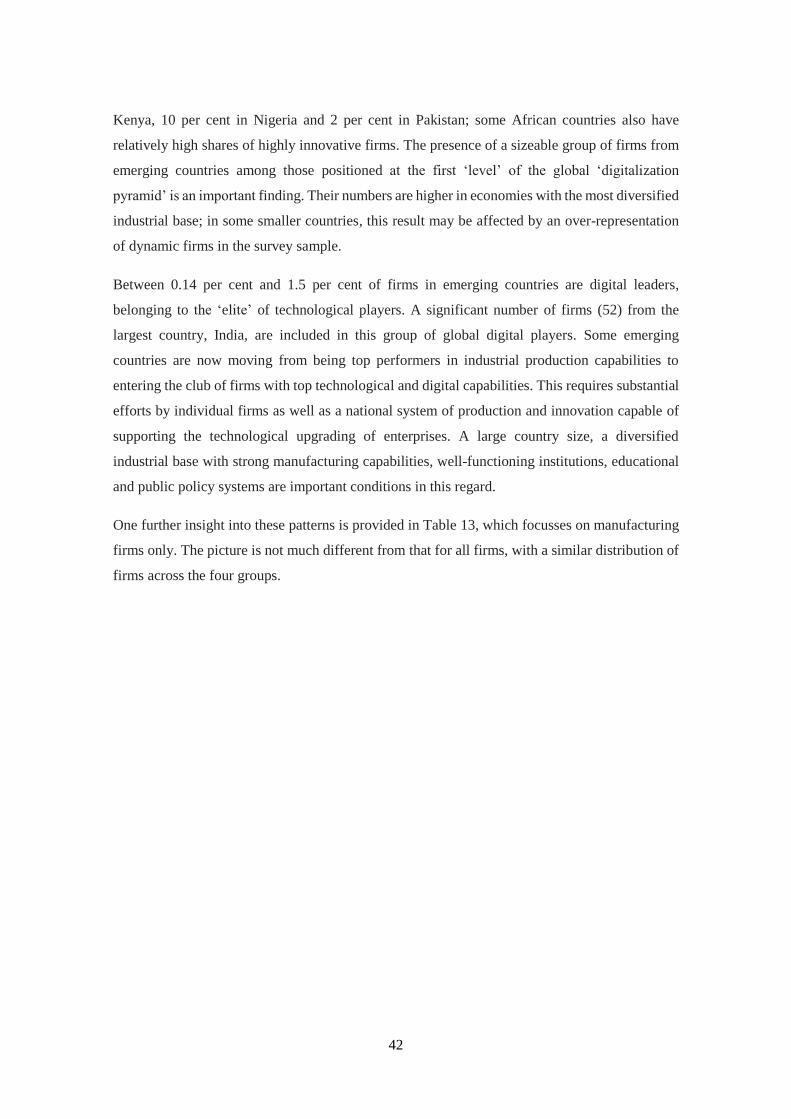
42
Kenya, 10 per cent in Nigeria and 2 per cent in Pakistan; some African countries also have
relatively high shares of highly innovative firms. The presence of a sizeable group of firms from
emerging countries among those positioned at the first ‘level’ of the global ‘digitalization
pyramid’ is an important finding. Their numbers are higher in economies with the most diversified
industrial base; in some smaller countries, this result may be affected by an over-representation
of dynamic firms in the survey sample.
Between 0.14 per cent and 1.5 per cent of firms in emerging countries are digital leaders,
belonging to the ‘elite’ of technological players. A significant number of firms (52) from the
largest country, India, are included in this group of global digital players. Some emerging
countries are now moving from being top performers in industrial production capabilities to
entering the club of firms with top technological and digital capabilities. This requires substantial
efforts by individual firms as well as a national system of production and innovation capable of
supporting the technological upgrading of enterprises. A large country size, a diversified
industrial base with strong manufacturing capabilities, well-functioning institutions, educational
and public policy systems are important conditions in this regard.
One further insight into these patterns is provided in Table 13, which focusses on manufacturing
firms only. The picture is not much different from that for all firms, with a similar distribution of
firms across the four groups.

43
Table 13: Grouping of firms with innovative and digital activities in manufacturing only
Percentages of total manufacturing firms
Country Digital
leaders
Highly
innovative
Product
innovators
Non-
innovators
Bangladesh 0.70 15.91 46.32 37.08
DR Congo 0.55 10.38 30.60 58.47
Ghana 0.35 7.80 18.79 73.05
India 1.69 16.81 50.33 31.17
Kenya 0.71 11.39 33.45 54.45
Malawi 2.99 20.90 35.82 40.30
Namibia 0.00 15.87 31.75 52.38
Nepal 0.43 2.13 14.47 82.98
Nigeria 0.75 9.95 27.36 61.94
Pakistan 0.00 2.07 22.63 75.30
South Sudan 1.22 6.10 63.41 29.27
Sudan 1.06 5.32 32.98 60.64
Tanzania 0.00 0.74 17.65 81.62
Uganda 2.88 9.13 44.71 43.27
Zambia 0.00 15.30 45.15 39.55
Source: Author’s elaboration based on the World Bank Enterprise Survey Innovation Follow-up 2013-2014.
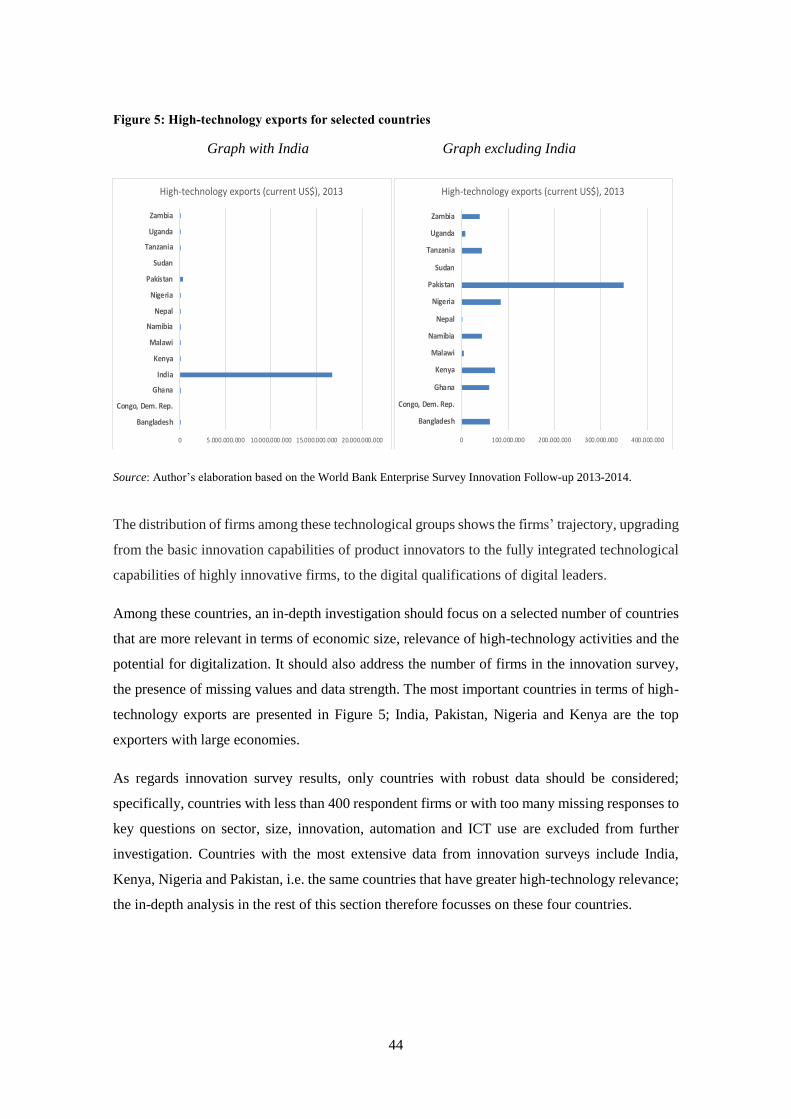
44
Figure 5: High-technology exports for selected countries
Graph with India Graph excluding India
Source: Author’s elaboration based on the World Bank Enterprise Survey Innovation Follow-up 2013-2014.
The distribution of firms among these technological groups shows the firms’ trajectory, upgrading
from the basic innovation capabilities of product innovators to the fully integrated technological
capabilities of highly innovative firms, to the digital qualifications of digital leaders.
Among these countries, an in-depth investigation should focus on a selected number of countries
that are more relevant in terms of economic size, relevance of high-technology activities and the
potential for digitalization. It should also address the number of firms in the innovation survey,
the presence of missing values and data strength. The most important countries in terms of high-
technology exports are presented in Figure 5; India, Pakistan, Nigeria and Kenya are the top
exporters with large economies.
As regards innovation survey results, only countries with robust data should be considered;
specifically, countries with less than 400 respondent firms or with too many missing responses to
key questions on sector, size, innovation, automation and ICT use are excluded from further
investigation. Countries with the most extensive data from innovation surveys include India,
Kenya, Nigeria and Pakistan, i.e. the same countries that have greater high-technology relevance;
the in-depth analysis in the rest of this section therefore focusses on these four countries.
Source: Own calculations based on The World Bank data
0 5.000.000.000 10.000.000.000 15.000.000.000 20.000.000.000
Bangladesh
Congo, Dem. Rep.
Ghana
India
Kenya
Malawi
Namibia
Nepal
Nigeria
Pakistan
Sudan
Tanzania
Uganda
Zambia
High-technology exports (current US$), 2013
0 100.000.000 200.000.000 300.000.000 400.000.000
Bangladesh
Congo, Dem. Rep.
Ghana
Kenya
Malawi
Namibia
Nepal
Nigeria
Pakistan
Sudan
Tanzania
Uganda
Zambia
High-technology exports (current US$), 2013
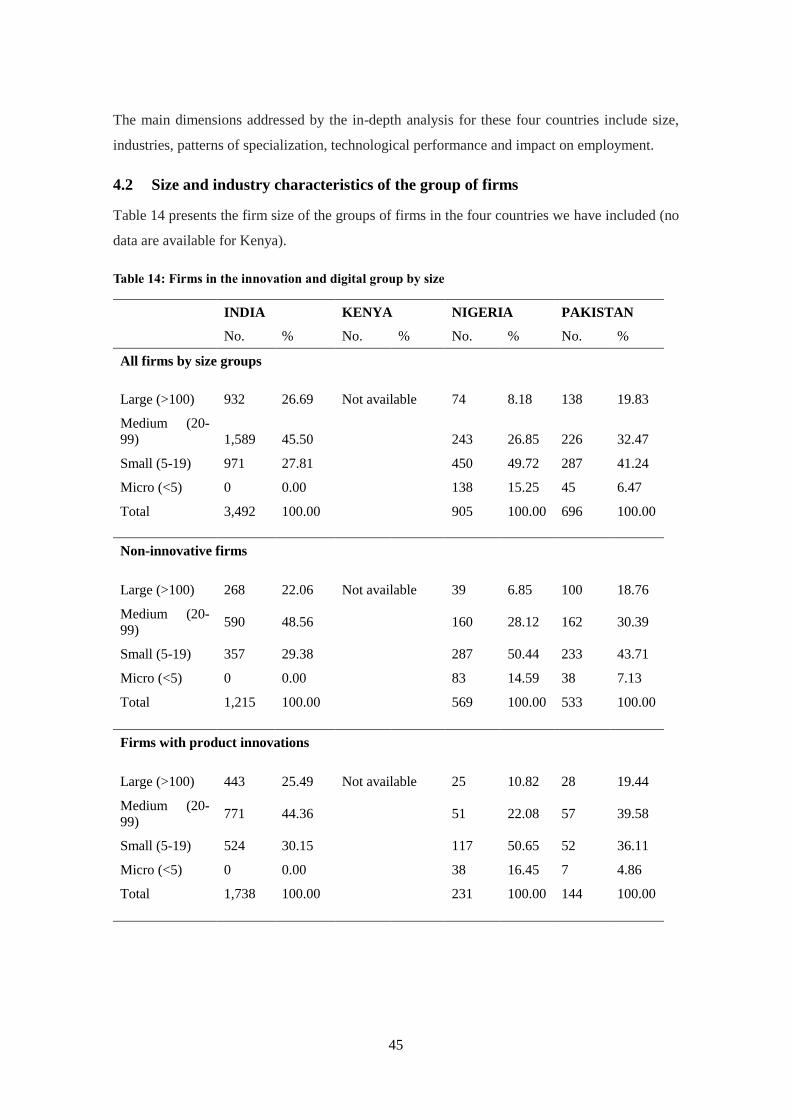
45
The main dimensions addressed by the in-depth analysis for these four countries include size,
industries, patterns of specialization, technological performance and impact on employment.
4.2 Size and industry characteristics of the group of firms
Table 14 presents the firm size of the groups of firms in the four countries we have included (no
data are available for Kenya).
Table 14: Firms in the innovation and digital group by size
INDIA KENYA NIGERIA PAKISTAN
No. % No. % No. % No. %
All firms by size groups
Large (>100) 932 26.69 Not available 74 8.18 138 19.83
Medium (20-
99) 1,589 45.50
243 26.85 226 32.47
Small (5-19) 971 27.81
450 49.72 287 41.24
Micro (<5) 0 0.00
138 15.25 45 6.47
Total 3,492 100.00
905 100.00 696 100.00
Non-innovative firms
Large (>100) 268 22.06 Not available 39 6.85 100 18.76
Medium (20-
99) 590 48.56
160 28.12 162 30.39
Small (5-19) 357 29.38
287 50.44 233 43.71
Micro (<5) 0 0.00
83 14.59 38 7.13
Total 1,215 100.00
569 100.00 533 100.00
Firms with product innovations
Large (>100) 443 25.49 Not available 25 10.82 28 19.44
Medium (20-
99) 771 44.36
51 22.08 57 39.58
Small (5-19) 524 30.15
117 50.65 52 36.11
Micro (<5) 0 0.00
38 16.45 7 4.86
Total 1,738 100.00
231 100.00 144 100.00

46
Highly innovative firms
Large (>100) 190 39.18 Not available 9 9.89 8 61.54
Medium (20-
99) 212 43.71
29 31.87 5 38.46
Small (5-19) 83 17.11
41 45.05 0 0.00
Micro (<5) 0 0.00
12 13.19 0 0.00
Total 485 100.00
91 100.00 13 100.00
Digital leaders
Large (>100) 31 59.62 Not available 1 25.00 0 0.00
Medium (20-
99) 16 30.77
2 50.00 1 100.00
Small (5-19) 5 9.62
1 25.00 0 0.00
Micro (<5) 0 0.00
0 0.00 0 0.00
Total 52 100.00
4 100.00 1 100.00
Note: The size of the firm was defined on the basis of the number of permanent full-time workers: micro (less than 5
employees), small (5 to 19 employees), medium (20 to 99 employees), and large (more than 99 employees).
Source: Author’s elaboration based on the World Bank Enterprise Survey Innovation Follow-up 2013-2014.
Large firms show strong differences across countries, but their share in total firms and in product
innovators is largely the same. In India, large firms account for 27 per cent of all firms and 25 per
cent of product innovators; in Nigeria, the shares are 8 per cent and 11 per cent, respectively; in
Pakistan, 20 per cent are large firms and 19 per cent of all firms are product innovators. Medium-
sized firms account for about 40 per cent of product innovators in both India and Pakistan, and 22
per cent in Nigeria. Micro firms (under 5 employees) were included in the surveys of Nigeria and
Pakistan; in Nigeria, the share of small and micro firms that are product innovators is 16 per cent,
and 5 per cent in Pakistan. Moving to highly innovative firms, we again find that large firms are
not the only relevant technological players. In India, large and medium sized firms have similar
shares of highly innovative firms at around 40 per cent; in Pakistan, large firms account for 62
per cent of highly innovative firms, while in Nigeria, smaller firms dominate in the group of
highly innovative firms.
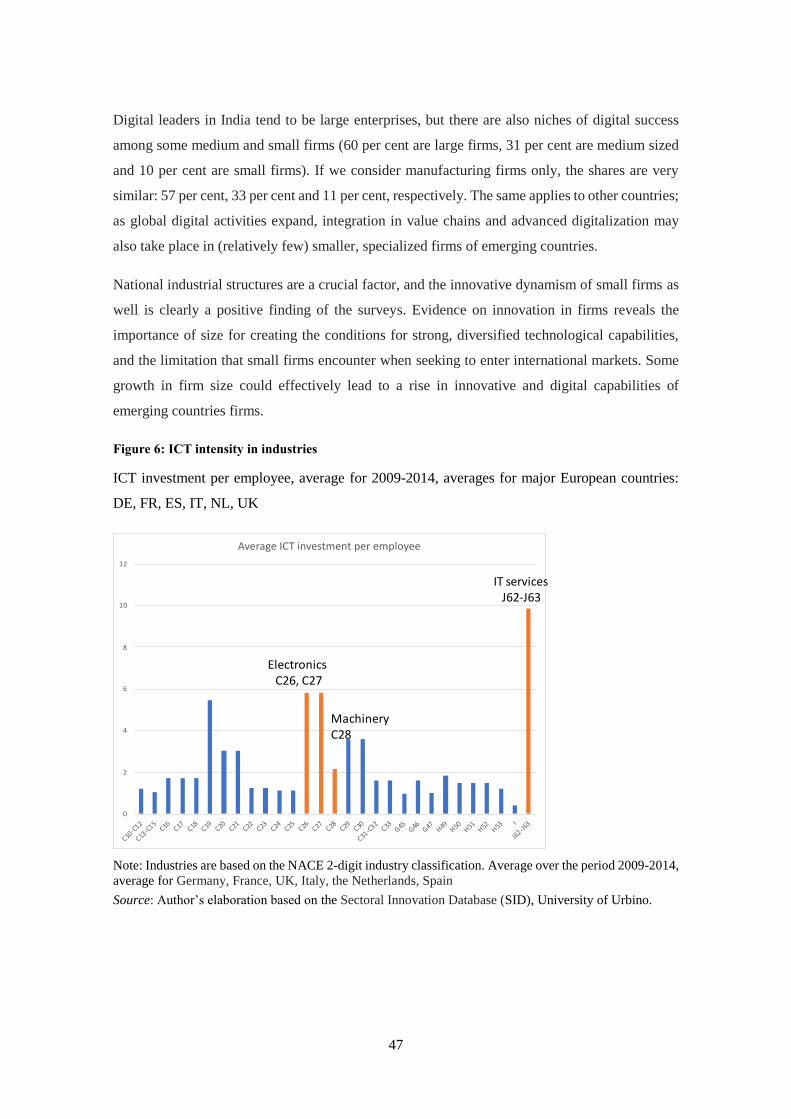
47
Digital leaders in India tend to be large enterprises, but there are also niches of digital success
among some medium and small firms (60 per cent are large firms, 31 per cent are medium sized
and 10 per cent are small firms). If we consider manufacturing firms only, the shares are very
similar: 57 per cent, 33 per cent and 11 per cent, respectively. The same applies to other countries;
as global digital activities expand, integration in value chains and advanced digitalization may
also take place in (relatively few) smaller, specialized firms of emerging countries.
National industrial structures are a crucial factor, and the innovative dynamism of small firms as
well is clearly a positive finding of the surveys. Evidence on innovation in firms reveals the
importance of size for creating the conditions for strong, diversified technological capabilities,
and the limitation that small firms encounter when seeking to enter international markets. Some
growth in firm size could effectively lead to a rise in innovative and digital capabilities of
emerging countries firms.
Figure 6: ICT intensity in industries
ICT investment per employee, average for 2009-2014, averages for major European countries:
DE, FR, ES, IT, NL, UK
Note: Industries are based on the NACE 2-digit industry classification. Average over the period 2009-2014,
average for Germany, France, UK, Italy, the Netherlands, Spain
Source: Author’s elaboration based on the Sectoral Innovation Database (SID), University of Urbino.
0
2
4
6
8
10
12
C10-C
12
C13-C
15C16 C17 C18 C19 C20 C21 C22 C23 C24 C25 C26 C27 C28 C29 C30
C31-C
32C33 G45 G46 G47 H49 H50 H51 H52 H53
I
J62-J6
3
Average ICT investment per employee
Electronics C26, C27
IT services J62-J63
MachineryC28

48
Figure 7: Share of firms introducing product innovations in Europe, ranking of industries
Note: Industries are based on the NACE 2-digit industry classification.
Source: Author’s elaboration based on the Sectoral Innovation Database (SID), University of Urbino.
The industrial structure of emerging countries is crucial for understanding their potential for
innovation and digitalization. The relevance of manufacturing vs. services is one first important
distinction. Industries with greater potential for innovation and digitalization must also be
identified. We rely on the extensive evidence from ICT diffusion (see OECD, 2018) and
innovation surveys in Europe and look at industries with the highest indicators of digitalization
and innovation. The ranking of industries based on these indicators tend to be stable across both
advanced and emerging countries. To identify the sectors of manufacturing and services with the
greatest potential for digitalization, we first consider the importance of ICT investment per
employee in all industries. We use the NACE classification (listed in Table 3 in the Appendix)
adopted by the Sectoral Innovation Database (SID) developed at the University of Urbino (see
Pianta et al., 2019). Figure 6 presents data for the average of six major EU countries (Germany,
France, UK, Italy, the Netherlands, Spain) for the period 2009-2014. Information technology
services and electronics have the highest values.
The second indicator is the share of firms introducing product innovations only, a good proxy for
the potential for high innovation; Figure 7 shows the ranking of industries based on the NACE
classification and on data from the Sectoral Innovation Database (SID) for the average of those
countries, considering the innovation survey of 2014 (the ranking of industries is very similar
when we look at firms that have introduced product, process and organizational innovations).
49
Information technology services, chemicals, machinery and electronics are industries with a
greater dynamism in new products.
Moreover, IT services, machinery and electronics are crucial activities for digitalization as they
provide the software and hardware for automation and digital activities. Chemicals is an industry
that is of little relevance for digitalization, in spite of its ability to introduce a large number of
new chemical and pharmaceutical entities (telecommunication is not considered here because this
industry is not available in the World Bank Innovation Survey, as it is included in the transport
industry). In the rest of this analysis, we therefore focus on IT services, machinery and electronics
as ‘digital industries’. Evidence from business and technology studies confirms the key relevance
of these three industries for the prospects of digitalization. The industry analysis addresses the
importance of these industries in detail.
Table 15 presents data for the sectoral composition of firms—again grouped by their innovative
and digital potential—in the four emerging countries included in our study; we consider the
manufacturing/service divide and the relevance of IT services, machinery and electronics.
Manufacturing is important for India and Pakistan (78 per cent and 84 per cent, respectively; no
detailed data is available for Pakistan). India has a more diversified economy and a stronger
presence in high-technology manufacturing and services. Nigeria has a concentration in oil and
natural resources, which are grouped in ‘other industries’. One significant result in India is the
relatively diversified distribution in all firm groups across industries with the highest innovative
performance.
Electronics accounts for 6.5 per cent of all firms, 6.2 per cent of product innovators, 10.5 per cent
of highly innovative firms, 12 per cent of digital leaders. Machinery accounts for 8.6 per cent of
all firms and for 9.3 per cent, 11.1 per cent and 13.4 per cent of firm groups, respectively.
Information technology services represent a small share of all firms; the remaining manufacturing
and service firms, including some traditional industries, account for 82 per cent of all firms;
product innovators and highly innovative firms account for similar shares. The range of industries
with technologically dynamic firms appears to be a factor of strength of India’s industry,
broadening the base from which digital players could emerge. Conversely, in the case of Nigeria,
high-technology manufacturing and services appear to be of modest relevance for the country’s
innovative performance.
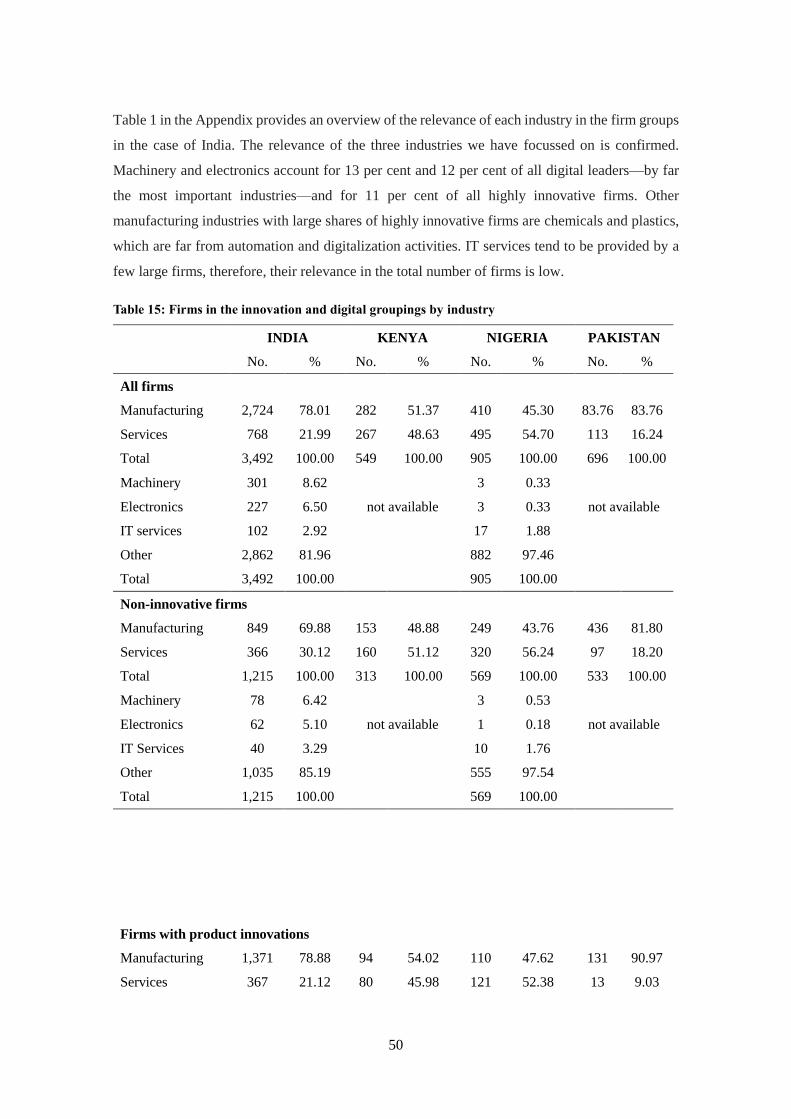
50
Table 1 in the Appendix provides an overview of the relevance of each industry in the firm groups
in the case of India. The relevance of the three industries we have focussed on is confirmed.
Machinery and electronics account for 13 per cent and 12 per cent of all digital leaders—by far
the most important industries—and for 11 per cent of all highly innovative firms. Other
manufacturing industries with large shares of highly innovative firms are chemicals and plastics,
which are far from automation and digitalization activities. IT services tend to be provided by a
few large firms, therefore, their relevance in the total number of firms is low.
Table 15: Firms in the innovation and digital groupings by industry
INDIA KENYA NIGERIA PAKISTAN
No. % No. % No. % No. %
All firms
Manufacturing 2,724 78.01 282 51.37 410 45.30 83.76 83.76
Services 768 21.99 267 48.63 495 54.70 113 16.24
Total 3,492 100.00 549 100.00 905 100.00 696 100.00
Machinery 301 8.62 3 0.33
Electronics 227 6.50 not available 3 0.33 not available
IT services 102 2.92 17 1.88
Other 2,862 81.96 882 97.46
Total 3,492 100.00 905 100.00
Non-innovative firms
Manufacturing 849 69.88 153 48.88 249 43.76 436 81.80
Services 366 30.12 160 51.12 320 56.24 97 18.20
Total 1,215 100.00 313 100.00 569 100.00 533 100.00
Machinery 78 6.42
3 0.53
Electronics 62 5.10 not available 1 0.18 not available
IT Services 40 3.29
10 1.76
Other 1,035 85.19
555 97.54
Total 1,215 100.00
569 100.00
Firms with product innovations
Manufacturing 1,371 78.88 94 54.02 110 47.62 131 90.97
Services 367 21.12 80 45.98 121 52.38 13 9.03

51
Total 1,738 100.00 174 100.00 231 100.00 144 100.00
Machinery 162 9.32
0 0.00
Electronics 108 6.21 not available 2 0.87 not available
IT services 57 3.28
6 2.60
Other 1,411 81.19
223 96.54
Total 1,738 100.00
231 100.00
Highly innovative firms
Manufacturing 458 94.43 32 58.18 40 43.96 12 92.31
Services 27 5.57 23 41.82 51 56.04 1 7.69
Total 485 100.00 55 100.00 91 100.00 13 100.00
Machinery 54 11.13
0 0.00
Electronics 51 10.52 not available 0 0.00 not available
IT services 4 0.82
1 1.10
Other 376 77.53
90 98.90
Total 485 100.00
91 100.00
Digital leaders
Manufacturing 46 88.46 2 50.00 3 75.00 0 0.00
Services 6 11.54 2 50.00 1 25.00 1 100.00
Total 52 100.00 4 100.00 4 100.00 1 100.00
Machinery 7 13.46
0 0.00
Electronics 6 11.54 not available 0 0.00 not available
IT Services 1 1.92
0 0.00
Other 38 73.08
4 100.00
Total 52 100.00
4 100.00
Note: Machinery (29-30), electronics (30-31) and IT services (72) are industries with high ICT and innovative
characteristics. ISIC Rev. 3.1 industry classification code in parenthesis.
Source: Author’s elaboration based on the World Bank Enterprise Survey Innovation Follow-up 2013-2014.
4.3 Technological and employment performance of firm grouping
Table 16 presents a key indicator of technological performance, i.e. the ability of firms to apply
for a patent for a new product they have developed. Patents are an output indicator for the success
and originality of a firm’s invention (see Archibugi and Pianta, 1996). Moreover, in global
technology markets, they indicate the international relevance of a firm’s technology.
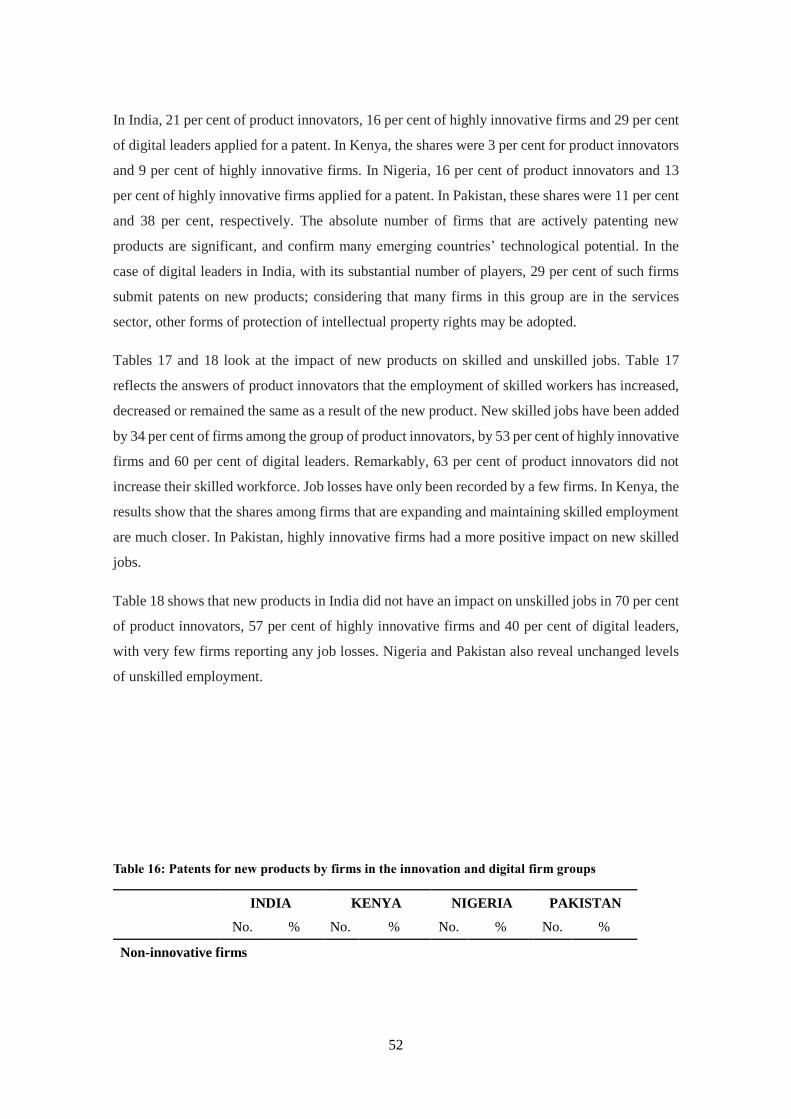
52
In India, 21 per cent of product innovators, 16 per cent of highly innovative firms and 29 per cent
of digital leaders applied for a patent. In Kenya, the shares were 3 per cent for product innovators
and 9 per cent of highly innovative firms. In Nigeria, 16 per cent of product innovators and 13
per cent of highly innovative firms applied for a patent. In Pakistan, these shares were 11 per cent
and 38 per cent, respectively. The absolute number of firms that are actively patenting new
products are significant, and confirm many emerging countries’ technological potential. In the
case of digital leaders in India, with its substantial number of players, 29 per cent of such firms
submit patents on new products; considering that many firms in this group are in the services
sector, other forms of protection of intellectual property rights may be adopted.
Tables 17 and 18 look at the impact of new products on skilled and unskilled jobs. Table 17
reflects the answers of product innovators that the employment of skilled workers has increased,
decreased or remained the same as a result of the new product. New skilled jobs have been added
by 34 per cent of firms among the group of product innovators, by 53 per cent of highly innovative
firms and 60 per cent of digital leaders. Remarkably, 63 per cent of product innovators did not
increase their skilled workforce. Job losses have only been recorded by a few firms. In Kenya, the
results show that the shares among firms that are expanding and maintaining skilled employment
are much closer. In Pakistan, highly innovative firms had a more positive impact on new skilled
jobs.
Table 18 shows that new products in India did not have an impact on unskilled jobs in 70 per cent
of product innovators, 57 per cent of highly innovative firms and 40 per cent of digital leaders,
with very few firms reporting any job losses. Nigeria and Pakistan also reveal unchanged levels
of unskilled employment.
Table 16: Patents for new products by firms in the innovation and digital firm groups
INDIA KENYA NIGERIA PAKISTAN
No. % No. % No. % No. %
Non-innovative firms
53
Yes 83 6.83 5 1.60 12 2.11 17 3.19
No 1,105 90.95 305 97.44 545 95.78 499 93.62
Do not know 27 2.22 3 0.96 12 2.11 17 3.19
Total 1,215 100.00 313 100.00 569 100.00 533 100.00
Firms with product innovations
Yes 372 21.40 6 3.45 36 15.58 16 11.11
No 1,357 78.08 165 94.83 189 81.82 121 84.03
Do not know 9 0.52 3 1.72 6 2.60 7 4.86
Total 1,738 100.00 174 100.00 231 100.00 144 100.00
Highly innovative firms
Yes 76 15.67 5 9.09 12 13.19 5 38.46
No 405 83.51 50 90.91 78 85.71 7 53.85
Do not know 4 0.82
1 1.10 1 7.69
Total 485 100.00 55 100.00 91 100.00 13 100.00
Digital leaders
Yes 15 28.85 0 0.00 2 50.00 0 0.00
No 36 69.23 4 100.00 2 50.00 1 100.00
Do not know 1 1.92 0 0.00
0 0.00
Total 52 100.00 4 100.00 4 100.00 1 100.00
Source: Author’s elaboration based on the World Bank Enterprise Survey Innovation Follow-up 2013-2014.
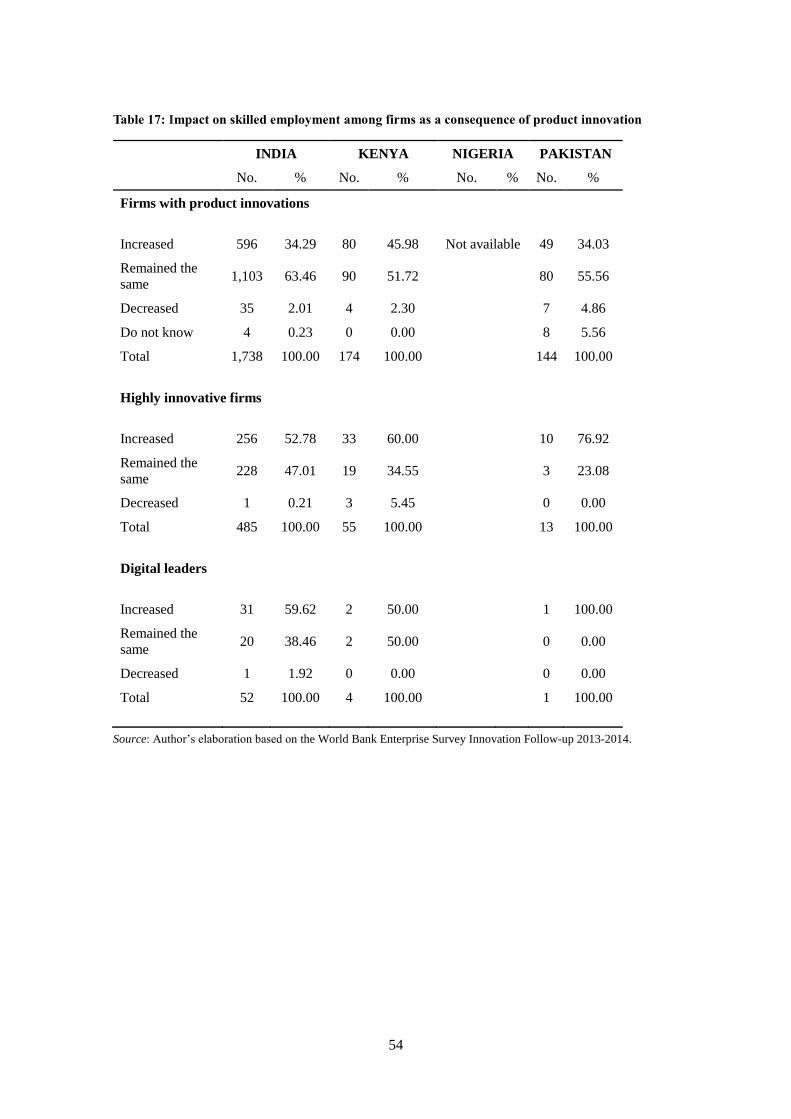
54
Table 17: Impact on skilled employment among firms as a consequence of product innovation
INDIA KENYA NIGERIA PAKISTAN
No. % No. % No. % No. %
Firms with product innovations
Increased 596 34.29 80 45.98 Not available 49 34.03
Remained the
same 1,103 63.46 90 51.72
80 55.56
Decreased 35 2.01 4 2.30
7 4.86
Do not know 4 0.23 0 0.00
8 5.56
Total 1,738 100.00 174 100.00
144 100.00
Highly innovative firms
Increased 256 52.78 33 60.00
10 76.92
Remained the
same 228 47.01 19 34.55
3 23.08
Decreased 1 0.21 3 5.45
0 0.00
Total 485 100.00 55 100.00
13 100.00
Digital leaders
Increased 31 59.62 2 50.00
1 100.00
Remained the
same 20 38.46 2 50.00
0 0.00
Decreased 1 1.92 0 0.00
0 0.00
Total 52 100.00 4 100.00
1 100.00
Source: Author’s elaboration based on the World Bank Enterprise Survey Innovation Follow-up 2013-2014.
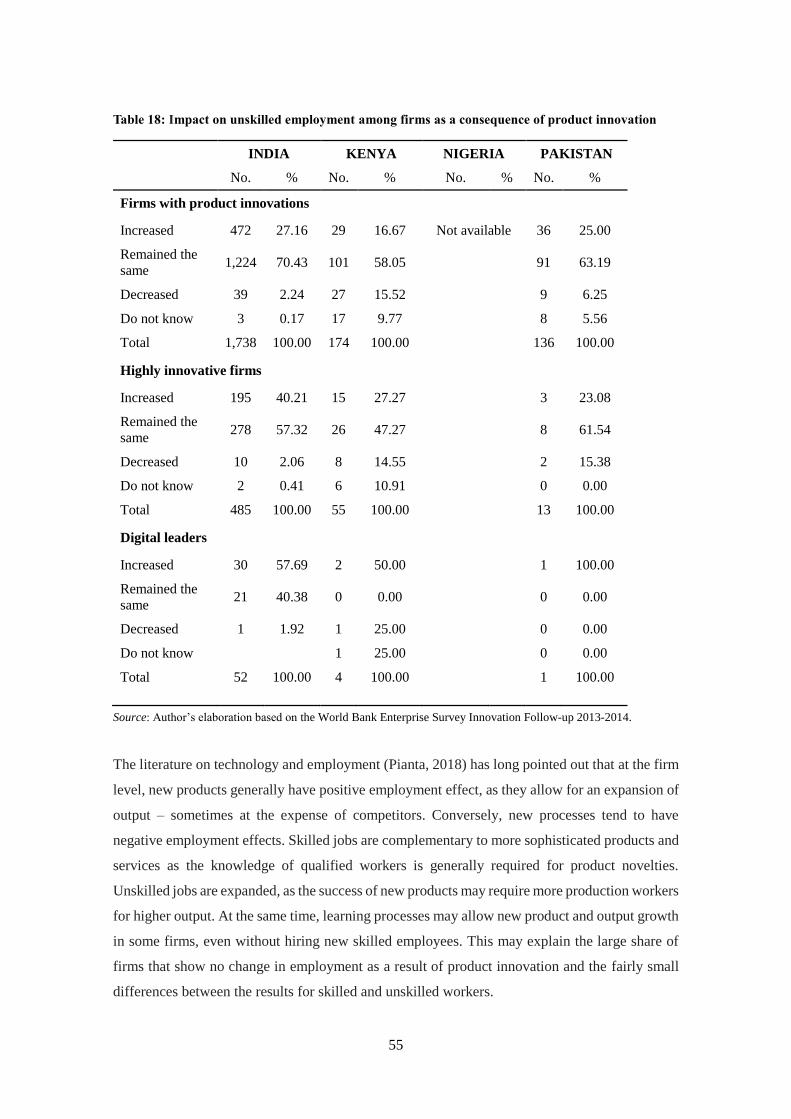
55
Table 18: Impact on unskilled employment among firms as a consequence of product innovation
INDIA KENYA NIGERIA PAKISTAN
No. % No. % No. % No. %
Firms with product innovations
Increased 472 27.16 29 16.67 Not available 36 25.00
Remained the
same 1,224 70.43 101 58.05
91 63.19
Decreased 39 2.24 27 15.52
9 6.25
Do not know 3 0.17 17 9.77
8 5.56
Total 1,738 100.00 174 100.00
136 100.00
Highly innovative firms
Increased 195 40.21 15 27.27
3 23.08
Remained the
same 278 57.32 26 47.27
8 61.54
Decreased 10 2.06 8 14.55
2 15.38
Do not know 2 0.41 6 10.91
0 0.00
Total 485 100.00 55 100.00
13 100.00
Digital leaders
Increased 30 57.69 2 50.00
1 100.00
Remained the
same 21 40.38 0 0.00
0 0.00
Decreased 1 1.92 1 25.00
0 0.00
Do not know
1 25.00
0 0.00
Total 52 100.00 4 100.00
1 100.00
Source: Author’s elaboration based on the World Bank Enterprise Survey Innovation Follow-up 2013-2014.
The literature on technology and employment (Pianta, 2018) has long pointed out that at the firm
level, new products generally have positive employment effect, as they allow for an expansion of
output – sometimes at the expense of competitors. Conversely, new processes tend to have
negative employment effects. Skilled jobs are complementary to more sophisticated products and
services as the knowledge of qualified workers is generally required for product novelties.
Unskilled jobs are expanded, as the success of new products may require more production workers
for higher output. At the same time, learning processes may allow new product and output growth
in some firms, even without hiring new skilled employees. This may explain the large share of
firms that show no change in employment as a result of product innovation and the fairly small
differences between the results for skilled and unskilled workers.
56
4.4 Innovation and digitalization in India
The relationships between digitalization and overall innovative capabilities in firms are complex.
In this section, we carry out a more detailed investigation of India by matching different degrees
of digital activities in firms and overall innovative performance. Based on the World Bank
questionnaire, we identify five indicators of digitalization: 1) Share of employees who regularly
use computers is above 50 per cent; 2) Purchase or in-house development of software; 3) Presence
of IT employees; 4) Presence of external computer/software consultants; and 5) Use of ICTs
across the entire range of business activities listed in the questionnaire. We construct dummy
variables for each indicator and based on their sum, define four groups: 1) No digital activities:
sum of dummies equal to 0; 2) Low digital activities: sum of dummies equal to 1 or 2; 3) Medium
digital activities: sum of dummies equal to 3 or 4; 4) High digital activities: sum of dummies
equal to 5. Data on India, reported in Table 19, reveal the following highlights:
Thirty per cent of firms have a medium or high level of digitalization (scores 3, 4, 5), with a
significant or systematic use of ICTs in business activities. These are mainly large firms. About
two-thirds are in manufacturing, are innovators in products and in processes and carry out R&D.
They are highly innovative and digital, and lie at the forefront of technological change and
digitalization.
Seventy per cent of firms have no or low digitalization (scores 0, 1, 2), with a lack or very
modest use of ICTs in business activities. They are mostly small and medium firms. Three-
quarters of these firms are engaged in manufacturing. About two-thirds are capable of introducing
innovations in products or processes; half of the firms carry out R&D. They combine some
innovative capabilities with no or low digitalization. They appear to be engaged in manufacturing
niches where digitalization is secondary to the diffusion and adoption of production technologies,
with the acquisition of new machinery and product imitation.

57
Table 19: India, digitalization and innovative activities
Absolute values
Number Large Product Process R&D Highly innov.
of firms Firms innovators innovators performers Firms
No. digital activities
Manufacturing 527 66 356 350 217 45
Total 666 76 441 425 242 48
Low digital activities
Manufacturing 1290 385 905 961 752 278
Total 1627 453 1079 1178 848 292
Medium digital activities
Manufacturing 603 255 431 437 417 161
Total 825 337 535 577 508 171
High digital activities
Manufacturing 12 11 11 8 8 3
Total 52 38 44 24 27 8
Tot. Manuf. 2432 717 1703 1756 1394 487
Total all firms 3170 904 2099 2204 1625 519
Percentages of total firms
Number Large Product Process R&D Highly innov.
of firms firms innovators innovators performers firms
No digital activities
Manufacturing 22% 3% 15% 14% 9% 2%
Total 21% 2% 14% 13% 8% 2%
Low digital activities
Manufacturing 53% 16% 37% 40% 31% 11%
Total 51% 14% 34% 37% 27% 9%
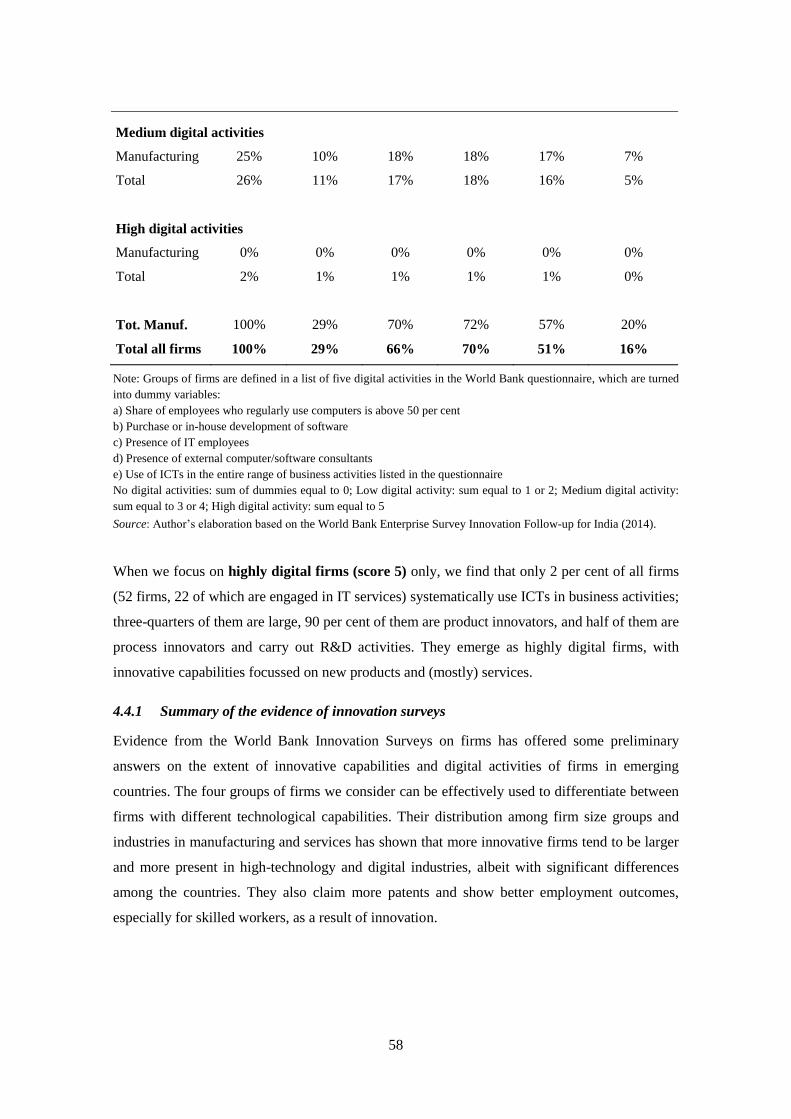
58
Medium digital activities
Manufacturing 25% 10% 18% 18% 17% 7%
Total 26% 11% 17% 18% 16% 5%
High digital activities
Manufacturing 0% 0% 0% 0% 0% 0%
Total 2% 1% 1% 1% 1% 0%
Tot. Manuf. 100% 29% 70% 72% 57% 20%
Total all firms 100% 29% 66% 70% 51% 16%
Note: Groups of firms are defined in a list of five digital activities in the World Bank questionnaire, which are turned
into dummy variables:
a) Share of employees who regularly use computers is above 50 per cent
b) Purchase or in-house development of software
c) Presence of IT employees
d) Presence of external computer/software consultants
e) Use of ICTs in the entire range of business activities listed in the questionnaire
No digital activities: sum of dummies equal to 0; Low digital activity: sum equal to 1 or 2; Medium digital activity:
sum equal to 3 or 4; High digital activity: sum equal to 5
Source: Author’s elaboration based on the World Bank Enterprise Survey Innovation Follow-up for India (2014).
When we focus on highly digital firms (score 5) only, we find that only 2 per cent of all firms
(52 firms, 22 of which are engaged in IT services) systematically use ICTs in business activities;
three-quarters of them are large, 90 per cent of them are product innovators, and half of them are
process innovators and carry out R&D activities. They emerge as highly digital firms, with
innovative capabilities focussed on new products and (mostly) services.
4.4.1 Summary of the evidence of innovation surveys
Evidence from the World Bank Innovation Surveys on firms has offered some preliminary
answers on the extent of innovative capabilities and digital activities of firms in emerging
countries. The four groups of firms we consider can be effectively used to differentiate between
firms with different technological capabilities. Their distribution among firm size groups and
industries in manufacturing and services has shown that more innovative firms tend to be larger
and more present in high-technology and digital industries, albeit with significant differences
among the countries. They also claim more patents and show better employment outcomes,
especially for skilled workers, as a result of innovation.
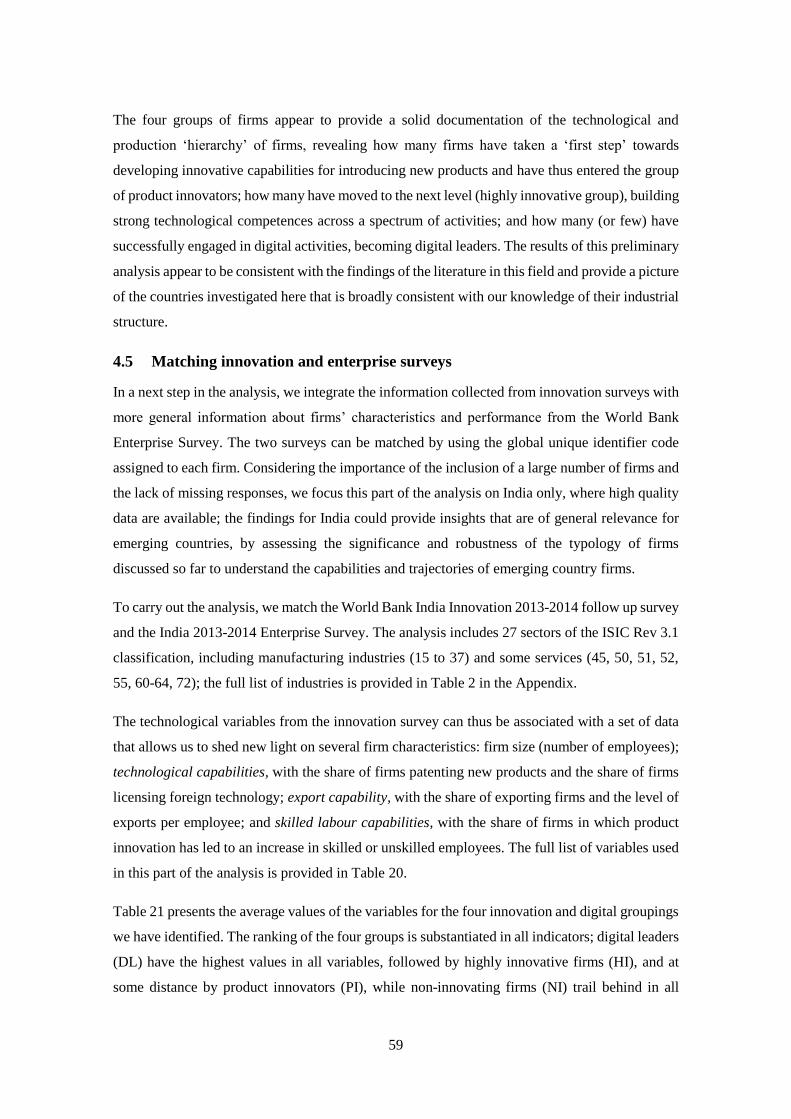
59
The four groups of firms appear to provide a solid documentation of the technological and
production ‘hierarchy’ of firms, revealing how many firms have taken a ‘first step’ towards
developing innovative capabilities for introducing new products and have thus entered the group
of product innovators; how many have moved to the next level (highly innovative group), building
strong technological competences across a spectrum of activities; and how many (or few) have
successfully engaged in digital activities, becoming digital leaders. The results of this preliminary
analysis appear to be consistent with the findings of the literature in this field and provide a picture
of the countries investigated here that is broadly consistent with our knowledge of their industrial
structure.
4.5 Matching innovation and enterprise surveys
In a next step in the analysis, we integrate the information collected from innovation surveys with
more general information about firms’ characteristics and performance from the World Bank
Enterprise Survey. The two surveys can be matched by using the global unique identifier code
assigned to each firm. Considering the importance of the inclusion of a large number of firms and
the lack of missing responses, we focus this part of the analysis on India only, where high quality
data are available; the findings for India could provide insights that are of general relevance for
emerging countries, by assessing the significance and robustness of the typology of firms
discussed so far to understand the capabilities and trajectories of emerging country firms.
To carry out the analysis, we match the World Bank India Innovation 2013-2014 follow up survey
and the India 2013-2014 Enterprise Survey. The analysis includes 27 sectors of the ISIC Rev 3.1
classification, including manufacturing industries (15 to 37) and some services (45, 50, 51, 52,
55, 60-64, 72); the full list of industries is provided in Table 2 in the Appendix.
The technological variables from the innovation survey can thus be associated with a set of data
that allows us to shed new light on several firm characteristics: firm size (number of employees);
technological capabilities, with the share of firms patenting new products and the share of firms
licensing foreign technology; export capability, with the share of exporting firms and the level of
exports per employee; and skilled labour capabilities, with the share of firms in which product
innovation has led to an increase in skilled or unskilled employees. The full list of variables used
in this part of the analysis is provided in Table 20.
Table 21 presents the average values of the variables for the four innovation and digital groupings
we have identified. The ranking of the four groups is substantiated in all indicators; digital leaders
(DL) have the highest values in all variables, followed by highly innovative firms (HI), and at
some distance by product innovators (PI), while non-innovating firms (NI) trail behind in all

60
indicators. The groups we have identified appear robust and relevant for understanding the
diversity of firms in terms of their innovation capabilities and ability to move towards
digitalization.
We now consider the different sets of capabilities discussed at the beginning of this section and
examine the position of each group to assess the extent to which greater innovation and digital
capabilities are associated with higher capabilities in technology, export and skilled labour.
Table 20: List of variables for enterprise analysis, India, 2013-2014
List of
variables Label
QDIGIND
Share of firms in digital industries (electronics, machinery and IT
services)
SIZE
Size of the firm (average number of
employees)
QEXPFIRM
Share of exporting firms (condition:
export>0)
QPAT
Share of firms patenting new
products
QTECH
Share of firms licensing foreign
technology
QISKIL
Share of firms increasing the number of skilled workers as a consequence of product
innovation
QIUNSK
Share of firms increasing the number of unskilled workers as a consequence of product
innovation
EXPEMP Export per employee
DL Digital leaders
HI Highly innovative firms
PI Product innovators
NI Firms that are not product innovators
Source: Authors’ elaboration
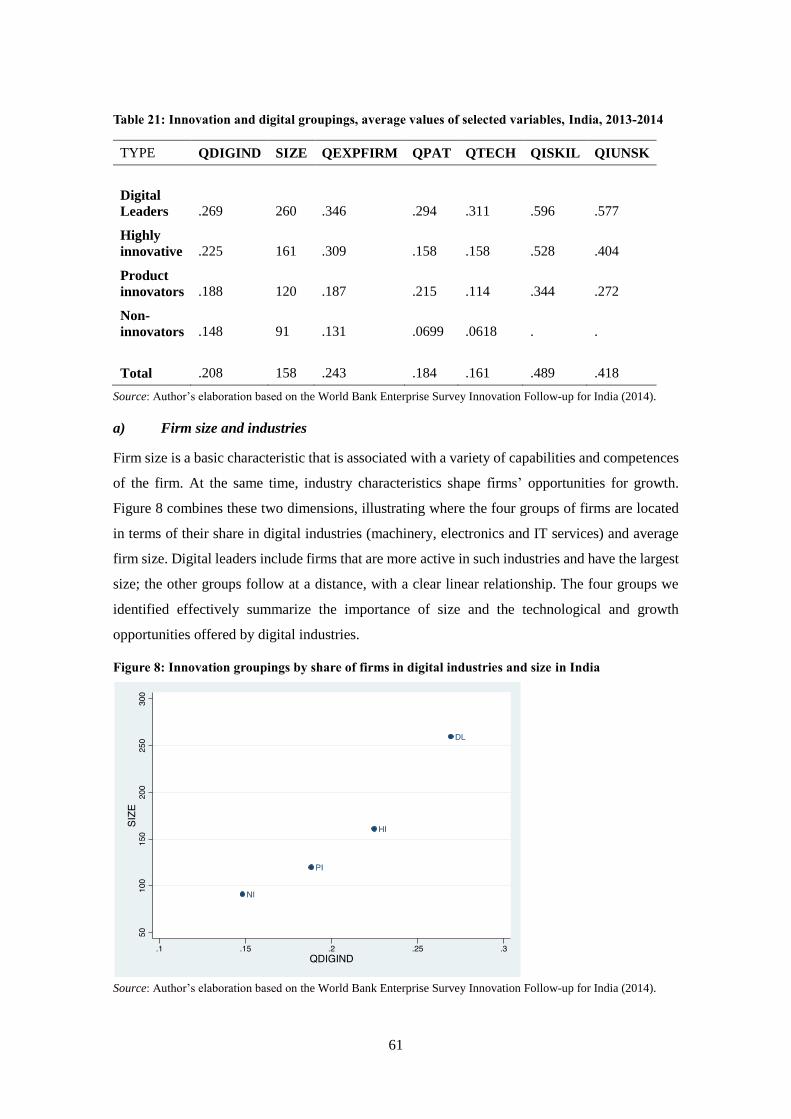
61
Table 21: Innovation and digital groupings, average values of selected variables, India, 2013-2014
TYPE QDIGIND SIZE QEXPFIRM QPAT QTECH QISKIL QIUNSK
Digital
Leaders .269 260 .346 .294 .311 .596 .577
Highly
innovative .225 161 .309 .158 .158 .528 .404
Product
innovators .188 120 .187 .215 .114 .344 .272
Non-
innovators .148 91 .131 .0699 .0618 . .
Total .208 158 .243 .184 .161 .489 .418
Source: Author’s elaboration based on the World Bank Enterprise Survey Innovation Follow-up for India (2014).
a) Firm size and industries
Firm size is a basic characteristic that is associated with a variety of capabilities and competences
of the firm. At the same time, industry characteristics shape firms’ opportunities for growth.
Figure 8 combines these two dimensions, illustrating where the four groups of firms are located
in terms of their share in digital industries (machinery, electronics and IT services) and average
firm size. Digital leaders include firms that are more active in such industries and have the largest
size; the other groups follow at a distance, with a clear linear relationship. The four groups we
identified effectively summarize the importance of size and the technological and growth
opportunities offered by digital industries.
Figure 8: Innovation groupings by share of firms in digital industries and size in India
Source: Author’s elaboration based on the World Bank Enterprise Survey Innovation Follow-up for India (2014).
62
b) External and internal technological capabilities of firms
How can we assess firms’ technological capabilities? And what are the sources of the
technological capabilities of firms in the four groups? In particular, is there a complementarity or
trade-off between the acquisition of foreign technology and the ability to develop inventions and
innovations internally? Figures 9 and 10 address these questions.
Figure 9 combines industry characteristics with the importance of patenting. Digital leaders are
more active in digital industries and have the highest share of firms with patents. Highly
innovative firms are also more active in digital industries but claim fewer patents than product
innovators. Non-innovators are only modestly active in digital industries with very few firms
claiming patents.
Figure 10 combines the two alternative sources of technological capabilities, namely the
acquisition of foreign licenses and the internal ability to claim patents. The same linear
relationship appears again for the four groups, with greater external acquisitions being associated
with greater patenting activity; highly innovative firms appear to be relatively more active in
foreign acquisition—associated with the variety of efforts they undertake to produce new
products, processes and automation—while product innovators are more active in the patenting
of new products.
This finding shows that technological capabilities for the aggregate of firms included in the four
groups, are the result of the complementarities between external acquisition of know-how, which
is necessary when firms want to enter new technology fields, and the accumulation of internal
capabilities, which eventually results in the successful patenting of new products. It is noteworthy
that digital leaders are the largest users of licenses of foreign technologies; the diversity of
knowledge required by high-tech firms means that the requirements of know-how are greater;
moreover, digital leaders are more integrated in global technology networks and therefore more
capable of acquiring the necessary know-how that cannot be developed internally. This also has
important implications for policies on the protection of IPRs and on incentives to license and
patent.

63
Figure 9: Innovation groupings by share of firms in digital industries and share of firms with patents
in India
Source: Author’s elaboration based on the World Bank Enterprise Survey Innovation Follow-up for India
(2014).
Figure 10: Innovation groupings by share of firms with patents and share of firms with foreign
technology licensing in India
Source: Author’s elaboration based on the World Bank Enterprise Survey Innovation Follow-up for India
(2014).

64
c) Export capabilities
Greater technological capabilities are expected to lead to better economic performance and,
specifically, to greater export success in international markets. In the following figures, we
explore the relevance of digital industries and the acquisition of foreign technologies for
contributing to export dynamism. Figure 11 shows that for the four groups included in our
analysis, the share of exporting firms is closely associated with the share of firms in digital
industries. The greater technological and growth opportunities of digital industries open up greater
possibilities for firm to enter export markets. The share of exporters among digital leaders is one-
third, followed closely by highly innovative firms; values are about three times greater than for
non-innovators. Product innovators tend to mainly operate in the domestic market.
Figure 12 illustrates that opening up to foreign activities works both ways, combining acquisition
of foreign technology with greater presence in export markets. It appears that accessing foreign
know-how is a contributing factor to the ability to develop production capabilities that are relevant
in international markets, opening up export possibilities for firms.
The groups we have identified can account for the development of firms’ export capabilities.
Export capabilities appear to be influenced by industry composition, by the acquisition of external
technology and by the innovation and digital activities summarized in the grouping of firms we
have identified.
Figure 11: Innovation groupings by share of firms in digital industries and share of exporting firms
in India
Source: Author’s elaboration based on the World Bank Enterprise Survey Innovation Follow-up for India (2014).

65
Figure 12: Innovation groupings by share of firms with foreign technology licensing and share of
exporting firms in India
Source: Author’s elaboration based on the World Bank Enterprise Survey Innovation Follow-up for India (2014).
d) Labour capabilities
The relationship between innovation, digitalization and employment is complex, with
opportunities for expanding higher skill jobs and the risk of labour-replacing automation (Pianta,
2018). The available data allow us to assess the impact new products introduced by firms have
had on the amount of high and low skill employees; non-innovators that did not introduce new
products are excluded from this analysis. Figure 13 shows the relationship between firms with a
presence in digital industries and employment growth of both high and low skill workers; first,
for total firms, then, for manufacturing firms only. We find a positive general relationship between
the presence in digital industries and positive employment effects. Among digital leaders, close
to 60 per cent have expanded high skill jobs, and slightly less have increased low skilled jobs as
well; the impact of demand expansion in fast growing industries is a clear driver of such
employment growth. Highly innovative firms show greater differentiation, with over 50 per cent
of firms expanding high skill and 40 per cent expanding low skill jobs. Product innovators have
lower employment dynamism and there is a gap between high and low skill jobs. This gap is
smaller in the case of manufacturing firms only.
Figure 14 shows that the acquisition of foreign technology is positively associated with greater
increases of high skill employment, with the same result for product innovators and digital leaders.
66
This evidence is consistent with the results of the large body of literature on this issue. Fast
growing industries witnessed extensive job creation associated with the role of demand; an
orientation towards product innovation favours employment growth; in high-technology firms,
there is a complementarity between high skills and advanced innovation that favours high skill
jobs. Some of the employment gains documented here—especially for lower skill jobs—may not
be net gains for the economy as a whole, but may result from ‘job poaching’ by innovative firms
(illustrated in the figure) from non-innovative ones (not included in the figure), which may
register large job losses.
The results show that the expansion of high skilled labour is clearly associated with higher
innovative and digital activities in firms as summarized by the four groups we have identified,
confirming the complementarities between human knowledge, technologies acquired from
external sources and the relevance of digital activities.
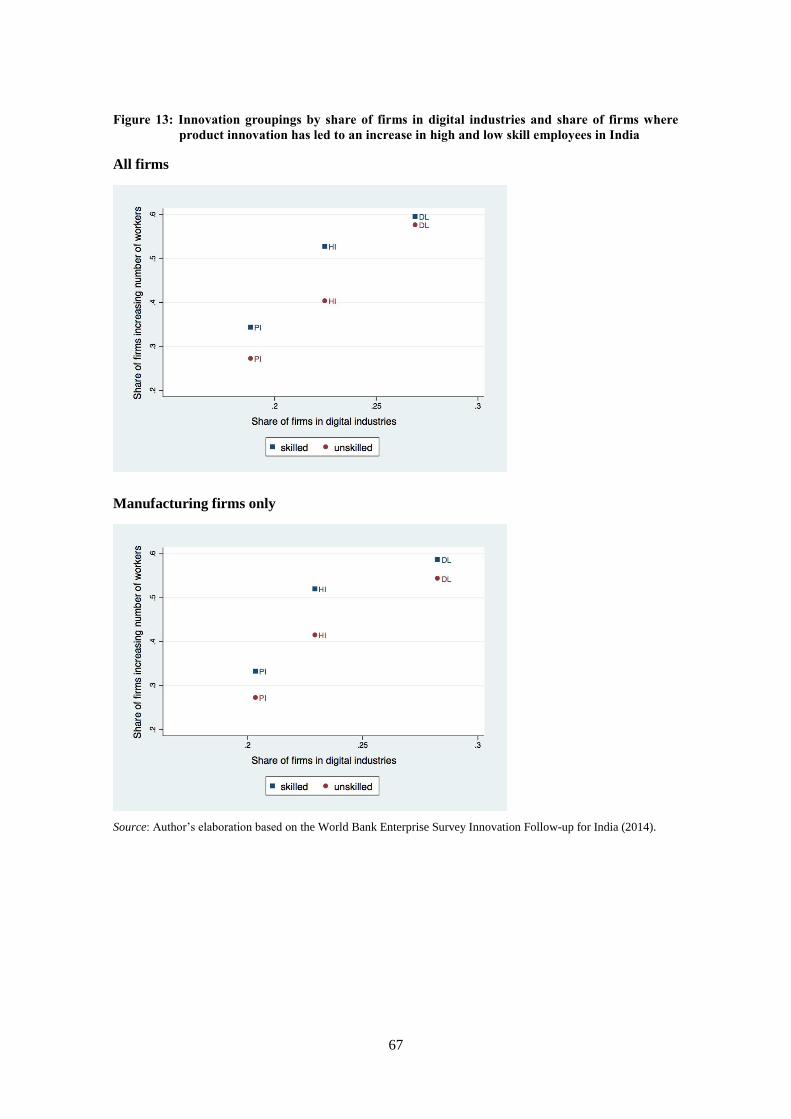
67
Figure 13: Innovation groupings by share of firms in digital industries and share of firms where
product innovation has led to an increase in high and low skill employees in India
All firms
Manufacturing firms only
Source: Author’s elaboration based on the World Bank Enterprise Survey Innovation Follow-up for India (2014).

68
Figure 14: Innovation groupings by share of firms with foreign technology licensing and share of
firms in which product innovation has led to an increase in high skilled labour in India
Source: Author’s elaboration based on the World Bank Enterprise Survey Innovation Follow-up for India (2014).
Figure 15 illustrates the job performance of skilled workers and the share of exporting firms for
digital leaders, highly innovative firms and product innovators, for all firms and for manufacturing
firms only. We find a close relationship; greater export activity is closely linked to better
employment performance, for both all firms and for manufacturing firms only.
An additional performance variable is considered here, namely the level of exports per employee,
which is an important indicator of productivity and success in international markets. The
monetary value of this variable, however, included a number of outliers that could be the result
of either a measurement error or extreme outcomes. Using the blocked adaptive computationally
efficient outlier nominators (BACON) algorithm by Billor, Hadi and Velleman (2000), we find
21 outliers. These firms lie at a considerable distance from the population of firms in terms of
exports and sales per employee, and we excluded them from the analysis. The electronics and
machinery industries account for 30 per cent of these outliers; to ensure more robust findings, we
merge the groups of digital leaders and highly innovative firms.

69
Figure 15: Innovation groupings by share of exporting firms and share of firms in which product
innovation has led to an increase in skilled employees in India
All firms
Manufacturing firms only
Source: Author’s elaboration based on the World Bank Enterprise Survey Innovation Follow-up for India (2014).
Figure 16 shows that the share of firms in digital industries is positively associated with higher
exports per employee. The exports per employee of digital leaders and highly innovative firms
are almost four times higher than those of non-innovating firms, with product innovators that have
an intermediate position. The previous analysis has relied on the share of exporting firms as the
main variable to assess export capabilities, Figure 17 illustrates the close relationship between
this indicator and the level of export per employee. Measures of performance are therefore

70
consistently associated with the innovative and digital activities of firms summarized in the four
groups we identified and with the range of capabilities documented above.
Figure 16: Innovation groupings by share of firms in digital industries and level of exports per
employee in India
All firms
Manufacturing only
Source: Author’s elaboration based on the World Bank Enterprise Survey Innovation Follow-up for India (2014).

71
Figure 17: Innovation groupings by share of exporting firms and level of exports per employee in
India
All firms
Manufacturing only
Source: Author’s elaboration based on the World Bank Enterprise Survey Innovation Follow-up for India
(2014).

72
4.6 Summing up the evidence
The range of analyses carried out in this section using the World Bank Innovation Surveys sheds
new light on how firms in a large number of emerging countries are active in innovation and
digitalization. Grouping firms as digital leaders, highly innovative firms, product innovators and
non-innovators is an effective and robust way to summarize the diversity of technological
capabilities and the ability to move towards digitalization.
More detailed investigations on four major emerging economies—India, Kenya, Nigeria and
Pakistan—have been possible, confirming the stability of the findings on the grouping of firms
and the differences associated with the structure of economies. Additional details have been
provided in the case of India by matching innovation with enterprise surveys.
The grouping of firms we have identified is an important tool for understanding and linking four
types of capabilities that are crucial for the development of firms in emerging countries: 1)
capabilities in innovation and digitalization, 2) capabilities in external and internal technological
development; 3) capabilities in export; and 4) capabilities in skilled labour. We have shown their
relationship and complementarities, as well as the persisting relevance of firm size and industry
characteristics in shaping the opportunities for growth. In the concluding section, we bring
together these results with those of the other sections.
5 Conclusions
Building on the empirical evidence provided so far, we now integrate our findings on FDI flows
and innovation surveys and link them to the typology of emerging country firms proposed in
Section 2.
5.1 Insights from the analysis of FDI projects and innovation surveys
The evidence provided in Sections 3 and 4 describes the environment firms in emerging countries
find themselves in in terms of FDI flows and innovation activities. In terms of FDI, there are
significant flows towards industries and activities that are relevant for the development of
advanced technological capabilities and for digitalization. At the same time, the prevalence of
production-oriented FDI in both incoming and outgoing investments from emerging countries
leaves modest room for FDI that focusses on high skill activities, namely R&D, design and ICT.
In parallel, the evidence from innovation surveys documented in Section 4 demonstrates the
relevance of the ‘hierarchy’ between digital leaders, highly innovative firms, product innovators
and non-innovators.
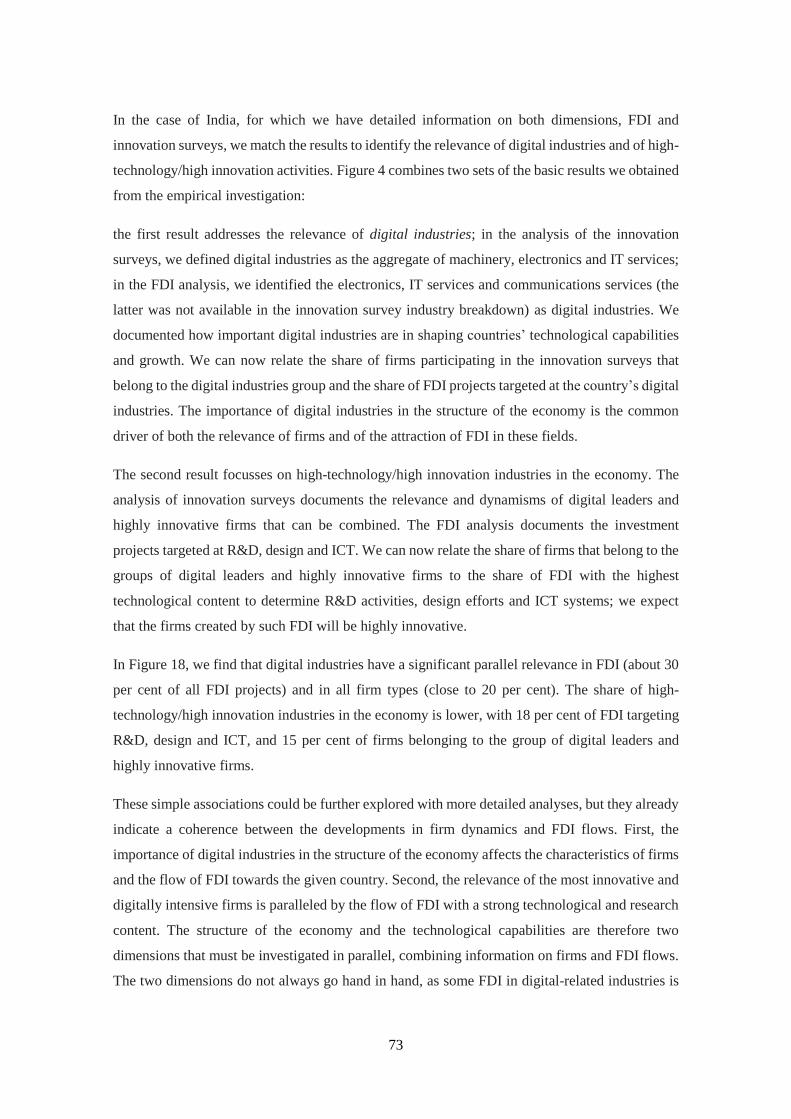
73
In the case of India, for which we have detailed information on both dimensions, FDI and
innovation surveys, we match the results to identify the relevance of digital industries and of high-
technology/high innovation activities. Figure 4 combines two sets of the basic results we obtained
from the empirical investigation:
the first result addresses the relevance of digital industries; in the analysis of the innovation
surveys, we defined digital industries as the aggregate of machinery, electronics and IT services;
in the FDI analysis, we identified the electronics, IT services and communications services (the
latter was not available in the innovation survey industry breakdown) as digital industries. We
documented how important digital industries are in shaping countries’ technological capabilities
and growth. We can now relate the share of firms participating in the innovation surveys that
belong to the digital industries group and the share of FDI projects targeted at the country’s digital
industries. The importance of digital industries in the structure of the economy is the common
driver of both the relevance of firms and of the attraction of FDI in these fields.
The second result focusses on high-technology/high innovation industries in the economy. The
analysis of innovation surveys documents the relevance and dynamisms of digital leaders and
highly innovative firms that can be combined. The FDI analysis documents the investment
projects targeted at R&D, design and ICT. We can now relate the share of firms that belong to the
groups of digital leaders and highly innovative firms to the share of FDI with the highest
technological content to determine R&D activities, design efforts and ICT systems; we expect
that the firms created by such FDI will be highly innovative.
In Figure 18, we find that digital industries have a significant parallel relevance in FDI (about 30
per cent of all FDI projects) and in all firm types (close to 20 per cent). The share of high-
technology/high innovation industries in the economy is lower, with 18 per cent of FDI targeting
R&D, design and ICT, and 15 per cent of firms belonging to the group of digital leaders and
highly innovative firms.
These simple associations could be further explored with more detailed analyses, but they already
indicate a coherence between the developments in firm dynamics and FDI flows. First, the
importance of digital industries in the structure of the economy affects the characteristics of firms
and the flow of FDI towards the given country. Second, the relevance of the most innovative and
digitally intensive firms is paralleled by the flow of FDI with a strong technological and research
content. The structure of the economy and the technological capabilities are therefore two
dimensions that must be investigated in parallel, combining information on firms and FDI flows.
The two dimensions do not always go hand in hand, as some FDI in digital-related industries is
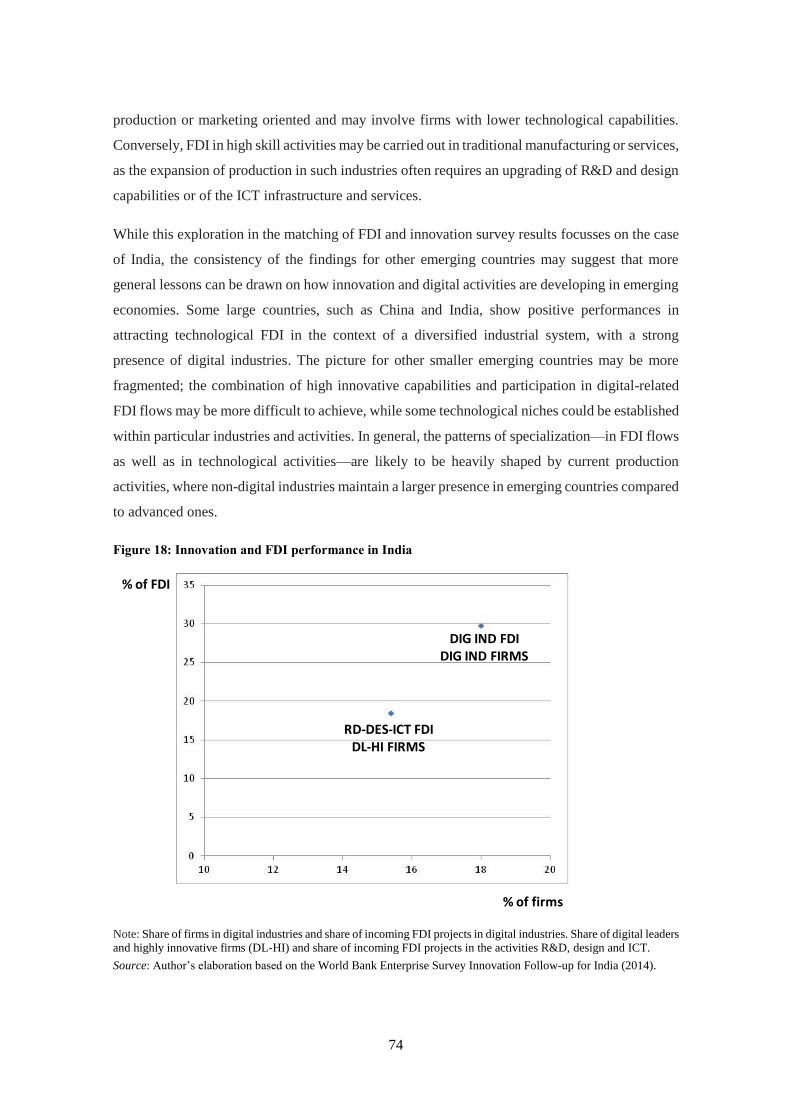
74
production or marketing oriented and may involve firms with lower technological capabilities.
Conversely, FDI in high skill activities may be carried out in traditional manufacturing or services,
as the expansion of production in such industries often requires an upgrading of R&D and design
capabilities or of the ICT infrastructure and services.
While this exploration in the matching of FDI and innovation survey results focusses on the case
of India, the consistency of the findings for other emerging countries may suggest that more
general lessons can be drawn on how innovation and digital activities are developing in emerging
economies. Some large countries, such as China and India, show positive performances in
attracting technological FDI in the context of a diversified industrial system, with a strong
presence of digital industries. The picture for other smaller emerging countries may be more
fragmented; the combination of high innovative capabilities and participation in digital-related
FDI flows may be more difficult to achieve, while some technological niches could be established
within particular industries and activities. In general, the patterns of specialization—in FDI flows
as well as in technological activities—are likely to be heavily shaped by current production
activities, where non-digital industries maintain a larger presence in emerging countries compared
to advanced ones.
Figure 18: Innovation and FDI performance in India
Note: Share of firms in digital industries and share of incoming FDI projects in digital industries. Share of digital leaders
and highly innovative firms (DL-HI) and share of incoming FDI projects in the activities R&D, design and ICT.
Source: Author’s elaboration based on the World Bank Enterprise Survey Innovation Follow-up for India (2014).
% of FDI
% of firms
RD-DES-ICT FDIDL-HI FIRMS
DIG IND FDIDIG IND FIRMS

75
5.2 The prospects for emerging country firms in the face of digitalization
Figure 19 summarizes the links between the typology of firms proposed in Section 2 and the
results of the analysis of FDI and innovation surveys. Building on the discussion of the firm
characteristics and on their position in the global economy, we can propose some stylized facts
on the situation and trajectories of groups of emerging country firms.
Product innovators are firms that show significant innovation capabilities, based primarily on
strategies of imitation and acquisition of foreign technologies; they are to some extent (20 per
cent of Indian firms) in the position to patent their new products; they often report an increase in
employment as a result of the innovation (on average, in close to 40 per cent of cases, there is a
rise in high skill jobs; in 30 per cent of firms, low skill jobs increase as well). Product innovators
can be associated with potential entrants discussed in Section 2. Their product innovation
capability suggests that they may have intermediate productivity levels; their degree of integration
in global markets and GVCs may vary, but this group of firms clearly has the potential for growth
in production, employment, technological capabilities and international performance. From the
evidence on FDI flows, the patterns of global investment in industries more closely related to
digitalization, in which high skill activities are more important—R&D, design and ICT—appear
to leave this type of firm at the margin of investment flows. The prospects for digitalization of
such firms are difficult to evaluate; they will first need to expand their technological activities in
a broader range of capabilities, including R&D efforts, new processes, automation and patenting.
This expansion of capabilities appears to be a necessary precondition to fully enter the
digitalization and global economy scene.
76
Figure 19: Relationship between typology of emerging country firms and the analysis of FDI
and innovative activities
Source: Author’s elaboration.
Highly innovative firms have a range of technological capabilities that suggest they tend to be
competitive in international markets, with a relevance in exports and integration in GVCs. They
may include foreign-owned firms and be affected by incoming FDI from advanced countries.
Their high innovation capabilities include both internal strengths (R&D activities, some patenting
activities) and access to foreign know-how; they are active in automation efforts using a range of
new processes alongside their ability to introduce new products. They therefore have the
characteristics of insider firms, operating in global markets and international technology
networks. The technological and employment performance of this group of firms is dynamic and
has the potential to move from automation of manual processes of production towards a more
extensive and advanced level of digital activities. This group of firms is likely to be part of the
environment of FDI flows, both incoming and outgoing, in industries that are related to
digitalization and in the business activities of R&D, design and ICT. They may include foreign
affiliates in high-technology industries where FDI—also in knowledge intensive activities—have
been introduced. They may as well include dynamic firms from emerging countries that are now
investing abroad, even though such FDI is largely outside the R&D, design and ICT activities.
These firms from emerging countries are well established at the first level of digitalization:
industrial automation as well as R&D efforts and the ability to introduce new products and
processes. All these activities are carried out by a substantial number of firms in emerging
Non innovative firms
Firms with product innovation
Highlyinnovative firms
Digital leading firms
Global players
Global players
Insider firms
Potential entrants
Outsider firms
FDI flowsin R&DDesignICTs
FDI flows inDigitalrelatedindustries

77
countries. FDI—both incoming and outgoing—also appear to be relevant in digitally relevant
industries and business activities. China and India have the strongest performance both in
innovation and in FDI in high-tech industries, with a presence across a large number of
manufacturing industries, and increasingly in IT-based services. For these insider firms, there is
evidence that it is easier to enter digitally relevant industries with global markets—usually, with
production activities or production-oriented FDI—than to ‘move up’ into FDI in knowledge-
based activities—R&D, design and ICT—both when emerging countries are destinations or
origins of FDI. The prospects for digitalization of this type of firms are likely to depend on the
speed at which they are able to consolidate their capabilities across the wide range of
technological activities they already carry out, to use them as the base for production growth and
as a source of technological competitiveness in global markets and, at the same time, to move
their efforts towards the creation of knowledge and capabilities for digitalization. The specific
institutional conditions, the prospects of growth of domestic markets, the growth of capabilities
in knowledge accumulation and technological development will be critical factors shaping their
role in the rise of digitalization and Industry 4.0 in emerging countries.
Digital leaders belong to a group of global firms in emerging countries that appear to be strong
ICT users as well as highly innovative and good performers. They are likely to be efficient
producers, exporters and active players in GVCs. They are likely to be affected by both incoming
and outgoing FDI. This ‘elite’ group of emerging country firms appears to be part of digitalization,
building on its wide range of innovative activities, automation efforts, extensive involvement in
ICT usage and development. These firms appear to be global players in both production and
technology, with a potential for full involvement in the emergence of digital industries. This group
of firms is fully part of the FDI dynamics, with a strong presence in digital related industries and
in high skill activities (R&D, design and ICT). They may equally include foreign affiliates in
higher-technology fields and domestic firms of emerging countries that have been engaged in
foreign direct investment, and have therefore also become global players in FDI.
These firms in emerging countries are full players in the process of digitalization and Industry
4.0. They are not many, but they appear to be active in a whole range of advanced technological
activities, including automation and widespread ICT usage, and they are likely to use FDI—both
incoming and outgoing—as an additional tool for integration in global technology markets. China
and India are the countries in which these developments have emerged with greater strength and
with an important diversification across industries and business activities. In other emerging
countries, this gap may be higher, and few firms may enter this ‘elite’ group of digitalization. An
additional question is whether the patterns and direction of digitalization pursued by these

78
emerging country firms are the same as those found in the firms of advanced countries. The
different institutional conditions, knowledge accumulation, degrees of market development and
relative prices may lead to digitalization and Industry 4.0 possibly taking a different direction
from that found in advanced countries. But the extent of this process, its content and impact in
emerging countries remain to be seen.
In this paper, we provide a new conceptual framework on the typology of emerging country firms,
identifying the technological and production characteristics that shape their ‘hierarchy’ and
trajectory of development in the context of the global economy and digitalization of industry.
Different sources of empirical evidence have been used to document the dynamics of
technologies, the innovation in firms and their impact. We have combined these insights in a
typology of firms, providing some preliminary answers to the question on the position of
emerging country firms in the global economy, in current technological developments and in the
rise of digitalization.

79
Bibliography
Acemoglu, D. and Restrepo, P. (2017) Robots and Jobs: Evidence from US labor markets. NBER
Working Paper No. w23285.
Altenburg, T., H. Schmitz and A. Stamm (2008): "Breakthrough? China’s and India’s Transition
from Production to Innovation". World Development, 36(2): 325-344
Archibugi, D. and M. Pianta (1992), The Technological Specialization of Advanced Countries.
A Report to the EC on International Science and Technology Activities, Preface by Jacques
Delors, Kluwer, Dordrecht, 1992, pp.164.
Archibugi, D. and M. Pianta (1996): "Measuring technological change through patents and
innovation surveys". Technovation, 16(9), pp. 451-468.
Arntz, M., Gregory, T. & Zierahn, U., 2016. The Risk of Automation for Jobs in OECD
Countries: A Comparative Analysis. OECD Social, Employment and Migration Working
Papers, Volumen 189.
Baldwin R (2016). The Great Convergence. Harvard University Press, Cambridge (MA).
Billor, N., Hadi, A. S., Velleman, P. F. (2000). BACON: Blocked adaptive computationally
efficient outlier nominators.Computational Statistics and Data Analysis, 34:279–298.
Bogliacino, F., Perani, G., Pianta, M. & Supino, S., 2012. Innovation and Development: The
Evidence From Innovation Surveys. Latin American Business Review, 13(3), pp. 219-261.
Bogliacino, F. & Pianta, M., 2010. Innovation and Employment: a Reinvestigation using Revised
Pavitt classes. Research Policy, Volume 39, pp. 799-809.
Bogliacino, F. & Pianta, M., 2016. The Pavitt Taxonomy, revisited: patterns of innovation in
manufacturing and services. Economia Politica, 33(2), pp. 153-180 Technology and
employment.
Branstetter L, Glennon B and Jensen JB (2018). The IT revolution and the globalisation of R&D.
Working Paper No 24707, National Bureau of Economic Research, Cambridge (MA).
Brynjolfsson E., Mcafee A. (2014), “The Second Machine Age; work, progress, and prosperity
in a time of brilliant technologies”, New York: W.W. Norton & Company
Buer, S., Strandhagen, J. & Chan, F., 2018. The link between Industry 4.0 and lean
manufacturing: mapping current research and establishing a research agenda. Journal of
Production Research, 56(8), pp. 2924-2940.
Bugmann G. (2011), “A role for robotics in sustainable development?” Institute of Electrical and
Electronics Engineers Africon (2011): 13-15.
Calvino, F., Criscuolo, C., Marcolin, L., Squicciarini, M. (2018) A taxonomy of digital intensive
sectors. OECD Science, Technology Industry Working Papers 2018/4.

80
Castellani, D., and Zanfei, A. (2006) Multinational Firms, Innovation and Productivity,
Cheltenham, Elgar.
Chang J-H., Huynh P. (2016), “ASEAN in Transformation: The Future of Jobs at Risk of
Automation”, International Labour Organisation: Bureau for Employers’ Activities, No. 9,
pp. 1-34
Cimoli, M., Dosi, G. and Stiglitz, J. (eds) (2009): Industrial Policy and Development. The
Political Economy of Capabilities Accumulation. Oxford, Oxford University Press.
Cirera, X., Marin, A. and Markwald, R., 2015. Explaining export diversification through firm
innovation decisions: The case of Brazil. Research Policy, Volumen 44, pp. 1962-1973.
Cirera, X. and Sabetti, L, 2016. "The effects of innovation on employment in developing
countries : evidence from enterprisesurveys," Policy Research Working Paper Series 7775,
The World Bank.
Cirera, X., Lage, F., Sabetti, L. 2016. "ICT use, innovation, and productivity : evidence from
Sub-Saharan Africa," Policy Research Working Paper Series 7868, The World Bank
Crespi, F., Pianta, M., 2008, Diversity in innovation and productivity in Europe, Journal of
Evolutionary Economics, 18:529-545.
De Backer K, DeStefano T, Menon C and Suh JR (2018). Industrial robotics and the global
organisation of production. Science, Technology and Industry Working Paper 2018/03,
OECD, Paris.
De Backer K and Flaig D (2017). The Future of Global value Chains: Business as usual or "a
new normal"? OECD Science, Technology and Innovation Policy Paper, No 41,
http://dx.doi.org/10.1787/d8da8760-en.
De Marchi V, Giuliani E and Rabellotti R (2017). Do global value chains offer developing
countries learning and innovation opportunities? European Journal of Development Research.
https://doi.org/10.1057/s41287-017-0126-z.
Digital Transformation Monitor. 2017a. “Germany: Industrie 4.0.” European Commission.
https://ec.europa.eu/growth/toolsdatabases/dem/monitor/sites/default/files/DTM_Industrie%
204.0.pdf.
Digital Transformation Monitor. 2017b. “Key Lessons from National Industry 4.0 Policy
Initiatives in Europe.” European Commission.
https://ec.europa.eu/growth/toolsdatabases/dem/monitor/sites/default/files/DTM_Policy%20
initiative%20comparison%20v1.pdf
Dosi, G. (1982): "Technological paradigms and technological trajectories: a suggested
interpretations of the determinants and directions of technical change". Research Policy, 11:
147-162
Durand C and Milberg W (2018). Intellectual monopoly in global value chains.
https://hal.archives-ouvertes.fr/hal01850438/document.

81
Eurofound (2018). Game changing technologies: Exploring the impact on production processes
and work. Publications, Office of the European Union, Luxembourg.
European Union Chamber of Commerce in China (2017) China manufacturing 2025. Putting
industrial policy ahead of market forces. Bejing, European Union Chamber of Commerce in
China.
European Commission, 2017. Key lessons from national industry 4.0 policy initiative in Europe.,
Brussels: European Commission.
Foster C, Graham M, Mann L, Waema T and Friederici N (2018). Digital control in value chains:
challenges of connectivity for East African firms. Economic Geography, 94(1): 68–86.
Freeman, C. and Louçã, F. (2001) As time goes by. From the industrial revolution to the
information revolution. Oxford, Oxford University Press
Frey, C. & Osborne, M., 2017. The future of employment: How susceptible are jobs to
computerisation?. Technological Forecasting and Social Change, Volumen 114, pp. 254-
280.
Furman J and Orszag P (2018). Slower Productivity and Higher Inequality: Are They Related?
Working Paper 18-4, Peterson Institute for International Economics, Washington DC.
Gates, Doug, and Michael Bremicker. 2017. “Beyond the Hype. Separating Ambition from
Reality in i4.0.” KPMG International.
https://assets.kpmg.com/content/dam/kpmg/xx/pdf/2017/05/beyondthe-hype-separating-
ambition-from-reality-in-i4.0.pdf.
Grant Thornton. 2017. “India’s Readiness for Industry 4.0. A Focus on Automotive Sector.”
http://www.grantthornton.in/globalassets/1.-
memberfirms/india/assets/pdfs/indias_readiness_for_industry_4_a_focus_on_automotive_s
ector.pdf
Gereffi G, Humphrey J and Sturgeon T (2005). The governance of global value chains. Review
of International Political Economy, 12 (1): 78–104.
Ghani E and O’Connell SD (2014). Can service be a growth escalator in low-income countries?
Policy Research Working Paper No 6971. World Bank, Washington, DC.
Guarascio, D., Pianta, M. & Bogliacino, F., 2016. Export, R&D and new products. a model and
a test on European industries. Journal of Evolutionary Economics, 26(4), pp. 869-905.
Guarascio, D., Pianta, M., Lucchese, M. & Bogliacino, F., 2015. Business cycles, technology
and exports. Economia Politica, 32(2), pp. 167-200.
Guellec, D. & Paunov, C., 2017. Digital Innovation and the Distribution of Income.. NBER
working paper, Volumen 23987.
Hallward-Driemeier M and Nayyar G (2017). Trouble in the Making? The Future of
Manufacturing-Led Development. World Bank, Washington DC.
Haraguchi N, Cheng C and Smeets E (2017). The importance of manufacturing in economic
development: has this changed? World Development, 93: 189–204.
82
Hausman, R., Hwang, J. & Rodrik, D., 2007. What you export matter. Journal of Economic
Growth, 12(1), pp. 1-25.
Hermann, M., Pentek, T. & Otto, B., 2015. Design Principles for Industrie 4.0 Scenarios: A
Literature Review. Technische Universitat Dortmund, Volumen 01/2015.
IFR. 2017. “Executive Summary World Robotics 2017 Industrial Robots.” International
Federation of Robotics.
https://ifr.org/downloads/press/Executive_Summary_WR_2017_Industrial_Robots.pdf.
Keller, W. (2004): "International Technology Diffusion", Journal of Economic Literature, 42:
752-782
International Labour Organization (ILO) (2018). Robotics and Reshoring. ILO, Geneva.
International Monetary Fund (IMF) (2018a). Manufacturing jobs: implications for productivity
and inequality. World Economic Outlook, Chapter 3, April. Washington, DC.
International Monetary Fund (IMF) (2018b). Measuring the digital economy. Washington, DC.
http://www.imf.org/en/Publications/Policy-Papers/Issues/2018/04/03/022818-measuring-the-
digital-economy.
Joo H, Oh Cand Lee K (2016). Catch-up strategy of an emerging firm in an emerging country:
analysing the case of Huawei vs. Ericsson with patent data. International Journal of
Technology Management, 72 (1–3): 19–42.
Kamble, S., Gunasekaran, A. & Sharma, R., 2018. Analysis of the driving and dependence power
of barriers to adopt industry 4.0 in Indian manufacturing industry. Computers in Industry,
Volumen 101, pp. 107-119.
Lall, S. (1992): "Technological capabilities and industrialisation", World Development, 20(2):
165-186.
Leliveld A and Knorringa P (2018). Frugal innovation and development research. The European
Journal of Development Research, 30(1): 1–16.
Li, L., 2018. China's manufacturing locus in 2025: With a comparison of “Made-in-China 2025”
and “Industry 4.0”. Technological Forecasting & Social Change, 135, pp. 66-74.
López-Gómez, Carlos, David Leal-Ayala, Michele Palladino, and Eoin O’Sullivan. 2017.
“Emerging Trends in Global Advanced Manufacturing: Challenges, Opportunities and Policy
Responses.” United Nations Industrial Development Organization and University of
Cambridge’s Institute for Manufacturing.
Luo S, Lovely ME, Popp D (2017). Intellectual returnees as drivers of indigenous innovation:
Evidence from the Chinese photovoltaic industry. The World Economy, 40, 11: 2424–2454.
Make In India. 2017. Towards Smart Manufacturing: Industry 4.0 and India.Partnership Summit
2017, http://www.makeinindia.com/article/-/v/towards-smart-manufacturing-industry-4-0-
and-india

83
Mayer J (2018) Digitalization and industrialization: friends or foes? UNCTAD Research Paper
25, October 2018, Geneva, UNCTAD.
Mayer J (2018). Robots and industrialization: what policies for inclusive growth? G24 Working
Paper, Washington DC. https://www.g24.org/wp-content/uploads/2018/08/Mayer_-
_Robots_and_industrialization.pdf.
Milberg W and Winkler D (2013) Outsourcing Economics: Global Value Chains in Capitalist
Development. Cambridge University Press, Cambridge.
Mittal, S., Khan, M. & Romaero, D., 2018. A critical review of smart manufacturing & Industry
4.0 maturity models: Implications for small and medium-sized enterprises (SMEs). Journal
of Manufacturing Systems, Volumen 49, pp. 194-214.
Mohelska, H., Sokolova, M. (2018) Management approaches for industry 4.0 – the
organizational culture perspective, Technological and Economic Development of Economy,
24, 6: 2225–2240
Morrison A. Pietrobelli C. and Rabellotti R. (2008), “Global Value Chains and Technological
Capabilities: A Framework to Study Learning and Innovation in Developing Countries”,
Oxford Development Studies, 36:1, 39 - 58
Nascia, L., Pianta M. (2018) Research and innovation policy in Italy, MPRA working paper
https://mpra.ub.uni-muenchen.de/89510/
OECD, 2018, Oslo Manual 2018. Guidelines for Collecting, Reporting and Using Data on
Innovation, 4th Edition, Paris, OECD.
OECD. 2017. “The next Production Revoution. Implications for Governments and Business.”
Organisation for Economic Co-operation and Development.
http://www.oecd.org/sti/ind/nextproduction-revolution.htm
Pavitt, K. (1984) Sectoral patterns of technical change: Towards a taxonomy and a theory.
research Policy, 13, 6: 343-373.
Perez, C. (2008): "A vision for Latin America: a resource-based strategy for technological
dynamism and social inclusion", Globelics working paper series, WPG0804
Perez C. (2009), “Technological revolutions and techno-economic paradigms,” Working Paper
in Technology Governance and Economic Dynamics, No. 20
http://hum.ttu.ee/wp/paper20.pdf
Pianta, M. (2001) ‘Innovation, demand and employment’, in P. Petit and L. Soete (eds),
Technology and the future of European employment, Elgar, Aldershot, 2001, 142-165.
Pianta, M. (2005), “Innovation and Employment”, in Fagerberg, J., Mowery, D., and Nelson, R.
(eds.), The Oxford Hand book of Innovation, pp. 568–598. Oxford: Oxford University Press.
Pianta, M., 2018 Twelve stylized facts for the digital age. Indian Journal of Labour Economics,
2018, DOI: 10.1007/s41027-018-0124-5

84
Pianta, M., Coveri, A., Reljic, J. 2019 The Sectoral Innovation Database, 1994-2018.
Methodological Note. Università di Urbino Working Paper 2019.
Pietrobelli C and Rabelotti R (2011). Global value chains meet innovation systems: are there
learning opportunities for developing countries? World Development, 39(7): 1261–1269.
Popov V and Jomo KS (2018). Are developing countries catching up? Cambridge Journal of
Economics, 42(1): 33–46.
Rehnberg M., Ponte S. (2016), 3D Printing and Global Value Chains: How a new technology
may restructure global production, National University of Singapore, GPN Working Paper
2016-010
Rodriguez-Pose, A. and Wilkie, C. (2016) Putting China in perspective: a comparative
exploration of the ascent of the Chinese knowledge economy, Cambridge Journal of Regions,
Economy and Society, 9, 479–497.
Rodrik D (2016). Premature deindustrialization. Journal of Economic Growth, 21(1): 1–33.
Roland Berger, 2016. “The Industrie 4.0 Transition Quantified. How the Fourth Industrial
Revolution Is Reshuffling the Economic, Social and Industrial Model.” Think, Act beyond
Mainstream.
Saliola, F. and Seker, M. (2011) Total Factor Productivity Across the Developing World, The
World Bank Group, Enterprise Notes 23, Washington D.C.
Schwab, Klaus (2016) The Fourth Industrial Revolution. New York: Crown Business.
Santiago F (2018). You say you want a revolution: strategic approaches to Industry 4.0 in middle-
income countries. Working Paper 19, UNIDO.
Santos Dalenogare, L., Benitez, G., Ayala, N. & Frank, A. (2018) The expected contribution of
Industry 4.0 technologies for industrial. International Journal of Production Economics,
Volumen 204, pp. 383-394.
Seker, M. (2011) Importing, Exporting, and Innovation in Developing Countries, World Bank,
Enterprise Analysis Unit, Washington D.C.
Sturgeon T (2017). The "New" Digital Economy and Development. UNCTAD Technical Notes
on ICT for Development No. 8, UNCTAD, Geneva.
Tansan, Burak, Aykan Gökbulut, Çağlar Targotay, and Eern Tevfik (2016) “Industry 4.0 in
Turkey as an Imperative for Global Competitiveness. An Emerging Market Perspective.
Executive Summary.” Istanbul: Turkish Industry and Business Association.
Tortorella, G. & Fetterman, D. (2018). Implementation of Industry 4.0 and lean production in
Brazilian manufacturing companies. International Journal of Production Research, 56(8), pp.
2975-2987.
Tourk, Khairy, and Peter Marsh (2016). “The New Industrial Revolution and Industrial
Upgrading in China: Achievements and Challenges.” Economic and Political Studies 4
(2):187–209. https://doi.org/10.1080/20954816.2016.1180769.

85
UNCTAD (2018). Trade and Development Report. Power, Platforms and the Free Trade
Delusion. United Nations, New York and Geneva.
UNIDO (2015) Industrial Development Report 2016, The Role of Technology and Innovation
in
Inclusive and Sustainable Industrial Development,Vienna, United Nations Industrial
Development Organization
UNIDO (2017) “Accelerating Clean Energy through Industry 4.0: Manufacturing the next
Revolution.” Vienna, United Nations Industrial Development Organization
World Bank, 2013-2014. World Bank Enterprise Survey – Innovation follow up. Available at:
https://microdata.worldbank.org/index.php/catalog?sort_by=rank&sort_order=desc&sk=ent
erprise+survey.
World Bank (2016). Digital Dividends. World Development Report 2016. Washington, DC.
World Bank, IDE-JETRO, OECD, UIBE and WTO (2017). Measuring and Analyzing the Impact
of GVCs on Economic Development. Global Value Chain Development Report 2017. World
Bank, Washington, DC.
World Intellectual Property Organization (WIPO) (2017). World Intellectual Property Report
2017 – Intangible Capital in Global Value Chains. WIPO, Geneva.
Yu, X., Dosi, G., Grazzi, M. & Lei, Y. (2017) Inside the virtuous circle between productivity,
profitability, investment and corporate growth: An anatomy of Chinese industrialization.
Research Policy, 46(5), pp. 1020-1038.
Wong P-K., Singh A., (2005) "From technology adopter to innovator: the dynamics of change
in Singapore’s national innovation system", NUS Entrepreneurship Centre Working Papers,
No. 16.
Zanello G, Fu X, Mohnen P and Ventresca M (2016). The creation and diffusion of innovation
in developing countries: a systematic literature review. Journal of Economic Surveys, 30(5):
884–912.
Zanfei, A., Coveri, A., Pianta, M. (2019). FDI patterns and global value chains in the digital
economy, University of Urbino Working Paper 2019/03.
86
Appendix
Table 22: Innovation and digital groupings, number and share of firms in each industry in India
ISIC
Rev
3.1 INDUSTRY
Typology of firms
DL HI PI NI Total
15 Food 3 19 96 93 211
5.77 3.92 5.52 7.65 6.05
16 Tobacco 0 0 13 21 34
0.00 0.00 0.75 1.73 0.97
17 Textiles 2 30 103 52 187
3.85 6.19 5.93 4.28 5.36
18 Garments 3 18 54 24 99
5.77 3.71 3.11 1.98 2.84
19 Leather 0 6 23 10 39
0.00 1.24 1.32 0.82 1.12
20 Wood 0 8 26 19 53
0.00 1.65 1.50 1.56 1.52
21 Paper 0 8 33 19 60
0.00 1.65 1.90 1.56 1.72
22 Publishing 2 8 26 19 55
3.85 1.65 1.50 1.56 1.58
23
Refined petroleum
products 2 0 4 2 8
3.85 0.00 0.23 0.16 0.23
24 Chemicals 4 52 101 88 245
7.69 10.72 5.81 7.24 7.02
25 Plastics 2 66 139 72 279
3.85 13.61 8.00 5.93 7.99
26
Non-metal mineral
products 1 8 86 50 145
1.92 1.65 4.95 4.12 4.15
27 Basic metals 1 43 104 79 227
1.92 8.87 5.98 6.50 6.50
28 Fabricated metal products 7 41 130 70 248
13.46 8.45 7.48 5.76 7.11
29-30 Machinery 7 54 162 78 301
13.46 11.13 9.32 6.42 8.62
87
31 -32 Electronics 6 51 108 62 227
11.54 10.52 6.21 5.10 6.50
33 Precision instruments 1 4 14 5 24
1.92 0.82 0.81 0.41 0.69
34-35 Transport machines 5 39 102 65 211
9.62 8.04 5.87 5.35 6.05
36 Furniture 0 3 18 7 28
0.00 0.62 1.04 0.58 0.80
37 Recycling 0 0 3 7 10
0.00 0.00 0.17 0.58 0.29
F Construction 0 6 55 50 111
0.00 1.24 3.16 4.12 3.18
50 Services of motor vehicles 1 1 33 68 103
1.92 0.21 1.90 5.60 2.95
51 Wholesale 1 1 51 44 97
1.92 0.21 2.93 3.62 2.78
52 Retail 0 9 91 42 142
0.00 1.86 5.24 3.46 4.07
55 Hotel and restaurants 1 3 71 77 152
1.92 0.62 4.09 6.34 4.36
60-64 Transport 5 39 102 65 211
9.62 8.04 5.87 5.35 6.05
72 IT Services 1 4 57 40 102
1.92 0.82 3.28 3.29 2.92
Total 52 485 1,738 1,215 3,490
100.00 100.00 100.00 100.00 100.00
Note: Industries were coded using the ISIC Rev 3.1 classification. The survey includes most manufacturing industries
(15 to 37), and some services (45, 50, 51, 52, 55, 60-64, 72). The typology of firms corresponds to: DL – Digital leaders;
HI – Highly innovative firms; PI – Product innovating; NI – Non-innovative.
Source: Author’s elaboration.
88
Table 23: Industry classification ISIC Rev. 3.1
List of the 27 industries covered by the World Bank Enterprise Surveys
WB DATA
(27 sectors) ISIC Rev.3.1
Food 15 - Manufacture of food products and beverages
Tobacco 16 - Manufacture of tobacco products
Textiles 17 - Manufacture of textiles
Garments 18 - Manufacture of wearing apparel; dressing and dyeing of fur
Leather 19 - Tanning and dressing of leather; manufacture of luggage, handbags,
saddlery, harness and footwear
Wood 20 - Manufacture of wood and of products of wood and cork, except furniture;
Paper 21 - Manufacture of paper and paper products
Publishing,
printing, and
recorded media
22 - Publishing, printing and reproduction of recorded media
Refined
petroleum 23 - Manufacture of coke, refined petroleum products and nuclear fuel
Chemicals 24 - Manufacture of chemicals and chemical products
Plastics &
rubber 25 - Manufacture of rubber and plastics products
Non-metallic
mineral products 26 - Manufacture of other non-metallic mineral products
Basic metals 27 - Manufacture of basic metals
Fabricated metal
products
28 - Manufacture of fabricated metal products, except machinery and
equipment
Machinery (29-
30) 29- Manufacture of machinery and equipment n.e.c.
30 - Manufacture of office, accounting and computing machinery
Electronics (30-
31) 31 - Manufacture of electrical machinery and apparatus n.e.c.
32 - Manufacture of radio, television and communication equipment and
apparatus
Precision
instruments
33 - Manufacture of medical, precision and optical instruments, watches and
clocks
Transport
machines (34-
35)
34 - Manufacture of motor vehicles, trailers and semi-trailers
35 - Manufacture of other transport equipment
Furniture 36 - Manufacture of furniture; manufacturing n.e.c.
Recycling 37 - Recycling

89
Construction F - Construction
Services of
motor vehicles
50 - Sale, maintenance and repair of motor vehicles and motorcycles; retail
sale of automotive fuel
Wholesale 51 - Wholesale trade and commission trade, except of motor vehicles and
motorcycles
Retail 52 - Retail trade, except of motor vehicles and motorcycles; repair of personal
and household goods
Hotel and
restaurants H - Hotels and restaurants
Transport (60-
64) I - Transport, storage and communications
60 - Land transport; transport via pipelines
61 - Water transport
62 - Air transport
63 - Supporting and auxiliary transport activities; activities of travel agencies
64 - Post and telecommunications
IT Services 72 - Computer and related activities
Table 24: The NACE classification of economic activities, Rev.2, 2-digit level
C MANUFACTURING
10 Manufacture of food products
11 Manufacture of beverages
12 Manufacture of tobacco products
13 Manufacture of textiles
14 Manufacture of wearing apparel
15 Manufacture of leather and related products
16 Manufacture of wood and of products of wood and cork, except furniture
17 Manufacture of paper and paper products
18 Printing and reproduction of recorded media
19 Manufacture of coke and refined petroleum products
20 Manufacture of chemicals and chemical products
21 Manufacture of basic pharmaceutical products and pharmaceutical preparations
22 Manufacture of rubber and plastic products
23 Manufacture of other non-metallic mineral products
24 Manufacture of basic metals
25 Manufacture of fabricated metal products, except machinery and equipment
26 Manufacture of computer, electronic and optical products
27 Manufacture of electrical equipment

90
28 Manufacture of machinery and equipment n.e.c.
29 Manufacture of motor vehicles, trailers and semi-trailers
30 Manufacture of other transport equipment
31 Manufacture of furniture
32 Other manufacturing
33 Repair and installation of machinery and equipment
D ELECTRICITY, GAS, STEAM AND AIR CONDITIONING SUPPLY
35 Electricity, gas, steam and air conditioning supply
E
WATER SUPPLY; SEWERAGE, WASTE MANAGEMENT AND REMEDIATION
ACTIVITIES
36 Water collection, treatment and supply
37 Sewerage
38 Waste collection, treatment and disposal activities; materials recovery
39 Remediation activities and other waste management services
F CONSTRUCTION
41 Construction of buildings
42 Civil engineering
43 Specialised construction activities
G
WHOLESALE AND RETAIL TRADE; REPAIR OF MOTOR VEHICLES AND
MOTORCYCLES
45 Wholesale and retail trade and repair of motor vehicles and motorcycles
46 Wholesale trade, except of motor vehicles and motorcycles
47 Retail trade, except of motor vehicles and motorcycles
H TRANSPORTATION AND STORAGE
49 Land transport and transport via pipelines
50 Water transport
51 Air transport
52 Warehousing and support activities for transportation
53 Postal and courier activities
I ACCOMMODATION AND FOOD SERVICE ACTIVITIES
55 Accommodation
56 Food and beverage service activities

91
J INFORMATION AND COMMUNICATION
58 Publishing activities
59 Motion picture, video and television programme production, recording and music publishing
60 Programming and broadcasting activities
61 Telecommunications
62 Computer programming, consultancy and related activities
63 Information service activities
K FINANCIAL AND INSURANCE ACTIVITIES
64 Financial service activities, except insurance and pension funding
65 Insurance, reinsurance and pension funding, except compulsory social security
66 Activities auxiliary to financial services and insurance activities
L REAL ESTATE ACTIVITIES
68 Real estate activities
M PROFESSIONAL, SCIENTIFIC AND TECHNICAL ACTIVITIES
69 Legal and accounting activities
70 Activities of head offices; management consultancy activities
71 Architectural and engineering activities; technical testing and analysis
72 Scientific research and development
73 Advertising and market research
74 Other professional, scientific and technical activities
75 Veterinary activities
N ADMINISTRATIVE AND SUPPORT SERVICE ACTIVITIES
77 Rental and leasing activities
78 Employment activities
79 Travel agency, tour operator and other reservation service and related activities
80 Security and investigation activities
81 Services to buildings and landscape activities
82 Office administrative, office support and other business support activities
Source:
https://ec.europa.eu/eurostat/ramon/nomenclatures/index.cfm?TargetUrl=LST_NOM_DTL&StrNom=NACE_REV2

Vienna International Centre · P.O. Box 300 9 · 1400 Vienna · AustriaTel.: (+43-1) 26026-o · E-mail: [email protected]