Embed Size (px)
Citation preview

The Challenge from India
Dr. Brian W Tempest
Chief Mentor & Executive Vice Chairman of the Board
Ranbaxy Laboratories Limited, Delhi, India
Lisbon – 8/9 November 2006
Except for the historical information contained herein, statements in this presentation and
the subsequent discussions, which include words or phrases such as “will”, “aim”, “will
likely result”, “would”, “believe”, “may”, “expect”, “will continue”, “anticipate”, “estimate”,
“intend”, “plan”, “contemplate”, “seek to”, “future”, “objective”, “goal”, “likely”, “project”,
“should”, “potential”, “will pursue” and similar expressions or variations of such
expressions may constitute "forward-looking statements". These forward-looking
statements involve a number of risks, uncertainties and other factors that could cause
actual results to differ materially from those suggested by the forward-looking statements.
These risks and uncertainties include, but are not limited to our ability to successfully
implement our strategy, our growth and expansion plans, obtain regulatory approvals, our
provisioning policies, technological changes, investment and business income, cash flow
projections, our exposure to market risks as well as other risks. Ranbaxy does not
undertake any obligation to update forward-looking statements to reflect events or
circumstances after the date thereof.
Disclaimer

Asia’s Share of the World GDP (at PPP in %)
Year 1870 1913 1950 1973 2001 China 17% 9% 5% 5% 12% India 12% 8% 4% 3% 5% Japan 2% 3% 3% 8% 7%
Rest of Asia 7% 5% 7% 9% 13% Total Asia 38% 25% 19% 25% 37%
Source – WEF
- was 59% in 1820 with India 16%, China 33%

1. India +84%
2. Pakistan +75%
3. Korea +54%
4. Philippines +39%
5. China +34%
Stock Market Performance in Asia in 2005
Source: Rimes in GBP

Davos 2006
Source – FT

The Productivity Advantage
India a usa Pharma view USA India a usa Pharma view USA
1 chemist 1 chemist 1 chemist 1 chemist
70 hours/week 50 hours/week 70 hours/week 50 hours/week
$ 800 monthly $ 12,000 monthly $ 800 monthly $ 12,000 monthly
Better education x 1.3Better education x 1.3
Longer working time x 1.3Longer working time x 1.3
Lower cost x 20Lower cost x 20
Sources: IPHMR Conferences, New Delhi August 2004

Japan - by 2050 36% > 65 years from 19% in 2005
China - one child families, get older before becoming wealthy - labour costs will rise owing to labour shortage - South Guangdong province is short of 2m workers
India - will remain very young, 50% <25years, 65% <35 years - source of the extra needed global workforce
- in 2025 100m > 65 years (to China’s 200m)
The Ageing Advantage
Working Population, 15-64 yearsIn millions

Growth- Japan, sustain current growth- China, slightly slower growth to prevent hard landing
- India, increasing growth rate being talked up to 9%/10% Sentiment
- India, largest foreign affairs caucus in US Congress (180), nuclear deal - China, 74,000 demonstrations reported in 2005 in China. State secrecy, IP
The Economic Growth Advantage

The world has 793 billionaires USA has 371 – almost half India - 23 billionaires, UK has 24 China - 8 billionaires Net worth of 40 richest Indians - $106 b 40 richest Chinese - $26b
“2006 belongs to some of the emerging markets, and
no country more than India”
Source: Forbes
The Billionaires Advantage

The R&D Investment Advantage Most attractive R&D Investment locations:
1. China 2. USA 3. India 4. Japan 5. UK
Source – UNCTAD 2005

Qualified Scientists & Engineers
Global India players with Alliances
English speaking
TRIPs compliant – first patent March 2006
IIT, IIM & other scientific institutions
Source – UNCTAD 2005
The R&D Investment Advantage-reasons why India

4th largest reservoir of Scientific Manpower (2nd largest English speaking)
3m graduates pa, 115k MSc Chemistry, 215k Eng (222k USA) Physics the most popular subject
Knowledge super power in the making
Lead by a Nuclear Scientist as President – remote sensing satellite technology, 1/6 countries
PCT application ranked 3rd – K, Ch, Ind, Si, RSA
Diaspora network (25m across 120 countries)
US & Europe will not dominate Science, Maths, IT
The Knowledge Advantage

Science Education in EU
“This means that when pupils are in a science laboratory their experience is unsafe, unsatisfactory or uninspiring for 65% of the time. In addition, 13% of science classes are not taught in a laboratory at all”
Source: Royal Society of Chemistry, Policy Bulletin – Spring 2006
UK “A” Level entries: Closed UK University 2000 2005 % change Chemistry Departments: Physics : 32,059 28,119 -12% Dundee Kings Chemistry: 40,856 38,851 -5% Surrey Exeter Maths: 67,036 52,897 -21% Lancaster Queen Mary Computing: 19,099 7,242 -62% under review-Sussex
Source: Daily Mail – 11 August 2006

Number of Higher Education Institutions
05/06 18,123 +59%
00/01 11,412
90/01 5,932
80/01 4,861
Source: Indian University Grants Commission
Science Education in India
Number of Students enrolled in
Higher Education Institutions
05/06 10,500 +40%
00/01 7,500
90/01 4,000
80/01 3,000Source: Indian University Grants Commission
Number of Institutions courses
05/06 99/00
Pharmacy 1478 669 +120%
Medicine 229 174 +32%
Physiotherapy 205 52 +294%
Source: Pavan Agarwal (2006) based on data
from professional councils
PhD Degree awarded in Science
03/04 5408 +44%
00/01 3734
90/01 2950
(USA 03/04 25,000)
Source: Indian University Grants Committee

The Knowledge Advantage
Engineers/Science graduates p.a – India 0.7m, China 0.5m, EU 0.5m, USA 0.4m, Japan 0.3m

34 News TV channels. Oldest 13 years old (NDTV)
5000 newspapers, circulation 17m. 12 with 1m copies each.200m daily readers. 21m new daily readers 2003/2005, +14% with 50% rural and 50% urban readership
Principal internet languages to become English, Chinese and Hindi
Indians are hungry for information
The Information Advantage
Internet Usage – Asia
1. China 123 m2. Japan 86 m3. India
51 m4. S.Korea 34 m
Source: Business Today, Sept. 24, 2006
Mobile Phones
1. China 421 m2. USA
190 m3. Japan 157 m4. Russia 148 m5. India
116 m
Source: Times of India, Sept. 14, 2006
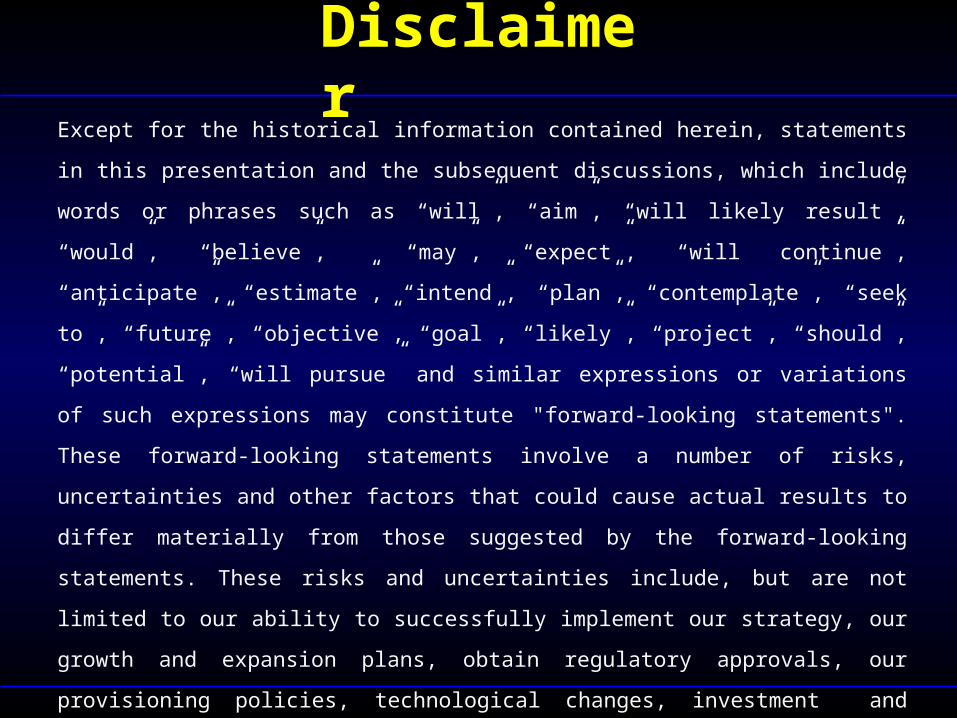
Manufacturing growth versus China Scope for improvement of Government Policies
Revitalization of agriculture - beyond milk (1st globally), wheat (2nd), rice (2rd)
More privatization – public sector not so buoyant
Further encouragement of R&D for Pharmaceuticals
Expand further the prosperous middle class of 300m
The Potential for Improvement Advantage

CRO Market India
2006 $318 m +347%2005 $71 m2000 $10 m
Source:Clinivest Research Pvt. Ltd
Country USAIndia
Sites 22 8
Subject 626 896
Source: Andy Lee Pfizer Global, head clinical study and data management.Business India, August 13, 2006
“………..The Country’s World Class skills in Chemistry & IT and it’s large treatment naivepatient population provides added allure” Boston Consultancy Group
Harnessing the power of India 2006
The Clinical Advantage
Medical Tourism
Thailand India
- Open heart $14250 $4400
- Hysterectomy $ 2012 $ 571 - Knee surgery $7000 $4500
Patients
- Naïve- HIV 50m- Diabetes 32m- HT 5m

The M&A Future Advantage
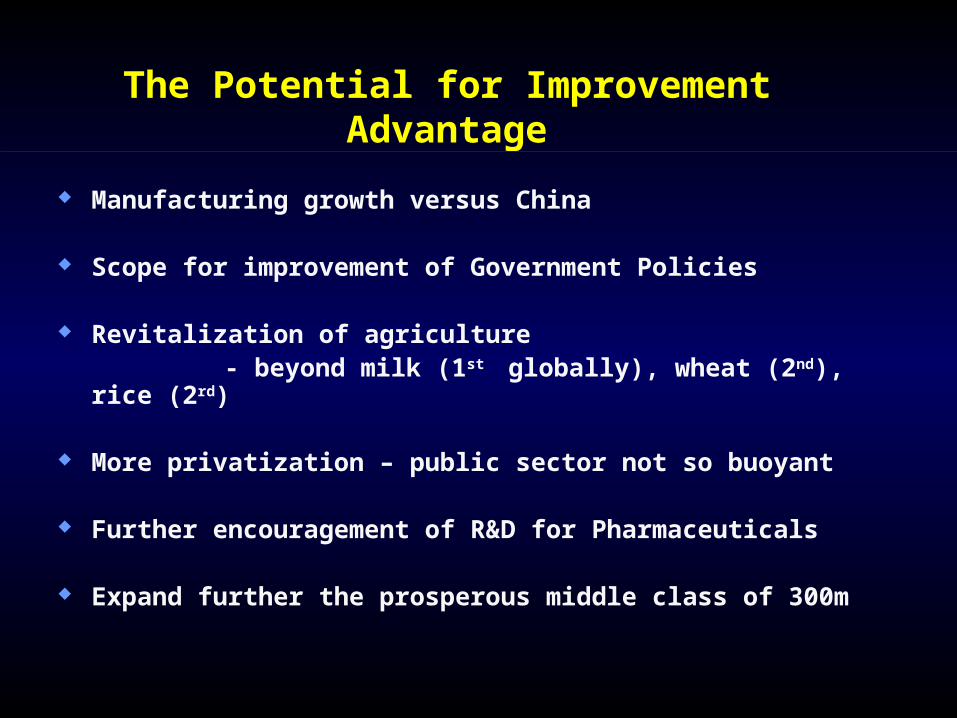
$b
1997/8 3.61998/9 2.51999/0 2.22000/1 4.02001/2 6.12002/3 5.02003/4 4.32004/5 5.62005/6 6.0
Source: Outlook business June 2006
- 2006/7 on target for $10b- But still only 15% of China
The FDI Advantage

$m 2000 110 2001 160 2002 200 2003 250 2004 400 2005 450
- Leading to even more Pharma R&D facilities and factories
Source – Citigroup
Investment by top 15 Indian Domestic Pharmaceutical Companies

Investment by foreign Pharma companies

Microsoft Global Development Centre (GDCI)
Microsoft Global Services (MGSI)
Microsoft Global Technical Support Centre (GTSC)
Microsoft Systems Research (MSRI)
Microsoft India Development Centre (MIDC)
Investment by Microsoft in India

A Global Strategic Asset for developed
World Market businesses
India

$b 2004 2009
USA 15 27 W Europe 9 14 Japan 3 4 Rest of America 6 9 ROW 25 40
Total 58 94 Source: Frost & Sullivan
“India could soon dominate the entire production chain for generics”
IMS prediction No 4 Scrip April 5 2006
The Global Generic Market – growing everywhere

The Pharma Advantage
Competitive Advantage – Aggressive Home Market

The Pharma Advantage
Competitive Advantage - Cost of Manufacture
Active Pharmaceuticals Facility, Mohali Dosage Forms Facility, Paonta Sahib
Highest number of FDA approved plants outside the USNo. of FDA approved plants:
1990 11995 102000 442004 105
Source: Crisil / IPA

The Pharma Advantage
R&D I
R&D III
R&D II
Competitive Advantage - Cost of Innovation
Ranbaxy’s Patent Filings
2449
32
86
146
24
170
185
2001
2000
1999
20042005

The Pharma Advantage – API’s
USA DMF filings by India
1990 1 1995 4 2000 36
2004 187 2005 262
Source: Crisil / US FDA / J P Morgan
% Share of USA DMF filings
India China 2004 27% 9% 2005 37% 10% Q1’06 44% 15% Q2’06 41% 16%
Source: US FDA / J P Morgan 6th August 2006

Annual USA ANDA FilingsRanbaxy 29Sun 22Orchid 18Lupin 14DRL 13Cadilla 12
Source: Pharmabiz 8th Sept’ 2005
- One in every four ANDAs filed by Indian Companies in top USA FDA filers Source: KPMG
- 29 ANDAs p.a ranks in top 3 USA FDA filers
- Indian Generic Companies on a Filing Spree - BOA
- - No Chinese generic company has yet filed a USA FDA - ANDA
The Pharma Advantage - ANDAs

0
1000
2000
3000
4000
5000
6000
7000
8000
9000
0
1000
2000
3000
4000
5000
6000
7000
8000
9000
Leading Generic Companies
Source : Company /Financial reports & presentations
Annual Sales (US$ Millions)
Source: CLSA, 6 August 2006
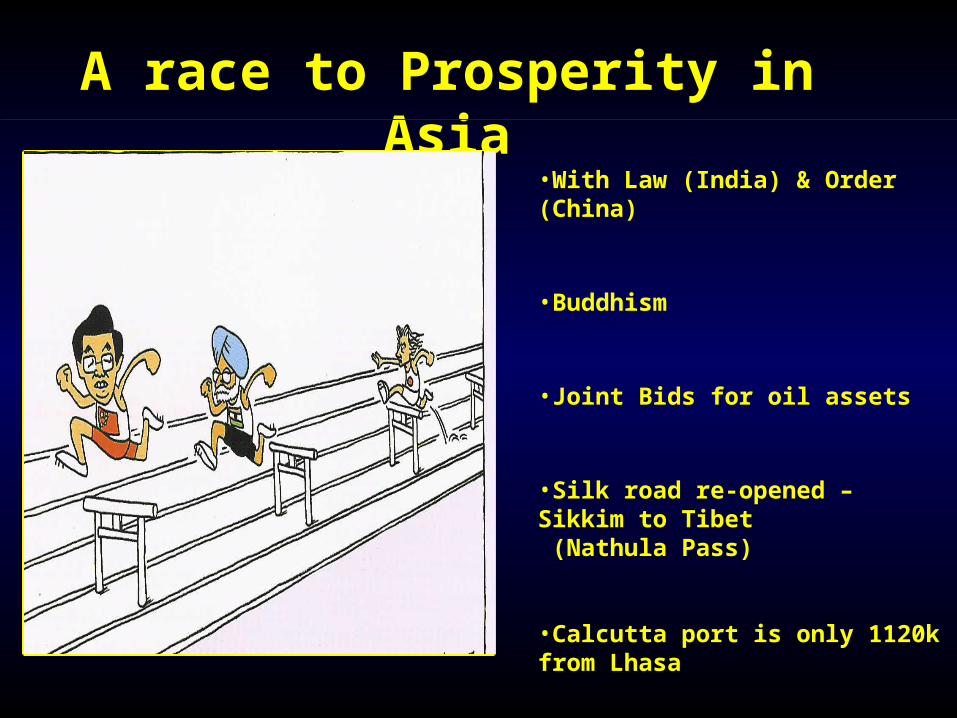
A race to Prosperity in Asia
•With Law (India) & Order (China)
•Buddhism
•Joint Bids for oil assets
•Silk road re-opened – Sikkim to Tibet (Nathula Pass)
•Calcutta port is only 1120k from Lhasa
•India leading in the Pharma race

Potential Downsides to theIndian Scenario
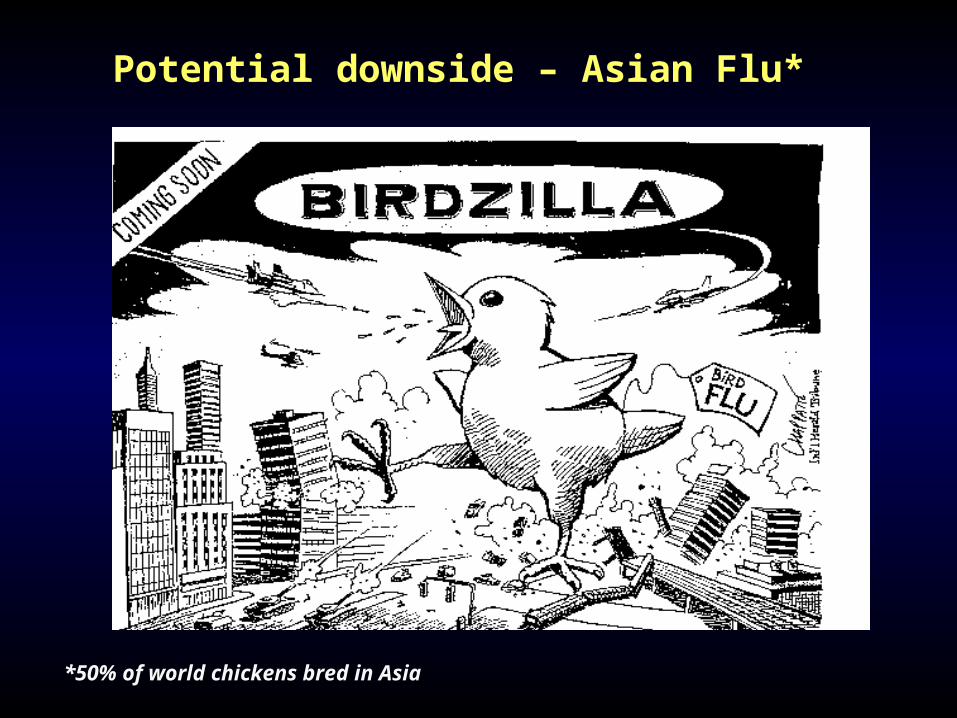
Potential downside – Asian Flu*
*50% of world chickens bred in Asia

Potential downside – Oil prices
Source – Outlook business June 2006
• A war against Iran could drive oil > $200 a barrel - ‘Times’ 22nd June 2006• Oil is 33% of Indian Energy Sources – IMA, India June 2006• BRIC countries consume 20% oil
Source – EIIG Source – BP

USA – 4% population with 20% emissions
China – Same level as USA in 2005. In 2025 will be double
India, China, USA – Refuse any mandatory CO2 emission caps
India is 6th greatest energy consumer
Ganges River is the World’s most polluted river
– source: World Commission on water
Potential Downside - Pollution

Potential downside – InfrastructureA common view
Source – Manmohan Singh
- Infrastructure will need $155b over the next five years
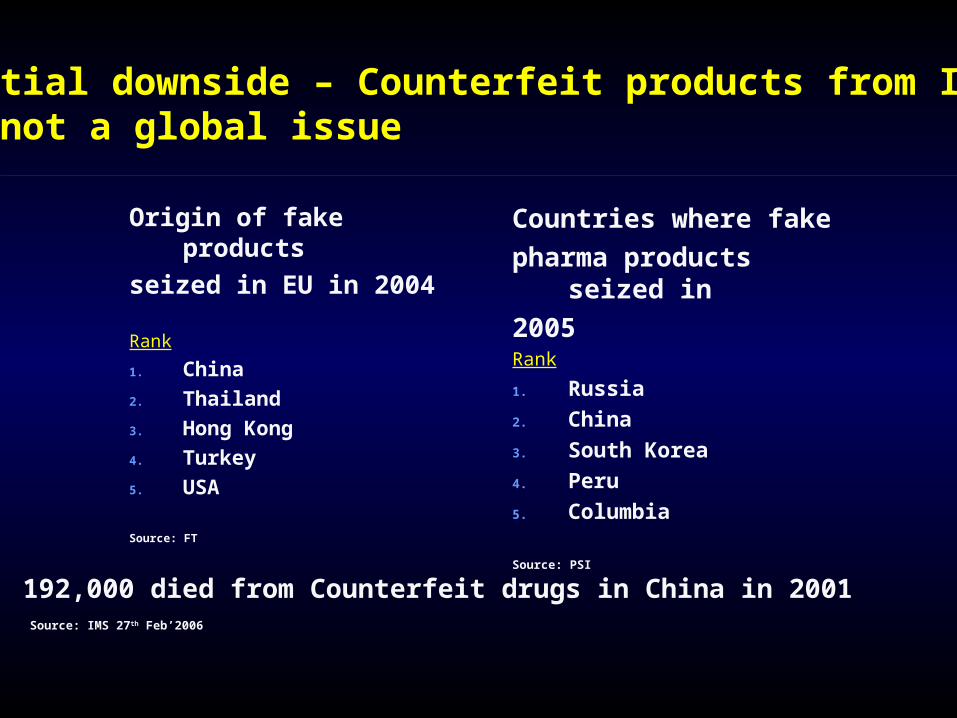
Potential downside – Counterfeit products from India-but not a global issue
Origin of fake products
seized in EU in 2004
Rank
1. China
2. Thailand
3. Hong Kong
4. Turkey
5. USA
Source: FT
Countries where fake
pharma products seized in
2005Rank
1. Russia
2. China
3. South Korea
4. Peru
5. Columbia
Source: PSI
192,000 died from Counterfeit drugs in China in 2001 Source: IMS 27th Feb’2006

Asia economic strength is returning to levels seen in the past
Many advantages for India – R&D, Demographics education India as a global strategic asset Some downsides - infrastructure
The current feeling in India a turning point has been reached and an inflexion point has been passed
“China & India represent the future of Asia and quite possiblythe future for the global economy” – Steve Roach, Morgan Stanley
Summary

“We have all grown up learning the story of the unfinished voyage of Christopher Columbus
setting sail to reach India, he discovered America. I now invite the people of America to complete the
Voyage of that great explorer”
Manmohan SinghPrime Minister of India
July 2005

Thank You