Embed Size (px)
Citation preview

University of Southampton Research Repository
ePrints Soton
Copyright © and Moral Rights for this thesis are retained by the author and/or other copyright owners. A copy can be downloaded for personal non-commercial research or study, without prior permission or charge. This thesis cannot be reproduced or quoted extensively from without first obtaining permission in writing from the copyright holder/s. The content must not be changed in any way or sold commercially in any format or medium without the formal permission of the copyright holders.
When referring to this work, full bibliographic details including the author, title, awarding institution and date of the thesis must be given e.g.
AUTHOR (year of submission) "Full thesis title", University of Southampton, name of the University School or Department, PhD Thesis, pagination
http://eprints.soton.ac.uk

UNIVERSITY OF SOUTHAMPTON
FACULTY OF PHYSICAL AND APPLIED SCIENCES
Electronics and Computer Science
The cell-free expression of ion channels and
electrophysiological measurements in interdroplet bilayers
by
Mark Samuel Friddin
A thesis submitted in partial fulfillment for the degree of Doctor of
Philosophy
May 2014


UNIVERSITY OF SOUTHAMPTON
ABSTRACT
FACULTY OF PHYSICAL AND APPLIED SCIENCES
Electronics and Computer Science
Doctor of Philosophy
THE CELL-FREE EXPRESSION OF ION CHANNELS AND
ELECTROPHYSIOLOGICAL MEASUREMENTS IN INTERDROPLET
BILAYERS
by Mark Samuel Friddin
Ion channels are membrane proteins of interest for medical research and drug
discovery, however a major bottleneck in obtaining functional measurements is the
requirement to over-express the channel in-vivo. Cell-free (CF) protein expression
is an alternative in-vitro approach capable of expressing proteins from a supplied
DNA template - the method is fast, requires minimal apparatus and can be
stabilised for the expression of membrane proteins by the addition of lipids or
detergents. One drawback is the expense of commercial CF systems, however this
can be economised by performing the reaction in microdroplets. This is attractive
as microdroplets immersed in lipid-oil can be manipulated into contact to form a
lipid bilayer, potentially allowing for ion channel expression and characterisation
to be fully coupled. This study addresses the feasibility of achieving this goal
by first investigating the stability of interdroplet bilayers formed in the presence
of pre-incubated CF systems. Under these conditions the bilayers failed in <10
min, however a combination of diluting the mixture and adding vesicles was found
to enable measurements of >30 min. The CF expression of the small prokaryotic
potassium channel KcsA was then verified, in addition to the pore domain region of
the eukaryotic hERG channel, where 20 ng/µl-74 ng/µl was expressed depending
on the reaction conditions. Single-channel currents were subsequently obtained
in interdroplet bilayers formed directly from the CF mixture, indicating that
the channels were capable of self-inserting into the bilayer for measurements in
both cases. The findings of this study support the feasibility of coupling the CF
expression and electrical characterisation of ion channels in microdroplets and
represent a progression toward the development of a high-throughput platform for
screening novel pharmaceutical compounds.

Contents
Nomenclature vii
Declaration of Authorship ix
Acknowledgements xi
1 Introduction 1
1.1 Objectives and outcomes of the PhD study . . . . . . . . . . . . . . 1
1.2 Novelty and contributions of the PhD study . . . . . . . . . . . . . 2
1.3 Scientific Relevance . . . . . . . . . . . . . . . . . . . . . . . . . . . 3
2 Literature and background 7
2.1 Ion channel electrophysiology . . . . . . . . . . . . . . . . . . . . . 7
2.1.1 Theoretical background . . . . . . . . . . . . . . . . . . . . . 8
2.1.2 The patch clamp method . . . . . . . . . . . . . . . . . . . 10
2.1.3 Electrophysiology using planar lipid bilayers . . . . . . . . . 13
2.1.4 Electrophysiology using microdroplets . . . . . . . . . . . . . 14
2.1.5 Controlled delivery of proteins to lipid bilayers . . . . . . . . 17
2.2 Ion channel expression for electrophysiological measurements . . . . 18
2.2.1 The expression of ion channels in vivo . . . . . . . . . . . . 18
2.2.2 Ion channel purification . . . . . . . . . . . . . . . . . . . . 18
2.2.3 Sodium dodecyl sulphate polyacrylamide gel electrophoresis(SDS PAGE) . . . . . . . . . . . . . . . . . . . . . . . . . . 19
2.2.4 Western blotting . . . . . . . . . . . . . . . . . . . . . . . . 20
2.2.5 Protein reconstitution . . . . . . . . . . . . . . . . . . . . . 20
2.3 Cell-free protein expression . . . . . . . . . . . . . . . . . . . . . . . 21
2.3.1 State of the art in CF protein expression . . . . . . . . . . . 24
2.3.2 Spontaneous channel insertion into vesicles . . . . . . . . . . 25
2.3.3 Cell-free protein expression in microsystems . . . . . . . . . 27
2.4 Ion channels . . . . . . . . . . . . . . . . . . . . . . . . . . . . . . . 29
2.4.1 KcsA . . . . . . . . . . . . . . . . . . . . . . . . . . . . . . . 31
2.4.2 KvAP . . . . . . . . . . . . . . . . . . . . . . . . . . . . . . 33
2.4.3 Kv11.1 (hERG) . . . . . . . . . . . . . . . . . . . . . . . . . 35
2.5 Summary . . . . . . . . . . . . . . . . . . . . . . . . . . . . . . . . 37
3 Methods and preliminary work 39
v

vi CONTENTS
3.1 Methods for cell-free protein expression . . . . . . . . . . . . . . . . 40
3.1.1 Template preparation . . . . . . . . . . . . . . . . . . . . . . 40
3.1.2 GFP and KcsA protein . . . . . . . . . . . . . . . . . . . . . 42
3.1.3 Unilamellar vesicle formation . . . . . . . . . . . . . . . . . 43
3.1.4 The cell-free reaction . . . . . . . . . . . . . . . . . . . . . . 43
3.1.5 Protein purification using Ni-NTA affinity chromatography . 44
3.1.6 Gel electrophoresis . . . . . . . . . . . . . . . . . . . . . . . 45
3.1.7 Western blotting . . . . . . . . . . . . . . . . . . . . . . . . 47
3.1.8 Protein reconstitution . . . . . . . . . . . . . . . . . . . . . 48
3.1.9 The cell-free expression of green fluorescent protein anddetection using fluorescence microscopy . . . . . . . . . . . . 49
3.1.10 The cell-free expression of GFP and real time measurementsusing a plate reader . . . . . . . . . . . . . . . . . . . . . . . 51
3.1.11 Expression of GFP with fluorescent tRNA-lysine . . . . . . . 52
3.1.12 Expression of KcsA with fluorescent tRNA-lysine . . . . . . 55
3.1.13 SDS PAGE of diluted CF expression mixtures spiked withKcsA protein . . . . . . . . . . . . . . . . . . . . . . . . . . 56
3.2 Methods for bilayer formation and current measurements . . . . . . 59
3.2.1 Bilayer current amplifier . . . . . . . . . . . . . . . . . . . . 59
3.2.2 Silver/silver chloride electrodes . . . . . . . . . . . . . . . . 60
3.2.3 KcsA electrophysiology with bilayer curvettes . . . . . . . . 60
3.2.4 Interdroplet bilayer formation using the regulated attach-ment method . . . . . . . . . . . . . . . . . . . . . . . . . . 64
3.2.4.1 Fabrication of a flexible PDMS substrate for inter-droplet bilayer formation using RAM . . . . . . . . 66
3.2.4.2 Lipid bilayer formation in RAM devices . . . . . . 68
3.2.5 Interdroplet bilayer formation on a planar microelectrodearray . . . . . . . . . . . . . . . . . . . . . . . . . . . . . . . 73
3.2.5.1 Fabrication of planar microelectrode arrays . . . . 73
3.2.5.2 Fabrication of chip holders and oil reservoirs . . . . 75
3.2.5.3 Interdroplet bilayer formation using the planarmicroelecrode array . . . . . . . . . . . . . . . . . 79
3.2.5.4 Electrokinetic versus manual interdroplet bilayerformation . . . . . . . . . . . . . . . . . . . . . . . 84
3.3 Summary . . . . . . . . . . . . . . . . . . . . . . . . . . . . . . . . 85
4 Stability of interdroplet bilayers with cell-free expression mix-tures 87
4.1 Interdroplet bilayers of asolectin . . . . . . . . . . . . . . . . . . . . 87
4.2 Interdroplet bilayers of synthetic lipids . . . . . . . . . . . . . . . . 88
4.3 Interdroplet bilayers with asymmetric pH . . . . . . . . . . . . . . . 94
4.4 The effect of cell-free expression mixtures and components onbilayer stability . . . . . . . . . . . . . . . . . . . . . . . . . . . . . 98
4.5 Interdroplet bilayers formed of pure protein and polymers . . . . . . 102
CONTENTS vii
4.6 Stabilisation of interdroplet bilayers formed in the presence of CFsystems . . . . . . . . . . . . . . . . . . . . . . . . . . . . . . . . . 105
4.7 Summary . . . . . . . . . . . . . . . . . . . . . . . . . . . . . . . . 108
5 The cell-free expression of ion channels 109
5.1 The cell-free expression of KcsA . . . . . . . . . . . . . . . . . . . . 109
5.1.1 Western blotting of cell-free expressed His-tagged KcsA . . . 110
5.1.2 Affinity-bead purification of cell-free expressed His-taggedKcsA . . . . . . . . . . . . . . . . . . . . . . . . . . . . . . . 112
5.1.3 Dependence of KcsA expression yield on the amount of DNAtemplate . . . . . . . . . . . . . . . . . . . . . . . . . . . . . 120
5.1.4 Dependence of KcsA expression yield on the presence of lipidvesicles . . . . . . . . . . . . . . . . . . . . . . . . . . . . . . 123
5.2 Cell-free expression of full-length KvAP potassium channel . . . . . 128
5.2.1 Western blotting of cell-free expressed His-tagged KvAP . . 128
5.2.2 Dependence of KvAP expression yield on the amount ofDNA template . . . . . . . . . . . . . . . . . . . . . . . . . 130
5.2.3 Dependence of KvAP expression yield on the presence oflipid vesicles . . . . . . . . . . . . . . . . . . . . . . . . . . . 131
5.3 Cell-free expression of a pore domain of the hERG potassium channel132
5.3.1 Western blotting of CF expressed His-tagged hERGS5−S6 . . 132
5.3.2 Dependence of hERGS5−S6 expression yield on the amountof DNA template . . . . . . . . . . . . . . . . . . . . . . . . 134
5.4 Summary . . . . . . . . . . . . . . . . . . . . . . . . . . . . . . . . 137
6 Electrophysiology of cell-free expressed ion channels 139
6.1 Electrophysiology of CF expressed KcsA in interdroplet bilayers . . 140
6.2 KcsA inhibition by TEA . . . . . . . . . . . . . . . . . . . . . . . . 147
6.3 Electrophysiology of KcsA expressed in the presence of lipid vesicles 148
6.4 Electrophysiology of CF expressed and purified KcsA in interdropletbilayers . . . . . . . . . . . . . . . . . . . . . . . . . . . . . . . . . 151
6.5 Electrophysiology of CF expressed hERGS5−S6 in interdroplet bilayers160
6.6 Summary . . . . . . . . . . . . . . . . . . . . . . . . . . . . . . . . 164
7 Conclusion 165
7.1 Summary . . . . . . . . . . . . . . . . . . . . . . . . . . . . . . . . 165
7.2 Recommendations for future work . . . . . . . . . . . . . . . . . . . 167
7.3 Publications . . . . . . . . . . . . . . . . . . . . . . . . . . . . . . . 168
References 170


Nomenclature
APS Ammonium persulfate
ATP Adenosine triphosphate
BLM Bilayer lipid membrane or Black lipid membrane
BODIPY Boron-dipyrromethane
BSA Bovine serum albumin
CAD Computer aided design
CECF Continuous exchange cell-free
CF Cell-free
CFCF Continuous flow cell-free
CMC Critical micellar concentration
D-CF Detergent assisted cell-free
DEP Dielectrophoresis
DHB Droplet-hydrogel bilayer
DIB Droplet interface bilayer
DOPC 1,2-dioleoyl-sn-glycero-3-phosphocholine
DPhPC 1,2-diphytanoyl-sn-glycero-3-phosphocholine
eGFP Enhanced green fluorescent protein
GFP Green fluorescent protein
GPCR G protein coupled receptor
GTP Guanosine triphosphate
GUV Giant unilamellar vesicle
HEPES 4-(2-hydroxyethyl)-1-piperazineethanesulfonic acid
hERG The product of the human ether-a-go go-related gene
HRP Horseradish peroxidase
IPTG Isopropyl β-D-1-thiogalactopyranoside
KcsA Potassium crystollographically-sited activation channel
kDa Kilo Dalton
L-CF Lipid assisted cell-free
LOC Lab on a chip
ix

x NOMENCLATURE
mRNA Messenger ribonucleic acid
Ni-NTA Nickel-nitrilotriacetic acid
NTP Nucleoside triphosphate
P-CF Precipitate assisted cell-free
PBS Phosphate buffered saline
PCR Polymerase chain reaction
PDMS Polydimethylsiloxane
PEG Polyethylene glycol
PMMA Poly (methyl methacrylate)
POPE 1-palmitoyl-2-oleoyl-sn-glycero-3-phosphoethanolamine
POPG 1-palmitoyl-2-oleyl-sn-glycero-3-phospho-(1’-rac-glycerol)
PURE Protein synthesis using recombinant elements
RAM Regulated attachment method
RNA Ribonucleic acid
SDS PAGE Sodium dodecyl sulfate polyacrylamide gel electrophoresis
TEA Tetraethyl ammonium
TEMED Tetramethylethylenediamine
tRNA Transfer ribonucleic acid
αHL α-Haemolysin

Declaration of Authorship
I, Mark Samuel Friddin, declare that the thesis entitled The cell-free expression
of ion channels and electrophysiological measurements in interdroplet bilayers and
the work presented in the thesis are both my own, and have been generated by
me as the result of my own original research. I confirm that:
• this work was done wholly or mainly while in candidature for a research
degree at this University;
• where any part of this thesis has previously been submitted for a degree or
any other qualification at this University or any other institution, this has
been clearly stated;
• where I have consulted the published work of others, this is always clearly
attributed;
• where I have quoted from the work of others, the source is always given.
With the exception of such quotations, this thesis is entirely my own work;
• I have acknowledged all main sources of help;
• where the thesis is based on work done by myself jointly with others, I have
made clear exactly what was done by others and what I have contributed
myself;
• parts of this work have been published as: (Friddin et al., 2013a,d,c,b) and
(Friddin et al., 2012)
Signed:.......................................................................................................................
Date:..........................................................................................................................
xi


Acknowledgements
I owe much gratitude to the many people who have helped me along this journey,
only a few of which I can mention in this short acknowledgement. Recognition
should first go to my supervisors Dr. Maurits de Planque and Professor Hywel
Morgan for offering me this opportunity and for their guidance throughout the
course of this study. The Engineering and Physical Sciences Research Council
(EPSRC) are also acknowledged for providing the funding required for this PhD.
This work would also not have been possible if it were not for the help of
project collaborators, Dr. Philip Williamson, Dr. Natalie Smithers, and Maıwenn
Beaugrand from the Centre for Biological Sciences. I would also like to thank Katie
Chamberlain for fabricating the planar microelectrodes used in this study and the
rest of the Hybrid BioDevices Group for constantly offering guidance, advice and
camaraderie. In addition, I am especially grateful to all of the people I lived with
and got to know during my three years in Southampton - your friendship, counsel
and banter was invaluable. I would also like to thank my friends from home for
their support throughout this process, particularly to Declan and Sara for helping
with the proofreading of this thesis. Finally, I would like to thank my parents,
sisters and family for always encouraging me to succeed.
xiii


For Booba,
xv

Chapter 1
Introduction
1.1 Objectives and outcomes of the PhD study
The purpose of this doctoral study was to determine the feasibility of coupling
the cell-free (CF) expression and electrical characterisation of ion channels in
microdroplets. A fundamental requirement to achieve this was to first demonstrate
that interdroplet bilayers could be stabilised in the presence of a CF mixture to
enable the measurement of single-channel currents. The next priority was to verify
the CF expression of ion channels without the use of isotopic labels and to identify
the key parameters that influence the protein yield. Further to addressing the
bilayer stability and confirming protein expression, the final objective of this study
was to determine whether CF expressed ion channels could spontaneously self-
insert into an interdroplet bilayer for electrophysiological characterisation, directly
from the CF expression mixture, without any purification or reconstitution.
The stability of interdroplet bilayers formed in the presence of a CF mixture
is studied in Chapter 4, where electrophysiological screening of three different
commercial CF mixtures allowed for the components of the systems responsible
for destabilising the membrane to be identified. Stabilisation of the bilayer
was achieved by diluting the system and adding vesicles, allowing for electrical
measurements to be obtained for a minimum of 30 minutes.
The cell free expression of ion channels is shown in Chapter 5 by protein gel
electrophoresis of purified KcsA obtained from a CF mixture supplied with the
KcsA DNA template. The same method was also used to show the CF expression
of the pore domain of the eukaryotic hERG channel as verified by Western Blotting.
1

2 Chapter 1 Introduction
Interestingly it was found that adding vesicles or increasing the amount of DNA
supplied to the CF system led to a significant increase in the amount of KcsA
expressed, however the same effect was not found with the hERG construct.
In Chapter 6 it is shown that single channel currents of KcsA and the hERG pore
domain are obtained when an interdroplet bilayer is formed with a 2 µl droplet of
buffer and a 2 µl droplet of the unpurified CF expression mixture incubated with
the relevant DNA template. This outcome indicates that ion channels expressed in
situ can spontaneously self-insert into interdroplet bilayers for electrophysiological
measurements, without the need for protein purification or reconstitution.
The findings presented in Chapters 4, 5 and 6 support the concept of coupling
the expression and characterisation of ion channels in microdroplets and provide
preliminary data for conditions that support spontaneous channel insertion in
combination with bilayer survival.
1.2 Novelty and contributions of the PhD study
The novel aspects of the research presented in this study are :
• The stability study of interdroplet bilayers formed in the presence of three
commercial CF systems and their respective components. All three systems
were found to destabilise the interdroplet bilayer. However, the cell-lysate
fraction was identified to cause bilayer rupture while the reaction mixture
caused elevations and spikes in the bilayer current. It was found that diluting
the CF system 10x and adding vesicles to the reaction mixture enabled stable
current measurements to be obtained for experiments lasting 30 minutes.
• Single-channel electrophysiology of cell-free expressed ion channels by direct
incorporation into interdroplet bilayers. The CF expression of KcsA and
the novel hERGS5−S6 pore domain construct, was verified by purification
followed by SDS PAGE. It was shown that single channel measurements
could be obtained in interdroplet bilayers formed directly from each sample
without purification or reconstitution. This shows that spontaneous-
insertion of cell free expressed ion channels into interdroplet bilayers is a
general phenomenon that is not specific for the small viral potassium channel
Kcv (Syeda et al., 2008).

Chapter 1 Introduction 3
1.3 Scientific Relevance
This section outlines the motivations for studying ion channels and explains
the limitations in obtaining measurements using conventional techniques. The
rationale for using the cell-free method and the incentives for miniaturisation are
then introduced before the ideal of coupling the expression and characterisation
of ion channels in microdroplets is discussed.
The medical relevance of membrane proteins
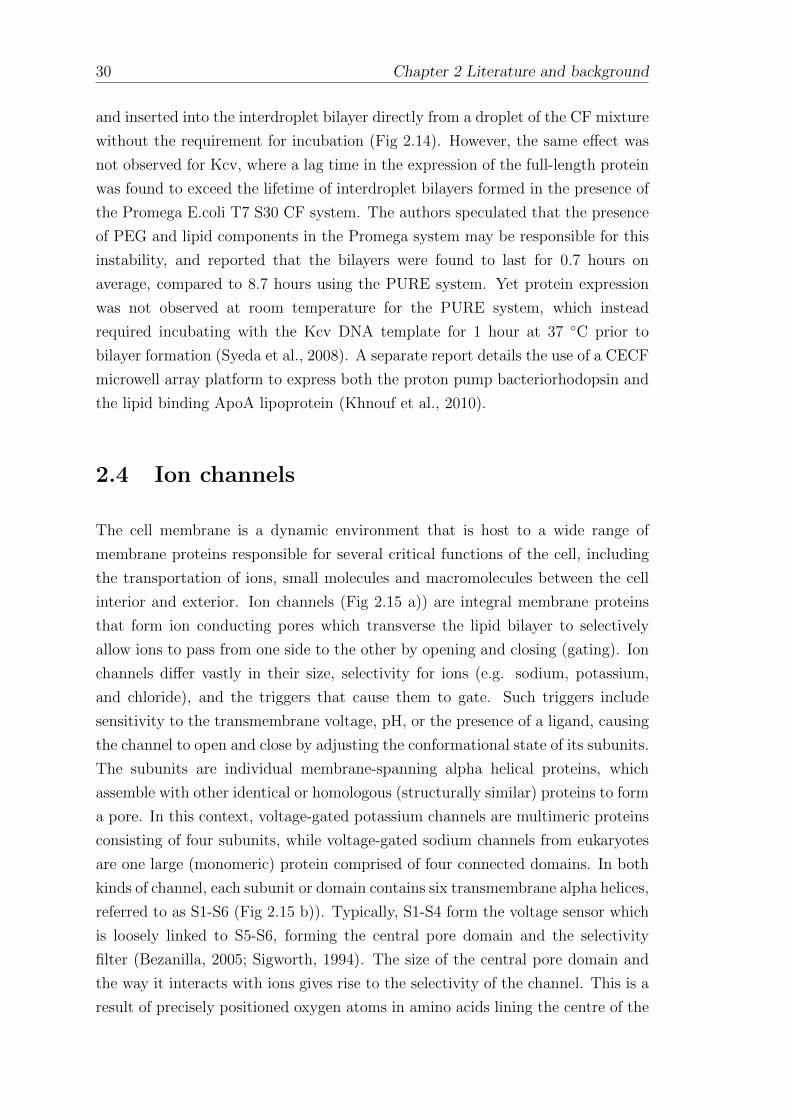
Membrane proteins (Fig 1.1) are targets for approximately 50% of all drugs and
account for ∼25% of all polypeptides encoded in the human genome (Overington
et al., 2006). Yet despite their clinical significance, difficulties in expressing and
purifying sufficient amounts of membrane proteins for analysis has resulted in a
bottleneck in structural and functional studies (Junge et al., 2011). Ion channels
are an important class of membrane proteins that mediate ion flow across cellular
membranes and are responsible for a number of processes including the excitability
of neurons and the regulation of cardiac rhythm (Hille, 2001). Obtaining electrical
measurements of ion channels is therefore essential for studying their roles in
normal physiology and for understanding their function in ion channel-related
diseases, known as channelopathies (Celesia, 2001; Abraham et al., 1999). For
this purpose the model potassium channel KcsA is studied, in addition to KvAP
and the pore domain region of the eukaryotic hERG channel
Figure 1.1: The cell membrane. The image illustrates a highly active cellsurface that is densely populated by different types of membrane proteins.The figure was obtained from Hardin et al. (2011).
4 Chapter 1 Introduction
Conventional methods for studying ion channels
Ion channels can be characterised at a single-channel level with a number of
electrophysiology techniques. These include patch clamping, where a glass pipette
makes a seal with a cell membrane, or bilayer lipid membranes, where purified
ion channels are introduced into an aperture-suspended bilayer of synthetic lipids.
The first method requires precise positioning and clamping of the glass pipette over
a small membrane patch, while the second method requires protein purification,
reconstitution into proteoliposomes and incorporation into the lipid bilayer (Fig
1.2). Both methods require over-expression (an induced increase in the natural
level of protein expressed by the cell) to generate sufficient amounts of the channel
of interest, which may be toxic to the cell, leading to a substantial reduction in
the process yield. This demands that the whole process be performed on a scale
of several litres to obtain sufficient amounts of protein to study. This requires
several days work and a substantial molecular biology infrastructure, which limits
the throughput of ion channel research (Demarche et al., 2011).
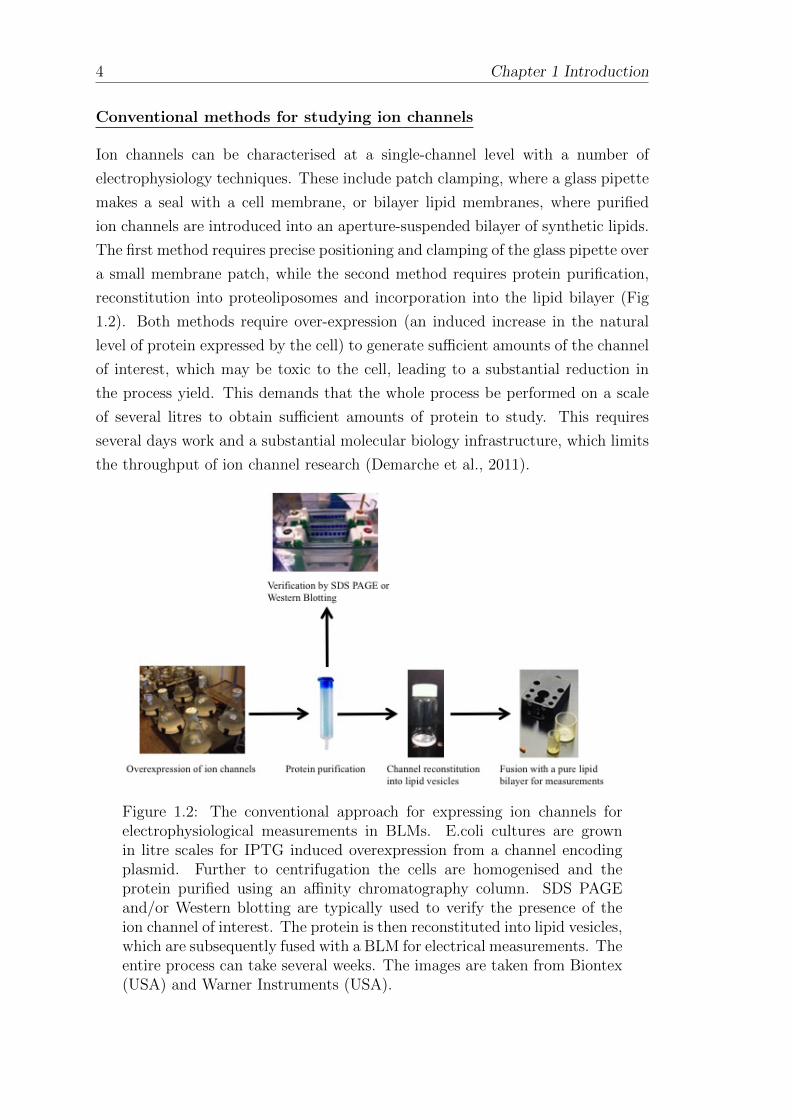
Figure 1.2: The conventional approach for expressing ion channels forelectrophysiological measurements in BLMs. E.coli cultures are grownin litre scales for IPTG induced overexpression from a channel encodingplasmid. Further to centrifugation the cells are homogenised and theprotein purified using an affinity chromatography column. SDS PAGEand/or Western blotting are typically used to verify the presence of theion channel of interest. The protein is then reconstituted into lipid vesicles,which are subsequently fused with a BLM for electrical measurements. Theentire process can take several weeks. The images are taken from Biontex(USA) and Warner Instruments (USA).

Chapter 1 Introduction 5
Electrophysiology of cell free expressed ion channels in microdroplets
Cell-free (CF) protein expression (Fig 1.3 a)) is an alternative in vitro method
for producing proteins that works by adding a DNA template to a mixture of
the essential components required for protein expression (Whittaker, 2013). The
method is fast, commercially available and is continuously accessible, allowing
detergents or lipid vesicles to be freely added for stabilising the expression of
membrane proteins (Katzen, 2008; Junge et al., 2011). One drawback of the
CF method is the expense of the systems, however this can be economised by
performing the reaction in microlitre volumes. Performing the reaction on this
scale is also interesting as it is possible to form a lipid bilayer by placing two
aqueous droplets into contact inside a well of lipid-oil (Bayley et al., 2008). This
presents the opportunity to express ion channels in the proximity of a lipid bilayer,
which is desirable as it may allow for the entire process of ion channel expression
and characterisation to be fully coupled (1.3 b)). This would be particularly useful
for the development of miniature high throughput screening platforms, capable
of testing the response of ion channels against arrays of novel pharmaceutical
compounds.
Figure 1.3: Cell free protein expression and coupled expression/character-isation. a) Cell-free protein expression is an in-vitro method of expressingproteins from a user supplied DNA template. The mixture contains all ofthe consumables and cellular apparatus required for the transcription andtranslation of DNA into proteins. b) An interdroplet bilayer can be formedby manipulating two aqueous microdroplets into contact inside a well oflipid-oil. If one droplet contained the CF expression mixture supplied witha DNA template for an ion channel it is possible that Ag/AgCl electrodesinserted into each droplet could allow for single channel measurements tobe obtained as the channel is expressed.
.

Chapter 2
Literature and background
This chapter details the theoretical background behind the study and is supported
by a review of the relevant literature. The chapter is split into four parts, where
the first part provides an introduction to obtaining electrical measurements of ion
channels using both the patch-clamp method and the model membrane method.
The recent innovations towards developing high-throughput methods are then pre-
sented, followed by an introduction to the concept of obtaining electrophysiological
measurements from bilayers formed using microdroplets immersed in lipid oil. The
conventional methods used to express ion channels are then discussed in the third
section of the chapter before achievements and observations using the cell-free
method are detailed. The chapter concludes with a general description of ion
channels followed by a summary of the specific characteristics reported in the
literature for the KcsA, KvAP and the hERG channel.
2.1 Ion channel electrophysiology
Electrophysiology is a field of biophysics concerned with the study of the electrical
properties of biological components such as tissues and cells. While the subject
dates back to the late 18th century when Luigi Galvani discovered bioelectricity
(Piccolino, 1998), the field as it is known today has largely evolved from the more
recent era of classical biophysics (1935-1952) (Hille, 2001). This period is famous
for research using the squid giant axon to investigate the ionic theory of membrane
conduction and the electrophysiology of action potentials. Critically it was shown
that the movement of ions were responsible for changes in membrane potential
(inside potential - outside potential) and that the permeability of the plasma
7
8 Chapter 2 Literature and background
membrane to Na+ ions changes during the action potential which was recorded
for the first time (Hodgkin and A.F, 1945; Curtis and Cole, 1940, 1942). These
results were obtained by measuring the change in membrane potential at different
locations along the squid giant axon when a current in the form of an electrical
stimulus was applied. The invention of the voltage clamp technique in 1949 was
a significant advancement as it allowed for ionic currents to be measured under
a predefined membrane potential (Hille, 2001; Hodgkin et al., 1952; Maramont,
1949). The setup consisted of an intracellular electrode, a follower circuit to
measure the membrane potential, a feedback amplifier to correct any difference
between the recorded voltage and preset value and a second intracellular electrode
to supply any subsequent current. Through keeping the membrane potential
constant Hodgkin and Huxley were able to outline the ionic basis of the action
potential earning them the Nobel Prize in Physiology or Medicine in 1963 (Hille,
2001).
2.1.1 Theoretical background
An open ion channel can allow the movement of ions into or out of the cell at a rate
of over 10,000,000 ions per second (Hille, 2001), giving rise to cellular excitation
required for the generation of an action potential. This movement of free charges in
a conducting medium can be described as an electrical current, where one ampere
equates to a steady flow of charges at a rate of one coulomb per second. In the case
of potassium ions, a mole of KCl contains one mole of K+ cations and a mole of
Cl− anions. By definition, one mole of any given substance contains 6.022 x 10²³
number of particles, the charge of a proton is 1.16 x 10⁻¹⁹ C and the multiplication
of these two values, the charge on Avagadro’s number of elementary charges, is
known as the Faraday constant (F), which is approximately equal to 105 C/mol.
In the case of divalent cations, the charge is 2F while in monovalent anions the
charge is -F. These terms allow Ohms law to be applied to ion channel studies,
where the ionic current passing through the channel is equal to the conductance
of the channel multiplied by the voltage difference across the conductor. As the
cell membrane comprises of an insulating lipid bilayer separating two aqueous
compartments, it is also possible to view this structure as a capacitor. These
properties allow biophysicists to model the properties of membranes and channels
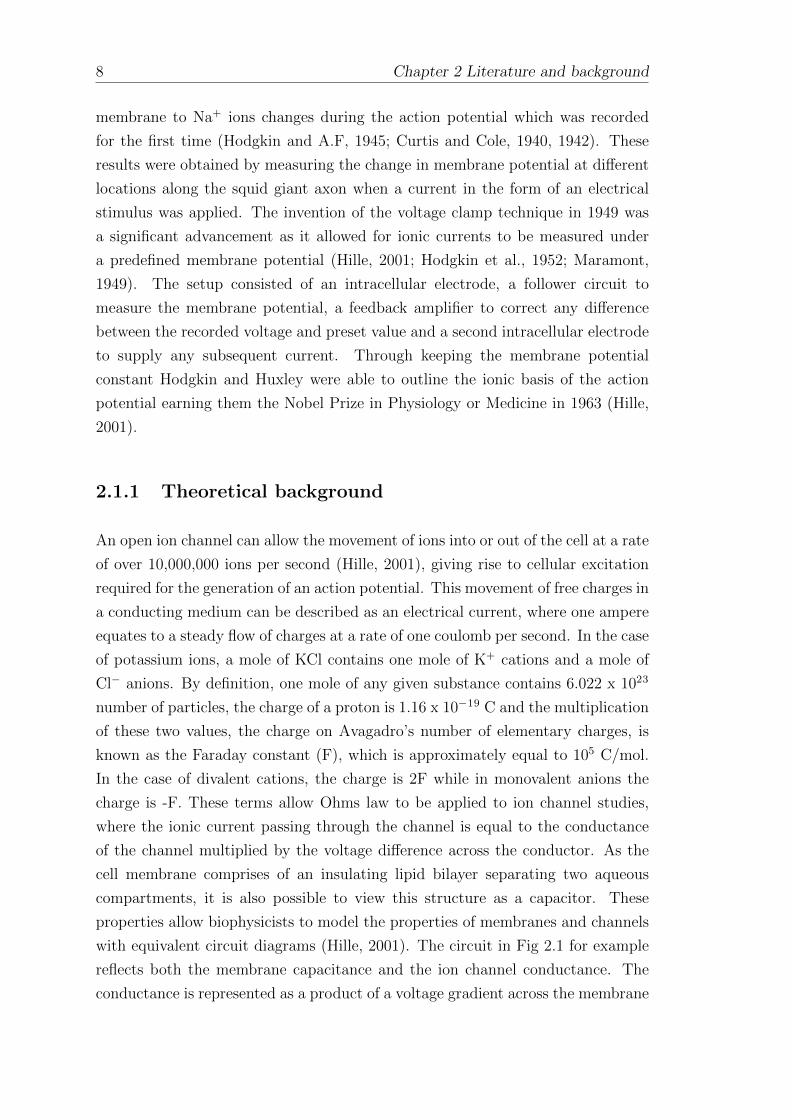
with equivalent circuit diagrams (Hille, 2001). The circuit in Fig 2.1 for example
reflects both the membrane capacitance and the ion channel conductance. The
conductance is represented as a product of a voltage gradient across the membrane
Chapter 2 Literature and background 9
Figure 2.1: A model membrane circuit. The circuit is an electricalrepresentation of an ion channel inserted into a cell membrane. Thecapacitor reflects the membrane capacitance (CM), the resistor representsthe conductance of the ion channel conductance (gK) and the batterydepicts the membrane potential. The figure is taken from (Hille, 2001).
due to a concentration of ions generating an electromotive force (EMF) and the
conductance of the channel is represented by a resistor. Using this circuit, the
current-voltage relationship of ion channels can be represented.
It therefore stands to reason that electrophysiological recordings can be obtained
by placing an electrode either side of the bilayer and measuring either the mem-
brane potential or the transmembrane current. The latter can be achieved using
silver/silver chloride (Ag/AgCl) electrodes, a standard non-polarised electrode
(exhibiting no double layer capacitance) that is more practical to use than either
the classic Hg/HgCl or calomel electrode. The electrode works when in contact
with solution containing chloride (e.g. KCl), where the Cl atoms in the AgCl
crust can be exchanged just like metal atoms in contact with a salt of that metal,
allowing the Ag/AgCl electrode to effectively behave as a chlorine electrode in a
salt of chlorine. The potential is determined by the concentration of Cl− in the
solution and can be calculated using the Nernst equation.
10 Chapter 2 Literature and background
2.1.2 The patch clamp method
One method to record single-channel currents is to carefully press a glass
micropipette with a small tip diameter of ∼1 µm against the surface of a cell
such as a neuron as illustrated in Fig 2.2. A high resistance seal is formed
between the pipette and the plasma membrane by applying suction, allowing
the membrane patch to be electrically isolated from the rest of the cell surface.
Any channels present in the membrane patch can be studied in the intact cell,
or the membrane patch can be removed by drawing the pipette away, allowing
for the investigator to have access to the cytosolic side of the membrane. In
either case, a Ag/AgCl electrode inserted inside the pipette and a second Ag/AgCl
electrode connected to ground allows for the voltage across the membrane to be
maintained using an amplifier containing a voltage clamp feedback circuit. The
voltage clamp then measures any changes in the transmembrane current, arising
due to openings and closings of ion channels residing in the isolated membrane
patch. This method, invented by Neher and Sakmannin in 1976, allowed the first
experimental verification of ion channels by demonstrating single channel currents
of the acetylcholine receptor (Neher and Sakmann, 1976). This achievement led
to their award of the Nobel Prize in Physiology and Medicine in 1991. While
the patch clamp method is considered the gold standard for obtaining single-
channel measurements, the method suffers from low-throughput and practical
difficulties. This has motivated the commercial development of automated
platforms for performing electrophysiological measurements in mammalian cell
lines and oocytes. These include both single and multichannel systems that
essentially replace the top down access to cells via micropipettes with a bottom up
configuration to enable compatibility with plate or chip-based formats (Fig 2.3).
This is most typically achieved using planar-array based approaches, referring to
the use of multi-well configurations to enable multiple recordings in parallel (Laszlo
et al., 2003). The Ion Works HT system was the first screening platform to become
widely available (Schroeder et al., 2003). The first-generation system used a 384-
well PatchPlate, with each well containing a single 1-2 µm wide micropore in the
glass substrate for patching a cell (Fig 2.3 a)). A more recent evolution of the
platform obtained simultaneous recordings from 64 cells per well (Fig 2.3 b)) and
termed the process population patch clamp (Finkel et al., 2006). A key advantage
of this method is that it allows for multi-well averaging to overcome typical well-
well variability observed with the single hole approach (John et al., 2007), however
a major drawback is the absence of perfusion capability. The first planar-array
based system to enable giga-ohm seal patch-clamp electrophysiology on-chip was

Chapter 2 Literature and background 11
Figure 2.2: The Patch-Clamp method for obtaining measurements ofion channels. Cells containing the over-expressed channel of interestare supplied suspended in a bath solution. A glass micropipette witha ∼3 µm opening is positioned on to a cell using micromanipulators,a giga Ohm seal is created by applying suction, electrically isolatingthe ion channels inserted in the membrane patch from the rest of thecell membrane (insert). A patch clamp amplifier connected to Ag/AgClelectrodes inserted into the micropipette and the bath facilitates electricalmeasurements by maintaining the membrane potential and detecting anysmall changes in the transmembrane current. The figure is adapted fromDunlop et al. (2008); Hardin et al. (2011).
the Patch Xpress (Molecular Devies, USA), illustrated in Fig 2.3 part c) (Tao
et al., 2004; Xu et al., 2003). The ‘seal chip’ used in the platform enabled fluid
exchange using pumps. The QPatch is a similar platform and was the first to
enable microfluidic flow capabilities for fluid exchange in their QPlate modules
shown in Fig 2.3 part d) (Asmild et al., 2003; Mathes, 2006). The Patchliner
system extended this microfluidic capability to facilitate fluid exchange on both
the extracellular and intracellular side on a glass chip, the NPC16 chip used in the
platform is shown in Fig 2.3 part e) (Farre et al., 2007). The recently developed
CytoPatch robotic platform is shown in Fig 2.3 part f). The examples provided
highlight the diversity in approaches that have been used to develop automated
devices to patch clamping, however one general drawback is that each platform
still requires a supply of cells. While Xenopus oocytes, are both mechanically and
electrically stable, large in size and readily available (Cens and Charnet, 2007), the
requirement to prepare cells for each individual ion channel remains limiting to the
12 Chapter 2 Literature and background
potential throughput of the method. This makes automated patch clamp platforms
closer to a ‘chip in a lab as opposed to a lab on a chip. Additional practical
limitations of the patch clamp system also include the inability to control the lipid
composition of the membrane, the dependence of the channel incorporating into
the patched region of the membrane, and the unavailability of ion channels that
do not reside on the outer cell surface.
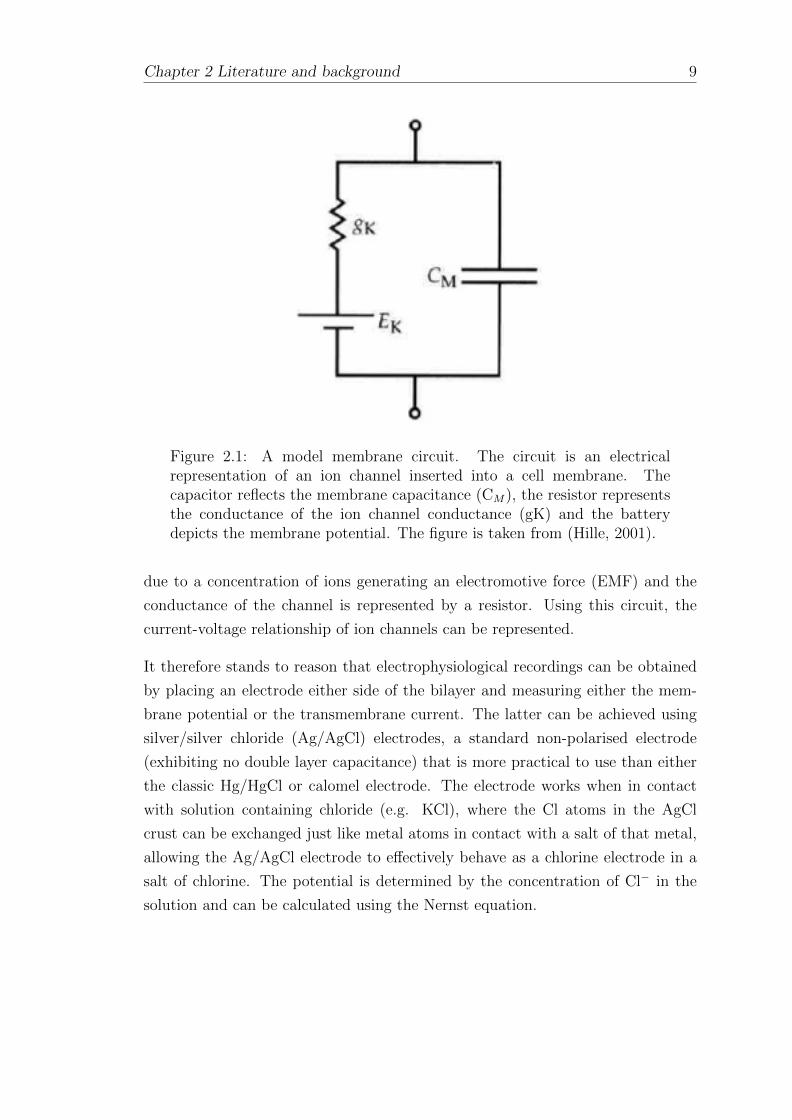
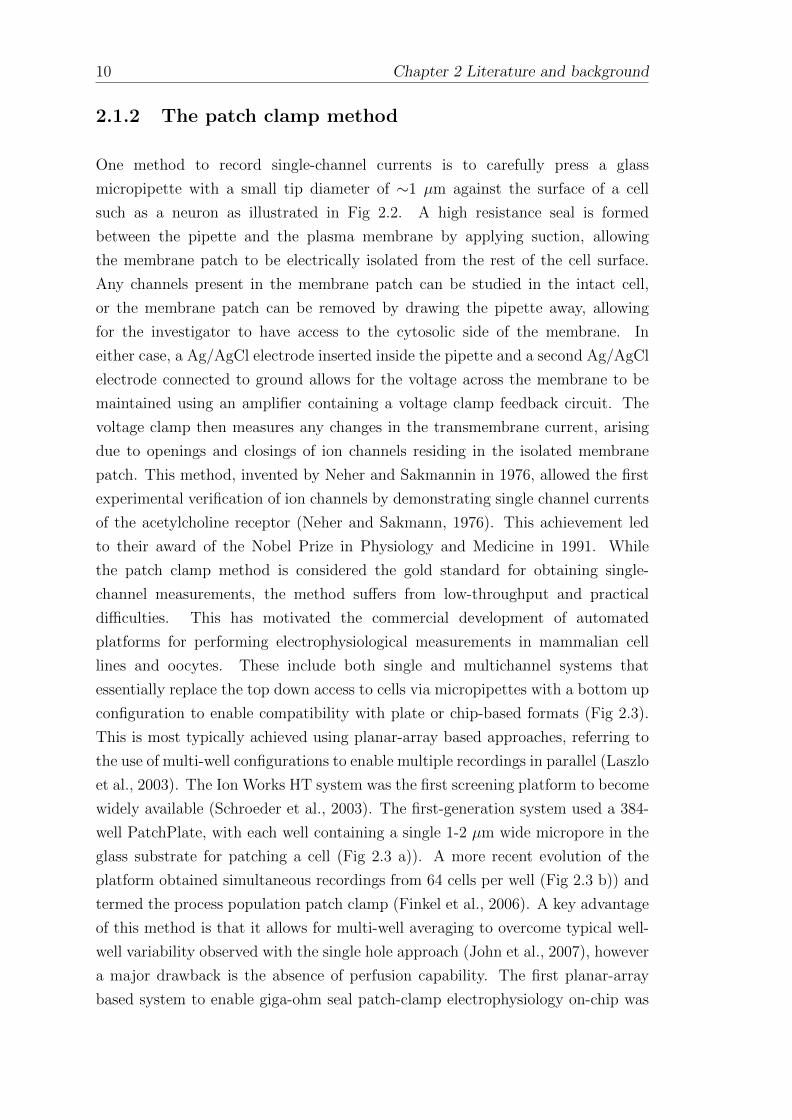
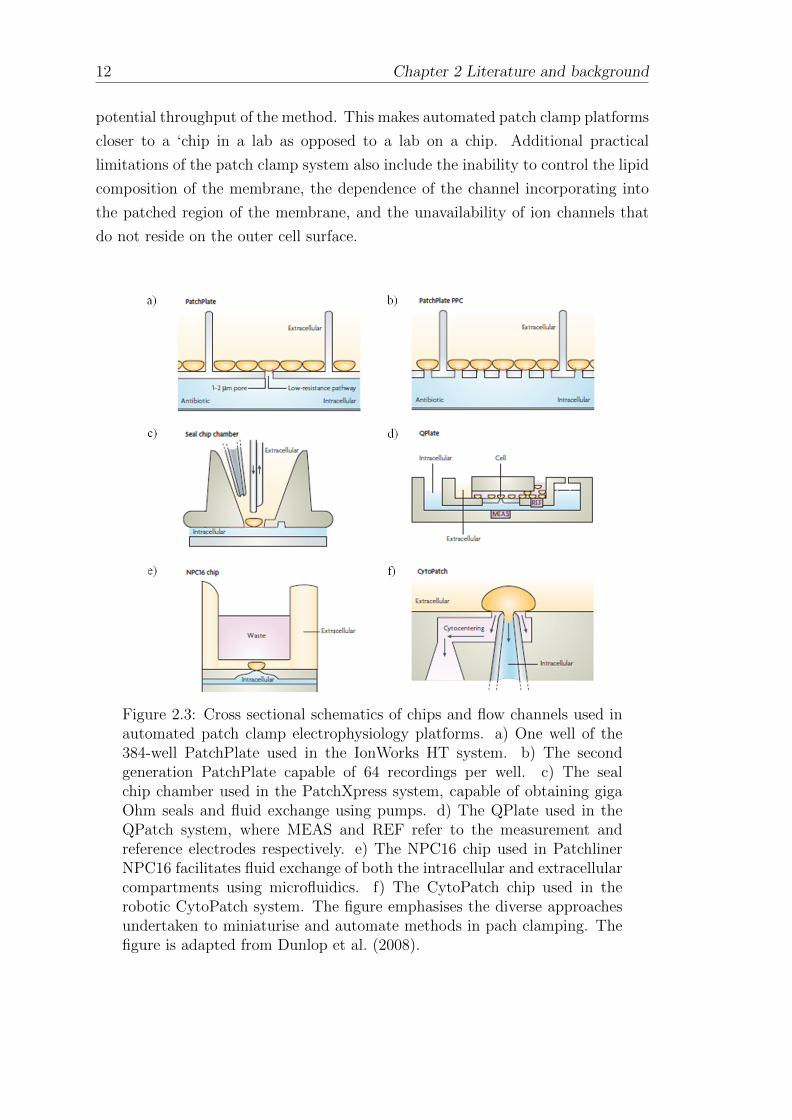
Figure 2.3: Cross sectional schematics of chips and flow channels used inautomated patch clamp electrophysiology platforms. a) One well of the384-well PatchPlate used in the IonWorks HT system. b) The secondgeneration PatchPlate capable of 64 recordings per well. c) The sealchip chamber used in the PatchXpress system, capable of obtaining gigaOhm seals and fluid exchange using pumps. d) The QPlate used in theQPatch system, where MEAS and REF refer to the measurement andreference electrodes respectively. e) The NPC16 chip used in PatchlinerNPC16 facilitates fluid exchange of both the intracellular and extracellularcompartments using microfluidics. f) The CytoPatch chip used in therobotic CytoPatch system. The figure emphasises the diverse approachesundertaken to miniaturise and automate methods in pach clamping. Thefigure is adapted from Dunlop et al. (2008).
Chapter 2 Literature and background 13
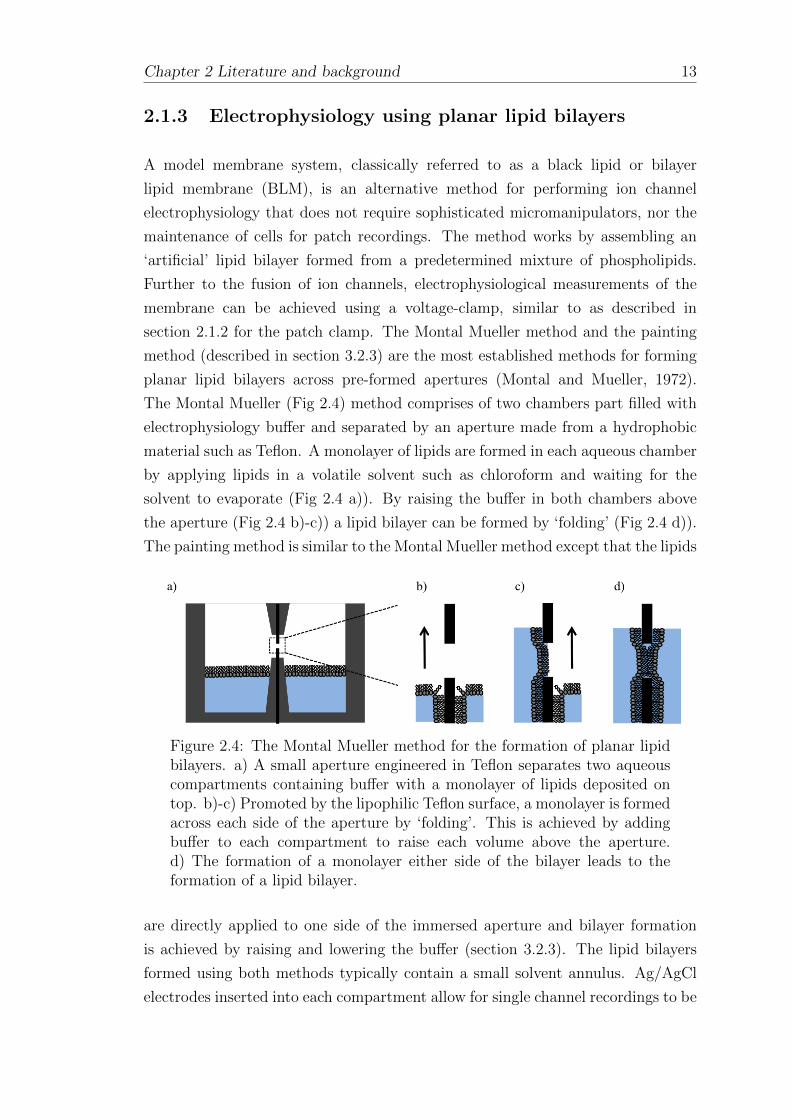
2.1.3 Electrophysiology using planar lipid bilayers
A model membrane system, classically referred to as a black lipid or bilayer
lipid membrane (BLM), is an alternative method for performing ion channel
electrophysiology that does not require sophisticated micromanipulators, nor the
maintenance of cells for patch recordings. The method works by assembling an
‘artificial’ lipid bilayer formed from a predetermined mixture of phospholipids.
Further to the fusion of ion channels, electrophysiological measurements of the
membrane can be achieved using a voltage-clamp, similar to as described in
section 2.1.2 for the patch clamp. The Montal Mueller method and the painting
method (described in section 3.2.3) are the most established methods for forming
planar lipid bilayers across pre-formed apertures (Montal and Mueller, 1972).
The Montal Mueller (Fig 2.4) method comprises of two chambers part filled with
electrophysiology buffer and separated by an aperture made from a hydrophobic
material such as Teflon. A monolayer of lipids are formed in each aqueous chamber
by applying lipids in a volatile solvent such as chloroform and waiting for the
solvent to evaporate (Fig 2.4 a)). By raising the buffer in both chambers above
the aperture (Fig 2.4 b)-c)) a lipid bilayer can be formed by ‘folding’ (Fig 2.4 d)).
The painting method is similar to the Montal Mueller method except that the lipids
Figure 2.4: The Montal Mueller method for the formation of planar lipidbilayers. a) A small aperture engineered in Teflon separates two aqueouscompartments containing buffer with a monolayer of lipids deposited ontop. b)-c) Promoted by the lipophilic Teflon surface, a monolayer is formedacross each side of the aperture by ‘folding’. This is achieved by addingbuffer to each compartment to raise each volume above the aperture.d) The formation of a monolayer either side of the bilayer leads to theformation of a lipid bilayer.
are directly applied to one side of the immersed aperture and bilayer formation
is achieved by raising and lowering the buffer (section 3.2.3). The lipid bilayers
formed using both methods typically contain a small solvent annulus. Ag/AgCl
electrodes inserted into each compartment allow for single channel recordings to be
14 Chapter 2 Literature and background
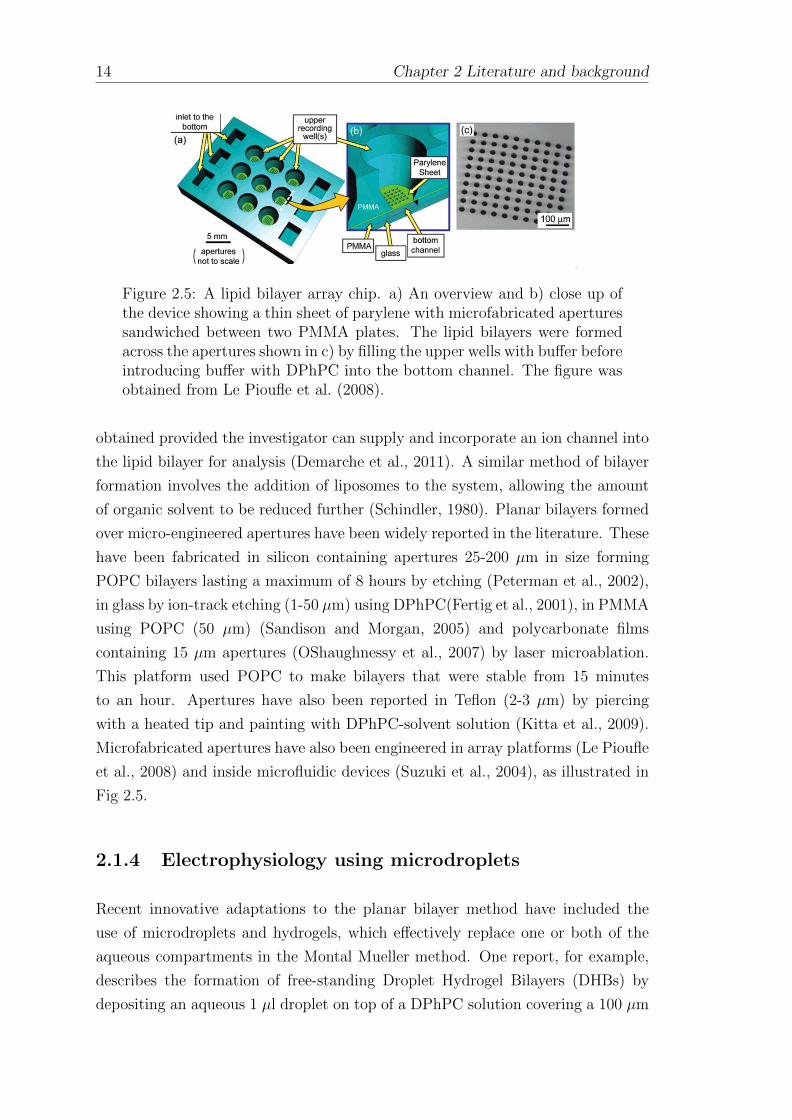
Figure 2.5: A lipid bilayer array chip. a) An overview and b) close up ofthe device showing a thin sheet of parylene with microfabricated aperturessandwiched between two PMMA plates. The lipid bilayers were formedacross the apertures shown in c) by filling the upper wells with buffer beforeintroducing buffer with DPhPC into the bottom channel. The figure wasobtained from Le Pioufle et al. (2008).
obtained provided the investigator can supply and incorporate an ion channel into
the lipid bilayer for analysis (Demarche et al., 2011). A similar method of bilayer
formation involves the addition of liposomes to the system, allowing the amount
of organic solvent to be reduced further (Schindler, 1980). Planar bilayers formed
over micro-engineered apertures have been widely reported in the literature. These
have been fabricated in silicon containing apertures 25-200 µm in size forming
POPC bilayers lasting a maximum of 8 hours by etching (Peterman et al., 2002),
in glass by ion-track etching (1-50 µm) using DPhPC(Fertig et al., 2001), in PMMA
using POPC (50 µm) (Sandison and Morgan, 2005) and polycarbonate films
containing 15 µm apertures (OShaughnessy et al., 2007) by laser microablation.
This platform used POPC to make bilayers that were stable from 15 minutes
to an hour. Apertures have also been reported in Teflon (2-3 µm) by piercing
with a heated tip and painting with DPhPC-solvent solution (Kitta et al., 2009).
Microfabricated apertures have also been engineered in array platforms (Le Pioufle
et al., 2008) and inside microfluidic devices (Suzuki et al., 2004), as illustrated in
Fig 2.5.
2.1.4 Electrophysiology using microdroplets
Recent innovative adaptations to the planar bilayer method have included the
use of microdroplets and hydrogels, which effectively replace one or both of the
aqueous compartments in the Montal Mueller method. One report, for example,
describes the formation of free-standing Droplet Hydrogel Bilayers (DHBs) by
depositing an aqueous 1 µl droplet on top of a DPhPC solution covering a 100 µm

Chapter 2 Literature and background 15
aperture pressed onto a hydrogel. Single-channel recordings of the BK-channel,
the ryanodine receptor channel and the nicotinic receptor channel were reported
using this technique (Ide and Ichikawa, 2005). In an adapted method reported
by the Wallace group at Oxford, DHBs were formed without an aperture where
an aqueous droplet was placed on top of a hydrogel immersed in a DPhPC-
decane solution (Thompson et al., 2007). The same group also reported the
direct detection of membrane channels from gels by rolling 200 pl droplets over
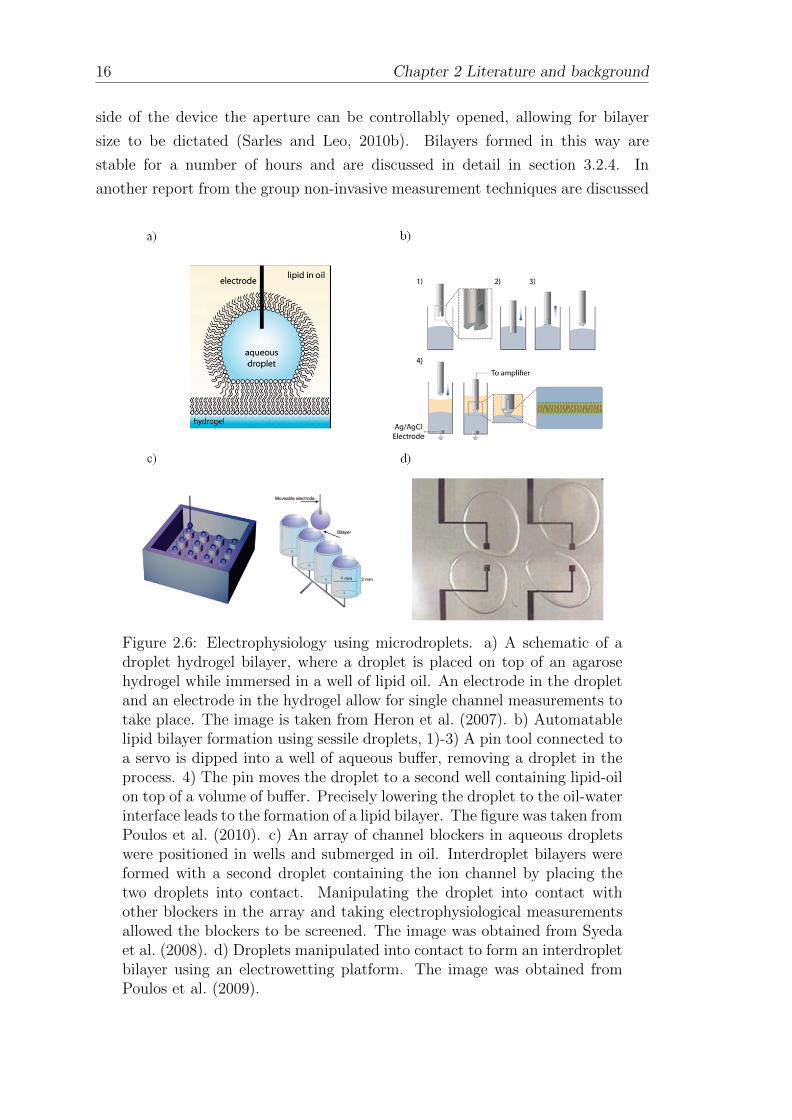
the gel in oil using a micromanipulator (Heron et al., 2007), a schematic for
the platform is shown in Fig 2.6. DHBs formed this way were reported to be
stable for weeks. The Schmidt group from the University of California have also
reported a novel method of lipid bilayer formation using sessile droplets controlled
by automated liquid-handling robotics (Fig 2.6 b). Bilayer formation is achieved
using a customised Ag/AgCl pin which collects droplets from sample wells and
delivers them to measurement wells containing an organic phase on top of an
aqueous phase. As the droplet is immersed in the oil a monolayer of lipid is
formed around its surface from DPhPC vesicles accumulating at the surface, when
the droplet meets the monolayer of lipid separating the organic and aqueous phase
a lipid bilayer is formed. To allow for electrical recordings each well on a 384 well
plate was modified to contain a 200 µm Ag/AgCl electrode (Poulos et al., 2010).
The setup has been shown to run unattended for up to 27 hours. The concept
of forming bilayers using droplet interfaces immersed in lipid-oil has already been
introduced in section 1.3. Forming bilayers this way is popular since the method is
highly amenable to miniaturisation and high-throughput applications. The latter
has been demonstrated in principle by Holden et al. through the construction
of bionetworks from nanoliter water droplets (Holden et al., 2007; Hwang et al.,
2008). A platform capable of high-throughput electrophysiological screening for
blockers of the potassium channel Kcv was later reported by Syeda et al. (2008).
whereby the protein was also produced using CF expression (Syeda et al., 2008).
High-throughput screening was achieved by moving the droplet expressing Kcv
into contact with different droplets each containing different blockers (Fig 2.6
c)). In another approach, the Leo group at Virginia Tech report the physical
encapsulation of interdroplet bilayers using a PMMA device containing adjacent
wells fixing the position of droplets in oil (discussed in detail in section 3.2.4). This
was demonstrated with 2 and more droplets forming portable and durable DIB
networks (Sarles and Leo, 2010a). A simplified PDMS platform was documented
by the same group where the novel feature, reported as the regulated attachment
method, allows for the lipid bilayer (DPhPC) to be controllably reconstituted
using a deformable flexible aperture. By applying a controlled pressure to either
16 Chapter 2 Literature and background
side of the device the aperture can be controllably opened, allowing for bilayer
size to be dictated (Sarles and Leo, 2010b). Bilayers formed in this way are
stable for a number of hours and are discussed in detail in section 3.2.4. In
another report from the group non-invasive measurement techniques are discussed
Figure 2.6: Electrophysiology using microdroplets. a) A schematic of adroplet hydrogel bilayer, where a droplet is placed on top of an agarosehydrogel while immersed in a well of lipid oil. An electrode in the dropletand an electrode in the hydrogel allow for single channel measurements totake place. The image is taken from Heron et al. (2007). b) Automatablelipid bilayer formation using sessile droplets, 1)-3) A pin tool connected toa servo is dipped into a well of aqueous buffer, removing a droplet in theprocess. 4) The pin moves the droplet to a second well containing lipid-oilon top of a volume of buffer. Precisely lowering the droplet to the oil-waterinterface leads to the formation of a lipid bilayer. The figure was taken fromPoulos et al. (2010). c) An array of channel blockers in aqueous dropletswere positioned in wells and submerged in oil. Interdroplet bilayers wereformed with a second droplet containing the ion channel by placing thetwo droplets into contact. Manipulating the droplet into contact withother blockers in the array and taking electrophysiological measurementsallowed the blockers to be screened. The image was obtained from Syedaet al. (2008). d) Droplets manipulated into contact to form an interdropletbilayer using an electrowetting platform. The image was obtained fromPoulos et al. (2009).
Chapter 2 Literature and background 17
for performing electrophysiology on interdroplet bilayers. Here it was shown that
electrophysiological measurements could take place using a single droplet pierced
with an Ag/AgCl electrode and an adjacent agar coated electrode (Creasy and Leo,
2010). Manipulating droplets into contact using electrokinetics is an alternative
method for forming interdroplet bilayers (shown in section 3.2.5.3). This has been
demonstrated by Aghdaei et al. (2008) by moving 2 µl droplets into contact within
an asolectin n-decane solution using DEP at 12 V with a 2 kHz sinusoidal wave.
Bilayers formed this way were stable for ∼20 hours (Aghdaei et al., 2008). The
novelty of this work is both the fabricated electrokinetic chip and the subsequent
control of droplet motion without the need for manual dragging.
Electrokinetics has also been used to modulate the size of interdroplet bilayers by
altering the contact angle between droplets using electrowetting (Punnamaraju
and Steckl, 2011). In this example, a hydrophobic layer of the fluoropolymer
Fluoropel was deposited on an Al2O3 dielectric layer on top of an ITO coated glass
substrate and droplets pierced with an electrode were immersed in oil containing
POPC/DPhPC. A similar device has also been reported by Poulos and co-workers
(Poulos et al., 2009) except integrated Ag/AgCl electrodes were incorporated into
the device (Fig 2.6 d)). Interdroplet bilayers, also referred to as Droplet Interface
Bilayers (DIBs), have been reviewed by Bayley (Bayley et al., 2008).
2.1.5 Controlled delivery of proteins to lipid bilayers
Initially described by Woodbury (Woodbury and Miller, 1990; Woodbury, 1999)
using Cl− channels from Torpedo californica and later refined by De Planque et
al. using β-amyloid peptide (de Planque et al., 2006), the controlled delivery of
ion channels to lipid bilayers can be achieved by functionalising reconstituted
proteoliposomes (section 2.2.5 with nystatin A1 trihydrate (antifungal) and
ergosterol (a sterol component of yeast and fungal cell membranes). The two
together form a small conductive pore which allows for fusion events to be
observed when performing electrophysiology with an ergosterol deficient bilayer.
Nystatin-ergosterol vesicles carrying the protein of interest are introduced to a
lipid bilayer where the nystatin-ergosterol complex is introduced in its active
form. The complex almost immediately disassociates as the ergosterol diffuses
along the membrane and the conduction decays. If performed successfully, this
method should indicate vesicle fusion by a short current spike and leave the ion
channel of interest in the lipid bilayer ready to be studied. The technique has
also been demonstrated to deliver the bacterial K+ channel KcsA on-chip from
18 Chapter 2 Literature and background
falling droplets (Zagnoni et al., 2009) and the bacterial Na+ channel NaChBac
into planar bilayers (Studer et al., 2011).
2.2 Ion channel expression for electrophysiolog-
ical measurements
2.2.1 The expression of ion channels in vivo
Acquiring ion channels for electrical measurements may be achieved by isolation
from native membranes, overexpression in cell lines or by CF protein expression.
While high numbers of nicotinic acetylcholine receptors of the electric organ of
Torpedo Californica can be found natively in in the plasma membrane (Kistler and
Stroud, 1981), this is extremely uncommon. Overexpression is instead required for
ion channels that are natively present in low numbers at the cell surface. This can
be achieved using a variety of prokaryotic or eukaryotic hosts (Junge et al., 2008),
where features of the expressed proteins such as their toxic effect on the cell and
requirements for posttranslational modifications are deciding factors.
In general, a plasmid vector containing the DNA encoding the protein of interest
is introduced into a host cell by transformation. The cells are grown in a nutrient
broth containing one, or a mixture of antibiotics specific to the vector used such
that all cells that do not contain the vector are rendered unviable. The cells are
grown to a specific point before overexpression is triggered, usually through the
addition of IPTG. The cells are later separated from the medium by centrifugation,
sonicated in PBS to homogenise and spun again at high speed to pellet the
membranes. At this stage a solubilisation buffer containing detergents is typically
added before the protein is purified.
2.2.2 Ion channel purification
A C- or N- terminal amino acid tag included in the overexpressed protein to
allow it to be specifically isolated from the thousands of proteins present in the
cell lysate. This is commonly achieved using agarose beads functionalised with
a Ni-nitrilotriacetic acid (NTA) resin that is specific for the amino acid tag.
Typically, the beads are washed and incubated with the cell-lysate overnight in a
cold room before the suspension is loaded onto a column. The column is normally

Chapter 2 Literature and background 19
washed several times before the beads are eluted in 50 - 250 mM concentrations
of imidazole in PBS and titrated to pH 7.4. At this stage the presence of the
protein of interest may be inferred by running an SDS PAGE gel and confirmed
by performing a Western Blot.
2.2.3 Sodium dodecyl sulphate polyacrylamide gel elec-
trophoresis (SDS PAGE)
SDS PAGE is a frequently used method for separating proteins by size (Laemmli,
1970). The technique essentially involves the use of the detergent SDS to impart
a negative charge onto denatured proteins, which are subsequently loaded onto a
polyacrylamide gel immersed in buffer. A potential applied across the gel induces
the migration of proteins down the gel by electrophoresis. The polyacrylamide
matrix causes larger proteins to migrate down the gel slower than small proteins,
leading to protein separation. The proteins are later visualised by staining, which
is commonly achieved using Coomassie Brilliant Blue. The stain binds to the
proteins present on the gel, revealing a series of bands after the excess stain is
removed by destaining. The gel is later imaged for analysis, where the molecular
weight of the proteins present on the gel can be estimated by comparing them to
a known standard that is usually run on an adjacent lane. An overview of the
method is shown in Fig 2.7.
2.2.4 Western blotting
Western blotting is a technique that allows for specific proteins to be identified
using the amino acid affinity tag described in section 2.2.2. The method works by
running a SDS PAGE gel of the sample before a Western transfer is performed to
remove proteins from the gel onto a piece of nitrocellulose paper. The paper is
subsequently blocked in BSA to prevent non-specific binding before an antibody
containing specificity for the amino acid affinity tag is introduced. The antibody
is subsequently probed with a second antibody that is specific for the first, but
also contains a detectable signal, either an infra-red dye for detection by infra-red
or horseradish peroxidase for detection using chemiluminescence. The observed
signal allows the presence of the expressed ion channel to be verified.

20 Chapter 2 Literature and background
Figure 2.7: The SDS PAGE method for protein separation. a) A mixtureof denatured protein, mixed with SDS is loaded onto a polyacrylamide gelimmersed in electrolyte buffer. The SDS imparts a negative charge on thedenatured proteins, causing them to move uniformly down the gel uponthe application of a potential. b) The porous polyacrylamide gel causeslarge proteins to remain at the top of the gel while smaller proteins run tothe bottom. The gel is subsequently stained and imaged for analysis. Thefigure was obtained from Hardin et al. (2011).
2.2.5 Protein reconstitution
Once SDS PAGE and/or Western blotting confirm the presence of the channel,
the final step in the process prior to obtaining electrophysiological measurements
is to reconstite the protein into liposomes for fusion with the bilayer (Demarche
et al., 2011). This is possible using dialysis, where the dilution of detergent to
values below the critical micelle concentration results in the disintegration of
micelles into detergent monomers that can be easily removed (Seddon et al.,
2004). An alternative method for detergent removal is hydrophobic absorption
using Biobeads SM-2. These polystyrene beads are 750 µm in size with pores of
90 A. Detergent removal is achieved through the interaction of the hydrophobic
detergent tail with the hydrophobic surface of the bead (Seddon et al., 2004).
These processes performed in the presence of lipids facilitates the conversion of
micelles into proteoliposomes by gradually exchanging detergent for lipid. During
this transition, detergent removal initially causes the transformation of small
micelles into larger micelles before becoming bent to form curved mixed micelles.
Further detergent removal leads to the formation of detergent-saturated vesicles
which extend in size through fusion and lipid exchange mechanisms culminating
in the formation of unilamellar liposomes typically 200 nm in diameter (Rigaud
et al., 1998). The size of the liposomes can be tuned by extrusion, or reduced less
Chapter 2 Literature and background 21
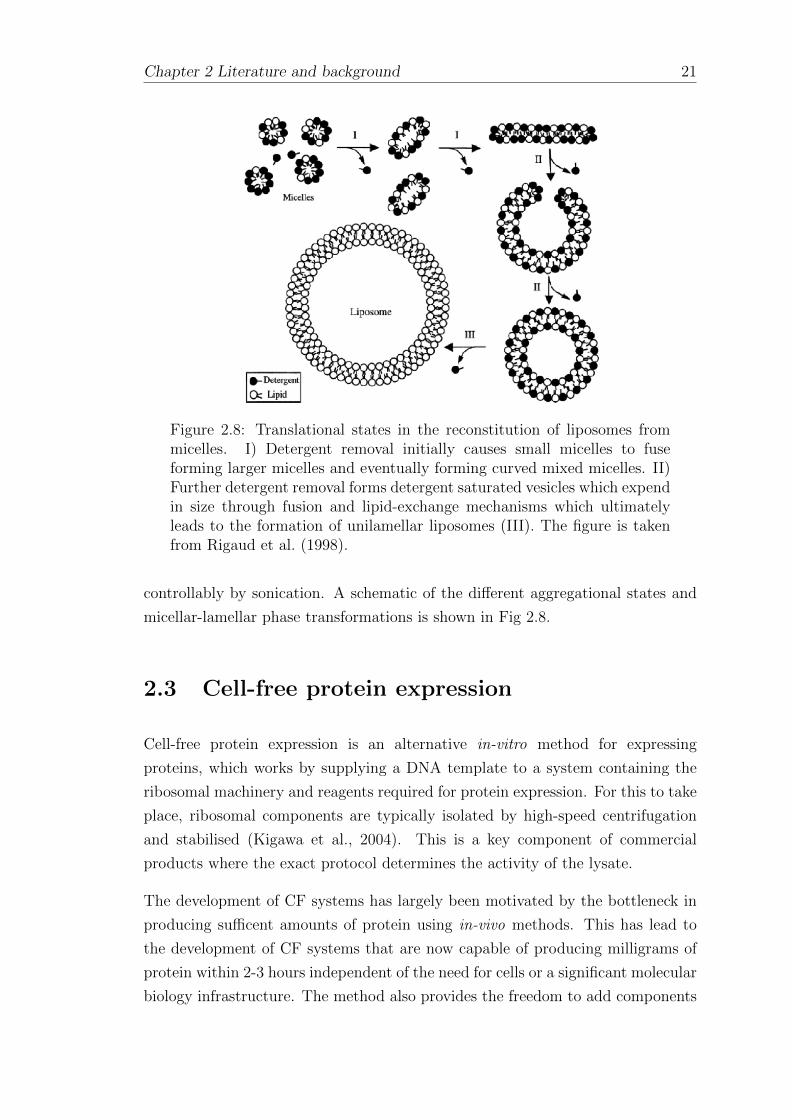
Figure 2.8: Translational states in the reconstitution of liposomes frommicelles. I) Detergent removal initially causes small micelles to fuseforming larger micelles and eventually forming curved mixed micelles. II)Further detergent removal forms detergent saturated vesicles which expendin size through fusion and lipid-exchange mechanisms which ultimatelyleads to the formation of unilamellar liposomes (III). The figure is takenfrom Rigaud et al. (1998).
controllably by sonication. A schematic of the different aggregational states and
micellar-lamellar phase transformations is shown in Fig 2.8.
2.3 Cell-free protein expression
Cell-free protein expression is an alternative in-vitro method for expressing
proteins, which works by supplying a DNA template to a system containing the
ribosomal machinery and reagents required for protein expression. For this to take
place, ribosomal components are typically isolated by high-speed centrifugation
and stabilised (Kigawa et al., 2004). This is a key component of commercial
products where the exact protocol determines the activity of the lysate.
The development of CF systems has largely been motivated by the bottleneck in
producing sufficent amounts of protein using in-vivo methods. This has lead to
the development of CF systems that are now capable of producing milligrams of
protein within 2-3 hours independent of the need for cells or a significant molecular
biology infrastructure. The method also provides the freedom to add components

22 Chapter 2 Literature and background
such as isotopic labels, detergents or lipids to the reaction mixture at any time,
where the labels are useful for NMR structure studies, while the surfactants can
stabilise the CF expression of membrane proteins (Schwarz et al., 2008).
CF protein expression has been known since the 1950s when several independent
laboratories reported the continuation of protein synthesis in disrupted animal
cells and cell extracts (Spirin and Swartz, 2008). This was later demonstrated
with disrupted bacterial cells and led to the identification of the ribonucleoprotein
fraction, the ribosome, being the core protein-synthesising component of a cell
(Roberts, 1958). This discovery led to the assembly of the first cell-free (CF)
protein expression systems consisting of cell extract, amino acids, ATP and GTP
(Lamborg and Zamecnik, 1960; McQuillen et al., 1959; Schweet et al., 1958;
Tissieres et al., 1960). These early systems allowed for the mechanisms for
protein expression to be studied, but were only capable of translating endogenous
mRNA. This was overcome in 1961 by Nirenberg and Matthaei who were able to
remove endogenous mRNA without any damage to the ribosomal extract, allowing
for the expression of exogenous mRNA (Matthaei and Nirenberg, 1961). This
accomplishment led to the deciphering of the genetic code, an achievement for
which Nirenberg was awarded the Nobel Prize in Physiology or Medicine in 1968.
The capability of CF systems to express proteins based on a DNA template
was also demonstrated in this period through the development of bacterial CF
systems containing endogenous RNA polymerases. Such systems were termed
coupled transcription-translation systems as the rates of both mechanisms were
coupled since elongating mRNA is simultaneously translated by ribosomes using
this method (Matthaei and Nirenberg, 1961; Byrne et al., 1964; DeVries and
Zubay, 1967; Lederman and Zubay, 1967). This was much more recently achieved
in eukaryotic systems by the introduction of exogenous RNA polymerases such
as T7 and SP6 isolated from bacteriophages. Although in this case the rate of
transcription greatly exceeds the rate of translation, as such these systems were
coined combined transcription-translation systems (Baranov and Spirin, 1993;
Craig et al., 1992). These first generation CF systems were functional but limited
by low yields due to their short periods of activity spanning less than 1 hour. This
inhibition was due to the accumulation of waste products and the rapid depletion
of the high-energy nucleotide triphosphate (NTP) pool by NTPases and NTP
dependent-metabolic reactions (aminoacylation and ribosome function) (Spirin
and Swartz, 2008).
Chapter 2 Literature and background 23
To increase the lifetime of the system, a solution proposed by Spirin and co-workers
was to alter the mechanics of the CF reaction, moving away from containing the
reaction mix in a fixed test tube volume (or batch format) and introducing the
continuous-flow cell-free (CFCF) translation system (Spirin, 2004). This system
relied on the continuous supply of materials and metabolic energy into the reaction
vessel and the continuous removal of reaction by-products (inorganic phosphates,
nucleoside monophosphates and polypeptide products) from the reaction mix. The
latter was achieved using a porous (ultrafiltration or dialysis) membrane to retain
the high molecular weight protein synthesising components while being permeable
to the low molecular weight waste products. It is documented that this technique
extends the reaction time by 20 hours and increases the product yield by two
orders of magnitude. However, the operational complexities of the CFCF method
made it impractical and motivated the development of the semi-continuous or
continuous exchange cell-free (CECF) method. Instead of using active pumping,
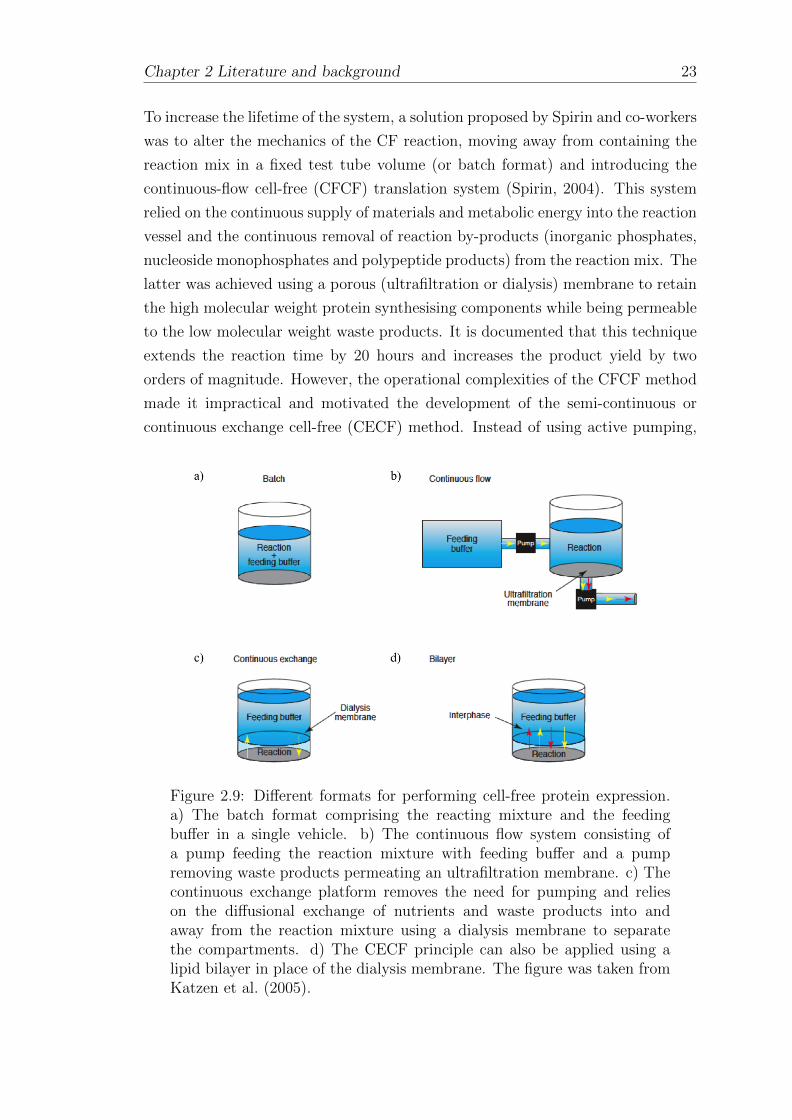
Figure 2.9: Different formats for performing cell-free protein expression.a) The batch format comprising the reacting mixture and the feedingbuffer in a single vehicle. b) The continuous flow system consisting ofa pump feeding the reaction mixture with feeding buffer and a pumpremoving waste products permeating an ultrafiltration membrane. c) Thecontinuous exchange platform removes the need for pumping and relieson the diffusional exchange of nutrients and waste products into andaway from the reaction mixture using a dialysis membrane to separatethe compartments. d) The CECF principle can also be applied using alipid bilayer in place of the dialysis membrane. The figure was taken fromKatzen et al. (2005).
24 Chapter 2 Literature and background
the CECF method exploits the passive (diffusional) exchange of CF substrates
and low molecular weight products across a porous barrier separating the reaction
mixture and the feeding buffer, extending the reaction lifetime of the system
(Chekulayeva et al., 2001) and rendering it more applicable to miniaturised and
automated high-throughput applications (Spirin, 2004). In addition to various
types of dialysis membrane, the CECF principle has also been demonstrated using
Sephadex granules, gel capsules and phase boundaries to separate the CF reaction
mix and the feeding solution (Spirin and Swartz, 2008; Noireaux et al., 2005).
2.3.1 State of the art in CF protein expression
Founded on first generation systems there are now a variety of commercially
available coupled and combined CF protein expression systems based on bacterial
and eukaryotic extracts including E.coli, Insect, Wheat Germ and Rabbit
Reticulate Lysate. In addition there also exists the selectively constructed PURE
(Protein synthesis Using Recombinant Elements) system, a minimal reconstitution
comprising of only 32 purified factors isolated from E.coli (Schwarz et al., 2008).
The challenge is therefore not to produce CF expression systems but instead to
use them effectively and sustainably on miniature platforms to produce correctly
folded proteins of interest; a task which is no small feat for synthesising membrane
proteins which require assistance to achieve their correctly folded conformations.
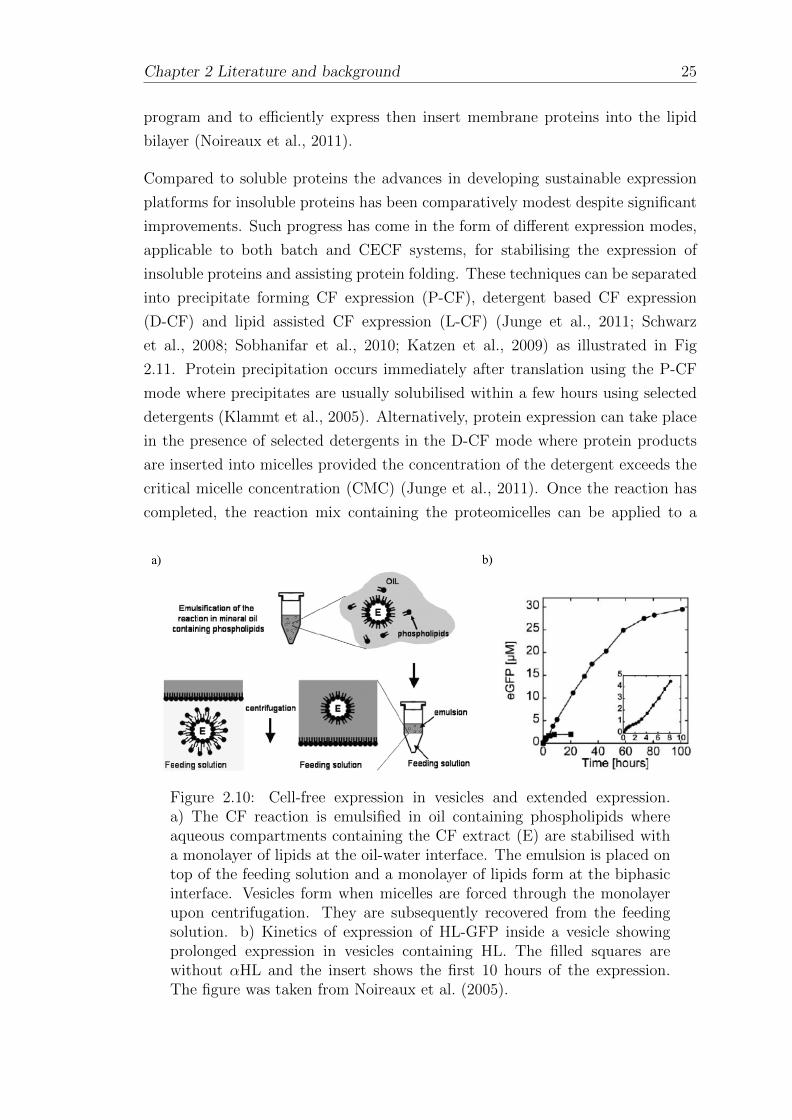
Achieving the sustainable synthesis of soluble proteins has been well documented
by the Noireaux group who have demonstrated the CF expression of green
fluorescent protein (GFP) inside lecithin vesicles (1-50 µm in diameter) and
the prolonged expression of the same product using vesicles supplied with the
DNA for the expression of the bacterial toxin alpha haemolysin (αHL). This was
accomplished using vesicles immersed inside an aqueous feeding solution (Fig 2.10
a)), where it was shown that the addition of αHL pores to the vesicles extended
the longevity of expression from 20 to 100 hours (Fig 2.10 b)). This improvement
was a result of the enhanced permeability of the vesicles to low molecular weight
consumables due to αHL insertion (Noireaux and Libchaber, 2004; Noireaux et al.,
2005). The progress made by the Noireaux group is part of a larger objective
to construct an artificial cell based on gene expression inside vesicles. Working
toward this goal the group have published several functionalities of CF systems
including specific protein degradation, the development of an active membrane
and the expression of a three gene genetic circuit behaving as a switch (Noireaux
et al., 2005). The next challenges are to achieve vesicle division, develop a DNA
Chapter 2 Literature and background 25
program and to efficiently express then insert membrane proteins into the lipid
bilayer (Noireaux et al., 2011).
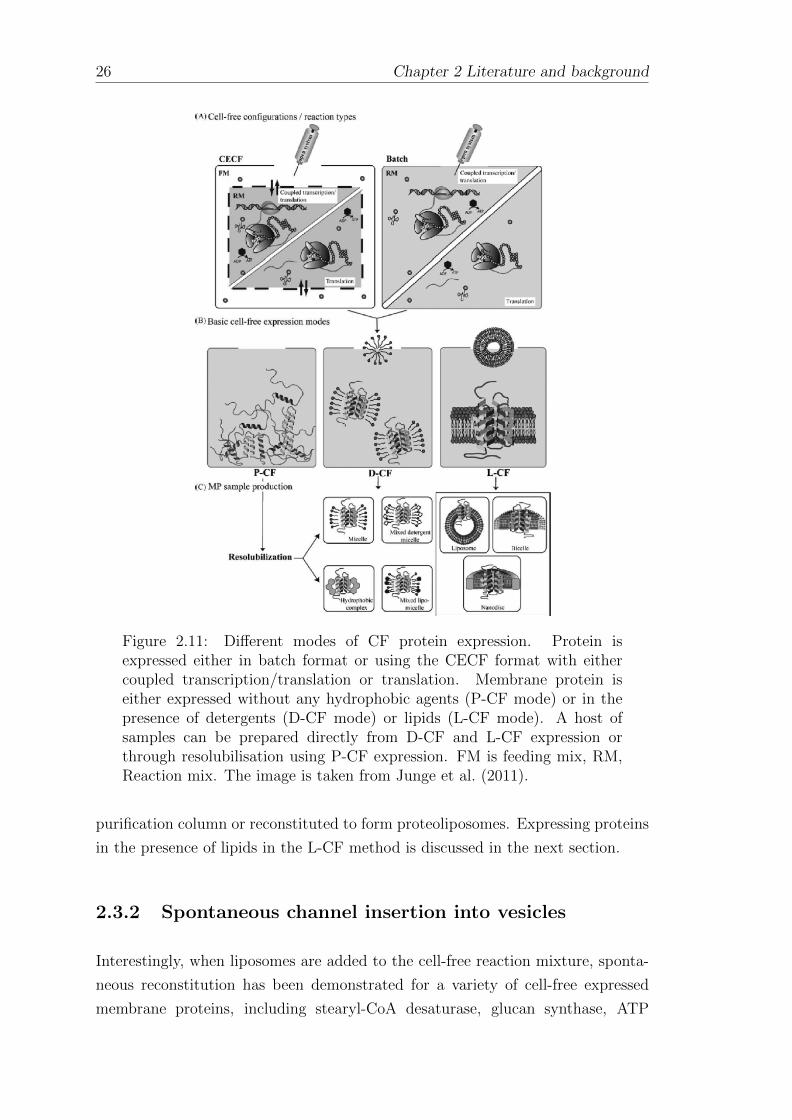
Compared to soluble proteins the advances in developing sustainable expression
platforms for insoluble proteins has been comparatively modest despite significant
improvements. Such progress has come in the form of different expression modes,
applicable to both batch and CECF systems, for stabilising the expression of
insoluble proteins and assisting protein folding. These techniques can be separated
into precipitate forming CF expression (P-CF), detergent based CF expression
(D-CF) and lipid assisted CF expression (L-CF) (Junge et al., 2011; Schwarz
et al., 2008; Sobhanifar et al., 2010; Katzen et al., 2009) as illustrated in Fig
2.11. Protein precipitation occurs immediately after translation using the P-CF
mode where precipitates are usually solubilised within a few hours using selected
detergents (Klammt et al., 2005). Alternatively, protein expression can take place
in the presence of selected detergents in the D-CF mode where protein products
are inserted into micelles provided the concentration of the detergent exceeds the
critical micelle concentration (CMC) (Junge et al., 2011). Once the reaction has
completed, the reaction mix containing the proteomicelles can be applied to a
Figure 2.10: Cell-free expression in vesicles and extended expression.a) The CF reaction is emulsified in oil containing phospholipids whereaqueous compartments containing the CF extract (E) are stabilised witha monolayer of lipids at the oil-water interface. The emulsion is placed ontop of the feeding solution and a monolayer of lipids form at the biphasicinterface. Vesicles form when micelles are forced through the monolayerupon centrifugation. They are subsequently recovered from the feedingsolution. b) Kinetics of expression of HL-GFP inside a vesicle showingprolonged expression in vesicles containing HL. The filled squares arewithout αHL and the insert shows the first 10 hours of the expression.The figure was taken from Noireaux et al. (2005).
26 Chapter 2 Literature and background
Figure 2.11: Different modes of CF protein expression. Protein isexpressed either in batch format or using the CECF format with eithercoupled transcription/translation or translation. Membrane protein iseither expressed without any hydrophobic agents (P-CF mode) or in thepresence of detergents (D-CF mode) or lipids (L-CF mode). A host ofsamples can be prepared directly from D-CF and L-CF expression orthrough resolubilisation using P-CF expression. FM is feeding mix, RM,Reaction mix. The image is taken from Junge et al. (2011).
purification column or reconstituted to form proteoliposomes. Expressing proteins
in the presence of lipids in the L-CF method is discussed in the next section.
2.3.2 Spontaneous channel insertion into vesicles
Interestingly, when liposomes are added to the cell-free reaction mixture, sponta-
neous reconstitution has been demonstrated for a variety of cell-free expressed
membrane proteins, including stearyl-CoA desaturase, glucan synthase, ATP
Chapter 2 Literature and background 27
synthase, DesK thermosensor, endothelin receptors A and B, bacteriorhodopsin,
connexin-43, aquaporin Z, and the ion channels Kcv and KcsA (Goren et al., 2009;
Periasamy et al., 2013; Matthies et al., 2011; Martın et al., 2009; Proverbio et al.,
2013; Kalmbach et al., 2007; Moritani et al., 2010; Hovijitra et al., 2009; Syeda
et al., 2008; van Dalen et al., 2002). Given that incorporation of protein into the
liposome cannot be facilitated by translocon components as these are not present in
the lysate, it has been speculated in the absence of a comprehensive study that the
presence of detergents, trace amounts of native lipids, or a close ribosome-liposome
proximity aid protein insertion in the lipid bilayer of the liposomes (Katzen et al.,
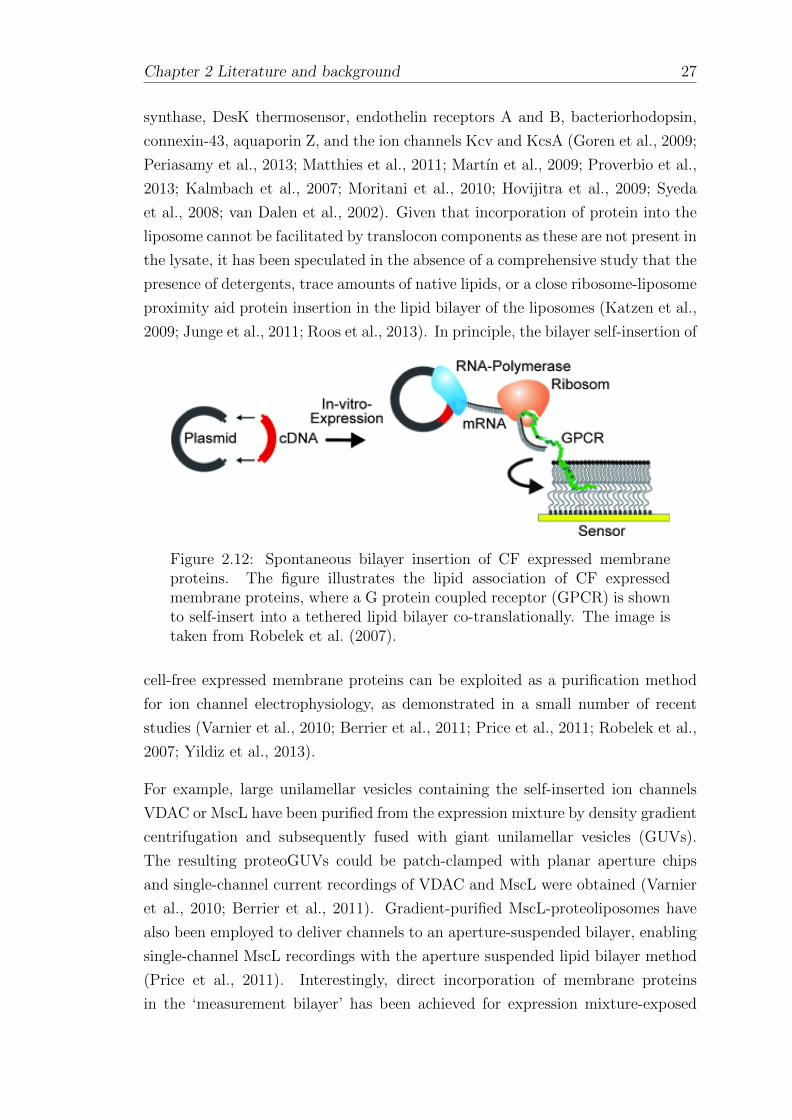
2009; Junge et al., 2011; Roos et al., 2013). In principle, the bilayer self-insertion of
Figure 2.12: Spontaneous bilayer insertion of CF expressed membraneproteins. The figure illustrates the lipid association of CF expressedmembrane proteins, where a G protein coupled receptor (GPCR) is shownto self-insert into a tethered lipid bilayer co-translationally. The image istaken from Robelek et al. (2007).
cell-free expressed membrane proteins can be exploited as a purification method
for ion channel electrophysiology, as demonstrated in a small number of recent
studies (Varnier et al., 2010; Berrier et al., 2011; Price et al., 2011; Robelek et al.,
2007; Yildiz et al., 2013).
For example, large unilamellar vesicles containing the self-inserted ion channels
VDAC or MscL have been purified from the expression mixture by density gradient
centrifugation and subsequently fused with giant unilamellar vesicles (GUVs).
The resulting proteoGUVs could be patch-clamped with planar aperture chips
and single-channel current recordings of VDAC and MscL were obtained (Varnier
et al., 2010; Berrier et al., 2011). Gradient-purified MscL-proteoliposomes have
also been employed to deliver channels to an aperture-suspended bilayer, enabling
single-channel MscL recordings with the aperture suspended lipid bilayer method
(Price et al., 2011). Interestingly, direct incorporation of membrane proteins
in the ‘measurement bilayer’ has been achieved for expression mixture-exposed

28 Chapter 2 Literature and background
solid-supported bilayers (Fig 2.12), specifically for the odorant receptor OR5 and
the transmembrane domain of the hERG potassium channel, enabling optical
characterisation of ligand binding without protein purification (Robelek et al.,
2007; Yildiz et al., 2013).
2.3.3 Cell-free protein expression in microsystems
CF expression of soluble proteins in microsystems has been largely achieved
in the form of microchambers or microwells arranged into an array, a format
of interest due to its overlap with protein microarray technology. CF protein
expression has been reported using sub-microlitre volumes on chips containing
nanowells (Angenendt et al., 2004) and in picolitre volumes within cylindrical
PDMS chambers 10 µm in diameter and 15 µm deep (Kinpara et al., 2004).
Here 250,000 PDMS chambers were made on a single, sealed device using a
patterned silicon wafer as a master. A PDMS-glass microreactor array device
with embedded temperature control has also been reported by the Fujii Group.
The platform (Fig 2.13) comprised of PDMS reactor chambers 125 nl in volume
bonded to the surface a patterned ITO glass substrate making the heaters and
temperature sensors (Yamamoto et al., 2002). The hybrid platform was recently
evaluated and demonstrated to express a variety of soluble proteins on-chip at 37◦C (Klammt et al., 2005). Albeit in larger 13 µl chambers milled into acrylic,
Figure 2.13: PDMS-glass microreactor array with embedded temperaturecontrol. The device is comprised of a 500 µm thick PDMS reactor chamberchip bonded to an ITO patterned, glass temperature control chip. Theelectrode width for the heaters was 100 µm and 60 µm for the temperaturesensors. The image was taken from Yamamoto et al. (2002).

Chapter 2 Literature and background 29
CF expression has also been demonstrated in an array format to detect toxins
through synthesis inhibition (Mei et al., 2005). Arrays have also been formed in
a single chamber by adsorbing proteins onto a functionalised surface. This has
been demonstrated using CF expression to form tagged proteins which adsorb to
a pretreated microtiter plate in situ forming an array (He and Taussig, 2001). The
method known as Protein in-situ Array (PISA) is discussed along with other CF
based array technologies in a recent review (He and Wang, 2007).
On-chip platforms capable of facilitating CECF expression have also been reported.
These include a PDMS microreactor consisting of two chambers separated by
dialysis membrane (Hahn et al., 2007), an array device containing nanoporous
membranes and microchannels (Mei et al., 2010), and a microchannel array
platform which supplies a small volume of feeding solution to a reaction mix using
passive pumping (Khnouf et al., 2009).
The expression of water-insoluble proteins such as membrane proteins has been
less frequently reported in microsystems. One publication from the Bayley group
at Oxford describes a method for expressing αHL or the small viral potassium
channel Kcv inside microdroplets in oil in the presence of an array of channel
blockers (Figs 2.6). It was shown that the water soluble αHL could be expressed
Figure 2.14: αHL expression in the presence of an interdroplet bilayer anda known channel blocker. DPhPC vesicles supplied to a droplet containingthe CF expression mixture, and a droplet containing the channel blockerresult in the formation of a monolayer around each droplet surface. Aninterdroplet bilayer is formed by positioning the droplets into contact usinga micromanipulator. The image shows composition of each droplet formingthe interdroplet bilayer, where one droplet contains the cell-free mixtureand the αHL DNA required, while the opposite droplet contains a channelblocker. The image was taken from Syeda et al. (2008).
30 Chapter 2 Literature and background
and inserted into the interdroplet bilayer directly from a droplet of the CF mixture
without the requirement for incubation (Fig 2.14). However, the same effect was
not observed for Kcv, where a lag time in the expression of the full-length protein
was found to exceed the lifetime of interdroplet bilayers formed in the presence of
the Promega E.coli T7 S30 CF system. The authors speculated that the presence
of PEG and lipid components in the Promega system may be responsible for this
instability, and reported that the bilayers were found to last for 0.7 hours on
average, compared to 8.7 hours using the PURE system. Yet protein expression
was not observed at room temperature for the PURE system, which instead
required incubating with the Kcv DNA template for 1 hour at 37 ◦C prior to
bilayer formation (Syeda et al., 2008). A separate report details the use of a CECF
microwell array platform to express both the proton pump bacteriorhodopsin and
the lipid binding ApoA lipoprotein (Khnouf et al., 2010).
2.4 Ion channels
The cell membrane is a dynamic environment that is host to a wide range of
membrane proteins responsible for several critical functions of the cell, including
the transportation of ions, small molecules and macromolecules between the cell
interior and exterior. Ion channels (Fig 2.15 a)) are integral membrane proteins
that form ion conducting pores which transverse the lipid bilayer to selectively
allow ions to pass from one side to the other by opening and closing (gating). Ion
channels differ vastly in their size, selectivity for ions (e.g. sodium, potassium,
and chloride), and the triggers that cause them to gate. Such triggers include
sensitivity to the transmembrane voltage, pH, or the presence of a ligand, causing
the channel to open and close by adjusting the conformational state of its subunits.
The subunits are individual membrane-spanning alpha helical proteins, which
assemble with other identical or homologous (structurally similar) proteins to form
a pore. In this context, voltage-gated potassium channels are multimeric proteins
consisting of four subunits, while voltage-gated sodium channels from eukaryotes
are one large (monomeric) protein comprised of four connected domains. In both
kinds of channel, each subunit or domain contains six transmembrane alpha helices,
referred to as S1-S6 (Fig 2.15 b)). Typically, S1-S4 form the voltage sensor which
is loosely linked to S5-S6, forming the central pore domain and the selectivity
filter (Bezanilla, 2005; Sigworth, 1994). The size of the central pore domain and
the way it interacts with ions gives rise to the selectivity of the channel. This is a
result of precisely positioned oxygen atoms in amino acids lining the centre of the

Chapter 2 Literature and background 31
Figure 2.15: The structure and function of ion channels. a) Ion channelsare integral membrane proteins that open and close depending on theconformational state of the channel subunits. b) The typical domainstructure of an individual subunit contains six transmembrane helices, S1-S6. S1-S4 form the voltage sensor while S5-S6 are responsible for the poredomain and selectivity filter. c) The pore structure of a channel showingPotassium ions losing their waters of hydration as they pass the channel.Only two of four subunits are shown. The image was obtained from Hardinet al. (2011).
channel that interact with ions as they move through the selectivity filter, allowing
them to give up their waters of hydration (Fig 2.15 c)). The level of precision of
the positioning of the oxygen atoms is such that slightly smaller sodium ions can
only interact with one of the oxygen atoms on one side of a potassium channel,
rendering it energetically unfavorable for the sodium ion to give up its waters of
hydration and enter the channel.
Voltage-gated ion channels play key roles in the generation of action potentials,
defined as momentary but sizable electrical depolarisation and repolarisation
events of the neural plasma membrane, caused by an influx of sodium ions and

32 Chapter 2 Literature and background
the subsequent efflux of potassium ions. This mechanism is responsible for cell-
cell communication in neurons, while in other cells such as muscle cells, the action
potential is the first step in a cascade of events leading to muscle contraction. Such
responsibility links defects in voltage-gated ion channels with human neurological
diseases. Individuals carrying mutations in certain potassium channels for example
suffer from a defect in muscle coordination known as ataxia, while one form of
epilepsy is caused by a mutation in one specific voltage-gated sodium channel.
Other conditions associated with faulty ion channels include muscular dystrophy,
cystic fibrosis, osteoporosis and malignant hyperthermia (George, 2005; Celesia,
2001). The connection with ion channels and disease make them interesting
targets for research, where small ion channels such as the KcsA from Streptomyces
lividans have been extensively studied to reveal some of its principle structural
and functional characteristics.
2.4.1 KcsA
The KcsA channel is the subject of many biophysical studies as it was the first
ion channel to have its structure solved to a resolution of 3.2 Angstroms by X-
ray crystallography (Doyle et al., 1998). This revealed that the channel forms a
tetramer with each subunit having two transmembrane helices and a cytoplasmic
domain that contains 35 amino acids at the C-terminus (Doyle et al., 1998; Cortes
et al., 2001). Interestingly, the negatively charged amino acids comprising the
cytoplasmic domain have recently been shown to be responsible for the pH sensing
capability of the KcsA channel (Hirano et al., 2011). Single channel measurements
of KcsA reveal that it is a proton-activated potassium channel (Cuello et al., 1998),
which shows permeability to potassium ions, rubidium ions, ammonium ions and
titanium ions, but is impermeable to sodium ion, lithium ions and cesium ions
(LeMasurier et al., 2001). KcsA is known to exhibit asymmetric characteristics,
where protons cause the channel to gate on the cytoplasmic side but not on the
extracellular side of the membrane (Heginbotham et al., 1999). The cytoplasmic
side of the channel is also susceptible to blockade by tetraethylammonium (TEA)
(Heginbotham et al., 1999), an effect that has been shown to have complex voltage
dependence (Kutluay et al., 2005). The single channel gating characteristics of
KcsA are the subject of intense debate. Original observations of the channel
reconstituted into proteoliposomes and fused into planar lipid bilayers revealed a
channel conductance of 42 pS, and a less frequently observed larger opening with a
conductance of 90 pS (Schrempf et al., 1995). The observation of dual conductance

Chapter 2 Literature and background 33
Figure 2.16: The KcsA channel. a) The KcsA channel in the open statewith one subunit removed for the purposes of clarity (Cuello et al., 2010).b) The current voltage relation for KcsA in symmetrical 100 mM KCl,showing slight outward rectification (LeMasurier et al., 2001). c) Bursts ofchannel activity with different open probabilities leading to three differentmodes of gating, the high Po mode, the flicker mode and the low Po mode(Chakrapani et al., 2007).
states was also reported using asolectin or DOPE: DOPS planar lipid bilayers by
Cuello, who identified a small conductance state of 70 pS and a more frequently
seen larger conductance state of 135 pS (Cuello et al., 1998). Here it was also noted
that the channel displayed considerable voltage dependence, with higher single-
channel activity at negative potentials. In symmetric 100 mM KCl, KcsA was
also shown to exhibit open-channel rectification by the observation of openings
with conductances of 56 pS and 31 pS at 200 mV and -200 mV respectively.
However it was noted that no low magnitude events were detected as reported
previously (Heginbotham et al., 1999). The same results were also reported by
LeMasurier, who observed the appearance of excess noise in channel openings
that was notably worse at negative potentials (LeMasurier et al., 2001). In a more
recent description of single channel KcsA currents, using the inside-out patch
clamp method with symmetrical conditions of 200 mM KCl, KcsA was reported
to have a single channel conductance of 70 pS at 100 mV (Chakrapani et al.,

34 Chapter 2 Literature and background
2007). In this work, the intraburst open probabilities of the gating events were
measured and three distinct populations reported, including a low Po mode, a
flicker mode and a high Po mode (Fig 2.16 c)). These different gating modes gave
rise to three distinctly different types of opening events, where the low Po mode
is characterised by few brief openings of a few milliseconds, the flicker mode is
depicted by rapid gating, while in the high Po mode the channel remains in the
open position with short closing and opening events (Chakrapani et al., 2007). It
was also found that the open probability of the channel increases ∼30-fold between
pH 5.5 and 3.0, which is the first quantitative measurement of the pH dependency
of the channel (Chakrapani et al., 2007).
2.4.2 KvAP
The first structure of a voltage-gated potassium channel, termed KvAP, from
the hyperthermophilic archeabacterium Aeropyrum pernix (Ruta et al., 2003) was
determined by crystallising the channel as a complex with a monoclonal Fab
fragment attached to its voltage sensors (Jiang et al., 2003). This revealed that
tetrameric KvAP contains a canonical pore (S5-S6) surrounded by voltage sensors,
comprising of four membrane spanning helical segments (Jiang et al., 2003). Here,
S3 consists of two helices referred to as S3a and S3b, where S3b forms a helix-turn-
helix with the N-terminal half of S4. This is called the voltage-sensor paddle and
resides on the outer perimeter of the channel (Jiang et al., 2003; Long et al., 2005,
2007). Single channel measurements of the full length KvAP channel in planar
lipid bilayers, composed of POPE: POPG with a symmectric KCl concentration
of 150 mM on both sides of the bilayer, revealed a single channel conductance of
170 pS when a voltage step was applied (Ruta et al., 2003). The channel was also
found to be strongly selective for potassium ions over sodium ions, thus exhibiting
functional properties similar to eukaryotic voltage-gated potassium channels. This
preservation of function reflects structural conservation in the voltage sensor as
revealed by specific, high affinity interactions with tarantula venom toxins (Ruta
et al., 2003). In a separate study, measurements were also obtained by patch
clamping giant DPhPC unilamellar vesicles containing KvAP. Under symmetric
conditions of 100 mM KCl, channel openings and closings were observed with a
conductance of 100 pS when the holding potential was suddenly raised to 100
mV (Aimon et al., 2011). It was also observed that the channels were highly
selective for potassium over sodium and had a tendency to open more with
increasing voltage (Aimon et al., 2011). KvAP gating has also been shown to

Chapter 2 Literature and background 35
Figure 2.17: The KvAP channel. a) The pore domain and a single voltagesensor in the open and closed state, viewed from the side (top) and fromthe top (bottom). S1 and S2 are grey, S3a is orange, S3b-S4 is red, theS4-S5 linker is green, S5 is purple, the P-helix is cyan and S6 is yellow(Schow et al. 2012). Single-channel measurements were obtained fromreconstituted protein in planar POPG: POPE bilayers in b)-c). b) Single-channel current of the KvAP channel as a function of voltage, c) Single-channel measurements at 100 mV. The voltage step used to trigger theopenings is shown at the top of the traces. The figures are taken fromSchow et al. (2012); Ruta et al. (2003).
depend on the properties of the lipid membrane (Schmidt et al., 2006; Schmidt
and MacKinnon, 2008), where the channel was shown to respond differently in
bilayers containing POPE:POPG compared to those formed of DPhPC (Schmidt
et al., 2009). Specifically it was observed that the channels activated at more
negative voltages in POPE:POPG bilayers and displayed a slower rate of recovery
from the inactivated state.
36 Chapter 2 Literature and background
2.4.3 Kv11.1 (hERG)
The human Ether-a-go-go Related Gene (hERG) 1 encodes the pore-forming
subunit of the Kv11.1 delayed rectifier potassium channel. The protein comprises
of 1,159 amino acids (Warmke and Ganetzky, 1994), forming 6 transmembrane
segments, S1-S6, with S1-S4 forming the voltage sensor domain and S5-S6 along
with the intervening pore loop contributing to the pore domain. Similar to KvAP,
the channel forms a tetramer with a pore domain from each of the four subunits
lining the ion conduction pathway. In addition to the membrane-spanning region,
the hERG proein contains large cytoplasmic NH2-terminal and COOH-terminal
domains, where the PAS domain of the former is a characterising feature of
the ether-a-go-go subfamily of voltage-gated potassium channels (Warmke and
Ganetzky, 1994) and the cyclic nucleotide binding domain (cNBD) of the latter
is homologous with hyperpolarisation activated channels. The hERG channel is
expressed in the heart, brain, smooth muscle, endocrine cells and a variety of
tumour cell lines in humans (Vandenberg et al., 2012). The medical relevance of
the channel arises since mutations in the gene are known to cause chromosome 7-
assisted long QT syndrome (Curran et al., 1995), a cardiac repolarisation disorder
that predisposes affected individuals to rapid irregular heartbeats that can lead
to fainting and sudden death. In addition, blockade of the channel by a wide
range of prescription medications can also cause drug-induced QT prolongation
with an increased risk of sudden cardiac arrest. This discovery has resulted
in the pharmaceutical industry performing cardiac safety screening for hERG
channel activity in the early stages of developing novel pharmaceutical compounds
(Sanguinetti and Tristani-Firouzi, 2006).
While the hERG channel is well-characterised for macroscopic currents, there
are few reports detailing single channel characterisation. The first single-
channel currents of the hERG channel were by Kiehn et al, achieved by
inserting hERG RNA into Xenopus oocytes and obtaining electrical measurements
using the standard two electrode patch clamp technique (Kiehn et al., 1996).
Channel activity was only apparent during repolarisation and the single channel
conductance was measured to be 7.0, 10.1 and 13.7 pS when the KCl concentrations
in the pipette were 50, 100 and 300 mM respectively (Kiehn et al., 1996). In
a separate study, using a similar method with 120 mM KCl in the pipette, a
1The hERG gene is the human homologue of the Ether-a-go-go gene found in Drosophila.The name a-go-go was coined in the 1960’s by William Kaplan, who observed that flies carryingmutations in this gene had shaky legs when anaesthetised with ether and likened the effect toa type of dancing popular at the time at the Whisky A-Go-Go nightclub in West Hollywood,California.

Chapter 2 Literature and background 37
Figure 2.18: The hERG channel. a) A diagram of a single hERG subunitcontaining six alpha helical transmembrane domains, S1-S6. Featureshighlighted include the S4 domain which contains multiple basic (+) aminoacids and the acidic Asp (-) residues in S1-S3, which can form salt bridgeswith specific basic residues in S4 during gating. The figure was takenfrom (Sanguinetti and Tristani-Firouzi, 2006). b) Single channel gatingunder the applied voltage step with different concentrations of potassiumin the patch pipette. c) The amplitude of the observed channel openingsplotted against the holding potential applied for each salt concentration.d) A plot of the channel conductance against the extracellular potassiumconcentration. Part a) was obtained from (Sanguinetti and Tristani-Firouzi, 2006)) and parts b)-c) were taken from Kiehn et al. (1996).
conductance of 12.1 pS was measured between test potentials of -50 and -110 mV.
It was also reported that the probability of channel openings was low at positive
test potentials (40 to 80mV) and the slope conductance was calculated to be 5.1

38 Chapter 2 Literature and background
pS (Zou et al., 1997). In addition, the authors also showed channel blocking by
MK-499, which they suggest occurs on the cytoplasmic side of the membrane (Zou
et al., 1997).
2.5 Summary
Ion channels are membrane proteins of interest for medical research and drug
discovery as outlined in section 1.3. This chapter begins by introducing the
conventional methods for obtaining ion channel measurements (outlined in section
1.3) before a comprehensive review of contemporary approaches is presented.
These include automated patch-clamp platforms, planar bilayer arrays and the use
of interdroplet bilayers for performing electrophysiology. These configurations are
of particular interest to this study for the purpose of developing a high-throughput
screening platform as explained in section 1.3. The chapter continues to explain all
of the steps involved in obtaining ion channel measurements from in-vivo expressed
protein, previously summarised in Fig 1.2. This clarifies the advantages of the CF
method, which is explained together with the current state-of-the-art in the field.
Here, the phenomenon of self-insertion of CF expressed membrane proteins into
lipid bilayers is reviewed in detail alongside a summary of the achievements made
in performing CF expression in microsystems. The chapter concludes by outlining
the general structure and function of ion channels, together with specific details
of some of the characteristics of the channels investigated as part of this study.
Such topics are important for developing a microdevice capable of the coupled
expression and characterisation of ion channels as explained in sections 1.1 and
1.3.
The structure of this chapter is replicated in Chapter 3 where the specific methods
used for expressing proteins and obtaining ion channel measurements are explained
in further detail.
Chapter 3
Methods and preliminary work
for cell-free expression and ion
channel measurements
This chapter is split into two parts, detailing all of the materials and methods
required to: 1) express a protein in-vitro using CF protein expression (as
outlined in section 2.3) and 2) to form lipid bilayers and to obtain single-channel
measurements using electrophysiology (as explained in section 2.1). The first
section begins with a brief overview of the processes used by project collaborators
to prepare the DNA templates used in this study, before the details concerning
the preparation of the CF expression are presented. A summary of the methods
used to verify the CF expressed protein is then provided. The section concludes
by showing some preliminary data to demonstrate that the expression system
functioned correctly. This is achieved by showing the CF expression of green
fluorescent protein (GFP), while also highlighting the problem of identifying CF
expressed proteins from the residual proteins present in the CF system. The second
section begins by describing the assembly of a conventional electrophysiology
system for aperture-suspended lipid bilayers. The section then continues to show
the fabrication and setup of a flexible PDMS substrate akin to a version previously
presented in the literature (section 2.1.4) that was shown to be capable of forming
and regulating the size of interdroplet bilayers (Sarles and Leo, 2010b). This
method was particularly interesting for the purpose of this study as control of
the bilayer area may be beneficial for stabilising interdroplet bilayers formed in
the presence of a CF system, a problem which has been introduced in section
1.1 and section 2.1.4. The third method involves the use of electrokinetic droplet
39

40 Chapter 3 Methods and preliminary work
manipulation to form droplet interface bilayers, as discussed in section 2.1.4. The
device used was previously developed in the Morgan group (Aghdaei et al., 2008)
and represents a basic unit of a digital microfluidic system that could be scaled
to form a high-throughput screening platform as introduced in 1.3. Lipid bilayers
have been formed in all three systems, with or without ion channel recordings using
KcsA proteoliposomes, and the advantages and disadvantages of each system are
discussed.
3.1 Methods for cell-free protein expression
This section outlines all of the materials and methods required to express proteins
using commercial CF expression systems.
3.1.1 Template preparation
Here, the preparation of the different DNA templates that were used in this study
are described. All DNA templates were prepared by collaborators.
Green fluorescent protein plasmid
The control template supplied with the Roche RTS100 System (5PRIME GmbH,
Germany) was the source of the GFP DNA used in this study. The GFP gene
was supplied pre-inserted into the pIVEX 2.3d vector (Fig 3.1 a)) and amplified
in E.coli by Dr. Natalie Smithers (University of Southampton). The DNA was
Figure 3.1: The Green fluorescent protein DNA plasmid. a) The vectormap of pIVEX 2.3d (image taken from 5PRIME GmbH, Germany). b)The amino acid sequence of the GFP protein.
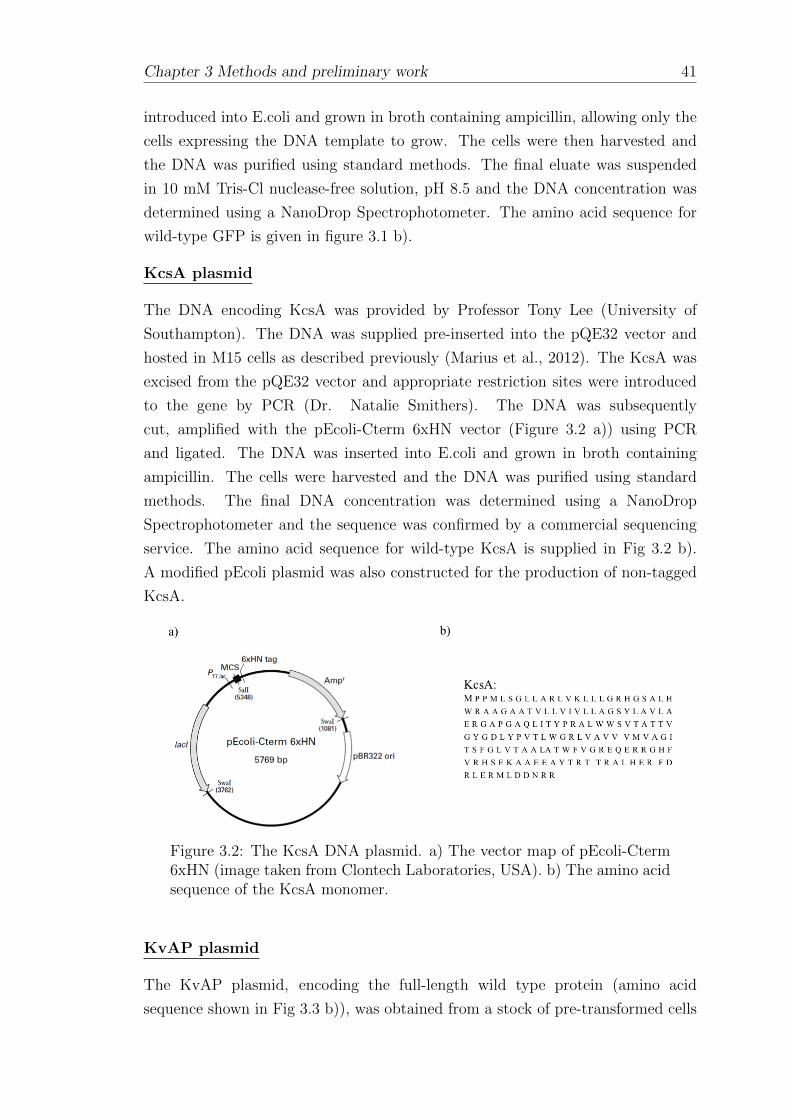
Chapter 3 Methods and preliminary work 41
introduced into E.coli and grown in broth containing ampicillin, allowing only the
cells expressing the DNA template to grow. The cells were then harvested and
the DNA was purified using standard methods. The final eluate was suspended
in 10 mM Tris-Cl nuclease-free solution, pH 8.5 and the DNA concentration was
determined using a NanoDrop Spectrophotometer. The amino acid sequence for
wild-type GFP is given in figure 3.1 b).
KcsA plasmid
The DNA encoding KcsA was provided by Professor Tony Lee (University of
Southampton). The DNA was supplied pre-inserted into the pQE32 vector and
hosted in M15 cells as described previously (Marius et al., 2012). The KcsA was
excised from the pQE32 vector and appropriate restriction sites were introduced
to the gene by PCR (Dr. Natalie Smithers). The DNA was subsequently
cut, amplified with the pEcoli-Cterm 6xHN vector (Figure 3.2 a)) using PCR
and ligated. The DNA was inserted into E.coli and grown in broth containing
ampicillin. The cells were harvested and the DNA was purified using standard
methods. The final DNA concentration was determined using a NanoDrop
Spectrophotometer and the sequence was confirmed by a commercial sequencing
service. The amino acid sequence for wild-type KcsA is supplied in Fig 3.2 b).
A modified pEcoli plasmid was also constructed for the production of non-tagged
KcsA.
Figure 3.2: The KcsA DNA plasmid. a) The vector map of pEcoli-Cterm6xHN (image taken from Clontech Laboratories, USA). b) The amino acidsequence of the KcsA monomer.
KvAP plasmid
The KvAP plasmid, encoding the full-length wild type protein (amino acid
sequence shown in Fig 3.3 b)), was obtained from a stock of pre-transformed cells

42 Chapter 3 Methods and preliminary work
stored in glycerol from previous work (Rogers, 2010). The original DNA sequence,
inserted into the pQE-60 vector (figure 3.3 a)), was a gift from Professor R.
MacKinnon. The plasmid was inserted into XL-1 Blue cells in order for the in-vivo
expression of the vector to be inducible by IPTG. The cells were grown in 1 L of
nutrient broth containing 1 mg/ml ampicillin and 0.0025 mg/ml tetracycline. The
XL-1 Blue cells were resistant to tetracycline, while the vector encoded resistance
for the ampicillin, ensuring that only the cells encoding the plasmid were allowed
to grow. The cells were later harvested and the DNA was purified using standard
methods. The DNA concentration of the final eluate was determined using a
NanoDrop Spectrophotometer.
Figure 3.3: The KvAP DNA plasmid. a) The vector map of pQE-60(image taken from the German Research Centre for Environmental Health,Germany.) b) The amino acid sequence of KvAP.
hERGS5−S6 plasmid
The full-length hERG plasmid was provided by Dr. Philip Williamson through a
collaboration with Professor Isabelle Marcotte (Universite du Quebec a Montreal).
The hERGS5−S6 plasmid (UniProtKB entry Q12809, residues 540-673) was
prepared by Andre E. Gravel under the supervision of Jason C. Young (McGill
University). The DNA fragment was inserted into a pProEX HTa vector (Fig 3.4
a)) with a Trc promoter sequence (Invitrogen Life Technologies, UK) by Maıwenn
Beaugrand (University of Southampton). The cells were subsequently grown in
ampicillin and harvested before the DNA was purified. The final eluate was
analysed using a NanoDrop Spectrophotometer (Maıwenn Beaugrand).

Chapter 3 Methods and preliminary work 43
Figure 3.4: The hERGS5−S6 DNA Plasmid. a) The vector map of pProEXHTa (image taken from Life Technologies, USA). b) The amino acidsequence of the hERGS5−S6 pore domain.
3.1.2 GFP and KcsA protein
The GFP plasmid and the KcsA plasmid detailed in section 3.1.1 were separately
expressed in E.coli culture and purified to obtain His-tagged GFP and KcsA
protein (Dr. Natalie Smithers, University of Southampton). These proteins were
used as positive controls on SDS PAGE gels as detailed in sub-sections 3.1.13,
5.1.1 and 5.1.2.
3.1.3 Unilamellar vesicle formation
The desired amount of lipid in chloroform was added to a glass vial. The lipids were
typically a 1:1 (w/w) mixture of 1,2-dioleoyl-sn-glycero-3-phosphocholine (DOPC)
and 1-palmitoyl-2-oleoyl-sn-glycero-3-phospho-(1’-rac-glycerol) (POPG) (Avanti
Polar Lipids, AL, USA). The chloroform was evaporated under a stream of nitrogen
to form a dry lipid film, which was placed inside a vacuum desiccator for ∼1 hour
to remove any residual solvent. Subsequently, 1 mL of electrophysiology buffer
pH 7 was added to the lipid film, which was then resuspended using a vortexer.
The resulting dispersion of multilamellar vesicles was freeze-thawed five times and
then passed 21 times through a polycarbonate filter with 100 nm pores (Avanti
Polar Lipids, AL, USA) to obtain large unilamellar vesicles.
44 Chapter 3 Methods and preliminary work
3.1.4 The cell-free reaction
The L1130 E. coli T7 Extract System for Circular DNA (Promega, USA), the
EasyXpress Protein Synthesis Kit (Qiagen Ltd, UK), the Expressway Cell-Free E.
coli Expression System (Invitrogen Life Technologies, USA), and the Promega
L1110 S30 T7 High-Yield Protein Expression System (Promega, USA) were
prepared as directed by the manufacturer, with the exception that the distilled
water component in the reaction mixture was replaced with electrophysiology
buffer (150 mM KCl, 10 mM HEPES, pH 7.0). Typically for the L1130 system,
equal volumes of two minus amino acid solutions were first mixed by pipetting
before 5 µl of the mixture was added to 20 µl of the reaction S30 pre-mixture.
15 µl of the cell extract was then added, followed by 9 µl of nuclease free water
supplemented with buffer. The desired amount of DNA was typically prepared to
1 µl and added last to control the initiation of the reaction, with the only exception
being when vesicles were added to the CF mixture. In this instance, the vesicles
were added last, inside the 9 µl volume used to dilute the CF mixture, and the
DNA was the penultimate component to be added. The final volume of all of the
CF reactions was 50 µl, and is commonly referred to as one volume of the CF
reaction in the later chapters. The CF mixture was used without incubation in
Chapter 4 and at 30 ◦C for 2 hours in Chapters 5 and 6, with or without agitation
as specified. The CF reactions were kept on ice before use.
3.1.5 Protein purification using Ni-NTA affinity chro-
matography
Ni-NTA agarose beads (Qiagen, UK) from 40 µl of as-supplied bead slurry were
equilibrated and resuspended in 50 µl wash buffer (20 mM imidazole in phosphate
buffered saline (PBS)) according to the instructions from the manufacturer. The
affinity bead dispersion was then added to 100 or 150 µl of a completed cell-
free reaction mixture, followed by overnight incubation under agitation at 4 ◦C.
Beads were then washed with four bead volumes of wash buffer, before elution
with stepwise increases in imidazole concentration: 0.1, 0.5 and 1 M imidazole in
PBS with 5% glycerol. Finally, the beads were resuspended in 50 µl PBS. For
purifications where the pooled eluates were to be used as an electrophysiology
sample all elution buffers were supplemented with electrophysiology buffer (150
mM KCl, 10 mM HEPES, pH 7.0) and the 1 M imidazole elution step was
replaced with more 0.5 M imidazole elutions. 15% SDS-PAGE gels were prepared
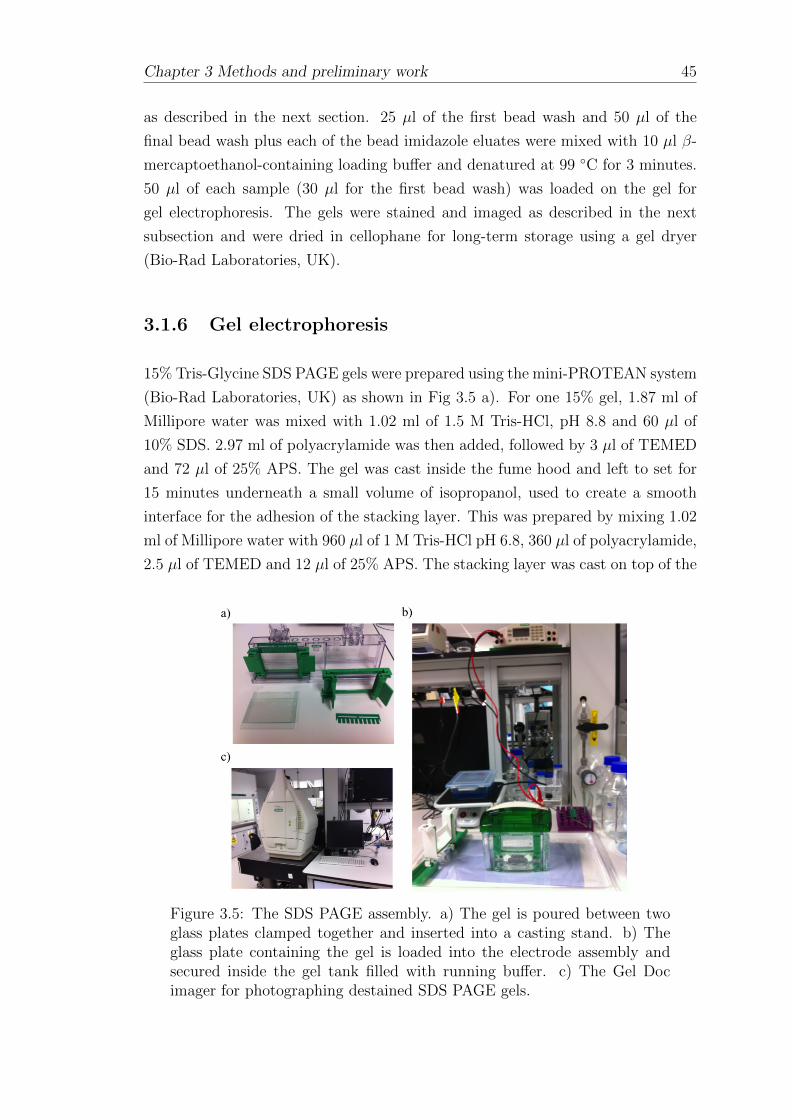
Chapter 3 Methods and preliminary work 45
as described in the next section. 25 µl of the first bead wash and 50 µl of the
final bead wash plus each of the bead imidazole eluates were mixed with 10 µl β-
mercaptoethanol-containing loading buffer and denatured at 99 ◦C for 3 minutes.
50 µl of each sample (30 µl for the first bead wash) was loaded on the gel for
gel electrophoresis. The gels were stained and imaged as described in the next
subsection and were dried in cellophane for long-term storage using a gel dryer
(Bio-Rad Laboratories, UK).
3.1.6 Gel electrophoresis
15% Tris-Glycine SDS PAGE gels were prepared using the mini-PROTEAN system
(Bio-Rad Laboratories, UK) as shown in Fig 3.5 a). For one 15% gel, 1.87 ml of
Millipore water was mixed with 1.02 ml of 1.5 M Tris-HCl, pH 8.8 and 60 µl of
10% SDS. 2.97 ml of polyacrylamide was then added, followed by 3 µl of TEMED
and 72 µl of 25% APS. The gel was cast inside the fume hood and left to set for
15 minutes underneath a small volume of isopropanol, used to create a smooth
interface for the adhesion of the stacking layer. This was prepared by mixing 1.02
ml of Millipore water with 960 µl of 1 M Tris-HCl pH 6.8, 360 µl of polyacrylamide,
2.5 µl of TEMED and 12 µl of 25% APS. The stacking layer was cast on top of the
Figure 3.5: The SDS PAGE assembly. a) The gel is poured between twoglass plates clamped together and inserted into a casting stand. b) Theglass plate containing the gel is loaded into the electrode assembly andsecured inside the gel tank filled with running buffer. c) The Gel Docimager for photographing destained SDS PAGE gels.
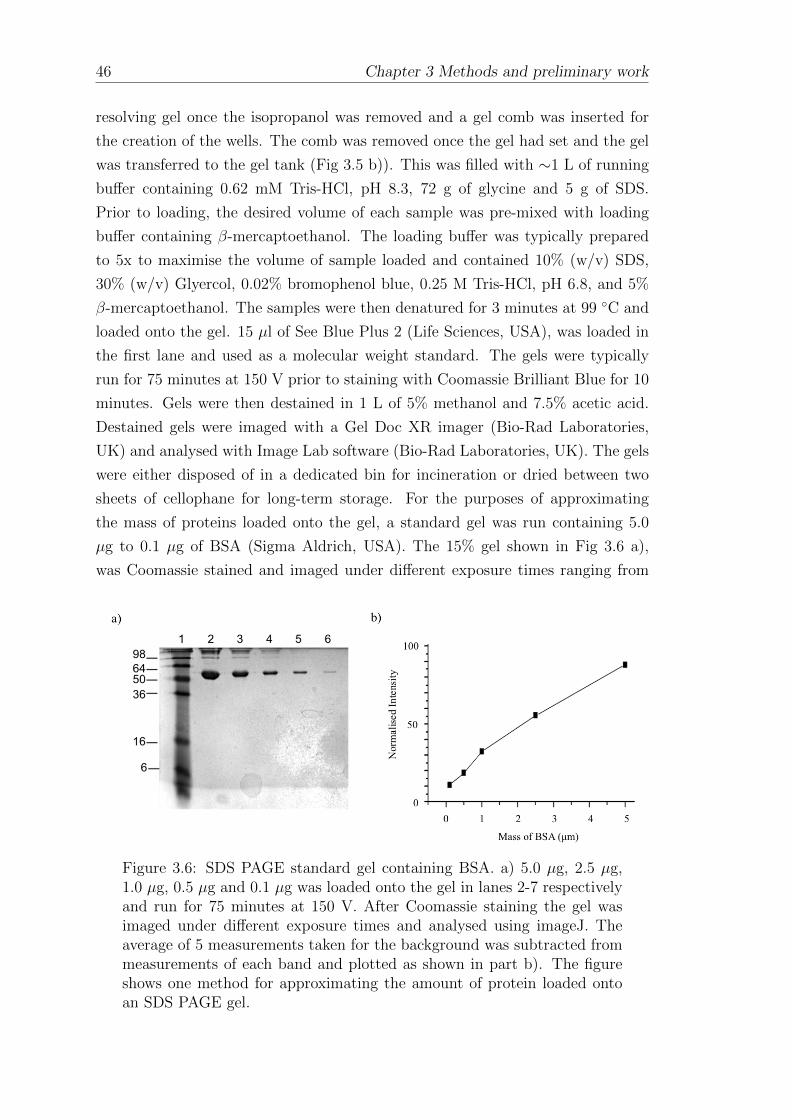
46 Chapter 3 Methods and preliminary work
resolving gel once the isopropanol was removed and a gel comb was inserted for
the creation of the wells. The comb was removed once the gel had set and the gel
was transferred to the gel tank (Fig 3.5 b)). This was filled with ∼1 L of running
buffer containing 0.62 mM Tris-HCl, pH 8.3, 72 g of glycine and 5 g of SDS.
Prior to loading, the desired volume of each sample was pre-mixed with loading
buffer containing β-mercaptoethanol. The loading buffer was typically prepared
to 5x to maximise the volume of sample loaded and contained 10% (w/v) SDS,
30% (w/v) Glyercol, 0.02% bromophenol blue, 0.25 M Tris-HCl, pH 6.8, and 5%
β-mercaptoethanol. The samples were then denatured for 3 minutes at 99 ◦C and
loaded onto the gel. 15 µl of See Blue Plus 2 (Life Sciences, USA), was loaded in
the first lane and used as a molecular weight standard. The gels were typically
run for 75 minutes at 150 V prior to staining with Coomassie Brilliant Blue for 10
minutes. Gels were then destained in 1 L of 5% methanol and 7.5% acetic acid.
Destained gels were imaged with a Gel Doc XR imager (Bio-Rad Laboratories,
UK) and analysed with Image Lab software (Bio-Rad Laboratories, UK). The gels
were either disposed of in a dedicated bin for incineration or dried between two
sheets of cellophane for long-term storage. For the purposes of approximating
the mass of proteins loaded onto the gel, a standard gel was run containing 5.0
µg to 0.1 µg of BSA (Sigma Aldrich, USA). The 15% gel shown in Fig 3.6 a),
was Coomassie stained and imaged under different exposure times ranging from
Figure 3.6: SDS PAGE standard gel containing BSA. a) 5.0 µg, 2.5 µg,1.0 µg, 0.5 µg and 0.1 µg was loaded onto the gel in lanes 2-7 respectivelyand run for 75 minutes at 150 V. After Coomassie staining the gel wasimaged under different exposure times and analysed using imageJ. Theaverage of 5 measurements taken for the background was subtracted frommeasurements of each band and plotted as shown in part b). The figureshows one method for approximating the amount of protein loaded ontoan SDS PAGE gel.
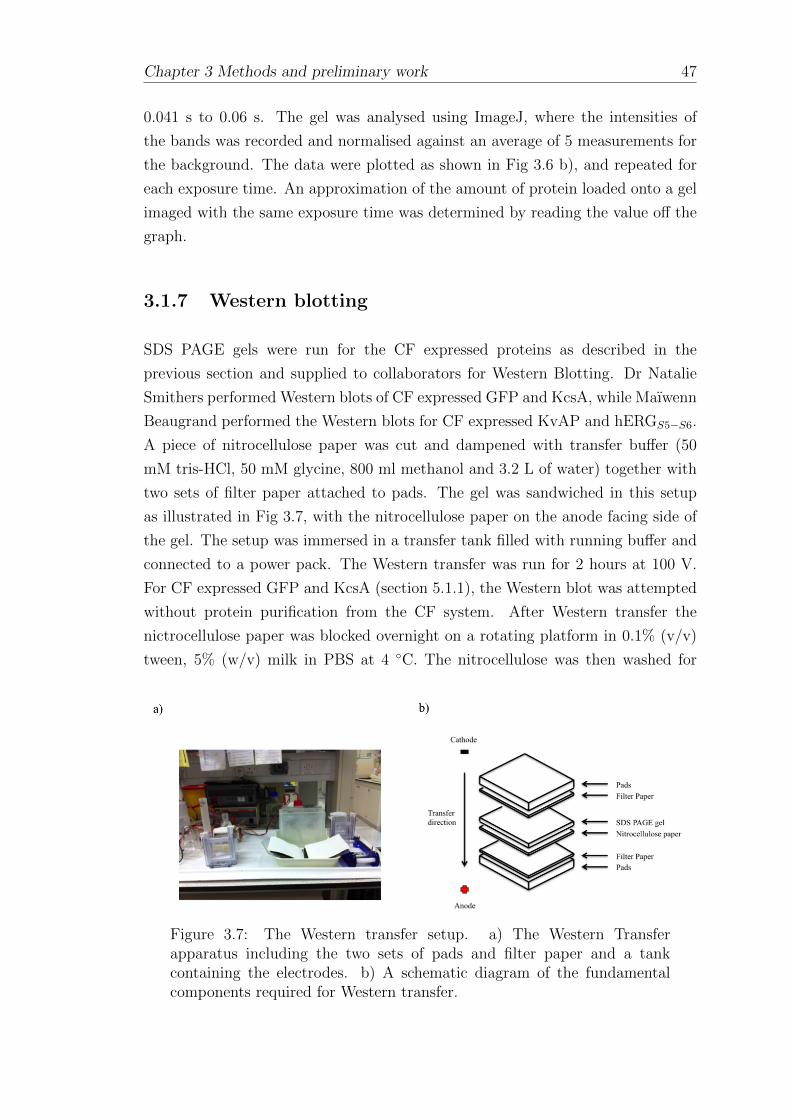
Chapter 3 Methods and preliminary work 47
0.041 s to 0.06 s. The gel was analysed using ImageJ, where the intensities of
the bands was recorded and normalised against an average of 5 measurements for
the background. The data were plotted as shown in Fig 3.6 b), and repeated for
each exposure time. An approximation of the amount of protein loaded onto a gel
imaged with the same exposure time was determined by reading the value off the
graph.
3.1.7 Western blotting
SDS PAGE gels were run for the CF expressed proteins as described in the
previous section and supplied to collaborators for Western Blotting. Dr Natalie
Smithers performed Western blots of CF expressed GFP and KcsA, while Maıwenn
Beaugrand performed the Western blots for CF expressed KvAP and hERGS5−S6.
A piece of nitrocellulose paper was cut and dampened with transfer buffer (50
mM tris-HCl, 50 mM glycine, 800 ml methanol and 3.2 L of water) together with
two sets of filter paper attached to pads. The gel was sandwiched in this setup
as illustrated in Fig 3.7, with the nitrocellulose paper on the anode facing side of
the gel. The setup was immersed in a transfer tank filled with running buffer and
connected to a power pack. The Western transfer was run for 2 hours at 100 V.
For CF expressed GFP and KcsA (section 5.1.1), the Western blot was attempted
without protein purification from the CF system. After Western transfer the
nictrocellulose paper was blocked overnight on a rotating platform in 0.1% (v/v)
tween, 5% (w/v) milk in PBS at 4 ◦C. The nitrocellulose was then washed for
Figure 3.7: The Western transfer setup. a) The Western Transferapparatus including the two sets of pads and filter paper and a tankcontaining the electrodes. b) A schematic diagram of the fundamentalcomponents required for Western transfer.

48 Chapter 3 Methods and preliminary work
1 hour in a solution containing 0.1% tween (v/v), 5% milk and the rabbit anti-
HN primary antibody (RayBiotech, USA) prepared to a final concentration of 1
µg/ml in PBS. The antibody solution was then removed and the nitrocellulose
paper was briefly soaked in water, which was then replaced with wash buffer
containing 5% BSA in PBS. The nitrocellulose was left soaking in the wash buffer
on the rotating platform for 10 minutes before the wash buffer was replaced with
fresh solution. This was repeated a total of three times. The nitrocellulose paper
was then incubated with a solution containing a horseradish peroxidase (HRP)
conjugated goat anti-rabbit secondary antibody (RayBiotech, USA), prepared at
1:3000 dilution in PBS containing 5% BSA, 0.1% tween. The nitrocellulose paper
was then dried and transferred to a darkroom for chemiluminescent imaging using
photographic paper. Briefly, the Thermo SuperSignal West Dura ECL detection
reagent (Life Technologies, USA) was prepared as directed by the manufacturer
and deposited on the nitrocellulose paper. The photographic film was exposed
to the nitrocellulose for 30 seconds in a small light-proof box. The film was
subsequently developed using standard developer solutions.
For CF expressed KvAP (section 5.2.1) and hERGS5−S6 (section 5.3.1), the protein
was purified from the CF system as described in section 3.1.5, before the SDS
PAGE gel used for the Western transfer was run. After the transfer was complete,
the nitrocellulose paper was blocked in Odyssey blocking buffer for 1 h. The
primary monoclonal anti-polyhistidine antibody (Sigma-Aldrich Company Ltd.,
UK) was diluted as directed by the manufacturer and poured over the nitrocellulose
paper. The paper was incubated with the primary antibody under light agitation
for 1 h prior to being washed three times with PBS. The Quick Western Kit - IRDye
680RD (LI-COR) was used for detection. The detection solution was prepared
according to the manufacturers instructions and incubated with the paper for 1 h.
The nitrocellulose paper was finally washed three times with PBS and transferred
to a Li-Cor Odyssey infrared imaging system.
3.1.8 Protein reconstitution
Protein reconstitution was performed using SM-2 BioBeads (Bio-Rad, USA). To
activate the beads, 2 g were weighed out inside a beaker and washed with analytical
grade methanol for 30 minutes using a magnetic stirrer. The beads were allowed
to settle, the methanol poured away and the volume replaced with 150 mM KCl,
10 mM HEPES, pH 7.40 electrophysiology buffer. The beads were washed for 30
min using a magnetic stirrer, before the dispersion was allowed to settle. The
Chapter 3 Methods and preliminary work 49
floating beads were discarded and the buffer replaced with a fresh solution. This
was repeated three times to ensure that the methanol was completely removed.
The washed beads were stored in buffer at 4 ◦C until use.
The desired quantity of lipid was prepared in a glass vial by making a lipid film,
as described in the section 3.1.3 for the formation of unilamellar vesicles. 1 ml of
electrophysiology buffer containing 40 mM b-D-octyl-glucoside was added and the
solution was sonicated in short bursts lasting 1-2 min. The protein of interest was
then transferred to the mixture to give a molar ratio of lipid:protein of 10,000:1. To
initiate protein reconstitution, the buffer was removed from the washed BioBeads
and 80 mg were added to solution. The absorption of the detergent by the
BioBeads, resulted in the transformation of micelles to proteoliposomes, as is
indicated by the clear solution changing to form a cloudy emulsion. The sample
was carefully removed from the beads after 1 h and added to a fresh 80 mg of
beads for a further hour, after which the reconstituted protein was again removed
and transferred to a fresh eppendorf tube. The sample was either kept on ice and
used immediately or stored at -20 ◦C.
3.1.9 The cell-free expression of green fluorescent protein
and detection using fluorescence microscopy
The proceeding subsections in this chapter explain the methods used for expressing
and detecting proteins, however it remains to be seen whether the commercial CF
systems are compatible with the templates described in section 3.1.1. This is
addressed in this subsection by demonstrating the CF expression of GFP using
fluorescence microscopy.
Expression was performed as described in 3.1.4 using the Promega L1130 system
and the Invitrogen ExpressWay system. Both systems were supplied with 1 µg
of the GFP DNA template and run alongside controls containing no DNA (the
volume was replaced with RNase-free water). The eppendorfs were snap-frozen
using liquid nitrogen after incubation and thawed by hand for analysis, where 2 µl
samples were prepared on a glass slide and imaged. Images were taken at multiple
positions at x20 magnification with an exposure time of 10 sec using a FITC filter
set. They were later analysed using ImageJ to determine the mean intensity of the
fluorescence in selected areas, the size of which was kept constant for the purposes
of consistency.
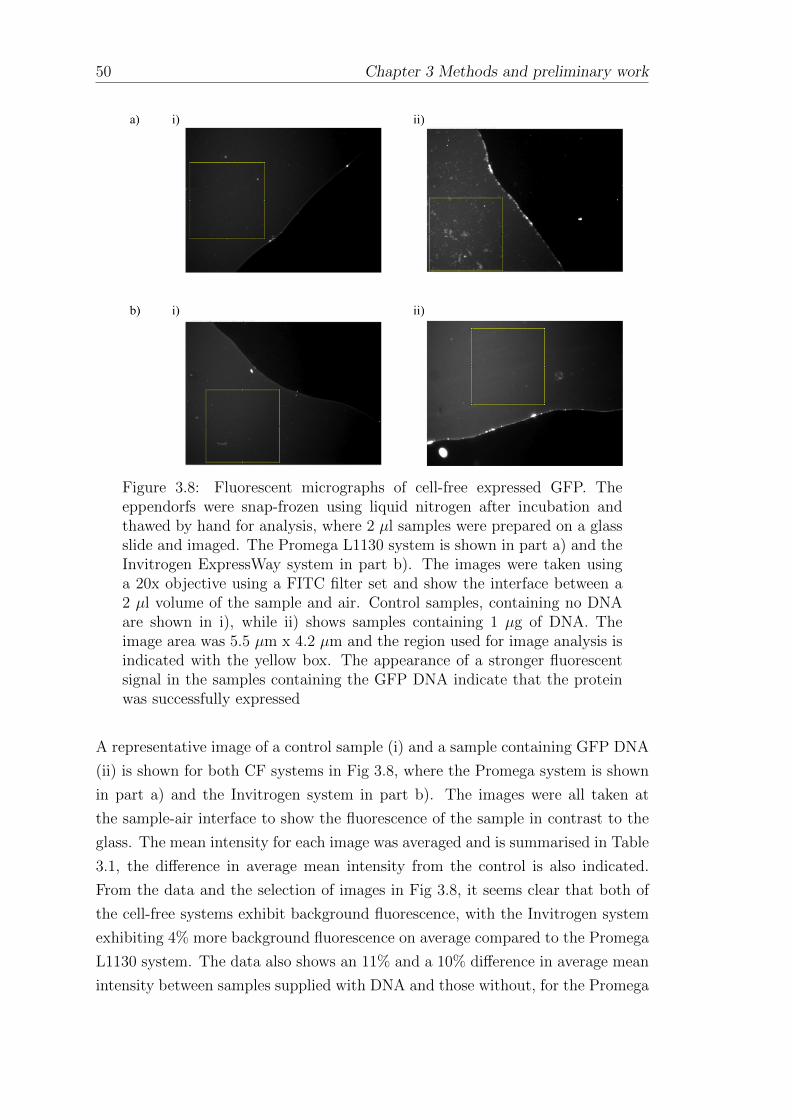
50 Chapter 3 Methods and preliminary work
Figure 3.8: Fluorescent micrographs of cell-free expressed GFP. Theeppendorfs were snap-frozen using liquid nitrogen after incubation andthawed by hand for analysis, where 2 µl samples were prepared on a glassslide and imaged. The Promega L1130 system is shown in part a) and theInvitrogen ExpressWay system in part b). The images were taken usinga 20x objective using a FITC filter set and show the interface between a2 µl volume of the sample and air. Control samples, containing no DNAare shown in i), while ii) shows samples containing 1 µg of DNA. Theimage area was 5.5 µm x 4.2 µm and the region used for image analysis isindicated with the yellow box. The appearance of a stronger fluorescentsignal in the samples containing the GFP DNA indicate that the proteinwas successfully expressed
A representative image of a control sample (i) and a sample containing GFP DNA
(ii) is shown for both CF systems in Fig 3.8, where the Promega system is shown
in part a) and the Invitrogen system in part b). The images were all taken at
the sample-air interface to show the fluorescence of the sample in contrast to the
glass. The mean intensity for each image was averaged and is summarised in Table
3.1, the difference in average mean intensity from the control is also indicated.
From the data and the selection of images in Fig 3.8, it seems clear that both of
the cell-free systems exhibit background fluorescence, with the Invitrogen system
exhibiting 4% more background fluorescence on average compared to the Promega
L1130 system. The data also shows an 11% and a 10% difference in average mean
intensity between samples supplied with DNA and those without, for the Promega
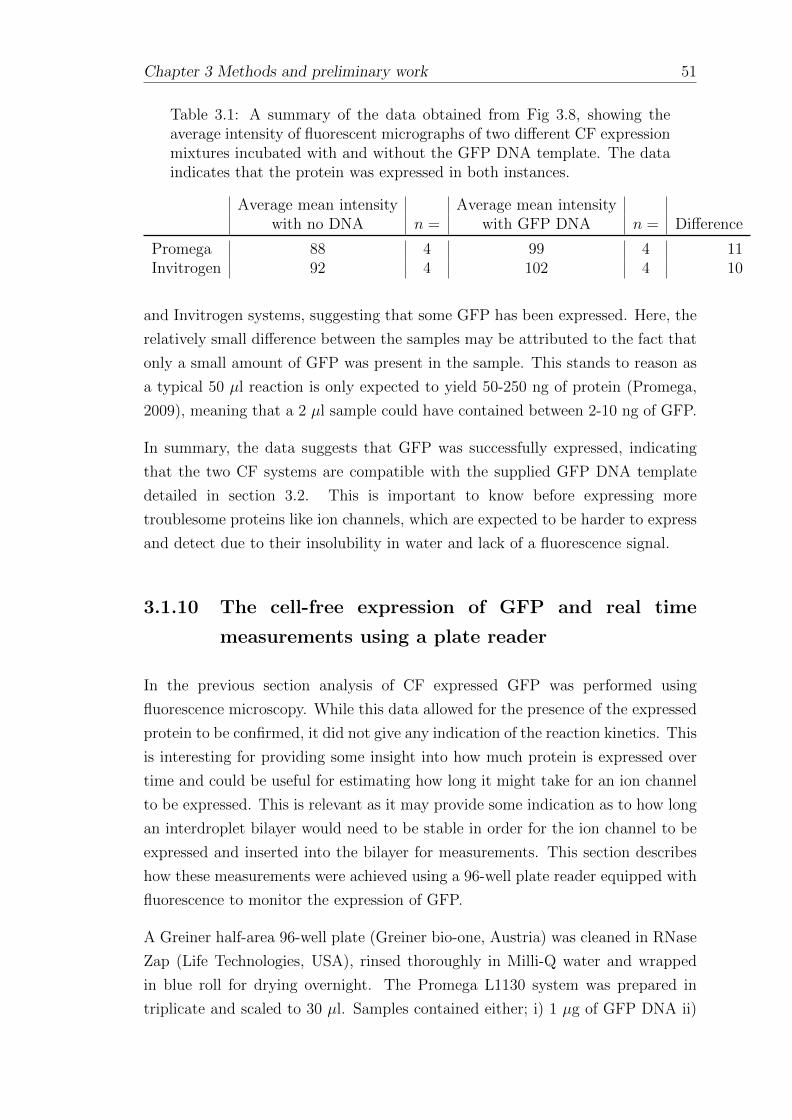
Chapter 3 Methods and preliminary work 51
Table 3.1: A summary of the data obtained from Fig 3.8, showing theaverage intensity of fluorescent micrographs of two different CF expressionmixtures incubated with and without the GFP DNA template. The dataindicates that the protein was expressed in both instances.
Average mean intensity Average mean intensitywith no DNA n = with GFP DNA n = Difference
Promega 88 4 99 4 11Invitrogen 92 4 102 4 10
and Invitrogen systems, suggesting that some GFP has been expressed. Here, the
relatively small difference between the samples may be attributed to the fact that
only a small amount of GFP was present in the sample. This stands to reason as
a typical 50 µl reaction is only expected to yield 50-250 ng of protein (Promega,
2009), meaning that a 2 µl sample could have contained between 2-10 ng of GFP.
In summary, the data suggests that GFP was successfully expressed, indicating
that the two CF systems are compatible with the supplied GFP DNA template
detailed in section 3.2. This is important to know before expressing more
troublesome proteins like ion channels, which are expected to be harder to express
and detect due to their insolubility in water and lack of a fluorescence signal.
3.1.10 The cell-free expression of GFP and real time
measurements using a plate reader
In the previous section analysis of CF expressed GFP was performed using
fluorescence microscopy. While this data allowed for the presence of the expressed
protein to be confirmed, it did not give any indication of the reaction kinetics. This
is interesting for providing some insight into how much protein is expressed over
time and could be useful for estimating how long it might take for an ion channel
to be expressed. This is relevant as it may provide some indication as to how long
an interdroplet bilayer would need to be stable in order for the ion channel to be
expressed and inserted into the bilayer for measurements. This section describes
how these measurements were achieved using a 96-well plate reader equipped with
fluorescence to monitor the expression of GFP.
A Greiner half-area 96-well plate (Greiner bio-one, Austria) was cleaned in RNase
Zap (Life Technologies, USA), rinsed thoroughly in Milli-Q water and wrapped
in blue roll for drying overnight. The Promega L1130 system was prepared in
triplicate and scaled to 30 µl. Samples contained either; i) 1 µg of GFP DNA ii)
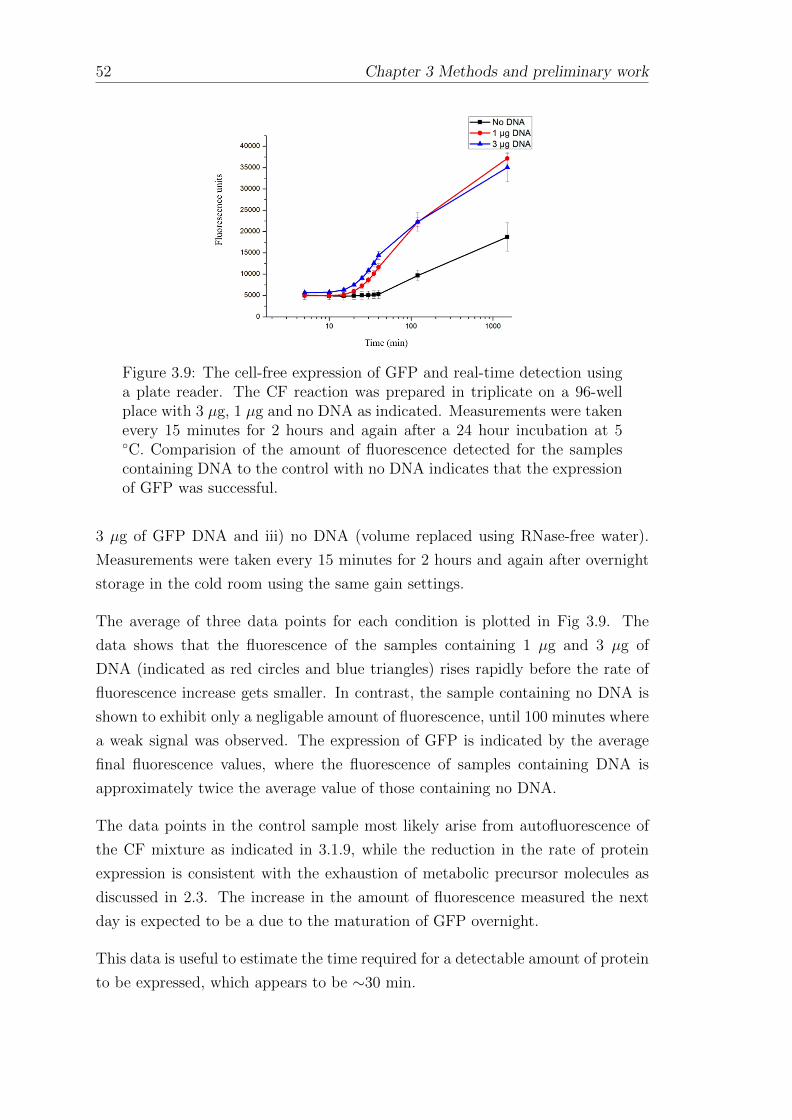
52 Chapter 3 Methods and preliminary work
Figure 3.9: The cell-free expression of GFP and real-time detection usinga plate reader. The CF reaction was prepared in triplicate on a 96-wellplace with 3 µg, 1 µg and no DNA as indicated. Measurements were takenevery 15 minutes for 2 hours and again after a 24 hour incubation at 5◦C. Comparision of the amount of fluorescence detected for the samplescontaining DNA to the control with no DNA indicates that the expressionof GFP was successful.
3 µg of GFP DNA and iii) no DNA (volume replaced using RNase-free water).
Measurements were taken every 15 minutes for 2 hours and again after overnight
storage in the cold room using the same gain settings.
The average of three data points for each condition is plotted in Fig 3.9. The
data shows that the fluorescence of the samples containing 1 µg and 3 µg of
DNA (indicated as red circles and blue triangles) rises rapidly before the rate of
fluorescence increase gets smaller. In contrast, the sample containing no DNA is
shown to exhibit only a negligable amount of fluorescence, until 100 minutes where
a weak signal was observed. The expression of GFP is indicated by the average
final fluorescence values, where the fluorescence of samples containing DNA is
approximately twice the average value of those containing no DNA.
The data points in the control sample most likely arise from autofluorescence of
the CF mixture as indicated in 3.1.9, while the reduction in the rate of protein
expression is consistent with the exhaustion of metabolic precursor molecules as
discussed in 2.3. The increase in the amount of fluorescence measured the next
day is expected to be a due to the maturation of GFP overnight.
This data is useful to estimate the time required for a detectable amount of protein
to be expressed, which appears to be ∼30 min.

Chapter 3 Methods and preliminary work 53
3.1.11 Expression of GFP with fluorescent tRNA-lysine
It is clear from the data shown in this chapter that the commercial CF systems are
capable of expressing GFP, however the methods presented thus far for protein
detection are not suitable for CF expressed ion channels due to the lack of a
fluorescence signal. The aim of this section is therefore to use CF expressed GFP
to investigate other methods of protein detection. One strategy for achieving this
is to supply the CF system with lysine transfer RNA labelled with the fluorophore
BODIPY-FL and running the sample on an SDS PAGE gel. This allows for
the fluorescent label to be incorporated into the CF expressed protein of interest,
enabling the protein to be detected using a laser-based fluorescent scanner without
the requirement for a C- or N- terminal affinity tag. This method also allows for the
viability of identifying CF expressed proteins on SDS PAGE gels to be addressed,
as the gel can later be stained and imaged.
The CF reaction was prepared and run in 50 µl volumes with 3 µg, 1 µg and
no GFP DNA in triplicate as described in section 3.1.4, except that 3 µl of the
BODIPY-FL tagged lysine transfer RNA (Promega, USA) was added with the
nuclease-free water. As an additional control, an extra reaction was prepared
containing 1 µg of the PinPoint control vector containing the chloramphenicol
acetyltransferase gene fused to the pinpoint peptide sequence (Promega, USA). 5
µl of each sample was mixed with 7 µl of loading buffer (no β-mercaptoethanol),
denatured for 3 minutes at 99 ◦C before 10 µl of each sample was loaded across
two 10-lane, 15% 1.5 mm thick gels (prepared as described in section 3.1.6). ∼2
µg of recombinant eGFP protein (ThermoFisher Scientific, USA) was added as a
positive control to estimate the position of the CF expressed GFP in the adjacent
lanes. The gels were run for 1 hour and 15 min at 150V and imaged under UV
light before staining with Coomassie blue.
The fluorescent band at ∼36 kDa in the gel images (indicated by the arrow) in
parts a) and b) of Fig 3.10 show that the GFP was successfully expressed in lane
7 of gel a), and lanes 3, 4, 5 and 6 in gel b). This is inferred by the position
of the positive control in lanes 2 of both gels, shown in red due to saturation of
the instrument, and the absence of this band in all lanes that did not contain the
GFP DNA template. The fluorescent signal in lane 2 is interesting, as the SDS
present in the loading buffer should have denatured the GFP. This is relevant as it
is then difficult to identify whether the GFP bands in the adjacent lanes are visible
due to the fact that the protein has been expressed and not fully denatured, or
whether the fluorescence signal is a result of the BODIPY-FL tagged lysine residue
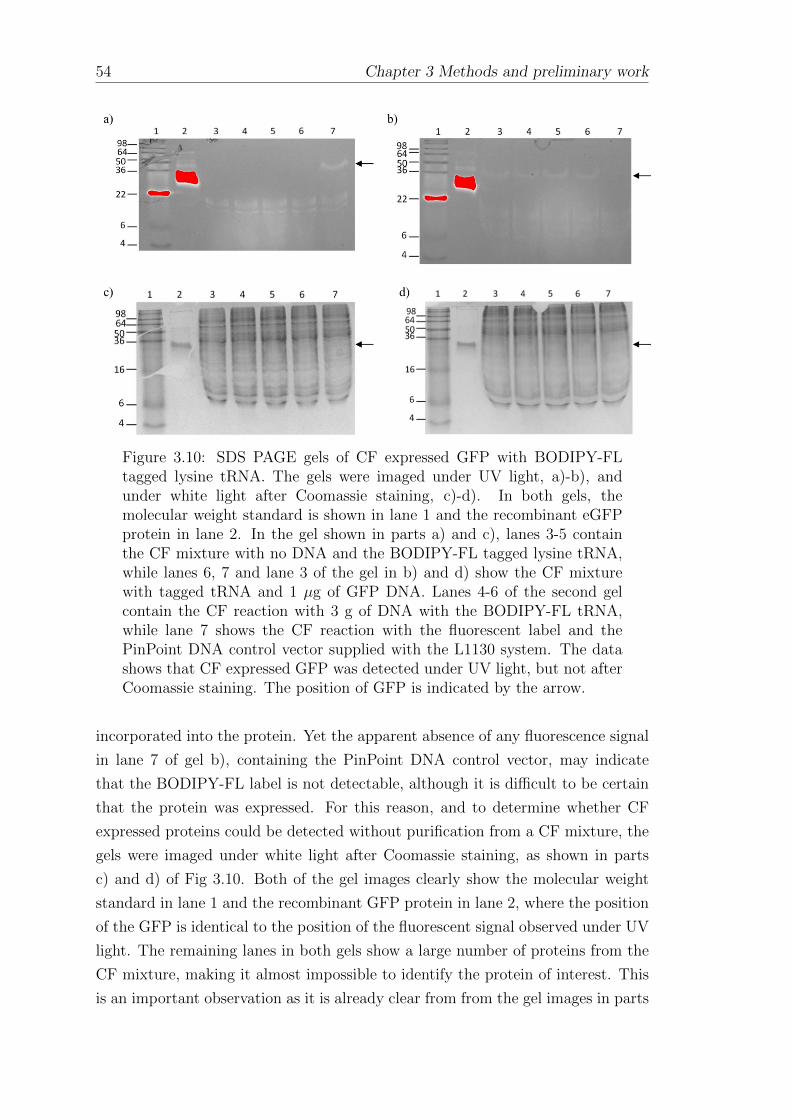
54 Chapter 3 Methods and preliminary work
Figure 3.10: SDS PAGE gels of CF expressed GFP with BODIPY-FLtagged lysine tRNA. The gels were imaged under UV light, a)-b), andunder white light after Coomassie staining, c)-d). In both gels, themolecular weight standard is shown in lane 1 and the recombinant eGFPprotein in lane 2. In the gel shown in parts a) and c), lanes 3-5 containthe CF mixture with no DNA and the BODIPY-FL tagged lysine tRNA,while lanes 6, 7 and lane 3 of the gel in b) and d) show the CF mixturewith tagged tRNA and 1 µg of GFP DNA. Lanes 4-6 of the second gelcontain the CF reaction with 3 g of DNA with the BODIPY-FL tRNA,while lane 7 shows the CF reaction with the fluorescent label and thePinPoint DNA control vector supplied with the L1130 system. The datashows that CF expressed GFP was detected under UV light, but not afterCoomassie staining. The position of GFP is indicated by the arrow.
incorporated into the protein. Yet the apparent absence of any fluorescence signal
in lane 7 of gel b), containing the PinPoint DNA control vector, may indicate
that the BODIPY-FL label is not detectable, although it is difficult to be certain
that the protein was expressed. For this reason, and to determine whether CF
expressed proteins could be detected without purification from a CF mixture, the
gels were imaged under white light after Coomassie staining, as shown in parts
c) and d) of Fig 3.10. Both of the gel images clearly show the molecular weight
standard in lane 1 and the recombinant GFP protein in lane 2, where the position
of the GFP is identical to the position of the fluorescent signal observed under UV
light. The remaining lanes in both gels show a large number of proteins from the
CF mixture, making it almost impossible to identify the protein of interest. This
is an important observation as it is already clear from from the gel images in parts
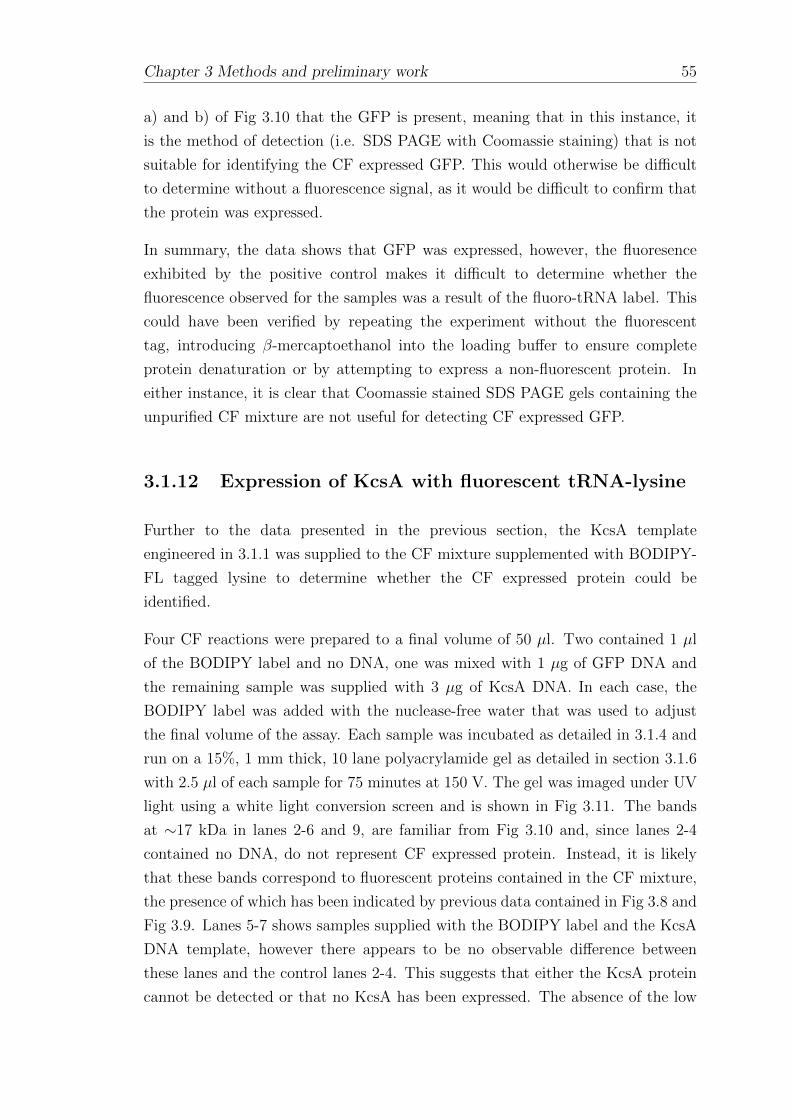
Chapter 3 Methods and preliminary work 55
a) and b) of Fig 3.10 that the GFP is present, meaning that in this instance, it
is the method of detection (i.e. SDS PAGE with Coomassie staining) that is not
suitable for identifying the CF expressed GFP. This would otherwise be difficult
to determine without a fluorescence signal, as it would be difficult to confirm that
the protein was expressed.
In summary, the data shows that GFP was expressed, however, the fluoresence
exhibited by the positive control makes it difficult to determine whether the
fluorescence observed for the samples was a result of the fluoro-tRNA label. This
could have been verified by repeating the experiment without the fluorescent
tag, introducing β-mercaptoethanol into the loading buffer to ensure complete
protein denaturation or by attempting to express a non-fluorescent protein. In
either instance, it is clear that Coomassie stained SDS PAGE gels containing the
unpurified CF mixture are not useful for detecting CF expressed GFP.
3.1.12 Expression of KcsA with fluorescent tRNA-lysine
Further to the data presented in the previous section, the KcsA template
engineered in 3.1.1 was supplied to the CF mixture supplemented with BODIPY-
FL tagged lysine to determine whether the CF expressed protein could be
identified.
Four CF reactions were prepared to a final volume of 50 µl. Two contained 1 µl
of the BODIPY label and no DNA, one was mixed with 1 µg of GFP DNA and
the remaining sample was supplied with 3 µg of KcsA DNA. In each case, the
BODIPY label was added with the nuclease-free water that was used to adjust
the final volume of the assay. Each sample was incubated as detailed in 3.1.4 and
run on a 15%, 1 mm thick, 10 lane polyacrylamide gel as detailed in section 3.1.6
with 2.5 µl of each sample for 75 minutes at 150 V. The gel was imaged under UV
light using a white light conversion screen and is shown in Fig 3.11. The bands
at ∼17 kDa in lanes 2-6 and 9, are familiar from Fig 3.10 and, since lanes 2-4
contained no DNA, do not represent CF expressed protein. Instead, it is likely
that these bands correspond to fluorescent proteins contained in the CF mixture,
the presence of which has been indicated by previous data contained in Fig 3.8 and
Fig 3.9. Lanes 5-7 shows samples supplied with the BODIPY label and the KcsA
DNA template, however there appears to be no observable difference between
these lanes and the control lanes 2-4. This suggests that either the KcsA protein
cannot be detected or that no KcsA has been expressed. The absence of the low

56 Chapter 3 Methods and preliminary work
Figure 3.11: Cell-free expression of KcsA with incorporated BODIPYlabeled lysine residues. Lane 1 contains the SeeBlue Plus 2 protein ladder,lanes 2-4 contain the negative control sample, the cell-free mixture with noDNA and 1 µl of the BODIPY label), Lanes 5-7 contain the CF system,1 µl of BODIPY labeled lysine and 3 µg of KcsA encoding DNA, lanes 8and 10 were empty, while lane 9 contained the CF system combined with1 µl of the BODIPY label and 1 µg of GFP encoding DNA. The data showthat no KcsA is detected. The gel was imaged under UV light. Saturationis indicated by red spots.
molecular weight proteins in lane 7 indicates that there was a pipetting error in
the preparation of the sample. Lane 8 was left empty, while lane 9 contained the
BODIPY label and 1 µg of GFP DNA template. The band observed at ∼40 kDa
is higher than expected for GFP (27 kDa) but consistent with the data shown in
the previous section, indicating that GFP has been expressed as observed in Fig
3.10. The arrow at ∼19 kDa indicates the region where the KcsA monomer would
be expected.
The gel shows the CF expression of GFP, however no CF expressed KcsA is
detected. It is unclear whether this infers that the KcsA was not expressed or
whether the KcsA was expressed but did not incorporate the BODIPY label.
3.1.13 SDS PAGE of diluted CF expression mixtures
spiked with KcsA protein
Experiments with GFP in the previous subsections have shown that commercial
CF systems contain large quantities of proteins, leading to difficulties in identifying
the CF expressed protein of interest by Coomassie staining (3.10). The ability to
visualise the contents of the CF system on an SDS PAGE gel can be improved
by dilution, however this will also dilute any CF expressed protein. The aim of

Chapter 3 Methods and preliminary work 57
this section is thus to determine how much KcsA would be required for this to be
achieved.
All samples contained 5 µl of 5x loading buffer, either 0.5 µl, 1.0 µl, 2.5 µl or 5 µl
of the CF mixture, 0.1 µg, 0.5 µg, 1.0 µg or 2.0 µg of KcsA (prepared as described
in 3.1.2 by Dr. Andy Powl, Birkbeck College) and were made up to a final volume
of 12 µl using molecular biology grade water. 10 µl of each sample was loaded
onto a 10% gel and run for 1 hour and 15 minutes at 150 V as detailed in section
3.1.6. Lane 2 of each gel contained 2.5 µg of KcsA, useful to identify the KcsA
present in the adjacent lanes.
The gels shown in Fig 3.12 show two different sets of dilutions, where lanes 3-6
in part a) contain the CF mixture diluted 3.8x, while lanes 7-10 contain the CF
mixture diluted 0.72x.
In both cases, the KcsA was added incrementally which, using the reference sample
and the arrow provided as a guide, is just visible in lanes 3-6 but difficult to
detect in lanes 7-10. Analysis of the gel suggests that the molecular weight of the
reference sample in lane 2 is 13.5 kDa, while the bands in lanes 4, 5, and 6 were
measured at 12.0 kDa, 11.9 kDa and 12.0 kDa respectively. Although these values
are slightly lower than that measured for the control, the observation of increasing
band intensity is convincing for the presence of KcsA. A plausible explanation for
this is that the proteins in lanes 3-6 are running slightly further down the gel due
to the effect of protein overloading.
The difficulty in identifying the KcsA in lanes 7-10 appears to be due to the higher
concentration of the background proteins from the CF mixture. Bands similar
in molecular weight to those highlighted in lanes 3-6 are highlighted in Table 3.2
however the absence of increasing band intensity relating to the increasing amount
of KcsA is noticeable. This may indicate that the bands are not KcsA or that the
high intensity of the bands already present in the CF system makes the difference
in the bands of interest negligible. This clarifies that the level of dilution used
for the samples in lanes 7-10 was inferior for the purposes visualising KcsA in
comparison to the level of dilution used in lanes 3-6.
The gel containing the remaining two sets of samples, diluted 23x and 11.5x
respectively is shown in Fig 3.12 b), where lanes 3-6 show the 23x diluted sample
and lanes 7-10 contain the 11.5x diluted sample. As before, the KcsA was added
incrementally in both sets of samples. The bands of interest are summarised in
Table 3.2.
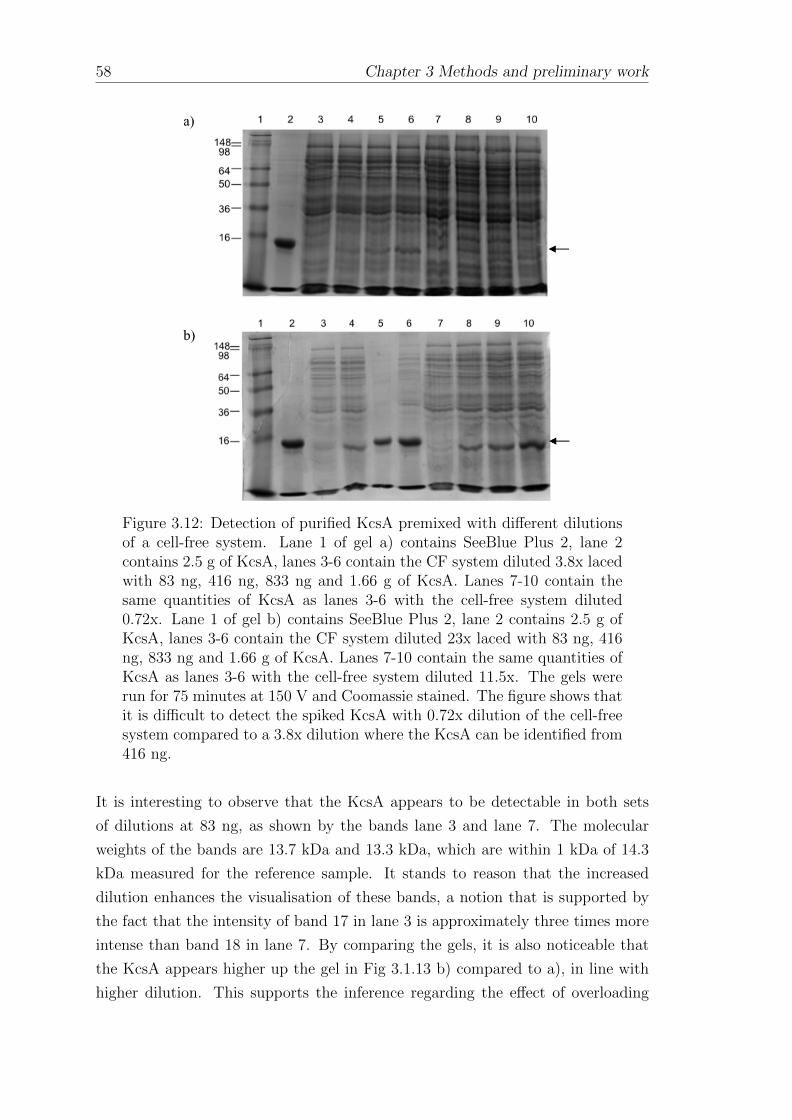
58 Chapter 3 Methods and preliminary work
Figure 3.12: Detection of purified KcsA premixed with different dilutionsof a cell-free system. Lane 1 of gel a) contains SeeBlue Plus 2, lane 2contains 2.5 g of KcsA, lanes 3-6 contain the CF system diluted 3.8x lacedwith 83 ng, 416 ng, 833 ng and 1.66 g of KcsA. Lanes 7-10 contain thesame quantities of KcsA as lanes 3-6 with the cell-free system diluted0.72x. Lane 1 of gel b) contains SeeBlue Plus 2, lane 2 contains 2.5 g ofKcsA, lanes 3-6 contain the CF system diluted 23x laced with 83 ng, 416ng, 833 ng and 1.66 g of KcsA. Lanes 7-10 contain the same quantities ofKcsA as lanes 3-6 with the cell-free system diluted 11.5x. The gels wererun for 75 minutes at 150 V and Coomassie stained. The figure shows thatit is difficult to detect the spiked KcsA with 0.72x dilution of the cell-freesystem compared to a 3.8x dilution where the KcsA can be identified from416 ng.
It is interesting to observe that the KcsA appears to be detectable in both sets
of dilutions at 83 ng, as shown by the bands lane 3 and lane 7. The molecular
weights of the bands are 13.7 kDa and 13.3 kDa, which are within 1 kDa of 14.3
kDa measured for the reference sample. It stands to reason that the increased
dilution enhances the visualisation of these bands, a notion that is supported by
the fact that the intensity of band 17 in lane 3 is approximately three times more
intense than band 18 in lane 7. By comparing the gels, it is also noticeable that
the KcsA appears higher up the gel in Fig 3.1.13 b) compared to a), in line with
higher dilution. This supports the inference regarding the effect of overloading
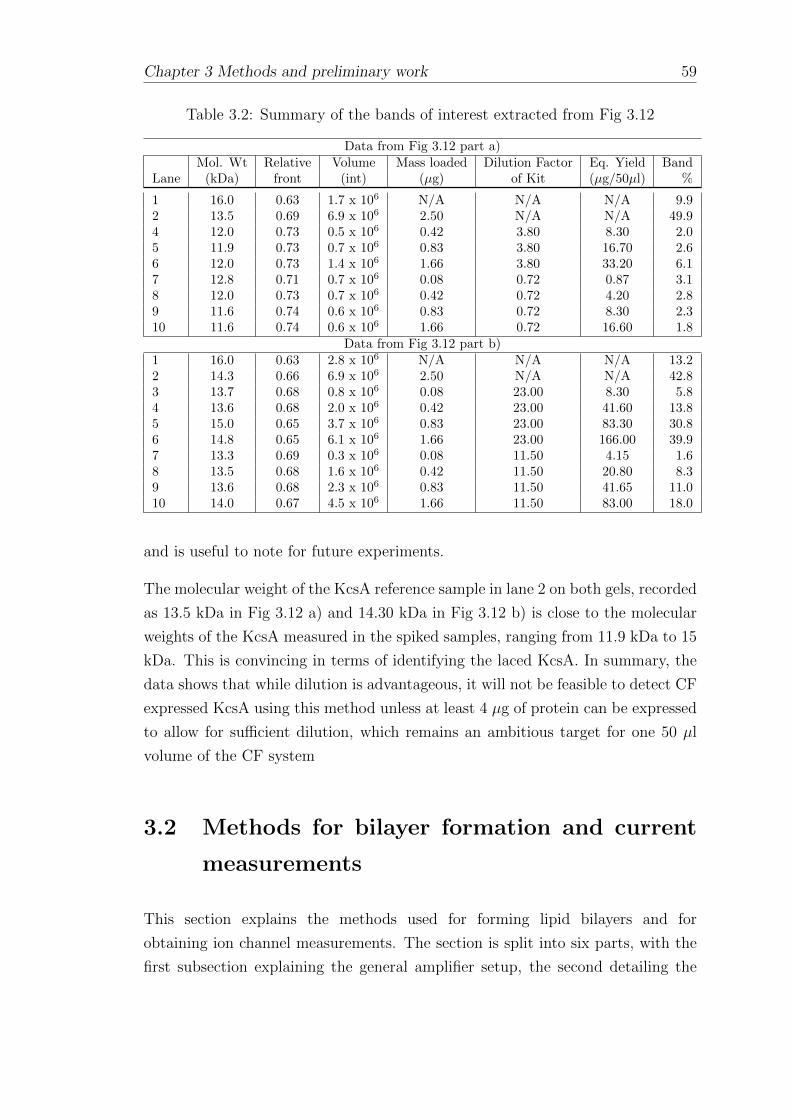
Chapter 3 Methods and preliminary work 59
Table 3.2: Summary of the bands of interest extracted from Fig 3.12
Data from Fig 3.12 part a)Mol. Wt Relative Volume Mass loaded Dilution Factor Eq. Yield Band
Lane (kDa) front (int) (µg) of Kit (µg/50µl) %
1 16.0 0.63 1.7 x 10⁶ N/A N/A N/A 9.92 13.5 0.69 6.9 x 10⁶ 2.50 N/A N/A 49.94 12.0 0.73 0.5 x 10⁶ 0.42 3.80 8.30 2.05 11.9 0.73 0.7 x 10⁶ 0.83 3.80 16.70 2.66 12.0 0.73 1.4 x 10⁶ 1.66 3.80 33.20 6.17 12.8 0.71 0.7 x 10⁶ 0.08 0.72 0.87 3.18 12.0 0.73 0.7 x 10⁶ 0.42 0.72 4.20 2.89 11.6 0.74 0.6 x 10⁶ 0.83 0.72 8.30 2.310 11.6 0.74 0.6 x 10⁶ 1.66 0.72 16.60 1.8
Data from Fig 3.12 part b)1 16.0 0.63 2.8 x 10⁶ N/A N/A N/A 13.22 14.3 0.66 6.9 x 10⁶ 2.50 N/A N/A 42.83 13.7 0.68 0.8 x 10⁶ 0.08 23.00 8.30 5.84 13.6 0.68 2.0 x 10⁶ 0.42 23.00 41.60 13.85 15.0 0.65 3.7 x 10⁶ 0.83 23.00 83.30 30.86 14.8 0.65 6.1 x 10⁶ 1.66 23.00 166.00 39.97 13.3 0.69 0.3 x 10⁶ 0.08 11.50 4.15 1.68 13.5 0.68 1.6 x 10⁶ 0.42 11.50 20.80 8.39 13.6 0.68 2.3 x 10⁶ 0.83 11.50 41.65 11.010 14.0 0.67 4.5 x 10⁶ 1.66 11.50 83.00 18.0
and is useful to note for future experiments.
The molecular weight of the KcsA reference sample in lane 2 on both gels, recorded
as 13.5 kDa in Fig 3.12 a) and 14.30 kDa in Fig 3.12 b) is close to the molecular
weights of the KcsA measured in the spiked samples, ranging from 11.9 kDa to 15
kDa. This is convincing in terms of identifying the laced KcsA. In summary, the
data shows that while dilution is advantageous, it will not be feasible to detect CF
expressed KcsA using this method unless at least 4 µg of protein can be expressed
to allow for sufficient dilution, which remains an ambitious target for one 50 µl
volume of the CF system
3.2 Methods for bilayer formation and current
measurements
This section explains the methods used for forming lipid bilayers and for
obtaining ion channel measurements. The section is split into six parts, with the
first subsection explaining the general amplifier setup, the second detailing the
60 Chapter 3 Methods and preliminary work
formation of Ag/AgCl electrodes, the third describing the formation of aperture-
suspended lipid bilayers, and the fourth discussing the use of the regulated
attachment method for the formation of interdroplet bilayers. The fifth and
sixth sections describe the formation of free-standing interdroplet bilayers using
electrokinetic forces and by manual positioning.
3.2.1 Bilayer current amplifier
Bilayer current measurements were obtained using an Axon AxoPatch 200B Patch-
Clamp amplifier (Molecular Devices, USA) connected to a Digidata 1440A digitiser
(Molecular Devices, USA). The digitiser was connected to a PC via a USB
connection, allowing for the amplifier to be controlled using pClamp (Molecular
Devices, USA). The amplifier and digitiser were stored on the top of a steel storage
cabinet (500 mm x 820 mm x 500 mm) used as a Faraday cage. The size of the
cage allowed for a stereozoom microscope together with the relevant goniometer
and translation stages to be inserted for work with microdroplets. The whole unit
was connected to the ground port of the amplifier and placed on top of a Newport
RS1000 optical table, which was separately grounded using the mains electricity
supply. A retort stand fitted with a clamp was placed inside the Faraday Cage
to hold the CV 203BU headstage (Molecular Devices, USA), which connected
directly to the amplifier using a shielded cable. Single channel measurements
were obtained at a sampling rate of 50 kHz, filtered using a 5 kHz low-pass 8
pole Bessel filter and later digitally filtered with a 1 kHz low-pass digital filter.
Any additional filtering beyond this stage is indicated in the text. Capacitance
measurements were obtained by applying a linear voltage ramp under conditions
(triangle waveform; 500 Hz frequency, 1 mV peak-to-peak, i.e., ±1V/s voltage
ramp), where the measured current response (e.g., 100 pA) can be interpreted as
the bilayer capacitance (e.g., 100 pF).
3.2.2 Silver/silver chloride electrodes
Ag/AgCl electrodes were made in pairs by electroplating in 0.1 M HCl, as
illustrated in the schematic diagram in Fig 3.13. Two even lengths of silver wire
(Goodfellow, UK) were cut, soldered into a simple electrical circuit and immersed
in a container of HCl. Care was taken to ensure that the metal surface of the
wire remained untouched and that both wires were lowered into the HCl to the
same depth without touching each other. A Pt counter electrode was inserted into
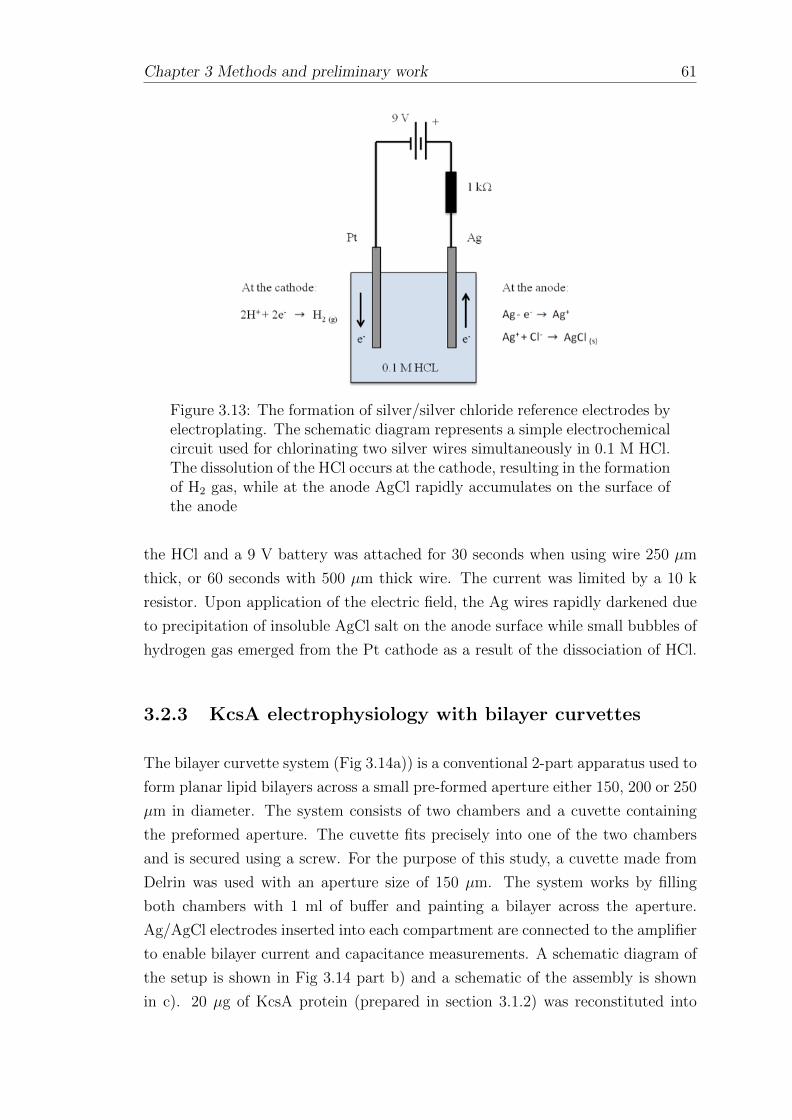
Chapter 3 Methods and preliminary work 61
Figure 3.13: The formation of silver/silver chloride reference electrodes byelectroplating. The schematic diagram represents a simple electrochemicalcircuit used for chlorinating two silver wires simultaneously in 0.1 M HCl.The dissolution of the HCl occurs at the cathode, resulting in the formationof H2 gas, while at the anode AgCl rapidly accumulates on the surface ofthe anode
the HCl and a 9 V battery was attached for 30 seconds when using wire 250 µm
thick, or 60 seconds with 500 µm thick wire. The current was limited by a 10 k
resistor. Upon application of the electric field, the Ag wires rapidly darkened due
to precipitation of insoluble AgCl salt on the anode surface while small bubbles of
hydrogen gas emerged from the Pt cathode as a result of the dissociation of HCl.
3.2.3 KcsA electrophysiology with bilayer curvettes
The bilayer curvette system (Fig 3.14a)) is a conventional 2-part apparatus used to
form planar lipid bilayers across a small pre-formed aperture either 150, 200 or 250
µm in diameter. The system consists of two chambers and a cuvette containing
the preformed aperture. The cuvette fits precisely into one of the two chambers
and is secured using a screw. For the purpose of this study, a cuvette made from
Delrin was used with an aperture size of 150 µm. The system works by filling
both chambers with 1 ml of buffer and painting a bilayer across the aperture.
Ag/AgCl electrodes inserted into each compartment are connected to the amplifier
to enable bilayer current and capacitance measurements. A schematic diagram of
the setup is shown in Fig 3.14 part b) and a schematic of the assembly is shown
in c). 20 µg of KcsA protein (prepared in section 3.1.2) was reconstituted into

62 Chapter 3 Methods and preliminary work
Figure 3.14: The bilayer cuvette method for planar bilayer formation. a) Aphotograph of the apparatus showing the bilayer curvette containing thepreformed aperture and the bilayer chamber. b) A schematic diagramof the method, showing the insertion of Ag/AgCl electrodes in eachcompartment and the formation of a lipid bilayer across an apertureseparating the two compartments. c) A schematic of the assembly, abicycle inner tube was inflated and placed at the bottom of the Faradaycage to minimise vibrations. A piece of wood positioned on top of thebicycle tyre was used as a base to which a small lab jack was screwed. Thebilayer cuvette system was fixed onto the lab jack via an acrylic stand,which was stuck onto the surface of the jack using a piece of double sidedtape. A retort stand with two clamps was used to secure the acrylicelectrode holder and the CV 203BU headstage.
DOPC/POPG vesicles as described in section 3.1.8. Pure POPG lipids were used
to form the bilayer, prepared to a final concentration of 20 mg/ml in n-decane.
The cis chamber was filled with 150 mM KCl, 10 mM HEPES pH 4.0 and the
trans chamber filled with 150 mM KCl, 10 mM HEPES pH 7.40. The bilayer was
formed by painting a small droplet of the lipid-oil solution over the aperture using
a pipette tip, followed by raising and lowering the buffer contained in the trans
compartment. Bilayer formation was indicated using capacitance measurements.
For ion channel measurements from reconstituted protein, a holding potential of
100 mV was applied and 2-5 µl of KcsA proteoliposomes was added into the trans
Chapter 3 Methods and preliminary work 63
chamber. If no activity was observed after ∼10 min, the bilayer was broken and
reformed by raising and lowering the buffer. This was repeated several times before
more vesicles were added. All measurements were obtained using a sampling rate
of 50 kHz and a low-pass 2 kHz Bessel filter.
Bilayer current measurements of reconstituted KcsA in the bilayer cuvette system
are shown in Fig 3.15. A 30 s segment of a recording obtained at 100 mV is
shown in a) where channel activity is indicated by a number spikes in the baseline
of approximately the same intensity. The single-channel events are more clearly
shown in the insert, revealing a number of non-periodic openings and closings in
the baseline of approximately 8 pA and a baseline noise of ∼1 pA peak-to-peak.
No channel activity was observed prior to the addition of vesicles. The histogram
in b) of the figure shows a dense population of data points at ∼1.5 pA and a much
smaller number of events at ∼9.5 pA. Single-channel analysis of the data indicates
that the average opening amplitude was 6.8 ±0.64 pA, the dwell time was 4.15
ms and the opening probability was 0.21, results which fit closely with previously
reported measurements for KcsA (LeMasurier et al., 2001).
A sample trace obtained at -100 mV is shown in part c) of the figure. In this
instance, the channel openings are observed as negative spikes in the baseline,
identified more clearly by the zoomed region. In this example, channel openings
are associated with an increased amount of baseline noise, which is consistent with
previous observations with recordings at negative potentials (Cuello et al.). The
histogram in part d) of the figure reveals a very small population of data points
at ∼-6 pA and a large number of points at ∼0.5 pA. Analysis of the burst shown
in the figure revealed an average opening amplitude of -6.3 ±1.3 pA, a dwell time
of 3.29 ms and an opening probability of 0.18. While slightly high, this figure
for the average opening amplitude is close to what has been observed previously
for KcsA in the literature (2.4.1) and still remains lower than the value obtained
at 100 mV, indicating that the channel is displaying weak outward rectification,
which is consistent with previous reports.
The measurement at 100 mV was repeated in part e) but with the concentration
of KCl in the trans chamber increased to 750 mM. The 30 s trace shows that
this resulted in single channel events with a greater opening amplitude than those
shown in part a). The histogram in part f) shows a small population of data points
at ∼27 pA and a dense number of points at ∼2.5 pA. Single channel analysis of the
burst shown in the insert revealed an average opening amplitude of 22.51 ±2.42
pA a dwell time of 2.51 ms and an open probability of 0.13. These measurements

64 Chapter 3 Methods and preliminary work
are in line with previous reports at high potassium concentrations (LeMasurier
et al., 2001), however the channel openings were unexpectedly brief.
In summary, the data in this subsection verifies both the low-noise performance
of the apparatus and the preparation of the His-tagged KcsA protein, expressed
in vivo from the same DNA template used to supply the CF system in Chapters
5 and 6.
Figure 3.15: KcsA electrophysiology in bilayer cuvettes. Measurements ofin vivo expressed and reconstituted KcsA were performed at a-b) 100 mV,c-d) -100 mV and e-f)) 100 mV with the KCl concentration of the transchamber increased to 750 mM. The figure shows KcsA activity, verifyingthe KcsA preparation and the low-noise performance of the apparatus.The arrows in the histograms indicate the positions of small peaks.
Chapter 3 Methods and preliminary work 65
3.2.4 Interdroplet bilayer formation using the regulated
attachment method
The regulated attachment method (RAM) for forming lipid bilayers has been
described previously using a flexible PDMS substrate (Sarles and Leo, 2010b)
and is introduced in section 2.1.4. The device, shown in Fig 3.16 a)-b) essentially
consists of a tablet-shaped piece of PDMS containing a well, with two smaller
slightly overlapping wells in the centre. The well was filled with oil and a small
volume of an aqueous vesicle dispersion was added to the small wells which are
pierced with Ag/AgCl electrodes (Fig 3.16 c) part 1). Bilayer formation was
achieved by manually compressing and releasing the device, causing the aperture
separating two small chambers to close and open. This caused the initial volume
of aqueous vesicles, enclosed by a monomer of lipids, to be split into two smaller
droplets (Fig 3.16 c) part 2). The lipid bilayer is formed when the two droplets, now
each encased by a monolayer of lipids, come into contact when the aperture opens
(Fig 3.16 c) part 3). The extent of the aperture opening allows for the attachment
of the two droplets, and thus the size of the lipid bilayer, to be regulated as shown
in Fig 3.16 d).
This method of bilayer formation is interesting as the control over the bilayer size
should allow the level of membrane incorporation to be dictated. Specifically, for
the purposes of this project, this functionality may also be helpful for stabilising
the bilayer in the presence of high concentrations of membrane perturbants, such
as those expected to be present in a CF mixture (as introduced in section 2.1.4
and discussed in 4.4).
In this section, a customised version of the flexible PDMS device is engineered
using 3D printed moulds. The data shown in the results and discussion section
was obtained by an MSc student, Bandar Alfaifi, who was supervised as part of
this study. Undergraduate students who worked on the project previously, found
that it was easier to deform the PDMS substrate by rotating the device features by
90 degrees, resulting in the compression along the width of the device rather than
the length. Moulds of both designs with different aperture sizes and a contraption
for manually deforming the PDMS device were made for the MSc project student.
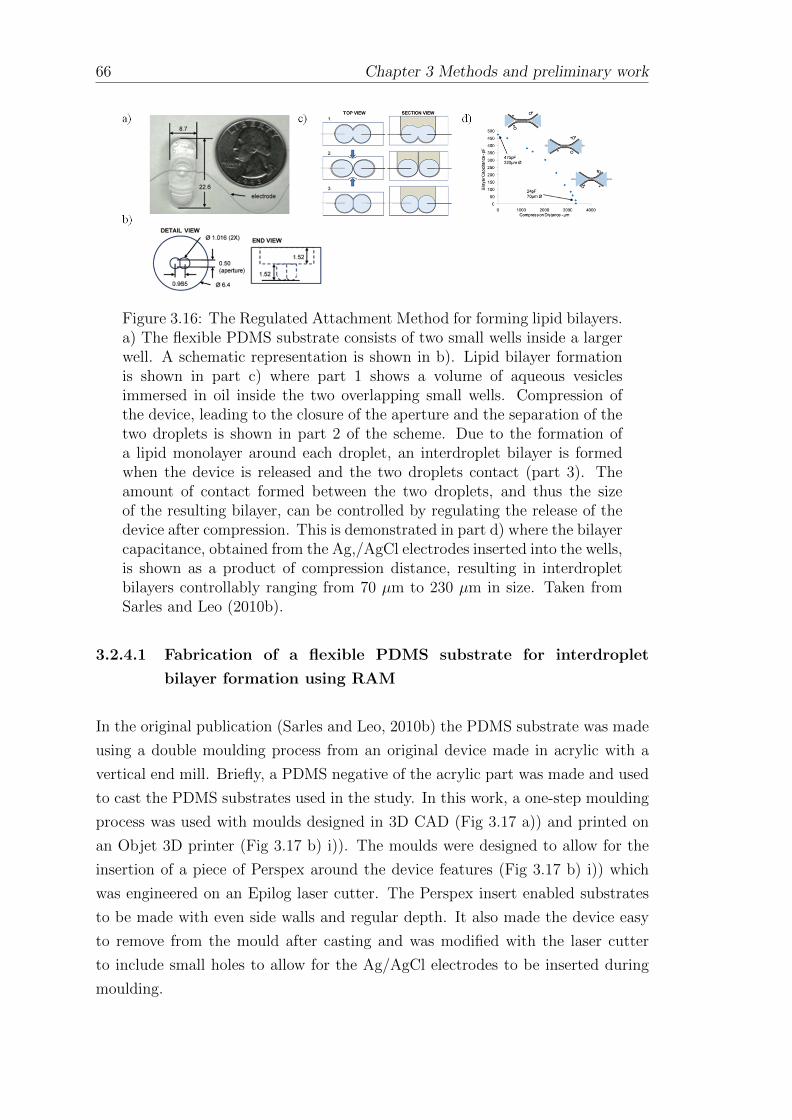
66 Chapter 3 Methods and preliminary work
Figure 3.16: The Regulated Attachment Method for forming lipid bilayers.a) The flexible PDMS substrate consists of two small wells inside a largerwell. A schematic representation is shown in b). Lipid bilayer formationis shown in part c) where part 1 shows a volume of aqueous vesiclesimmersed in oil inside the two overlapping small wells. Compression ofthe device, leading to the closure of the aperture and the separation of thetwo droplets is shown in part 2 of the scheme. Due to the formation ofa lipid monolayer around each droplet, an interdroplet bilayer is formedwhen the device is released and the two droplets contact (part 3). Theamount of contact formed between the two droplets, and thus the sizeof the resulting bilayer, can be controlled by regulating the release of thedevice after compression. This is demonstrated in part d) where the bilayercapacitance, obtained from the Ag,/AgCl electrodes inserted into the wells,is shown as a product of compression distance, resulting in interdropletbilayers controllably ranging from 70 µm to 230 µm in size. Taken fromSarles and Leo (2010b).
3.2.4.1 Fabrication of a flexible PDMS substrate for interdroplet
bilayer formation using RAM
In the original publication (Sarles and Leo, 2010b) the PDMS substrate was made
using a double moulding process from an original device made in acrylic with a
vertical end mill. Briefly, a PDMS negative of the acrylic part was made and used
to cast the PDMS substrates used in the study. In this work, a one-step moulding
process was used with moulds designed in 3D CAD (Fig 3.17 a)) and printed on
an Objet 3D printer (Fig 3.17 b) i)). The moulds were designed to allow for the
insertion of a piece of Perspex around the device features (Fig 3.17 b) i)) which
was engineered on an Epilog laser cutter. The Perspex insert enabled substrates
to be made with even side walls and regular depth. It also made the device easy
to remove from the mould after casting and was modified with the laser cutter
to include small holes to allow for the Ag/AgCl electrodes to be inserted during
moulding.

Chapter 3 Methods and preliminary work 67
Before casting the PDMS, the 3D printed moulds were treated with reactive oxygen
plasma to render the surface more hydrophobic for the attachment of a silane.
This was achieved using 2 µl of tricholorosilane (Sigma-Aldrich, USA), which was
deposited on a glass slide with the moulds inside a vacuum desiccator. Uncured
Sylgard 184 (Dow-Corning) PDMS (10:1 wt-wt ratio of base to curing agent) was
prepared in a plastic cup and fully degassed inside a vacuum desiccator before being
poured into the moulds shown in Fig 3.17 b) part ii). The moulds were transferred
to a 90 ◦C oven, for 10 minutes and two pieces of silver wire were inserted into
the mould using the holes engineered in the Perspex insert. The assembly was
returned to the oven for a further 30 minutes before the wires were removed from
the cast, which was released from the mould by removing the Perspex insert with
a pair of pliers. The cast could then be easily ‘popped out’ of the Perspex for
any excess PDMS to be removed using a scalpel before fresh Ag/AgCl electrodes
were re-inserted into the device. Examples of two different designs of the PDMS
platform fabricated using this method are shown in part c) of Fig 3.17, where the
photographs to the left show the final device and the images in the middle focus
on the centre of the substrate, highlighting the different positions of the two sets of
wells. The images to the right of the image magnify the inner wells, allowing both
the aperture and the position of the Ag/AgCl electrodes to be clearly visualised.
A device was also designed in 3D CAD and 3D printed for deforming the flexible
PDMS substrate manually. The operating principle was that the amount of
displacement could be controlled by two nylon screws that are tightened to deform
the PDMS substrate, provided that it is securely clamped in position. The design,
included in Fig 3.17 d) part i), shows a base plate containing a stage for the PDMS
substrate to be positioned, two holes for screws, guides for the Ag/AgCl electrodes
and some small pillars for securing a Perspex bracket. Soft print material was used
inside the stage to promote adhesion with the PDMS device and adequate spacing
was left for the movement of the screws. Some tolerance was also included to
account for the PDMS expanding. The Perspex bracket, used to fasten the PDMS
into position was made on an Epilog laster cutter. To maximise grip, the shape
of the PDMS device was etched into the bottom surface of the bracket. Perspex
was chosen as the build material over the 3DP print material for the brackets due
to its mechanical strength (3D printed brackets tended to deform over time). The
final assembled device is shown in Fig 3.17 d) part ii).
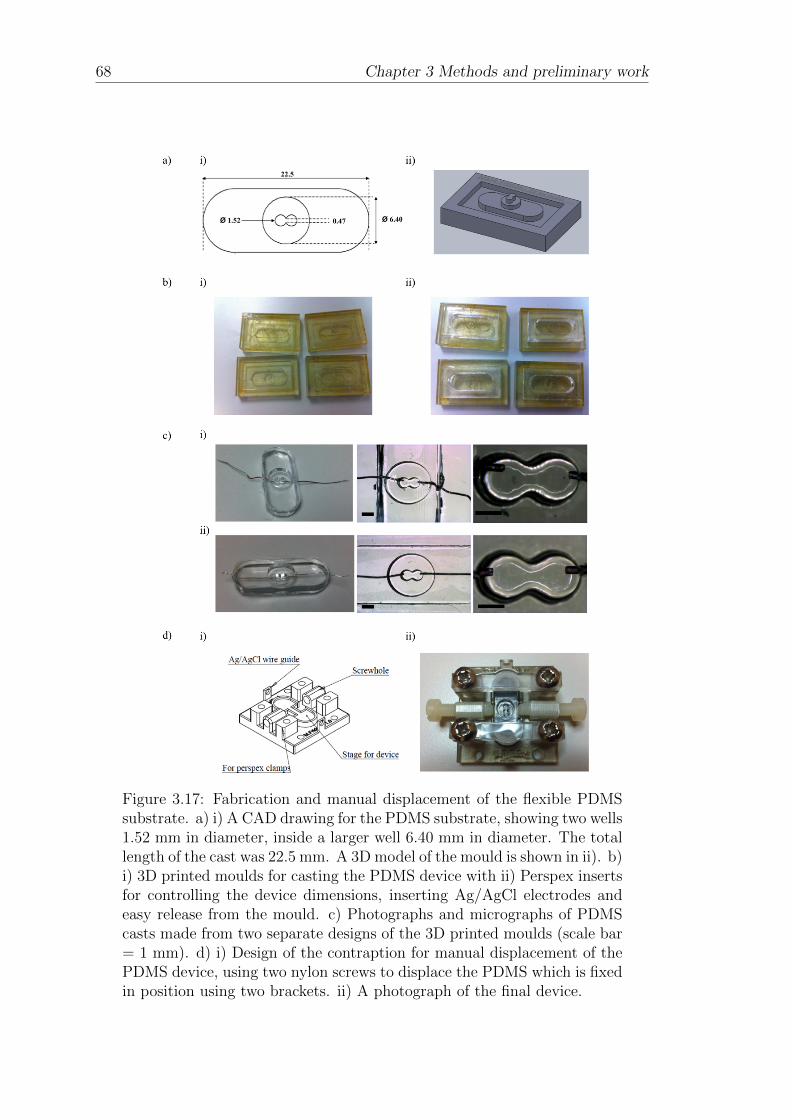
68 Chapter 3 Methods and preliminary work
Figure 3.17: Fabrication and manual displacement of the flexible PDMSsubstrate. a) i) A CAD drawing for the PDMS substrate, showing two wells1.52 mm in diameter, inside a larger well 6.40 mm in diameter. The totallength of the cast was 22.5 mm. A 3D model of the mould is shown in ii). b)i) 3D printed moulds for casting the PDMS device with ii) Perspex insertsfor controlling the device dimensions, inserting Ag/AgCl electrodes andeasy release from the mould. c) Photographs and micrographs of PDMScasts made from two separate designs of the 3D printed moulds (scale bar= 1 mm). d) i) Design of the contraption for manual displacement of thePDMS device, using two nylon screws to displace the PDMS which is fixedin position using two brackets. ii) A photograph of the final device.

Chapter 3 Methods and preliminary work 69
3.2.4.2 Lipid bilayer formation in RAM devices
Experiments were initially conducted using 5 µl of 150 mM KCl, 10 mM HEPES,
pH 7.40 as the aqueous volume and 40 µl of 20 mg/ml asolectin in hexadecane
as the oil phase. An interdroplet bilayer was formed by closing and releasing the
aperture through manual compression of the PDMS substrate. The device was
subsequently placed on the stage of a stereozoom microscope for imaging.
One problem with this method was the tendency of the PDMS to absorb the
solvent, resulting in the oil escaping the well and the droplets merging. It was
observed that the problem was worse when using decane instead of hexadecane
and that immersing the PDMS casts in different solvents resulted in significant
expansion of the devices. Devices soaked in decane were the most affected and were
unusable, while those soaked in hexadecane were swollen but retained functionality.
Subsequent experiments were therefore performed after pre-soaking the device for
24 hours in hexadecane. Interdroplet bilayers formed this way were found to last
for several hours compared to 5-10 minutes without pre-soaking.
It was found that when the PDMS device was used with one droplet, as originally
described, it took time for the aqueous volume to evenly disperse across both wells,
as shown in Fig 3.18 a). One drawback of this method was that it was generally
found to be more challenging to obtain an interdroplet bilayer in the centre of
Figure 3.18: Interdroplet bilayer formation using the RAM method. a)An interdroplet bilayer is formed from a 5 µl droplet, which is dispensedinto a well and allowed to spread across the surface. The droplets areseparated by compression of the device, resulting in the closure of theaperture. An interdroplet bilayer is formed when the device is released. b)An interdroplet bilayer is formed when a 2.5 µl droplet was inserted intoeach well and left to form contact. The method shown in b) was found tobe quicker and easier than in a). The diameter of the wells was 1.52 mm.The data in the figure was obtained from Alfaifi (2013).
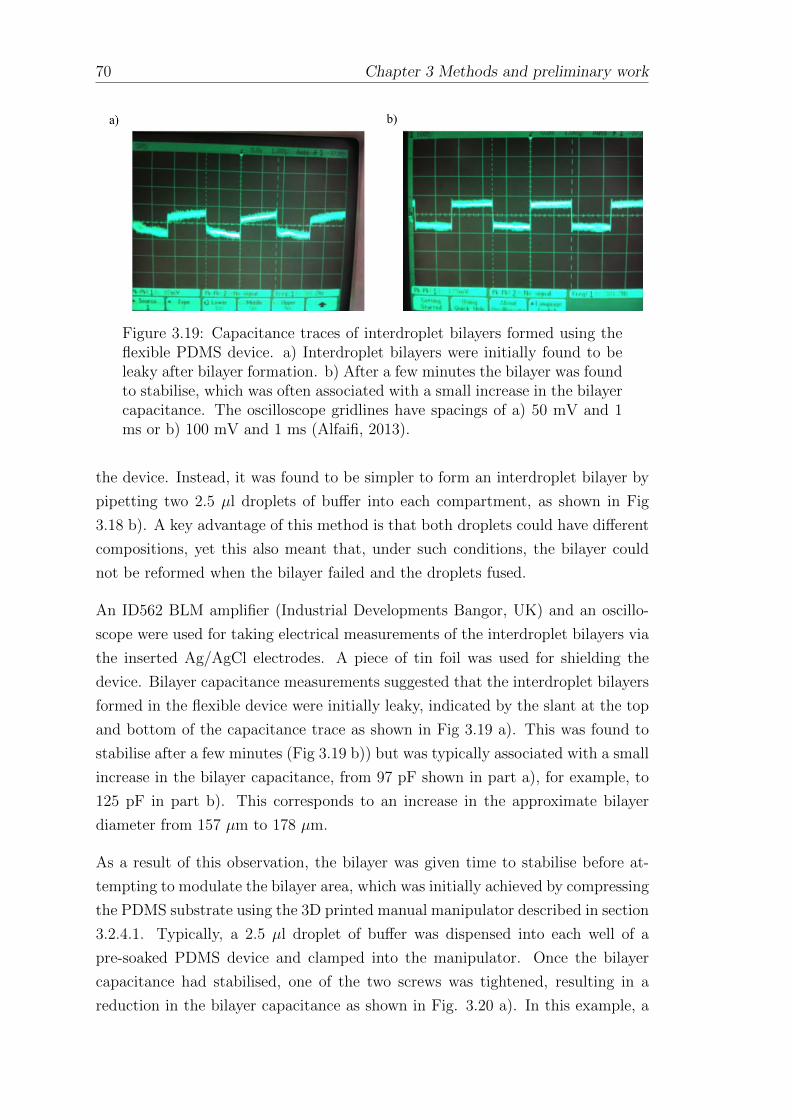
70 Chapter 3 Methods and preliminary work
Figure 3.19: Capacitance traces of interdroplet bilayers formed using theflexible PDMS device. a) Interdroplet bilayers were initially found to beleaky after bilayer formation. b) After a few minutes the bilayer was foundto stabilise, which was often associated with a small increase in the bilayercapacitance. The oscilloscope gridlines have spacings of a) 50 mV and 1ms or b) 100 mV and 1 ms (Alfaifi, 2013).
the device. Instead, it was found to be simpler to form an interdroplet bilayer by
pipetting two 2.5 µl droplets of buffer into each compartment, as shown in Fig
3.18 b). A key advantage of this method is that both droplets could have different
compositions, yet this also meant that, under such conditions, the bilayer could
not be reformed when the bilayer failed and the droplets fused.
An ID562 BLM amplifier (Industrial Developments Bangor, UK) and an oscillo-
scope were used for taking electrical measurements of the interdroplet bilayers via
the inserted Ag/AgCl electrodes. A piece of tin foil was used for shielding the
device. Bilayer capacitance measurements suggested that the interdroplet bilayers
formed in the flexible device were initially leaky, indicated by the slant at the top
and bottom of the capacitance trace as shown in Fig 3.19 a). This was found to
stabilise after a few minutes (Fig 3.19 b)) but was typically associated with a small
increase in the bilayer capacitance, from 97 pF shown in part a), for example, to
125 pF in part b). This corresponds to an increase in the approximate bilayer
diameter from 157 µm to 178 µm.
As a result of this observation, the bilayer was given time to stabilise before at-
tempting to modulate the bilayer area, which was initially achieved by compressing
the PDMS substrate using the 3D printed manual manipulator described in section
3.2.4.1. Typically, a 2.5 µl droplet of buffer was dispensed into each well of a
pre-soaked PDMS device and clamped into the manipulator. Once the bilayer
capacitance had stabilised, one of the two screws was tightened, resulting in a
reduction in the bilayer capacitance as shown in Fig. 3.20 a). In this example, a
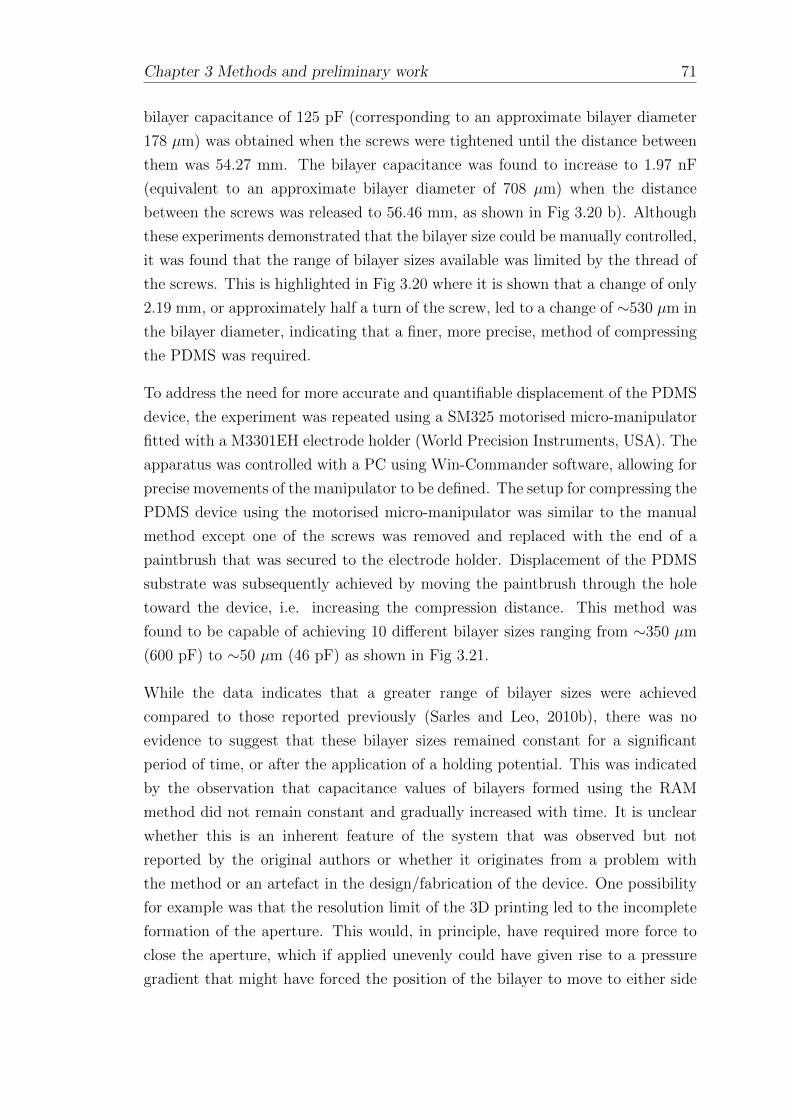
Chapter 3 Methods and preliminary work 71
bilayer capacitance of 125 pF (corresponding to an approximate bilayer diameter
178 µm) was obtained when the screws were tightened until the distance between
them was 54.27 mm. The bilayer capacitance was found to increase to 1.97 nF
(equivalent to an approximate bilayer diameter of 708 µm) when the distance
between the screws was released to 56.46 mm, as shown in Fig 3.20 b). Although
these experiments demonstrated that the bilayer size could be manually controlled,
it was found that the range of bilayer sizes available was limited by the thread of
the screws. This is highlighted in Fig 3.20 where it is shown that a change of only
2.19 mm, or approximately half a turn of the screw, led to a change of ∼530 µm in
the bilayer diameter, indicating that a finer, more precise, method of compressing
the PDMS was required.
To address the need for more accurate and quantifiable displacement of the PDMS
device, the experiment was repeated using a SM325 motorised micro-manipulator
fitted with a M3301EH electrode holder (World Precision Instruments, USA). The
apparatus was controlled with a PC using Win-Commander software, allowing for
precise movements of the manipulator to be defined. The setup for compressing the
PDMS device using the motorised micro-manipulator was similar to the manual
method except one of the screws was removed and replaced with the end of a
paintbrush that was secured to the electrode holder. Displacement of the PDMS
substrate was subsequently achieved by moving the paintbrush through the hole
toward the device, i.e. increasing the compression distance. This method was
found to be capable of achieving 10 different bilayer sizes ranging from ∼350 µm
(600 pF) to ∼50 µm (46 pF) as shown in Fig 3.21.
While the data indicates that a greater range of bilayer sizes were achieved
compared to those reported previously (Sarles and Leo, 2010b), there was no
evidence to suggest that these bilayer sizes remained constant for a significant
period of time, or after the application of a holding potential. This was indicated
by the observation that capacitance values of bilayers formed using the RAM
method did not remain constant and gradually increased with time. It is unclear
whether this is an inherent feature of the system that was observed but not
reported by the original authors or whether it originates from a problem with
the method or an artefact in the design/fabrication of the device. One possibility
for example was that the resolution limit of the 3D printing led to the incomplete
formation of the aperture. This would, in principle, have required more force to
close the aperture, which if applied unevenly could have given rise to a pressure
gradient that might have forced the position of the bilayer to move to either side
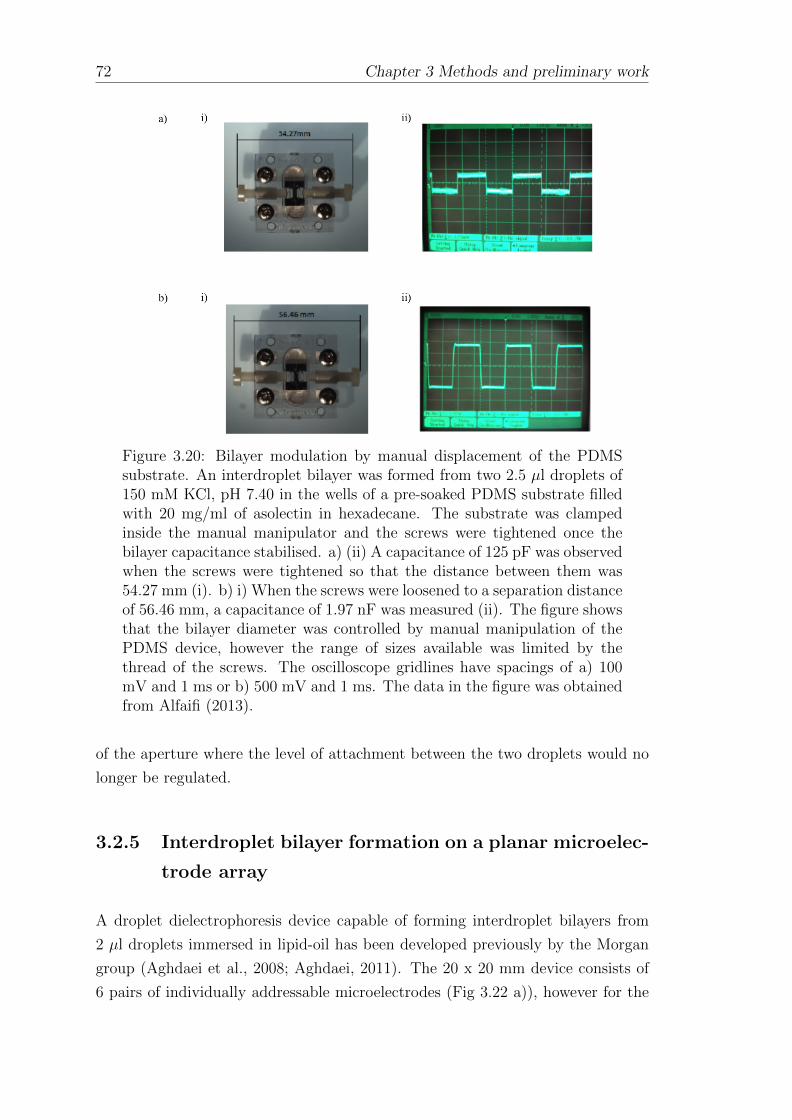
72 Chapter 3 Methods and preliminary work
Figure 3.20: Bilayer modulation by manual displacement of the PDMSsubstrate. An interdroplet bilayer was formed from two 2.5 µl droplets of150 mM KCl, pH 7.40 in the wells of a pre-soaked PDMS substrate filledwith 20 mg/ml of asolectin in hexadecane. The substrate was clampedinside the manual manipulator and the screws were tightened once thebilayer capacitance stabilised. a) (ii) A capacitance of 125 pF was observedwhen the screws were tightened so that the distance between them was54.27 mm (i). b) i) When the screws were loosened to a separation distanceof 56.46 mm, a capacitance of 1.97 nF was measured (ii). The figure showsthat the bilayer diameter was controlled by manual manipulation of thePDMS device, however the range of sizes available was limited by thethread of the screws. The oscilloscope gridlines have spacings of a) 100mV and 1 ms or b) 500 mV and 1 ms. The data in the figure was obtainedfrom Alfaifi (2013).
of the aperture where the level of attachment between the two droplets would no
longer be regulated.
3.2.5 Interdroplet bilayer formation on a planar microelec-
trode array
A droplet dielectrophoresis device capable of forming interdroplet bilayers from
2 µl droplets immersed in lipid-oil has been developed previously by the Morgan
group (Aghdaei et al., 2008; Aghdaei, 2011). The 20 x 20 mm device consists of
6 pairs of individually addressable microelectrodes (Fig 3.22 a)), however for the

Chapter 3 Methods and preliminary work 73
Figure 3.21: Bilayer modulation by motorised displacement of the PDMSsubstrate. An interdroplet bilayer was formed by pipetting two 2.5 µldroplets of 150 mM KCl, 10 mM HEPES, pH 7.40 into the wells of apre-soaked PDMS device filled with 20 mg/ml of asolectin in hexadecane.The PDMS cast was clamped inside the manual manipulator compressedwith the end of a paintbrush attached to a motorised micro-manipulator.The compression distance was controlled using a PC. a) When theaperture is fully open the bilayer capacitance was measured at 3.39 nF,which approximates to a bilayer diameter of 929 µm. b) When thecompression distance was increased the bilayer capacitance reduced to1.91 nF, indicating a bilayer with an approximate diameter of 697 µm.c) Further compression of the device resulted in a bilayer capacitance of300 pF, equivalent to an approximate bilayer diameter of 276 µm. Thedata points show the reduction of the bilayer diameter with compressiondistance, from 356 µm to 46 µm. The figure was modified from Alfaifi(2013).
purpose of forming interdroplet bilayers with two droplets, only two pairs of the
outer 1,1 and 4,4 electrodes are required (Fig 3.22 b)).
The microelectrode array described in Aghdaei et al. (2008) was fabricated by
patterning an evaporated Ti/Pt layer (10/200 nm thick) by ion beam milling,
before a 700 nm thick SU-8 insulating layer was applied. Droplet manipulation
was achieved when a 2 kHz sinusoidal waveform, with a peak-to-peak intensity
of 10 V, was applied to the outer electrodes 1,1 and 4,4, which captured the
droplets and focused them toward the centre of the device. In this position the

74 Chapter 3 Methods and preliminary work
two pairs of inner electrodes (2,2 and 3,3) were activated and agar coated Ag/AgCl
electrodes were inserted into each droplet. The signal intensity was then reduced
to 2 V peak-to-peak and the outer electrodes turned off, causing the droplets to
move into the centre of device and make contact. The formation of an interdroplet
bilayer was verified by capacitance measurements and the method was also verified
by obtaining recordings of gramicidin and KcsA (Aghdaei et al., 2008).
The specific workings of the device are detailed in a previous study by Aghdaei
(2011). Briefly, when a signal is applied, the SU-8 insulating surface becomes
charged. The charge distribution is governed by the geometry of the microelec-
trodes, which were designed (Dr. Nicolas Green, University of Southampton) to
generate a divergent electrical field that increases towards the centre of the device.
The polar droplet becomes polarised in response to the electric field, resulting in
the migration of charges and the formation of a dipole. A secondary effect, caused
by the divergence of the electrical field then arises which causes in an imbalance of
charges acting on the droplet and initiates droplet movement (Fig 3.22 d)). The
droplet thus travels toward the centre of the device as dictated by the electrical
field gradient.
3.2.5.1 Fabrication of planar microelectrode arrays
Devices were fabricated on 6′′ glass wafers as described by Aghdaei et al, with
minor modifications to the photoresist application. Electrode structures were
formed by patterning an evaporated Ti/Pt layer (10/200 nm thick) by ion beam
milling by Katie Chamberlain in the Southampton Nanofabrication Centre (SNC).
Wafers were diced into 20 x 20 mm chips and cleaned with fuming nitric acid,
acetone and isopropanol prior to overnight baking at 150 ◦C. A piece of Kapton
tape was applied to protect the contact pads before spin coating Ti Prime adhesion
promoter at 3000 RPM for 20 s and baking at 120 ◦C for 2 min. Two layers of
the negative photoresist SU-8 2000.5 were then deposited by spin coating at 6000
RPM for 30 s, followed by soft-baking at 95 ◦C for 1 min. The SU-8 was cross-
linked by flood exposure to UV light for 10 s at an intensity of 11.85 mJ/cm2 ,
followed by post-exposure baking at 95 ◦C for 2 min, and by hard baking at 150◦C for 20 min. This procedure produced a 0.5 µm thick SU-8 film, verified using
a profilometer, which served as the dielectric that is required for electrokinetic
droplet manipulation on planar electrodes.
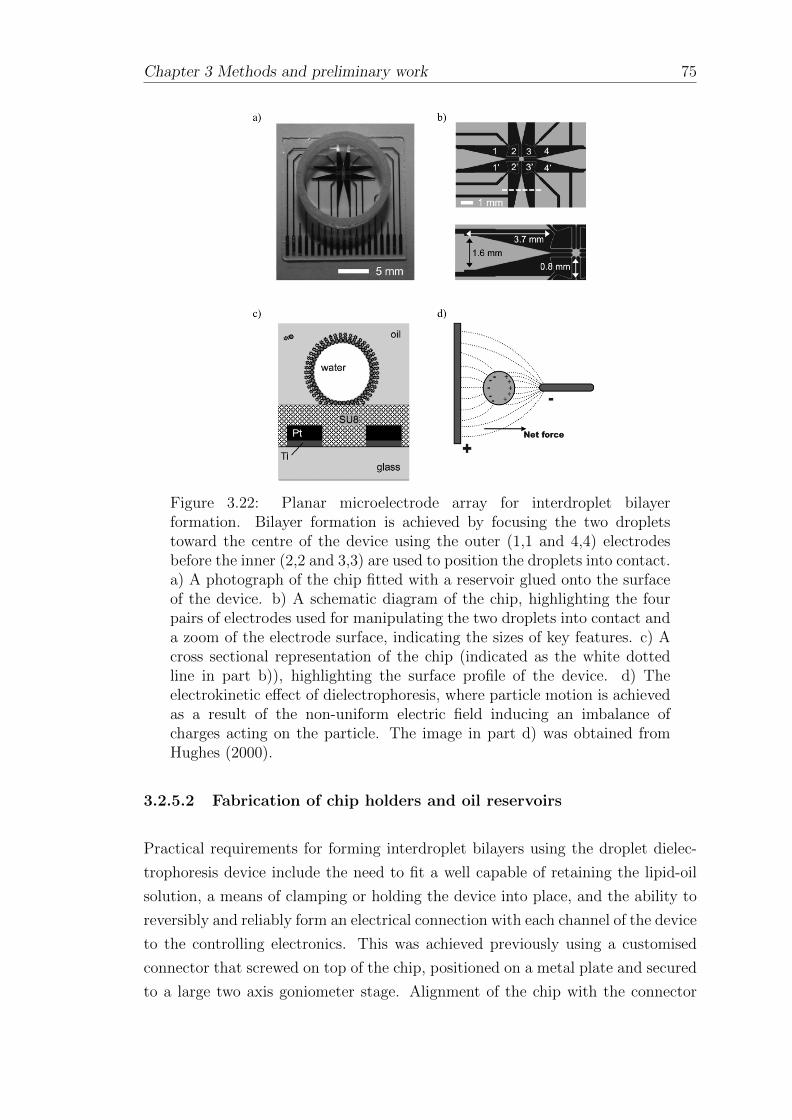
Chapter 3 Methods and preliminary work 75
Figure 3.22: Planar microelectrode array for interdroplet bilayerformation. Bilayer formation is achieved by focusing the two dropletstoward the centre of the device using the outer (1,1 and 4,4) electrodesbefore the inner (2,2 and 3,3) are used to position the droplets into contact.a) A photograph of the chip fitted with a reservoir glued onto the surfaceof the device. b) A schematic diagram of the chip, highlighting the fourpairs of electrodes used for manipulating the two droplets into contact anda zoom of the electrode surface, indicating the sizes of key features. c) Across sectional representation of the chip (indicated as the white dottedline in part b)), highlighting the surface profile of the device. d) Theelectrokinetic effect of dielectrophoresis, where particle motion is achievedas a result of the non-uniform electric field inducing an imbalance ofcharges acting on the particle. The image in part d) was obtained fromHughes (2000).
3.2.5.2 Fabrication of chip holders and oil reservoirs
Practical requirements for forming interdroplet bilayers using the droplet dielec-
trophoresis device include the need to fit a well capable of retaining the lipid-oil
solution, a means of clamping or holding the device into place, and the ability to
reversibly and reliably form an electrical connection with each channel of the device
to the controlling electronics. This was achieved previously using a customised
connector that screwed on top of the chip, positioned on a metal plate and secured
to a large two axis goniometer stage. Alignment of the chip with the connector

76 Chapter 3 Methods and preliminary work
was achieved visually and the oil was retained by gluing part of a 5 ml pipette tip
to the chip surface. A ribbon cable attached the connector to a switchbox which
was in turn connected to the output of a wideband amplifier, used to increase the
intensity of signals generated by a function generator. An oscilloscope was used
to verify the output.
A PCB was designed by Dr. Marta Lombardini (University of Southampton) to
fit a surface SMT mount, one piece 20 pin connector (SEI Series, Samtec). 2 mm
holes in the PCB were integrated into the design to match the 2 mm threaded
holes positioned on each end of the connector. Matching holes were also included
in the design for an alignment tray (Fig 3.23 a)), which was printed to position the
electrodes in line with the connector. The assembly was secured together using 2
mm screws as shown in Fig 3.23 b).
In order to avoid the use of glue on the chip surface, two designs were made to
secure the device and retain the oil. The first consisted of a PDMS cast made from
a 3D printed mould (Fig 3.23 c)-d)), where the choice of material was motivated by
the possibility of integrating microfluidics such as a droplet generator or channel.
A mould was designed to include a frame for the chip to be inserted and a hole
for the oil to be added (Fig 3.23 e)-f)). A housing was designed and 3D printed
for the PDMS cast to be secured and to also allow for the chip/PCB assembly to
be attached using the 2 mm screws (Fig 3.23 g)-h)). A 3D printed bracket was
used to create a seal between the PDMS cast and the chip to prevent the oil from
leaking (Fig 3.23 h)). One general observation was that it was difficult to keep the
platform flat when using this setup, however the key limitation was the tendency
of the PDMS to absorb the oil and become deformed, leading to leakage. This
approach was abandoned after it was found that reducing the size of the well did
not significantly improve the problem.
The second design incorporated the same chip/PCB assembly used for the PDMS
setup (Fig 3.23 b)), however in this instance the alignment tray fitted into a recess
designed into a 3D printed baseplate (Fig 3.24 a)). The plate was designed to
fit onto a small GNL 20 dual axis goniometer stage (ThorLabs, Germany), and
included two 1.8 mm holes positioned for the attachment of a 3D printed gasket
(Fig 3.24 c)-f)).
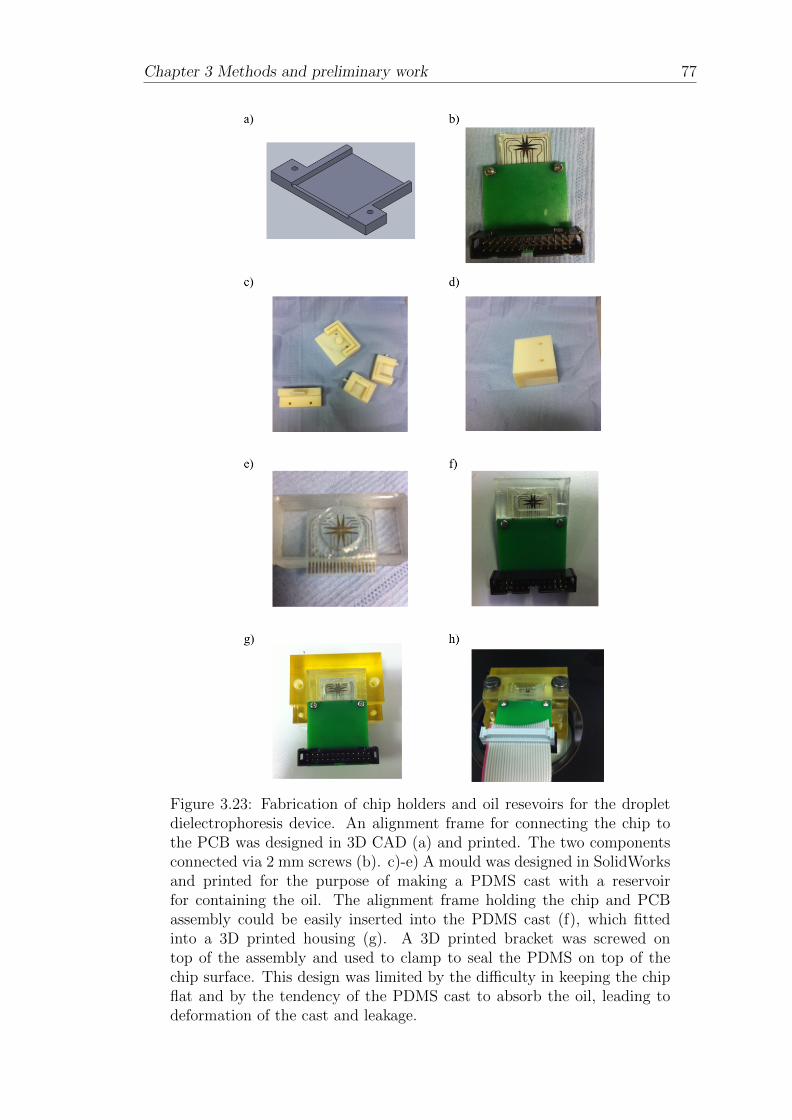
Chapter 3 Methods and preliminary work 77
Figure 3.23: Fabrication of chip holders and oil resevoirs for the dropletdielectrophoresis device. An alignment frame for connecting the chip tothe PCB was designed in 3D CAD (a) and printed. The two componentsconnected via 2 mm screws (b). c)-e) A mould was designed in SolidWorksand printed for the purpose of making a PDMS cast with a reservoirfor containing the oil. The alignment frame holding the chip and PCBassembly could be easily inserted into the PDMS cast (f), which fittedinto a 3D printed housing (g). A 3D printed bracket was screwed ontop of the assembly and used to clamp to seal the PDMS on top of thechip surface. This design was limited by the difficulty in keeping the chipflat and by the tendency of the PDMS cast to absorb the oil, leading todeformation of the cast and leakage.

78 Chapter 3 Methods and preliminary work
The gasket was designed as a rectangular window that included a narrow trench,
positioned in the centre of the frame and running alongside the bottom surface of
the structure (Fig 3.24 b)). The trench was filled with a rectangular ring, designed
in Solidworks and printed with the soft, Tango Black, build material. The concept
was that the soft build material would extend beyond the bottom surface of the
frame and form a seal with the surface of the chip (Fig 3.24 c)-d) & f)). The
gasket was designed with two 2 mm holes to allow the assembly to be fitted to the
3D printed baseplate (Fig 3.24 a)).
Figure 3.24: Fabrication of chip holders and oil reservoirs for the dropletdielectrophoresis device. a) A baseplate was designed and printed to housethe alignment frame/chip/PCB assembly. b) A 3D printed gasket wasengineered with a rectangular ring of soft build material extruded fromthe base to make a seal with the chip surface. The baseplate was fittedonto the top of a small dual axis goniometer stage (c)-f)) and fitted with thegasket which was designed to screw into the baseplate, forming a reservoiraround the focusing electrodes (c),d) & f)).

Chapter 3 Methods and preliminary work 79
It was found that the method worked well for retaining the oil but was not
consistently reliable. For example, the setup would occasionally leak when the
gasket was secured unevenly or as a result of the structure deforming under
the applied stress from the screws. For this reason the 3D printed gasket was
eventually replaced with a reservoir made from a pipette tip and glued to the chip
surface as described by Aghdaei. While this method resulted in some spoiling of
the chips, it was found to be the most reliable method for containing the oil.
3.2.5.3 Interdroplet bilayer formation using the planar microelecrode
array
A schematic diagram of the apparatus used for forming interdroplet bilayers using
the droplet dielectrophoresis device is shown in Fig 3.25.
For gramicidin measurements, 1 mg of gramicidin was dissolved in 1 ml of
analytical grade ethanol and serial diluted to a final concentration of 1 ng/ml.
The solution was subsequently diluted in buffer (150 mM KCl, 10 mM HEPES,
pH 7.40) until the desired concentration was achieved. Alpha haemolysin was
similarly prepared and the KcsA was used directly from the reconstituted sample
used in 3.2.3.
A common problem when first attempting to achieve droplet motion was the
observation of air bubbles emanating from the droplet. This was most likely
caused by the hydrolysis of water into gaseous hydrogen and oxygen as a result of
a hole in the SU-8 layer and the droplet coming into contact with an exposed part
of the metalised chip surface. This explanation was supported by the observation
of the bubbles appearing more rapidly when the intensity of the applied signal was
increased and vice versa. To avoid damaging the spade shaped electrodes (See Fig
3.22 part b)), droplet motion was first developed using a similar chip with square
shaped inner electrodes.
When investigating the problem it was established that the holes in the SU-8
layer occurred due to the SU-8 being deposited unevenly, either as a result of
contamination of the chips before spin coating and/or from a problem with the spin
coating process itself. The concern with the latter arose due to the unavailability
of a chuck capable of spinning small wafer fragments. Several short-term solutions
were tested, including 1) using a larger chuck with a 6′′ plastic wafer to which the
chip was stuck using dicing tape, and 2) positioning the chip directly on top of
the rotor without a chuck at all (as suggested by Katie Chamberlain, University

80 Chapter 3 Methods and preliminary work
of Southampton). Difficulties with the first method included positioning the chip
in the centre of the 6′′ wafer and removing the device from the tape, while the
second method frequently caused vacuum failure of the spin coater, resulting in the
chips flying off the rotor during processing. Despite this limitation, it was found
that the overall quality of the SU-8 layer (identified as a reduction in the amount
of hydrolysis observed) was significantly improved when this method was used in
combination with placing the chips in clean petri dishes for overnight drying before
the application of the resist. Here, it stands to reason that particles contained in
the drying oven were accumulating on the chip surface and led to cracks in the
SU-8 layer when it was deposited on top. Despite the problems encountered,
some devices were successfully engineered this way without the vacuum failing
and droplet motion was achieved without the observation of hydrolysis (Fig 3.26
a)-e)). The damage to the instrument was later fixed and an adequately sized
Figure 3.25: Schematic diagram for performing electrophysiology using theplanar microelectrode array. An inflated bicycle inner-tube was positionedinside the Faraday cage underneath a piece of wood used as a base.The dual axis gonoimeter stage containing the assembled chip, PCB andgasket was secured in the centre of the cage, within the field of view of astereozoom microscope. Retort stands with claps were positioned eitherside of the stage and clamped translation stages in place for loweringAg/AgCl electrodes into the gasket. Gold plated wires connected theAg/AgCl electrodes to the headstage which connected to the amplifier viaa shielded wire. A ribbon cable connected the PCB attached to the chipto a switchbox, that was fed the output of an amplifier that was used tointensify the signal emitted by a function generator. The signal was verifiedusing an oscilloscope and the output of the amplifier was controlled by aPC via a digitiser.

Chapter 3 Methods and preliminary work 81
chuck was purchased for the spin coater.
Droplet motion was first achieved at 10 V, as described previously by (Aghdaei
et al., 2008; Aghdaei, 2011) using the electrode array with the square focusing
electrodes. During these experiments, it was generally observed that the droplet
motion was more readily achieved once the device had been washed with the
lipid-oil solution, that speed of the droplet motion increased when raising the
peak-to-peak intensity of the applied signal, and that the design of the square
focusing electrodes was more suited to moving a droplet from one side of the
device to the other rather than bringing the droplets into contact in the centre of
the device. Although this was still achievable as shown in Fig 3.26 e). With the
setup functioning correctly, the chip was substituted for the design with the spade
shaped focusing electrodes and the camera was removed from the microscope. This
was necessary for removing the electrical noise that was detected in its presence
during current measurements, which required the insertion of Ag/AgCl electrodes
into each droplet.
The Ag/AgCl electrodes were inserted when the droplets were positioned station-
ary by the activation of both the inner and outer pairs of electrodes as described
by Aghdaei et al. (2008). This was first attempted by lowering both electrodes
into the oil using translation stages but was found to be problematic, largely due
to the droplet moving and/or deforming to avoid being pierced by the wire. The
problem was overcome by making the Ag/AgCl electrode tips more hydrophilic.
This was achieved by coating the electrodes with 5% (w/v) agar, boiled until a
thick syrup consistency was obtained and poured into a small petri dish that was
used to dip the electrodes. It was important to get the right consistency of the
agar, to evenly coat the electrodes, and to gauge the level of insertion required, as
over inserting the electrodes restricted droplet movement. It was also found to be
important to immediately hydrate the agar coating with buffer to ensure that the
electrode successfully pierced the droplets.
With the Ag/AgCl electrodes inserted the droplets were brought into contact by
lowering the peak to peak intensity of the supplied signal to 2 V and deactivating
both sets of outer electrodes. Upon droplet contact, to avoid the droplets fusing,
it was found to be important to slowly reduce the intensity of the applied signal
before switching the electrodes off. The ribbon cable was then carefully removed
from the switchbox and placed inside the Faraday cage, which was then closed
for electrical measurements. Examples of electrical measurements of the droplets
a) before contact, b) in contact and c) after fusion are shown in Fig 3.27. For 2
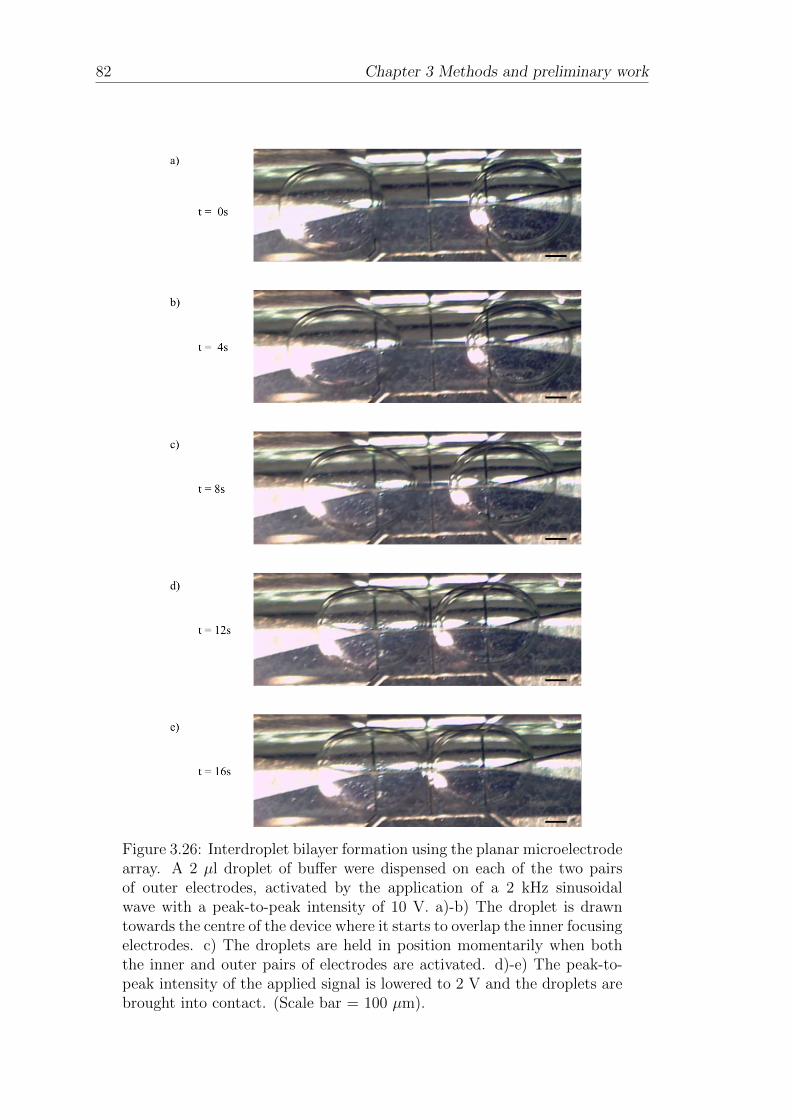
82 Chapter 3 Methods and preliminary work
Figure 3.26: Interdroplet bilayer formation using the planar microelectrodearray. A 2 µl droplet of buffer were dispensed on each of the two pairsof outer electrodes, activated by the application of a 2 kHz sinusoidalwave with a peak-to-peak intensity of 10 V. a)-b) The droplet is drawntowards the centre of the device where it starts to overlap the inner focusingelectrodes. c) The droplets are held in position momentarily when boththe inner and outer pairs of electrodes are activated. d)-e) The peak-to-peak intensity of the applied signal is lowered to 2 V and the droplets arebrought into contact. (Scale bar = 100 µm).
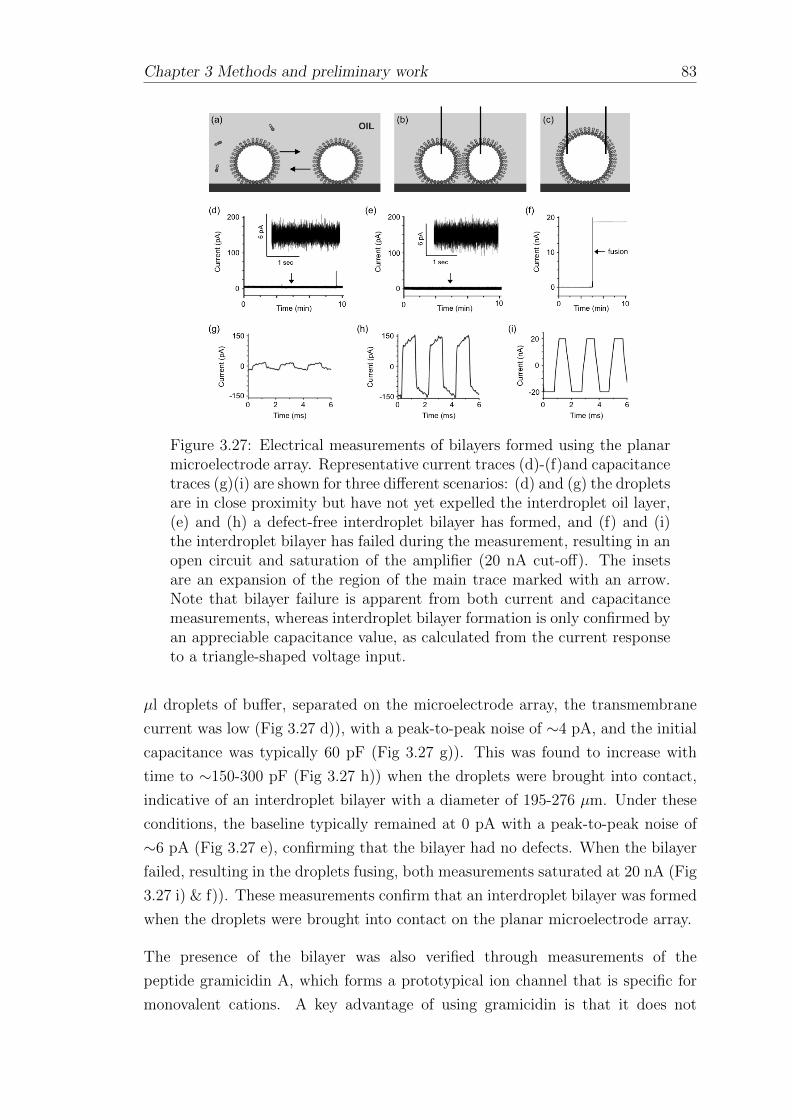
Chapter 3 Methods and preliminary work 83
Figure 3.27: Electrical measurements of bilayers formed using the planarmicroelectrode array. Representative current traces (d)-(f)and capacitancetraces (g)(i) are shown for three different scenarios: (d) and (g) the dropletsare in close proximity but have not yet expelled the interdroplet oil layer,(e) and (h) a defect-free interdroplet bilayer has formed, and (f) and (i)the interdroplet bilayer has failed during the measurement, resulting in anopen circuit and saturation of the amplifier (20 nA cut-off). The insetsare an expansion of the region of the main trace marked with an arrow.Note that bilayer failure is apparent from both current and capacitancemeasurements, whereas interdroplet bilayer formation is only confirmed byan appreciable capacitance value, as calculated from the current responseto a triangle-shaped voltage input.
µl droplets of buffer, separated on the microelectrode array, the transmembrane
current was low (Fig 3.27 d)), with a peak-to-peak noise of ∼4 pA, and the initial
capacitance was typically 60 pF (Fig 3.27 g)). This was found to increase with
time to ∼150-300 pF (Fig 3.27 h)) when the droplets were brought into contact,
indicative of an interdroplet bilayer with a diameter of 195-276 µm. Under these
conditions, the baseline typically remained at 0 pA with a peak-to-peak noise of
∼6 pA (Fig 3.27 e), confirming that the bilayer had no defects. When the bilayer
failed, resulting in the droplets fusing, both measurements saturated at 20 nA (Fig
3.27 i) & f)). These measurements confirm that an interdroplet bilayer was formed
when the droplets were brought into contact on the planar microelectrode array.
The presence of the bilayer was also verified through measurements of the
peptide gramicidin A, which forms a prototypical ion channel that is specific for
monovalent cations. A key advantage of using gramicidin is that it does not
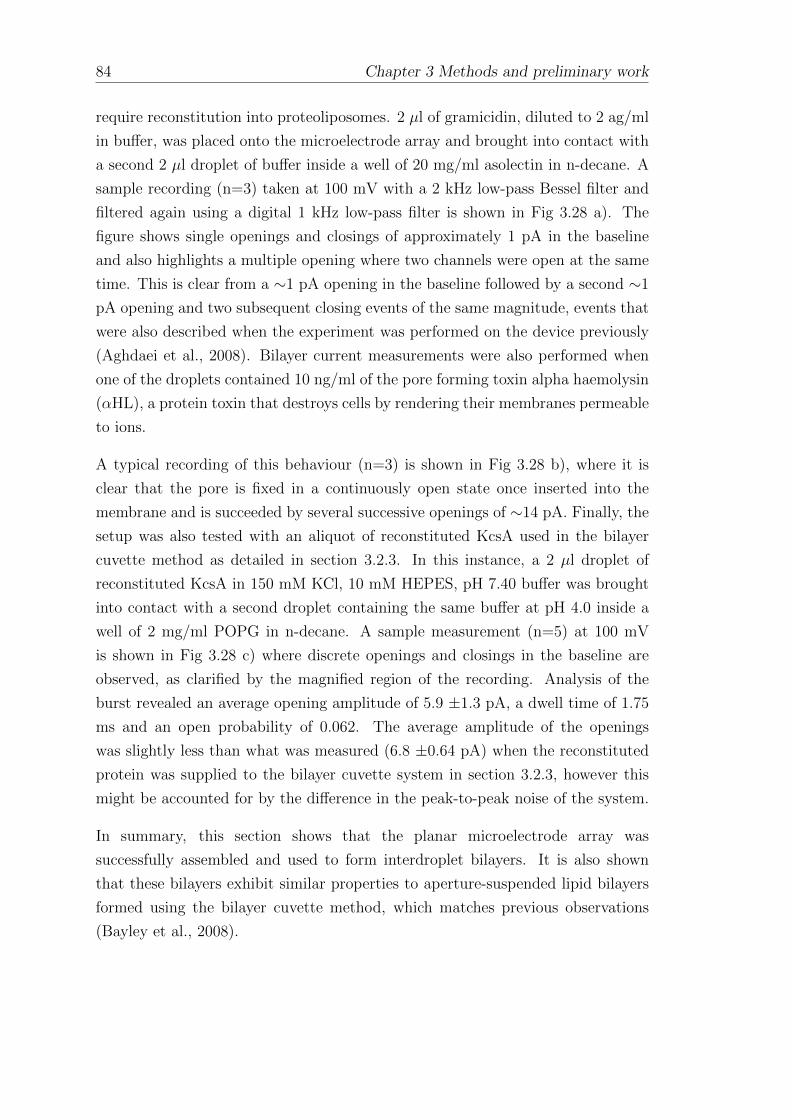
84 Chapter 3 Methods and preliminary work
require reconstitution into proteoliposomes. 2 µl of gramicidin, diluted to 2 ag/ml
in buffer, was placed onto the microelectrode array and brought into contact with
a second 2 µl droplet of buffer inside a well of 20 mg/ml asolectin in n-decane. A
sample recording (n=3) taken at 100 mV with a 2 kHz low-pass Bessel filter and
filtered again using a digital 1 kHz low-pass filter is shown in Fig 3.28 a). The
figure shows single openings and closings of approximately 1 pA in the baseline
and also highlights a multiple opening where two channels were open at the same
time. This is clear from a ∼1 pA opening in the baseline followed by a second ∼1
pA opening and two subsequent closing events of the same magnitude, events that
were also described when the experiment was performed on the device previously
(Aghdaei et al., 2008). Bilayer current measurements were also performed when
one of the droplets contained 10 ng/ml of the pore forming toxin alpha haemolysin
(αHL), a protein toxin that destroys cells by rendering their membranes permeable
to ions.
A typical recording of this behaviour (n=3) is shown in Fig 3.28 b), where it is
clear that the pore is fixed in a continuously open state once inserted into the
membrane and is succeeded by several successive openings of ∼14 pA. Finally, the
setup was also tested with an aliquot of reconstituted KcsA used in the bilayer
cuvette method as detailed in section 3.2.3. In this instance, a 2 µl droplet of
reconstituted KcsA in 150 mM KCl, 10 mM HEPES, pH 7.40 buffer was brought
into contact with a second droplet containing the same buffer at pH 4.0 inside a
well of 2 mg/ml POPG in n-decane. A sample measurement (n=5) at 100 mV
is shown in Fig 3.28 c) where discrete openings and closings in the baseline are
observed, as clarified by the magnified region of the recording. Analysis of the
burst revealed an average opening amplitude of 5.9 ±1.3 pA, a dwell time of 1.75
ms and an open probability of 0.062. The average amplitude of the openings
was slightly less than what was measured (6.8 ±0.64 pA) when the reconstituted
protein was supplied to the bilayer cuvette system in section 3.2.3, however this
might be accounted for by the difference in the peak-to-peak noise of the system.
In summary, this section shows that the planar microelectrode array was
successfully assembled and used to form interdroplet bilayers. It is also shown
that these bilayers exhibit similar properties to aperture-suspended lipid bilayers
formed using the bilayer cuvette method, which matches previous observations
(Bayley et al., 2008).
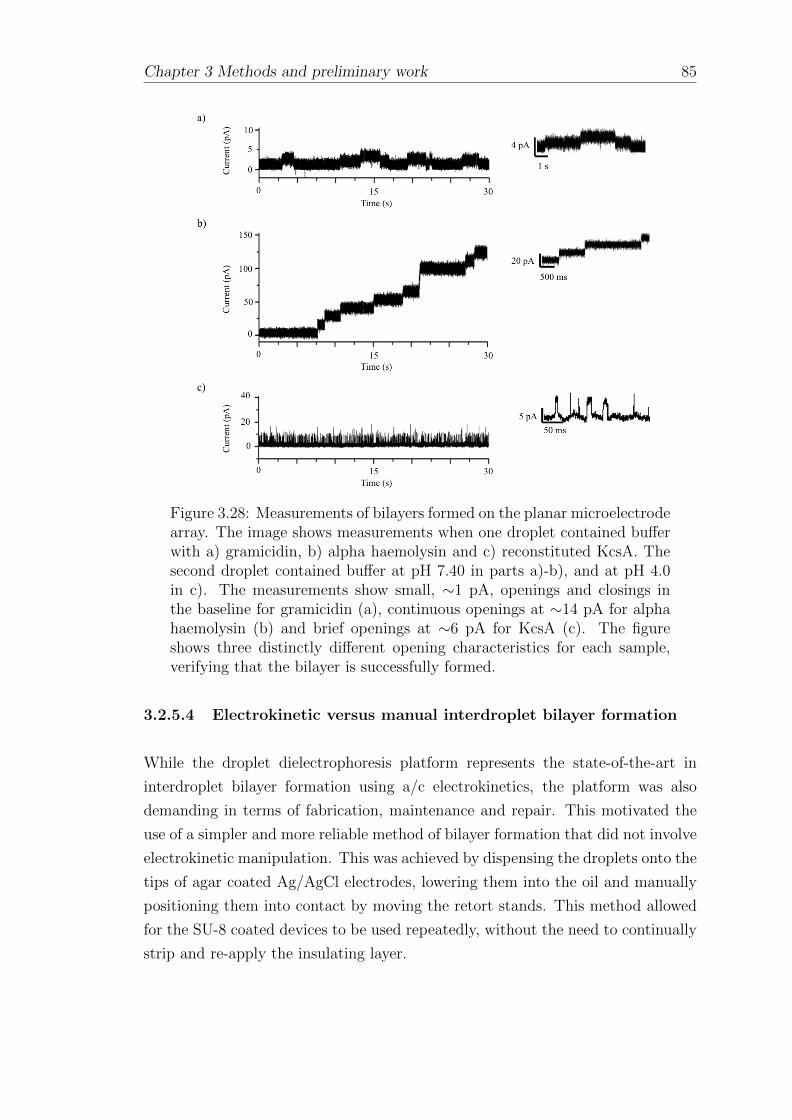
Chapter 3 Methods and preliminary work 85
Figure 3.28: Measurements of bilayers formed on the planar microelectrodearray. The image shows measurements when one droplet contained bufferwith a) gramicidin, b) alpha haemolysin and c) reconstituted KcsA. Thesecond droplet contained buffer at pH 7.40 in parts a)-b), and at pH 4.0in c). The measurements show small, ∼1 pA, openings and closings inthe baseline for gramicidin (a), continuous openings at ∼14 pA for alphahaemolysin (b) and brief openings at ∼6 pA for KcsA (c). The figureshows three distinctly different opening characteristics for each sample,verifying that the bilayer is successfully formed.
3.2.5.4 Electrokinetic versus manual interdroplet bilayer formation
While the droplet dielectrophoresis platform represents the state-of-the-art in
interdroplet bilayer formation using a/c electrokinetics, the platform was also
demanding in terms of fabrication, maintenance and repair. This motivated the
use of a simpler and more reliable method of bilayer formation that did not involve
electrokinetic manipulation. This was achieved by dispensing the droplets onto the
tips of agar coated Ag/AgCl electrodes, lowering them into the oil and manually
positioning them into contact by moving the retort stands. This method allowed
for the SU-8 coated devices to be used repeatedly, without the need to continually
strip and re-apply the insulating layer.
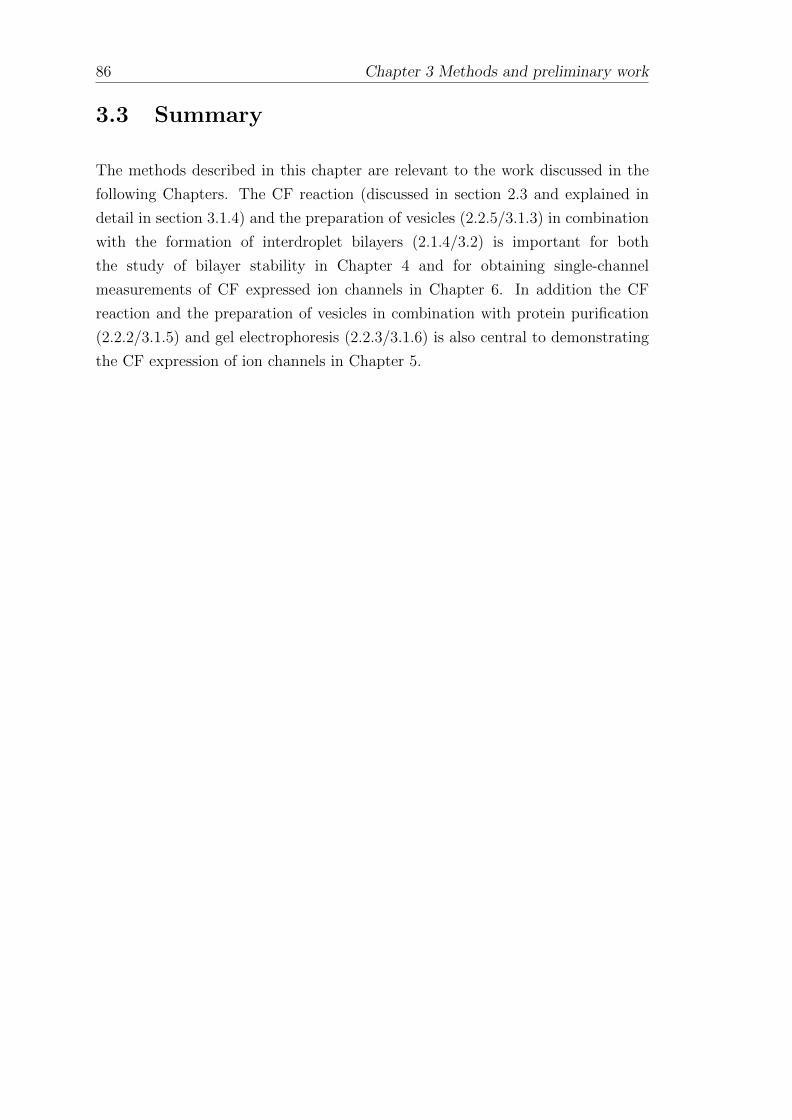
86 Chapter 3 Methods and preliminary work
3.3 Summary
The methods described in this chapter are relevant to the work discussed in the
following Chapters. The CF reaction (discussed in section 2.3 and explained in
detail in section 3.1.4) and the preparation of vesicles (2.2.5/3.1.3) in combination
with the formation of interdroplet bilayers (2.1.4/3.2) is important for both
the study of bilayer stability in Chapter 4 and for obtaining single-channel
measurements of CF expressed ion channels in Chapter 6. In addition the CF
reaction and the preparation of vesicles in combination with protein purification
(2.2.2/3.1.5) and gel electrophoresis (2.2.3/3.1.6) is also central to demonstrating
the CF expression of ion channels in Chapter 5.
Chapter 4
Stability of interdroplet bilayers
with cell-free expression mixtures
The formation of a stable and durable lipid bilayer is a fundamental requirement
for achieving the coupled expression and characterisation of ion channels in
microdroplets (section 1.1), however the stability of interdroplet bilayers formed
in the presence of CF systems, which are known to destabilise the bilayer (Syeda
et al., 2008), has not been comprehensively studied.
To this end, the stability of interdroplet bilayers formed between two droplets of
pure buffer solution was studied in mixtures of different synthetic lipids, in addition
to asolectin bilayers formed in the presence of different pH gradients. Further to
demonstrating the stability of the bilayers, three different commercial CF mixtures
and their comprising fractions were screened, followed by measurements of pure
proteins, polymers and vesicles.
4.1 Interdroplet bilayers of asolectin
Interdroplet bilayers composed of asolectin, a lipid extract from soybean, were
formed by manual manipulation of the droplets as described in section 3.2.5.4. This
enabled the properties of the bilayer to be studied without electrokinetic forces
and in the absence of a CF system. Two representative recordings of interdroplet
bilayers formed this way are shown in Fig 4.1 a)-b), where in both examples
the baseline is shown to be stable and close to 0 pA, with no significant leakage
currents. The appearance of only a few of spikes in the baseline is shown in
87
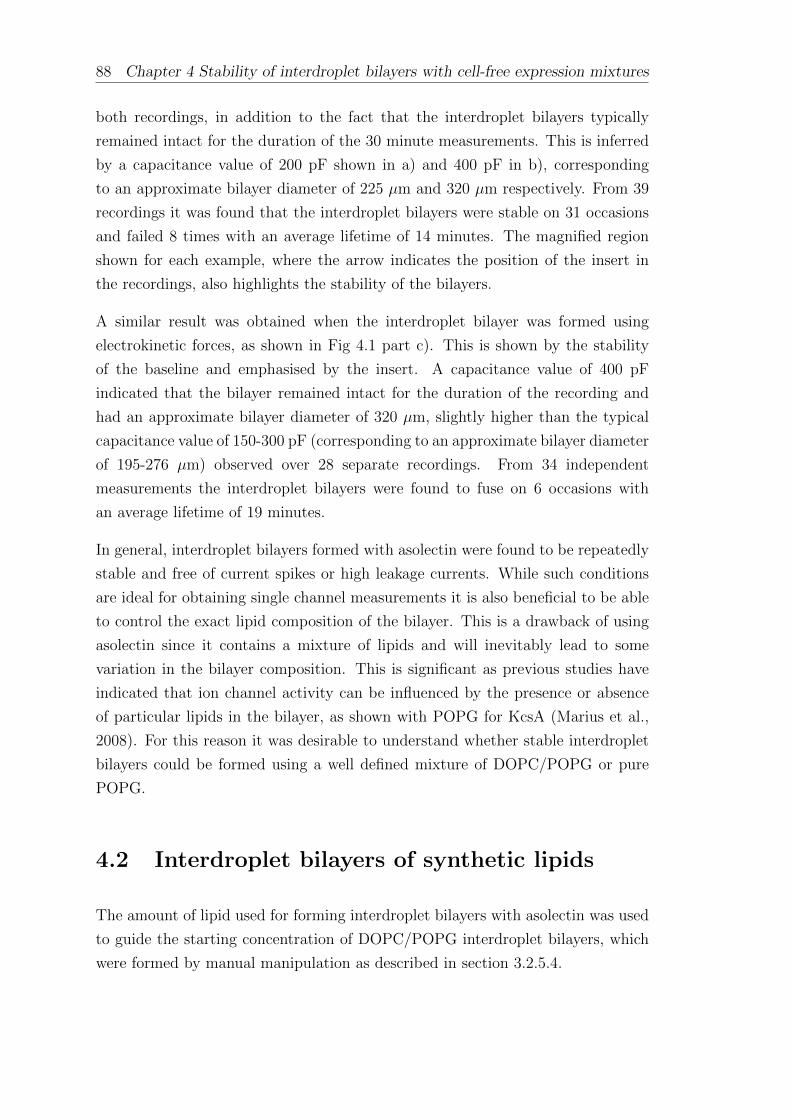
88 Chapter 4 Stability of interdroplet bilayers with cell-free expression mixtures
both recordings, in addition to the fact that the interdroplet bilayers typically
remained intact for the duration of the 30 minute measurements. This is inferred
by a capacitance value of 200 pF shown in a) and 400 pF in b), corresponding
to an approximate bilayer diameter of 225 µm and 320 µm respectively. From 39
recordings it was found that the interdroplet bilayers were stable on 31 occasions
and failed 8 times with an average lifetime of 14 minutes. The magnified region
shown for each example, where the arrow indicates the position of the insert in
the recordings, also highlights the stability of the bilayers.
A similar result was obtained when the interdroplet bilayer was formed using
electrokinetic forces, as shown in Fig 4.1 part c). This is shown by the stability
of the baseline and emphasised by the insert. A capacitance value of 400 pF
indicated that the bilayer remained intact for the duration of the recording and
had an approximate bilayer diameter of 320 µm, slightly higher than the typical
capacitance value of 150-300 pF (corresponding to an approximate bilayer diameter
of 195-276 µm) observed over 28 separate recordings. From 34 independent
measurements the interdroplet bilayers were found to fuse on 6 occasions with
an average lifetime of 19 minutes.
In general, interdroplet bilayers formed with asolectin were found to be repeatedly
stable and free of current spikes or high leakage currents. While such conditions
are ideal for obtaining single channel measurements it is also beneficial to be able
to control the exact lipid composition of the bilayer. This is a drawback of using
asolectin since it contains a mixture of lipids and will inevitably lead to some
variation in the bilayer composition. This is significant as previous studies have
indicated that ion channel activity can be influenced by the presence or absence
of particular lipids in the bilayer, as shown with POPG for KcsA (Marius et al.,
2008). For this reason it was desirable to understand whether stable interdroplet
bilayers could be formed using a well defined mixture of DOPC/POPG or pure
POPG.
4.2 Interdroplet bilayers of synthetic lipids
The amount of lipid used for forming interdroplet bilayers with asolectin was used
to guide the starting concentration of DOPC/POPG interdroplet bilayers, which
were formed by manual manipulation as described in section 3.2.5.4.
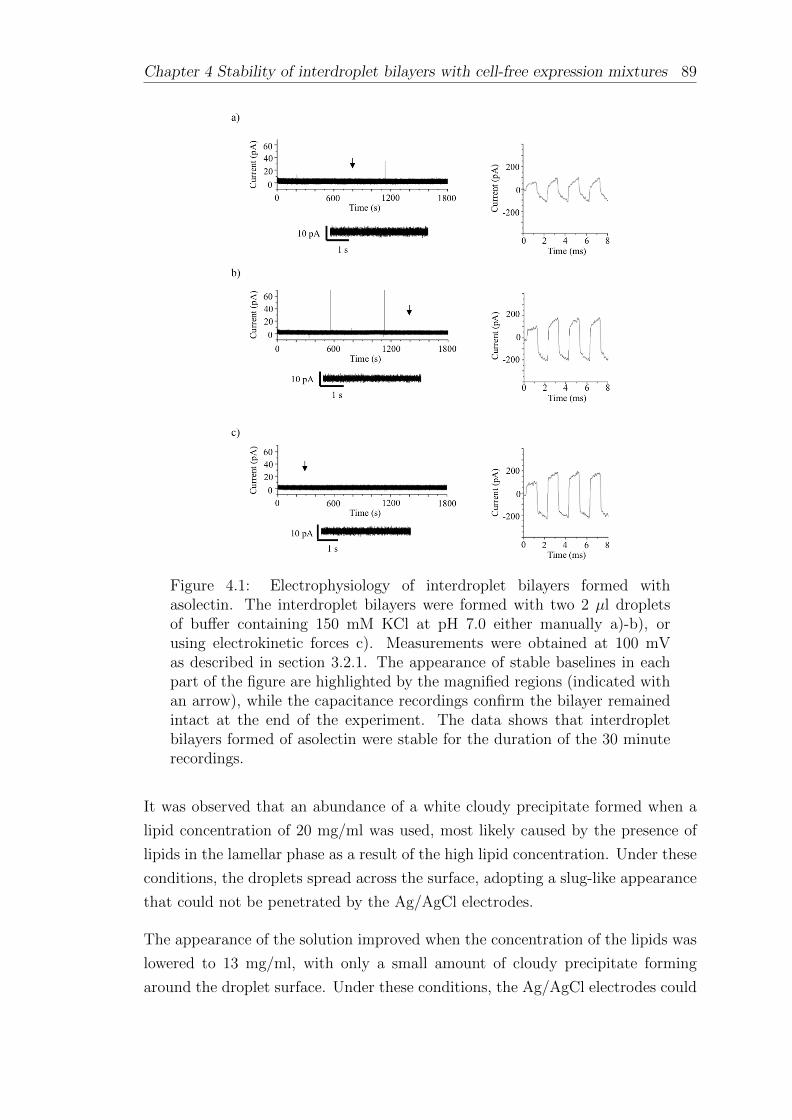
Chapter 4 Stability of interdroplet bilayers with cell-free expression mixtures 89
Figure 4.1: Electrophysiology of interdroplet bilayers formed withasolectin. The interdroplet bilayers were formed with two 2 µl dropletsof buffer containing 150 mM KCl at pH 7.0 either manually a)-b), orusing electrokinetic forces c). Measurements were obtained at 100 mVas described in section 3.2.1. The appearance of stable baselines in eachpart of the figure are highlighted by the magnified regions (indicated withan arrow), while the capacitance recordings confirm the bilayer remainedintact at the end of the experiment. The data shows that interdropletbilayers formed of asolectin were stable for the duration of the 30 minuterecordings.
It was observed that an abundance of a white cloudy precipitate formed when a
lipid concentration of 20 mg/ml was used, most likely caused by the presence of
lipids in the lamellar phase as a result of the high lipid concentration. Under these
conditions, the droplets spread across the surface, adopting a slug-like appearance
that could not be penetrated by the Ag/AgCl electrodes.
The appearance of the solution improved when the concentration of the lipids was
lowered to 13 mg/ml, with only a small amount of cloudy precipitate forming
around the droplet surface. Under these conditions, the Ag/AgCl electrodes could
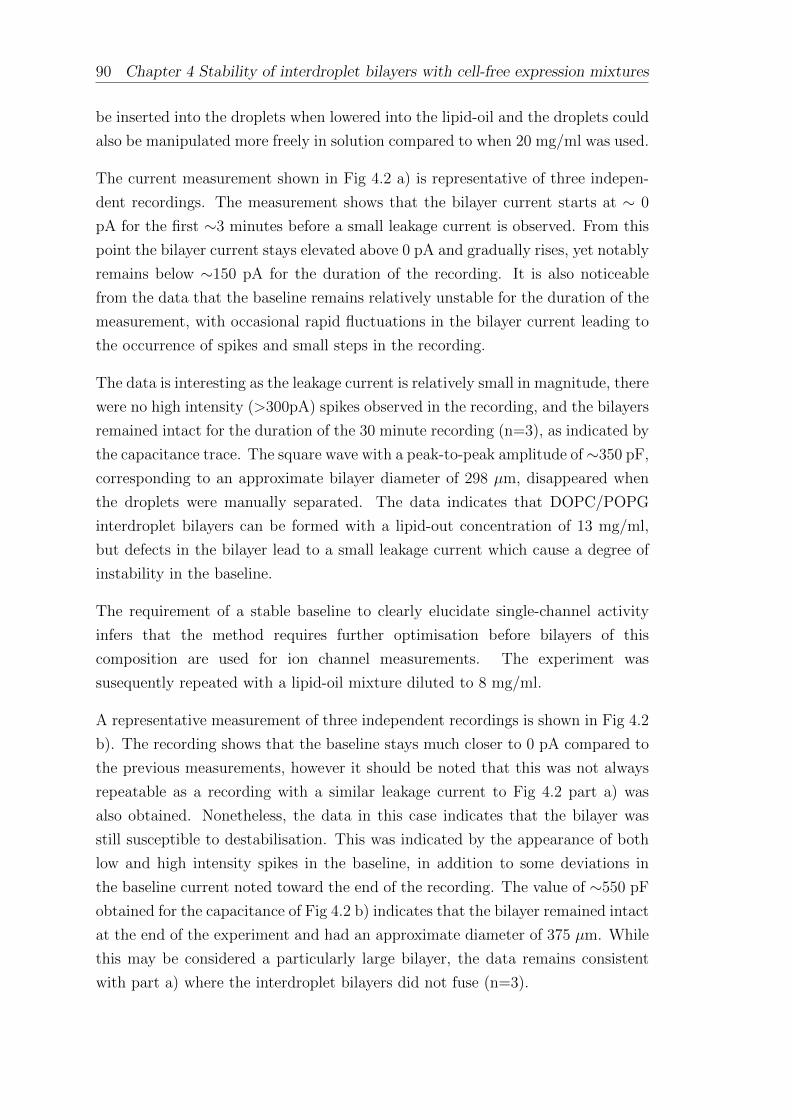
90 Chapter 4 Stability of interdroplet bilayers with cell-free expression mixtures
be inserted into the droplets when lowered into the lipid-oil and the droplets could
also be manipulated more freely in solution compared to when 20 mg/ml was used.
The current measurement shown in Fig 4.2 a) is representative of three indepen-
dent recordings. The measurement shows that the bilayer current starts at ∼ 0
pA for the first ∼3 minutes before a small leakage current is observed. From this
point the bilayer current stays elevated above 0 pA and gradually rises, yet notably
remains below ∼150 pA for the duration of the recording. It is also noticeable
from the data that the baseline remains relatively unstable for the duration of the
measurement, with occasional rapid fluctuations in the bilayer current leading to
the occurrence of spikes and small steps in the recording.
The data is interesting as the leakage current is relatively small in magnitude, there
were no high intensity (>300pA) spikes observed in the recording, and the bilayers
remained intact for the duration of the 30 minute recording (n=3), as indicated by
the capacitance trace. The square wave with a peak-to-peak amplitude of∼350 pF,
corresponding to an approximate bilayer diameter of 298 µm, disappeared when
the droplets were manually separated. The data indicates that DOPC/POPG
interdroplet bilayers can be formed with a lipid-out concentration of 13 mg/ml,
but defects in the bilayer lead to a small leakage current which cause a degree of
instability in the baseline.
The requirement of a stable baseline to clearly elucidate single-channel activity
infers that the method requires further optimisation before bilayers of this
composition are used for ion channel measurements. The experiment was
susequently repeated with a lipid-oil mixture diluted to 8 mg/ml.
A representative measurement of three independent recordings is shown in Fig 4.2
b). The recording shows that the baseline stays much closer to 0 pA compared to
the previous measurements, however it should be noted that this was not always
repeatable as a recording with a similar leakage current to Fig 4.2 part a) was
also obtained. Nonetheless, the data in this case indicates that the bilayer was
still susceptible to destabilisation. This was indicated by the appearance of both
low and high intensity spikes in the baseline, in addition to some deviations in
the baseline current noted toward the end of the recording. The value of ∼550 pF
obtained for the capacitance of Fig 4.2 b) indicates that the bilayer remained intact
at the end of the experiment and had an approximate diameter of 375 µm. While
this may be considered a particularly large bilayer, the data remains consistent
with part a) where the interdroplet bilayers did not fuse (n=3).
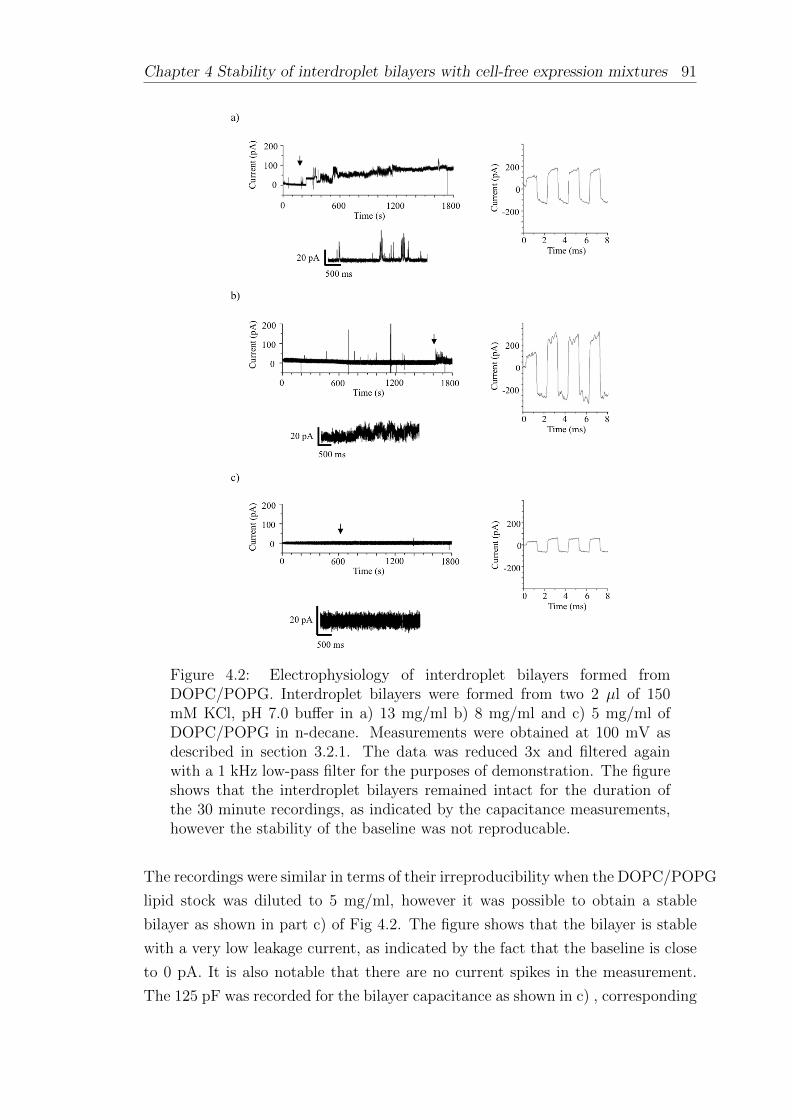
Chapter 4 Stability of interdroplet bilayers with cell-free expression mixtures 91
Figure 4.2: Electrophysiology of interdroplet bilayers formed fromDOPC/POPG. Interdroplet bilayers were formed from two 2 µl of 150mM KCl, pH 7.0 buffer in a) 13 mg/ml b) 8 mg/ml and c) 5 mg/ml ofDOPC/POPG in n-decane. Measurements were obtained at 100 mV asdescribed in section 3.2.1. The data was reduced 3x and filtered againwith a 1 kHz low-pass filter for the purposes of demonstration. The figureshows that the interdroplet bilayers remained intact for the duration ofthe 30 minute recordings, as indicated by the capacitance measurements,however the stability of the baseline was not reproducable.
The recordings were similar in terms of their irreproducibility when the DOPC/POPG
lipid stock was diluted to 5 mg/ml, however it was possible to obtain a stable
bilayer as shown in part c) of Fig 4.2. The figure shows that the bilayer is stable
with a very low leakage current, as indicated by the fact that the baseline is close
to 0 pA. It is also notable that there are no current spikes in the measurement.
The 125 pF was recorded for the bilayer capacitance as shown in c) , corresponding
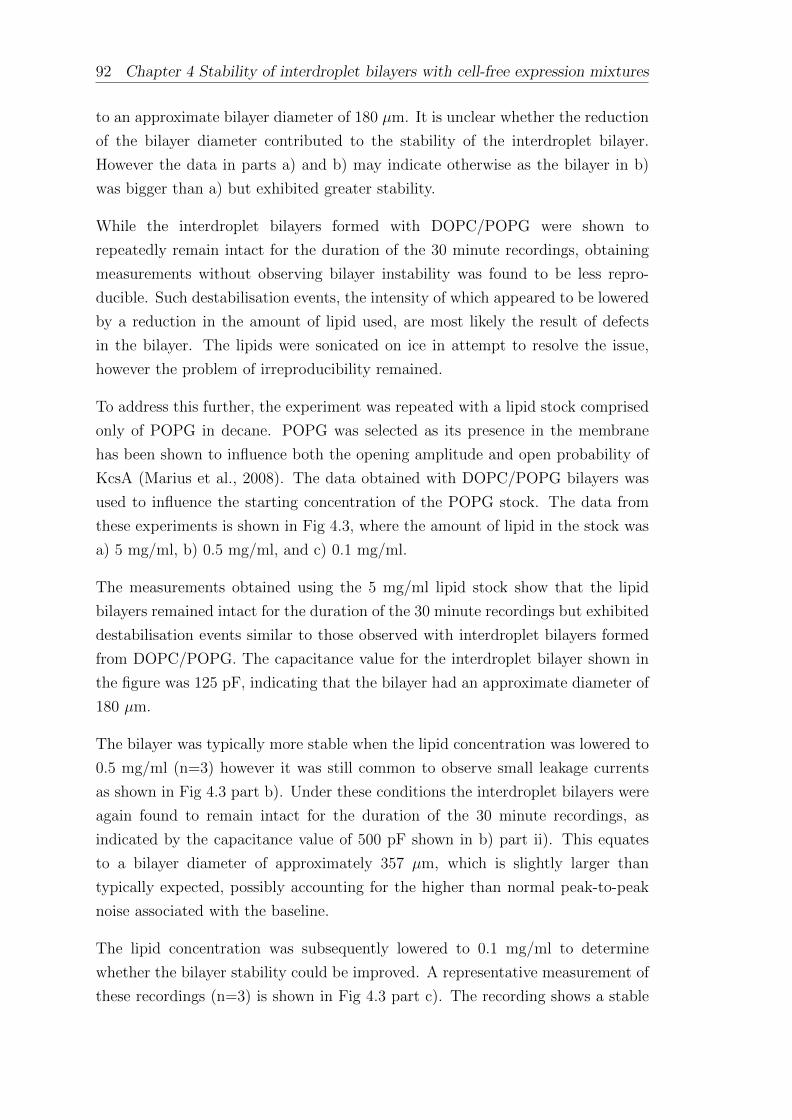
92 Chapter 4 Stability of interdroplet bilayers with cell-free expression mixtures
to an approximate bilayer diameter of 180 µm. It is unclear whether the reduction
of the bilayer diameter contributed to the stability of the interdroplet bilayer.
However the data in parts a) and b) may indicate otherwise as the bilayer in b)
was bigger than a) but exhibited greater stability.
While the interdroplet bilayers formed with DOPC/POPG were shown to
repeatedly remain intact for the duration of the 30 minute recordings, obtaining
measurements without observing bilayer instability was found to be less repro-
ducible. Such destabilisation events, the intensity of which appeared to be lowered
by a reduction in the amount of lipid used, are most likely the result of defects
in the bilayer. The lipids were sonicated on ice in attempt to resolve the issue,
however the problem of irreproducibility remained.
To address this further, the experiment was repeated with a lipid stock comprised
only of POPG in decane. POPG was selected as its presence in the membrane
has been shown to influence both the opening amplitude and open probability of
KcsA (Marius et al., 2008). The data obtained with DOPC/POPG bilayers was
used to influence the starting concentration of the POPG stock. The data from
these experiments is shown in Fig 4.3, where the amount of lipid in the stock was
a) 5 mg/ml, b) 0.5 mg/ml, and c) 0.1 mg/ml.
The measurements obtained using the 5 mg/ml lipid stock show that the lipid
bilayers remained intact for the duration of the 30 minute recordings but exhibited
destabilisation events similar to those observed with interdroplet bilayers formed
from DOPC/POPG. The capacitance value for the interdroplet bilayer shown in
the figure was 125 pF, indicating that the bilayer had an approximate diameter of
180 µm.
The bilayer was typically more stable when the lipid concentration was lowered to
0.5 mg/ml (n=3) however it was still common to observe small leakage currents
as shown in Fig 4.3 part b). Under these conditions the interdroplet bilayers were
again found to remain intact for the duration of the 30 minute recordings, as
indicated by the capacitance value of 500 pF shown in b) part ii). This equates
to a bilayer diameter of approximately 357 µm, which is slightly larger than
typically expected, possibly accounting for the higher than normal peak-to-peak
noise associated with the baseline.
The lipid concentration was subsequently lowered to 0.1 mg/ml to determine
whether the bilayer stability could be improved. A representative measurement of
these recordings (n=3) is shown in Fig 4.3 part c). The recording shows a stable
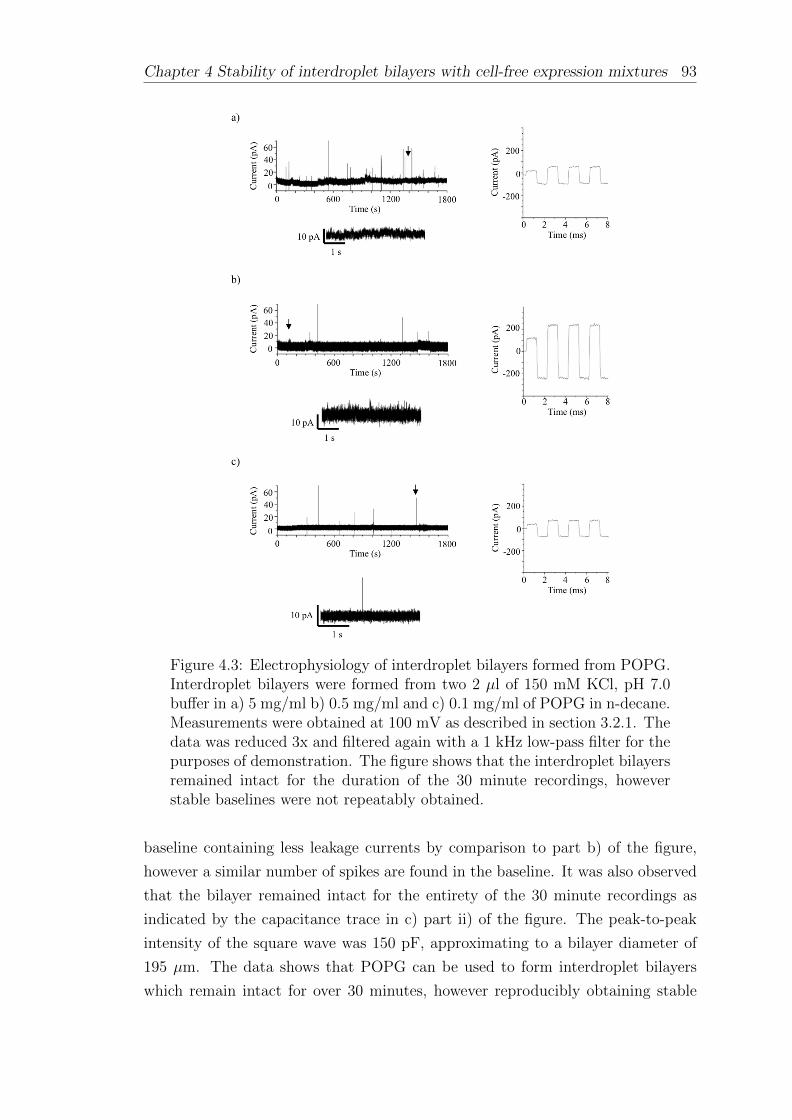
Chapter 4 Stability of interdroplet bilayers with cell-free expression mixtures 93
Figure 4.3: Electrophysiology of interdroplet bilayers formed from POPG.Interdroplet bilayers were formed from two 2 µl of 150 mM KCl, pH 7.0buffer in a) 5 mg/ml b) 0.5 mg/ml and c) 0.1 mg/ml of POPG in n-decane.Measurements were obtained at 100 mV as described in section 3.2.1. Thedata was reduced 3x and filtered again with a 1 kHz low-pass filter for thepurposes of demonstration. The figure shows that the interdroplet bilayersremained intact for the duration of the 30 minute recordings, howeverstable baselines were not repeatably obtained.
baseline containing less leakage currents by comparison to part b) of the figure,
however a similar number of spikes are found in the baseline. It was also observed
that the bilayer remained intact for the entirety of the 30 minute recordings as
indicated by the capacitance trace in c) part ii) of the figure. The peak-to-peak
intensity of the square wave was 150 pF, approximating to a bilayer diameter of
195 µm. The data shows that POPG can be used to form interdroplet bilayers
which remain intact for over 30 minutes, however reproducibly obtaining stable

94 Chapter 4 Stability of interdroplet bilayers with cell-free expression mixtures
bilayers devoid of leakage currents or current spikes was found to be problematic.
It is difficult to identify the origins of these destabilisation events, particularly
since the lipid bilayer is a stochastic system in constant flux, manifested by the
lateral diffusion of lipids (Jacobson et al., 1995). However it is plausible that the
leakage currents arise from small defects in the lipid bilayer, while the current
spikes could have a number of origins, including external electrical noise.
In summary, the data in this section shows that interdroplet bilayers can be
successfully formed using asolectin, a mixture of DOPC/POPG and pure POPG
lipids. In each case, the bilayers remained intact for the duration of the 30 minute
recordings, however the measurement of stable baselines was found to be more
reproducible with asolectin compared to the synthetic lipids.
This was unexpected because synthetic lipids are routinely used to form aperture
suspended lipid bilayers (Marius et al., 2008). This difference in stability could be
due to the size and shape of the lipid bilayer formed using the droplet method,
where interdroplet bilayers are typically much larger than those formed across
apertures.
4.3 Interdroplet bilayers with asymmetric pH
Obtaining stable baselines when both droplets contain buffer at different pH is a
requirement for acquiring single-channel measurements of pH gated ion channels.
Interdroplet bilayers of this nature have been reported in the literature (Aghdaei
et al., 2008; Bayley et al., 2008) however to date there has been no detailed
investigation in to the stability of these bilayers over time. This is important
to understand for the purposes of this study as it is desirable for the bilayer to
be stable for ∼30 minutes while a pH gated ion channel is expressed in-situ and
inserted into the bilayer for electrical characterisation. The aim of this part of the
study was therefore to determine whether interdroplet bilayers are stable when
one droplet contains buffer at pH 4.0.
Interdroplet bilayers were formed by manual manipulation as described in section
3.2.5.4, in 20 mg/ml asolectin in n-decane. Current measurements were performed
for 30 minutes under a holding potential of 100 mV (as detailed in section 3.2.1).
As shown in Fig 4.4 a), it was found that interdroplet bilayers with one droplet
containing buffer at pH 7.0 and the other containing buffer at pH 4.0 rapidly failed
Chapter 4 Stability of interdroplet bilayers with cell-free expression mixtures 95
upon the application of the holding potential. This lead to the saturation of the
baseline current and fusion of the two droplets, as indicated (*). The recording
shows low-intensity destabilisation events in the baseline which appear as spikes
<100 pA in intensity and small leakage currents (<10 pA) leading up to the point
of bilayer failure. From 12 independent experiments, the bilayer was found to
fail on each occasion with an average lifetime of 6 minutes. A similar result was
observed when both droplets contained buffer at pH 4.0, however these conditions
were less interesting since protein expression is unlikely to be sustained at low pH.
Figure 4.4: Interdroplet bilayers with asymmetric pH. Interdroplet bilayerswere formed with one droplet containing 150 mM KCl buffered at pH 7and a second droplet containing; a) 150 mM KCl buffered at pH 4.0, b)150 mM KCl buffered at pH 4.5, and c) 150 mM KCl buffered at pH 5.0.The interdroplet bilayers were formed manually in 20 mg/ml asolectin inn-decane as described in section 3.2.5.4. Measurements were obtained at100 mV as detailed in section 3.2.1. The data was reduced 3x and filteredagain with a 1 kHz low-pass filter for the purposes of demonstration. Thedata shows that the lifetime of the interdroplet bilayers is significantlyeffected by the pH of the second droplet.
96 Chapter 4 Stability of interdroplet bilayers with cell-free expression mixtures
The data suggests that the low pH of the second droplet led to the destabilisaiton of
the bilayer, an outcome that would be surprising as the same level of instability has
not been reported for aperture suspended lipid bilayers under the same conditions
(Marius et al., 2008)(Cuello et al., 1998)(Chakrapani et al., 2007).
To verify the pH dependence on the bilayer stability, the experiment was repeated
with the second droplet containing buffer at pH 4.5. A representative measurement
is shown in Fig 4.4 b), where some high intensity spikes are observed in the baseline
before the bilayer fails. The magnified region also reveals some small leakage
currents, where the current temporarily rises above 0 pA and several ∼100 pA
intensity spikes are present in the baseline. From 6 independent experiments the
interdroplet bilayers were found to fail on 4 occasions with an average lifetime of
10 minutes but were also found to remain intact for the duration of the 30-minute
recordings on 2 separate occasions.
The data suggests that the higher pH of the droplet led to a significantly increased
bilayer lifetime, an observation that was supported by the measurement of stable
bilayers that did not fuse when the pH of the second droplet was increased to 5.0
(n=3). A representative recording of one of these measurements is shown in Fig
4.4 c), where only a small amount of noise is detected in the baseline, which is
otherwise comparable to the data obtained at pH 7.0 in the previous subsection.
The data clearly demonstrates a pH dependent effect on the bilayer stability,
however it still remains necessary to stabilise the bilayer at pH 4.0 in order to
obtain measurements of pH gated channels such as KcsA. To achieve this, the
experiment was repeated using higher concentrations of asolectin in n-decane.
The measurement in Fig 4.5 parts a)-b) clarifies the result when 20 mg/ml was
used, where in part a) both droplets contained buffer at pH 7.0 and in part b)
one droplet was substituted for a droplet containing buffer at pH 4.0. In line with
what was observed in Fig 4.1 parts a) and b), the data in Fig 4.5 a) shows that the
bilayer was stable and did not fail when both droplets contained buffer at pH 7.0.
While Fig 4.5 b) shows that the bilayer fails after ∼5 minutes when the second
droplet is replaced with buffer solution at pH 4.0.
The result when the lipid concentration was increased to 40 mg/ml is shown in
parts c-d) of the figure, where the measurement shown with both droplets at pH
7.0 in part c) reveals a stable baseline with only a few low intensity (<20 pA)
current spikes. Part d) is a representative recording of when the second droplet
was substituted for buffer at pH 4.0 and shows that despite bilayer failure,the

Chapter 4 Stability of interdroplet bilayers with cell-free expression mixtures 97
lifetime of the bilayer appears to be improved by comparison to when 20 mg/ml
of asolectin was used. This was inferred over 4 independent experiments where
the bilayer fused on 2 occasions with an average lifetime of 20 minutes and was
found to remain intact for the duration of the 30 minute recordings on 2 separate
occasions. This is a significant improvement compared to the previous conditions,
where the bilayer was shown to fail on each of the 12 measurements with an average
lifetime of 6 minutes.
To identify whether the stability of the bilayer could be improved upon further,
the experiment was repeated with the lipid concentration increased to 60 mg/ml.
The data is shown in Fig 4.5 e)-f), where the control experiment with both
droplets containing buffer at pH 7.0 is shown in e) and a measurement when
one droplet contained buffer at pH 4.0 is shown in part f). Consistent with
previous observations at lower lipid concentrations, the data shows that the
Figure 4.5: Stabilisation of interdroplet bilayers with asymmetric pH.Interdroplet bilayers comprising of one 2 µl droplet of 150 mM KClbuffer at pH 7.0 and either a second identical 2 µl droplet or a seconddroplet containing 150 mM KCl buffer at pH 4.0 were formed manuallyin 20 mg/ml (a-b), 40 mg/ml (c-d) or 60 mg/ml (e-f) of asolectin in n-decane. Bilayers of symmetric composition are shown in parts a), c) ande). Measurements were obtained at 100 mV as described in section! and,additionally, the data was reduced 3x and filtered again with a 1 kHzlow-pass filter for the purposes of demonstration. Bilayer failure leads tosaturation of the baseline current as indicated (*). The data shows thatthe lifetime of the interdroplet bilayers with asymmetric pH is significantlyimproved by increasing the amount of lipid supplied to the system.

98 Chapter 4 Stability of interdroplet bilayers with cell-free expression mixtures
Table 4.1: The stability of interdroplet bilayers formed with asymmetricpH and different lipid concentrations. The composition of the two dropletsis shown together with the average lifetime of bilayers that failed withineach 30-minute experiment.
Lipid out Trans (ground) Cis n = No.fused Average lifetime (s)
20 mg/ml 150 mM KCl, pH 4.0 150 mM KCl, pH 7.0 12 12 620 mg/ml 150 mM KCl, pH 4.5 150 mM KCl, pH 7.0 6 4 1020 mg/ml 150 mM KCl, pH 5.0 150 mM KCl, pH 7.0 3 0 -40 mg/ml 150 mM KCl, pH 4.0 150 mM KCl, pH 7.0 4 2 2040 mg/ml 150 mM KCl, pH 7.0 150 mM KCl, pH 7.0 3 0 -60 mg/ml 150 mM KCl, pH 4.0 150 mM KCl, pH 7.0 5 2 2060 mg/ml 150 mM KCl, pH 7.0 150 mM KCl, pH 7.0 3 0 -
baseline remained stable when both droplets contained buffer at pH 7.0 when 60
mg/ml of asolectin in n-decane was used. When the second droplet was substituted
with a droplet containing buffer at pH 4.0, it was found that the interdroplet
bilayers still had the propensity to fail, seemingly within a similar timeframe to
what was observed when 40 mg/ml of asolectin in n-decane was used. From 5
independent measurements it was found that the interdroplet bilayers failed twice
with an average lifetime of ∼20 minutes and remained intact for the duration of
the 30 minute recordings on 3 separate occasions. The data from this section is
summarised in Table 4.1.
In summary, the data in this subsection shows that interdroplet bilayers failed at
100 mV when one droplet contained buffer at pH 7.0 and when the second droplet
contained buffer at pH 4.0. However it was found that the lifetime of the bilayer
could be improved by supplying 60 mg/ml of asolectin to the decane solution.
While destabilisation events were still found to occur under these conditions, the
data shows that these events do not occur continuously throughout the recordings,
indicating that it is possible to obtain single channel recordings of pH gated
ion channels when interdroplet bilayers with asymmetric pH are used. This is
assuming that the bilayer is not destabilised further by the presence of a CF
system, a topic which is addressed in the next section.
4.4 The effect of cell-free expression mixtures
and components on bilayer stability
As discussed in section 2.3.3, CF systems have been previously reported to
destabilise interdroplet bilayers (Syeda et al., 2008), however a systematic study

Chapter 4 Stability of interdroplet bilayers with cell-free expression mixtures 99
was not undertaken. This is addressed in this section of the study, where the
stability of interdroplet bilayers made of asolectin was investigated in the presence
of different CF systems and their comprising fractions.
Interdroplet bilayers were formed using the electrokinetic method described in
section 3.2.5.3 and the CF systems were prepared without incubation as outlined
in section 3.1.4 with the DNA fraction replaced with 150 mM KCl buffer at pH
7.0.
Bilayer current recordings with a CF expression mixture in one droplet and buffer
solution in the second droplet are shown in Fig 4.6 a)-c). It can be seen that the
bilayer current is elevated, with a current baseline at ∼5-15 pA and with occasional
bursts of short-lived current spikes (<20 ms lifetime and up to 80 pA amplitude).
Similar irregular current bursts or current steps have also been observed for lipid
bilayers in contact with pure buffer solution when the lipids are near their phase
transition temperature (Blicher et al., 2009; Laub et al., 2012) and for bilayers in
the presence of silica nanospheres (Klein et al., 2008; de Planque et al., 2011) and
have been attributed to lipid packing defects.
The electrical recordings thus indicate that the structural integrity of the bilayer
is compromised by exposure to each of the three CF expression mixtures. Bilayer
rupture, observed as saturation of the baseline current, was usually preceded by
more intense leakage current spikes of up to 0.5-1.0 nA. Based on at least three
independent experiments (See Table 4.2), the lifetime of the interdroplet bilayers
of asolectin lipids is on average reduced to 8 minutes in the presence of the L1130
mixture, and to less than 30 seconds for the EasyXpress and Expressway solutions.
Hence, the lifetime of interdroplet bilayers in the presence of cell-free expression
mixtures based on S30 lysates (Zubay, 1973) is too short to allow experiments
with in situ expressed membrane proteins.
To identify the cause of the bilayer instability, which is unlikely to result from
an osmotic imbalance because it was also observed when the same mixtures are
present in both droplets, the various components that make up the cell-free protein
expression mixtures were investigated. It is the S30 cell lysate, extracted from
E.coli cell cultures, that contains the actual ribosomal machinery for translation
of mRNA (Zubay, 1973; Kigawa et al., 2004; Zawada, 2012; Berrier et al., 2004).
This is supplemented with T7 RNA polymerase for transcription of the user-
supplied DNA to mRNA, and with a system for metabolic energy generation
(referred to as premix or reaction buffer), for example based on pyruvate or
creatine kinase enzymes (Kim and Kim, 2009), to sustain the transcription and

100 Chapter 4 Stability of interdroplet bilayers with cell-free expression mixtures
translation reactions. Because the various suppliers divided the key biomolecules
over these premixed component fractions in different ways, the protein content
of these various fractions were visualised by gel electrophoresis. Fig 4.7 shows
that each of the three lysate fractions contains a large number of <150 kDa
proteins, which is consistent with previous reports (Berrier et al., 2004). A band
with a molecular weight corresponding to T7 RNA polymerase is visible for the
Expressway enzyme mix in lane 8, whereas the remaining component fractions are
either devoid of protein, or the protein concentration is too low to be detected by
staining with Coomassie Blue.
Figure 4.6: Electrophysiology of interdroplet bilayers containing differentCF systems mixtures and selected fractions. (a-c) Current traces for L1130(a), EasyXpress (b) and Expressway (c) complete reaction mixtures. (d-f)Current traces for L1130 (d), EasyXpress (e) and Expressway (f) lysatefractions, supplemented with buffer solution. (g-i) Current traces for L1130(g), EasyXpress (i) and Expressway (j) metabolic energy supply fractions,supplemented with buffer solution. An abrupt rise in current at the endof a trace indicates bilayer failure (a-f); corresponding insets show detailsof the current trace immediately before bilayer failure. The insets are anexpansion of the region of the main trace marked with an arrow while anasterisk signifies bilayer failure.

Chapter 4 Stability of interdroplet bilayers with cell-free expression mixtures 101
To investigate whether the bilayer destabilisation by the cell-free mixtures was due
to a high protein concentration, the effect of the lysate fractions were studied alone.
The lysates were diluted with buffer solution to achieve the same concentration as
in the total expression mixture, and subsequently one 2 µl droplet of diluted lysate
was placed in the oil reservoir and brought into contact with a 2 µl droplet of buffer
solution using the electrode array. As shown in Fig 4.6 d)-f), the lysates did not
give rise to bursts of bilayer current spikes, but bilayer destabilisation was evident
from the decreased bilayer lifetime. In contrast to the total mixtures shown in Fig
4.6 a)-c) the average lifetime of the lysates by themselves was different for the three
suppliers: 8 min for L1130 lysate and ∼30 seconds for EasyXpress and Expressway
lysates. The absence of pronounced current spikes and the significantly increased
bilayer lifetime observed with the L1130 lysate, suggest that it is not just the
protein-rich lysate that contributes to the bilayer destabilisation by the complete
CF expression solutions.
The ’energy mixture’ fractions, which contain the components for metabolic energy
generation, and sometimes also T7 RNA polymerase, were also investigated at a
dilution corresponding to the concentrations in the total mixture. The bilayer
current traces in Fig 4.4 g)-i) show low-intensity current spikes (up to 30 pA)
as well as large current steps (∼75 pA amplitude with a lifetime of several
Figure 4.7: SDS PAGE of the protein content of various components of cell-free expression mixtures. The lanes are loaded as follows: 1) SeeBlue Plus2 protein ladder with apparent molecular weights in kDa, 2) L1130 lysate,3) L1130 reaction buffer, 4) EasyXpress lysate, 5) EasyXpress reactionbuffer, 6) Expressway lysate, 7) Expressway reaction buffer, 8) ExpresswayT7 enzyme mixture, and 9) protein ladder. The 15% SDS-PAGE gel wasrun at 150 V for 75 mins in Tris-glycine buffer and stained with CoomassieBlue. The figure shows that the cell lysate fraction of the CF expressionsystems contain a large number of proteins.

102 Chapter 4 Stability of interdroplet bilayers with cell-free expression mixtures
Table 4.2: The stability of interdroplet bilayers formed with CF expressionmixtures and components. The composition of the two droplets is showntogether with the average lifetime of bilayers that failed within each 30-minute experiment.
Trans (ground) Cis n = No.fused Average lifetime (s)
Buffer Buffer 34 6 1140Amino Acids Buffer 3 0 -1 µg GFP DNA Buffer 3 0 -L1130 system Buffer 8 8 499L1130 lysate Buffer 3 3 520L1130 reaction mixture Buffer 3 0 -L1130 system L1130 system 5 5 153EasyXpress system Buffer 12 12 19EasyXpress lysate Buffer 4 4 20EasyXpress reaction mixture Buffer 3 0 -Expressway system Buffer 9 9 15Expressway lysate Buffer 7 7 171Expressway reaction mixture Buffer 3 0 -
seconds), which are not evident for the total cell-free expression mixtures or for
the lysate fractions. Despite these bilayer perturbations, the interdroplet bilayer
remained intact for 30 minutes for all the three energy mixtures, at which point
the measurement was terminated. It should be noted that the other fractions
of the cell-free mixtures, such as the amino acids and the T7 RNA polymerase
did not give rise to any bilayer perturbations or reduced bilayer lifetimes, and a
control experiment with DNA plasmid also resulted in a bilayer current similar to
that observed for pure buffer solution. A summary of the data obtained in this
subsection is shown in Table 4.2.
In summary, this subsection shows that interdroplet bilayers become unstable and
fuse within a few minutes when in the presence of a CF system. The possible
causes of this instability are investigated in the next section.
4.5 Interdroplet bilayers formed of pure protein
and polymers
In the previous subsection it was found that interdroplet bilayers failed rapidly
when one droplet contained a CF expression mixture. It has been previously
suggested that membrane destabilisation of CF systems to interdroplet layers could
be due to polyethylene glycol (PEG) or E.coli lipids (Syeda et al., 2008), while the
findings of the previous section also highlight the effect of high concentrations of

Chapter 4 Stability of interdroplet bilayers with cell-free expression mixtures 103
proteins. The aim of this section is to investigate the effect of these components
on the stability of interdroplet bilayers. The effect of lipids is studied in the next
section.
Polymer and proteins at different concentrations were all prepared in buffer
solution (150 mM KCl, pH 7.4). Interdroplet bilayers were formed by manipulating
a 2 µl droplet of the sample into contact with a 2µl droplet of buffer (150 mM
KCl, pH 7.4) using electrokinetic forces as described in section 3.2.5.3. Current
measurements were obtained under a holding potential of 100 mV as detailed in
section 3.2.1.
Cell-free expression mixtures based on S30 cell lysates contain proteins at a
concentration of ∼15 mg/ml (Patnaik et al., 1998; Freischmidt et al., 2010), which
is estimated to be equivalent to ∼0.11 mM. BSA, a positively charged protein,
and lysozyme, a negatively charged protein, were prepared at concentrations of
3 mM, 3 µM and 3 nM, for the effect of high concentrations of the protein
to be compared with the effect of much lower concentrations, where the latter
are closer to the typical range used for interdroplet bilayer experiments with ion
channels. Measurements of bilayers formed between a droplet with a nM protein
concentration and a droplet of pure buffer solution, depicted in Fig 4.8 a) and b),
show a stable baseline as observed for pure buffer, and the bilayer remains intact
for 30 minutes, after which the measurement was aborted. Similar results were
obtained at a concentration of 3 µM. Interestingly at the higher concentration of
3 mM the two proteins have a different effect on the bilayer, as shown in Fig 4.8
b) and d).
The negatively charged BSA causes a small number of current spikes prior to
failure of the bilayer, which happens before ∼65 sec on average (n=5), whereas
the positively charged lysozyme causes a large number of high-amplitude (up to
1.2 nA) bilayer current spikes, but these do not lead to bilayer failure within the
30-minute measurement period (n=3). Thus, the effects of a high concentration
of BSA and lysozyme are, respectively, reminiscent of the effect of cell lysates and
energy mixtures shown in the previous subsection. The polymer PEG 8000 is
added to cell-free reaction mixtures as a molecular crowding agent to compensate
for the dilution of the pure S30 lysate, typically to a concentration of 4-5% (w/v)
(Kigawa et al., 2004; Patnaik et al., 1998). The bilayer current was measured in
the presence of 0.1 or 10% PEG 8000 on one side of the interdroplet bilayer and
pure buffer solution on the other side. As shown in Fig 4.8 e),f), current spikes
were observed for both polymer concentrations, but occurred more frequently, as
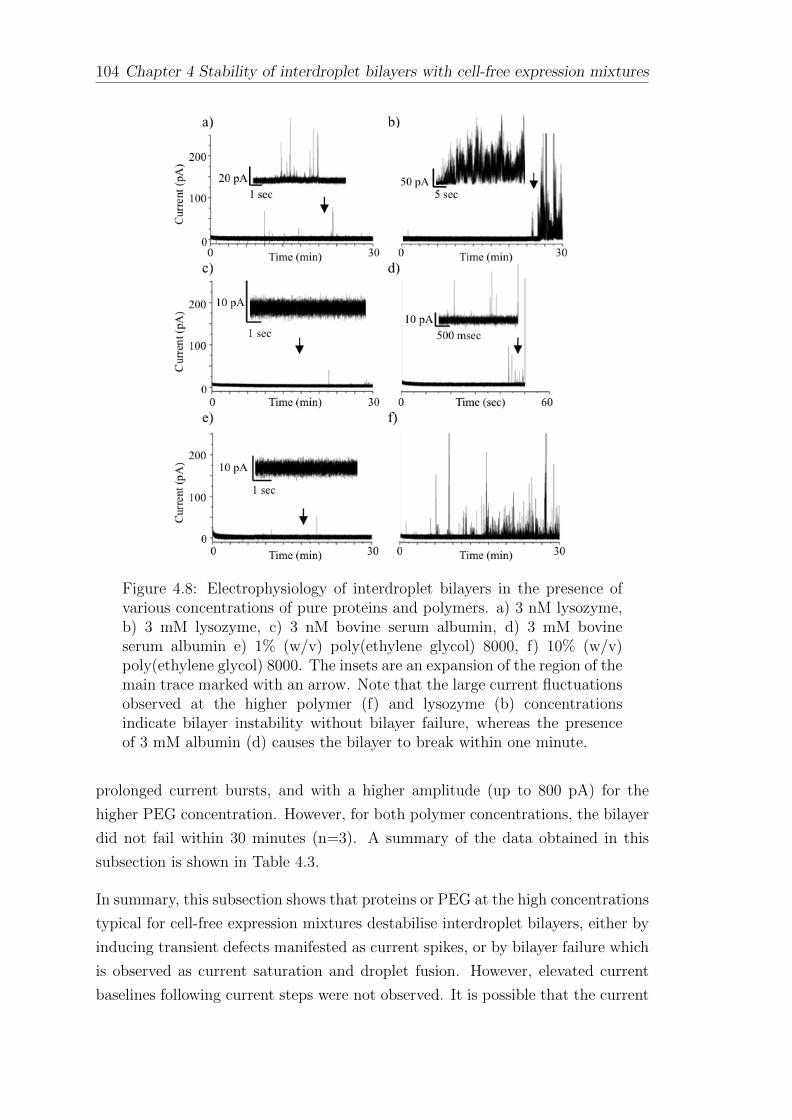
104 Chapter 4 Stability of interdroplet bilayers with cell-free expression mixtures
Figure 4.8: Electrophysiology of interdroplet bilayers in the presence ofvarious concentrations of pure proteins and polymers. a) 3 nM lysozyme,b) 3 mM lysozyme, c) 3 nM bovine serum albumin, d) 3 mM bovineserum albumin e) 1% (w/v) poly(ethylene glycol) 8000, f) 10% (w/v)poly(ethylene glycol) 8000. The insets are an expansion of the region of themain trace marked with an arrow. Note that the large current fluctuationsobserved at the higher polymer (f) and lysozyme (b) concentrationsindicate bilayer instability without bilayer failure, whereas the presenceof 3 mM albumin (d) causes the bilayer to break within one minute.
prolonged current bursts, and with a higher amplitude (up to 800 pA) for the
higher PEG concentration. However, for both polymer concentrations, the bilayer
did not fail within 30 minutes (n=3). A summary of the data obtained in this
subsection is shown in Table 4.3.
In summary, this subsection shows that proteins or PEG at the high concentrations
typical for cell-free expression mixtures destabilise interdroplet bilayers, either by
inducing transient defects manifested as current spikes, or by bilayer failure which
is observed as current saturation and droplet fusion. However, elevated current
baselines following current steps were not observed. It is possible that the current

Chapter 4 Stability of interdroplet bilayers with cell-free expression mixtures 105
Table 4.3: The stability of interdroplet bilayers formed in the presence ofpure proteins and polymers. The composition of the two droplets is showntogether with the average lifetime of bilayers that failed within each 30-minute experiment
Trans (ground) Cis n = No.fused Average lifetime (s)
3 nM BSA Buffer 3 0 -3 µM BSA Buffer 5 0 -3 mM BSA Buffer 5 5 623 mM BSA 3 mM BSA 4 4 163 nM Lysozyme Buffer 3 0 -3 µM Lysozyme Buffer 3 0 -3 mM Lysozyme Buffer 3 0 -0.1 % (w/v) PEG,8000 Buffer 3 0 -1.0 % (w/v) PEG,8000 Buffer 3 0 -10.0 % (w/v) PEG,8000 Buffer 3 0 -
fluctuations observed with lysozyme indicate electrostatic interactions with the
overall negatively charged asolectin bilayer, but it is difficult to explain the rapid
bilayer rupture observed for BSA.
4.6 Stabilisation of interdroplet bilayers formed
in the presence of CF systems
In the previous section, it was shown that high concentrations of proteins and
polymers can destabilise interdroplet bilayers, a problem that must be resolved
in order to achieve the coupled expression and characterisation of ion channels in
microdroplets.
In this section, the stability of interdroplet bilayers formed in the presence of cell-
free expression mixtures are studied in two ways: dilution of the cell-free mixture
and addition of lipid vesicles. The latter approach also serves to establish whether
bilayer destabilisation is a result of residual lipid molecules in the S30 lysates,
discussed in the previous section. The rationale of supplementing the cell-free
mixture with lipid vesicles is that additional lipid surface is provided, effectively
lowering the concentration of undesirable membrane-associating molecules at the
interdroplet bilayer. Also, when membrane proteins are expressed by cell-free
expression (e.g. in glass vials), vesicles are commonly added to prevent aggregation
of the produced proteins and to achieve protein incorporation in the vesicle bilayer
for subsequent proteoliposome assays, as discussed in section 2.3.2.
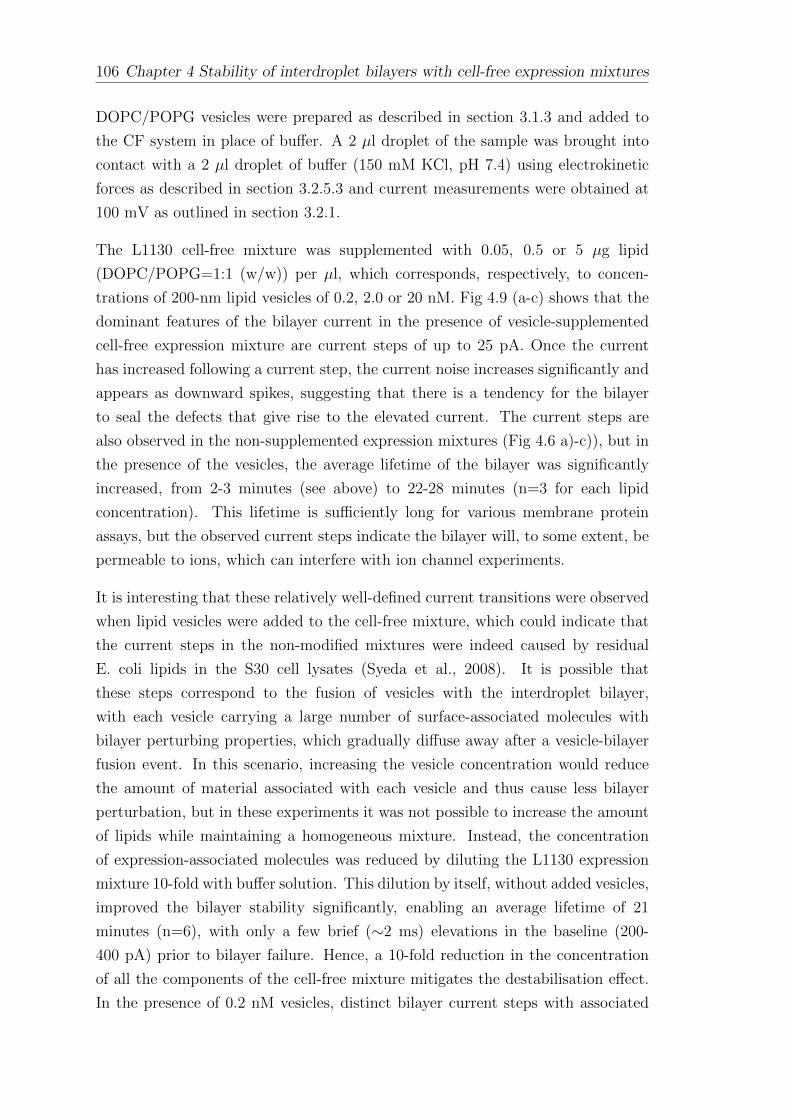
106 Chapter 4 Stability of interdroplet bilayers with cell-free expression mixtures
DOPC/POPG vesicles were prepared as described in section 3.1.3 and added to
the CF system in place of buffer. A 2 µl droplet of the sample was brought into
contact with a 2 µl droplet of buffer (150 mM KCl, pH 7.4) using electrokinetic
forces as described in section 3.2.5.3 and current measurements were obtained at
100 mV as outlined in section 3.2.1.
The L1130 cell-free mixture was supplemented with 0.05, 0.5 or 5 µg lipid
(DOPC/POPG=1:1 (w/w)) per µl, which corresponds, respectively, to concen-
trations of 200-nm lipid vesicles of 0.2, 2.0 or 20 nM. Fig 4.9 (a-c) shows that the
dominant features of the bilayer current in the presence of vesicle-supplemented
cell-free expression mixture are current steps of up to 25 pA. Once the current
has increased following a current step, the current noise increases significantly and
appears as downward spikes, suggesting that there is a tendency for the bilayer
to seal the defects that give rise to the elevated current. The current steps are
also observed in the non-supplemented expression mixtures (Fig 4.6 a)-c)), but in
the presence of the vesicles, the average lifetime of the bilayer was significantly
increased, from 2-3 minutes (see above) to 22-28 minutes (n=3 for each lipid
concentration). This lifetime is sufficiently long for various membrane protein
assays, but the observed current steps indicate the bilayer will, to some extent, be
permeable to ions, which can interfere with ion channel experiments.
It is interesting that these relatively well-defined current transitions were observed
when lipid vesicles were added to the cell-free mixture, which could indicate that
the current steps in the non-modified mixtures were indeed caused by residual
E. coli lipids in the S30 cell lysates (Syeda et al., 2008). It is possible that
these steps correspond to the fusion of vesicles with the interdroplet bilayer,
with each vesicle carrying a large number of surface-associated molecules with
bilayer perturbing properties, which gradually diffuse away after a vesicle-bilayer
fusion event. In this scenario, increasing the vesicle concentration would reduce
the amount of material associated with each vesicle and thus cause less bilayer
perturbation, but in these experiments it was not possible to increase the amount
of lipids while maintaining a homogeneous mixture. Instead, the concentration
of expression-associated molecules was reduced by diluting the L1130 expression
mixture 10-fold with buffer solution. This dilution by itself, without added vesicles,
improved the bilayer stability significantly, enabling an average lifetime of 21
minutes (n=6), with only a few brief (∼2 ms) elevations in the baseline (200-
400 pA) prior to bilayer failure. Hence, a 10-fold reduction in the concentration
of all the components of the cell-free mixture mitigates the destabilisation effect.
In the presence of 0.2 nM vesicles, distinct bilayer current steps with associated
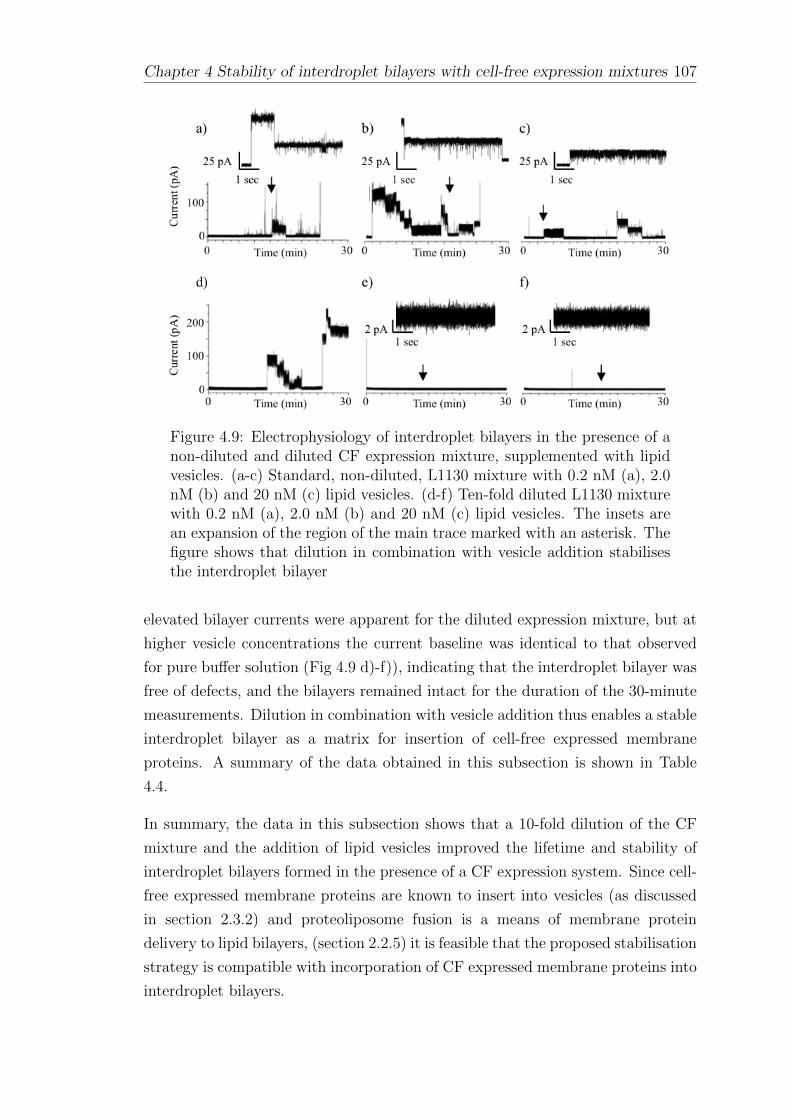
Chapter 4 Stability of interdroplet bilayers with cell-free expression mixtures 107
Figure 4.9: Electrophysiology of interdroplet bilayers in the presence of anon-diluted and diluted CF expression mixture, supplemented with lipidvesicles. (a-c) Standard, non-diluted, L1130 mixture with 0.2 nM (a), 2.0nM (b) and 20 nM (c) lipid vesicles. (d-f) Ten-fold diluted L1130 mixturewith 0.2 nM (a), 2.0 nM (b) and 20 nM (c) lipid vesicles. The insets arean expansion of the region of the main trace marked with an asterisk. Thefigure shows that dilution in combination with vesicle addition stabilisesthe interdroplet bilayer
elevated bilayer currents were apparent for the diluted expression mixture, but at
higher vesicle concentrations the current baseline was identical to that observed
for pure buffer solution (Fig 4.9 d)-f)), indicating that the interdroplet bilayer was
free of defects, and the bilayers remained intact for the duration of the 30-minute
measurements. Dilution in combination with vesicle addition thus enables a stable
interdroplet bilayer as a matrix for insertion of cell-free expressed membrane
proteins. A summary of the data obtained in this subsection is shown in Table
4.4.
In summary, the data in this subsection shows that a 10-fold dilution of the CF
mixture and the addition of lipid vesicles improved the lifetime and stability of
interdroplet bilayers formed in the presence of a CF expression system. Since cell-
free expressed membrane proteins are known to insert into vesicles (as discussed
in section 2.3.2) and proteoliposome fusion is a means of membrane protein
delivery to lipid bilayers, (section 2.2.5) it is feasible that the proposed stabilisation
strategy is compatible with incorporation of CF expressed membrane proteins into
interdroplet bilayers.
108 Chapter 4 Stability of interdroplet bilayers with cell-free expression mixtures
Table 4.4: The stabilisation of interdroplet bilayers. The composition ofthe two droplets is shown together with the average lifetime of bilayersthat failed within each 30-minute experiment
Trans (ground) Cis n = No.fused Average lifetime (s)
L1130 system & 0.2 nM of vesicles Buffer 3 3 1341L1130 system & 2.0 nM of vesicles Buffer 3 3 1288L1130 system & 20.0 nM of vesicles Buffer 3 2 1614L1130 system x 10 dilute Buffer 6 4 936L1130 system x 10 dilute & 0.2 nM of vesicles Buffer 3 1 1117L1130 system x 10 dilute & 2.0 nM of vesicles Buffer 3 0 -L1130 system x 10 dilute & 20.0 nM of vesicles Buffer 3 0 -
4.7 Summary
As the effect of concentrated protein solutions in general, and of CF mixtures in
particular, on lipid bilayers is not known (section 2.3.3) the interdroplet bilayer
electrophysiology system described in section 3.2.5 was used to study the stability
of bilayers exposed to different pre-incubated CF expression mixtures and their
comprising fractions. This led to the identification of the cell-lysates and the
energy mixtures being responsible for disrupting the membrane in section 4.4,
where two distinctly different types of destabilisation were observed; 1) sudden
bilayer failure and 2) current spikes and baseline fluctuations.
Sudden bilayer failure was also observed for high concentrations of BSA in section
4.5 where spikes in the baseline are also shown in representative concentrations of
PEG. Baseline fluctuations similar to those observed in section 4.4 were similarly
found when supplying vesicles to the system in section 4.6, yet vesicle addition
coupled with a 10x dilution of the CF system led to the stabilisation of the bilayer,
enabling measurements for longer than 30 minutes.
The stabilisation of interdroplet bilayers in the presence of the pre-incubated CF
system is a milestone toward achieving the coupled expression and characterisation
of ion channels, which could be realised if ion channels can be expressed by the
CF system and can self-insert into the bilayer for characterisation.
Chapter 5
The cell-free expression of ion
channels
As outlined in Chapter 1, the aim of this study was to determine whether the CF
expression and characterisation of ion channels could be coupled in microdroplets.
This motivated the study of the bilayer stability in the presence of the CF system
in Chapter 4 where, to determine the intrinsic effect of the mixture on the bilayer
stability, three commercial pre-incubated CF systems were screened without the
addition of a DNA template. This led to the stabilisation of interdroplet bilayers
through a combination of dilution and the addition of vesicles but did not address
the ability of the CF systems to express ion channels.
The focus of this chapter is therefore to demonstrate and quantify the capability
the CF system to express ion channels from the DNA templates engineered in
section 3.1.1 and to determine the yield dependence on the presence of DNA and
vesicles. This methodology is developed in the first part of the chapter for His-
tagged KcsA and then applied to the full-length KvAP channel, a substantially
larger channel containing an extramembranous domain, before being attempted
with the hERG pore domain.
5.1 The cell-free expression of KcsA
This section details the CF expression of the KcsA channel, discussed in detail in
section 2.4.1, and outlines the methods developed to verify that the protein was
successfully expressed
109
110 Chapter 5 The cell-free expression of ion channels
5.1.1 Western blotting of cell-free expressed His-tagged
KcsA
As shown in section 3.1.11, verifying the expression of KcsA is complicated by
the number of proteins at high concentrations present in the CF system. This
motivated the use of Western blotting (section 2.2.4) to identify CF His-tagged
KcsA. Dr. Natalie Smithers performed the Western transfer, staining and imaging.
Eight CF reactions were prepared to 50 µl as detailed in section 3.1.4. Two
contained no DNA, two contained 0.5 µg of KcsA DNA, two contained 1 µg of
KcsA DNA while the two remaining reactions contained 2 µg of KcsA DNA. One
of each sample was incubated at 37◦C for 2 hours while the remaining sample for
each condition was kept at room temperature. Three 1.5 mm thick 10 % gels were
prepared as described in section 3.1.6, except a 5 well comb was used to allow for
the entire 50 µl samples to be loaded.
The first gel contained 20 µl of SeeBlue Plus2 protein standard in the first lane
while the second and third lanes contained purified His-tagged GFP and KcsA
protein expressed in-vivo, prepared by Dr. Natalie Smithers as detailed in section
3.1.2. The GFP sample was prepared by taking 15 µl of the sample, adding
35 µl of nuclease free water and mixing with 50 µl of 5 x loading buffer. The
concentration of the GFP protein was unclear since other proteins were present in
the final eluate. The KcsA sample was prepared by taking 10 µl of the protein,
adding 40 µl of nuclease-free water and 50 µl of 5 x loading buffer. The amount of
the His-tagged protein loaded was 57 µg. Lane 4 contained the CF mixture with
no DNA after 2 hour incubation at 37◦C. This sample was mixed with 50 µl of 5 x
loading buffer. The second gel contained 20 µl of SeeBlue Plus2 protein standard
in the first lane, pre-mixed with 30 µl of nuclease free water as in the first gel.
Lanes 2, 3 and 4 contained the CF mixtures containing 0.5 µg of KcsA DNA, 1 µg
of KcsA and 2 µg of KcsA DNA respectively. Each sample was incubated at 37◦C
for 2 hours and loaded as described above with 50 µl of 5 x loading buffer. Lane
5 contained KcsA protein, prepared as in the first gel. The third gel was identical
to the second gel except that the samples incubated at room temperature were
used in lanes 2-4. The three gels were run together for 75 minutes at 150 V prior
to Western transfer (as detailed in sections 3.1.6 and 3.1.7.
The Coomassie stained gels after Western transfer to the nitrocellulose paper are
shown in parts a), c) and d) of Fig 5.1 where a)-b), c)-d) and e)-f) correspond
to gels one, two and three respectively. Although each gel shows the almost

Chapter 5 The cell-free expression of ion channels 111
Figure 5.1: Western blot of CF expressed KcsA. Three SDS Page gelswere run and transferred onto nitrocellulose paper for antibody detection.The SDS page gels are shown in parts a), c) and e) of Fig 5.3 whilethe photographic impression of the luminescence released by the boundsecondary antibody is shown in parts b), d) and f). Lane 1 of all gelscontained the molecular weight standard See Blue Plus 2. a-b) Lane 2contained purified His-tagged GFP, lane 3 purified His-tagged KcsA andthe cell-free mixture with no DNA after a 2 hour incubation at 37◦C wasloaded into Lane 4. c-d) Lanes 2, 3 and 4 contained the cell-free mixturewith 0.5 µg, 1 µg and 2 µg of KcsA DNA respectively incubated at 37◦C for2 hours and Lane 5 contained purified KcsA protein. e-f) Was a duplicateof c-d) except the samples were incubated at room temperature. KcsA isnot identified in either the samples or the control and the data shows alarge amount of non-specific binding by the primary anti-HN antibody.
complete transfer of the protein ladder there remains a large amount of protein in
the remaining lanes, indicating that not all of the protein was transferred to the
nitrocellulose.
112 Chapter 5 The cell-free expression of ion channels
The imaged blotting paper from gel one is shown in Fig 5.1 a), where multiple
proteins are detected in lane 2, containing the His-tagged GFP control compared
to fewer in lane 3 containing the His-tagged KcsA control. As no DNA was
supplied to CF mix in lane 4, no tagged proteins should be present. However
the image shows that a huge number of proteins are detected as indicated by the
luminescence spanning the entire lane, inside of which three pronounced bands are
more clearly seen. This indicates that the primary anti-HN antibody is binding
non-specifically to the protein sample, with the secondary antibody subsequently
binding to the primary antibody leading to the signal observed. The same outcome
was observed for the second and third gels as shown in Fig 5.1 c) and e), where
all lanes containing the CF system display similar levels of non-specific binding.
This is interesting given the signal observed on the blotting paper in the lanes
containing the CF system and most likely reflects the scale of the amount of protein
loaded onto the gel, which may negatively influence the specificity of the binding of
the primary antibody. With this in mind, the pieces of nitrocellulose were stripped
of both antibodies, blocked with a higher concentration of milk and re-probed with
the same primary antibody and an IR dye conjugated secondary antibody for direct
imaging using a LI-COR ODYSSEY infrared imager. However no improvement
was observed (data not shown), which again points toward the specificity of the
primary antibody. One possibility could be that the huge number of proteins on
the blotting paper compromise the specificity of the primary antibody, but this
would then bring into question why no signal was obtained for the control sample.
This may be explained by the gels in Fig 5.1 which show that a considerable
amount of the control sample was retained on each gel and thus not transferred
to the nitrocellulose.
In summary, the data shows that the CF protein expression product was not
successfully detected using Western Blotting, indicating that protein purification
may be required to identify the CF expressed protein of interest on an SDS PAGE
gel, which is investigated in the next subsection.
5.1.2 Affinity-bead purification of cell-free expressed His-
tagged KcsA
The presence of the His-tag introduced for Western Blotting also allows for the
purification of CF expressed proteins using nickel beads functionalised with a
nitrilotriacetic acid resin as explained in detail in Chapter 3, section 3.1.5. This
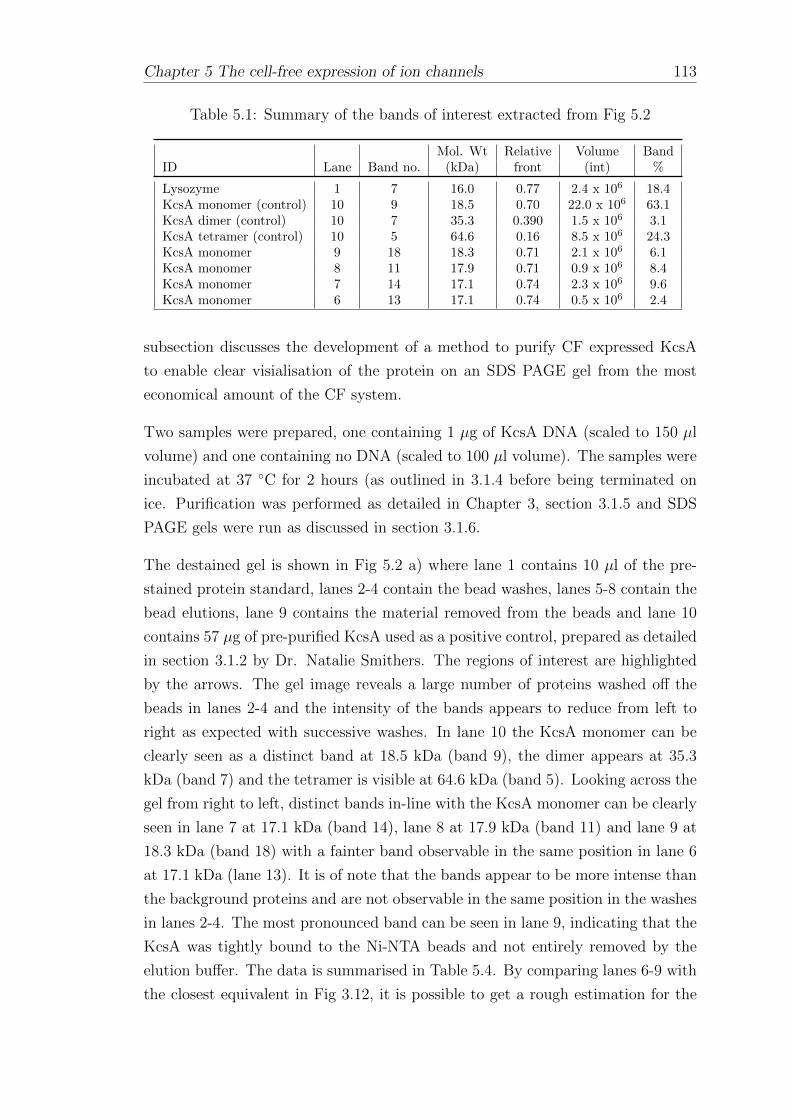
Chapter 5 The cell-free expression of ion channels 113
Table 5.1: Summary of the bands of interest extracted from Fig 5.2
Mol. Wt Relative Volume BandID Lane Band no. (kDa) front (int) %
Lysozyme 1 7 16.0 0.77 2.4 x 10⁶ 18.4KcsA monomer (control) 10 9 18.5 0.70 22.0 x 10⁶ 63.1KcsA dimer (control) 10 7 35.3 0.390 1.5 x 10⁶ 3.1KcsA tetramer (control) 10 5 64.6 0.16 8.5 x 10⁶ 24.3KcsA monomer 9 18 18.3 0.71 2.1 x 10⁶ 6.1KcsA monomer 8 11 17.9 0.71 0.9 x 10⁶ 8.4KcsA monomer 7 14 17.1 0.74 2.3 x 10⁶ 9.6KcsA monomer 6 13 17.1 0.74 0.5 x 10⁶ 2.4
subsection discusses the development of a method to purify CF expressed KcsA
to enable clear visialisation of the protein on an SDS PAGE gel from the most
economical amount of the CF system.
Two samples were prepared, one containing 1 µg of KcsA DNA (scaled to 150 µl
volume) and one containing no DNA (scaled to 100 µl volume). The samples were
incubated at 37 ◦C for 2 hours (as outlined in 3.1.4 before being terminated on
ice. Purification was performed as detailed in Chapter 3, section 3.1.5 and SDS
PAGE gels were run as discussed in section 3.1.6.
The destained gel is shown in Fig 5.2 a) where lane 1 contains 10 µl of the pre-
stained protein standard, lanes 2-4 contain the bead washes, lanes 5-8 contain the
bead elutions, lane 9 contains the material removed from the beads and lane 10
contains 57 µg of pre-purified KcsA used as a positive control, prepared as detailed
in section 3.1.2 by Dr. Natalie Smithers. The regions of interest are highlighted
by the arrows. The gel image reveals a large number of proteins washed off the
beads in lanes 2-4 and the intensity of the bands appears to reduce from left to
right as expected with successive washes. In lane 10 the KcsA monomer can be
clearly seen as a distinct band at 18.5 kDa (band 9), the dimer appears at 35.3
kDa (band 7) and the tetramer is visible at 64.6 kDa (band 5). Looking across the
gel from right to left, distinct bands in-line with the KcsA monomer can be clearly
seen in lane 7 at 17.1 kDa (band 14), lane 8 at 17.9 kDa (band 11) and lane 9 at
18.3 kDa (band 18) with a fainter band observable in the same position in lane 6
at 17.1 kDa (lane 13). It is of note that the bands appear to be more intense than
the background proteins and are not observable in the same position in the washes
in lanes 2-4. The most pronounced band can be seen in lane 9, indicating that the
KcsA was tightly bound to the Ni-NTA beads and not entirely removed by the
elution buffer. The data is summarised in Table 5.4. By comparing lanes 6-9 with
the closest equivalent in Fig 3.12, it is possible to get a rough estimation for the
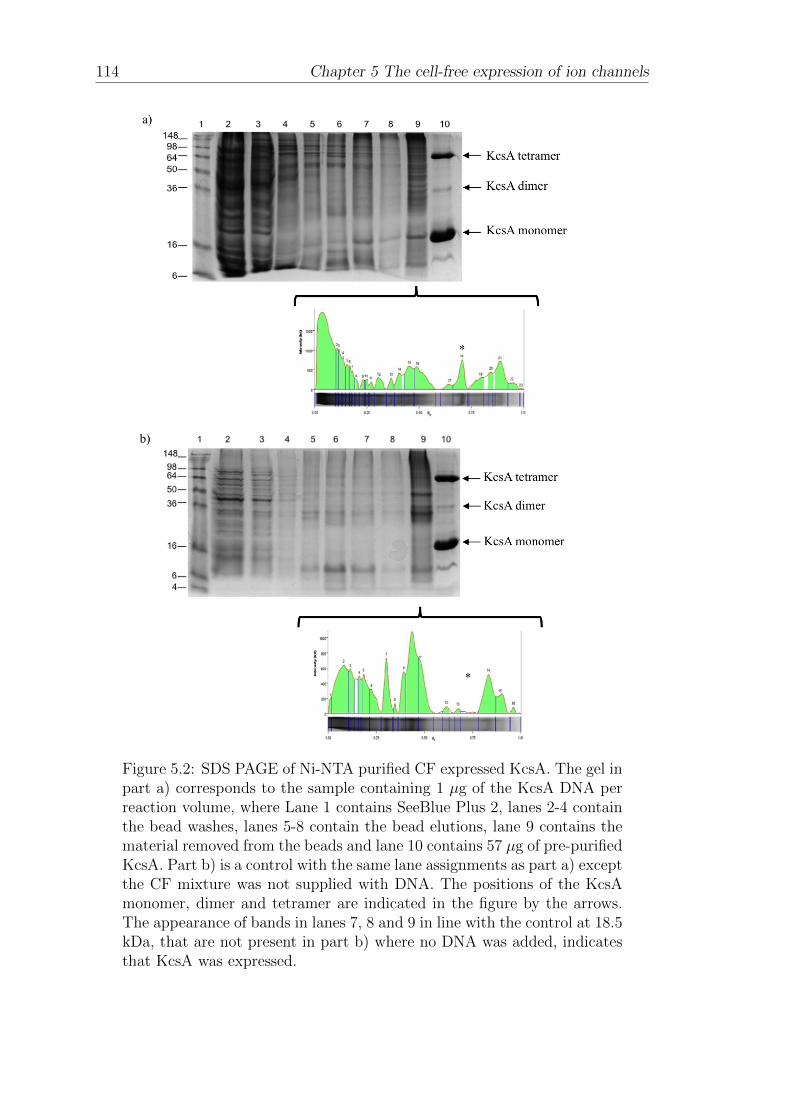
114 Chapter 5 The cell-free expression of ion channels
Figure 5.2: SDS PAGE of Ni-NTA purified CF expressed KcsA. The gel inpart a) corresponds to the sample containing 1 µg of the KcsA DNA perreaction volume, where Lane 1 contains SeeBlue Plus 2, lanes 2-4 containthe bead washes, lanes 5-8 contain the bead elutions, lane 9 contains thematerial removed from the beads and lane 10 contains 57 µg of pre-purifiedKcsA. Part b) is a control with the same lane assignments as part a) exceptthe CF mixture was not supplied with DNA. The positions of the KcsAmonomer, dimer and tetramer are indicated in the figure by the arrows.The appearance of bands in lanes 7, 8 and 9 in line with the control at 18.5kDa, that are not present in part b) where no DNA was added, indicatesthat KcsA was expressed.
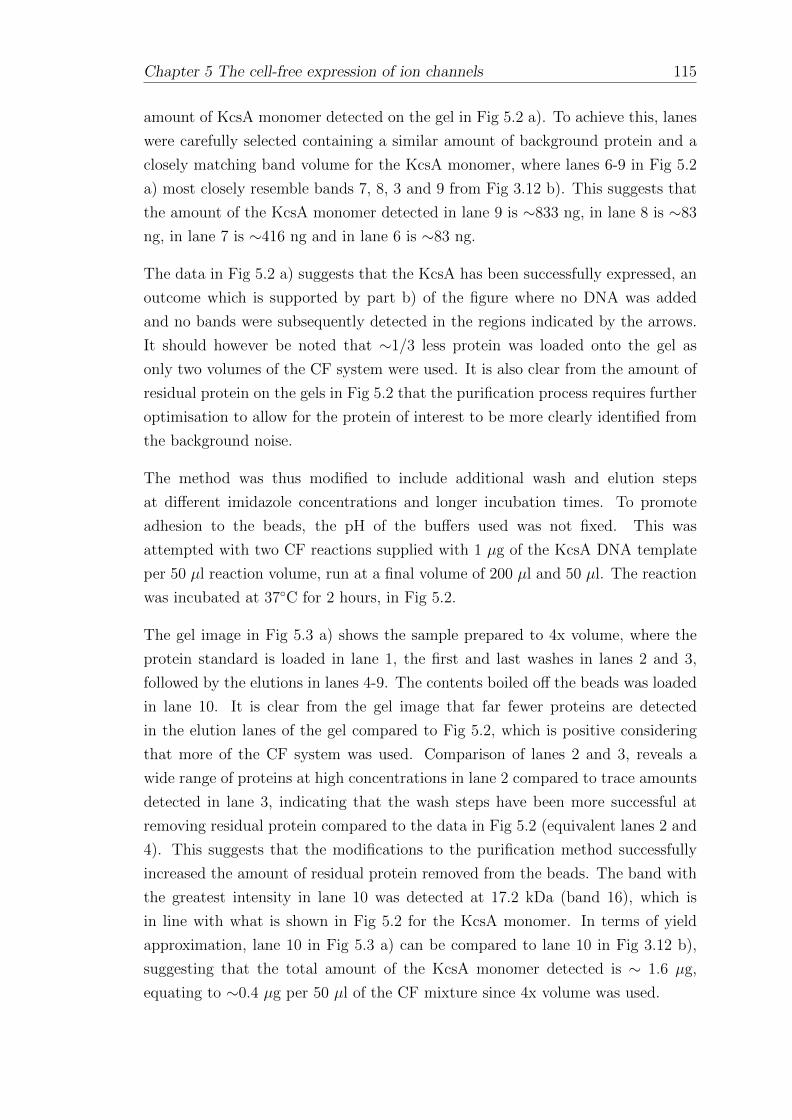
Chapter 5 The cell-free expression of ion channels 115
amount of KcsA monomer detected on the gel in Fig 5.2 a). To achieve this, lanes
were carefully selected containing a similar amount of background protein and a
closely matching band volume for the KcsA monomer, where lanes 6-9 in Fig 5.2
a) most closely resemble bands 7, 8, 3 and 9 from Fig 3.12 b). This suggests that
the amount of the KcsA monomer detected in lane 9 is ∼833 ng, in lane 8 is ∼83
ng, in lane 7 is ∼416 ng and in lane 6 is ∼83 ng.
The data in Fig 5.2 a) suggests that the KcsA has been successfully expressed, an
outcome which is supported by part b) of the figure where no DNA was added
and no bands were subsequently detected in the regions indicated by the arrows.
It should however be noted that ∼1/3 less protein was loaded onto the gel as
only two volumes of the CF system were used. It is also clear from the amount of
residual protein on the gels in Fig 5.2 that the purification process requires further
optimisation to allow for the protein of interest to be more clearly identified from
the background noise.
The method was thus modified to include additional wash and elution steps
at different imidazole concentrations and longer incubation times. To promote
adhesion to the beads, the pH of the buffers used was not fixed. This was
attempted with two CF reactions supplied with 1 µg of the KcsA DNA template
per 50 µl reaction volume, run at a final volume of 200 µl and 50 µl. The reaction
was incubated at 37◦C for 2 hours, in Fig 5.2.
The gel image in Fig 5.3 a) shows the sample prepared to 4x volume, where the
protein standard is loaded in lane 1, the first and last washes in lanes 2 and 3,
followed by the elutions in lanes 4-9. The contents boiled off the beads was loaded
in lane 10. It is clear from the gel image that far fewer proteins are detected
in the elution lanes of the gel compared to Fig 5.2, which is positive considering
that more of the CF system was used. Comparison of lanes 2 and 3, reveals a
wide range of proteins at high concentrations in lane 2 compared to trace amounts
detected in lane 3, indicating that the wash steps have been more successful at
removing residual protein compared to the data in Fig 5.2 (equivalent lanes 2 and
4). This suggests that the modifications to the purification method successfully
increased the amount of residual protein removed from the beads. The band with
the greatest intensity in lane 10 was detected at 17.2 kDa (band 16), which is
in line with what is shown in Fig 5.2 for the KcsA monomer. In terms of yield
approximation, lane 10 in Fig 5.3 a) can be compared to lane 10 in Fig 3.12 b),
suggesting that the total amount of the KcsA monomer detected is ∼ 1.6 µg,
equating to ∼0.4 µg per 50 µl of the CF mixture since 4x volume was used.
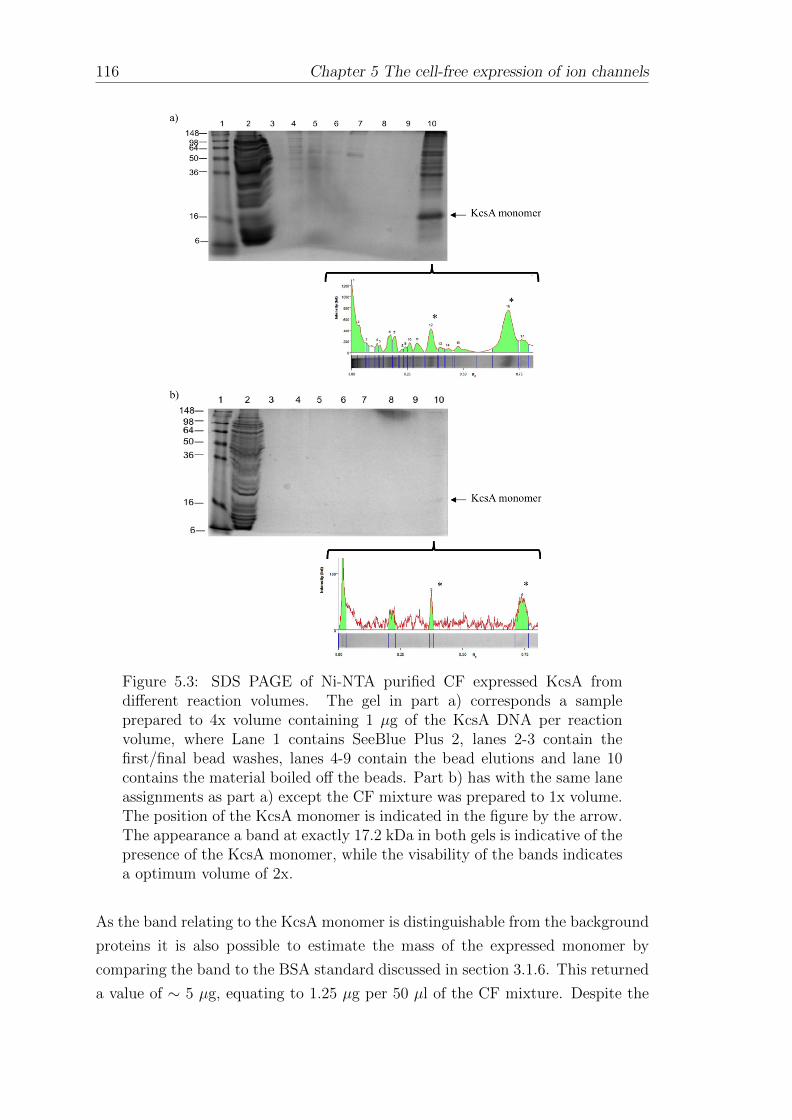
116 Chapter 5 The cell-free expression of ion channels
Figure 5.3: SDS PAGE of Ni-NTA purified CF expressed KcsA fromdifferent reaction volumes. The gel in part a) corresponds a sampleprepared to 4x volume containing 1 µg of the KcsA DNA per reactionvolume, where Lane 1 contains SeeBlue Plus 2, lanes 2-3 contain thefirst/final bead washes, lanes 4-9 contain the bead elutions and lane 10contains the material boiled off the beads. Part b) has with the same laneassignments as part a) except the CF mixture was prepared to 1x volume.The position of the KcsA monomer is indicated in the figure by the arrow.The appearance a band at exactly 17.2 kDa in both gels is indicative of thepresence of the KcsA monomer, while the visability of the bands indicatesa optimum volume of 2x.
As the band relating to the KcsA monomer is distinguishable from the background
proteins it is also possible to estimate the mass of the expressed monomer by
comparing the band to the BSA standard discussed in section 3.1.6. This returned
a value of ∼ 5 µg, equating to 1.25 µg per 50 µl of the CF mixture. Despite the
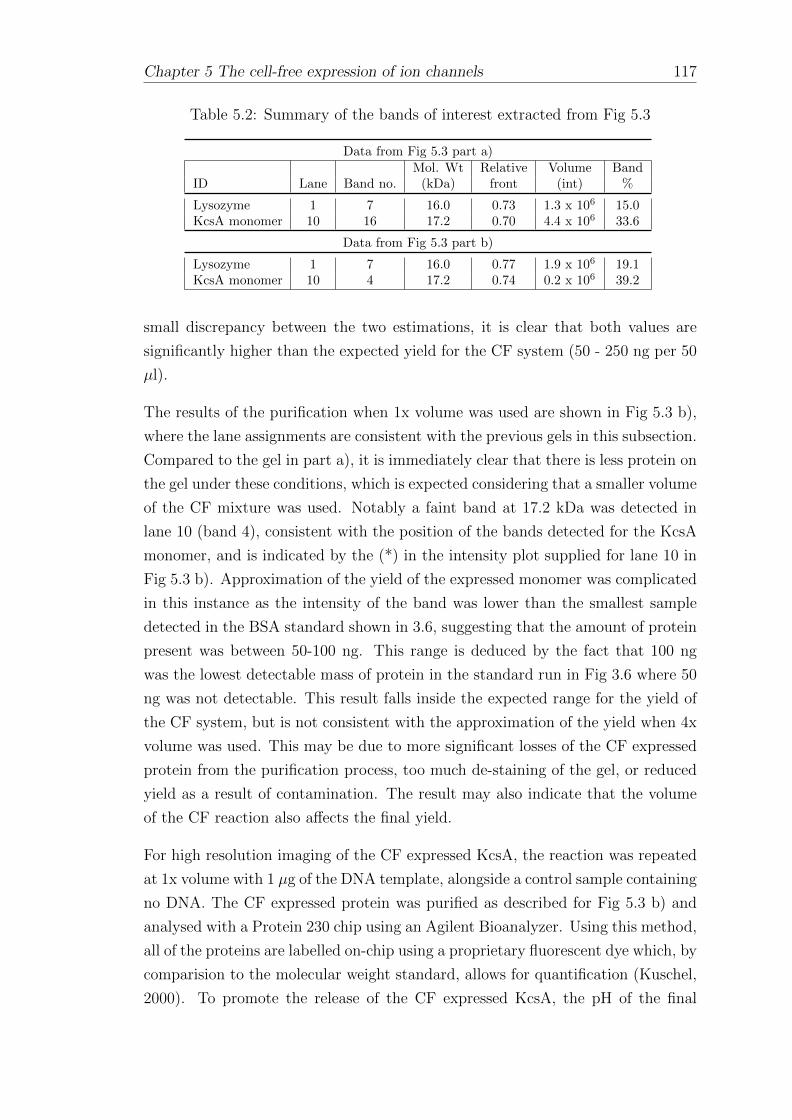
Chapter 5 The cell-free expression of ion channels 117
Table 5.2: Summary of the bands of interest extracted from Fig 5.3
Data from Fig 5.3 part a)Mol. Wt Relative Volume Band
ID Lane Band no. (kDa) front (int) %
Lysozyme 1 7 16.0 0.73 1.3 x 10⁶ 15.0KcsA monomer 10 16 17.2 0.70 4.4 x 10⁶ 33.6
Data from Fig 5.3 part b)
Lysozyme 1 7 16.0 0.77 1.9 x 10⁶ 19.1KcsA monomer 10 4 17.2 0.74 0.2 x 10⁶ 39.2
small discrepancy between the two estimations, it is clear that both values are
significantly higher than the expected yield for the CF system (50 - 250 ng per 50
µl).
The results of the purification when 1x volume was used are shown in Fig 5.3 b),
where the lane assignments are consistent with the previous gels in this subsection.
Compared to the gel in part a), it is immediately clear that there is less protein on
the gel under these conditions, which is expected considering that a smaller volume
of the CF mixture was used. Notably a faint band at 17.2 kDa was detected in
lane 10 (band 4), consistent with the position of the bands detected for the KcsA
monomer, and is indicated by the (*) in the intensity plot supplied for lane 10 in
Fig 5.3 b). Approximation of the yield of the expressed monomer was complicated
in this instance as the intensity of the band was lower than the smallest sample
detected in the BSA standard shown in 3.6, suggesting that the amount of protein
present was between 50-100 ng. This range is deduced by the fact that 100 ng
was the lowest detectable mass of protein in the standard run in Fig 3.6 where 50
ng was not detectable. This result falls inside the expected range for the yield of
the CF system, but is not consistent with the approximation of the yield when 4x
volume was used. This may be due to more significant losses of the CF expressed
protein from the purification process, too much de-staining of the gel, or reduced
yield as a result of contamination. The result may also indicate that the volume
of the CF reaction also affects the final yield.
For high resolution imaging of the CF expressed KcsA, the reaction was repeated
at 1x volume with 1 µg of the DNA template, alongside a control sample containing
no DNA. The CF expressed protein was purified as described for Fig 5.3 b) and
analysed with a Protein 230 chip using an Agilent Bioanalyzer. Using this method,
all of the proteins are labelled on-chip using a proprietary fluorescent dye which, by
comparision to the molecular weight standard, allows for quantification (Kuschel,
2000). To promote the release of the CF expressed KcsA, the pH of the final
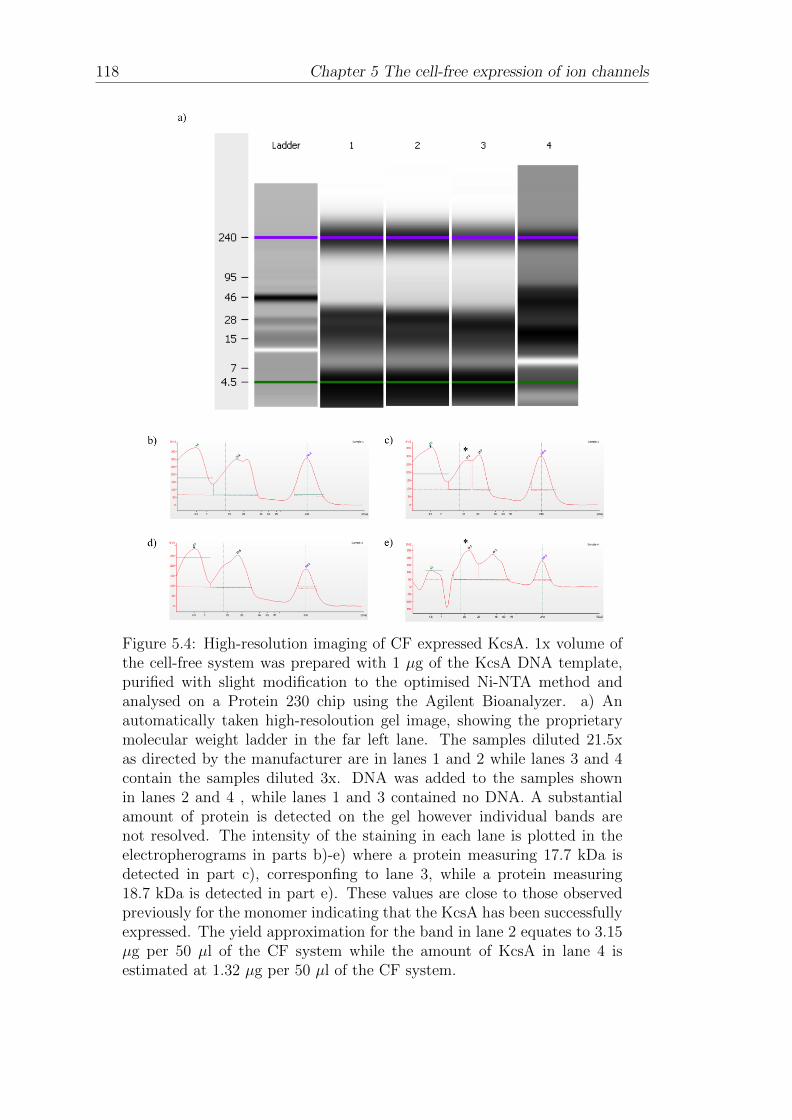
118 Chapter 5 The cell-free expression of ion channels
Figure 5.4: High-resolution imaging of CF expressed KcsA. 1x volume ofthe cell-free system was prepared with 1 µg of the KcsA DNA template,purified with slight modification to the optimised Ni-NTA method andanalysed on a Protein 230 chip using the Agilent Bioanalyzer. a) Anautomatically taken high-resoloution gel image, showing the proprietarymolecular weight ladder in the far left lane. The samples diluted 21.5xas directed by the manufacturer are in lanes 1 and 2 while lanes 3 and 4contain the samples diluted 3x. DNA was added to the samples shownin lanes 2 and 4 , while lanes 1 and 3 contained no DNA. A substantialamount of protein is detected on the gel however individual bands arenot resolved. The intensity of the staining in each lane is plotted in theelectropherograms in parts b)-e) where a protein measuring 17.7 kDa isdetected in part c), corresponfing to lane 3, while a protein measuring18.7 kDa is detected in part e). These values are close to those observedpreviously for the monomer indicating that the KcsA has been successfullyexpressed. The yield approximation for the band in lane 2 equates to 3.15µg per 50 µl of the CF system while the amount of KcsA in lane 4 isestimated at 1.32 µg per 50 µl of the CF system.

Chapter 5 The cell-free expression of ion channels 119
elution solution was buffered to pH 7.0. Samples were analysed as directed by the
manufacturer, involving a 21.5x dilution, and with a lower 3x dilution in attempt
to emphasise any proteins at low concentrations. The results in Fig 5.4 show the
high-resolution gel image of the 4 lanes in part a) and the electropherograms of each
lane in parts b)-e). The molecular weight standard is shown in the far left lane,
where the intensity of the first and last band are used for internal calibration of
the system. Lanes 1 and 2 contain the 21.5x diluted sample with lane 1 containing
the control sample with no DNA. Lanes 3 and 4 contain the 3x diluted sample,
where lane 3 contained no DNA. A considerable amount of staining is seen in each
of the 4 lanes, the intensity of which is plotted in the electropherograms. Although
clear bands are not visually distinguishable from the high-resolution gel image, the
peaks are readily identifiable from the electropherograms, enabling two bands to
be detected at 17.7 and 18.7 kD in lanes c) and e), which are not present in the
lanes containing the control. These measurements are close to the values obtained
for the KcsA monomer in Figs 5.2 and 5.3, indicating that the protein has been
successfully expressed and detected.
One advantage of using the on-chip system is that it provides an estimation of
the protein concentration, which is automatically approximated relative to the
intensities of the first and last bands in the ladder. This returns a value of 63.1
ng/µl for the peak at 17.7 kDa in lane 2, equating to a total yield of 3.15 µg
per 50 µl. The 18.7 kDa band in lane 4 is estimated at 188.9 ng/µl, which
scales to 26.38 µg/µl accounting for the dilution and equates to 1.32 µg per 50
µl. A discrepancy between the two estimations is expected for different levels of
dilution as indicated by the manufacturer. Noticeably, the on-chip approximations
for protein yield are generally higher compared to previous estimations in this
subsection. The exception is the 1.25 µg per 50 µl approximated for Fig 5.3 a),
which is close to the value of 1.32 µg per 50 µl mentioned above for lane 4 of
Fig 5.4. The overall higher approximations of the on-chip method could be a
reflection of the direct method of staining, with no requirement for de-staining as
with the Coomassie stained gels, however more repeats of the experiment would be
necessary to support this inference and to validate the approximation supplied by
the system. The ambiguity of the high-resolution gel image also indicates that the
Table 5.3: Summary of the bands of interest extracted from Fig 5.3
Mol. Wt Relative BandID Lane (kDa) concentration (ng/µl) %
KcsA monomer 2 17.2 63.1 54.1KcsA monomer 4 18.7 188.9 51.0

120 Chapter 5 The cell-free expression of ion channels
process requires further optimisation while in comparison, the conventional SDS
PAGE gels shown previously allow for the purified protein to be clearly visualised
provided the reaction is performed at a suitable volume.
In summary, the data in this subsection shows that the KcsA template engineered
in section 3.1.1 was successfully expressed using a commercial CF expression
system. The KcsA monomer was easily detected when the reaction was performed
at 4x volume, but difficult when performed at 1x volume. This indicates that a
compromise of 2x volume is sufficient and cost-effective for future experiments.
By isolating CF expressed proteins from the CF mixture, this method also allows
for the factors determining protein yield to be studied. This is addressed in the
following subsections.
5.1.3 Dependence of KcsA expression yield on the amount
of DNA template
Previous reports have shown that the final yield of the CF expression reaction is
sensitive to the amount of DNA added to the system. This was shown with eGFP,
where the amount of protein expressed was reported to increase by raising the
amount of DNA supplied to the system from 0.03 µg/µl to 0.24 µg/µl (Roos
et al., 2013). In contrast, when expressing the Firefly luciferase protein the
amount of protein expressed was shown to rise and slowly fall between plasmid
concentrations of 0.01 nM and 1 nM (Noireaux et al., 2005). These reports indicate
that the amount of DNA supplied to the CF system has an influence on the protein
yield and the purpose of this subection is to determine whether the same effect is
observed with CF expressed KcsA.
The expression was performed at 37 ◦C for 2 hours using 2x volume with 0 µg,
3 µg and 6 µg of KcsA DNA per 50 µl of the CF system. The reactions were
terminated on ice, purified as described in section 3.1.5 and run on SDS PAGE
gels.
The gel image in Fig 5.5 a) shows the purified CF mixture where no DNA was
added. Consistent with the previous gels, a large amount of residual protein is
detected in lane 2 relating to the first wash, no proteins are detected in the elution
lanes 4-9, while some residual protein was removed from the beads in lane 10. Here
a small amount of protein ∼36 kDa and above is observable, which is similar to
the region where the KcsA dimer has been observed in Fig 5.2, however there are
no detectable bands in the position for the KcsA monomer, at 19 kDa or below.

Chapter 5 The cell-free expression of ion channels 121
Figure 5.5: Dependence of the KcsA expression yield on the amountof DNA template. SDS PAGE of Ni-NTA purified CF expressed KcsAexpressed in the presence of a) 0 µg, b) 3 µg and c) 6 µg of KcsA DNA.The appearance of an intensifying band at ∼17 kDa is shown in parts b)and c) of the figure and indicated by the asterisk. The data suggests thatmore KcsA is expressed as the amount of DNA is increased to the system.
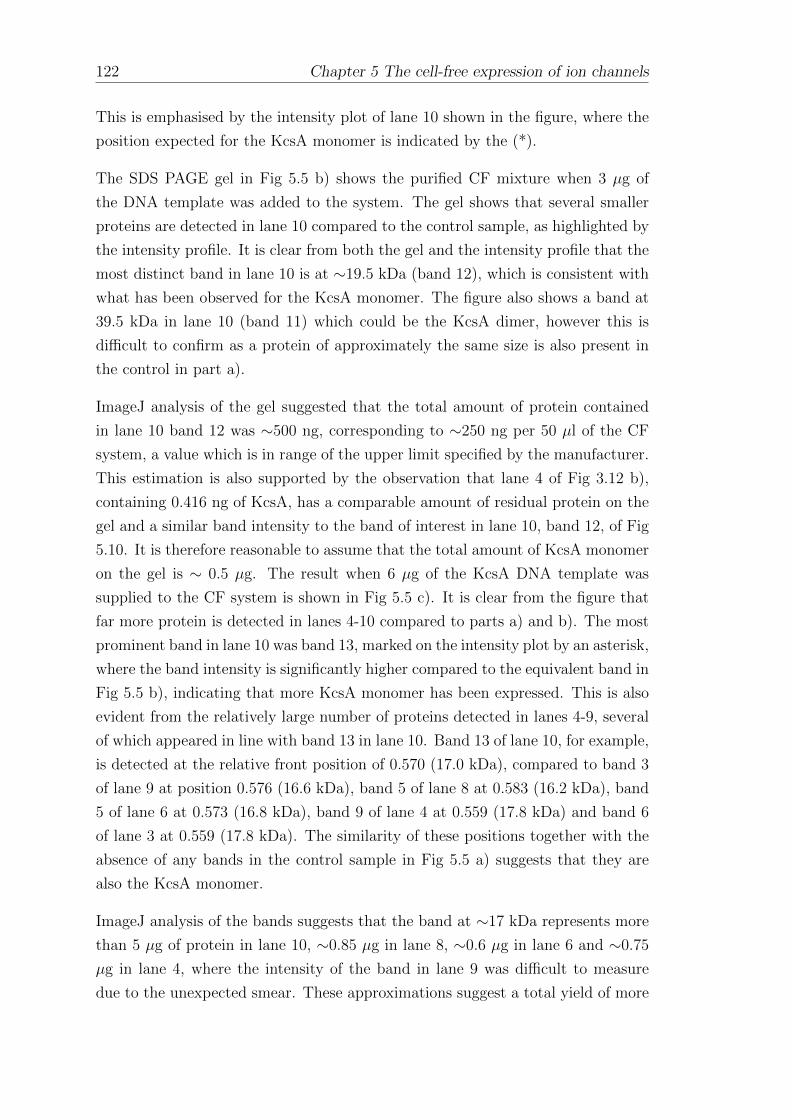
122 Chapter 5 The cell-free expression of ion channels
This is emphasised by the intensity plot of lane 10 shown in the figure, where the
position expected for the KcsA monomer is indicated by the (*).
The SDS PAGE gel in Fig 5.5 b) shows the purified CF mixture when 3 µg of
the DNA template was added to the system. The gel shows that several smaller
proteins are detected in lane 10 compared to the control sample, as highlighted by
the intensity profile. It is clear from both the gel and the intensity profile that the
most distinct band in lane 10 is at ∼19.5 kDa (band 12), which is consistent with
what has been observed for the KcsA monomer. The figure also shows a band at
39.5 kDa in lane 10 (band 11) which could be the KcsA dimer, however this is
difficult to confirm as a protein of approximately the same size is also present in
the control in part a).
ImageJ analysis of the gel suggested that the total amount of protein contained
in lane 10 band 12 was ∼500 ng, corresponding to ∼250 ng per 50 µl of the CF
system, a value which is in range of the upper limit specified by the manufacturer.
This estimation is also supported by the observation that lane 4 of Fig 3.12 b),
containing 0.416 ng of KcsA, has a comparable amount of residual protein on the
gel and a similar band intensity to the band of interest in lane 10, band 12, of Fig
5.10. It is therefore reasonable to assume that the total amount of KcsA monomer
on the gel is ∼ 0.5 µg. The result when 6 µg of the KcsA DNA template was
supplied to the CF system is shown in Fig 5.5 c). It is clear from the figure that
far more protein is detected in lanes 4-10 compared to parts a) and b). The most
prominent band in lane 10 was band 13, marked on the intensity plot by an asterisk,
where the band intensity is significantly higher compared to the equivalent band in
Fig 5.5 b), indicating that more KcsA monomer has been expressed. This is also
evident from the relatively large number of proteins detected in lanes 4-9, several
of which appeared in line with band 13 in lane 10. Band 13 of lane 10, for example,
is detected at the relative front position of 0.570 (17.0 kDa), compared to band 3
of lane 9 at position 0.576 (16.6 kDa), band 5 of lane 8 at 0.583 (16.2 kDa), band
5 of lane 6 at 0.573 (16.8 kDa), band 9 of lane 4 at 0.559 (17.8 kDa) and band 6
of lane 3 at 0.559 (17.8 kDa). The similarity of these positions together with the
absence of any bands in the control sample in Fig 5.5 a) suggests that they are
also the KcsA monomer.
ImageJ analysis of the bands suggests that the band at ∼17 kDa represents more
than 5 µg of protein in lane 10, ∼0.85 µg in lane 8, ∼0.6 µg in lane 6 and ∼0.75
µg in lane 4, where the intensity of the band in lane 9 was difficult to measure
due to the unexpected smear. These approximations suggest a total yield of more
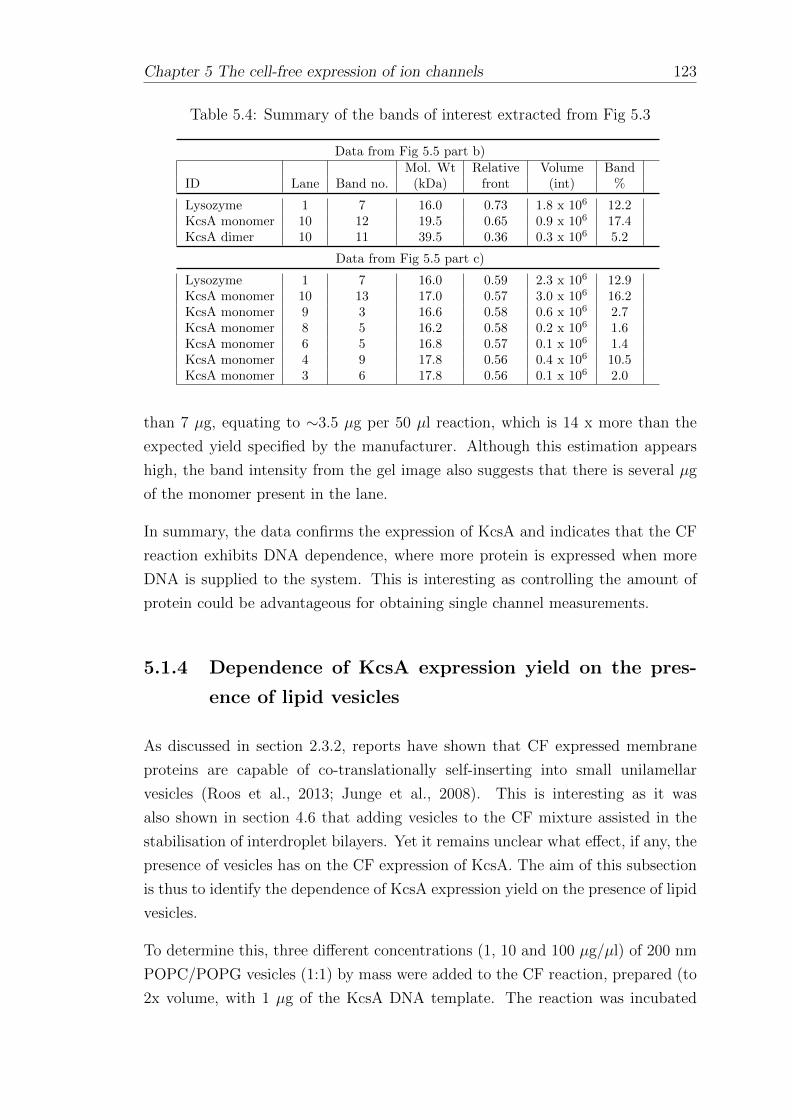
Chapter 5 The cell-free expression of ion channels 123
Table 5.4: Summary of the bands of interest extracted from Fig 5.3
Data from Fig 5.5 part b)Mol. Wt Relative Volume Band
ID Lane Band no. (kDa) front (int) %
Lysozyme 1 7 16.0 0.73 1.8 x 10⁶ 12.2KcsA monomer 10 12 19.5 0.65 0.9 x 10⁶ 17.4KcsA dimer 10 11 39.5 0.36 0.3 x 10⁶ 5.2
Data from Fig 5.5 part c)
Lysozyme 1 7 16.0 0.59 2.3 x 10⁶ 12.9KcsA monomer 10 13 17.0 0.57 3.0 x 10⁶ 16.2KcsA monomer 9 3 16.6 0.58 0.6 x 10⁶ 2.7KcsA monomer 8 5 16.2 0.58 0.2 x 10⁶ 1.6KcsA monomer 6 5 16.8 0.57 0.1 x 10⁶ 1.4KcsA monomer 4 9 17.8 0.56 0.4 x 10⁶ 10.5KcsA monomer 3 6 17.8 0.56 0.1 x 10⁶ 2.0
than 7 µg, equating to ∼3.5 µg per 50 µl reaction, which is 14 x more than the
expected yield specified by the manufacturer. Although this estimation appears
high, the band intensity from the gel image also suggests that there is several µg
of the monomer present in the lane.
In summary, the data confirms the expression of KcsA and indicates that the CF
reaction exhibits DNA dependence, where more protein is expressed when more
DNA is supplied to the system. This is interesting as controlling the amount of
protein could be advantageous for obtaining single channel measurements.
5.1.4 Dependence of KcsA expression yield on the pres-
ence of lipid vesicles
As discussed in section 2.3.2, reports have shown that CF expressed membrane
proteins are capable of co-translationally self-inserting into small unilamellar
vesicles (Roos et al., 2013; Junge et al., 2008). This is interesting as it was
also shown in section 4.6 that adding vesicles to the CF mixture assisted in the
stabilisation of interdroplet bilayers. Yet it remains unclear what effect, if any, the
presence of vesicles has on the CF expression of KcsA. The aim of this subsection
is thus to identify the dependence of KcsA expression yield on the presence of lipid
vesicles.
To determine this, three different concentrations (1, 10 and 100 µg/µl) of 200 nm
POPC/POPG vesicles (1:1) by mass were added to the CF reaction, prepared (to
2x volume, with 1 µg of the KcsA DNA template. The reaction was incubated

124 Chapter 5 The cell-free expression of ion channels
at 37◦C for 2 hours and terminated on ice. CF expressed His-tagged protein was
purified as described in section 3.1.5 and run on an SDS PAGE gel as detailed in
section 3.1.6.
Fig 5.6 a) shows the result when 1 µg of vesicles were added to the CF system.
It seems apparent from the gel image in part a) that more KcsA was expressed
compared to what has been previously obtained. This is indicated by the presence
and intensity of the bands observed in the position expected for the monomer in
lanes 4-9. Such bands were detected at 17.4 kDa (band 10), 16.6 kDa (band 10),
16.5 kDa (band 5), 16.8 kDa (band 10), 16.7 kDa (band 3) and 17.0 kDa (band 2),
as summarised in Table 5.5. The bands all appear in line with the most prominent
band in lane 10 (band 13), recorded at 18.0 kDa and indicated in the intensity
plot for the lane provided in the figure by an asterisk.
ImageJ analysis suggests that the band in lane 10 represents more than 5 µg of
protein with lane 9 containing ∼0.1 µg of protein, lane 8 containing ∼0.1 µg, lane
7 containing ∼0.7 µg of protein, lane 6 containing ∼0.65 µg, lane 5 containing ∼0.9 µg of protein and lane 4 containing 1.25 µg of protein. This totals to more
than 8.7 µg of the KcsA monomer, which is the equivalent of ∼4.35 µg of protein
per 50 µl of the CF mixture. While this figure is high, the intensity of band 13
in lane 10 is greater than observed in the previous gels, such that the amount
of the KcsA monomer can only be estimated as greater than 1.66 µg. Lanes 4-7
however could be likened to lane 4 of Fig 3.12 b) which contained 416 ng of the
KcsA monomer, while lanes 3, 8 and 9 appear closer to lane 3 of Fig 3.12 which
contained 83 ng of the KcsA monomer. This suggests that approximately 1.9 µg
of the KcsA monomer is present on the gel in lanes 3-9. While the approximation
suggested by imageJ analysis seems high, it seems likely that the gel contains at
least 5-6 µg of the KcsA monomer in total. This was unexpected since less DNA
was used compared to the work in the previous subsection and yet it appears that
more KcsA has been expressed, indicating that the supplied vesicles assisted in the
expression as reported previously (Berrier et al., 2011) (Kalmbach et al., 2007).
Fig 5.6 b) shows the purification product when 10 µg of 200 nm POPC/POPG
vesicles (1:1 by mass) were added to the CF reaction. There is a clear similarity
between the gel image and that in part a), however from visual comparison it
seems that slightly less of the protein of interest is detected in the elution lanes.
The supplied intensity plot also infers this where the indicated peak at 18.5 kDa
in lane 10 (band 14) is less intense than the corresponding band in part a).

Chapter 5 The cell-free expression of ion channels 125
Figure 5.6: Dependence of KcsA expression yield on the presence of lipidvesicles. SDS PAGE of Ni-NTA purified CF expressed KcsA expressed inthe presence of a) 1 mg/ml, b) 10 mg/ml and c) 100 mg/ml of 200 nmPOPC/POPG vesicles. The appearance of intense bands at ∼17 kDa inlane 10 and several of the elution leanes in all three gels indicates that thepresence of vesicles promotes the expression of KcsA, however the intensityplots in the figure indicate that the effect is not concentration dependent.

126 Chapter 5 The cell-free expression of ion channels
The prominent bands detected in lanes 4-9 on the gel were recorded at 16.6 kDa
(band 10), 16.6 kDa (band 9), 16.7 kDa (band 9), 16.9 kDa (band 11), 17.1 kDa
(band 10) and 17.8 kDa (band 5), values that are closely similar to those obtained
for the KcsA monomer detected in the elution lanes in part a). The bands of
interest detected on the gel are sumarised in Table 5.5.
Analysis of the gel using ImageJ indicated that there was more than 5 µg of protein
at 18.5 kDa in lane 10, ∼0.1 µg in lane 7, ∼0.2 µg in lane 6, ∼0.4 µg in lane 5,
∼0.75 µg in lane 4 and ∼1 µg in lane 1. This suggests that the total amount of
expressed protein is more than 7.45 µg, or more than 3.73 µg per 50 µl of the CF
system. Lanes 3-9 can also be likened to lane 3 of Fig 3.12 b) which contained 83
ng of KcsA, while lane 10 seems to contain more protein than in lane 6 of the same
figure, which had 1.66 µg of KcsA. It therefore seems plausible that the gel could
contain ∼4 µg of the KcsA monomer. Despite some discrepancy between the two
estimations, it seems clear that both methods return values which are slightly less
than what was estimated for the previous figure when 1 µg of vesicles were added.
The result of the effect of adding 100 µg of vesicles to the CF expression reaction
is shown from the SDS PAGE gel in Fig 5.6 c). The gel appears visually similar
to the other gels in this subsection with the most distinct band in lane 10 inline
with fainter bands in lanes 3-6 and lane 8. The most intense band in lane 10
(indicated on the intensity plot) was detected at 15.4 kDa, which is lower than
the molecular weight obtained previously for the KcsA monomer. This was also
the case for the bands detected in lanes 3-6 and lane 8, which measured at 14.7
kDa (band 5), 13.7 kDa (band 6), 13.3 kDa (band 4), 12.0 kDa (band 4) and 12.0
kDa (band 4) respectively. No low molecular weight bands were detected in lane
7 while the band in lane 9 appears further down the gel compared to the other
bands summarised in Table 5.5. The consistency of the data indicates that the
apparent reduction in the molecular weight measured for the KcsA monomer was
due to an artefact in the running of the gel. This is supported by the observation
that the molecular weight ladder has not run as far down the gel as seen in parts
a) and b).
Estimations from the gel, shown in Fig 5.6 c), suggest there is >5 µg of protein
in lane 10 of the figure, ∼0.7 µg of protein in lane 5, ∼0.8 µg in lane 4 and ∼1.5
µg in lane 3. This indicates that more than 8 µg in total, or ∼4 µg per 50 µl, of
the protein of interest was expressed. Although this estimate seems high, most
likely due to background staining, it is roughly in line with what was estimated
for the other gels in this subsection. By comparing each lane to Fig 5.1, lanes 3-6

Chapter 5 The cell-free expression of ion channels 127
Table 5.5: Summary of the bands of interest extracted from Fig 5.6
Data from Fig 5.6 part a)Mol. Wt Relative Volume Band
ID Lane Band no. (kDa) front (int) %
Lysozyme 1 7 16.0 0.67 1.4 x 10⁶ 17.1KcsA monomer 10 13 18.0 0.63 10.0 x 10⁶ 30KcsA monomer 9 2 17.0 0.65 0.2 x 10⁶ 2.9KcsA monomer 8 3 16.7 0.66 0.1 x 10⁶ 1.7KcsA monomer 7 10 16.8 0.67 0.1 x 10⁶ 5.9KcsA monomer 6 5 16.5 0.66 1.7 x 10⁶ 11.2KcsA monomer 5 10 16.6 0.66 2.3 x 10⁶ 13.6KcsA monomer 4 10 17.4 0.64 0.5 x 10⁶ 4.8KcsA monomer 3 7 16.7 0.66 0.3 x 10⁶ 2.9
Data from Fig 5.6 part b)
Lysozyme 1 7 16.0 0.72 2.0 x 10⁶ 15.7KcsA monomer 10 14 18.5 0.66 5.7 x 10⁶ 39.8KcsA monomer 9 5 17.8 0.68 0.3 x 10⁶ 17.1KcsA monomer 8 10 17.1 0.70 0.3 x 10⁶ 7.5KcsA monomer 7 11 16.9 0.70 0.3 x 10⁶ 9.8KcsA monomer 6 9 16.7 0.71 0.4 x 10⁶ 9.8KcsA monomer 5 9 16.6 0.71 0.4 x 10⁶ 10.5KcsA monomer 4 10 16.6 0.71 0.3 x 10⁶ 7.2KcsA monomer 3 8 16.5 0.71 0.2 x 10⁶ 5.8
Data from Fig 5.6 part c)
Lysozyme 1 7 16.0 0.52 2.1 x 10⁶ 22.4KcsA monomer 10 11 15.4 0.53 9.0 x 10⁶ 66.3KcsA monomer 8 3 12.0 0.56 1.1 x 10⁶ 23.2KcsA monomer 6 4 12.0 0.56 0.6 x 10⁶ 41.0KcsA monomer 5 4 13.3 0.55 1.5 x 10⁶ 48.6KcsA monomer 4 6 13.7 0.54 1.8 x 10⁶ 69.5KcsA monomer 3 5 14.4 0.54 0.5 x 10⁶ 64.8
and lane 8 look again to be between lanes 3 and 4, containing 83 ng and 416 ng
of KcsA respectively, while lane 10 again appears incomparable, suggesting that
more than 1.66 µg of the KcsA monomer was present as found in parts a) and b).
In summary, the data indicates that the CF expression of KcsA is enhanced in the
presence of lipid vesicles, leading to an increase in the amount of protein expressed.
While more experiments would be needed to draw a firm conclusion, the data does
not indicate that this effect is dependent on the concentration of vesicles added.
128 Chapter 5 The cell-free expression of ion channels
5.2 Cell-free expression of full-length KvAP potas-
sium channel
This subsection details the CF expression of the full-length KvAP channel,
discussed in detail in section 2.4.2, and outlines the methods used to verify that
the protein was expressed.
5.2.1 Western blotting of cell-free expressed His-tagged
KvAP
The aim of this subsection is to demonstrate the CF expression of the full-length
KvAP channel, using the same approach as shown in the previous section for
KcsA.
The CF reaction was performed at 2x volume with 1 µg per volume of the KvAP
DNA template discussed in section 3.1.1. The reaction was performed for 2 hours
at 37 ◦C when using the L1130 system, and for 1 hour at 37◦C under light agitation
(1,200 RPM) using the L1110 system. His-tagged protein was purified as detailed
in section 3.1.8 and run on an SDS page gel as detailed in section 3.1.6 and Western
blotting was performed by Maıwenn Beaugrand, (University of Southampton) as
described in section 3.1.7.
No protein of interest was detected when the KvAP was expressed using the
L1130 system used previously for the expression of KcsA. This was most likely
due to the fact that the pQE-60 vector encoding the KVAP gene contained a
T5 promoter sequence while the expression system contained a T7 polymerase,
binding specifically to T7 promoter sites. To account for this, the expression
system was supplemented with endogenous RNA polymerase however this was also
unsuccessful, possibly caused by an insufficient amount of polymerase supplied to
the system as advised by the manufacturer.
Expression was subsequently attempted with the L1110 High Yield expression
system, which despite being based on a T7 system, has been shown by the
manufacturer to be compatible with a T5 promoter sequence. Fig 5.7 a) shows the
destained gel containing protein purified from the CF expression reaction when 1
µg of DNA was added. The gel in part a) of the figure shows that a large amount
of protein was washed off the beads in lane 2, while few proteins are detected
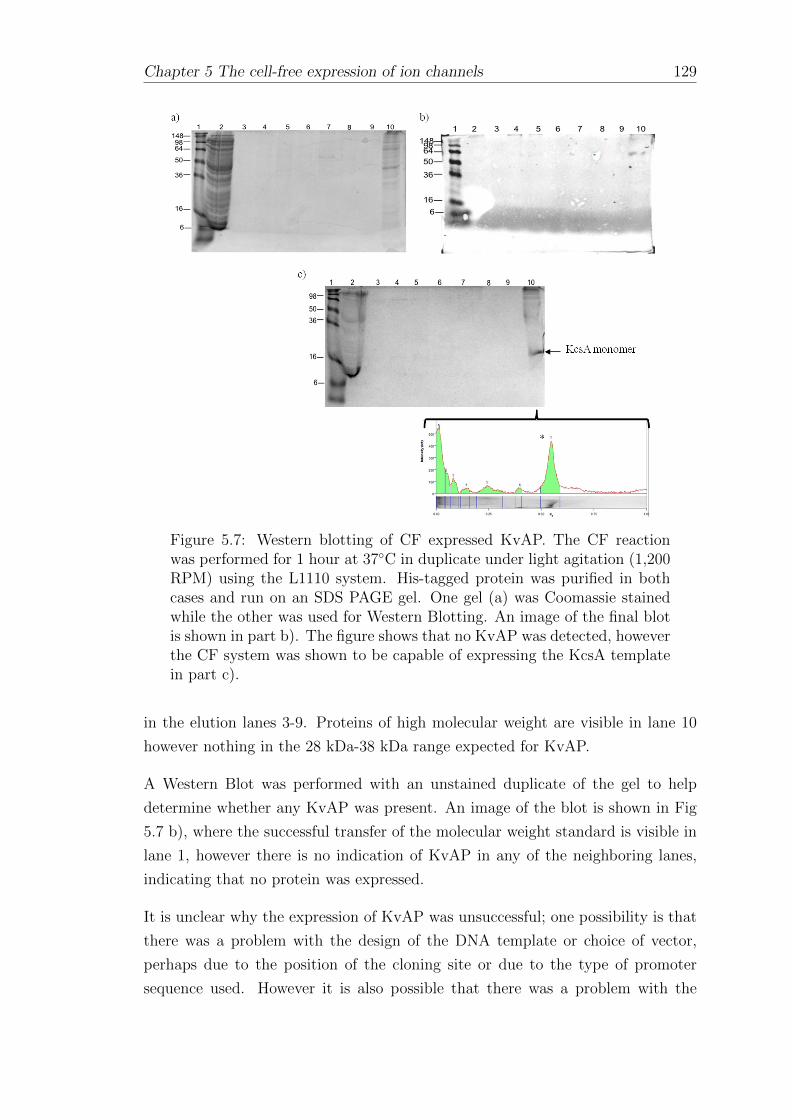
Chapter 5 The cell-free expression of ion channels 129
Figure 5.7: Western blotting of CF expressed KvAP. The CF reactionwas performed for 1 hour at 37◦C in duplicate under light agitation (1,200RPM) using the L1110 system. His-tagged protein was purified in bothcases and run on an SDS PAGE gel. One gel (a) was Coomassie stainedwhile the other was used for Western Blotting. An image of the final blotis shown in part b). The figure shows that no KvAP was detected, howeverthe CF system was shown to be capable of expressing the KcsA templatein part c).
in the elution lanes 3-9. Proteins of high molecular weight are visible in lane 10
however nothing in the 28 kDa-38 kDa range expected for KvAP.
A Western Blot was performed with an unstained duplicate of the gel to help
determine whether any KvAP was present. An image of the blot is shown in Fig
5.7 b), where the successful transfer of the molecular weight standard is visible in
lane 1, however there is no indication of KvAP in any of the neighboring lanes,
indicating that no protein was expressed.
It is unclear why the expression of KvAP was unsuccessful; one possibility is that
there was a problem with the design of the DNA template or choice of vector,
perhaps due to the position of the cloning site or due to the type of promoter
sequence used. However it is also possible that there was a problem with the
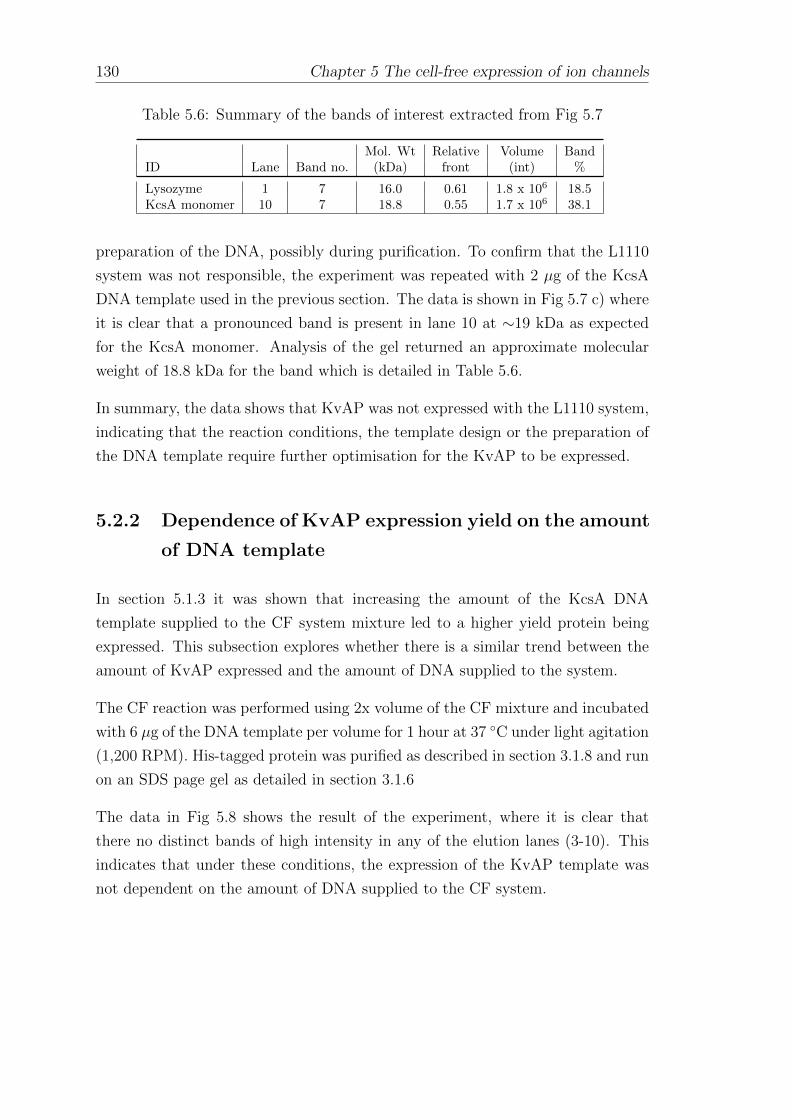
130 Chapter 5 The cell-free expression of ion channels
Table 5.6: Summary of the bands of interest extracted from Fig 5.7
Mol. Wt Relative Volume BandID Lane Band no. (kDa) front (int) %
Lysozyme 1 7 16.0 0.61 1.8 x 10⁶ 18.5KcsA monomer 10 7 18.8 0.55 1.7 x 10⁶ 38.1
preparation of the DNA, possibly during purification. To confirm that the L1110
system was not responsible, the experiment was repeated with 2 µg of the KcsA
DNA template used in the previous section. The data is shown in Fig 5.7 c) where
it is clear that a pronounced band is present in lane 10 at ∼19 kDa as expected
for the KcsA monomer. Analysis of the gel returned an approximate molecular
weight of 18.8 kDa for the band which is detailed in Table 5.6.
In summary, the data shows that KvAP was not expressed with the L1110 system,
indicating that the reaction conditions, the template design or the preparation of
the DNA template require further optimisation for the KvAP to be expressed.
5.2.2 Dependence of KvAP expression yield on the amount
of DNA template
In section 5.1.3 it was shown that increasing the amount of the KcsA DNA
template supplied to the CF system mixture led to a higher yield protein being
expressed. This subsection explores whether there is a similar trend between the
amount of KvAP expressed and the amount of DNA supplied to the system.
The CF reaction was performed using 2x volume of the CF mixture and incubated
with 6 µg of the DNA template per volume for 1 hour at 37 ◦C under light agitation
(1,200 RPM). His-tagged protein was purified as described in section 3.1.8 and run
on an SDS page gel as detailed in section 3.1.6
The data in Fig 5.8 shows the result of the experiment, where it is clear that
there no distinct bands of high intensity in any of the elution lanes (3-10). This
indicates that under these conditions, the expression of the KvAP template was
not dependent on the amount of DNA supplied to the CF system.
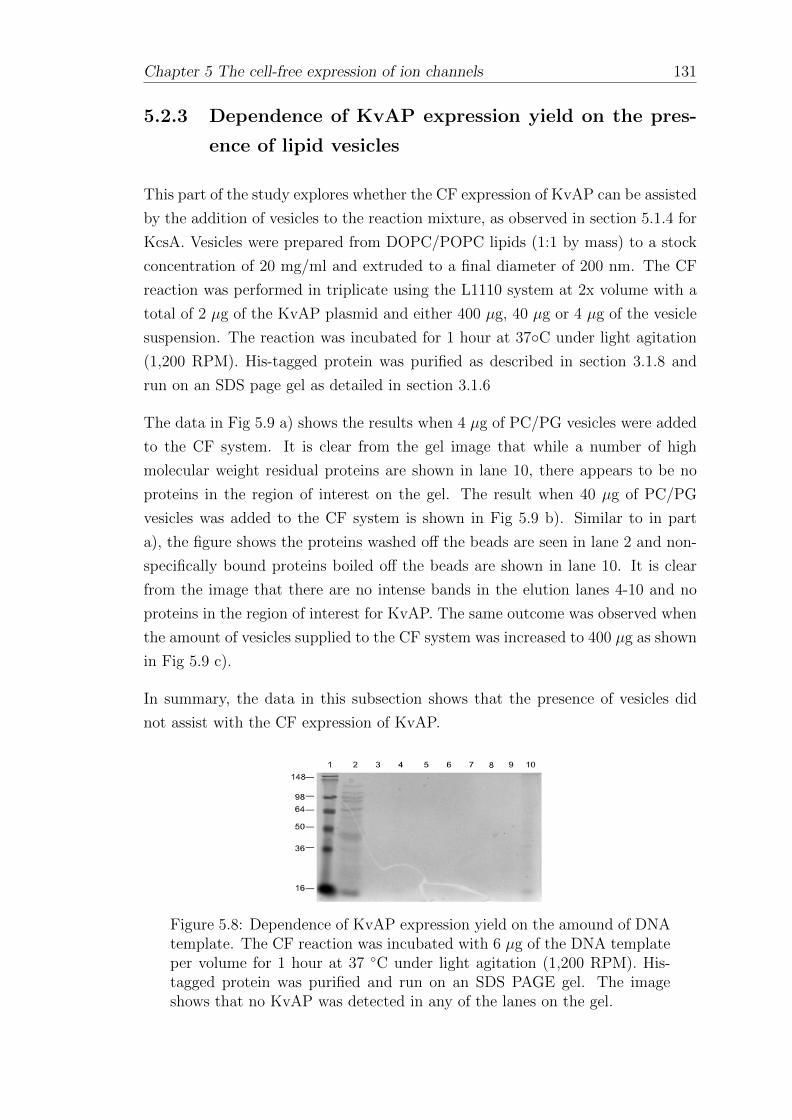
Chapter 5 The cell-free expression of ion channels 131
5.2.3 Dependence of KvAP expression yield on the pres-
ence of lipid vesicles
This part of the study explores whether the CF expression of KvAP can be assisted
by the addition of vesicles to the reaction mixture, as observed in section 5.1.4 for
KcsA. Vesicles were prepared from DOPC/POPC lipids (1:1 by mass) to a stock
concentration of 20 mg/ml and extruded to a final diameter of 200 nm. The CF
reaction was performed in triplicate using the L1110 system at 2x volume with a
total of 2 µg of the KvAP plasmid and either 400 µg, 40 µg or 4 µg of the vesicle
suspension. The reaction was incubated for 1 hour at 37◦C under light agitation
(1,200 RPM). His-tagged protein was purified as described in section 3.1.8 and
run on an SDS page gel as detailed in section 3.1.6
The data in Fig 5.9 a) shows the results when 4 µg of PC/PG vesicles were added
to the CF system. It is clear from the gel image that while a number of high
molecular weight residual proteins are shown in lane 10, there appears to be no
proteins in the region of interest on the gel. The result when 40 µg of PC/PG
vesicles was added to the CF system is shown in Fig 5.9 b). Similar to in part
a), the figure shows the proteins washed off the beads are seen in lane 2 and non-
specifically bound proteins boiled off the beads are shown in lane 10. It is clear
from the image that there are no intense bands in the elution lanes 4-10 and no
proteins in the region of interest for KvAP. The same outcome was observed when
the amount of vesicles supplied to the CF system was increased to 400 µg as shown
in Fig 5.9 c).
In summary, the data in this subsection shows that the presence of vesicles did
not assist with the CF expression of KvAP.
Figure 5.8: Dependence of KvAP expression yield on the amound of DNAtemplate. The CF reaction was incubated with 6 µg of the DNA templateper volume for 1 hour at 37 ◦C under light agitation (1,200 RPM). His-tagged protein was purified and run on an SDS PAGE gel. The imageshows that no KvAP was detected in any of the lanes on the gel.
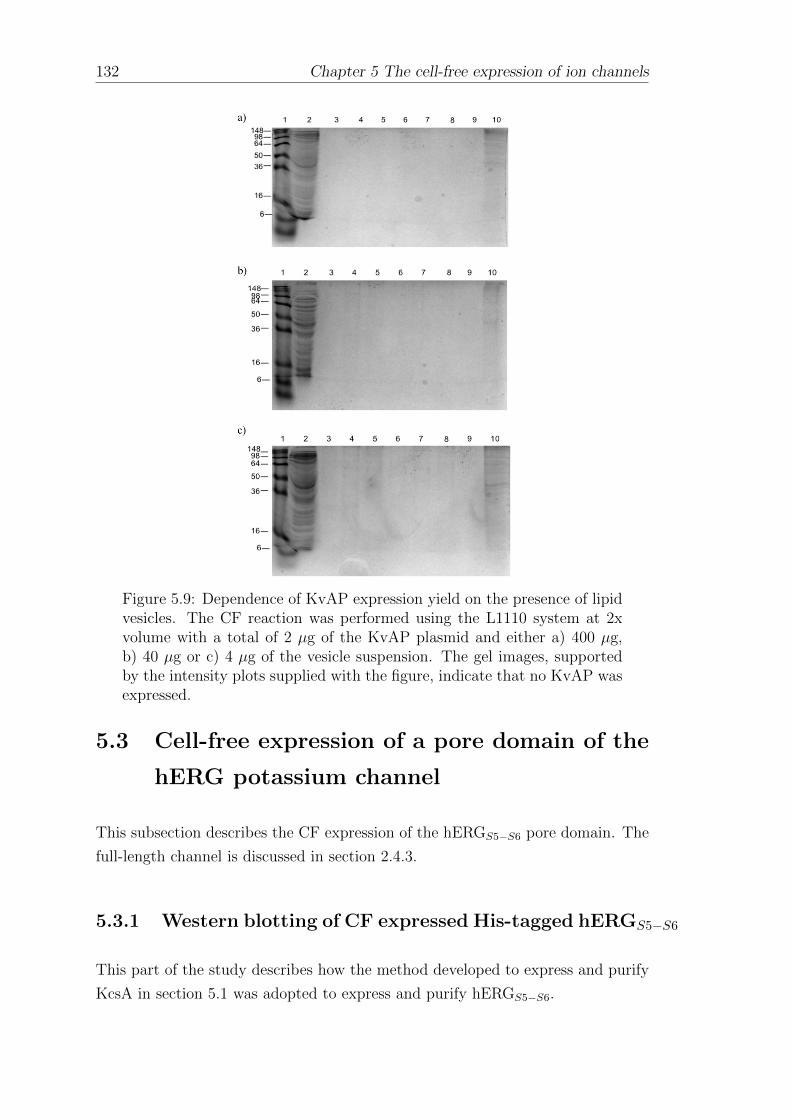
132 Chapter 5 The cell-free expression of ion channels
Figure 5.9: Dependence of KvAP expression yield on the presence of lipidvesicles. The CF reaction was performed using the L1110 system at 2xvolume with a total of 2 µg of the KvAP plasmid and either a) 400 µg,b) 40 µg or c) 4 µg of the vesicle suspension. The gel images, supportedby the intensity plots supplied with the figure, indicate that no KvAP wasexpressed.
5.3 Cell-free expression of a pore domain of the
hERG potassium channel
This subsection describes the CF expression of the hERGS5−S6 pore domain. The
full-length channel is discussed in section 2.4.3.
5.3.1 Western blotting of CF expressed His-tagged hERGS5−S6
This part of the study describes how the method developed to express and purify
KcsA in section 5.1 was adopted to express and purify hERGS5−S6.

Chapter 5 The cell-free expression of ion channels 133
The CF expression reaction was performed at 2x volume with a total of 2 µg of
the DNA encoding the hERGS5−S6 construct. The reaction was performed for 2
hours at 37 ◦C when using the L1130 system, and under agitation (1,200 RPM)
for 1 hour at 37 ◦C using the L1110 system. His-tagged protein was purified as
detailed in subsection 3.1.8 and run on an SDS page gel as detailed in section
3.1.6 and Western blotting was performed by Maıwenn Beaugrand, (University of
Southampton) as described in section 3.1.7.
The expected molecular weight of the hERGS5−S6 construct, can be calculated
from the pore domain sequence to be ∼18 kDa. No proteins in this region were
detected when the DNA encoding the hERGS5−S6 pore domain was added to the
L1130 system, most likely due to the plasmid containing a trc promoter sequence
instead of a T7. However a clear band at ∼ 16 kDa was observed when the process
was repeated using the L1110 system, as shown in Fig 5.10 a).
Figure 5.10: Western blotting of CF expressed hERGS5−S6. 2 µg ofthe hERGS5−S6 DNA template was incubated with 2 volumes of the CFexpression mixture for 1 hour at 37 ◦C under light agitation. The proteinwas performed in duplicate, purified and run on SDS PAGE gels. Onegel was Coomassie stained a), and the other used for Western blotting b).A band indicated by the arrow at ∼16 kDa in lane 10 of the stained gelin part a) indicates the presence of the hERGS5−S6, as confirmed by thepresence of a band in the same position in the Western blot in part b).
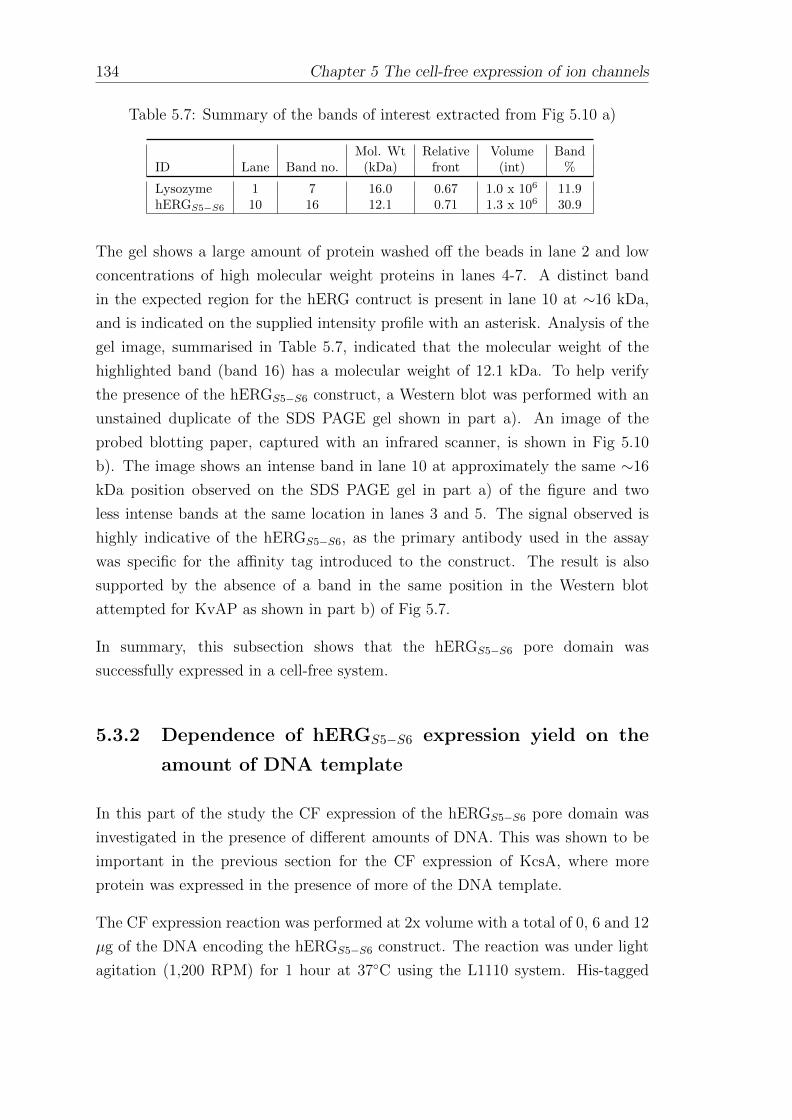
134 Chapter 5 The cell-free expression of ion channels
Table 5.7: Summary of the bands of interest extracted from Fig 5.10 a)
Mol. Wt Relative Volume BandID Lane Band no. (kDa) front (int) %
Lysozyme 1 7 16.0 0.67 1.0 x 10⁶ 11.9hERGS5−S6 10 16 12.1 0.71 1.3 x 10⁶ 30.9
The gel shows a large amount of protein washed off the beads in lane 2 and low
concentrations of high molecular weight proteins in lanes 4-7. A distinct band
in the expected region for the hERG contruct is present in lane 10 at ∼16 kDa,
and is indicated on the supplied intensity profile with an asterisk. Analysis of the
gel image, summarised in Table 5.7, indicated that the molecular weight of the
highlighted band (band 16) has a molecular weight of 12.1 kDa. To help verify
the presence of the hERGS5−S6 construct, a Western blot was performed with an
unstained duplicate of the SDS PAGE gel shown in part a). An image of the
probed blotting paper, captured with an infrared scanner, is shown in Fig 5.10
b). The image shows an intense band in lane 10 at approximately the same ∼16
kDa position observed on the SDS PAGE gel in part a) of the figure and two
less intense bands at the same location in lanes 3 and 5. The signal observed is
highly indicative of the hERGS5−S6, as the primary antibody used in the assay
was specific for the affinity tag introduced to the construct. The result is also
supported by the absence of a band in the same position in the Western blot
attempted for KvAP as shown in part b) of Fig 5.7.
In summary, this subsection shows that the hERGS5−S6 pore domain was
successfully expressed in a cell-free system.
5.3.2 Dependence of hERGS5−S6 expression yield on the
amount of DNA template
In this part of the study the CF expression of the hERGS5−S6 pore domain was
investigated in the presence of different amounts of DNA. This was shown to be
important in the previous section for the CF expression of KcsA, where more
protein was expressed in the presence of more of the DNA template.
The CF expression reaction was performed at 2x volume with a total of 0, 6 and 12
µg of the DNA encoding the hERGS5−S6 construct. The reaction was under light
agitation (1,200 RPM) for 1 hour at 37◦C using the L1110 system. His-tagged
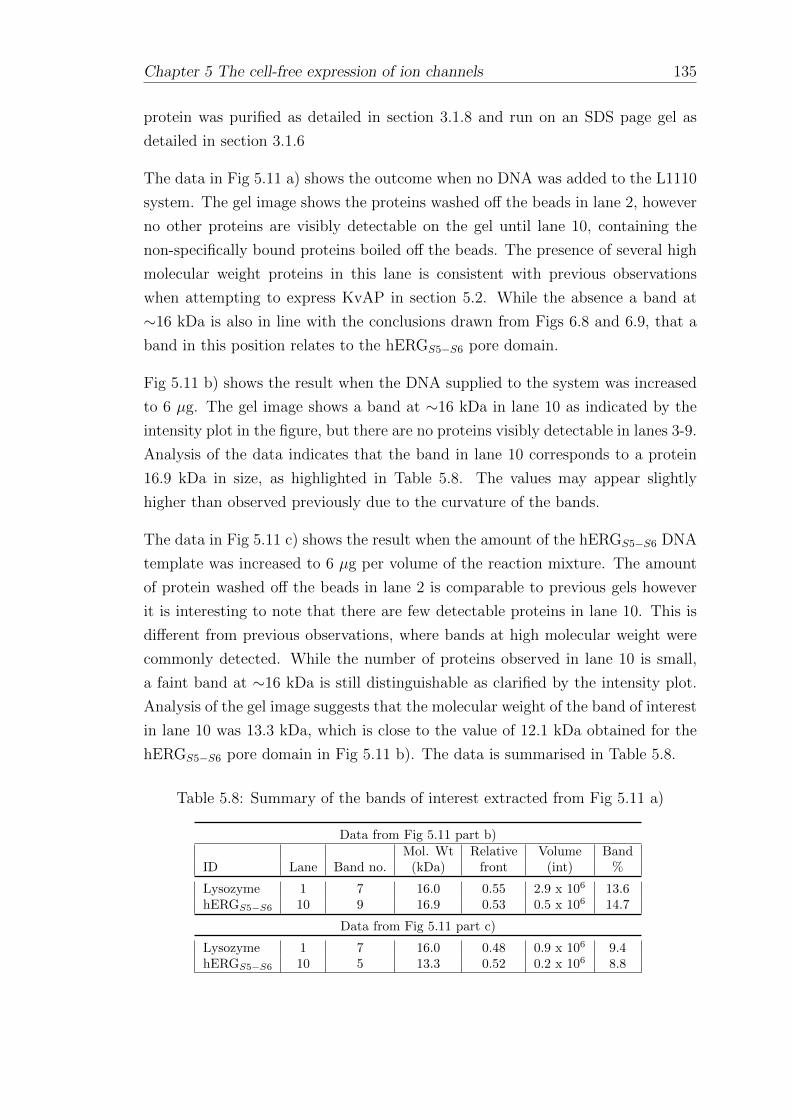
Chapter 5 The cell-free expression of ion channels 135
protein was purified as detailed in section 3.1.8 and run on an SDS page gel as
detailed in section 3.1.6
The data in Fig 5.11 a) shows the outcome when no DNA was added to the L1110
system. The gel image shows the proteins washed off the beads in lane 2, however
no other proteins are visibly detectable on the gel until lane 10, containing the
non-specifically bound proteins boiled off the beads. The presence of several high
molecular weight proteins in this lane is consistent with previous observations
when attempting to express KvAP in section 5.2. While the absence a band at
∼16 kDa is also in line with the conclusions drawn from Figs 6.8 and 6.9, that a
band in this position relates to the hERGS5−S6 pore domain.
Fig 5.11 b) shows the result when the DNA supplied to the system was increased
to 6 µg. The gel image shows a band at ∼16 kDa in lane 10 as indicated by the
intensity plot in the figure, but there are no proteins visibly detectable in lanes 3-9.
Analysis of the data indicates that the band in lane 10 corresponds to a protein
16.9 kDa in size, as highlighted in Table 5.8. The values may appear slightly
higher than observed previously due to the curvature of the bands.
The data in Fig 5.11 c) shows the result when the amount of the hERGS5−S6 DNA
template was increased to 6 µg per volume of the reaction mixture. The amount
of protein washed off the beads in lane 2 is comparable to previous gels however
it is interesting to note that there are few detectable proteins in lane 10. This is
different from previous observations, where bands at high molecular weight were
commonly detected. While the number of proteins observed in lane 10 is small,
a faint band at ∼16 kDa is still distinguishable as clarified by the intensity plot.
Analysis of the gel image suggests that the molecular weight of the band of interest
in lane 10 was 13.3 kDa, which is close to the value of 12.1 kDa obtained for the
hERGS5−S6 pore domain in Fig 5.11 b). The data is summarised in Table 5.8.
Table 5.8: Summary of the bands of interest extracted from Fig 5.11 a)
Data from Fig 5.11 part b)Mol. Wt Relative Volume Band
ID Lane Band no. (kDa) front (int) %
Lysozyme 1 7 16.0 0.55 2.9 x 10⁶ 13.6hERGS5−S6 10 9 16.9 0.53 0.5 x 10⁶ 14.7
Data from Fig 5.11 part c)
Lysozyme 1 7 16.0 0.48 0.9 x 10⁶ 9.4hERGS5−S6 10 5 13.3 0.52 0.2 x 10⁶ 8.8
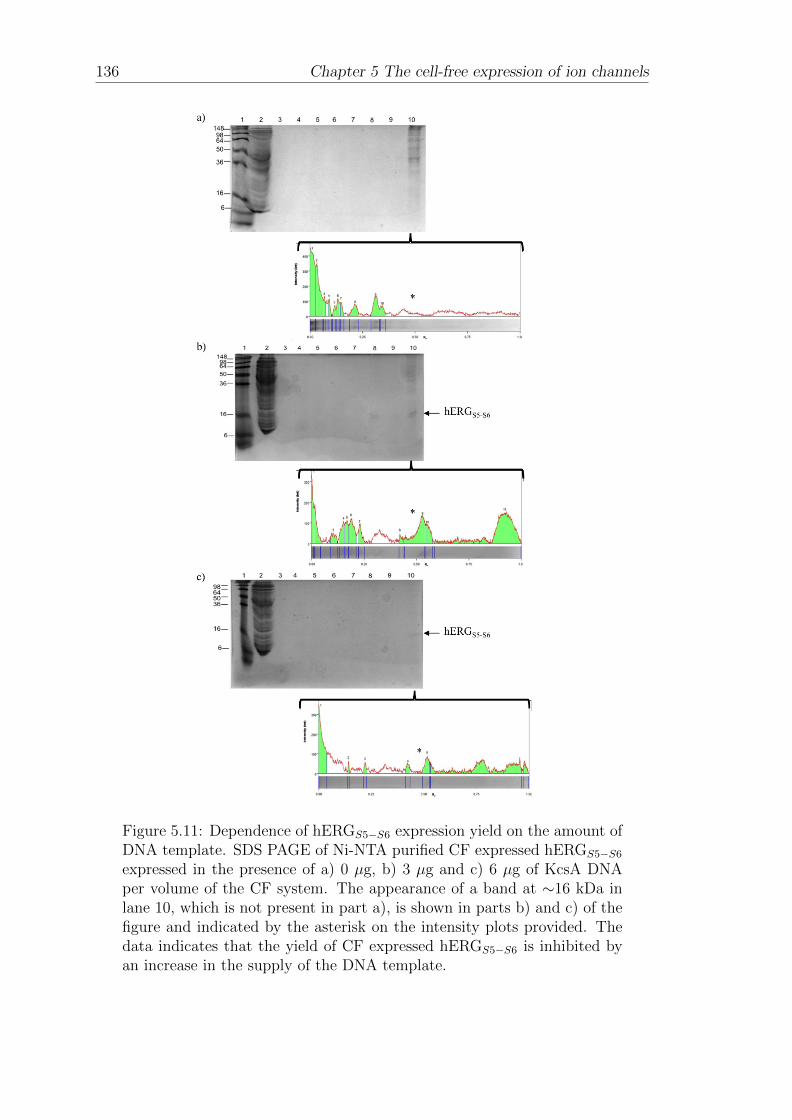
136 Chapter 5 The cell-free expression of ion channels
Figure 5.11: Dependence of hERGS5−S6 expression yield on the amount ofDNA template. SDS PAGE of Ni-NTA purified CF expressed hERGS5−S6expressed in the presence of a) 0 µg, b) 3 µg and c) 6 µg of KcsA DNAper volume of the CF system. The appearance of a band at ∼16 kDa inlane 10, which is not present in part a), is shown in parts b) and c) of thefigure and indicated by the asterisk on the intensity plots provided. Thedata indicates that the yield of CF expressed hERGS5−S6 is inhibited byan increase in the supply of the DNA template.
Chapter 5 The cell-free expression of ion channels 137
In summary, the data shows that hERGS5−S6 was expressed but indicates that
more of the hERGS5−S6 pore domain was expressed when 1 µg of the DNA
template was added to the CF system compared to when 3 µg and 6 µg of the
DNA template was supplied.
5.4 Summary
As protein expression was difficult to verify directly from the CF mixture by
gel electrophoresis (3.1.11 & 3.1.13), a His affinity tag was introduced to the
DNA template (3.1.1) to facilitate affinity purification and Western blotting of
CF expressed ion channels.
It was found that Western blotting attempted directly from the CF mixture led
to problems with the specificity of the antibodies in section 5.1.1, possibly due
to the large number of proteins loaded onto the gel. The CF expression of
KcsA was subsequently demonstrated after purification from the CF mixture,
enabling CF expressed KcsA to be visualised on an SDS PAGE gel next to a
control (section 5.1.2). Further to optimisation, the amount of KcsA expressed
with 1 µg of DNA supplied to the system was approximated to be 400 ng per 50
µl reaction volume, which is significantly higher yield than the 50-250 ng range
specified by the manufacturer (Promega, 2009). This method was also used to
show the dependency of the CF yield of KcsA on the presence of DNA or lipids
in sections 5.1.3 and 5.1.4. Here, an increase in the amount of DNA supplied to
the system to 6 µg was approximated to yield 3.5 µg per 50 µl volume of the
CF mixture, while 1 µg of the DNA template supplied in the presence of vesicles
yielded approximately 3.7 µg of KcsA, independent of the concentrations added.
The latter is in agreement with previous reports in the literature, discussed in
section 2.3.1.
The methods developed for expressing KcsA were also attempted with the full-
length KvAP channel in section 5.2 but expression of this template was not
confirmed, possibly due to the large size of the protein, the lack of optimum
expression conditions or as a result of error in the preparation of the DNA
template. The method was however shown to work on the hERGS5−S6 pore
domain, the expression of which was confirmed on an SDS PAGE gel and
by Western blotting after purification from the CF mixture in section 5.3.1.
Expression of the hERGS5−S6 template was not enhanced by increasing the supply
of the DNA template, while the effect of adding vesicles remains to be determined.

138 Chapter 5 The cell-free expression of ion channels
Verifying the CF expression of KcsA and hERGS5−S6 and identifying some of the
factors which affect protein yield is an important step towards achieving single
channel measurements, which is the focus of the following chapter.
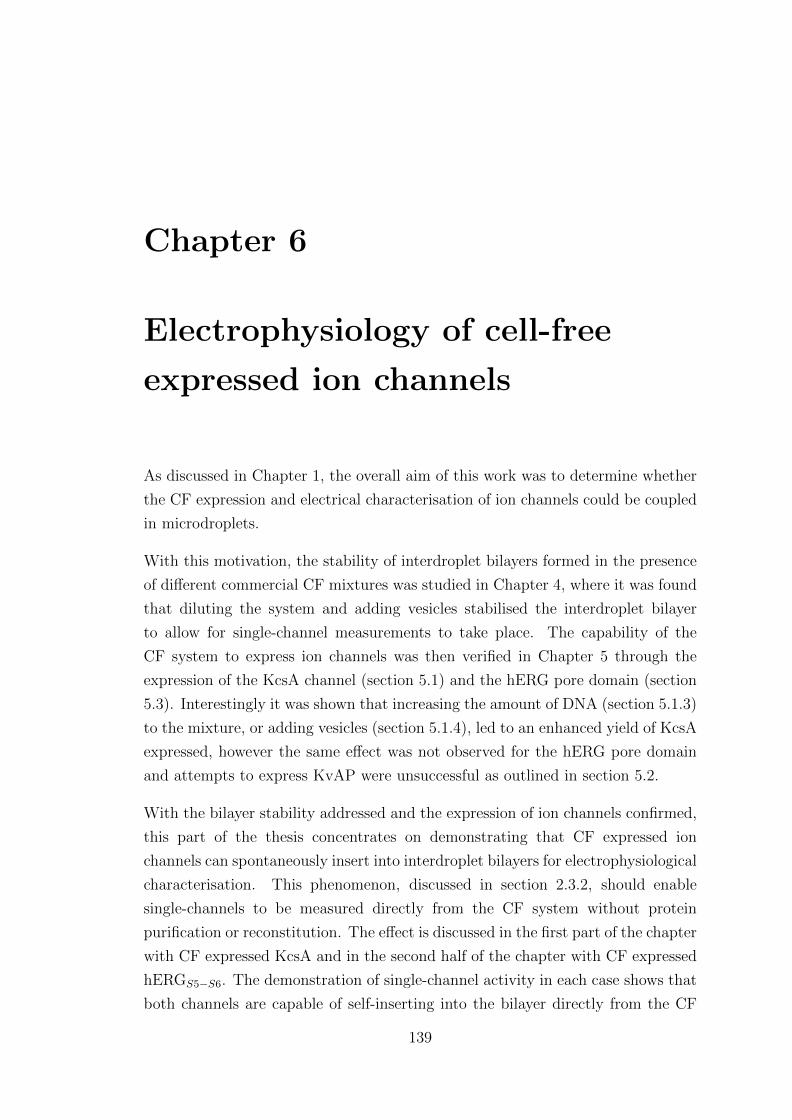
Chapter 6
Electrophysiology of cell-free
expressed ion channels
As discussed in Chapter 1, the overall aim of this work was to determine whether
the CF expression and electrical characterisation of ion channels could be coupled
in microdroplets.
With this motivation, the stability of interdroplet bilayers formed in the presence
of different commercial CF mixtures was studied in Chapter 4, where it was found
that diluting the system and adding vesicles stabilised the interdroplet bilayer
to allow for single-channel measurements to take place. The capability of the
CF system to express ion channels was then verified in Chapter 5 through the
expression of the KcsA channel (section 5.1) and the hERG pore domain (section
5.3). Interestingly it was shown that increasing the amount of DNA (section 5.1.3)
to the mixture, or adding vesicles (section 5.1.4), led to an enhanced yield of KcsA
expressed, however the same effect was not observed for the hERG pore domain
and attempts to express KvAP were unsuccessful as outlined in section 5.2.
With the bilayer stability addressed and the expression of ion channels confirmed,
this part of the thesis concentrates on demonstrating that CF expressed ion
channels can spontaneously insert into interdroplet bilayers for electrophysiological
characterisation. This phenomenon, discussed in section 2.3.2, should enable
single-channels to be measured directly from the CF system without protein
purification or reconstitution. The effect is discussed in the first part of the chapter
with CF expressed KcsA and in the second half of the chapter with CF expressed
hERGS5−S6. The demonstration of single-channel activity in each case shows that
both channels are capable of self-inserting into the bilayer directly from the CF
139

140 Chapter 6 Electrophysiology of cell-free expressed ion channels
mixture, which has only been previously achieved with the small viral channel Kcv
(Syeda et al., 2008) as discussed in section 2.3.3.
6.1 Electrophysiology of CF expressed KcsA in
interdroplet bilayers
As discussed in section 2.4.1, KcsA is a pH gated channel that activates when
the intracellular pH falls to 4.0 or below. As an initial control it was therefore
first determined whether any channel activity could be detected when one droplet
contained the CF system incubated with 1 µg of the un-tagged KcsA DNA
template (section 3.1.1) and when the second droplet (representing the intracellular
side of the cell), contained buffer at pH 7.0.
The CF reaction was incubated at 37 ◦C for 2 hours before a 2 µl droplet was taken
from the completed reaction mixture and used to form an interdroplet bilayer using
manual manipulation as described in section 3.2.5.4. Current measurements were
performed as described in section 3.2.1.
Three repeats of the experiment are shown in Fig 6.1 a) to c) where the data
shows that the baseline remains stable, with no channel activity detected, for
the duration of each 30 minute recording. The stability of the bilayer is evident
from the zooms of the highlighted regions in the figure, while the capacitance
measurements confirm that the bilayer remained in contact at the end of the 30
minute recording. The capacitance measured for a) was 100 pF which, assuming
a specific capacitance of 0.5 µF/cm2, roughly equates to a bilayer diameter of
160 µm. For part b) the capacitance measured was 90 pF, corresponding to an
approximate bilayer diameter of 151 µm, while for part c) the capacitance was 80
pF, which gives an approximate bilayer diameter of 143 µm.
In the absence of single-channel activity under these conditions the experiment was
performed without DNA supplied to the CF system and with the second droplet
containing 150 mM KCl at pH 4.0. Three repeats of the experiment are shown in
Fig 6.2 where, consistent with the findings in Chapter 4, the bilayer is shown to
fail in <15 min in each case. The recordings show that no single channel activity
was observed before the bilayer failed.
Single-channel activity was observed when the experiment was repeated with 1 µg
of DNA. Recordings under different holding potentials are shown in Fig 6.3, where
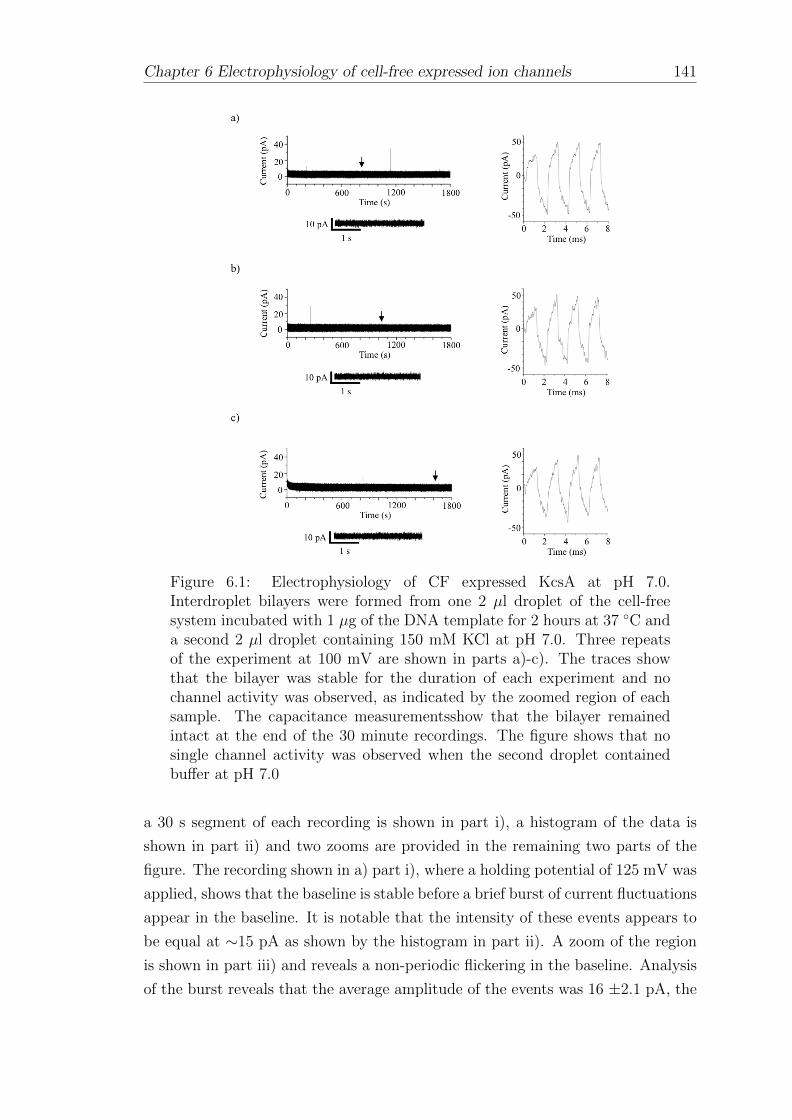
Chapter 6 Electrophysiology of cell-free expressed ion channels 141
Figure 6.1: Electrophysiology of CF expressed KcsA at pH 7.0.Interdroplet bilayers were formed from one 2 µl droplet of the cell-freesystem incubated with 1 µg of the DNA template for 2 hours at 37 ◦C anda second 2 µl droplet containing 150 mM KCl at pH 7.0. Three repeatsof the experiment at 100 mV are shown in parts a)-c). The traces showthat the bilayer was stable for the duration of each experiment and nochannel activity was observed, as indicated by the zoomed region of eachsample. The capacitance measurementsshow that the bilayer remainedintact at the end of the 30 minute recordings. The figure shows that nosingle channel activity was observed when the second droplet containedbuffer at pH 7.0
a 30 s segment of each recording is shown in part i), a histogram of the data is
shown in part ii) and two zooms are provided in the remaining two parts of the
figure. The recording shown in a) part i), where a holding potential of 125 mV was
applied, shows that the baseline is stable before a brief burst of current fluctuations
appear in the baseline. It is notable that the intensity of these events appears to
be equal at ∼15 pA as shown by the histogram in part ii). A zoom of the region
is shown in part iii) and reveals a non-periodic flickering in the baseline. Analysis
of the burst reveals that the average amplitude of the events was 16 ±2.1 pA, the
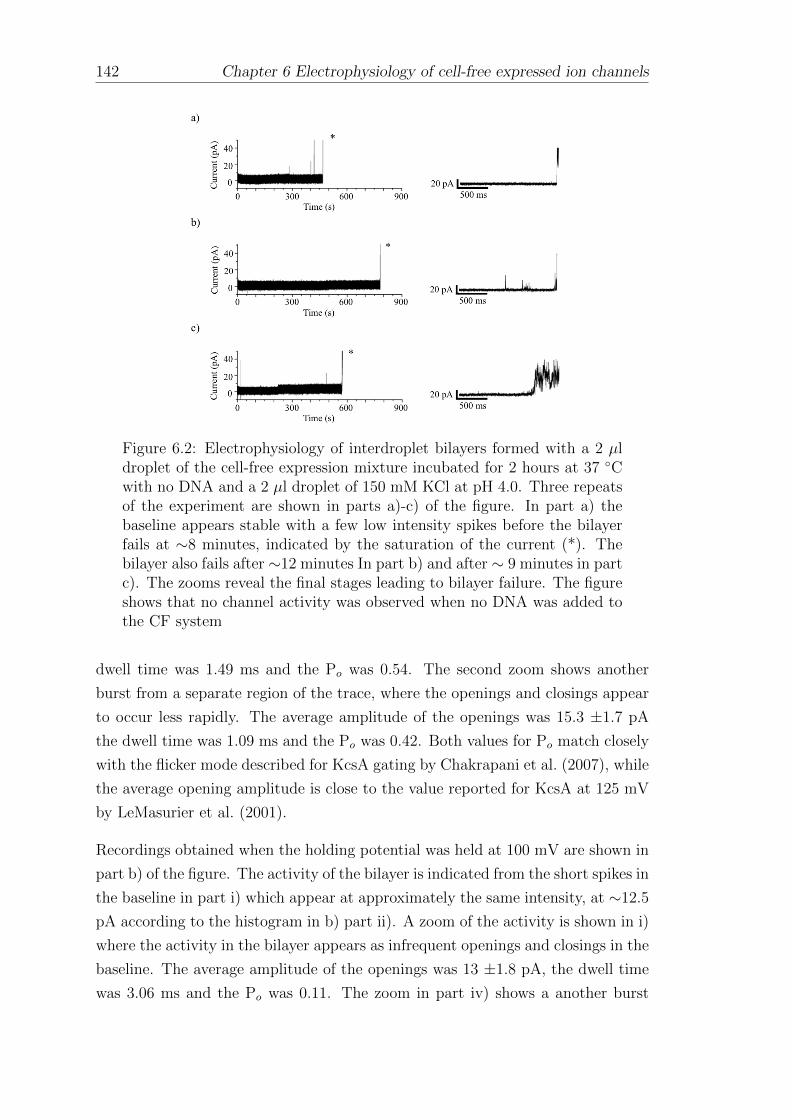
142 Chapter 6 Electrophysiology of cell-free expressed ion channels
Figure 6.2: Electrophysiology of interdroplet bilayers formed with a 2 µldroplet of the cell-free expression mixture incubated for 2 hours at 37 ◦Cwith no DNA and a 2 µl droplet of 150 mM KCl at pH 4.0. Three repeatsof the experiment are shown in parts a)-c) of the figure. In part a) thebaseline appears stable with a few low intensity spikes before the bilayerfails at ∼8 minutes, indicated by the saturation of the current (*). Thebilayer also fails after ∼12 minutes In part b) and after ∼ 9 minutes in partc). The zooms reveal the final stages leading to bilayer failure. The figureshows that no channel activity was observed when no DNA was added tothe CF system
dwell time was 1.49 ms and the Po was 0.54. The second zoom shows another
burst from a separate region of the trace, where the openings and closings appear
to occur less rapidly. The average amplitude of the openings was 15.3 ±1.7 pA
the dwell time was 1.09 ms and the Po was 0.42. Both values for Po match closely
with the flicker mode described for KcsA gating by Chakrapani et al. (2007), while
the average opening amplitude is close to the value reported for KcsA at 125 mV
by LeMasurier et al. (2001).
Recordings obtained when the holding potential was held at 100 mV are shown in
part b) of the figure. The activity of the bilayer is indicated from the short spikes in
the baseline in part i) which appear at approximately the same intensity, at ∼12.5
pA according to the histogram in b) part ii). A zoom of the activity is shown in i)
where the activity in the bilayer appears as infrequent openings and closings in the
baseline. The average amplitude of the openings was 13 ±1.8 pA, the dwell time
was 3.06 ms and the Po was 0.11. The zoom in part iv) shows a another burst
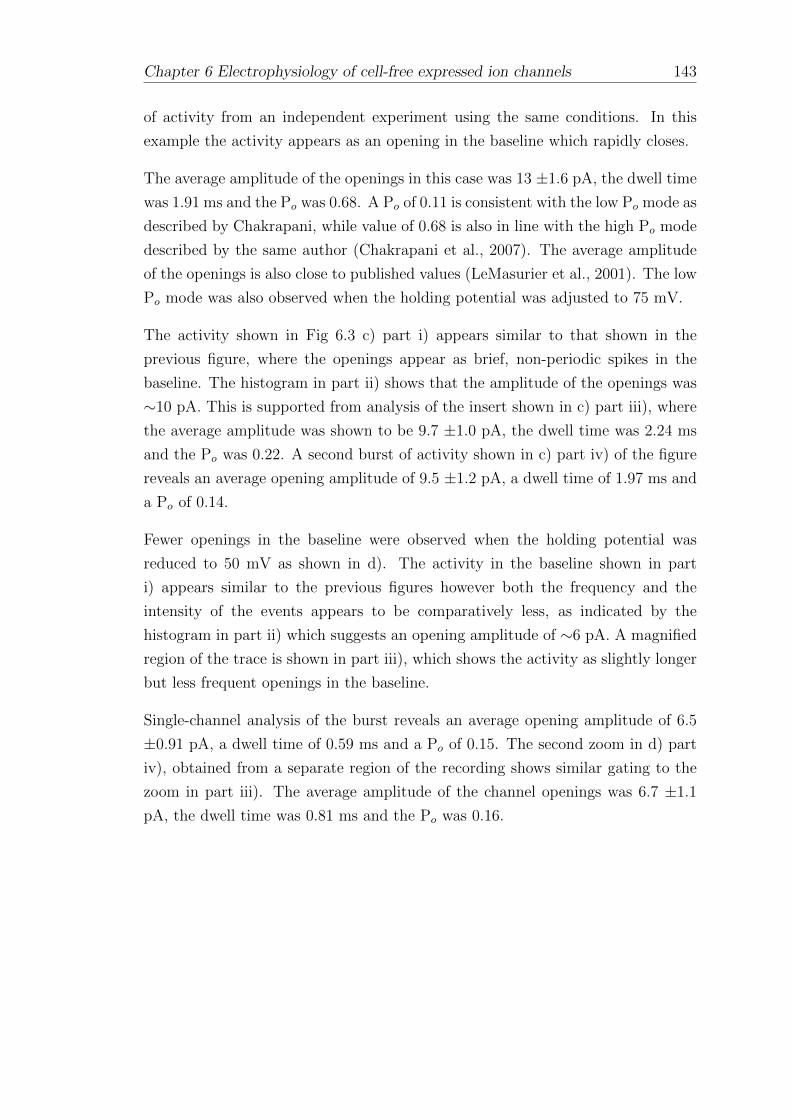
Chapter 6 Electrophysiology of cell-free expressed ion channels 143
of activity from an independent experiment using the same conditions. In this
example the activity appears as an opening in the baseline which rapidly closes.
The average amplitude of the openings in this case was 13 ±1.6 pA, the dwell time
was 1.91 ms and the Po was 0.68. A Po of 0.11 is consistent with the low Po mode as
described by Chakrapani, while value of 0.68 is also in line with the high Po mode
described by the same author (Chakrapani et al., 2007). The average amplitude
of the openings is also close to published values (LeMasurier et al., 2001). The low
Po mode was also observed when the holding potential was adjusted to 75 mV.
The activity shown in Fig 6.3 c) part i) appears similar to that shown in the
previous figure, where the openings appear as brief, non-periodic spikes in the
baseline. The histogram in part ii) shows that the amplitude of the openings was
∼10 pA. This is supported from analysis of the insert shown in c) part iii), where
the average amplitude was shown to be 9.7 ±1.0 pA, the dwell time was 2.24 ms
and the Po was 0.22. A second burst of activity shown in c) part iv) of the figure
reveals an average opening amplitude of 9.5 ±1.2 pA, a dwell time of 1.97 ms and
a Po of 0.14.
Fewer openings in the baseline were observed when the holding potential was
reduced to 50 mV as shown in d). The activity in the baseline shown in part
i) appears similar to the previous figures however both the frequency and the
intensity of the events appears to be comparatively less, as indicated by the
histogram in part ii) which suggests an opening amplitude of ∼6 pA. A magnified
region of the trace is shown in part iii), which shows the activity as slightly longer
but less frequent openings in the baseline.
Single-channel analysis of the burst reveals an average opening amplitude of 6.5
±0.91 pA, a dwell time of 0.59 ms and a Po of 0.15. The second zoom in d) part
iv), obtained from a separate region of the recording shows similar gating to the
zoom in part iii). The average amplitude of the channel openings was 6.7 ±1.1
pA, the dwell time was 0.81 ms and the Po was 0.16.
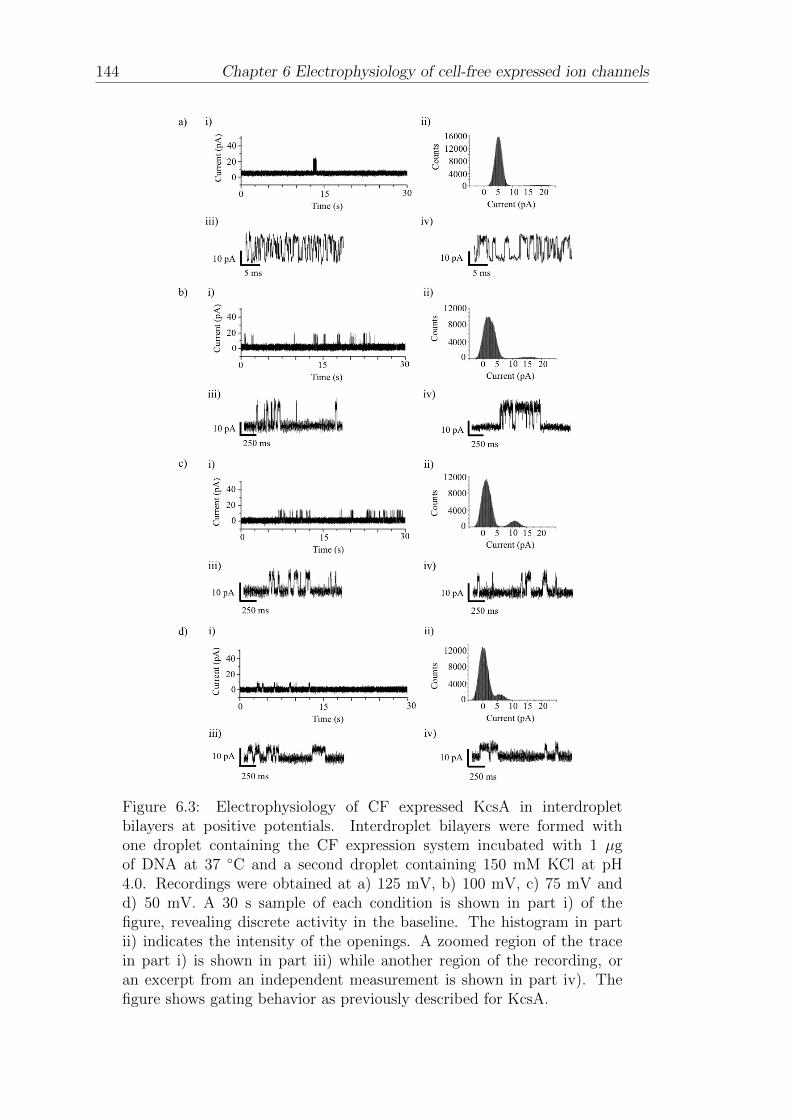
144 Chapter 6 Electrophysiology of cell-free expressed ion channels
Figure 6.3: Electrophysiology of CF expressed KcsA in interdropletbilayers at positive potentials. Interdroplet bilayers were formed withone droplet containing the CF expression system incubated with 1 µgof DNA at 37 ◦C and a second droplet containing 150 mM KCl at pH4.0. Recordings were obtained at a) 125 mV, b) 100 mV, c) 75 mV andd) 50 mV. A 30 s sample of each condition is shown in part i) of thefigure, revealing discrete activity in the baseline. The histogram in partii) indicates the intensity of the openings. A zoomed region of the tracein part i) is shown in part iii) while another region of the recording, oran excerpt from an independent measurement is shown in part iv). Thefigure shows gating behavior as previously described for KcsA.

Chapter 6 Electrophysiology of cell-free expressed ion channels 145
Data obtained under negative potentials are shown in Fig 6.4, where three
recordings obtained at -100 mV are shown in a). The traces show that the bilayer
fails in ≤ 3 minutes in each case, resulting in the droplets merging as indicated by
the saturation of the current. In part i) the baseline is seen to briefly fall to ∼-20
pA before returning to ∼0 and suddenly fusing after 40 seconds.
The insert reveals that a small amount of low intensity noise is detected in the
baseline before the current saturates. In a) part ii) the baseline is slightly offset at
∼5 pA and gradually returns to ∼0 pA. With the exception of two low-intensity
Figure 6.4: Electrophysiology of CF expressed KcsA in interdropletbilayers at negative potentials. Interdroplet bilayers were formed withone droplet containing the CF expression system incubated with 1 µg ofDNA at 37 ◦C for 2 hours and a second droplet containing 150 mM KClat pH 4.0. Recordings were obtained at a) -100 mV, b) -50 mV and c) -25mV. a) Shows that the bilayer fails in ≤ 3 minutes at -100 mV but thatit is possible to obtain single-channel activity in this timeframe. Partsb) and c) show two examples of individual events at -50 mV and -25mV respectively. The figure shows that the channel shows weak outwardrectification by comparison to the data obtained at positive potentials.

146 Chapter 6 Electrophysiology of cell-free expressed ion channels
spikes, the baseline appears stable for the duration of the recording before the
bilayer suddenly fails after 120 s. The zoom shows one low intensity spike in
the recording before the current rapidly saturates. The recording in a) part iii)
shows two bursts of discrete activity in the baseline before the bilayer rapidly
fails after 170 s. The magnified segment of the trace shows a stable opening in
the baseline followed by fast gating events. Analysis of the openings revealed an
average amplitude of 7.1 ±0.7 pA which is in line with what has been reported
previously by LeMasurier et al. (2001) and is significantly less than the value of
∼13 pA which was obtained when the channel was recorded under forward bias.
Part b) of the figure shows two separate segments of a different recording when the
holding potential was increased to -50 mV. Both examples show a single opening in
the baseline, which is common to observe with KcsA electrophysiology at negative
potentials (LeMasurier et al., 2001). The amplitude of the opening in part i) of the
figure was measured to be 5.6 ±1.1 pA, while the amplitude of the event shown
in part ii) was calculated to be 6.4 ±1.4 pA. Both values are close to, but remain
less than, the average amplitudes measured at forward bias. Part c) of the figure
shows two separate regions of a recording obtained at -25 mV. Part i) and part ii)
each show a single opening in the baseline, measured to be 4.3 ±1.6 pA and 4.9
±1.1 pA respectively.
The data from Figs 6.3 and 6.4 can be combined to form a current/voltage relation
shown in 6.5. The data confirms that the channel behaves as a weak outward
rectifier, as shown by the greater amount of current passed at positive potentials
compared to negative potentials, which is indicative of KcsA behavior (LeMasurier
et al., 2001).
Figure 6.5: I/V curve of cell-free expressed KcsA characterised ininterdroplet bilayers without purification. The plot reveals that thechannel shows outward rectification, as expected for KcsA gating.

Chapter 6 Electrophysiology of cell-free expressed ion channels 147
In summary, the data in this subsection shows that single-channel measurements
of CF expressed KcsA were obtained directly from the CF mixture, without
purification or reconstitution. This demonstrates both the functionality of the
CF expressed channel, and its capability to spontaneously self-insert into the
interdroplet bilayer for characterisation.
6.2 KcsA inhibition by TEA
Single-channel measurements of CF expressed KcsA were obtained in the previous
subsection where the characteristics of the channel were shown to closely match
those previously reported in the literature. To demonstrate this further, measure-
ments were repeated in the presence of different amounts of tetraethyl ammonium
(TEA), a quaternary ion which is known to block the channel as discussed in
section 2.4.1.
The TEA was added to the second droplet at concentrations of a) 25 mM and
b) 50 mM as described by Kutluay et al. (2005). The data is shown in Fig 6.6,
where two examples are shown for each condition. The channel appears to be
predominantly in the open position in a) part i) before brief closing and opening
events are seen to occur. Analysis of the burst reveals that the average amplitude
of the events was 8.1 ±1.7 pA, which is close to 8.2 ±1.7 pA found for the second
insert in a) part ii). Both values are significantly lower than ∼13 pA found when
no TEA was added and are in-line with what was reported previously (Kutluay
et al., 2005).
The amplitude of the openings was further reduced when the TEA concentration
was increased to 50 mM as shown in part b). The recording shown in b) part i),
for example, shows what appears to be a burst of quick gating akin to the flicker
mode. The average amplitude of the channel openings was 6.2 ±1.1 pA, the dwell
time was 1.02 ms and the Po was 0.57. A different region of the same trace is
shown in part ii). Specifically, it appears that a channel in the bilayer briefly
closes and opens before closing for ∼100 ms and briefly opening and closing again.
The amplitude of the events was ∼6 pA, which fits closely both with the data
from part i) and with previously published values (Kutluay et al., 2005).
In summary, the data shows that the TEA inhibits the channel, providing further
verification that the observed channel activity is indeed CF expressed KcsA.

148 Chapter 6 Electrophysiology of cell-free expressed ion channels
Figure 6.6: Inhibition of CF expressed KcsA by TEA. The figure showssingle-channel measurements of interdroplet bilayers formed with a 2 µldroplet of the cell-free expression mixture incubated at 37 ◦C for 2 hourswith 1 µg of the DNA template and a 2 µl droplet of 150 mM KCl, pH 4.0supplemented with a) 25 mM and b) 50 mM of the quaternary ammoniumion TEA. Recordings were performed at 100 mV. The figure shows thatTEA inhibits the channel.
6.3 Electrophysiology of KcsA expressed in the
presence of lipid vesicles
In previous parts of this study, the addition of vesicles has been shown to 1)
assist with the stabilisaiton of interdroplet bilayers using the unincubated CF
mixture (section 4.6) and 2) promote the CF expression of KcsA (section 5.1.4. In
addition, vesicles can also serve as a delivery mechanism to the bilayer as discussed
in sections 2.1.5 and 2.2.5.
The CF mixture was prepared in triplicate with 1 µg of DNA and incubated at
37◦C for 2 hours as described in section 3.1.4, except for the addition of a) 250
µg, b) 25 µg and c) 2.5 µg of DOPC/POPG (1:1 by mass) vesicles (extruded
to a final diameter of 100 nm). 2 µl of each preparation was used to form an
interdroplet bilayer with a second droplet containing 750 mM KCl, 10 mM HEPES,
pH 4.0 using manual manipulation as described in section 3.2.5.4. Single channel
measurements were performed as detailed in section 3.2.1 .
Chapter 6 Electrophysiology of cell-free expressed ion channels 149
A representative measurement for each condition is shown in Fig 6.7. Where
250 µg of vesicles was added to the CF system in part a), the recording shows the
baseline current briefly rising to ∼50 pA before later rising again to ∼200 pA where
smaller and shorter increases and decreases in the baseline current are observed.
The region of the trace shown in part i) reveals a discrete burst of activity in the
baseline which resembles single-channel activity. Notably, the brief events show a
reduction in the baseline current, suggesting that there is at least one channel held
in the open position which momentarily closes. Analysis of the activity reveals
that the average amplitude of the closings is 17.3 ±2.0 pA, a dwell time of 4.33
ms and a Po of 0.84. Similar activity is shown in the zoom in part ii) where two
closings and openings appear to occur sequentially, suggesting that several active
channels may have inserted into the bilayer. The average amplitude for the first
level of closings was 17.6 ±5.7 pA, the dwell time was 1.35 ms while the average
amplitude for the second level of openings was 31 ±3.3 pA, with a dwell time of
7.61 ms. The suggestion that two channels are sequentially closing and opening is
indicated as 31.2 pA is close to double the value of 17.6 pA, however the amplitude
of these openings is lower than what has been reported for KcsA when 750 mM
KCl is present on both sides of the bilayer (LeMasurier et al., 2001). This could be
due to an artefact or because the KCl concentrations were asymmetric in this case,
with 150 mM KCl in the cis (extracellular) side of the bilayer and 750 mM on the
trans side. It is also possible the gating seen in the figure is not caused by KcsA
at all, however no events of this nature were observed under similar conditions in
Chapter 4 when no DNA was added to the CF system.
The recording shown in part b), where 25 µg of vesicles were added to the CF
system, shows a similar increase in the bilayer current however the level of the
baseline is lower at ∼100 pA compared to part a). Closer inspection of the
recording revealed several discrete closings as shown in the zooms in i) and ii)
however no bursts of activity were observed. Analysis of the opening shown in
part i) reveals an amplitude of 20 pA, while the openings in part ii) were measured
at 19 pA and 13 pA respectively. It is possible that the larger openings relate to
the single-channel, while the lower value represents the sub-conductance state as
described by Cuello et al. (Cuello et al., 1998) however the absence of bursts of
gating was unexpected.
When 2.5 µg of vesicles were added to the CF mixture in part c) the baseline was
seen to rise to ∼30 pA, far less than what was observed in parts a) and b). The
zoom in part i) shows three short bursts of activity in the bilayer, each separated
by a brief period of inactivity, which is indicative of KcsA gating behaviour. The

150 Chapter 6 Electrophysiology of cell-free expressed ion channels
average amplitude of the closings was 20 ±2.5 pA, the dwell time was 3.6 ms and
the Po was 0.74, values that are expected for single-channel KcsA. A continuous
burst of gating behaviour is shown in part ii), where the average amplitude of the
channel openings was 20 ±2.5 pA, the dwell time was 1.96 ms and the Po was
0.77.
The large increases in the baseline current seen in the figure are reminiscent to
when vesicles were added to the unincubated CF system containing no DNA in
Fig 4.9. This indicates that vesicles supplied to the CF system are fusing with
the membrane, incorporating KcsA and/or membrane pertubing components from
the CF kit with the bilayer. Yet interestingly, this appears to improve when less
vesicles are added, implying less incorporation with the bilayer. This the opposite
Figure 6.7: Electrophysiology of KcsA expressed in the presence of vesicles.KcsA was expressed with 1 µg of DNA and incubated at 37 ◦C for 2hours with a) 250 µg b) 25 µg and c) 0.25 µg of DOPC/POPG (1:1 bymass) vesicles extruded to a final diameter of 100 nm. The indicatedregions of each recording are shown in the zooms in i) and ii). Despitethe detection of channel activity, the figure shows that stable baslines aredifficult to achieve under these conditions and indicates that single channelmeasurements may be easier to obtain when less vesicles are added to theCF system.
Chapter 6 Electrophysiology of cell-free expressed ion channels 151
to what was observed in Chapter 4, where the addition of vesicles was found to
stabilise the bilayer. It is possible that this effect could be a result of KcsA self-
inserting into the vesicles and making them more fusogenic. This is consistent with
the observation of channel activity in almost all measurements, the finding that
∼3.7 µg of KcsA is expressed per volume of the CF kit in the presence of vesicles
(section 5.1.4) and with previous reports with MscL, where macroscopic currents
were observed when the channel was expressed in the presence of liposomes (Berrier
et al., 2011). The difference in the lifetime of the bilayers compared to Fig 4.9 is
exlained by the low pH of the second droplet as detailed in section 4.3.
In summary, the results in this subsection show that the CF mixture incubated
with the KcsA template and vesicles leads to the appearance of transient
bilayer current fluctuations in single-channel measurements. The data implies
that this might be caused by a large number of active KcsA channels in the
bilayer, suggesting that the addition of vesicles compromises the control of bilayer
insertion.
6.4 Electrophysiology of CF expressed and pu-
rified KcsA in interdroplet bilayers
In the previous subsections single-channel measurements of CF expressed KcsA
were obtained in interdroplet bilayers formed directly from the CF system, where
the channel was shown to be capable of self-inserting into the membrane for
characterisation. To identify whether the effect of self-insertion was dependent on
the presence of the CF system, the His-tagged protein was expressed and purified
and supplied to the bilayer without reconstitution.
The CF reaction was incubated at 2x volume with 3 µg of DNA per volume at 37◦C for 2 hours. The expressed protein was purified as described in section 3.1.5
except that the final elution was performed using 500 mM imidazole containing
150 mM KCl, pH 7.0. The elutions were collected in a PCR tube and used for
single channel experiments which were performed as described in section 3.2.1.
The data in Fig 6.8 part a) shows a representative trace of three experiments where
an interdroplet bilayer was formed from a 2 µl droplet of purified protein from the
CF mixture supplied with no DNA, and a second 2 µl droplet containing 150 mM
KCl buffer at pH 4.0. The current trace in part i) shows that the baseline is stable

152 Chapter 6 Electrophysiology of cell-free expressed ion channels
for the duration of the 15 minute recording with the appearance of only a few low
intensity spikes.
A zoom of the indicated region of the recording distinguishes the spikes from
channel activity while the capacitance trace in part ii) shows that the bilayer
remained intact for the duration of the recording, revealing a capacitance of 250
pF which equates to an approximate bilayer diameter of 252 µm. The data shows
that no single channel activity was observed when no DNA was added to the
system.
Part b) of the figure shows a representative trace of three independent measure-
ments of an interdroplet bilayer formed from a 2 µl droplet of purified protein
from the CF expression mixture incubated with the DNA template, and a second
2 µl droplet containing 150 mM KCl buffer at pH 7.0. The current trace in part i)
shows several low intensity spikes in the baseline of varying magnitude, which are
distinguished from channel activity by the zoom provided. The bilayer was intact
for the duration of the 15 minute recording as shown from the capacitance trace
in part ii), revealing a capacitance of 400 pF, equating to an approximate bilayer
diameter of 319 µm.
A representative trace from three repeats of a third control experiment is shown in
Fig 6.8 part c), where an interdroplet bilayer was formed of one droplet of the final
elution buffer (500 mM imidazole containing 150 mM KCl, pH 7.0) and a second
droplet containing 150 mM KCl buffer at pH 4.0. The current measurement in part
i) of the figure shows some current spikes in the baseline, which do not resemble
channel activity as indicated by the zoom. The capacitance recording shown in
part ii) of the figure confirms that the bilayer remained in contact at the end of
the 15 minute recording, revealing a capacitance of 325 pF which equates to an
approximate bilayer diameter of 288 µm.
Measurements of CF expressed and purified KcsA are shown in Fig 6.9 under
different positive holding potentials, where interdroplet bilayers were formed from
one 2 µl droplet of purified protein from the CF mixture, and a 2 µl droplet of
150 mM KCl buffer at pH 4.0.
Part a) of the figure shows segments of two separate measurements obtained at 125
mV where in both cases the channel appears predominantly open with rapid closing
and opening events. The histogram in part iii) is taken from the measurement in
part i) and reveals an average opening amplitude of ∼20 pA. This value is in
line with the results obtained from the analysis of the burst, revealing an average
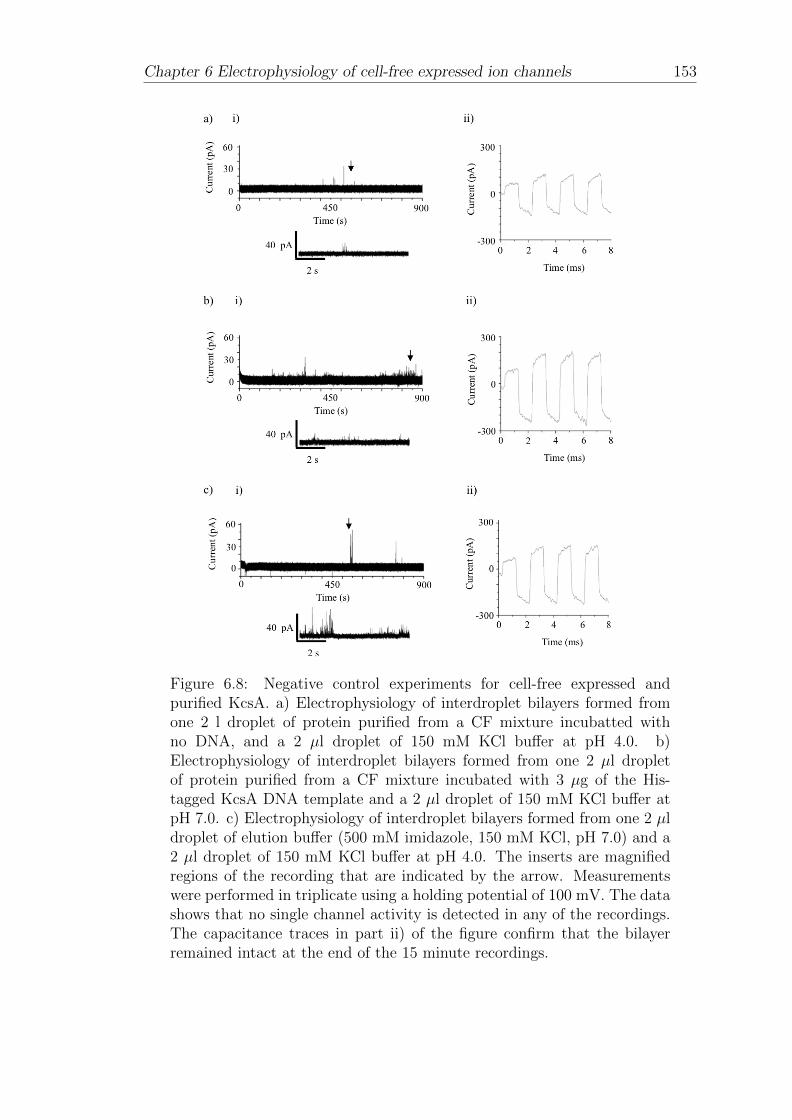
Chapter 6 Electrophysiology of cell-free expressed ion channels 153
Figure 6.8: Negative control experiments for cell-free expressed andpurified KcsA. a) Electrophysiology of interdroplet bilayers formed fromone 2 l droplet of protein purified from a CF mixture incubatted withno DNA, and a 2 µl droplet of 150 mM KCl buffer at pH 4.0. b)Electrophysiology of interdroplet bilayers formed from one 2 µl dropletof protein purified from a CF mixture incubated with 3 µg of the His-tagged KcsA DNA template and a 2 µl droplet of 150 mM KCl buffer atpH 7.0. c) Electrophysiology of interdroplet bilayers formed from one 2 µldroplet of elution buffer (500 mM imidazole, 150 mM KCl, pH 7.0) and a2 µl droplet of 150 mM KCl buffer at pH 4.0. The inserts are magnifiedregions of the recording that are indicated by the arrow. Measurementswere performed in triplicate using a holding potential of 100 mV. The datashows that no single channel activity is detected in any of the recordings.The capacitance traces in part ii) of the figure confirm that the bilayerremained intact at the end of the 15 minute recordings.

154 Chapter 6 Electrophysiology of cell-free expressed ion channels
amplitude of 20 ±1.7 pA with a dwell time of 8.49 ms and a Po of 0.93. Analysis
of the burst shown in part ii) of the figure shows an average amplitude of 19 ±0.96
pA, a dwell time of 6.33 ms and a Po of 0.90. Both values for the open probability
are consistent with those for the high Po state of the channel as described by
Chakrapani (Chakrapani et al., 2007) however the average opening amplitudes in
each case are ∼4 pA higher than those reported in the previous subsection for
unpurified protein and by (LeMasurier et al., 2001). This could be a result of fact
that the measurement was obtained at an elevated baseline, as indicated by the
histogram in part iii), yet how this would lead to a higher opening amplitude is
unclear.
Two independent measurements at 100 mV are shown in part b) of Fig 6.9, where
the segment shown in i) shows relatively long openings followed by brief closings.
It is notable that the openings and closings seem to appear more rapidly toward
the end of the trace. The histogram in iii) indicates that the amplitude of the
events is approximately 13 pA. A different type of gating behavior is shown in the
example provided in part ii) where the channel appears to be predominately in
the open state and rapidly closes. Analysis of the measurement in part i) reveals
an average amplitude of 13 ±0.98 pA, a dwell time of 12.84 ms and a Po of 0.46.
Meanwhile analysis of the burst in part ii) returned an average amplitude of 15
±1.2 pA a dwell time of 7.36 ms and a Po of 0.88. The values are ∼1 pA higher
than the measurements obtained for the unpurified protein without the HN tag
under the same holding potential.
Part c) of Fig 6.9 shows two separate measurements performed at 75 mV. In the
example provided in part i) the channel appears to stay open with brief gating
events, similar to the activity observed previously. While in part ii) the gating is
observed as discrete openings and closings. The average amplitude for the events
in part i) was 9.2 ±0.96 pA, the dwell time was 5.64 ms and the Po was 0.87. The
same measurements for ii) returned a value of 8.7 ±1.2 pA for the average opening
amplitude, a dwell time of 3.19 ms and a Po of 0.52. Both values for the average
opening amplitude are ∼1 pA less than those reported in the previous subsection.
Measurements performed at 50 mV are shown in part d) of Fig 6.9. In i) and ii)
the channel appears to be predominantly held in the open state with brief gating
events. However it is also clear that under these conditions it can be challenging
to separate the low amplitude gating events from the noise already present in the
baseline. This difficulty is also illustrated by the histogram in part iii) where two
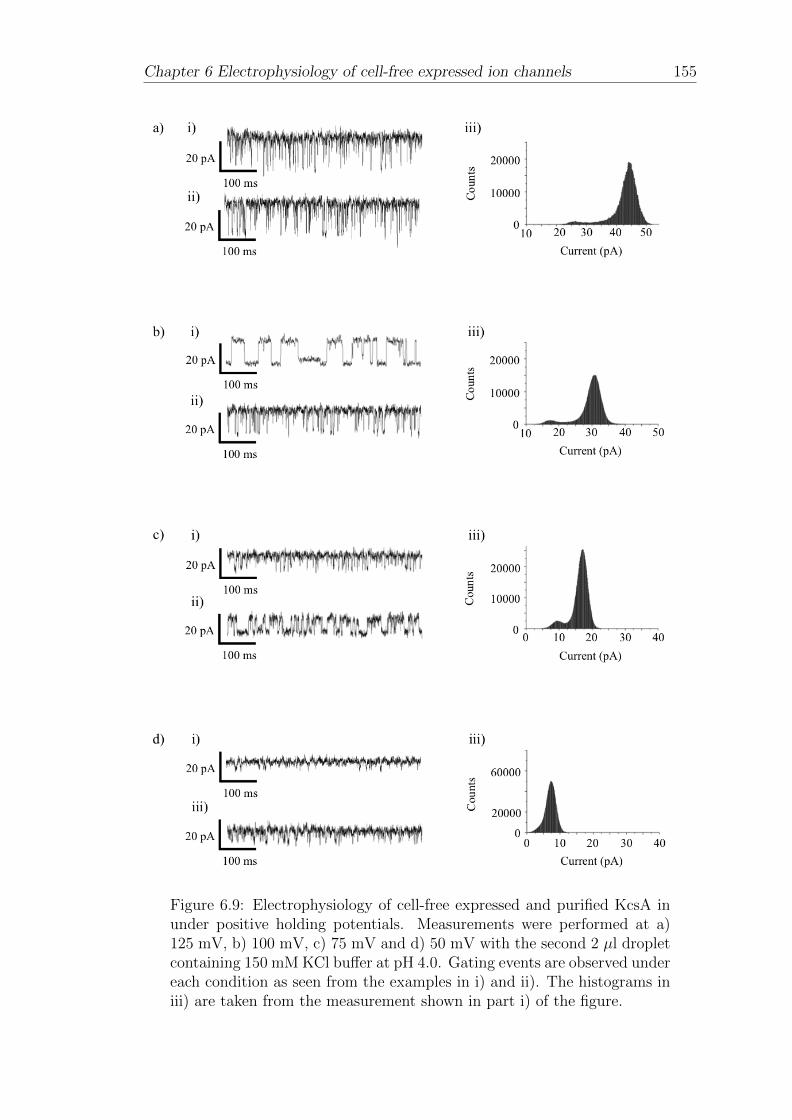
Chapter 6 Electrophysiology of cell-free expressed ion channels 155
Figure 6.9: Electrophysiology of cell-free expressed and purified KcsA inunder positive holding potentials. Measurements were performed at a)125 mV, b) 100 mV, c) 75 mV and d) 50 mV with the second 2 µl dropletcontaining 150 mM KCl buffer at pH 4.0. Gating events are observed undereach condition as seen from the examples in i) and ii). The histograms iniii) are taken from the measurement shown in part i) of the figure.
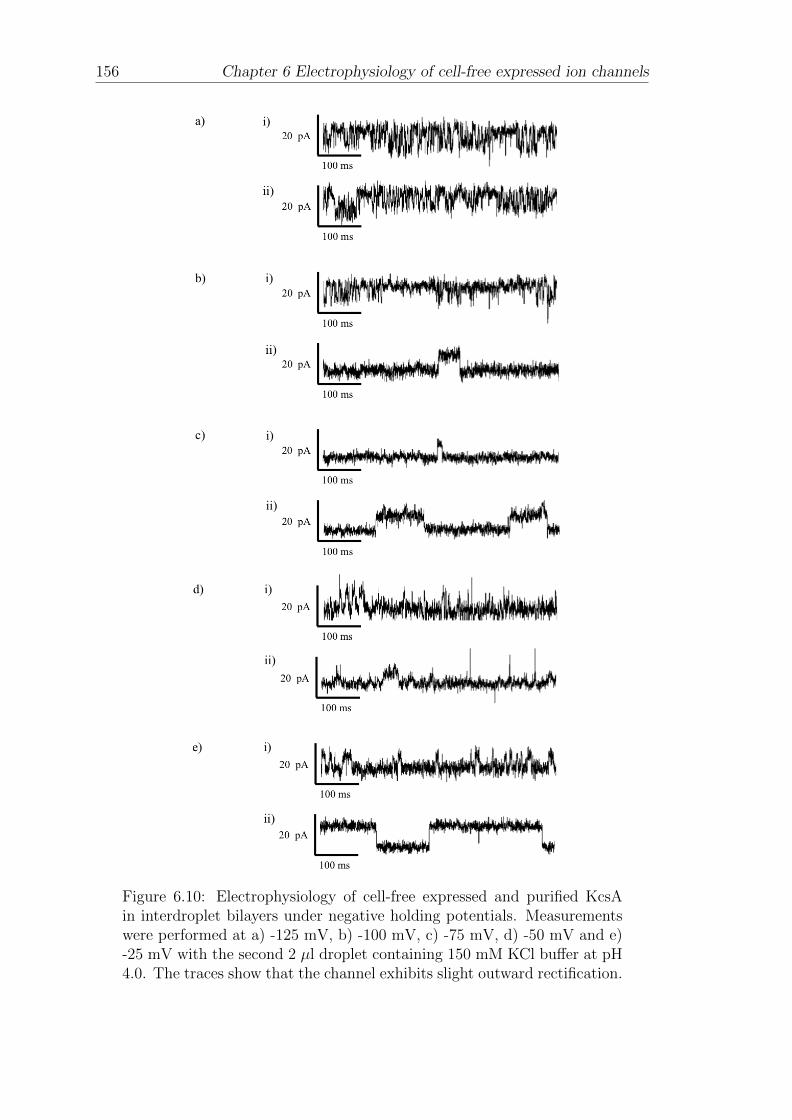
156 Chapter 6 Electrophysiology of cell-free expressed ion channels
Figure 6.10: Electrophysiology of cell-free expressed and purified KcsAin interdroplet bilayers under negative holding potentials. Measurementswere performed at a) -125 mV, b) -100 mV, c) -75 mV, d) -50 mV and e)-25 mV with the second 2 µl droplet containing 150 mM KCl buffer at pH4.0. The traces show that the channel exhibits slight outward rectification.

Chapter 6 Electrophysiology of cell-free expressed ion channels 157
populations of openings are difficult to clearly identify. Single-channel analysis of
the data returned an average amplitude of 5.0 ±0.79 pA a dwell time of 2.29 ms
and a Po of 0.84 for the measurement in part i) and an average amplitude of 6.7
±1.1 pA a dwell time of 3.09 ms and a Po of 0.85 for the measurement in part ii).
The data is close to the value of ∼6.5 pA obtained previously for unpurified KcsA
at 50 mV.
To further characterise the CF expressed and purified KcsA, measurements of the
channel were performed under negative holding potentials as shown in Fig 6.10.
Part a) of the figure shows two measurements obtained at -125 mV. In each case
the activity is seen as rapid opening and closing events, without a notable inactive
period.
Other reports of KcsA measurements obtained at negative potentials suggests
that this is less common for the channel under these conditions where single, less
frequent, openings and closings in the baseline tend to be observed (LeMasurier
et al., 2001). Analysis of the data reveals an average opening amplitude of -9.1
±1.6 pA for part i) and -8.4 ±1.3 pA for part ii), values which are noticeably less
than the results obtained for the channel at positive potentials and close to those
reported previously (LeMasurier et al., 2001).
The data in part b) of 6.10 shows two separate measurements performed at -100
mV. The example in part i) shows a burst of openings of in the baseline separated
by a period of inactivity. The average amplitude of the events was -8.1 ±1.4
pA, which is similar to the value obtained with unpurified protein in the previous
subsection. The value is also similar to average amplitude of the opening in part
ii), which was -8.1 ±1.8 pA. The intensity of the single event shown in part c)
of the figure was measured to be -7.3 ±0.3 pA when the holding potential was
increased to -75 mV. A separate region of the same trace is presented in ii) where
the two gating events in the baseline were measured to have an average amplitude
of -7.7 pA ±1.4 pA.
Two separate measurements at -50 mV are shown in c), where a number of brief
events are shown in part i) and a single, longer event in part ii). The average
amplitude of the openings in i) was -6.8 ±1.9 pA, while in part ii) the average
amplitude of the openings was -6.1 ±1.3 pA. The values are close to what was
obtained for the unpurified protein in the previous subsection. Part d) of the
figure shows two separate measurements obtained when the holding potential was
changed to -25 mV. Several low amplitude openings are shown in i) with an average
amplitude of -4.8 ±1.4 pA, while two longer events are shown in ii). The average

158 Chapter 6 Electrophysiology of cell-free expressed ion channels
Figure 6.11: I/V curve of cell-free expressed and purified KcsAcharacterised in interdroplet bilayers. The values from the I/V curve shownin the previous subsection with unpurified KcsA is shown for comparison(black Squares). The plot reveals that the purified protein also shows weakoutward rectification and the values from both data sets appear closely inline.
amplitude of the events shown in ii) was 7.7 pA, which was higher than what was
expected compared to the data obtained from the unpurified protein.
The I/V data obtained for the purified KcsA is shown in Fig 6.11 (red circles)
alongside what was obtained in the previous subsection where measurements were
performed without purification (black squares). It is clear from the figure that the
purified protein displays similar outward rectification to what was obtained with
the unpurified protein. With the exception of a small deviation at -25 mV and
125 mV, the figure shows close similarity between the two values.
Similarity was also observed when the CF expressed His-tagged KcsA protein was
studied without purification as shown by the measurement at 100 mV in Fig 6.12.
The trace shows discrete openings and closings in the baseline before remaining
open with rapid closing events. Single channel analysis of the burst reveals an
average opening amplitude of 12 pA ±1.7 pA a dwell time of 5.57 ms and a Po of
0.35, values which are close to those observed in both data sets.
The response of the purified channel to the blocker TEA was also studied as shown
in parts b) and c) of Fig 6.12 where measurements of purified CF expressed KcsA
were obtained at 100 mV with 1 mM and 10 mM of TEA respectively. When 1
mM TEA was used the amplitude of the openings were found to reduce to 8.1
±2.2 pA, while when the amount of TEA was increased to 10 mM the average
amplitude of single openings was found to reduce to 3.8 ±0.9 pA. The data shows
that TEA inhibits the channel, unexpectidly at a lower concentration of the blocker
compared to what was required in the previous subsection for unpurified KcsA.
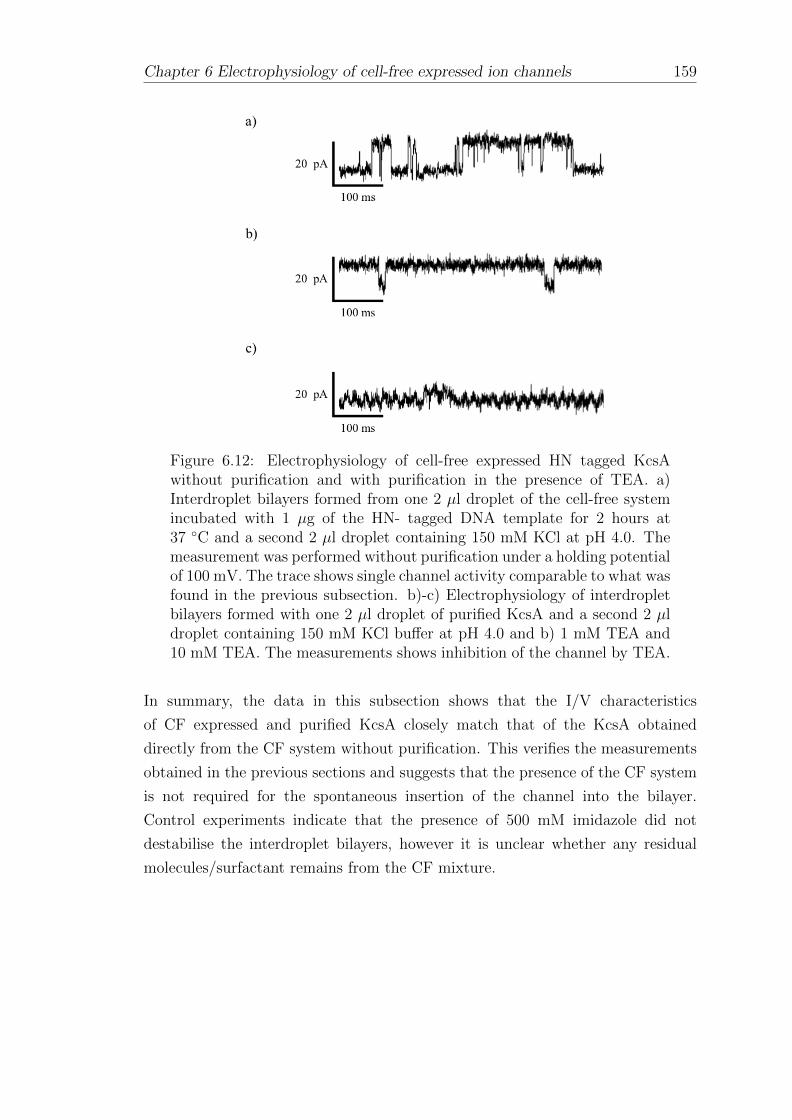
Chapter 6 Electrophysiology of cell-free expressed ion channels 159
Figure 6.12: Electrophysiology of cell-free expressed HN tagged KcsAwithout purification and with purification in the presence of TEA. a)Interdroplet bilayers formed from one 2 µl droplet of the cell-free systemincubated with 1 µg of the HN- tagged DNA template for 2 hours at37 ◦C and a second 2 µl droplet containing 150 mM KCl at pH 4.0. Themeasurement was performed without purification under a holding potentialof 100 mV. The trace shows single channel activity comparable to what wasfound in the previous subsection. b)-c) Electrophysiology of interdropletbilayers formed with one 2 µl droplet of purified KcsA and a second 2 µldroplet containing 150 mM KCl buffer at pH 4.0 and b) 1 mM TEA and10 mM TEA. The measurements shows inhibition of the channel by TEA.
In summary, the data in this subsection shows that the I/V characteristics
of CF expressed and purified KcsA closely match that of the KcsA obtained
directly from the CF system without purification. This verifies the measurements
obtained in the previous sections and suggests that the presence of the CF system
is not required for the spontaneous insertion of the channel into the bilayer.
Control experiments indicate that the presence of 500 mM imidazole did not
destabilise the interdroplet bilayers, however it is unclear whether any residual
molecules/surfactant remains from the CF mixture.
160 Chapter 6 Electrophysiology of cell-free expressed ion channels
6.5 Electrophysiology of CF expressed hERGS5−S6
in interdroplet bilayers
Further to demonstrating the CF expression of the hERGS5−S6 pore domain in
section 5.3, this subsection addresses the functionality of the channel and its
capability to self-insert into an interdroplet bilyer directly from the CF mixture,
without purification or reconstitution.
The hERGS5−S6 construct was expressed using the L1110 system as described in
section 5.3.1. A 2 µl droplet of the completed reaction mixture was used to form
an interdroplet bilayer with a second droplet containing 150 mM KCl buffer at
pH 7.0 by manual manipulation as described in section 3.2.5.4. Single channel
measurements were obtained as detailed in section 3.2.1.
Single channel recordings of the CF expressed hERGS5−S6 pore domain over a
range of holding potentials between 50 mV and 125 mV, with an interval of 25
mV, are shown in Fig 6.13. The 30 second example of a recording at 50 mV in
a) part i) of the figure shows discrete fluctuations in the baseline current that are
magnified in the inserts, iii) and iv). The appearance of the events as negative
spikes from an elevated baseline seems to indicate that the channel is held in the
open state with brief closing and opening events. This is depicted in the histogram,
where a far greater number of data points are shown at a peak of ∼26 pA compared
to the second population of data points at ∼21 pA. This value of ∼5 pA for the
channel opening is close to the 4.9 ± 0.64 pA obtained from ClampFit analysis,
which also generated a dwell time of 0.38 ms and an open probability of 0.05.
A similar form of gating behavior is shown in the measurement in part b), obtained
from the same recording at 75 mV. In this case, the histogram in part ii) of the
figure shows the two populations of data points more distinctly at ∼30 pA and
∼39 pA indicating an average channel opening of ∼ 9 pA. Intraburst analysis of
the trace revealed a similar value of 8.8 ±1.6 pA, a dwell time of 1.37 ms and an
opening probability of 0.07.
The data in part c) shows a 30 second segment of low intensity bilayer activity
at 100 mV, resolved as individual openings and closings in the baseline from the
zooms shown iii) and iv). Both the open and the closed state of the channel is
detectable from the histogram shown in part b) of the figure, where the closed
state appears at ∼4 pA compared to the open state at ∼8 pA, meaning that the
average amplitude of the channel openings was ∼4 pA. This is close to the value
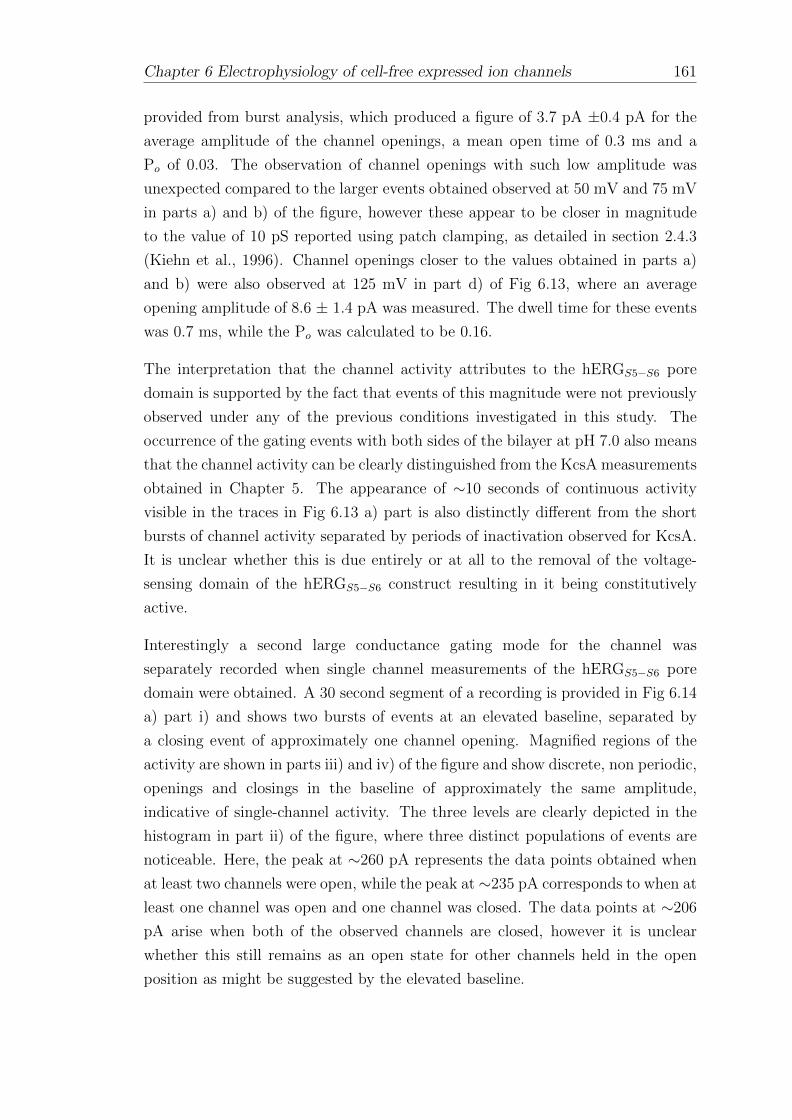
Chapter 6 Electrophysiology of cell-free expressed ion channels 161
provided from burst analysis, which produced a figure of 3.7 pA ±0.4 pA for the
average amplitude of the channel openings, a mean open time of 0.3 ms and a
Po of 0.03. The observation of channel openings with such low amplitude was
unexpected compared to the larger events obtained observed at 50 mV and 75 mV
in parts a) and b) of the figure, however these appear to be closer in magnitude
to the value of 10 pS reported using patch clamping, as detailed in section 2.4.3
(Kiehn et al., 1996). Channel openings closer to the values obtained in parts a)
and b) were also observed at 125 mV in part d) of Fig 6.13, where an average
opening amplitude of 8.6 ± 1.4 pA was measured. The dwell time for these events
was 0.7 ms, while the Po was calculated to be 0.16.
The interpretation that the channel activity attributes to the hERGS5−S6 pore
domain is supported by the fact that events of this magnitude were not previously
observed under any of the previous conditions investigated in this study. The
occurrence of the gating events with both sides of the bilayer at pH 7.0 also means
that the channel activity can be clearly distinguished from the KcsA measurements
obtained in Chapter 5. The appearance of ∼10 seconds of continuous activity
visible in the traces in Fig 6.13 a) part is also distinctly different from the short
bursts of channel activity separated by periods of inactivation observed for KcsA.
It is unclear whether this is due entirely or at all to the removal of the voltage-
sensing domain of the hERGS5−S6 construct resulting in it being constitutively
active.
Interestingly a second large conductance gating mode for the channel was
separately recorded when single channel measurements of the hERGS5−S6 pore
domain were obtained. A 30 second segment of a recording is provided in Fig 6.14
a) part i) and shows two bursts of events at an elevated baseline, separated by
a closing event of approximately one channel opening. Magnified regions of the
activity are shown in parts iii) and iv) of the figure and show discrete, non periodic,
openings and closings in the baseline of approximately the same amplitude,
indicative of single-channel activity. The three levels are clearly depicted in the
histogram in part ii) of the figure, where three distinct populations of events are
noticeable. Here, the peak at ∼260 pA represents the data points obtained when
at least two channels were open, while the peak at ∼235 pA corresponds to when at
least one channel was open and one channel was closed. The data points at ∼206
pA arise when both of the observed channels are closed, however it is unclear
whether this still remains as an open state for other channels held in the open
position as might be suggested by the elevated baseline.
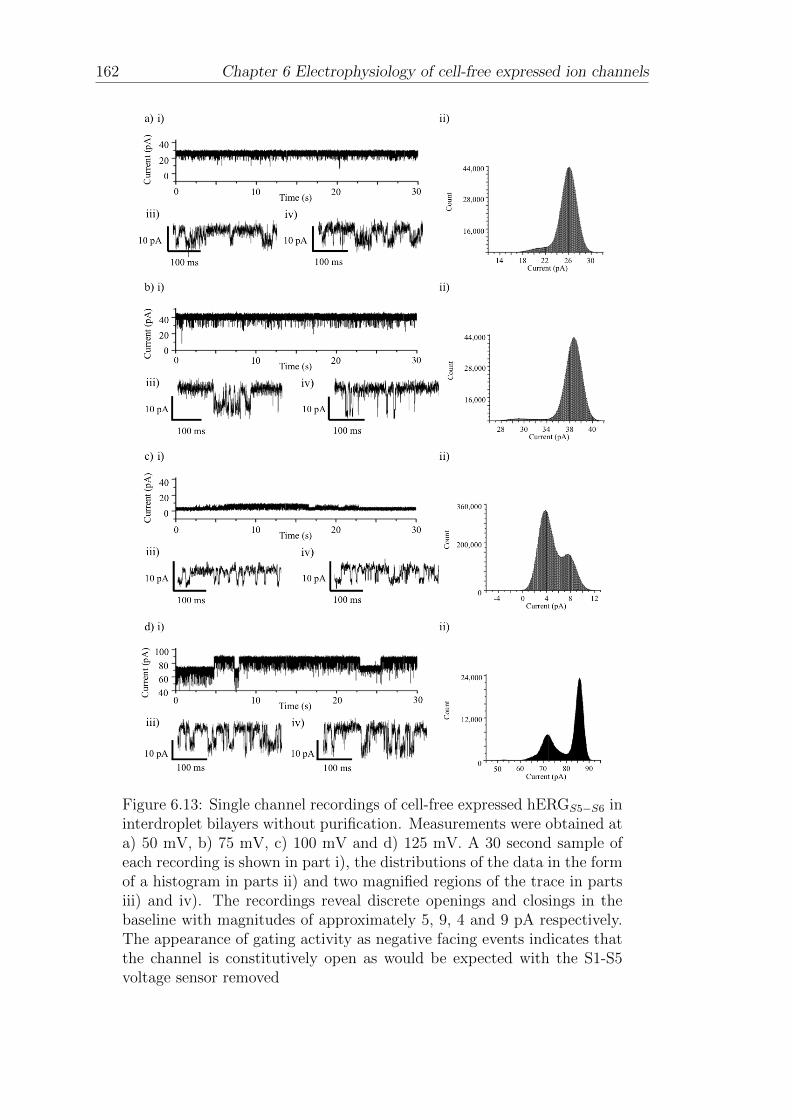
162 Chapter 6 Electrophysiology of cell-free expressed ion channels
Figure 6.13: Single channel recordings of cell-free expressed hERGS5−S6 ininterdroplet bilayers without purification. Measurements were obtained ata) 50 mV, b) 75 mV, c) 100 mV and d) 125 mV. A 30 second sample ofeach recording is shown in part i), the distributions of the data in the formof a histogram in parts ii) and two magnified regions of the trace in partsiii) and iv). The recordings reveal discrete openings and closings in thebaseline with magnitudes of approximately 5, 9, 4 and 9 pA respectively.The appearance of gating activity as negative facing events indicates thatthe channel is constitutively open as would be expected with the S1-S5voltage sensor removed
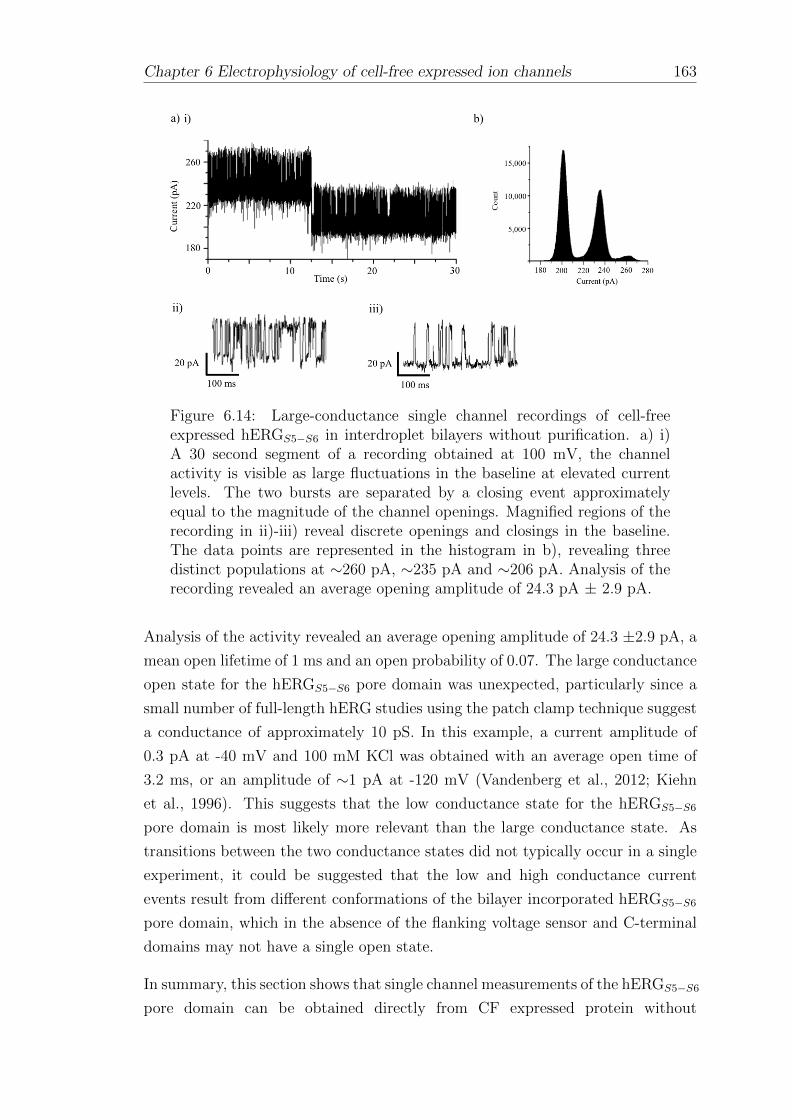
Chapter 6 Electrophysiology of cell-free expressed ion channels 163
Figure 6.14: Large-conductance single channel recordings of cell-freeexpressed hERGS5−S6 in interdroplet bilayers without purification. a) i)A 30 second segment of a recording obtained at 100 mV, the channelactivity is visible as large fluctuations in the baseline at elevated currentlevels. The two bursts are separated by a closing event approximatelyequal to the magnitude of the channel openings. Magnified regions of therecording in ii)-iii) reveal discrete openings and closings in the baseline.The data points are represented in the histogram in b), revealing threedistinct populations at ∼260 pA, ∼235 pA and ∼206 pA. Analysis of therecording revealed an average opening amplitude of 24.3 pA ± 2.9 pA.
Analysis of the activity revealed an average opening amplitude of 24.3 ±2.9 pA, a
mean open lifetime of 1 ms and an open probability of 0.07. The large conductance
open state for the hERGS5−S6 pore domain was unexpected, particularly since a
small number of full-length hERG studies using the patch clamp technique suggest
a conductance of approximately 10 pS. In this example, a current amplitude of
0.3 pA at -40 mV and 100 mM KCl was obtained with an average open time of
3.2 ms, or an amplitude of ∼1 pA at -120 mV (Vandenberg et al., 2012; Kiehn
et al., 1996). This suggests that the low conductance state for the hERGS5−S6
pore domain is most likely more relevant than the large conductance state. As
transitions between the two conductance states did not typically occur in a single
experiment, it could be suggested that the low and high conductance current
events result from different conformations of the bilayer incorporated hERGS5−S6
pore domain, which in the absence of the flanking voltage sensor and C-terminal
domains may not have a single open state.
In summary, this section shows that single channel measurements of the hERGS5−S6
pore domain can be obtained directly from CF expressed protein without
164 Chapter 6 Electrophysiology of cell-free expressed ion channels
purification or reconstitution in interdroplet bilayers. This demonstrates that the
CF expressed channel is functionally active and that it is capable of spontaneous
self-insertion into the bilayer for characterisation.
6.6 Summary
As the CF expression of ion channels was verified in Chapter 5, the focus of this
chapter was to identify whether the CF expressed ion channels were functional and
capable of self-inserting into an interdroplet bilayer for characterisation without
purification from the CF expression mixture. This was shown in section 6.1 for
KcsA, and section 6.5 for hERGS5−S6 where in both cases, single-channel currents
were observed in interdroplet bilayers formed directly from the CF mixture after
incubation with the respective DNA template. The KcsA activity closely matched
examples reported previously in the literature, including the blockade of the
channel by TEA (section 6.2), however it was found that the bilayer failed quickly
at negative potentials. The bilayer was also found to become unstable and fail
through the appearance of spikes and leakage currents when KcsA was expressed
in the presence of vesicles (section 5.1.4), more so than observed when vesicles
were supplied to a preincubated CF system in the absence of DNA in 4.6. It
was expected that the problem would be improved by diluting the CF mixture,
however this resulted in the observation of stable baselines with no channel activity.
Instead it was found that single-channel activity could be observed by reducing
the amount of vesicles supplied to the system. This implies that the presence
of vesicles promoted the expression of KcsA and/or fusion with the bilayer,
while the ineffectiveness of dilution suggests that perhaps the presence of the CF
system was required in order to achieve self-insertion into the bilayer. To clarify
this, CF expressed His-tagged KcsA was purified from the CF mixture in buffer
containing 500 mM imidazole and 150 mM KCl (section 6.4). The observation
of single-channel activity under these conditions indicates that the mechanism of
insertion is not dependent on the presence of the CF system however it is unclear
whether any residual surfactant from the expression mixture remained. Thus,
this chapter shows that single channel measurements of CF expressed KcsA and
hERGS5−S6 can be obtained in interdroplet bilayers formed directly from the CF
expression mixture, without purification or reconstitution. This demonstrates the
functionality of both CF expressed channels and their capability to spontaneously
insert into the bilayer for characterisation.
Chapter 7
Conclusion
7.1 Summary
As outlined in Chapter 1, ion channels are important targets for medical research
and drug discovery, however the conventional methods for studying ion channels
in model membrane systems are limited by the requirement to over-express the
channel of interest in cells, which is low-yielding. To obtain a suitable yield,
and to account for further losses downstream through protein purification and
reconstitution the expression of ion channels in cells is typically performed in a
volume of several litres, requiring a substantial amount of time, equipment and
lab space.
As explained in section 2.3 it is possible that this could be considerably simplified
using CF protein expression, with a commercially available mixture based on either
prokaryotic or eukaryotic cell extracts. One distinct advantage of this method is
that the reaction can be encapsulated inside a microdroplet. This economises the
cost of the reaction mixture and, in principle, allows for the ion channel of interest
to be expressed in the presence of an interdroplet bilayer. Under these conditions
it has been reported that ion channels can spontaneously insert into lipid bilayers
(section 2.3.2), allowing for single-channel electrophysiological measurements to
be obtained (section 2.1.4).
While coupling the expression and characterisation of ion channels in microdroplets
could significantly improve the throughput of ion channel measurements in
bilayers, potentially improving the rate of discovering novel pharmaceutical
compounds, progress has been limited by the short lifetime of interdroplet bilayers
165
166 Chapter 7 Conclusion
containing a pre-incubated CF expression mixture. This was investigated in
Chapter 4, where it was found that lipids, high concentrations of proteins and
PEG 8,000 caused membrane instability. However it was also shown that the
bilayer could be stabilised by diluting the CF expression mixture and adding large
concentrations of lipids, supplied to the reaction mixture as vesicles.
The capability of commercial CF systems to express ion channels from custom
DNA templates was shown in Chapter 5 through the expression of KcsA and
hERGS5−S6, which were both identified on SDS PAGE gels after purification.
The presence of hERGS5−S6 was also verified by Western Blotting (section 5.3.1).
Interestingly, for KcsA, it was found that the addition of vesicles to the CF mixture
facilitated an increase in the amount of protein expressed, from approximatly 0.4
µg per 50 µl volume of the CF mixture to 3.7 µg. A similar increase in the
amount of KcsA expressed was also observed by increasing the amount of KcsA
DNA to the CF mixture, however neither effect was observed for hERGS5−S6
expression. This shows that the expression conditions are important for controlling
the amount of protein expressed and indicates that optimal conditions for protein
expression and the yield of the expression may differ from channel to channel. The
control measurements in Chapter 6 show that interdroplet bilayers formed with
one droplet containing the CF mixture incubated with the KcsA DNA template
and a second droplet containing buffer at pH 7.0 were repeatedly stable for the
duration of the 30 minute recordings, and were more stable than interdroplet
bilayers formed in Chapter 4 with one droplet containing the pre-incubated CF
mixture (without DNA) and a second droplet containing buffer at pH 7.0 (average
lifetime <10 minutes). It is unclear whether this unexpected increase in the bilayer
stability can be attributed to the presence of the CF expressed protein, or whether
the exhausted CF system, after incubation with the DNA template, perturbs the
bilayer less compared to the pre-incubated mixture. However, it is clear through
the appearance of spikes and leakage currents leading to bilayer failure, that the
interdroplet bilayers comprised of a CF system incubated with vesicles and the
KcsA DNA template (Chapter 6) were less stable than those formed with the
unincubated CF system, without DNA, in the presence of vesicles (Chapter 4).
In Chapter 6 it was also shown that single-channel measurements of CF expressed
KcsA and hERGS5−S6 could be obtained from a 2 µl droplet of the CF expression
mixture incubated with the respective DNA template, by forming an interdroplet
bilayer with a 2 µl droplet of buffer. These measurements, obtained directly
from the undiluted CF mixture, without protein purification or reconstitution,
Chapter 7 Conclusion 167
show that CF expressed proteins can self-insert into interdroplet bilayers in-
situ for electrical characterisation. The detection of channel activity in these
measurements, together with the observation of an increased yield of KcsA
expressed in the presence of vesicles in Chapter 5, indicates that the instability
observed in this case arises due to a number of active channels inserted into the
membrane. It was expected that this would be improved by dilution, however this
instead led to the observation of stable baselines devoid of channel activity. This
may indicate that the components of the CF mixture is required in order for the
channel to spontaneously insert into the bilayer, components of which may have
remained when measurements of the purified CF expressed His-tagged KcsA were
obtained. While these results indicate that the stabilisation strategy of diluting
the CF system and adding high concentrations of vesicles may not be suitable
for obtaining ion channel measurements, the results in Chapter 5 imply that this
may be optimised by limiting the amount of DNA supplied to the CF system.
This in combination with adding more lipids to the oil and a small dilution may
allow for the expression and characterisation of ion channels to be fully coupled
in microdroplets.
In conclusion, the findings of this study, namely the stabilisation of the bilayer
in the presence of the CF system, the demonstration of the CF expression of
ion channels and the observation of spontaneous bilayer insertion support the
feasibility of coupling the expression and characterisation of ion channels in
microdroplets for the development of high-throughput bilayer platforms for ion
channel measurements, including drug screening.
7.2 Recommendations for future work
• Single-channel electrophysiology of different cell-free expressed ion
channels by direct incorporation in lipid bilayers
The focus of this study was to achieve single channel measurements of CF
expressed ion channels without purification. This was achieved with KcsA, a
pH gated ion channel, and the pore domain of the voltage-gated ion channel
hERG, which were both found to spontaneously self-insert (section 2.3.2) into
interdroplet bilayers directly from the CF mixture for electrophysiological
measurements. It would therefore be useful to determine whether this
phenomenon can also be observed with different ion channels, particularly
voltage-gated channels that are relevant to medical research.

168 Chapter 7 Conclusion
• Investigation of conditions for bilayer incorporation of ion channels
from CF mixtures
While this study highlighted the spontaneous insertion of ion channels
into interdroplet bilayers, the mechanism for bilayer incorporation remains
unclear; perhaps ion channels can incorporate with the membrane because it
is not completely stable or maybe the presence of the CF system influences
the capability of the CF expressed ion channels to self-insert, possibly by
surfactant-like properties that destabilise the membrane. It is also feasible
that the relatively large bilayer area increases the probability of ion channels
randomly fusing with the membrane.
• Parallel measurements of interdroplet bilayers
Recent advances in parallel bilayer platforms, for example Kawano et al.
(2013), allow multiple interdroplet bilayers to be measured simultaneously.
This is advantageous as it would enable the studies proposed in this section
to be investigated more rapidly, while also allowing for more statistically
relevant data sets to be obtained. This could be potentially automated
using more elaborate versions of the electrokinetic devices shown in Chapter
4 which might include a microfluidic droplet generator, more electrode arrays
and integrated Ag/AgCl electrodes for electrophysiological measurements.
7.3 Publications
• Friddin, Mark S., Morgan, Hywel and de Planque, Maurits R.R. (2013) Cell free
protein expression systems in microdroplets: stabilization of interdroplet bilayers.
Biomicrofluidics,7, 014108.
• Friddin, Mark S., Smithers, Natalie P., Beaugrand, Maıwenn, Marcotte, Isabelle,
Williamson, Philip T.F., Morgan, Hywel and de Planque, Maurits R.R. (2013)
Single-channel electrophysiology of cell-free expressed ion channels by direct
incorporation in lipid bilayers. Analyst, 138, (24), 7294-7298.
• Friddin, Mark S., Smithers, Natalie P., Lee, Anthony G., Morgan, Hywel
and de Planque, Maurits R.R.(2013) Electrophysiology of a cell-free expressed
potassium channel in microdroplets without protein purification. At Advances in
Microfluidics and Nanofluidics (AMN2013), Notre Dame, Indiana, US, 24 - 26
May 2013. Selected as oral presentation but conference not attended.

Chapter 7 Conclusion 169
• Friddin, Mark S., Smithers, Natalie P., Lee, Anthony G., Morgan, Hywel and
de Planque, Maurits R.R.(2013) Ion channel characterization with microdroplets
of protein expression mixtures. At 7th IEEE International Conference on
Nano/Molecular Medicine and Engineering (IEEE-NANOMED 2013), Phuket,
TH, 10 - 13 Nov 2013.
• Friddin, Mark S., Smithers, Natalie P., Lee, Anthony G., Morgan, Hywel and
de Planque, Maurits R.R. (2012) Cell-free expression and electrophysiological
measurements of the KcsA channel with interdroplet bilayers. At NanoBioTech
2012, Montreux, CH, 12 - 14 Nov 2012
References
Abraham, M. R., Jahangir, A., Alekseev, A. E., Terzic, A., 1999. Channelopathies
of inwardly rectifying potassium channels. FASEB J 13 (14), 1901–10.
Aghdaei, S., 2011. Electrodynamic droplet actuation for lab on a chip system.
Ph.D. thesis, University of Southampton, Electronics and Computer Science.
Aghdaei, S., Sandison, M. E., Zagnoni, M., Green, N. G., Morgan, H., 2008.
Formation of artificial lipid bilayers using droplet dielectrophoresis. Lab Chip
8 (10), 1617–20.
Aimon, S., Manzi, J., Schmidt, D., Larrosa, J. A. P., Bassereau, P., Toombes, G.,
2011. Functional reconstitution of a voltage-gated potassium channel in giant
unilamellar vesicles. PLOS ONE 10, 0025529.
Alfaifi, B. Y., 2013. Interdroplet bilayers for ion channel electrophysiology. Master’s
thesis, University of Southampton, Electronics and Computer Science.
Angenendt, P., Nyarsik, L., Szaflarski, W., Glokler, J., Nierhaus, K. H., Lehrach,
H., Cahill, D. J., Lueking, A., 2004. Cell-free protein expression and functional
assay in nanowell chip format. Anal Chem 76 (7), 1844–9.
Asmild, M., Oswald, N., Krzywkowski, K. M., Friis, S., Jacobsen, R. B., Reuter,
D., Taboryski, R., Kutchinsky, J., Vestergaard, R. K., Schrder, R. L., Srensen,
C. B., Bech, M., Korsgaard, M. P. G., Willumsen, N. J., 2003. Upscaling
and automation of electrophysiology: Toward high throughput screening in ion
channel drug discovery. Receptors and Channels 9 (1), 49–58.
Baranov, V. I., Spirin, A. S., 1993. Gene expression in cell-free system on
preparative scale. Methods Enzymol 217, 123–42.
Bayley, H., Cronin, B., Heron, A., Holden, M. A., Hwang, W. L., Syeda, R.,
Thompson, J., Wallace, M., 2008. Droplet interface bilayers. Mol Biosyst 4 (12),
1191–208.
170
REFERENCES 171
Berrier, C., Guilvout, I., Bayan, N., Park, K. H., Mesneau, A., Chami, M., Pugsley,
A. P., Ghazi, A., 2011. Coupled cell-free synthesis and lipid vesicle insertion of
a functional oligomeric channel mscl mscl does not need the insertase yidc for
insertion in vitro. Biochim Biophys Acta 1808 (1), 41–6.
Berrier, C., Park, K. H., Abes, S., Bibonne, A., Betton, J. M., Ghazi, A., 2004.
Cell-free synthesis of a functional ion channel in the absence of a membrane and
in the presence of detergent. Biochemistry 43 (39), 12585–91.
Bezanilla, F., 2005. Voltage-gated ion channels. IEEE Trans Nanobioscience 4 (1),
34–48.
Blicher, A., Wodzinska, K., Fidorra, M., Winterhalter, M., Heimburg, T., 06 2009.
The temperature dependence of lipid membrane permeability, its quantized
nature, and the influence of anesthetics. Biophysical journal 96 (11), 4581–4591.
Byrne, R., Levin, J., Bladen, H., Nirenberg, M., 1964. The in vitro formation of a
dna-ribosome complex. Proceedings of the National Academy of Sciences of the
United States of America 52 (1), 140.
Celesia, G. G., 2001. Disorders of membrane channels or channelopathies. Clinical
Neurophysiology 112 (1), 2 – 18.
Cens, T., Charnet, P., 2007. Use of xenopus oocytes to measure ionic selectivity
of pore-forming peptides and ion channels. In: Molnar, P., Hickman, J. (Eds.),
Patch-Clamp Methods and Protocols. Vol. 403 of Methods in Molecular Biology.
Humana Press, pp. 287–302.
Chakrapani, S., Cordero-Morales, J. F., Perozo, E., 2007. A quantitative
description of kcsa gating ii: single-channel currents. J Gen Physiol 130 (5),
479–96.
Chekulayeva, M. N., Kurnasov, O. V., Shirokov, V. A., Spirin, A. S., 2001.
Continuous-exchange cell-free protein-synthesizing system: synthesis of hiv-1
antigen nef. Biochem Biophys Res Commun 280 (3), 914–7.
Cortes, D. M., Cuello, L. G., Perozo, E., 2001. Molecular architecture of full-length
kcsa: Role of cytoplasmic domains in ion permeation and activation gating. The
Journal of General Physiology 117 (2), 165–180.
Craig, D., Howell, M. T., Gibbs, C. L., Hunt, T., Jackson, R. J., 1992. Plasmid
cdna-directed protein synthesis in a coupled eukaryotic in vitro transcription-
translation system. Nucleic Acids Res 20 (19), 4987–95.

172 REFERENCES
Creasy, M. A., Leo, D. J., 2010. Non-invasive measurement techniques for
measuring properties of droplet interface bilayers. Smart Materials and
Structures 19 (9), 094016 (7 pp.)–094016 (7 pp.).
Cuello, L. G., Jogini, V., Cortes, D. M., Perozo, E., 2010. Structural mechanism
of c-type inactivation in k+ channels. Nature 466 (7303), 203–208.
Cuello, L. G., Romero, J. G., Cortes, D. M., Perozo, E., 1998. ph-dependent gating
in the streptomyces lividans k+ channel. Biochemistry 37 (10), 3229–3236.
Curran, M. E., Splawski, I., Timothy, K. W., Vincen, G., Green, E. D., Keating,
M. T., 1995. A molecular basis for cardiac arrhythmia: {HERG} mutations
cause long {QT} syndrome. Cell 80 (5), 795 – 803.
Curtis, H., Cole, K., 1940. Membrane action potentials from the squid giant axon.
Journal of Cellular and Comparative Physiology 15, 147–157.
Curtis, H., Cole, K., 1942. Membrane resting and action potentials from the squid
giant axon. Journal of Cellular and Comparative Physiology 19, 135–144.
de Planque, M. R., Aghdaei, S., Roose, T., Morgan, H., 2011. Electrophysiological
characterization of membrane disruption by nanoparticles. ACS nano 5 (5),
3599–3606.
de Planque, M. R. R., Mendes, G. P., Zagnoni, M., Sandison, M. E., Fisher,
K. H., Berry, R., Watts, A., Morgan, H., 2006. Controlled delivery of membrane
proteins to artificial lipid bilayers by nystatin-ergosterol modulated vesicle
fusion. Nanobiotechnology, IEE Proceedings - 153 (2), 21–30.
Demarche, S., Sugihara, K., Zambelli, T., Tiefenauer, L., Voros, J., 2011.
Techniques for recording reconstituted ion channels. Analyst 136, 1077–1089.
DeVries, J. K., Zubay, G., 1967. Dna-directed peptide synthesis. ii. the synthesis
of the alpha-fragment of the enzyme beta-galactosidase. Proceedings of the
National Academy of Sciences of the United States of America 57 (4), 1010.
Doyle, D. A., Cabral, J. M., Pfuetzner, R. A., Kuo, A., Gulbis, J. M., Cohen, S. L.,
Chait, B. T., MacKinnon, R., 1998. The structure of the potassium channel:
Molecular basis of k+ conduction and selectivity. Science 280 (5360), 69–77.
Dunlop, J., Bowlby, M., Peri, R., Vasilyev, D., Arias, R., 2008. High-
throughput electrophysiology: an emerging paradigm for ion-channel screening
and physiology. Nat Rev Drug Discov 7 (4), 358–68.
REFERENCES 173
Farre, C., Stoelzle, S., Haarmann, C., George, M., Brggemann, A., Fertig, N., 2007.
Automated ion channel screening: patch clamping made easy. Expert Opinion
on Therapeutic Targets 11 (4), 557–565.
Fertig, N., Meyer, C., Blick, R. H., Trautmann, C., Behrends, J. C., 2001.
Microstructured glass chip for ion-channel electrophysiology. Phys Rev E Stat
Nonlin Soft Matter Phys 64 (4 Pt 1), 040901.
Finkel, A., Wittel, A., Yang, N., Handran, S., Hughes, J., Costantin, J., 2006.
Population patch clamp improves data consistency and success rates in the
measurement of ionic currents. Journal of Biomolecular Screening 11 (5), 488–
496.
Freischmidt, A., Meysing, M., Liss, M., Wagner, R., Kalbitzer, H. R., Horn, G.,
2010. Limiting factors of the translation machinery. Journal of Biotechnology
150 (1), 44 – 50.
Friddin, M. S., Morgan, H., de Planque, M. R. R., 2013a. Cell-free protein
expression systems in microdroplets: Stabilization of interdroplet bilayers.
Biomicrofluidics 7 (1), 014108.
Friddin, M. S., Smithers, N. P., Beaugrand, M., Marcotte, I., Williamson, P. T. F.,
Morgan, H., de Planque, M. R. R., 2013b. Single-channel electrophysiology of
cell-free expressed ion channels by direct incorporation in lipid bilayers. Analyst
138, 7294–7298.
Friddin, M. S., Smithers, N. P., Lee, A. G., Morgan, H., de Planque, M. R., 2013c.
Electrophysiology of a cell-free expressed potassium channel in microdroplets
without purification. At advances in Microfluidics and Nanofluidics, Notre
Dame, Indiana, USA.(Selected for oral presentation but not attended).
Friddin, M. S., Smithers, N. P., Lee, A. G., Morgan, H., de Planque, M. R. R.,
2012. Cell-free expression and electrophysiological measurements of the kcsa
channel with interdroplet bilayers. At NanoBioTech 2012, Montreux, CH, 12-14
Nov.
Friddin, M. S., Smithers, N. P., Lee, A. G., Morgan, H., de Planque, M. R. R.,
2013d. Ion channel characterization with microdroplets of cell-free expression
mixtures. At 7th IEEE International Conference on Nano/Molecular Medicine
and Engineering, Phuket, Thailand, 10-13 November 2013.
George, A. L., 8 2005. Inherited disorders of voltage-gated sodium channels. The
Journal of Clinical Investigation 115 (8), 1990–1999.
174 REFERENCES
Goren, M. A., Nozawa, A., Makino, S., Wrobel, R. L., Fox, B. G., 2009. Cell-free
translation of integral membrane proteins into unilamelar liposomes. Methods
Enzymol 463, 647–73.
Hahn, G. H., Asthana, A., Kim, D. M., Kim, D. P., 2007. A continuous-exchange
cell-free protein synthesis system fabricated on a chip. Anal Biochem 365 (2),
280–2.
Hardin, J., Bertoni, G. P., Kleinsmith, L. J., 2011. Becker’s World of the Cell.
Pearson; 8 edition.
He, M., Taussig, M. J., 2001. Single step generation of protein arrays from dna by
cell-free expression and in situ immobilisation (pisa method). Nucleic Acids Res
29 (15), E73–3.
He, M., Wang, M. W., 2007. Arraying proteins by cell-free synthesis. Biomol Eng
24 (4), 375–80.
Heginbotham, L., LeMasurier, M., Kolmakova-Partensky, L., Miller, C., 1999.
Single streptomyces lividans k+ channels: Functional asymmetries and
sidedness of proton activation. The Journal of General Physiology 114 (4), 551–
560.
Heron, A. J., Thompson, J. R., Mason, A. E., Wallace, M. I., 2007. Direct detection
of membrane channels from gels using water-in-oil droplet bilayers. J Am Chem
Soc 129 (51), 16042–7.
Hille, B., 2001. Ion Channels of Excitable Membranes. Sinauer Associates, Inc.;
3rd Edition edition.
Hirano, M., Onishi, Y., Yanagida, T., Ide, T., 2011. Role of the kcsa channel
cytoplasmic domain in ph-dependent gating. Biophysical Journal 101 (9), 2157
– 2162.
Hodgkin, A., A.F, H., 1945. Resting and action potentials in single nerve fibres.
Journal of Physiology 2, 176–195.
Hodgkin, A., A.F, H., Katz, B., 1952. Measurement of current-voltage relations
in the membrane of the giant squid axon of loligo. Journal of Physiology 116,
424–428.
Holden, M. A., Needham, D., Bayley, H., 2007. Functional bionetworks from
nanoliter water droplets. Journal of the American Chemical Society 129 (27),
8650–8655.

REFERENCES 175
Hovijitra, N. T., Wuu, J. J., Peaker, B., Swartz, J. R., 2009. Cell-free synthesis of
functional aquaporin z in synthetic liposomes. Biotechnol Bioeng 104 (1), 40–9.
Hughes, M. P., 2000. Ac electrokinetics: applications for nanotechnology.
Nanotechnology 11 (2), 124.
Hwang, W. L., Chen, M., Cronin, B., Holden, M. A., Bayley, H., 2008. Asymmetric
droplet interface bilayers. J Am Chem Soc 130 (18), 5878–9.
Ide, T., Ichikawa, T., 2005. A novel method for artificial lipid-bilayer formation.
Biosens Bioelectron 21 (4), 672–7, ide, Toru Ichikawa, Takehiko Evaluation
Studies England Biosensors & bioelectronics Biosens Bioelectron. 2005 Oct
15;21(4):672-7. Epub 2005 Jan 26.
Jacobson, K., Sheets, E. D., Simson, R., 1995. Revisiting the fluid mosaic model
of membranes. Science 268 (5216), 1441–1442.
Jiang, Y., Lee, A., Chen, J., Ruta, V., Cadene, M., Chait, Brian, T., Mackinnon,
R., 2003. X-ray structure of a voltage-dependent k+ channel. Nature 423, 33–41.
John, V. H., Dale, T. J., Hollands, E. C., Chen, M. X., Partington, L., Downie,
D. L., Meadows, H. J., Trezise, D. J., 2007. Novel 384-well population patch
clamp electrophysiology assays for ca2+-activated k+ channels. Journal of
Biomolecular Screening 12 (1), 50–60.
Junge, F., Haberstock, S., Roos, C., Stefer, S., Proverbio, D., Dotsch, V.,
Bernhard, F., 2011. Advances in cell-free protein synthesis for the functional
and structural analysis of membrane proteins. N Biotechnol 28 (3), 262–71.
Junge, F., Schneider, B., Reckel, S., Schwarz, D., Dotsch, V., Bernhard, F.,
2008. Large-scale production of functional membrane proteins. Cell Mol Life
Sci 65 (11), 1729–55.
Kalmbach, R., Chizhov, I., Schumacher, M. C., Friedrich, T., Bamberg, E.,
Engelhard, M., 2007. Functional cell-free synthesis of a seven helix membrane
protein: in situ insertion of bacteriorhodopsin into liposomes. J Mol Biol 371 (3),
639–48.
Katzen, F., 2008. Cell-free protein expression of membrane proteins using
nanolipoprotein particles. Biotechniques 45 (2), 190.
Katzen, F., Chang, G., Kudlicki, W., 2005. The past, present and future of cell-free
protein synthesis. Trends Biotechnol 23 (3), 150–6.
176 REFERENCES
Katzen, F., Peterson, T. C., Kudlicki, W., 2009. Membrane protein expression: no
cells required. Trends Biotechnol 27 (8), 455–60.
Kawano, R., Tsuji, Y., Sato, K., Osaki, T., Kamiya, K., Hirano, M., Ide, T., Miki,
N., Takeuchi, S., 2013. Automated parallel recordings of topologically identified
single ion channels. Scientific Reports 3.
Khnouf, R., Beebe, D. J., Fan, Z. H., 2009. Cell-free protein expression in a
microchannel array with passive pumping. Lab Chip 9 (1), 56–61.
Khnouf, R., Olivero, D., Jin, S., Coleman, M. A., Fan, Z. H., 2010. Cell-
free expression of soluble and membrane proteins in an array device for drug
screening. Anal Chem 82 (16), 7021–6.
Kiehn, J., Lacerda, A. E., Wible, B., Brown, A. M., 1996. Molecular physiology
and pharmacology of herg: Single-channel currents and block by dofetilide.
Circulation 94 (10), 2572–2579.
Kigawa, T., Yabuki, T., Matsuda, N., Matsuda, T., Nakajima, R., Tanaka,
A., Yokoyama, S., 2004. Preparation of escherichia coli cell extract for highly
productive cell-free protein expression. J Struct Funct Genomics 5 (1-2), 63–8.
Kim, H.-C., Kim, D.-M., 2009. Methods for energizing cell-free protein synthesis.
Journal of Bioscience and Bioengineering 108 (1), 1 – 4.
Kinpara, T., Mizuno, R., Murakami, Y., Kobayashi, M., Yamaura, S., Hasan, Q.,
Morita, Y., Nakano, H., Yamane, T., Tamiya, E., 2004. A picoliter chamber
array for cell-free protein synthesis. J Biochem 136 (2), 149–54.
Kistler, J., Stroud, R., 1981. Crystalline arrays of membrane-bound acetylcholine
receptor. Proceedings of the National Academy of Sciences 6, 3678–3682.
Kitta, M., Tanaka, H., Kawai, T., 2009. Rapid fabrication of teflon micropores for
artificial lipid bilayer formation. Biosens Bioelectron 25 (4), 931–4.
Klammt, C., Schwarz, D., Fendler, K., Haase, W., Dotsch, V., Bernhard, F.,
2005. Evaluation of detergents for the soluble expression of alpha-helical and
beta-barrel-type integral membrane proteins by a preparative scale individual
cell-free expression system. FEBS J 272 (23), 6024–38.
Klein, S. A., Wilk, S. J., Thornton, T. J., Posner, J. D., 2008. Formation of
nanopores in suspended lipid bilayers using quantum dots. Journal of Physics:
Conference Series 109 (1), 012022.
REFERENCES 177
Kuschel, M., 2000. Protein sizing and analysis using the agilent 2100 bioanalyzer
and protein 200 labchip R© kit. Agilent Technologies, 1–8.
Kutluay, E., Roux, B., Heginbotham, L., 2005. Rapid intracellular {TEA} block
of the kcsa potassium channel. Biophysical Journal 88 (2), 1018 – 1029.
Laemmli, U., 1970. Cleavage of structural proteins during the assembly of the head
of bacteriophage t4. Nature 227, 680–685.
Lamborg, M. R., Zamecnik, P. C., 1960. Amino acid incorporation into protein by
extracts of E. coli. Biochimica et biophysica acta 42, 206–211.
Laszlo, K., Bennett, P. B., Uebele, V. N., Koblan, K. S., Kane, S. A., Neagle, B.,
Schroeder, K., 2003. High throughput ion-channel pharmacology: Planar-array-
based voltage clamp. ASSAY and Drug Development Technologies 1, 127–135.
Laub, K. R., Witschas, K., Blicher, A., Madsen, S. B., Lckhoff, A., Heimburg, T.,
2012. Comparing ion conductance recordings of synthetic lipid bilayers with cell
membranes containing {TRP} channels. Biochimica et Biophysica Acta (BBA)
- Biomembranes 1818 (5), 1123 – 1134.
Le Pioufle, B., Suzuki, H., Tabata, K. V., Noji, H., Takeuchi, S., 2008. Lipid
bilayer microarray for parallel recording of transmembrane ion currents. Anal
Chem 80 (1), 328–32.
Lederman, M., Zubay, G., 1967. Dna-directed peptide synthesis i. a comparison of
t2 and Escherichia coli dna-directed peptide synthesis in two cell-free systems.
Biochimica et Biophysica Acta (BBA)-Nucleic Acids and Protein Synthesis
149 (1), 253–258.
LeMasurier, M., Heginbotham, L., Miller, C., 2001. Kcsa: It’s a potassium channel.
The Journal of General Physiology 118 (3), 303–314.
Long, S., Tao, Xiao, C. B. E., Mackinnon, R., 2007. Atomic structure of a voltage-
dependent k+ channel in a lipid membrane-like environment. Nature 450, 376–
382.
Long, S. B., Campbell, E. B., MacKinnon, R., 2005. Crystal structure of a
mammalian voltage-dependent shaker family k+ channel. Science 309 (5736),
897–903.
Maramont, G., 1949. Studies on the axon membrane; a new method. Journal of
Physiology 34, 351–382.

178 REFERENCES
Marius, P., de Planque, M. R., Williamson, P. T., 2012. Probing the interaction of
lipids with the non-annular binding sites of the potassium channel kcsa by magic-
angle spinning nmr. Biochimica et Biophysica Acta (BBA)-Biomembranes
1818 (1), 90–96.
Marius, P., Zagnoni, M., Sandison, M. E., East, J. M., Morgan, H., Lee,
A. G., 2008. Binding of anionic lipids to at least three nonannular sites on
the potassium channel kcsa is required for channel opening. Biophysical journal
94 (5), 1689–1698.
Martın, M., Albanesi, D., Alzari, P. M., de Mendoza, D., 2009. Functional¡ i¿
in vitro¡/i¿ assembly of the integral membrane bacterial thermosensor desk.
Protein expression and purification 66 (1), 39–45.
Mathes, C., 2006. Qpatch: the past, present and future of automated patch clamp.
Expert Opinion on Therapeutic Targets 10 (2), 319–327, pMID: 16548779.
Matthaei, H., Nirenberg, M. W., 1961. The dependence of cell-free protein
synthesis in e. coli upon rna prepared from ribosomes. Biochem Biophys Res
Commun 4, 404–8.
Matthies, D., Haberstock, S., Joos, F., Dtsch, V., Vonck, J., Bernhard, F., Meier,
T., 2011. Cell-free expression and assembly of {ATP} synthase. Journal of
Molecular Biology 413 (3), 593 – 603.
McQuillen, K., Roberts, R. B., Britten, R. J., 1959. Synthesis of nascent protein by
ribosomes in escherichia coli. Proceedings of the National Academy of Sciences
of the United States of America 45 (9), 1437.
Mei, Q., Fredrickson, C. K., Jin, S., Fan, Z. H., 2005. Toxin detection by a
miniaturized in vitro protein expression array. Analytical chemistry 77 (17),
5494–5500.
Mei, Q., Khnouf, R., Simon, A., Fan, Z. H., 2010. Protein synthesis in a device with
nanoporous membranes and microchannels. Lab on a Chip 10 (19), 2541–2545.
Montal, M., Mueller, P., 1972. Formation of bimolecular membranes from lipid
monolayers and a study of their electrical properties. Proceedings of the National
Academy of Sciences 69 (12), 3561–3566.
Moritani, Y., Nomura, S.-i. M., Morita, I., Akiyoshi, K., 2010. Direct integration
of cell-free-synthesized connexin-43 into liposomes and hemichannel formation.
FEBS Journal 277 (16), 3343–3352.
REFERENCES 179
Neher, E., Sakmann, B., 1976. Single-channel currents recorded from membrane
of denervated frog muscle fibres. Nature 260 (5554), 799–802.
Noireaux, V., Bar-Ziv, R., Godefroy, J., Salman, H., Libchaber, A., 2005. Toward
an artificial cell based on gene expression in vesicles. Phys Biol 2 (3), P1–8.
Noireaux, V., Libchaber, A., 2004. A vesicle bioreactor as a step toward an artificial
cell assembly. Proc Natl Acad Sci U S A 101 (51), 17669–74.
Noireaux, V., Maeda, Y. T., Libchaber, A., 2011. Development of an artificial cell,
from self-organization to computation and self-reproduction. Proc Natl Acad Sci
U S A 108 (9), 3473–80.
Overington, John, P., Al-Lazikani, B., Hopkins, Andrew, L., 2006. How many drug
targets are there? Nature Reviews Drug Discovery 5, 993–996.
OShaughnessy, T., Hu, J., Kulp, JohnL., I., Daly, S., Ligler, F., 2007. Laser
ablation of micropores for formation of artificial planar lipid bilayers. Biomedical
Microdevices 9 (6), 863–868.
Patnaik, R., Swartz, J., et al., 1998. E. coli-based in vitro transcription/trans-
lation: in vivo-specific synthesis rates and high yields in a batch system.
Biotechniques 24 (5), 862–868.
Periasamy, A., Shadiac, N., Amalraj, A., Garajov, S., Nagarajan, Y., Waters, S.,
Mertens, H. D., Hrmova, M., 2013. Cell-free protein synthesis of membrane
(1,3)-β-d-glucan (curdlan) synthase: Co-translational insertion in liposomes
and reconstitution in nanodiscs. Biochimica et Biophysica Acta (BBA) -
Biomembranes 1828 (2), 743 – 757.
Peterman, M. C., Ziebarth, J. M., Braha, O., Bayley, H., Fishman, H. A., Bloom,
D. M., 2002. Ion channels and lipid bilayer membranes under high potentials
using microfabricated apertures. Biomedical Microdevices 4 (3), 231–236.
Piccolino, M., 1998. Animal electricity and the birth of electrophysiology: the
legacy of luigi galvani. Brain Research Bulletin 46 (5), 381 – 407.
Poulos, J. L., Nelson, W. C., Jeon, T. J., Kim, C. J., Schmidt, J. J., 2009.
Electrowetting on dielectric-based microfluidics for integrated lipid bilayer
formation and measurement. Applied Physics Letters 95 (1).
Poulos, J. L., Portonovo, S. A., Bang, H., Schmidt, J. J., 2010. Automatable lipid
bilayer formation and ion channel measurement using sessile droplets. J Phys
Condens Matter 22 (45), 454105.
180 REFERENCES
Price, C. E., Kocer, A., Kol, S., van der Berg, J. P., Driessen, A. J., 2011. In
vitro synthesis and oligomerization of the mechanosensitive channel of large
conductance, mscl, into a functional ion channel. FEBS letters 585 (1), 249–
254.
Promega, 2009. E.Coli T7 S30 Extract System for Circular DNA. Promega
Corporation, 2800 Woods Hollow Road, Madison, WI 53711-5399. USA.
Proverbio, D., Roos, C., Beyermann, M., Orbn, E., Dtsch, V., Bernhard, F., 2013.
Functional properties of cell-free expressed human endothelin a and endothelin
b receptors in artificial membrane environments. Biochimica et Biophysica Acta
(BBA) - Biomembranes 1828 (9), 2182 – 2192.
Punnamaraju, S., Steckl, A. J., 2011. Voltage control of droplet interface bilayer
lipid membrane dimensions. Langmuir 27 (2), 618–26.
Rigaud, J.-L., Levy, D., Mosser, G., Lambert, O., 1998. Detergent removal by
non-polar polystyrene beads. European Biophysics Journal 27 (4), 305–319.
Robelek, R., Lemker, E. S., Wiltschi, B., Kirste, V., Naumann, R., Oesterhelt, D.,
Sinner, E.-K., 2007. Incorporation of in vitro synthesized gpcr into a tethered
artificial lipid membrane system. Angewandte Chemie International Edition
46 (4), 605–608.
Roberts, R. B., 1958. Microsomal particles and protein synthesis. Pergamon Press.
Rogers, N., 2010. The structure of a voltage gated potassium channel. Ph.D. thesis,
University of Southampton, School of Biological Sciences.
Roos, C., Kai, L., Proverbio, D., Ghoshdastider, U., Filipek, S., Dotsch, V.,
Bernhard, F., 2013. Co-translational association of cell-free expressed membrane
proteins with supplied lipid bilayers. Molecular membrane biology 30 (1), 75–89.
Ruta, V., Jiang, Youxing, Lee, A., Chen, J., Mackinnon, R., 2003. Functional
analysis of an archaebacterial voltage-dependent k+ channel. Nature 422, 180–
185.
Sandison, M. E., Morgan, H., 2005. Rapid fabrication of polymer microfluidic
systems for the production of artificial lipid bilayers. Journal of Micromechanics
and Microengineering 15 (7), S139.
Sanguinetti, M. C., Tristani-Firouzi, M., 2006. herg potassium channels and
cardiac arrhythmia. Nature 440, 463–469.

REFERENCES 181
Sarles, S. A., Leo, D. J., 2010a. Physical encapsulation of droplet interface bilayers
for durable, portable biomolecular networks. Lab Chip 10, 710–717.
Sarles, S. A., Leo, D. J., 2010b. Regulated attachment method for reconstituting
lipid bilayers of prescribed size within flexible substrates. Analytical Chemistry
82 (3), 959–966.
Schindler, H., 1980. Formation of planar bilayers from artificial or native membrane
vesicles. FEBS Letters 122 (1), 77–79.
Schmidt, D., Cross, S. R., MacKinnon, R., 2009. A gating model for the archeal
voltage-dependent k+ channel kvap in {DPhPC} and pope:popg decane lipid
bilayers. Journal of Molecular Biology 390 (5), 902 – 912.
Schmidt, D., Jiang, Q.-X., Mackinnon, R., 2006. Phospholipids and the origin of
cationic gating charges in voltage sensors. Nature 444, 775–779.
Schmidt, D., MacKinnon, R., 2008. Voltage-dependent k+ channel gating and
voltage sensor toxin sensitivity depend on the mechanical state of the lipid
membrane. Proceedings of the National Academy of Sciences 105 (49), 19276–
19281.
Schow, E. V., Freites, J. A., Nizkorodov, A., White, S. H., Tobias, D. J., 2012.
Coupling between the voltage-sensing and pore domains in a voltage-gated
potassium channel. Biochimica et Biophysica Acta (BBA) - Biomembranes
1818 (7), 1726 – 1736.
Schrempf, H., Schmidt, O., Kummerlen, R., Hinnah, S., Muller, D., Betzler, M.,
Steinkamp, T., Wagner, R., 1995. A prokaryotic potassium ion channel with
two predicted transmembrane segments from streptomyces lividans. The EMBO
Journal 21, 5170–5178.
Schroeder, K., Neagle, B., Trezise, D. J., Worley, J., 2003. Ionworks ht:
A new high-throughput electrophysiology measurement platform. Journal of
Biomolecular Screening 8 (1), 50–64.
Schwarz, D., Dotsch, V., Bernhard, F., 2008. Production of membrane proteins
using cell-free expression systems. Proteomics 8 (19), 3933–46.
Schweet, R., Lamfrom, H., Allen, E., 1958. The synthesis of hemoglobin in a cell-
free system. Proceedings of the National Academy of Sciences of the United
States of America 44 (10), 1029.

182 REFERENCES
Seddon, A. M., Curnow, P., Booth, P. J., 2004. Membrane proteins, lipids and
detergents: not just a soap opera. Biochimica et Biophysica Acta (BBA) -
Biomembranes 1666 (12), 105 – 117.
Sigworth, F. J., 2 1994. Voltage gating of ion channels. Quarterly Reviews of
Biophysics 27, 1–40.
Sobhanifar, S., Reckel, S., Junge, F., Schwarz, D., Kai, L., Karbyshev, M., Lohr,
F., Bernhard, F., Dotsch, V., 2010. Cell-free expression and stable isotope
labelling strategies for membrane proteins. J Biomol NMR 46 (1), 33–43.
Spirin, A. S., 2004. High-throughput cell-free systems for synthesis of functionally
active proteins. Trends Biotechnol 22 (10), 538–45.
Spirin, A. S., Swartz, J. R., 2008. Cell-free protein synthesis : methods and
protocols. Wiley-VCH, Weinheim.
Studer, A., Demarche, S., Langenegger, D., Tiefenauer, L., 2011. Integration
and recording of a reconstituted voltage-gated sodium channel in planar lipid
bilayers. Biosensors and Bioelectronics 26 (5), 1924 – 1928.
Suzuki, H., Tabata, K., Kato-Yamada, Y., Noji, H., Takeuchi, S., 2004. Planar
lipid bilayer reconstitution with a micro-fluidic system. Lab Chip 4 (5), 502–5.
Syeda, R., Holden, M. A., Hwang, W. L., Bayley, H., 2008. Screening blockers
against a potassium channel with a droplet interface bilayer array. J Am Chem
Soc 130 (46), 15543–8.
Tao, H., Santa Ana, D., Guia, A., Huang, M., Ligutti, J., Walker, G., Sithiphong,
K., Chan, F., Guoliang, T., Zozulya, Z., et al., 2004. Automated tight seal
electrophysiology for assessing the potential herg liability of pharmaceutical
compounds. Assay and drug development technologies 2 (5), 497–506.
Thompson, J. R., Heron, A. J., Santoso, Y., Wallace, M. I., 2007. Enhanced
stability and fluidity in droplet on hydrogel bilayers for measuring membrane
protein diffusion. Nano Lett 7 (12), 3875–8.
Tissieres, A., Schlessinger, D., Gros, F., 1960. Amino acid incorporation into
proteins by escherichia coli ribosomes. Proceedings of the National Academy
of Sciences of the United States of America 46 (11), 1450.
van Dalen, A., van der Laan, M., Driessen, A. J., Killian, J., de Kruijff, B., 2002.
Components required for membrane assembly of newly synthesized k+ channel
kcsa. {FEBS} Letters 511 (13), 51 – 58.
REFERENCES 183
Vandenberg, J. I., Perry, M. D., Perrin, M. J., Mann, S. A., Ke, Y., Hill,
A. P., 2012. herg k+ channels: Structure, function, and clinical significance.
Physiological Reviews 92 (3), 1393–1478.
Varnier, A., Kermarrec, F., Blesneac, I., Moreau, C., Liguori, L., Lenormand, J. L.,
Picollet-Dhahan, N., 2010. A simple method for the reconstitution of membrane
proteins into giant unilamellar vesicles. Journal of Membrane Biology 233 (1-3),
85–92.
Warmke, J. W., Ganetzky, B., 1994. A family of potassium channel genes related
to eag in drosophila and mammals. Proceedings of the National Academy of
Sciences 91 (8), 3438–3442.
Whittaker, J., 2013. Cell-free protein synthesis: the state of the art. Biotechnology
Letters 35 (2), 143–152.
Woodbury, D. J., 1999. Nystatin/ergosterol method for reconstituting ion channels
into planar lipid bilayers. Methods Enzymol 294, 319–39.
Woodbury, D. J., Miller, C., 1990. Nystatin-induced liposome fusion. a versatile
approach to ion channel reconstitution into planar bilayers. Biophys J 58 (4),
833–9.
Xu, J., Guia, A., Rothwarf, D., Huang, M., Sithiphong, K., Ouang, J., Tao, G.,
Wang, X., Wu, L., 2003. A benchmark study with seal chip planar patch-clamp
technology. Assay and drug development technologies 1 (5), 675–684.
Yamamoto, T., Fujii, T., Nojima, T., 2002. Pdms-glass hybrid microreactor
array with embedded temperature control device. application to cell-free protein
synthesis. Lab Chip 2 (4), 197–202.
Yildiz, A. A., Kang, C., Sinner, E.-K., 2013. Biomimetic membrane platform
containing herg potassium channel and its application to drug screening.
Analyst.
Zagnoni, M., Sandison, M. E., Marius, P., Morgan, H., 2009. Bilayer lipid
membranes from falling droplets. Anal Bioanal Chem 393 (6-7), 1601–5.
Zawada, J., 2012. Preparation and testing of e. coli s30 in vitro transcription
translation extracts. In: Douthwaite, J. A., Jackson, R. H. (Eds.), Ribosome
Display and Related Technologies. Vol. 805 of Methods in Molecular Biology.
Springer New York, pp. 31–41.

184 REFERENCES
Zou, A., Curran, M. E., Keating, M. T., Sanguinetti, M. C., 1997. Single herg
delayed rectifier k+ channels expressed in xenopus oocytes. American Journal
of Physiology - Heart and Circulatory Physiology 272 (3), H1309–H1314.
Zubay, G., 1973. In vitro synthesis of protein in microbial systems. Annual review
of genetics 7 (1), 267–287.