Embed Size (px)
Citation preview

The Career Trajectories of Urban Law GraduatesThe Career Trajectories of Urban Law Graduates
Ronit DinovitzerDepartment of Sociology
University of [email protected]

After the JD StudyAfter the JD Study
Nationally representative sample of lawyers in the US who began practice in the year 2000
Longitudinal design (contacts in 2002, 2007, 2010) Mail Questionnaires and telephone interviews with
nonrespondents (fielded in May 2002) 71% response rate of those who were located (n=4500) In depth, face to face interviews with a subsample of
respondents Comparison to lawyers in the general population:
Racial composition of young lawyers in the 2000 Census (AJD 5.6% Black vs. 6.1% in Census data)
Distribution of lawyers across firms, government, and business employers (AJD 70% in private firms vs. 68% Census data)
Gender composition (AJD 46.2% female vs. 46.0% ABA)

Table 1. Key Statistics for Measures of the Lawyer Sorting Process
Top 10Top 11-20
Top 21-40
Top 41-100 Tier 3 Tier 4
Father Occupational Prestige (mean) (range 16-90) 65.8 63.7 63.3 60.3 58.5 57.2
Father with at least some graduate education 68% 54% 54% 42% 33% 34%
Percent living in Major Metro area after graduation
77% 59% 48% 32% 35% 19%
More likely (p<.05) than other groups to report having considered a career in …
Invest. banking
community organizing
-- -- -- starting a business
Rating of why chose sector (mean scale 1-7)
Work/Life Balance 4.6 4.9 5.2 5.6 5.5 5.6

Table 1. Key Statistics for Measures of the Lawyer Sorting Process
Top 10Top 11-20
Top 21-40
Top 41-100 Tier 3 Tier 4
Received two or more offers in private sector 76% 62% 54% 45% 44% 40%
Received no offers in private sector 6% 10% 13% 19% 19% 17%
Percent working in Solo or Small firms (2-20 lawyers) 3% 15% 21% 31% 40% 47%
Percent working in firms of 100+ lawyers 66% 51% 39% 21% 13% 7%

Table 1. Key Statistics for Measures of the Lawyer Sorting Process
Top 10Top 11-20
Top 21-40
Top 41-100 Tier 3 Tier 4
Salary (mean) $122,000 $104,000 $91,000 $77,000 $67,000 $69,000
Income of the 25th percentile $93,000 $65,000 $55,000 $49,000 $47,000 $45,000
Debt Load (of those reporting any debt) 85k 73k 67k 66k 74k 75k
Hours worked per week (mean) 51 49 49 48 48 49
Total n of tier 332 430 539 1176 619 536

Rearranging the hierarchy
The “urban” law schools Definition: urban settings, ranked 32-178 Socio-historical role
YMCA, night law schools, Catholic law schools
Access mission: Alfred Reed (1931) “the mission of an evening or part-time law school is
to enable young men and women, who cannot afford to attend a better school, to prepare themselves for legal practice.”
Immigrants, working-class Placements

Urban law schools
Changes over time Current patterns by race and immigrant
status Almost 25% of top ten graduates report both parents
born outside of US vs. 11% at urban law schools
Top ten schools also have the highest percentage of African American students (8%) vs. 5% at urban law schools
Tuition: Capital law school 27k, Golden Gate Law School 29k, Northeastern 35k
1) Growth in the profession 2) Growth of large law firms:
[L]aw firms in the Am Law 200 … now require about 10,000 new associates each year out of about 40,000 graduates coming from all of the nation’s approximately 200 law schools combined.
Ward Bower, Consultant at Altman Weill
Where do urban law graduates work? Focus on the large law firm
The intersection of two trends…

Table 1. Demographic characteristics by law school type
Urban Law School with PT program
Urban Law School with FT
program
Catholic Law
School (excluding
non urban)
Independent Law School (excluding non urban)
Elite top 10
Elite top 31
Black 5% 6% 4% 4% 8% 6%
Hispanic 5% 4% 5% 4% 3% 3%
Asian 7% 3% 6% 6% 12% 9%
White 79% 82% 83% 83% 74% 78%
Other 4% 4% 2% 3% 2% 3%

Gender, Age, and Family
Elite top 31
Elite top 10
Independent Law
School (excluding non urban)
Catholic Law
School (excluding non urban)
Urban Law
School with FT progra
m
Urban Law
School with PT program
Table 1 (cont’d). Demographic characteristics by type of law school
26%13%37%25%34%32% Have Kids
53%43%56%56%60%59% Married
11%8%36%24%17%29% Over 36 years old
44%45%50%51%45%48% Female

Where do Urban Graduates work?
Focus on all urban law school graduates compared to elite law school graduates
Focus on large law firms (defined as >100 lawyers in the entire firm)

Practice Settings:
Urban Law School Elite - Top 1- 31
% of Grads % of Grads
Solo 5.9% 1.8%
Private firm - 2-20 31.5% 11.2%
Private firm - 21-100 12.4% 10.8%
Private firm - 101-250 5.5% 11.7%
Private firm - 251-499 5.8% 11.4%
Private firm - 500+ 6.0% 28.6%
Federal Government 4.0% 5.7%
State Government 13.5% 5.0%
Legal services or PD 2.6% 2.8%
Public Int, Non Profit or Education 2.6% 5.0%
Professional Service/Fortune 1000 5.5% 3.1%
Other Business 4.7% 2.9%
17.3% 51.7%

Chart 1. Distribution of large firm respondents by size of firm
25.93
20.82
33.55
22.28
40.51
56.91
0.00 10.00 20.00 30.00 40.00 50.00 60.00
Urban Law School
Elite - Top 1- 31
Private firm - firm 101-250 Private firm - firm 251-499 Private firm - firm 500+

Which Urban Graduates go to Large Firms?
Focus on comparing urban graduates in large law firms with those working in other settings
Compare urban graduates in large law firms with elite law school graduates in large law firms

A. Credentials
Urban Graduates
Works in a Large Firm Not in a Large Firm
*Was on the General Law Review
45.5% 16.1%
*Law school GPA 3.491 3.166
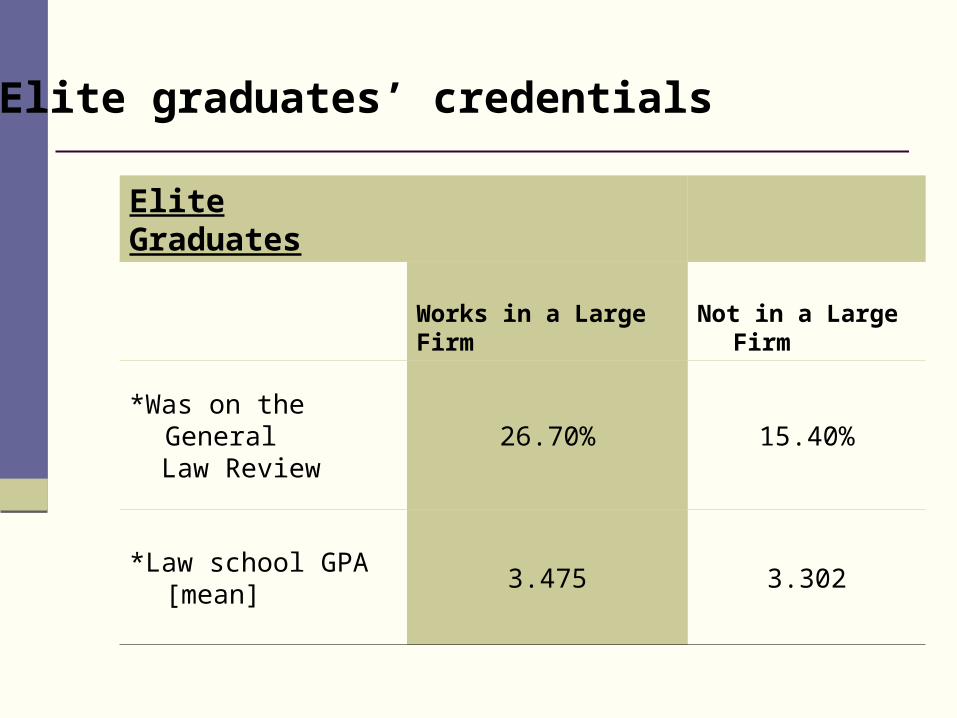
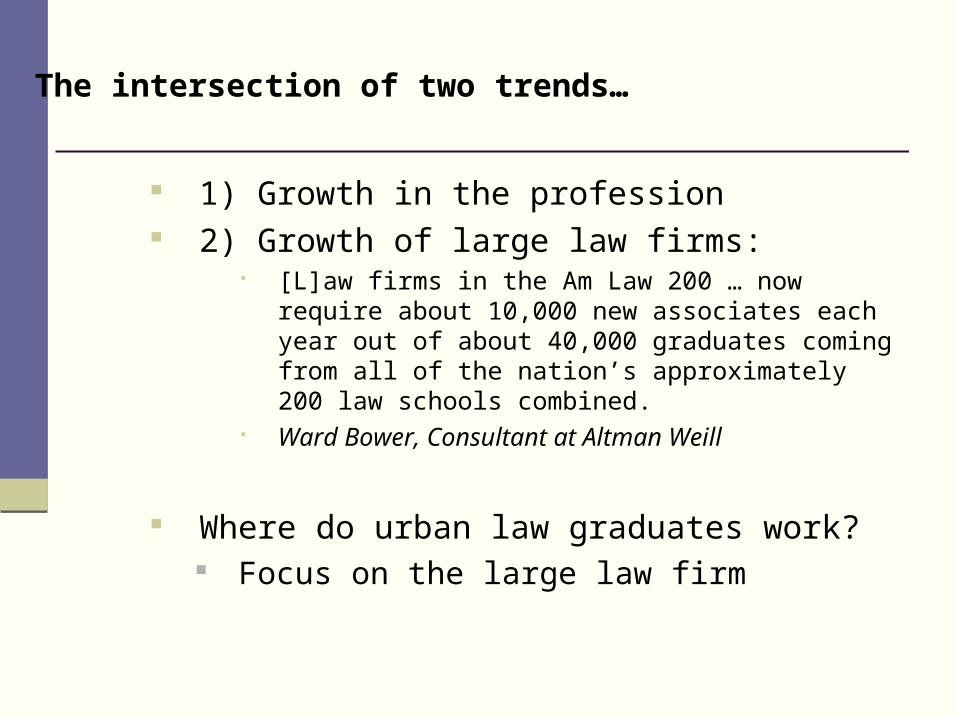
Elite Graduates
Works in a Large Firm Not in a Large Firm
*Was on the General Law Review
26.70% 15.40%
*Law school GPA [mean]
3.475 3.302
Elite graduates’ credentials

C. Other “Credentials”
Urban Graduates
Works in a Large Firm Not in a large firm
% of Grads % of Grads
*Married (at time of survey) 64.1% 56.9%
*Age at graduation (mean) 29.36 30.69
*Undergraduate Science Training 17.1% 9.6%
*Intended to Practice Law 85.7% 81.9%
Undergraduate GPA (mean) 3.37 3.37

Logistic Regression predicting the likelihood of working in a large firm by Law School Type (unweighted)
Model 2 Exp(B)
Law School Type (excluded category is Urban Ranked Tier 4)
Urban Ranked 32-65 4.04 ***
Urban Ranked 66-100 3.36 ***
Urban Ranked Tier 3 1.97 *
Elite Top 31 6.78 ***
Elite Top Ten 17.14 ***
Non Urban Law School 2.48 **
Controlling For …. (see next slide)

Logistic Regression predicting the likelihood of working in a large firm (unweighted)(Continued from previous slide)
Model 2 Exp(B)
Male 1.08
Age > 36 0.72
White 1.12
Has Children 0.70 *
Is Married 1.32 *
Father's Occupation 1.00
Lawyers in Family 0.92
Large Metro Area 2.35 ***
Small Metro Area 2.28 ***
Science Undergraduate 1.62 **
Intended to Practice Law 1.31
Served on Law Review 1.97 ***
Law School GPA 11.27 ***
Nagelkerke R Square 0.372

Do the same factors that matter for Urban graduates matter for Elite graduates?Subsamples: Regression of Factors For Large Firm Jobs
Urban Exp (B)
Elite Exp (B)
Z Tests (for diff in coeff)
Male 1.07 1.11 -0.15
Age > 36 0.64 * 0.6 0.149
White 0.94 1.44 -1.24
Has Children 0.76 0.79 -0.12
Is Married 1.33 1.18 0.405
Fathers Occupation 1.01 1 0.256
Lawyers in Family 1.04 0.77 1.082
Large Metro Area 2.12 *** 3.94 *** -1.87
Smaller Metro Area 1.74 * 2.35 ** -0.79
Science Undergraduate 2.19 *** 0.94 2.229
Intended to Practice Law 1.38 1.68 + -0.55
Law Review 1.96 *** 1.33 1.247
Law School GPA 17.84 *** 6.75 *** 1.991
Nagelkerke R Square 0.28 0.24

Working in the large law firm
Compare the experience of urban law graduates with elite law graduates working in large law firms

Chart 2. Reported levels of satisfaction among large law firm respondents, by law school type
35.9%
44.5%
6.7%
11.7%
1.2%
25.6%
48.8%
9.9%
13.5%
2.1%
0.0% 10.0% 20.0% 30.0% 40.0% 50.0% 60.0%
Extremely satisfied
Moderately satisfied
Neither satisfied nordissatisified
Moderatelydissatisfied
Extremely dissatisfied
Urban Elite
Urban total:80.4%

Chart 3. Length of expected stay at current position for large firm respondents, by type of school
0.0%
5.0%
10.0%
15.0%
20.0%
25.0%
30.0%
35.0%
40.0%
45.0%
already looking <1 year 1-2 years 3-5 years 5+ years
Urban Elite

Speculating about Ontario (with Gillian Hadfield) LSAT scores above 160
University of Toronto: 83% Western: 27% Osgoode Hall 24%, etc
Undergraduate GPA above 3.67 University of Toronto Over 50% Osgoode 39%, Ottawa 19%, Western 15%, etc
Percent working in large (51+) firms (source OLSAS & MIF - 1998 graduates):
University of Toronto 49% Osgoode 26%
Windsor 17%