Embed Size (px)
Citation preview

UNDER THE RADAR THE CARBON FOOTPRINT
OF EUROPE’S MILITARY SECTORS
A SCOPING STUDY

2 | Under the radar: The Carbon Footprint of Europe’s military sectors
COMMISSIONThis study was undertaken by the Conflict and Environment Observatory and Scientists for Global Responsibility. The study was commissioned by The Left group in the European Parliament - GUE/NGL. www.left.eu
ABOUT CEOBSThe Conflict and Environment Observatory (CEOBS) is a UK charity that undertakes research and advocacy on the environmental dimensions of armed conflicts and military activities and their derived humanitarian consequences. CEOBS’ overarching aim is to ensure that the environmental consequences of armed conflicts and military activities are properly docu-mented and addressed, and that those affected are assisted. www.ceobs.org
ABOUT SGRScientists for Global Responsibility (SGR) is a UK-based membership organisation which promotes responsible science and technology. Its membership includes hundreds of natural scientists, social scien-tists, engineers and professionals in related areas. It carries out research, education, and advocacy work centred around science and technology for peace, social justice and environmental sustainability. It is an active partner of ICAN, which was awarded the Nobel Peace Prize in 2017. www.sgr.org.uk
AUTHORSThis report was written and researched by Dr Stuart Parkinson, Executive Director at SGR and Linsey Cottrell, Environmental Policy Officer at CEOBS.
Dr Stuart Parkinson is Executive Director of SGR, a post he has held for over 15 years. He holds a PhD in climate change science and has worked in aca-demia, industry and for other NGOs. He has also been an expert reviewer for the Intergovernmental Panel on Climate Change. He is author of the report, ‘The environmental impacts of the UK military sector’, as well as numerous other publications.
Linsey Cottrell is a Chartered Environmentalist, with a master’s degree in Environmental Pollution and Control. She has over 20 years’ work experience in the environmental consultancy sector and joined CEOBS in 2019.
ACKNOWLEDGEMENTThe authors would like to acknowledge and thank the following who provided help in undertaking this scoping study:
• Dr Philip Webber, Andrew Simms, and Dr Jan Maskell, SGR
• Doug Weir, CEOBS• Lucas Wirl, International Network of Engineers and
Scientists for Global Responsibility (INES), Germany• Reiner Braun, International Peace Bureau, Germany• Wendela de Vries, Stop Wapenhandel, Netherlands• Jordi Calvo, Centre Delàs d’Estudis per la Pau,
Spain• Officials from ITP Aero, Spain• Bram Vranken, Vredesactie, Belgium• Laetitia Sedou, ENAAT, Belgium• Officials from ASD, Belgium
Acknowledgement does not imply agreement with the findings of this study. While every effort has been taken to ensure the accuracy of the information provided, any errors remain the responsibility of CEOBS and SGR.

Under the radar: The Carbon Footprint of Europe’s military sectors | 3
TABLE OF CONTENTS
STATEMENT 5
00 EXECUTIVE SUMMARY 7
01 INTRODUCTION 9
02 OVERARCHING POLICIES AND INITIATIVES 13
03 FRANCE 17
04 GERMANY 21
05 ITALY 25
06 THE NETHERLANDS 29
07 POLAND 33
08 SPAIN 37
09 OTHER EU MEMBER STATES 41
10 EU-WIDE ASSESSMENTS 43
11 STUDY FINDINGS AND RECOMMENDATIONS 47
12 LIST OF DATA SOURCES FROM INDUSTRY 51

4 | Under the radar: The Carbon Footprint of Europe’s military sectors
Abbreviations
ASD Aerospace and Defence Industries Association of Europe
CFSP Common Foreign and Security Policy
CSDP Common Security and Defence Policy
CF SEDSS Consultation Forum for Sustainable Energy in the Defence and Security Sector
CO2 Carbon dioxide
EDA European Defence Agency
EDEN European Defence Energy Network
EDSIS European Defence Standardisation Information System
EDSTAR European Defence Standards Reference System
EEA European Environment Agency
EEAS European External Action Service
EP Environmental protection
GHG Greenhouse gas emissions
IF CEED Incubation Forum on Circular Economy in European Defence
IPCC Intergovernmental Panel on Climate Change
MFF Multiannual Financial Framework
MMR Monitoring Mechanisms Regulation
NATO North Atlantic Treaty Organisation
NECP National energy and climate plan
NIR National inventory reporting
PMO Policy and Management Observatory
SIPRI Stockholm International Peace Research Institute
tCO2e tonnes of carbon dioxide equivalent
TCFD Task Force on Climate-Related Financial Disclosures
UNFCCC United Nations Framework Convention on Climate Change

Under the radar: The Carbon Footprint of Europe’s military sectors | 5
STATEMENT
At a time when rampant climate change is one of the most imminent threats to global security and to humanity, one would hope that the world’s political focus would be on how to lower our greenhouse gas emissions and to ensure a sustainable future. But the global military sector is reviving the sort of Cold War logic of international arms race, and we are in fact seeing an increase in the world’s military spending, not least in NATO countries. This study shows that not only does military spending swallow up resources that could and should be used to tackle climate change, invest in global justice, and to promote peaceful conflict resolution and disarmament, but that the military technology industry in itself contributes considerably to the climate emergency. In the EU alone, the carbon footprint of military expenditure is equivalent to the emissions of at least 14 million cars per year. However, this study also points out another serious problem – the lack of transparency around the military sector’s greenhouse gas emissions. The figures in the study are based on conservative estimates of these emissions. We must demand access to figures that will tell us how public money is spent and its impact on global heating, including when it concerns the military sector. This sector can no longer be treated as a separate and exempt from being scrutinised from a climate impact perspective. The Left aims for peace and disarmament, not the increase in military spending that we see both in Europe and globally today. The European Union is commonly referred to as a “peace project”, yet the EU allocates billions of euros to military projects such as the European Defence Fund. We know armament is counterproductive to peaceful and sustainable international relations. Our hope is that this study will bring about a public debate on how to tackle global human security threats such as climate change, and also shed light on the role that the military technology industry and the armed forces play in this regard.
- on behalf of Left MEPs in the European ParliamentEnvironment, Public Health and Food Safety Committee (ENVI)

6 | Under the radar: The Carbon Footprint of Europe’s military sectors
Under the radar: The Carbon Footprint of Europe’s military sectors | 7
EXECUTIVE SUMMARY
we were unable to find any specific data for Poland’s armed forces.
Of the military technology corporations operating in the EU that we examined, PGZ (based in Poland), Airbus, Leonardo, Rheinmetall, and Thales were judged to have the highest GHG emissions. Some military technology corporations did not publicly publish GHG emissions data, including MBDA, Hensoldt, KMW, and Nexter.
Overall, the transparency and accuracy of GHG emissions reporting within the military sectors exam-ined in this study was found to be low, and key de-ficiencies in the data were identified for all six countries assessed. These included omissions, un-der-reporting, and/or unclear data. A significant proportion of the military technology industry does not publicly declare GHG emissions data. Furthermore, there was little evidence that the combined GHG emissions of the military, the military technology industry, and their supply chains has been examined in individual EU nations or the EU as a whole. Given the high carbon intensity of these sectors, this is especially significant. National security was often cited as a reason for not publishing data. However, given the current level of technical, financial and environmental data already publicly available on the militaries of EU (and other) nations, this is an uncon-vincing argument, especially since several EU nations already publish data. A summary of reported military GHG emissions and the carbon footprint estimated
Tackling the global climate crisis requires transformational action over the next decade – and beyond. All sectors are under increased scrutiny to reduce their greenhouse gas (GHG) emissions. This includes the military, who remain high consumers of fossil fuels, not least through operating combat planes and warships, running military bases, procuring resource intensive equipment, and carrying out war-fighting activities. Militaries are frequently exempt from publicly reporting their GHG emissions. Indeed, there is currently no consolidated public reporting of GHG emissions for the national militaries of the European Union and no overarching reduction targets that incorporate emissions from the military.
00
Military spending is also currently increasing, not least among NATO countries, which make up more than half of global expenditure. In addition to the risks from increased militarisation, higher military spending also risks an increase in GHG emissions at a time when resources need to be directed towards tackling the climate crisis. As a department, the military is responsible for a high proportion of the GHG emissions by government and, as such, critical to a government’s contribution to achieving the European Green Deal target of net zero by 2050.
This study set out to estimate the carbon footprint of the EU’s military sectors. To do this, we examined available data from both government and industry sources from the six largest EU countries in terms of military expenditure, and the EU as a whole. The study therefore focused on France, Germany, Italy, the Netherlands, Poland and Spain. The report also provides a broad overview of the policies and meas-ures currently being pursued to reduce military GHG emissions in the EU, and their likely effectiveness.
We estimate that the carbon footprint of EU military expenditure in 2019 was approximately 24.8 million tCO2e, which is equivalent to the CO2 emissions of about 14 million average cars. We consider this a conservative estimate, given the many data quality issues. Breakdowns of this estimate by country and sub-sector are provided in the main report. France was found to contribute approximately one-third of the total carbon footprint for the EU’s militaries, but

8 | Under the radar: The Carbon Footprint of Europe’s military sectors
by this study is given in the table below. Refer to Table 11.1 in the main report for more detail.
Summary of reported military GHG emissions and carbon footprint estimated by this study
EU nation
Military GHG emissions
(reported)a MtCO2e
Carbon footprint
(estimated)b MtCO2e
France Not reported 8.38
Germany 0.75 4.53
Italy 0.34 2.13
Netherlands 0.15 1.25
Poland Not reported Insufficient data
Spain 0.45 2.79
EU total (27 nations) 4.52 24.83
a 2018 figures as reported to UNFCCC, see Table 11.1 for more detail.
b 2019 figures as estimated by this study.
There are already several initiatives to investigate and support the move to lower carbon energy use in the military, including international schemes es-tablished by the European Defence Agency and NATO. For example, the European External Action Service (EEAS) has published a Climate Change and Defence Roadmap, which sets out short-, medium- and long-term measures for addressing these issues, including improving energy efficiency. However, it is difficult to gauge their effectiveness without full GHG emission reporting being in place or published.
Current trends in the levels of military GHG emissions in the EU are hard to discern due to a lack of data. The combination of the upward trend in military expenditure to reach the NATO target of 2% of GDP, technology modernisation programmes, and NATO/ EU deployments outside of Europe all risk fuelling an increase in emissions. However, ongoing energy efficiency programmes and moves to expand renew-able energy use have the potential to reduce emissions.
• An urgent review of national and international security strategies is required to examine the potential to reduce the deployment of armed force and focus on diplomatic conflict resolution and disarmament – and hence reduce GHG emissions in ways not yet seriously considered by governments in the EU (or elsewhere). First steps should include:• assessing the potential of arms control and
disarmament initiatives to reduce emissions;
• examining the potential for less confronta-tional military force structures; and
• re-evaluating policies from the perspective of ‘human security’ rather than just ‘national security’, which would refocus resources on tackling the roots of insecurity, including poverty, inequality, ill-health, and environ-mental degradation.
• All EU nations should publish national data on the GHG emissions of their militaries and military technology industries as standard practice. Reporting should be transparent, consistent and comparative.
• All significant military technology corporations should be required to publicly publish GHG emissions data on their operations.
• All GHG emission reporting by militaries and military technology corporations should be externally audited and independently verified.
• Demanding targets should be set for the reduc-tion of military GHG emissions – consistent with the 1.5ºC level specified within the Paris Agreement. This should include targets for switching to renewable energy from national grids and investment in on-site renewables, as well as specific reduction targets for the military technology industry. The use of offsetting should be avoided.
• As a minimum, an assessment of EU-wide pro-gress is required on the recommendations of the 2015 NATO energy review, as well as imple-mentation of the environmental recommenda-tions of the EU Military Concept, which covered similar issues. This initial step is needed to assess if existing policies and practices are reducing environmental impacts.
• A review is required of the Energy Efficiency Directive 2012/27/EU and evaluation on how widely exemptions are applied on military contracts and across the military estate.
• Military-owned land should be managed both to improve carbon sequestration and biodiversity (e.g. through selective planting), as well as being used to generate on-site renewable energy where appropriate. Best practice land manage-ment options should be pursued and these should be monitored to ensure high standards are reached.
THIS STUDY IDENTIFIED THE NEED FOR THE FOLLOWING ACTIONS:

Under the radar: The Carbon Footprint of Europe’s military sectors | 9
SCOPE OF STUDY AND OBJECTIVES
Tackling the global climate crisis requires transfor-mational action over the next decade – and beyond. All sectors are under increased scrutiny to reduce their greenhouse gas (GHG) emissions. This includes the military who remain high consumers of fossil fuels, not least through operating combat planes and warships, running military bases, procuring resource intensive equipment, and carrying out war-fighting activities.
There is currently no consolidated public reporting of GHG emissions for the national militaries of the EU and no overarching reduction targets which in-corporate emissions from the military. Since climate change is now widely recognised as a driver of armed conflict, it is surprising that military efforts lag far behind civilian initiatives. Indeed, there would be other benefits to action in this area because, as referenced in NATO’s 2018 report on critical energy infrastructure,1 ‘the armed forces are a large consumer of energy that is a significant vulnerability in military capabilities’, making it necessary for measures to increase energy security and for increased energy resilience.
This scoping study sets out to provide a broad analysis of the carbon footprint of the EU military, including both the national armed forces and military technology industries based in the EU. The analysis has focused on the top six EU member states ac-cording to their total military expenditure.
This study has also reviewed policy and carbon re-duction strategies in the public domain and provided commentary on whether these are likely to signifi-cantly reduce emissions in the future or by the 2030 EU Green Deal target.
The estimates given in this study are not intended to present an accurate benchmark since they are
1 NATO (2018). Recommendations on the importance of critical energy infrastructure (CEI) stakeholder engagement, coordination and understanding of responsibilities in order to improve security, https://www.enseccoe.org/data/public/uploads/2018/04/d1_2018.04.23-recommendations-on-the-importance-of-critical-energy.pdf
2 UNFCCC (2013). Reporting guidelines on annual inventories for Parties included in Annex I to the Convention https://unfccc.int/resource/docs/2013/cop19/eng/10a03.pdf#page=2
3 IPCC (2019). Refinement to the 2006 IPCC Guideline for National Greenhouse Gas Inventories, Chapter 8 Reporting Guidance and Tables, https://www.ipcc-nggip.iges.or.jp/public/2019rf/pdf/1_Volume1/19R_V1_Ch08_Reporting_Guidance.pdf
derived using a broad set of assumptions and ex-trapolation of available datasets. The estimates however do provide an initial assessment against which comparison can be made against any future GHG reporting which may be published, and set out what should be included to provide a fair and trans-parent account of GHG emissions from the EU military.
EU OBLIGATIONS AND LEGISLATION ON GHG EMISSIONS
All EU Member States are party to the UN Framework Convention on Climate Change (UNFCCC) and the range of protocols and agreements that operation-alise it, including the 1997 Kyoto Protocol, under which targets for action were first agreed, and the 2015 Paris Agreement, under which current targets are set with an ambition to limit future global tem-perature rises to 1.5°C. Member States are obliged to prepare and publish annual GHG emissions in-ventories and regularly report on their climate policies and progress towards emissions reduction targets.
However, operating rules to implement the Kyoto Protocol explicitly excluded GHG emissions from military activities from reporting requirements or targets, while under the Paris Agreement, cutting emissions from the military is left to the discretion of individual nations. Inclusion of disaggregated military emissions in UNFCCC submissions is voluntary. In line with UNFCCC reporting guidelines,2 GHG emissions should be reported at the most disaggre-gated level of each source but allow aggregation to protect confidential business and military information. UNFCCC reporting of military GHG emissions for EU Member States has been reviewed, and any voluntary reporting by the top six EU militaries highlighted in this report.
Under guidelines published by the Intergovernmental Panel on Climate Change (IPCC),3 military fuel use
INTRODUCTION01
10 | Under the radar: The Carbon Footprint of Europe’s military sectors
should be reported under IPCC category 1.A.5 (Other, not elsewhere specified), which includes all mobile – i.e. ships, aircraft, road vehicles - and sta-tionary fuel consumption (i.e. military bases). Emissions from international military water-borne navigation can be included under IPCC category 1.A.3.d.i (provided it is defined). Emissions from multinational operations under the charter of the UN are excluded from national totals, and should be reported separately. However, this report finds that consistency of reporting is often poor, with emissions sometimes being counted in other categories (es-pecially common for military bases), or being excluded on the grounds of national security. Under certain circumstances, some civilian emissions are also re-ported in this category. We will highlight these issues in the following sections.
The EU Monitoring Mechanism Regulation (MMR) requires Member States to report annual national GHG emissions to enable the EU to prepare its UNFCCC report as a single entity, and to report climate policies and measures every two years.4 Effort Sharing legislation establishes annual GHG emission targets for Member States for 2013-2020 and 2021-2030,5 including sectors not covered by the EU Emissions Trading System,6 such as transport, buildings, waste and agriculture. The legislation recognises that all sectors of the economy should contribute to achieving GHG emission reductions.
The military is not listed as a specific sector under MMR or the Effort Sharing legislation, although both could influence military infrastructure, equipment and operations. In terms of energy efficiency,7 build-ings owned by the armed forces (except single living quarters or offices) are not obliged to meet the minimum building energy performance requirements. The energy efficiency requirements for products, services and buildings purchased by central govern-ment also only applies to contracts of the armed forces if ‘its application does not cause any conflict with the nature and primary aim of the activities of the armed forces’.8 The obligations also do not apply to contracts for the supply of military equipment.9
4 EU (2013). Regulation No. 525/2013, https://eur-lex.europa.eu/legal-content/EN/TXT/PDF/?uri=CELEX:02013R0525-20181224&from=EN 5 Effort sharing: Member States’ emission targets, https://ec.europa.eu/clima/policies/effort_en6 The European emission trading system applies to high-energy installations such as power stations, industrial plants and airlines, excluding military flights7 Under Article 5 of the Energy Efficiency Directive (2012/27/EU), https://eur-lex.europa.eu/legal-content/EN/TXT/PDF/?uri=CELEX:32012L0027&from=EN 8 Under Article 6 of the Energy Efficiency Directive (2012/27/EU)9 As defined by Directive 2009/81/EC, https://eur-lex.europa.eu/legal-content/EN/TXT/?uri=celex%3A32009L0081 10 EU (2014). Directive 2014/95/EU, https://eur-lex.europa.eu/legal-content/EN/TXT/?uri=CELEX%3A32014L009511 EC (2019). Guidelines on reporting climate-related information, https://ec.europa.eu/finance/docs/policy/190618-climate-related-information-reporting-guidelines_en.pdf12 A European Green Deal, https://ec.europa.eu/info/strategy/priorities-2019-2024/european-green-deal_en 13 EC (2020a). European Climate Law, https://eur-lex.europa.eu/legal-content/EN/TXT/PDF/?uri=CELEX:52020PC0080&from=EN 14 EEA (2019). Report No 15/2019 Trends and projections in Europe 2019, https://www.eea.europa.eu/publications/trends-and-projections-in-europe-1/at_download/file 15 NECPs available via https://ec.europa.eu/energy/topics/energy-strategy/national-energy-climate-plans_en#final-necps 16 See section 3.2, 4.2, 5.2, 6.2, 7.2 and 8.2 17 NATO (2020). Information on defence expenditures, https://www.nato.int/cps/en/natohq/topics_49198.htm
Under EU law,10 large public-interest companies are required to provide non-financial reporting, which includes information on their GHG emissions but the guidelines on reporting climate-related information are non-binding.11 This means that although large military contractors and arms manufacturers with more than 500 employees have been required to include non-financial information in their annual reports from 2018 onwards, including their policies to be implemented in relation to environmental protection, the scope and nature of reporting of GHG emissions varies considerably.
The European Green Deal sets out an action plan to reach net zero GHG emissions by 2050,12 with the proposed European Climate Law requiring action across all sectors of the economy.13 Only a GHG emission reduction of 60% (from 1990 levels) is re-quired by 2050 under current policies, and the proposal recognises that much more remains to be done to reach climate neutrality. It is logical that militaries, which are themselves responsible for high proportions of the GHG emissions from Member States, should play an important role in achieving the European Green Deal target of net zero by 2050. The annual European Environment Agency (EEA) report gives trends and projections based on national data for GHG emissions, renewable energy and energy consumption, but the military is not listed as a specific sector under the EEA reporting.14 The latest national energy and climate plans (NECPs)15 pub-lished for each of the six EU Member States have also been reviewed to check any reference in the NECP to the military.16
Finally, there is no clear mechanism for assessing or reporting GHG emissions resulting from the use of weapons in a battlefield environment, for example in destroying a fuel depot, or the emissions created during post-conflict reconstruction.
COUNTRY FOCUS
This study has focused on the top six EU Member States in terms of military expenditure. Data on this expenditure was taken from NATO,17 with a summary of 2018 spending levels for each nation given in

Under the radar: The Carbon Footprint of Europe’s military sectors | 11
Table 1.1.18 We have also drawn on national expend-iture data from the EU’s Eurostat portal,19 and the global military expenditure database complied by the Stockholm International Peace Research Institute (SIPRI),20 to supplement the NATO figures as necessary.
The data shows that military expenditure levels in 2018 for the top six EU Member States ranged from 0.9% to 1.8% of GDP. Military expenditure is at least €162 billion for the EU in total.19 Provisional figures for 2019 and 2020 showed significant increases for many countries, in line with moving towards NATO’s spending target of at least 2% of GDP.21 This is dis-cussed in more detail in sections 3 to 8.
Table 1.1 - Military expenditure of the EU’s six largest spending nations (excluding the UK), 2018
Member state
Total expenditurea
(€ bn)% of
GDPa
% of EU total military
expenditureb (ex-UK)
France 42.7 1.81 25.5
Germany 42.1 1.26 21.9
Italy 21.7 1.23 13.6
Netherlands 9.5 1.21 5.6
Poland 9.9 2.02 5.0
Spain 11.2 0.93 6.3
a NATO data17
b Eurostat portal data19
MILITARY TECHNOLOGY INDUSTRY
Europe is home to eight of the world’s top 30 largest corporations by military sales.22 Of the companies based in our six case study nations, the 10 largest are listed in Table 1.2.
According to the industry’s trade body, the Aerospace and Defence Industries Association of Europe (ASD), military technology corporations in the EU (including the UK) had revenues of €116 billion in 2019, and directly employed 440,000 people.23 The industry was active in all the major military technological areas, including naval vessels (surface ships and submarines), aircraft (combat planes, helicopters, and transporters), land vehicles (tanks and other armoured vehicles), weapons (missiles, artillery and ammunition), and
18 The latest complete datasets available at the time of writing. We note that NATO uses a broader definition for military spending than Eurostat or SIPRI.19 Figure from Eurostat (2020), https://ec.europa.eu/eurostat/cache/infographs/cofog/. Note that using NATO figures would give a higher level20 SIPRI (2020). SIPRI Military Expenditure Database, https://www.sipri.org/databases/milex 21 Funding NATO, https://www.nato.int/cps/en/natohq/topics_67655.htm#:~:text=The%202%25%20defence%20investment%20guideline,the%20Alliance’s%20common%20
defence%20efforts 22 Defense News (2020). Top 100 for 2020, https://people.defensenews.com/top-100/ 23 ASD (2020). Facts and figures, https://www.asd-europe.org/facts-figures 24 Defense News (2020). Op. cit. 25 SIPRI (2019). Arms industry database, https://www.sipri.org/databases/armsindustry 26 The other major GHGs are methane (CH4), nitrous oxide (N2O) and a group known as the ‘F’ gases.
information systems and services. Production includ-ed nuclear as well as conventional weapons systems. R&D efforts included emerging technologies in arti-ficial intelligence, robotic vehicles (especially aircraft), and cyber warfare.
Table 1.2 - The EU-based corporations with the 10 highest levels of military sales (not including those based in the UK), 201924
CorporationCountry
(Head office)Military sales
($ bn)
Airbus Trans-European 11.3
Leonardo Italy 11.1
Thales France 9.3
Dassault Aviation France 5.7
Safran France 4.4
Naval Group France 4.2
Rheinmetall Germany 3.9
MBDAa Trans-European 3.8
Saab Sweden 3.2
KNDS (Subsidiaries: Nexter; KMW) Trans-European 2.8
a Figures for 2018 from SIPRI25
METHODOLOGY AND BROAD ASSUMPTIONS FOR ESTIMATING GHG EMISSIONS
This report makes use of several methods to compile and report on the GHG emissions of the military-in-dustrial sectors of the EU. GHG emissions are reported in ‘tonnes of carbon dioxide equivalent’ or tCO2e. This is a standardised measure that takes account of the fact that there are a number of different GHGs – carbon dioxide (CO2) being the most prevalent.26 All emissions figures given in this report are for single years (most commonly 2018 or 2019), except where otherwise indicated.
There are two main approaches to compiling and reporting on GHG emissions:• territorial or ‘production-based’ emissions; and • lifecycle or ‘consumption-based’ emissions.
The production-based emissions of a nation or or-ganisation are those from sources within the national
12 | Under the radar: The Carbon Footprint of Europe’s military sectors
(or organisational) territorial boundaries. Such emissions may also include those from sources that are deployed internationally, but are owned by the national government (or organisation), for example, military ships and aircraft. National GHG inventories – as discussed below – cover production-based emissions. This approach is the simplest of the two to accurately apply in practice.
The consumption-based emissions of a nation or organisation are those that occur as part of the life-cycle of activities necessary to support that consump-tion. These activities include extraction of raw ma-terials, manufacture, use, and disposal of waste products, regardless of where in the world they happen, or who owns them. This is commonly known as the ‘carbon footprint’. This approach is argued to be more appropriate in that emissions are assigned to those nations or organisations whose consumption is responsible for driving them.
In this study, we compile total GHG emission figures for the combined military-industrial sectors of the six case study countries – and then extrapolate these to the EU as a whole – using both production-based and consumption-based approaches.
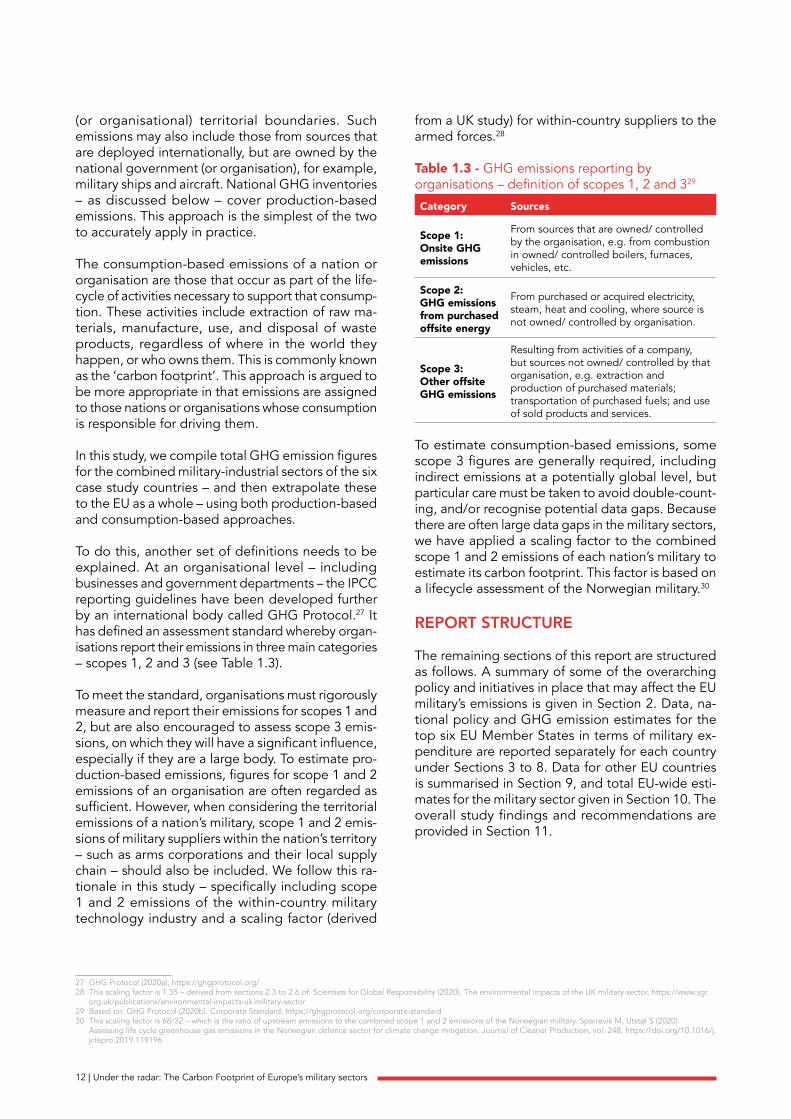
To do this, another set of definitions needs to be explained. At an organisational level – including businesses and government departments – the IPCC reporting guidelines have been developed further by an international body called GHG Protocol.27 It has defined an assessment standard whereby organ-isations report their emissions in three main categories – scopes 1, 2 and 3 (see Table 1.3).
To meet the standard, organisations must rigorously measure and report their emissions for scopes 1 and 2, but are also encouraged to assess scope 3 emis-sions, on which they will have a significant influence, especially if they are a large body. To estimate pro-duction-based emissions, figures for scope 1 and 2 emissions of an organisation are often regarded as sufficient. However, when considering the territorial emissions of a nation’s military, scope 1 and 2 emis-sions of military suppliers within the nation’s territory – such as arms corporations and their local supply chain – should also be included. We follow this ra-tionale in this study – specifically including scope 1 and 2 emissions of the within-country military technology industry and a scaling factor (derived
27 GHG Protocol (2020a), https://ghgprotocol.org/ 28 This scaling factor is 1.35 – derived from sections 2.3 to 2.6 of: Scientists for Global Responsibility (2020). The environmental impacts of the UK military sector, https://www.sgr.
org.uk/publications/environmental-impacts-uk-military-sector 29 Based on: GHG Protocol (2020b). Corporate Standard, https://ghgprotocol.org/corporate-standard 30 This scaling factor is 68/32 – which is the ratio of upstream emissions to the combined scope 1 and 2 emissions of the Norwegian military. Sparrevik M, Utstøl S (2020).
Assessing life cycle greenhouse gas emissions in the Norwegian defence sector for climate change mitigation. Journal of Cleaner Production, vol. 248, https://doi.org/10.1016/j.jclepro.2019.119196
from a UK study) for within-country suppliers to the armed forces.28
Table 1.3 - GHG emissions reporting by organisations – definition of scopes 1, 2 and 329
Category Sources
Scope 1:Onsite GHG emissions
From sources that are owned/ controlled by the organisation, e.g. from combustion in owned/ controlled boilers, furnaces, vehicles, etc.
Scope 2:GHG emissions from purchased offsite energy
From purchased or acquired electricity, steam, heat and cooling, where source is not owned/ controlled by organisation.
Scope 3: Other offsite GHG emissions
Resulting from activities of a company, but sources not owned/ controlled by that organisation, e.g. extraction and production of purchased materials; transportation of purchased fuels; and use of sold products and services.
To estimate consumption-based emissions, some scope 3 figures are generally required, including indirect emissions at a potentially global level, but particular care must be taken to avoid double-count-ing, and/or recognise potential data gaps. Because there are often large data gaps in the military sectors, we have applied a scaling factor to the combined scope 1 and 2 emissions of each nation’s military to estimate its carbon footprint. This factor is based on a lifecycle assessment of the Norwegian military.30
REPORT STRUCTURE
The remaining sections of this report are structured as follows. A summary of some of the overarching policy and initiatives in place that may affect the EU military’s emissions is given in Section 2. Data, na-tional policy and GHG emission estimates for the top six EU Member States in terms of military ex-penditure are reported separately for each country under Sections 3 to 8. Data for other EU countries is summarised in Section 9, and total EU-wide esti-mates for the military sector given in Section 10. The overall study findings and recommendations are provided in Section 11.

Under the radar: The Carbon Footprint of Europe’s military sectors | 13
OVERARCHING POLICIES AND INITIATIVES
02
NATO
Of the 27 EU Member States, 21 are also members of NATO.31 NATO members have agreed to a mini-mum spending target of 2% GDP on the military. A renewed pursuit of this target is chiefly in response to pressure from the US, and in particular the Trump administration. Indeed, NATO countries already make up more than half of global military expenditure, with EU military expenditure at least €162 billion. This compares with Russian military spending of less than €50 billion, and US military spending of €561 billion.The 2% target has been strongly criticised even by senior military analysts, with some calling it ‘irration-al’.32 A commitment to increase military spending risks an increase in GHG emissions.
The NATO Secretary General acknowledged the need for NATO and the armed forces to contribute to reaching net zero carbon emissions by 2050 in a speech in September 2020.33 To do this, the first step should involve NATO helping its members to calculate the specific carbon output of their militaries and then report these figures. The difficulty will arise in getting all NATO members to follow the same climate and carbon reduction obligations when climate policies are not equally prioritised across the nations.
31 EU Member States not in NATO are: Austria, Cyprus, Finland, Ireland, Malta and Sweden.32 Lunn S, Williams N (2017). NATO Defence Spending: The Irrationality of 2%. European Leadership Network.https://www.europeanleadershipnetwork.org/wp-content/uploads/2017/10/170608-ELN-Issues-Brief-Defence-Spending.pdf33 Virtual speech by NATO Secretary General, 28.09.2020, https://www.nato.int/cps/en/natohq/opinions_178355.htm?selectedLocale=en 34 NATO (2014a). Green Defence Framework, https://natolibguides.info/ld.php?content_id=2528507235 NATO (2014a). Policy on power generation for deployed force infrastructure https://natolibguides.info/ld.php?content_id=23264351 36 NATO Energy Security COE, https://www.enseccoe.org/en/about/6 37 NATO (2019). Energy Management in a Military Expeditionary Environment,https://www.enseccoe.org/data/public/uploads/2019/12/nato_ensec_coe-emmee_project_report-dec2019.pdf
NATO has a range of initiatives in place, with a shared aim to support the move to lower carbon energy use in the military. NATO adopted the Green Defence Framework in 2014,34 which sets out to improve energy efficiency but does not incorporate any specific carbon reduction, GHG emission or environ-mental performance targets. NATO policy on power generation for deployed force infrastructure also excludes any specific reporting requirements or targets.35
The NATO Energy Security Centre of Excellence (ENSEC COE) was also established in 2012.36 This provides access to a range of publications on energy infrastructure, efficiency and management, but no reporting on GHG emissions or guidance on GHG reporting mechanisms. NATO’s report on energy management for the military in deployed environ-ments recommended the need for a NATO energy management handbook, training for military person-nel, improved metering and data collection, proactive planning of energy management requirements during camp design and standardised management pro-cesses across nations.37 NATO ENSEC COE are developing an energy management handbook based on ISO 50001 (Energy Management Systems), with
This section summarises some of the overarching policies and initiatives in place that may affect the EU military’s GHG emissions, including those of NATO and the European Defence Agency.

14 | Under the radar: The Carbon Footprint of Europe’s military sectors
publication planned for March 2021,38 and training material on net zero energy is available through the ENSEC COE website.39
NATO undertook a review in 2015 of military energy use and national approaches to reducing energy consumption.40 At this time, few countries across NATO were noted to have strongly engaged with practical energy efficiency measures for the military, although a number of NATO and partner nations have established strategies, policies and standards, as well as implementing energy efficiency technol-ogies. The review reported a willingness to share knowledge and work collaboratively, yet most national initiatives were being conducted in isolation with a lack of cooperation between defence, scientific and industrial communities. Energy efficiency require-ments in military procurement were also noted to be lacking.
The review recommended the development of an energy strategy covering: education and training; standards and doctrine; research and technology; and targets and objectives. To implement the strat-egy, energy champions and single national focal points were also recommended, with ‘smart energy’ incorporated into the NATO working group structure. Reports and policies from only three EU Member States (Germany, Netherlands and Spain) are pub-lished on the NATO Smart Energy webpage.
Although it dates from 2015, the NATO review sets measures against which the EU military can be assessed.
EUROPEAN DEFENCE AGENCY
All EU Member States participate in the European Defence Agency (EDA), except Denmark. The EDA has also established several initiatives and networks with similar objectives of supporting the move to lower carbon energy use. Although initiatives may be in place and on-going, it is difficult to gauge their effectiveness without energy reduction targets or full reporting yet in place or published. As discussed in section 10.1, the EDA has compiled military energy consumption data for 22 EU Member States, although since the dataset is limited to 2016 and 2017, trends
38 NATO Energy Security COE, Energy Management Handbook https://enseccoe.org/en/events-and-projects/268/energy-management-for-deployed-forces-infrastructure-34/details
39 NATO Energy Security COE, Advanced Net Zero Energy training course https://www.enseccoe.org/en/resources/225/videos/advandced-net-zero-energy-water-and-waste-training-course-20
40 NATO (2015). Smart Energy Team (SENT) Comprehensive Report, https://natolibguides.info/ld.php?content_id=18110194 41 CF SEDSS, https://www.eda.europa.eu/european-defence-energy-network 42 CF SEDSS Phase III, https://www.eda.europa.eu/european-defence-energy-network/phase-iii 43 CF SEDSS III Work Plan, https://www.eda.europa.eu/european-defence-energy-network/phase-iii/work-plan 44 EDA (2020) CF SEDSSS III Handbook, https://www.eda.europa.eu/docs/default-source/events/eden/phase-iii/handbook.pdf 45 European Defence Standards Reference System, https://edstar.eda.europa.eu/ 46 Standards may exist on the European Defence Standardisation Information System (EDSIS) but we did not have access to EDSIS for this review, https://edsis.eda.europa.eu/
Introduction.aspx
in energy use are not yet obvious and the scope of the reported data is not clear.
The EDA’s European Defence Energy Network (EDEN) aims to link stakeholders engaged in the adoption of low carbon energy in the military and security sector.41 The Consultation Forum for Sustainable Energy in the Defence and Security Sector (CF SEDSS) is a European Commission funded initiative, managed by the EDA.42 CF SEDSS objectives include sharing information and best practices on energy manage-ment, energy efficiency and buildings performance and adopting renewable energy sources. The CF SEDSS work plan sets out eight key objectives,43 and the CF SEDSS III handbook details the ambitions of the initiative,44 which is programmed to run until September 2023. This includes providing best practice for the incorporation of green procurement in defence, the collection of energy-related data and analysis in-line with performance indication.
The CF SEDSS includes four working groups, with the Policy and Management Observatory (PMO) sub-group sitting within the transversal working group. The focus of the PMO is to support develop-ment of policy, strategy, methodologies and tools to improve energy management and encourage the setting of performance indicators, energy targets and energy monitoring. There is no specific reference to GHG reporting requirements.
The EDA’s European Defence Standards Reference System (EDSTAR) provides links to best practice guidance and specifications for the military sector.45 EDSTAR also does not currently include any guidance on renewable energy or GHG emissions reporting.46
Other initiatives include the EDA’s Energy and Environment Working Group, established in 2014. This aims to build on work conducted under the EDA’s Military Green initiative and cooperate with other entities such as CF SEDSS, NATO’s Environmental Protection working group and DEFNET, which is an informal expert group of environmental specialists and focal points from EU defence ministries. The informal minutes from the 16th meeting of the EDA’s Energy and Environment Working Group in September 2020 highlighted the need for a comprehensive

Under the radar: The Carbon Footprint of Europe’s military sectors | 15
database and for Ministries of Defence to improve the detail of energy data collected.47
The EDA also reported the forthcoming launch of the Incubation Forum on Circular Economy in European Defence (IF CEED),48 aimed at identifying collaborative projects between Member States, the defence industry and Research and Technology Organisations (RTOs) to address issues including environmental protection and resource use.
EU MULTIANNUAL FINANCIAL FRAMEWORK
The EU Multiannual Financial Framework (MFF) is a seven-year budget that sets out funding allocations for major programmes. The MFF for 2014-2020 in-cluded five programme headings, with military allo-cations under ‘Security and citizenship’ and ‘Global Europe’. The new MFF for 2021-2027 includes seven programme headings, with one now allocated to ‘Security and Defence’.
This is the first time that security and defence has been separated out in the budget structure,49 and has a €13.2 billion budget allocation, out of a MFF total of €1,074.3 billion.50 The funding allocation is a significant reduction compared with the €27.5 bil-lion total for security and defence initially proposed in June 2018 for MFF 2021-2027. Allocations under ‘Security and Defence’ to the European Defence Fund (EDF), which is designed to improve collabo-ration and co-operation in the procurement and development of military products and technologies, were revised down from €13 billion to €7 billion.51 Whilst the MFF 2021-2027 budget structure may help in reviewing future expenditure, there is no clear allocation to carbon reduction strategies, although this may fall under EDF initiatives. Any future carbon reductions should be measured against net expenditures.
OTHER EU AND EEAS POLICIES
The EU’s Common Security and Defence Policy (CSDP) sets out a framework in which missions and operations may be undertaken outside of the EU,
47 EDA ENE-WG-16th-Meeting Presentations, https://fileshare.eda.europa.eu/download.php?id=324&token=QY6kNOTYw7diaoZqBW4rXdqpBwIEYp9F 48 First conference of CF SEDSS Phase III, EDA Chief Executive speech https://www.eda.europa.eu/docs/default-source/documents/speech-eda-chief-executive-
ji%C5%99%C3%AD-%C5%A1ediv%C3%BD.docx 49 This includes internal security, defence, nuclear safety and decommissioning, and crisis response.50 EC (2020b). EU’s Next long-term budget and NextGenerationEU, https://ec.europa.eu/info/sites/info/files/about_the_european_commission/eu_budget/mff_factsheet_
agreement_en_web_20.11.pdf 51 EC (2018). EU Budget for the Future – The European Defence Fund, https://ec.europa.eu/commission/sites/beta-political/files/budget-may2018-eu-defence-fund_en_0.pdf52 EU (2012). Report on the role of the CDSP in the case of climate-driven crises and natural disasters, https://www.europarl.europa.eu/doceo/document/A-7-2012-0349_EN.html 53 Sonnsjö & Bremberg (2016). Climate Change in an EU Security Context, https://cdn-cms.f-static.net/uploads/3692253/normal_5ee7813ccdd30.pdf 54 EEAS (2012). 01574/12 European Union Military Concept on Environmental Protection and Energy Efficiency for EU-led military operations, https://data.consilium.europa.eu/
doc/document/ST-13758-2012-INIT/en/pdf55 EU (2020), Council conclusions on Climate Diplomacy, 20 January 2020, https://data.consilium.europa.eu/doc/document/ST-5033-2020-INIT/en/pdf
such as joint disarmament operations, conflict pre-vention, peace-keeping and use of combat forces in crisis management, which includes climate-related and natural disasters. An EU report in 2012 focused on the role of the CSDP in addressing the impacts of climate change and advocated the adoption of energy efficiency and renewable energy, highlighting the link with energy security.52 Although a 2016 re-search report noted that recent CSDP missions have been modest, and mainly limited to security sector training,53 there is no notable policy towards refo-cusing overall military strategy or reducing military deployment to reduce GHG emissions. The new European Peace Facility (EPF) also has €5 billion of funding planned for the seven-year period of the MFF, and is designed to support EU-backed military operations and activities abroad. This would increase the deployment of military equipment and personnel - as well as the export of arms - thereby increasing GHG emissions.
The EU Military Concept on Environmental Protection and Energy Efficiency for EU-led military operations provides strategic guidance and acknowledges the need for EU-led operations to adequately address environmental protection.54 The concept highlighted energy conservation as one of the considerations for environmental protection standards for CSDP mis-sions and operations, noting that CSDP environmental protection (EP) standards should be included in the Operation/Force Headquarters standard operating procedures, and align with environmental standards defined by the UN and NATO. Recommendations for the EP standard on energy conservation include for the planning and establishment of renewable energy. Planning and procurement was also high-lighted as an opportunity to introduce appropriate technical specifications to mitigate adverse environ-mental effects through a life-cycle approach. In the adoption of EU policies and principles, the concept notes that military necessity may justify overriding EP during EU-led operations, and that operational imperatives will usually have priority.
The Council of the EU conclusions on climate diplo-macy noted the relevance of environmental and climate change issues in the context of its impact on military capability, planning and development.55 In

16 | Under the radar: The Carbon Footprint of Europe’s military sectors
November 2020, the European External Action Service (EEAS)56 published a Climate Change and Defence Roadmap with short-, medium- and long-term measures for addressing the links between the military and climate change.57 This includes goals for the EEAS to:• develop operational guidelines and standard
operating procedures on environmental and carbon footprint management;
• introduce monitoring measures on the effective implementation of the EU Military Concept;53
• initiate the development of measurement capabil-ities and an associated light-touch reporting process based on indicators of progress related to the environmental footprint, including energy, water, waste management, etc. within CSDP missions and operations.
56 EEAS is the EU’s diplomatic service to support EU policies including the Common Foreign and Security Policy (CFSP) and Common Security and Defence Policy (CSDP)57 EU (2020a), Climate Change and Defence Roadmap, 9 November 2020, https://data.consilium.europa.eu/doc/document/ST-12741-2020-INIT/en/pdf
The EEAS roadmap also invites EU Member States to share good practices, join existing platforms and networks such as EDA’s Energy and Environment Working Group, and strengthen the military’s role in conserving biodiversity, given that the EU armed forces are the largest land owner in Europe. EU Member States are also invited to:• enhance tools to measure and monitor energy
efficiency and introduce benchmarks;• include climate and environmental assessment in
procurement and capability development processes;
• take climate, energy and environmental consider-ations into account when building and renovating military infrastructure;
• improve data collection and analysis efforts by providing national defence-related energy data.
This roadmap sets out steps against which the EU military can be assessed.

Under the radar: The Carbon Footprint of Europe’s military sectors | 17
MILITARY EXPENDITURE AND STRUCTURE
French military expenditure is summarised in Table 3.1, using figures reported to NATO. In real terms, this spending increased 11% between 2014 and 2020.
Table 3.1 – Military expenditure, France58
2018 2019* 2020*
Total expenditure €42.7bn €44.3bn €46.2bn
% of GDP 1.81 1.83 2.11
Figures are current values. Those marked * are estimates.
France’s military is one of the largest in the world, partly due to its large navy and air force. It also actively deploys nuclear weapons. France has been among the world’s top ten military spenders for decades, is a leading member of NATO, and has significant numbers of troops deployed in Africa, the Middle East, the Asia-Pacific, and elsewhere in Europe. The latest data summarising the size of France’s military – both equipment and personnel – are given in Table 3.2. Focus is given to factors that lead to higher levels of carbon emissions.
REPORTED EMISSIONS AND NATIONAL POLICY
The UNFCCC National Inventory Report for France stated military emissions under the IPCC category 1.A.5 as ‘not occurring’ and that fuel consumption from military activities is confidential.59 Fuel con-
58 NATO (2020). Defence Expenditure of NATO Countries (2013-2020). Press release, 21 October, https://www.nato.int/cps/en/natohq/news_178975.htm 59 France (2020a). National Inventory Report for France. Inventory of GHG Emissions in France 1990-2018, https://unfccc.int/sites/default/files/resource/frk-2020-nir-15apr20.zip60 From: NATO (2020) – op cit; IISS (2020). The Military Balance 2020, https://www.iiss.org/publications/the-military-balance-plus; FAS (2020). Status of World Nuclear Forces,
https://fas.org/issues/nuclear-weapons/status-world-nuclear-forces61 https://www.gouvernement.fr/en/climate-plan
sumption and its GHG emissions are however cur-rently included under category 1.A.4.a (commercial and institutional). The entry will be corrected and changed to ‘included elsewhere’ for the next sub-mission. It is therefore not currently possible to define reported military GHG emissions from the submitted UNFCCC data.
Table 3.2 – Key data on the make-up of the French military60
Military personnel 208,000
Percentage of total military expenditure spent on equipment 27%
Navy - Aircraft carriers (nuclear-powered) - Destroyers & frigates - Submarines (nuclear-powered)
1229
Air-force - Fighter/ ground attack aircrafta
- Heavy/ medium transport aircraft/ tankers24860
Army - Main battle tanks & infantry fighting vehicles - Artilleryb
- Heavy/ medium transport helicoptersc
- Armoured personnel carriersb
847
273155
2,427
Nuclear warheads (deployed on submarines and aircraft) 290
a Includes aircraft deployed with the navyb Includes equipment deployed with the gendarmeriec Includes helicopters deployed with the air-force
Regarding its overarching approach to GHG emis-sions, France published its Climate Plan in 2017.61 This seeks to increase the implementation of meas-
03FRANCE
This section focuses on France, which is one of the top six EU countries in terms of military expenditure. It includes reported military GHG emission data, a summary of national policy and our estimate for GHG emissions.

18 | Under the radar: The Carbon Footprint of Europe’s military sectors
ures to address climate change and reduce fossil fuel use across all government departments. The National Low Carbon Strategy 2020 sets out guidelines for a transition to a low-carbon economy for all sectors but does not specifically refer to or exclude the military sector.62 The Integrated National Energy and Climate Plan for France 2020 does set any specific targets for the military, and notes that certain build-ings owned by the Ministry of Defence are excluded from the scope of the Energy Efficiency Directive 2012/27/EU.63
The Defence Energy Strategy 2020 highlights that the European Green Deal, as well as the National Low Carbon Strategy 2020, applies in part to the Ministry of Armed Forces but notes that, where justified, exemptions for the military can apply.64 An example is given in the case of decarbonisation of fuels and military equipment with a longer life ex-pectancy than civilian equipment. The strategy does not include total GHG emissions of the French military, but does include figures for the ministry’s energy consumption, and a proportion of the emissions in 2019:• GHG emissions of military bases/ estates: 455,000
tCO2e; and• consumption of petroleum products by military
vehicles: 835,000 m3 (with a breakdown by fuel type).
By using standard conversion factors of fuels for aviation, shipping and land vehicles,65 we estimate that the GHG emissions of military vehicles were 2.23
62 Ministry for Ecological and Solidarity Transition (2020) National Low Carbon Strategy, https://www.ecologie.gouv.fr/sites/default/files/2020-03-25_MTES_SNBC2.pdf 63 France (2020b), Integrated National Energy and Climate Plan for France, https://ec.europa.eu/energy/sites/ener/files/documents/fr_final_necp_main_en.pdf 64 Ministry of Defence, France (2020) Defence Energy Strategy - Report of the Energy Working Group, https://www.defense.gouv.fr/content/download/593611/10047694/
Strate%CC%81gie%20E%CC%81nerge%CC%81tique%20de%20De%CC%81fense.pdf 65 BEIS (2020). Greenhouse gas reporting: conversion factors 2020, https://www.gov.uk/government/publications/greenhouse-gas-reporting-conversion-factors-2020 66 The Ministry also published GHG emissions data in 2012 (based on emissions for 2010). Although it is stated that the assessment will be repeated every three years, no further
published data was noted on the website, https://www.defense.gouv.fr/english/sga/sga-in-action/sustainable-development/bilan-carbone/la-defense-publie-son-premier-bilan-carbone
67 A list of references for this data can be found in section 12
million tCO2e. Conversion factors are used to estimate GHG emissions based on fuel use. Hence, the total GHG emissions of the French military – as derived from the reported data – were approximately 2.69 million tCO2e in 2019.66 The greater openness in this report regarding military emissions data strongly contrasts with the assertion in the national report to the UNFCCC that such data are confidential.
IN-COUNTRY MILITARY TECHNOLOGY INDUSTRY - CORPORATE GHG REPORTING AND GHG ESTIMATES
Many of the leading French corporations manufac-turing military technologies publish data on their GHG emissions in some detail. Table 3.3 summarises data for five of the largest companies: Thales, Airbus, Naval Group, Safran, and Dassault Aviation.
Using data on total GHG emissions for each company, the proportion of company sales that are military, and the proportion of employees based in France, we have estimated both the total GHG emissions for their operations based in France, and figures for GHG emissions per employee. Only emissions classified as scope 1 (direct emissions from company sites or equipment) and scope 2 (emissions that occur elsewhere resulting from electricity and heat used by the company) are included. These figures show Airbus with the largest military-related GHG emis-sions. Across companies, they also show marked variation in GHG emissions per employee.
Table 3.3 – GHG emissions and other key data for leading French military technology companies, 201967
Company / Parent countryFrench employees
(military sales only) % military salesFrench military GHG emissions (ktCO2e)a
GHG emissions intensity (tCO2e per employee)a
Thales / France 17,656 45% 49.1 2.8
Airbus / Trans-European 17,270 36% 125.7 7.3
Naval Group / France 11,653 100% 22.3 1.9
Safran / France 7,232 16% 45.9 6.4
Dassault Aviation / France 6,773 70% 50.2 7.4
Totalsb 60,600 293 4.8c
a Scopes 1 and 2 only.b Figures have been rounded.c Weighted average (mean).
Under the radar: The Carbon Footprint of Europe’s military sectors | 19
Reasons for this include: • Different levels of coverage of GHG emissions
reporting. For example, some companies do not have energy data for all of their sites, resulting in under-reporting of their total emissions.
• The proportion of company operations that take place in France. Since France has especially low GHG emissions per unit of electricity (due to its high level of nuclear and renewables), operations requiring high electricity usage tend to be lower in carbon than elsewhere in Europe. If a high proportion of a company’s operations take place in France, this is likely to bring the average reported level of emissions down.
• A concentration of high GHG emissions activities within the corporation’s sites. For example, a company that carries out a lot of aircraft flight testing will have significantly higher GHG emissions.
The average GHG emissions per employee in France – 4.8 tCO2e – is much lower than that found in a similar study of the UK – 10.7 tCO2e.68 While lower emissions for national grid electricity would be one reason for the difference, it is unlikely to be the full explanation. Another reason could be lower coverage of company sites within emissions reporting.
Some leading military technology companies that operate large facilities in France do not publicly publish in-depth data on their GHG emissions. Two companies that we looked to examine were MBDA,69 and Nexter,70 but neither responded to our requests for such data.
We have used the weighted average of GHG emis-sions per employee from Table 3.3 to estimate emissions for the military technology sector in France as a whole – as shown in Table 3.4. By multiplying this by the estimated number of employees in the sector, we calculate the total emissions (scopes 1 and 2) to be approximately 799,000 tCO2e.
An estimate for the carbon footprint for the military technology sector is also given in Table 3.4. This estimate uses data from Thales, which has estimated the carbon footprint of the whole company.71 It is rare for a company operating in this sector to calculate such an estimate, and they deserve credit for their openness. Using their figures, we estimate the carbon footprint per employee to be 31.6 tCO2e, which is well over six times the level for direct emissions, demonstrating the carbon intensive nature of the
68 SGR (2020). Op. cit.69 MBDA Missile Systems website, https://www.mbda-systems.com/ 70 Nexter website, https://www.nexter-group.fr/en 71 p.134 of: Thales (2019). Universal Registration Document (including the Annual Financial Report) 2019, https://www.thalesgroup.com/en/investors 72 p.27 of: European Parliament (2013). The development of a European defence technological and industrial base. Directorate-General for External Policies, https://ec.europa.eu/
growth/sectors/defence_en
industry and its supply chain. As such, we estimate the carbon footprint for the entire industry to be more than 5.2 million tCO2e.
Table 3.4 – Estimates for GHG emissions for French military technology industry as a whole, 2019
French employees72
French military GHG emissions
(ktCO2e)
GHG emissions intensity
(tCO2e per employee)
Scopes 1+2165,000
799 4.8
Carbon footprint 5,206 31.6
ESTIMATE OF TOTAL MILITARY GHG EMISSIONS
As discussed earlier, there are a number of ways to estimate the total GHG emissions of a nation’s military industrial sectors, including the armed forces, military technology industry, and other relevant emissions. As shown in Table 3.5, for territorial (production-based) emissions, this means adding together the scope 1 and 2 emissions of the military (stationary and mobile sectors) and the military technology industry, together with an estimate for other within-country supply chain emissions. This latter figure is hard to estimate and – as discussed in section 1.5 – we have used a scaling factor derived from SGR’s previous research to give an estimate. This gives a total estimate of 4.6 million tCO2e.
Table 3.5 – Territorial GHG emissions of the French military, 2019
GHG emissions (ktCO2e)
Armed forces (see section 3.2) - Stationary - Mobile
4552,226
Military technology industry (see section 3.3) 799
Other within-country supply chain emissions (see section 1.5) 1,078
Total 4,558
For the carbon footprint (consumption-based emis-sions), we have used a scaling factor based on a li-fecycle assessment of a European military (see section 1.5) to give an estimate of the indirect emissions and thus an overall total. Thus, we estimate the carbon
20 | Under the radar: The Carbon Footprint of Europe’s military sectors
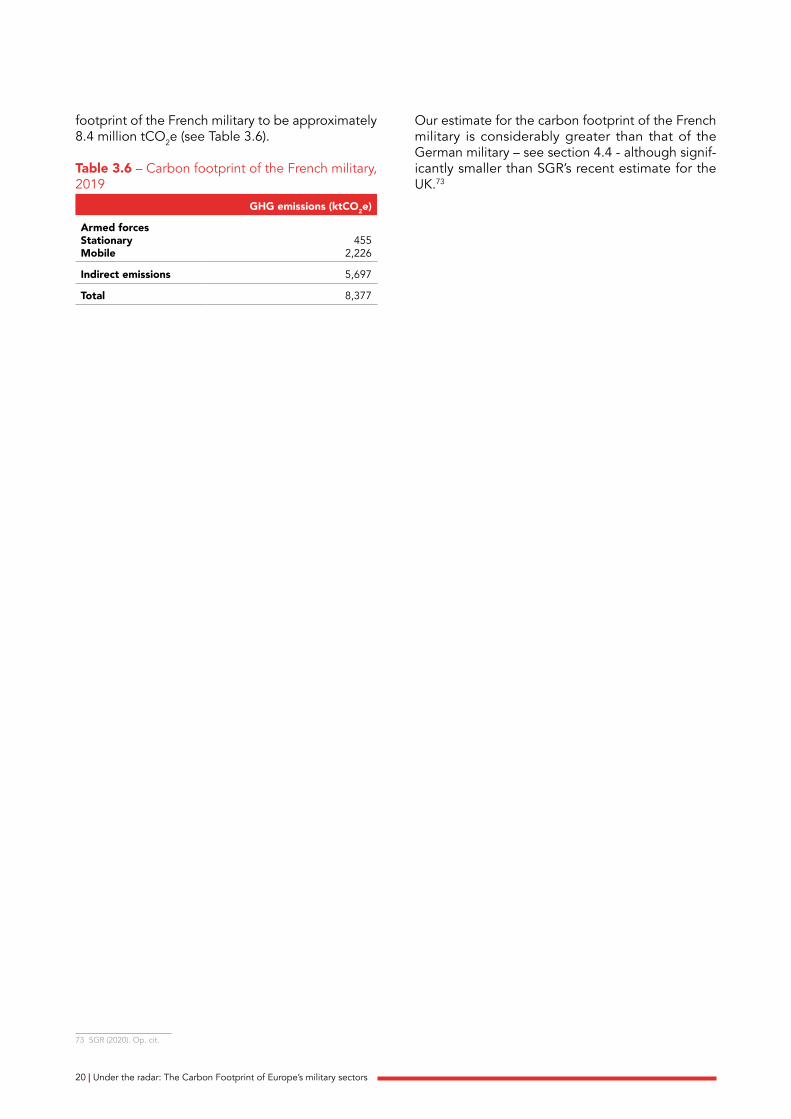
footprint of the French military to be approximately 8.4 million tCO2e (see Table 3.6).
Table 3.6 – Carbon footprint of the French military, 2019
GHG emissions (ktCO2e)
Armed forcesStationaryMobile
4552,226
Indirect emissions 5,697
Total 8,377
73 SGR (2020). Op. cit.
Our estimate for the carbon footprint of the French military is considerably greater than that of the German military – see section 4.4 - although signif-icantly smaller than SGR’s recent estimate for the UK.73
Under the radar: The Carbon Footprint of Europe’s military sectors | 21
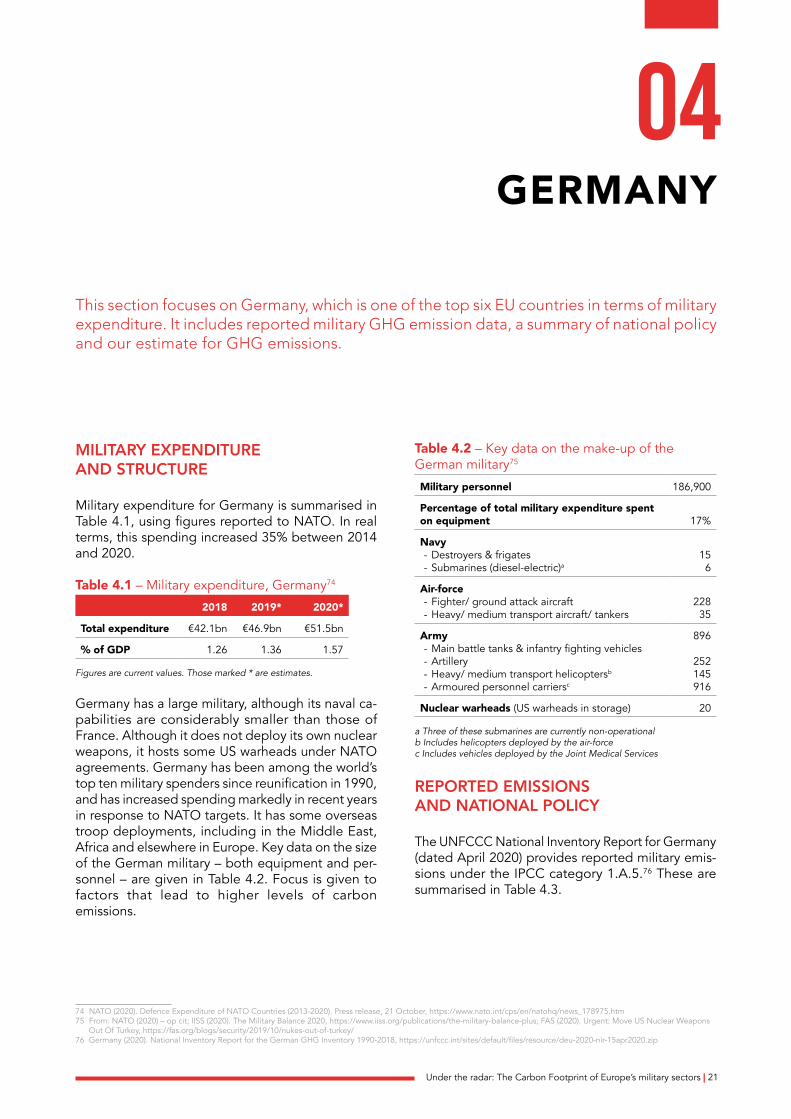
MILITARY EXPENDITURE AND STRUCTURE
Military expenditure for Germany is summarised in Table 4.1, using figures reported to NATO. In real terms, this spending increased 35% between 2014 and 2020.
Table 4.1 – Military expenditure, Germany74
2018 2019* 2020*
Total expenditure €42.1bn €46.9bn €51.5bn
% of GDP 1.26 1.36 1.57
Figures are current values. Those marked * are estimates.
Germany has a large military, although its naval ca-pabilities are considerably smaller than those of France. Although it does not deploy its own nuclear weapons, it hosts some US warheads under NATO agreements. Germany has been among the world’s top ten military spenders since reunification in 1990, and has increased spending markedly in recent years in response to NATO targets. It has some overseas troop deployments, including in the Middle East, Africa and elsewhere in Europe. Key data on the size of the German military – both equipment and per-sonnel – are given in Table 4.2. Focus is given to factors that lead to higher levels of carbon emissions.
74 NATO (2020). Defence Expenditure of NATO Countries (2013-2020). Press release, 21 October, https://www.nato.int/cps/en/natohq/news_178975.htm 75 From: NATO (2020) – op cit; IISS (2020). The Military Balance 2020, https://www.iiss.org/publications/the-military-balance-plus; FAS (2020). Urgent: Move US Nuclear Weapons
Out Of Turkey, https://fas.org/blogs/security/2019/10/nukes-out-of-turkey/ 76 Germany (2020). National Inventory Report for the German GHG Inventory 1990-2018, https://unfccc.int/sites/default/files/resource/deu-2020-nir-15apr2020.zip
Table 4.2 – Key data on the make-up of the German military75
Military personnel 186,900
Percentage of total military expenditure spent on equipment 17%
Navy - Destroyers & frigates - Submarines (diesel-electric)a
156
Air-force - Fighter/ ground attack aircraft - Heavy/ medium transport aircraft/ tankers
22835
Army - Main battle tanks & infantry fighting vehicles - Artillery - Heavy/ medium transport helicoptersb
- Armoured personnel carriersc
896
252145916
Nuclear warheads (US warheads in storage) 20
a Three of these submarines are currently non-operationalb Includes helicopters deployed by the air-forcec Includes vehicles deployed by the Joint Medical Services
REPORTED EMISSIONS AND NATIONAL POLICY
The UNFCCC National Inventory Report for Germany (dated April 2020) provides reported military emis-sions under the IPCC category 1.A.5.76 These are summarised in Table 4.3.
04GERMANY
This section focuses on Germany, which is one of the top six EU countries in terms of military expenditure. It includes reported military GHG emission data, a summary of national policy and our estimate for GHG emissions.

22 | Under the radar: The Carbon Footprint of Europe’s military sectors
Table 4.3 – Summary of military emissions given in UNFCCC NIR, Germany
IPCC category 2018 CO2 (kt)
1.A.5a Stationary 444
1.A.5b Mobile 304
1.A.5 Total 748
Germany’s Integrated National Energy and Climate Plan includes the Federal Ministry of Defence as one of the key implementation authorities in the role that federal buildings (under a voluntary commitment) can serve in energy efficiency and sustainable con-struction.77 The German armed forces issued a concept to optimise energy supply in static field accommodation in 2017, which lists measures to limit primary energy and water demands in operational infrastructure and camps.78 Carbon reduction or ef-ficiency targets are not included but requirements for documenting monitoring results in a report on energy and utility supply are set out. The Federal Ministry of Defence and German Armed Forces Sustainability Report,79 which includes reporting of CO2 emissions based on military transport (land, air and sea) and energy use in military property (see Table 4.4) states that military fuel data has been recorded since 2005. The report does not include CO2 emissions associated with the supply or produc-tion of armaments and equipment. The figures are considerably higher than those reported in the UNFCCC for 2018 under IPCC category 1.A.5. This discrepancy may be because the UNFCCC report excludes GHG emissions from international missions by the German armed forces, under NATO or UN mandates.
77 Integrated National Energy and Climate Plan (undated), https://ec.europa.eu/energy/sites/ener/files/documents/de_final_necp_main_en.pdf 78 Federal Office of Bundeswehr Infrastructure (2017). Increasing the Security of Supply by Optimising the Energy and Utility Supply in Static Field Accommodations, https://
natolibguides.info/ld.php?content_id=31493728 79 Federal Ministry of Defence (2020). Sustainability Report 2020 - reporting period 2018-2019, https://www.bmvg.de/resource/blob/3744490/
fb034ba5fc1c8148bb103bb04ae928e5/Nachhaltigkeitsbericht_2020_BMVg.pdf 80 A list of references for this data can be found in section 12
Table 4.4 – Summary of reported CO2 emissions for the German Armed Forces
CO2 emissions – kt
2018 2019
Military estate (electricity and heat) 1030 820
Military transport (land, air, sea) 680 630
Total 1710 1450
In Germany, the Climate Protection Act, the Climate Protection Programme 2030 and other national strategies (such as the National Hydrogen Strategy) are intended to secure carbon reduction goals. The Climate Protection Act sets greenhouse gas reduction targets of at least 35% by 2020 and 55% by 2030, compared with 1990 levels. The 2020 sustainability report indicates that the Federal Ministry of Defence will need to achieve around 40% overall reductions over the next ten years but also gives an ambitious objective to achieve carbon neutrality by 2023 through its ‘roadmap’ to avoid, reduce and compen-sate for GHG emissions. This suggests that carbon offsetting is planned where reductions cannot be made but no detail is provided on the criteria or offsetting proposals.
IN-COUNTRY MILITARY TECHNOLOGY INDUSTRY - CORPORATE GHG REPORTING AND GHG ESTIMATES
Some of the leading corporations manufacturing military technologies within Germany publish detailed data on their GHG emissions. Table 4.5 summarises data for five of the largest companies: Airbus, Rheinmetall, Thales, Raytheon, and Northrop Grumman.
Table 4.5 – Carbon emissions and other key data for leading German military technology companies, 201980
Company / Parent countryGerman employees (military sales only) % military sales
German military GHG emissions (ktCO2e)a
GHG emissions intensity (tCO2e per employee)a
Airbus / Trans-European 15,329 36% 111.6 7.3
Rheinmetall / Germany 6,373 55% 95.1 14.9
Thales/ France 1,648 45% 4.6 2.8
Raytheon / USA 752 94% 4.6 5.8
Northrop Grumman / USA 423 85% 2.3 5.4
Totalb 24,500 218 8.9c
a Scopes 1 and 2 onlyb Figures have been roundedc Weighted average (mean)

Under the radar: The Carbon Footprint of Europe’s military sectors | 23
Using data on total GHG emissions for each company, the proportion of company sales that are military, and the proportion of employees based in Germany, we have estimated the total GHG emissions for their operations based in Germany and GHG emissions per employee. Only emissions classified as scope 1 (direct emissions from company sites or equipment) and scope 2 (emissions that occur elsewhere resulting from electricity and heat used by the company) are included.
These figures show Airbus with the largest military-re-lated GHG emissions within Germany. Across com-panies, they also show marked variation in GHG emissions per employee – for the reasons discussed in section 3.3. There was less openness about GHG emissions data among the leading military technology companies that operate large facilities in Germany than those in France. For example, four other com-panies that we examined in this study were Hensoldt,81 KMW,82 Diehl Group,83 and MBDA.84 None of them publicly published GHG emissions data in any detail, and none provided any data in response to requests from us. This lack of openness may be a reason why the figure for average German GHG emissions per employee – 8.9 tCO2e – was lower than that for the UK – 10.7 tCO2e – despite the UK having, for example, significantly lower emissions per unit of grid electricity.
We have used the weighted average of GHG emis-sions per employee from Table 4.5 to estimate emissions for the military technology sector in Germany as a whole – as shown in Table 4.6. By multiplying this by the number of employees in the sector, we estimate the total emissions (scopes 1 and 2) to be approximately 711,000 tCO2e. This is less than that in France, but the difference is not as high as would be expected from a sector of about half the size. A key reason for this seems to be that Germany’s electricity sector has a higher GHG emissions intensity than that of France.85
An estimate for the carbon footprint for the military technology sector as a whole is also given in Table 4.6. This estimate uses data from Fincantieri, which has estimated the carbon footprint of the whole company.86 Although this company is Italian (see section 5.3), there are broad similarities between these international supply chains. Using their figures, we estimate the carbon footprint per employee to
81 Hensoldt website, https://www.hensoldt.net/ 82 KMW website, https://www.kmweg.com/ 83 Diehl website, https://www.diehl.com/group/en/84 MBDA website, https://www.mbda-systems.com/85 For example, the GHG emissions intensity of Germany was 441 gCO2/kWh in 2016 whereas France’s was only 59 gCO2/kWh. European Environment Agency (2018). Data and
maps: CO2 emissions intensity: for electricity generation: by member state, https://www.eea.europa.eu/data-and-maps/daviz/co2-emission-intensity-5 86 Fincantieri (2020). Environmental aspects: Greenhouse gas emissions, 2019, https://www.fincantieri.com/en/sustainability/environmental/environmental-aspects/ 87 p.27 of: European Parliament (2013). The development of a European defence technological and industrial base. Directorate-General for External Policies, https://ec.europa.eu/
growth/sectors/defence_en
be 42.7 tCO2e, which is nearly five times the level for direct emissions, demonstrating the carbon in-tensive nature of the industry and its supply chain. As such, we estimate the carbon footprint for the entire industry to be more than 3.4 million tCO2e.
Table 4.6 – Estimates for carbon emissions for German military technology industry as a whole, 2019
German employees87
German military
GHG emissions (ktCO2e)
GHG emissions intensity
(tCO2e per employee)
Scopes 1+280,000
711 8.9
Carbon footprint 3,416 42.7
ESTIMATE OF TOTAL MILITARY GHG EMISSIONS
To estimate the territorial (production-based) emis-sions of the German military sectors, we have added the scope 1 and 2 emissions of the military (stationary and mobile sectors) and the military technology in-dustry, together with an estimate for other with-in-country supply chain emissions – as shown in Table 4.7. The gives a total estimate of 3.1 million tCO2e.
Table 4.7 – Territorial GHG emissions of the German military, 2019
GHG emissions (ktCO2e)
Armed forces (see section 4.2) - Stationary - Mobile
820630
Military technology industry (see section 4.3) 711
Other within-country supply chain emissions (see section 1.5) 959
Total 3,120
For the carbon footprint (consumption-based emis-sions), we have used a scaling factor based on a li-fecycle assessment of a European military (see section 1.5), to give an estimate of the indirect emissions and thus an overall total. Thus, we estimate the

24 | Under the radar: The Carbon Footprint of Europe’s military sectors
carbon footprint of the German military to be ap-proximately 4.5 million tCO2e, as shown in Table 4.8.
Table 4.8 – Carbon footprint of the German military, 2019
GHG emissions (ktCO2e)
Armed forces - Stationary - Mobile
820630
Indirect emissions 3,081
Total 4,531
Comparing Germany’s figures with those of the other large EU military sector – in France – we can make two key observations: • Germany has significantly higher GHG emissions
associated with military bases (due to, for example, it’s much more carbon intensive electricity supply).
• France has considerably higher emissions associ-ated with its ‘mobile activities’ – especially its air force and navy – due to its larger size and levels of overseas deployment.
Overall, the military carbon footprint estimated for France is nearly double that of Germany, despite their levels of military spending being comparable. However, uncertainties in data mean that such ob-servations need to be treated with some caution.

Under the radar: The Carbon Footprint of Europe’s military sectors | 25
MILITARY EXPENDITURE AND STRUCTURE
Military expenditure for Italy is summarised in Table 5.1, using figures reported to NATO. In real terms, this spending increased 17% between 2014 and 2020.
Table 5.1 – Military expenditure, Italy88
2018 2019* 2020*
Total expenditure €21.7bn €21.0bn €22.8bn
% of GDP 1.23 1.18 1.43
Figures are current values. Those marked * are estimates.
Like Germany, Italy hosts US nuclear warheads under NATO agreements. Italy is currently among the world’s top 15 military spenders, and has increased spending in recent years in response to NATO targets, especially on its navy. It has some overseas troop deployments, including in the Middle East, Africa and elsewhere in Europe. The latest data summarising the size of the Italian military – both equipment and personnel – are given in Table 5.2. Focus is given to factors that lead to higher levels of carbon emissions.
88 NATO (2020). Defence Expenditure of NATO Countries (2013-2020). Press release, 21 October, https://www.nato.int/cps/en/natohq/news_178975.htm
89 From: NATO (2020) – op cit; IISS (2020). The Military Balance 2020, https://www.iiss.org/publications/the-military-balance-plus; FAS (2020). Urgent: Move US Nuclear Weapons Out Of Turkey, https://fas.org/blogs/security/2019/10/nukes-out-of-turkey/
90 Italy (2020). National Inventory Report 2020. Italian GHG Inventory 1990-2018 https://unfccc.int/sites/default/files/resource/ita-2020-nir-12apr20.zip
Table 5.2 – Key data on the make-up of the Italian military89
Military personnel 175,500
Percentage of total military expenditure spent on equipment 25%
Navy - Aircraft carriers - Destroyers & frigates - Submarines (diesel-electric)
2178
Air-force - Fighter/ ground attack aircrafta
- Heavy/ medium transport aircraft/ tankers21036
Army - Main battle tanks & infantry fighting vehicles - Artillery - Heavy/ medium transport helicoptersb
- Armoured personnel carriersc
63294067
855
Nuclear warheads (US warheads in storage) 40
a Includes aircraft deployed by the navyb Includes helicopters deployed by the air-force and navyc Includes vehicles deployed by the marines
REPORTED EMISSIONS AND NATIONAL POLICY
The UNFCCC National Inventory Report for Italy provides reported military emissions under the IPCC category 1.A.5 from military mobile activities.90 These are summarised in Table 5.3. No specific figures are given for GHG emissions from military bases, which is a concerning omission.
05ITALY
This section focuses on Italy, which is one of the top six EU countries in terms of military expenditure. It includes reported military GHG emission data, a summary of national policy and our estimate for GHG emissions.

26 | Under the radar: The Carbon Footprint of Europe’s military sectors
Table 5.3 – Summary of military emissions given in UNFCCC NIR, Italy
IPCC category 2018 CO2 (kt)
1.A.5a Stationary -
1.A.5b Mobile 341
1.A.5 Total 341
Italy’s Integrated National Energy and Climate Plan (dated December 2019) makes no specific reference to the military. The Ministry of Defence has produced guidelines for energy saving and energy reduction of its buildings and systems,91 and the policy directive on energy efficiency of military infrastructure includes short, medium and long activities objectives.92 The Project Energy has been active since 2015,93 with the aim of improving the energy efficiency of defence sites. The Defence Energy Strategy Plan,94 and the Joint Force Directive,95 were both issued in 2019, and include commitments to improve the energy efficiency of buildings, replace fossil fuels with re-newable energies and gradually reduce GHG emissions. This also covers the sustainable procure-ment of good and services, with a requirement to incorporate environmental information in technical specifications, and award selection based on low environmental impact as well as cost. The directive also advocates the use of life-cycle analysis during the planning of activities, works and supplies to manage their environmental impacts.
91 Ministry of Defence, Italy (2012). Guidelines for energy saving, energy reduction and optimisation […] of the Technical-Administrative Area of the Ministry of Defence, https://www.difesa.it/Amministrazionetrasparente/segredifesa/Documents/LineeGuidaRisparmioEnergetico.pdf
92 Defence Staff (2014). Department - Logistics and Infrastructure. Policy Directive for Energy Efficiency of the Military Infrastructure, https://www.difesa.it/Amministrazionetrasparente/SMD/Documents/Informazioni_Ambientali_Riferimenti_Normativi/Direttiva_di_policy_per_l_efficientamento_energetico_delle_infrastrutture_militari_Edizione_Marzo_2014.pdf
93 Ministry of Defence, Project Energy website, https://www.difesa.it/Content/Struttura_progetto_energia/Pagine/default.aspx 94 Defence Staff (2019a) Defence Energy Plan https://www.difesa.it/Content/Struttura_progetto_energia/Documents/Piano_SED_2019.pdf 95 Defence Staff (2019b) Joint Force Directive Environmental Protection in Defence https://www.difesa.it/Amministrazionetrasparente/SMD/Documents/Informazioni_Ambientali_
Riferimenti_Normativi/UGPREVATA_A_001_Ediz._2019_LA_TUTELA_AMBIENTALE_NELLA_DIFESA.pdf 96 Ministry of Defence (2020a) Performance Plan 2020-2022, https://www.difesa.it/Amministrazionetrasparente/SMD/Documents/Piano_performance/Piano_
Perfomance_2020_2022.pdf97 Ministry of Defence (2020b) Performance report 2019, https://www.difesa.it/Amministrazionetrasparente/SMD/Documents/Relazione_Performance/Relazione_sulla_
Perfomance_2019.pdf 98 A list of references for this data can be found in section 12
The purpose of the Ministry of Defence Performance Plan,96 is to set out objectives and indicators for measuring performance over the three-year period but it does not explicitly refer to targets for GHG emission reductions or reporting requirements; and the latest Performance Report does not include energy efficiency, fuel use or GHG emissions.97 We could not readily find reported GHG emissions through the Ministry of Defence website.
IN-COUNTRY MILITARY TECHNOLOGY INDUSTRY - CORPORATE GHG REPORTING AND GHG ESTIMATES
Some of the leading corporations manufacturing military technologies in Italy publish detailed data on their GHG emissions. Table 5.4 summarises data for four key companies, Leonardo, Fincantieri, Thales, and Northrop Grumman. Using data on total GHG emissions for each company, the proportion of company sales that are military, and the proportion of employees based in Italy, we have estimated both the total GHG emissions for their operations based in Italy, and figures for GHG emissions per employee. Only emissions classified as scope 1 (direct emissions from company sites or equipment) and scope 2 (emissions that occur elsewhere resulting from electricity and heat used by the company) are included.
Table 5.4 – Carbon emissions and other key data for leading Italian military technology companies, 201998
Company / Parent countryItalian employees
(military sales only) % military salesItalian military GHG emissions (ktCO2e)a
GHG emissions intensity (tCO2e per employee)a
Leonardo / Italy 22,454 72% 183.3 8.2
Fincantieri / Italy 2,313 26% 20.1 8.7
Thales / France 1,254 45% 3.5 2.8
Northrop Grumman / USA 169 85% 0.9 5.4
Totalb 26,200 208 7.9c
a Scopes 1 and 2 onlyb Figures have been roundedc Weighted average (mean)

Under the radar: The Carbon Footprint of Europe’s military sectors | 27
These figures show Leonardo to have the largest military-related GHG emissions within Italy. Across companies, we again see marked variation in GHG emissions per employee – for the reasons discussed in section 3.3.
We have used the weighted average of GHG emis-sions per employee from Table 5.4 as the basis of an estimate for the military technology sector in Italy as a whole – as shown in Table 5.5. By multiplying this by the number of employees in the military technology sector, we estimate the total emissions (scopes 1 and 2) to be approximately 492,000 tCO2e.
An estimate for the carbon footprint for the sector as a whole is also given in Table 5.5. This estimate uses data from Fincantieri, which has estimated the carbon footprint of the whole company.99 It is rare for a company operating in this sector to calculate such an estimate, and they deserve credit for their openness. Using their figures, we calculate the carbon footprint per employee to be 42.7 tCO2e which is more than five times the level for direct emissions, demonstrating the carbon intensive nature of the industry and its supply chain. As such, we estimate the carbon footprint for the entire industry to be more than 2.6 million tCO2e.
Table 5.5 – Estimates for carbon emissions for Italian military technology industry as a whole, 2019
Italian employees100
Italian military
GHG emissions (ktCO2e)
GHG emissions intensity
(tCO2e per employee)
Scopes 1+262,000
492 7.9
Carbon footprint 2,647 42.7
ESTIMATE OF TOTAL MILITARY GHG EMISSIONS
To estimate the territorial (production-based) emis-sions of the Italian military sectors, bearing in mind the major data gaps, we have assumed that the nation’s military bases have similar total emissions to its mobile sector – i.e. they lie somewhere between the situations in France and Germany. By adding the scope 1 and 2 emissions of the military technology industry, together with an estimate for other with-in-country supply chain emissions, we get an estimate of 1.8 million tCO2e (see Table 5.6). We regard this
99 Fincantieri (2020). Environmental aspects: Greenhouse gas emissions, 2019.https://www.fincantieri.com/en/sustainability/environmental/environmental-aspects/ 100 p.27 of: European Parliament (2013). The development of a European defence technological and industrial base. Directorate-General for External Policies, https://
ec.europa.eu/growth/sectors/defence_en
as a very conservative estimate as it is based on figures for the military submitted to the UNFCCC, which tend to be under-reported.
Table 5.6 – Territorial GHG emissions of the Italy military, 2018/19
GHG emissions (ktCO2e)
Armed forces (see section 5.2) - Stationary - Mobile
341341
Military technology industry (see section 5.3) 492
Other within-country supply chain emissions (see section 1.5) 664
Total 1,838
For the carbon footprint (consumption-based emis-sions), we have used a scaling factor based on a li-fecycle assessment of a European military (see section 1.5), to give an estimate of the indirect emissions and thus an overall total. Thus, we estimate the carbon footprint of the Italian military to be at least 2.1 million tCO2e, as shown in Table 5.7.
Table 5.7 – Carbon footprint of the Italian military, 2018/19
GHG emissions (ktCO2e)
Armed forces - Stationary - Mobile
341341
Indirect emissions 1,449
Total 2,131

28 | Under the radar: The Carbon Footprint of Europe’s military sectors

Under the radar: The Carbon Footprint of Europe’s military sectors | 29
MILITARY EXPENDITURE AND STRUCTURE
Military expenditure for the Netherlands is summa-rised in Table 6.1, using figures reported to NATO. In real terms, this spending increased 32% between 2014 and 2020.
Table 6.1 – Military expenditure, the Netherlands101
2018 2019* 2020*
Total expenditure €9.5bn €11.0bn €11.1bn
% of GDP 1.21 1.36 1.48
Figures are current values. Those marked * are estimates.
The Netherlands is the smallest nation considered in detail in this study. Although its military has only about 20% of the personnel and equipment of France, its capabilities are relatively extensive. Also, like Germany and Italy, it hosts some US nuclear warheads under NATO agreements. Military spending has increased markedly in recent years in response to NATO targets. It has some overseas troop deploy-ments, including in the Middle East, Africa and elsewhere in Europe. The latest data summarising the size of the Dutch military – both equipment and personnel – are given in Table 6.2. Focus is given to factors that lead to higher levels of carbon emissions.
101 NATO (2020). Defence Expenditure of NATO Countries (2013-2020). Press release, 21 October, https://www.nato.int/cps/en/natohq/news_178975.htm
102 From: NATO (2020) – op cit; IISS (2020). The Military Balance 2020, https://www.iiss.org/publications/the-military-balance-plus; FAS (2020). Urgent: Move US Nuclear Weapons Out Of Turkey, https://fas.org/blogs/security/2019/10/nukes-out-of-turkey
103 Netherlands (2020). National Inventory Report 2020. Greenhouse gas emissions in the Netherlands 1990-2018, https://unfccc.int/sites/default/files/resource/nld-2020-nir-15apr20.zip
Table 6.2 – Key data on the make-up of the Dutch military102
Military personnel 40,000
Percentage of total military expenditure spent on equipment 23%
Navy - Destroyers & frigates - Submarines (diesel-electric)
64
Air-force - Fighter/ ground attack aircraft - Heavy/ medium transport aircraft/ tankers
706
Army - Infantry fighting vehicles - Artillery - Heavy/ medium transport helicopters - Armoured personnel carriersa
11711933
376
Nuclear warheads (US warheads in storage) 20
a Includes vehicles deployed by the marines and military police
REPORTED EMISSIONS AND NATIONAL POLICY
The UNFCCC National Inventory Report for the Netherlands provides reported military emissions under the IPCC category 1.A.5.103 These are summa-rised in Table 6.3.
06THE NETHERLANDS
This section focuses on the Netherlands, which is one of the top six EU countries in terms of military expenditure. It includes reported military GHG emission data, a summary of national policy and our estimate for GHG emissions.
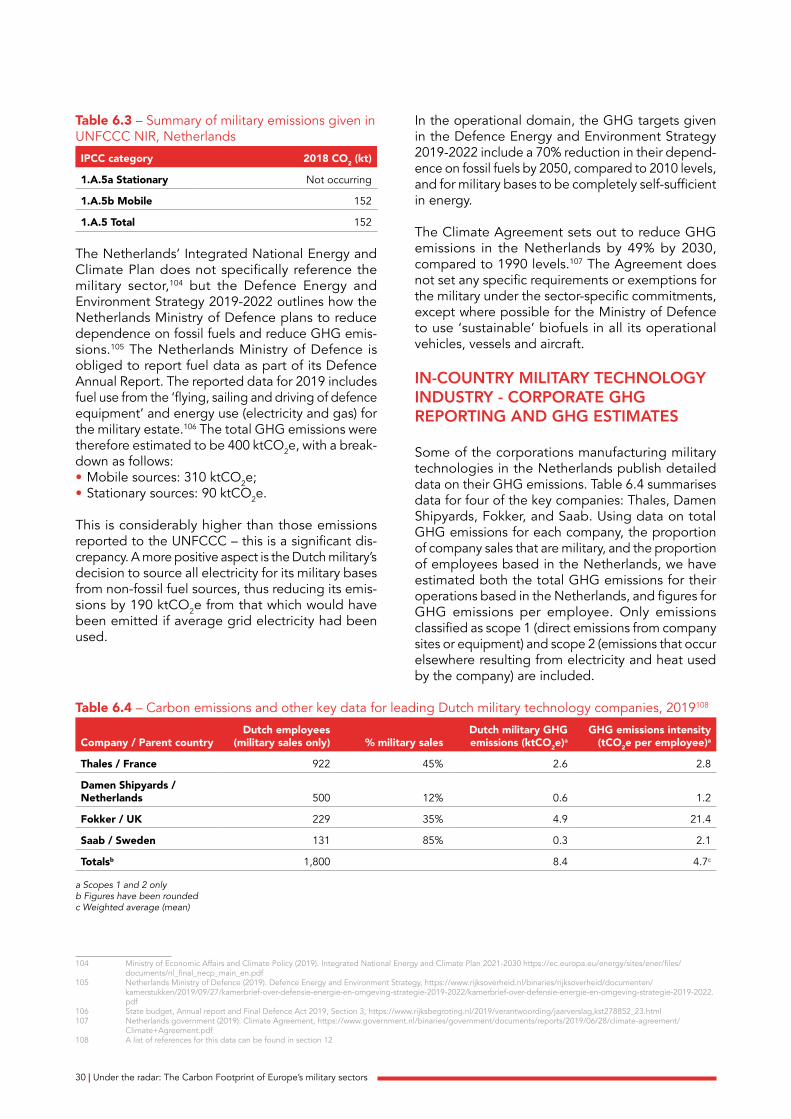
30 | Under the radar: The Carbon Footprint of Europe’s military sectors
Table 6.3 – Summary of military emissions given in UNFCCC NIR, Netherlands
IPCC category 2018 CO2 (kt)
1.A.5a Stationary Not occurring
1.A.5b Mobile 152
1.A.5 Total 152
The Netherlands’ Integrated National Energy and Climate Plan does not specifically reference the military sector,104 but the Defence Energy and Environment Strategy 2019-2022 outlines how the Netherlands Ministry of Defence plans to reduce dependence on fossil fuels and reduce GHG emis-sions.105 The Netherlands Ministry of Defence is obliged to report fuel data as part of its Defence Annual Report. The reported data for 2019 includes fuel use from the ‘flying, sailing and driving of defence equipment’ and energy use (electricity and gas) for the military estate.106 The total GHG emissions were therefore estimated to be 400 ktCO2e, with a break-down as follows:• Mobile sources: 310 ktCO2e;• Stationary sources: 90 ktCO2e.
This is considerably higher than those emissions reported to the UNFCCC – this is a significant dis-crepancy. A more positive aspect is the Dutch military’s decision to source all electricity for its military bases from non-fossil fuel sources, thus reducing its emis-sions by 190 ktCO2e from that which would have been emitted if average grid electricity had been used.
104 Ministry of Economic Affairs and Climate Policy (2019). Integrated National Energy and Climate Plan 2021-2030 https://ec.europa.eu/energy/sites/ener/files/documents/nl_final_necp_main_en.pdf
105 Netherlands Ministry of Defence (2019). Defence Energy and Environment Strategy, https://www.rijksoverheid.nl/binaries/rijksoverheid/documenten/kamerstukken/2019/09/27/kamerbrief-over-defensie-energie-en-omgeving-strategie-2019-2022/kamerbrief-over-defensie-energie-en-omgeving-strategie-2019-2022.pdf
106 State budget, Annual report and Final Defence Act 2019, Section 3, https://www.rijksbegroting.nl/2019/verantwoording/jaarverslag,kst278852_23.html 107 Netherlands government (2019). Climate Agreement, https://www.government.nl/binaries/government/documents/reports/2019/06/28/climate-agreement/
Climate+Agreement.pdf 108 A list of references for this data can be found in section 12
In the operational domain, the GHG targets given in the Defence Energy and Environment Strategy 2019-2022 include a 70% reduction in their depend-ence on fossil fuels by 2050, compared to 2010 levels, and for military bases to be completely self-sufficient in energy.
The Climate Agreement sets out to reduce GHG emissions in the Netherlands by 49% by 2030, compared to 1990 levels.107 The Agreement does not set any specific requirements or exemptions for the military under the sector-specific commitments, except where possible for the Ministry of Defence to use ‘sustainable’ biofuels in all its operational vehicles, vessels and aircraft.
IN-COUNTRY MILITARY TECHNOLOGY INDUSTRY - CORPORATE GHG REPORTING AND GHG ESTIMATES
Some of the corporations manufacturing military technologies in the Netherlands publish detailed data on their GHG emissions. Table 6.4 summarises data for four of the key companies: Thales, Damen Shipyards, Fokker, and Saab. Using data on total GHG emissions for each company, the proportion of company sales that are military, and the proportion of employees based in the Netherlands, we have estimated both the total GHG emissions for their operations based in the Netherlands, and figures for GHG emissions per employee. Only emissions classified as scope 1 (direct emissions from company sites or equipment) and scope 2 (emissions that occur elsewhere resulting from electricity and heat used by the company) are included.
Table 6.4 – Carbon emissions and other key data for leading Dutch military technology companies, 2019108
Company / Parent countryDutch employees
(military sales only) % military salesDutch military GHG emissions (ktCO2e)a
GHG emissions intensity (tCO2e per employee)a
Thales / France 922 45% 2.6 2.8
Damen Shipyards / Netherlands 500 12% 0.6 1.2
Fokker / UK 229 35% 4.9 21.4
Saab / Sweden 131 85% 0.3 2.1
Totalsb 1,800 8.4 4.7c
a Scopes 1 and 2 onlyb Figures have been roundedc Weighted average (mean)
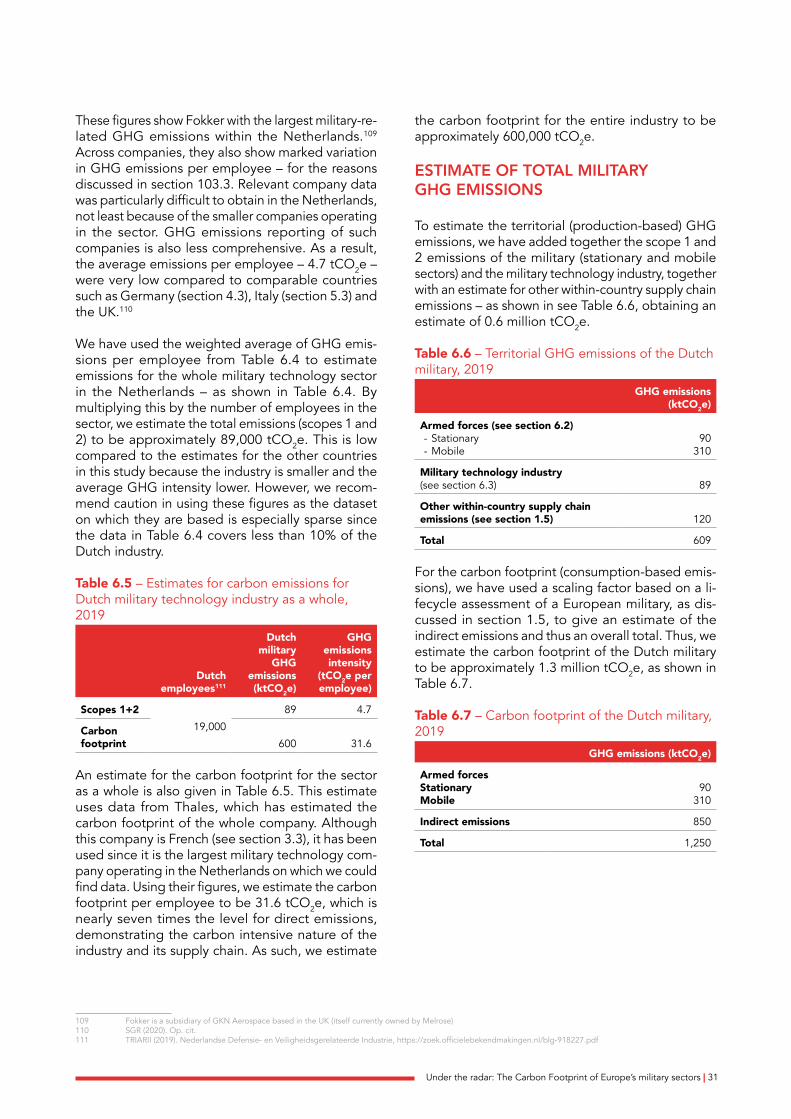
Under the radar: The Carbon Footprint of Europe’s military sectors | 31
These figures show Fokker with the largest military-re-lated GHG emissions within the Netherlands.109 Across companies, they also show marked variation in GHG emissions per employee – for the reasons discussed in section 103.3. Relevant company data was particularly difficult to obtain in the Netherlands, not least because of the smaller companies operating in the sector. GHG emissions reporting of such companies is also less comprehensive. As a result, the average emissions per employee – 4.7 tCO2e – were very low compared to comparable countries such as Germany (section 4.3), Italy (section 5.3) and the UK.110
We have used the weighted average of GHG emis-sions per employee from Table 6.4 to estimate emissions for the whole military technology sector in the Netherlands – as shown in Table 6.4. By multiplying this by the number of employees in the sector, we estimate the total emissions (scopes 1 and 2) to be approximately 89,000 tCO2e. This is low compared to the estimates for the other countries in this study because the industry is smaller and the average GHG intensity lower. However, we recom-mend caution in using these figures as the dataset on which they are based is especially sparse since the data in Table 6.4 covers less than 10% of the Dutch industry.
Table 6.5 – Estimates for carbon emissions for Dutch military technology industry as a whole, 2019
Dutch employees111
Dutch military
GHG emissions (ktCO2e)
GHG emissions intensity
(tCO2e per employee)
Scopes 1+219,000
89 4.7
Carbon footprint 600 31.6
An estimate for the carbon footprint for the sector as a whole is also given in Table 6.5. This estimate uses data from Thales, which has estimated the carbon footprint of the whole company. Although this company is French (see section 3.3), it has been used since it is the largest military technology com-pany operating in the Netherlands on which we could find data. Using their figures, we estimate the carbon footprint per employee to be 31.6 tCO2e, which is nearly seven times the level for direct emissions, demonstrating the carbon intensive nature of the industry and its supply chain. As such, we estimate
109 Fokker is a subsidiary of GKN Aerospace based in the UK (itself currently owned by Melrose) 110 SGR (2020). Op. cit.111 TRIARII (2019). Nederlandse Defensie- en Veiligheidsgerelateerde Industrie, https://zoek.officielebekendmakingen.nl/blg-918227.pdf
the carbon footprint for the entire industry to be approximately 600,000 tCO2e.
ESTIMATE OF TOTAL MILITARY GHG EMISSIONS
To estimate the territorial (production-based) GHG emissions, we have added together the scope 1 and 2 emissions of the military (stationary and mobile sectors) and the military technology industry, together with an estimate for other within-country supply chain emissions – as shown in see Table 6.6, obtaining an estimate of 0.6 million tCO2e.
Table 6.6 – Territorial GHG emissions of the Dutch military, 2019
GHG emissions (ktCO2e)
Armed forces (see section 6.2) - Stationary - Mobile
90310
Military technology industry (see section 6.3) 89
Other within-country supply chain emissions (see section 1.5) 120
Total 609
For the carbon footprint (consumption-based emis-sions), we have used a scaling factor based on a li-fecycle assessment of a European military, as dis-cussed in section 1.5, to give an estimate of the indirect emissions and thus an overall total. Thus, we estimate the carbon footprint of the Dutch military to be approximately 1.3 million tCO2e, as shown in Table 6.7.
Table 6.7 – Carbon footprint of the Dutch military, 2019
GHG emissions (ktCO2e)
Armed forcesStationaryMobile
90310
Indirect emissions 850
Total 1,250

32 | Under the radar: The Carbon Footprint of Europe’s military sectors
Under the radar: The Carbon Footprint of Europe’s military sectors | 33
POLAND07
This section focuses on Poland, which is one of the top six EU countries in terms of military expenditure. It includes details on the in-country military technology industry but no estimate of the total military GHG emissions was possible due to the lack of available data.
MILITARY EXPENDITURE AND STRUCTURE
Military expenditure for Poland is summarised in Table 7.1, using figures reported to NATO. In real terms, this spending increased 42% between 2014 and 2020.
Table 7.1 – Military expenditure, Poland112
2018 2019* 2020*
Total expenditure €9.9bn €10.7bn €11.2bn
% of GDP 2.02 2.02 2.30
Figures are current values. Those marked * are estimates.
Poland is rapidly expanding and modernising its military due to perceived security concerns about its neighbour Russia, and in response to NATO spending targets. Its army has a particularly large number of vehicles and equipment. It has some overseas troop deployments, including as part of NATO operations. The latest data summarising the size of the Polish military – both equipment and personnel – are given in Table 7.2. Focus is given to factors that lead to higher levels of carbon emissions.
112 NATO (2020). Defence Expenditure of NATO Countries (2013-2020). Press release, 21 October, https://www.nato.int/cps/en/natohq/news_178975.htm
113 From: NATO (2020) – op cit; IISS (2020). The Military Balance 2020, https://www.iiss.org/publications/the-military-balance-plus114 Poland (2020). Poland’s National Inventory Report. Greenhouse Gas Inventory for 1998-2018, https://unfccc.int/sites/default/files/resource/pol-2020-nir-15apr20.zip
Table 7.2 – Key data on the make-up of the Polish military113
Military personnel 120,000
Percentage of total military expenditure spent on equipment 26%
Navy - Destroyers & frigates - Submarines (diesel-electric)a
23
Air-force - Fighter/ ground attack aircraft - Heavy/ medium transport aircraft/ tankers
955
Army - Main battle tanks & infantry fighting vehicles - Artillery - Heavy/ medium transport helicoptersb
- Armoured personnel carriers
2,21783638
368
a One submarine is currently non-operationalb Includes helicopters deployed by the air-force
REPORTED EMISSIONS AND NATIONAL POLICY
The UNFCCC National Inventory Report for Poland stated military emissions under the IPCC category 1.A.5 as ‘not occurring’, with fuel consumption from military activities included elsewhere.114 It is therefore not possible to define reported military GHG emis-sions from the submitted UNFCCC data.
Poland’s National Energy and Climate Plan for 2021-2030 (dated December 2019) refers to the need for the military sector to support innovation in energy
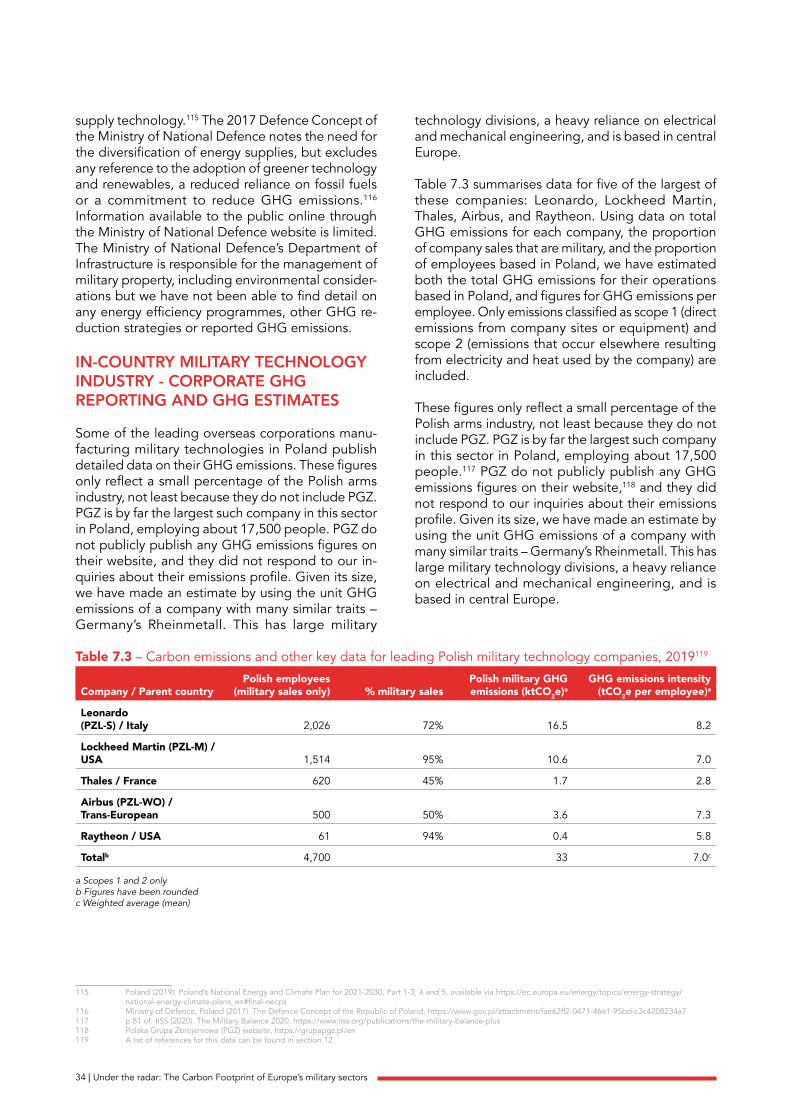
34 | Under the radar: The Carbon Footprint of Europe’s military sectors
supply technology.115 The 2017 Defence Concept of the Ministry of National Defence notes the need for the diversification of energy supplies, but excludes any reference to the adoption of greener technology and renewables, a reduced reliance on fossil fuels or a commitment to reduce GHG emissions.116 Information available to the public online through the Ministry of National Defence website is limited. The Ministry of National Defence’s Department of Infrastructure is responsible for the management of military property, including environmental consider-ations but we have not been able to find detail on any energy efficiency programmes, other GHG re-duction strategies or reported GHG emissions.
IN-COUNTRY MILITARY TECHNOLOGY INDUSTRY - CORPORATE GHG REPORTING AND GHG ESTIMATES
Some of the leading overseas corporations manu-facturing military technologies in Poland publish detailed data on their GHG emissions. These figures only reflect a small percentage of the Polish arms industry, not least because they do not include PGZ. PGZ is by far the largest such company in this sector in Poland, employing about 17,500 people. PGZ do not publicly publish any GHG emissions figures on their website, and they did not respond to our in-quiries about their emissions profile. Given its size, we have made an estimate by using the unit GHG emissions of a company with many similar traits – Germany’s Rheinmetall. This has large military
115 Poland (2019). Poland’s National Energy and Climate Plan for 2021-2030, Part 1-3, 4 and 5, available via https://ec.europa.eu/energy/topics/energy-strategy/national-energy-climate-plans_en#final-necps
116 Ministry of Defence, Poland (2017). The Defence Concept of the Republic of Poland, https://www.gov.pl/attachment/fae62ff2-0471-46e1-95bd-c3c4208234a7 117 p.81 of: IISS (2020). The Military Balance 2020, https://www.iiss.org/publications/the-military-balance-plus118 Polska Grupa Zbrojeniowa (PGZ) website, https://grupapgz.pl/en 119 A list of references for this data can be found in section 12
technology divisions, a heavy reliance on electrical and mechanical engineering, and is based in central Europe.
Table 7.3 summarises data for five of the largest of these companies: Leonardo, Lockheed Martin, Thales, Airbus, and Raytheon. Using data on total GHG emissions for each company, the proportion of company sales that are military, and the proportion of employees based in Poland, we have estimated both the total GHG emissions for their operations based in Poland, and figures for GHG emissions per employee. Only emissions classified as scope 1 (direct emissions from company sites or equipment) and scope 2 (emissions that occur elsewhere resulting from electricity and heat used by the company) are included.
These figures only reflect a small percentage of the Polish arms industry, not least because they do not include PGZ. PGZ is by far the largest such company in this sector in Poland, employing about 17,500 people.117 PGZ do not publicly publish any GHG emissions figures on their website,118 and they did not respond to our inquiries about their emissions profile. Given its size, we have made an estimate by using the unit GHG emissions of a company with many similar traits – Germany’s Rheinmetall. This has large military technology divisions, a heavy reliance on electrical and mechanical engineering, and is based in central Europe.
Table 7.3 – Carbon emissions and other key data for leading Polish military technology companies, 2019119
Company / Parent countryPolish employees
(military sales only) % military salesPolish military GHG emissions (ktCO2e)a
GHG emissions intensity (tCO2e per employee)a
Leonardo (PZL-S) / Italy 2,026 72% 16.5 8.2
Lockheed Martin (PZL-M) / USA 1,514 95% 10.6 7.0
Thales / France 620 45% 1.7 2.8
Airbus (PZL-WO) / Trans-European 500 50% 3.6 7.3
Raytheon / USA 61 94% 0.4 5.8
Totalb 4,700 33 7.0c
a Scopes 1 and 2 onlyb Figures have been roundedc Weighted average (mean)
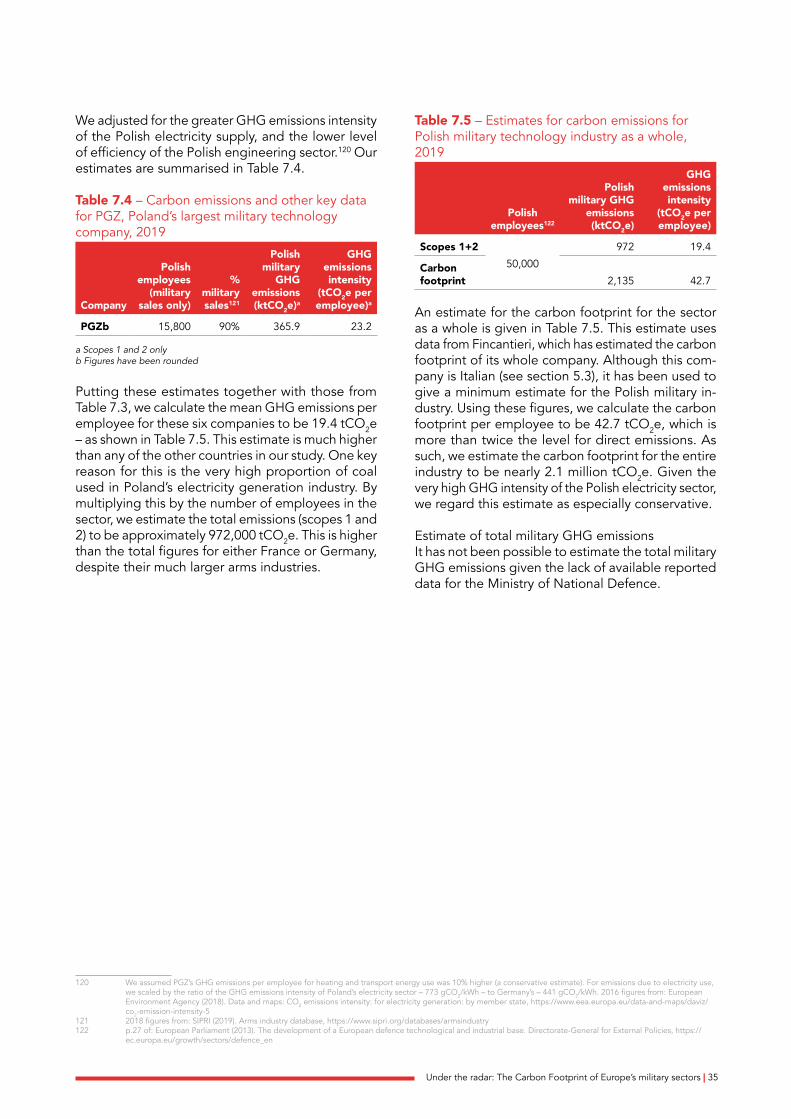
Under the radar: The Carbon Footprint of Europe’s military sectors | 35
We adjusted for the greater GHG emissions intensity of the Polish electricity supply, and the lower level of efficiency of the Polish engineering sector.120 Our estimates are summarised in Table 7.4.
Table 7.4 – Carbon emissions and other key data for PGZ, Poland’s largest military technology company, 2019
Company
Polish employees
(military sales only)
% military sales121
Polish military
GHG emissions (ktCO2e)a
GHG emissions intensity
(tCO2e per employee)a
PGZb 15,800 90% 365.9 23.2
a Scopes 1 and 2 onlyb Figures have been rounded
Putting these estimates together with those from Table 7.3, we calculate the mean GHG emissions per employee for these six companies to be 19.4 tCO2e – as shown in Table 7.5. This estimate is much higher than any of the other countries in our study. One key reason for this is the very high proportion of coal used in Poland’s electricity generation industry. By multiplying this by the number of employees in the sector, we estimate the total emissions (scopes 1 and 2) to be approximately 972,000 tCO2e. This is higher than the total figures for either France or Germany, despite their much larger arms industries.
120 We assumed PGZ’s GHG emissions per employee for heating and transport energy use was 10% higher (a conservative estimate). For emissions due to electricity use, we scaled by the ratio of the GHG emissions intensity of Poland’s electricity sector – 773 gCO2/kWh – to Germany’s – 441 gCO2/kWh. 2016 figures from: European Environment Agency (2018). Data and maps: CO2 emissions intensity: for electricity generation: by member state, https://www.eea.europa.eu/data-and-maps/daviz/co2-emission-intensity-5
121 2018 figures from: SIPRI (2019). Arms industry database, https://www.sipri.org/databases/armsindustry 122 p.27 of: European Parliament (2013). The development of a European defence technological and industrial base. Directorate-General for External Policies, https://
ec.europa.eu/growth/sectors/defence_en
Table 7.5 – Estimates for carbon emissions for Polish military technology industry as a whole, 2019
Polish employees122
Polish military GHG
emissions (ktCO2e)
GHG emissions intensity
(tCO2e per employee)
Scopes 1+250,000
972 19.4
Carbon footprint 2,135 42.7
An estimate for the carbon footprint for the sector as a whole is given in Table 7.5. This estimate uses data from Fincantieri, which has estimated the carbon footprint of its whole company. Although this com-pany is Italian (see section 5.3), it has been used to give a minimum estimate for the Polish military in-dustry. Using these figures, we calculate the carbon footprint per employee to be 42.7 tCO2e, which is more than twice the level for direct emissions. As such, we estimate the carbon footprint for the entire industry to be nearly 2.1 million tCO2e. Given the very high GHG intensity of the Polish electricity sector, we regard this estimate as especially conservative.
Estimate of total military GHG emissionsIt has not been possible to estimate the total military GHG emissions given the lack of available reported data for the Ministry of National Defence.

36 | Under the radar: The Carbon Footprint of Europe’s military sectors

Under the radar: The Carbon Footprint of Europe’s military sectors | 37
SPAIN
MILITARY EXPENDITURE AND STRUCTURE
Military expenditure for Spain is summarised in Table 8.1, using figures reported to NATO. In real terms, this spending increased 29% between 2014 and 2020.
Table 8.1 – Military expenditure, Spain123
2018 2019* 2020*
Total expenditure €11.2bn €11.3bn €12.9bn
% of GDP 0.93 0.91 1.16
Figures are current values. Those marked * are estimates.
Spain’s main military capabilities vary between half and three-quarters of those of France, with its air force being especially large. As with other nations in this study, its military spending has increased markedly in recent years in response to NATO targets. It has some overseas troop deployments, including in the Middle East, Africa and elsewhere in Europe.
The latest data summarising the size of Spain’s military – both equipment and personnel – are given in Table 7.2. Focus is given to factors that lead to higher levels of carbon emissions.
123 NATO (2020). Defence Expenditure of NATO Countries (2013-2020). Press release, 21 October, https://www.nato.int/cps/en/natohq/news_178975.htm
124 From: NATO (2020) – op cit; IISS (2020). The Military Balance 2020, https://www.iiss.org/publications/the-military-balance-plus125 Spain (2020a). National Inventory Report 2020. GHG Inventories Report 1990-2018, https://unfccc.int/sites/default/files/resource/esp-2020-nir-25may20.zip
Table 8.2 – Key data on the make-up of the Spanish military124
Military personnel 122,500
Percentage of total military expenditure spent on equipment 23%
Navy - Destroyers & frigates - Submarines (diesel-electric)
113
Air-force - Fighter/ ground attack aircrafta
- Heavy/ medium transport aircraft/ tankers18717
Army - Main battle tanks & infantry fighting vehiclesb
- Artilleryb
- Heavy/ medium transport helicoptersc
- Armoured personnel carriersb
556
1,59082
929
a Includes aircraft deployed by the navyb Includes equipment deployed by the marinesc Includes helicopters deployed by the navy and air-force
REPORTED EMISSIONS AND NATIONAL POLICY
The UNFCCC National Inventory Report for Spain provides reported military emissions under the IPCC category 1.A.5, as summarised in Table 8.3.125 There is currently no disaggregation of stationary combus-tion in military installations (1.A.5a stationary sources), although this is planned for future NIR submissions. The estimates are currently included in category 1.A.4a (commercial/institutional). There are also plans to improve information to provide a breakdown of
08
This section focuses on Spain, which is one of the top six EU countries in terms of military expenditure. It includes reported military GHG emission data, a summary of national policy and our estimate for GHG emissions.

38 | Under the radar: The Carbon Footprint of Europe’s military sectors
consumption between their own military’s and multilateral operations.
Table 8.3 – Summary of military emissions given in UNFCCC NIR, Spain
IPCC category 2018 CO2 (kt)
1.A.5a Stationary -
1.A.5b Mobile 447
1.A.5 Total 447
Spain’s Integrated National Energy and Climate Plan makes no specific reference to the military.126 The National Action Plan of Energy Efficiency does however state that although Article 5 of the Energy Efficiency Directive excludes certain buildings owned by the armed forces, the Ministry of Defence has developed SINFRADEF, an energy and asset man-agement system that contains information on the energy consumption and efficiency of all its build-ings.127 Although the earlier national action plan for 2017-2020 stated that information is not included in the national inventory for security reasons, data is collected and may be used for improvement action. The action plan also noted that energy performance criteria under Article 6 of Directive 2012/27/EU, does not apply to contracts for the supply of military equipment.
The Ministry of Defence has also developed the Defence Technology and Innovation Strategy (ETID), which sets out specific objectives to support collab-oration between national and international technol-ogy suppliers, including energy management systems and performance.128 In 2011, Instruction 56/2011 from the Secretary of State for Defence set out a commitment to the implementation of environmental
126 Spain (2020b) Integrated National Energy and Climate Plan 2021-2030, https://ec.europa.eu/energy/sites/ener/files/documents/es_final_necp_main_en.pdf 127 Spain (2017). National Action Plan of Energy Efficiency 2017-202, https://ec.europa.eu/energy/sites/ener/files/documents/es_neeap_2017_es.pdf 128 Ministry of Defence, Spain, ETID website, https://www.tecnologiaeinnovacion.defensa.gob.es/es-es/Estrategia/Paginas/Defensa.aspx 129 Secretary of State for Defence, Spain (2011) Instruction 56/2011, https://www.defensa.gob.es/medioambiente/Galerias/formacion/ficheros/Instruccin_56_2011.pdf 130 Ministry of Defence, Spain, Climate change website https://www.defensa.gob.es/medioambiente/cambioclimatico/reduccionemisiones 131 A list of references for this data can be found in section 12
sustainability and energy efficiency, including pub-lication of an accountability report on its social, economic and environmental strategy and policy, as well as setting up a protocol for calculating its carbon footprint.129 The Ministry of Defence website notes that in 2012, the Ministry of Defence began to cal-culate its carbon footprint, including direct emissions from the consumption of fossil fuel, indirect emissions from the use of electricity and indirect emissions produced by its suppliers of goods and services.130 The website also cites the importance of including environmental clauses in bids for the ministry’s contracts. We have not been able to locate a copy of the carbon footprint data, or an accountability report on the Ministry of Defence website.
IN-COUNTRY MILITARY TECHNOLOGY INDUSTRY - CORPORATE GHG REPORTING AND GHG ESTIMATES
Many of the leading overseas corporations manu-facturing military technologies in Spain publish de-tailed data on their GHG emissions. Table 8.4 summarises data for five of the largest of these companies: Airbus, Navantia, Indra, Thales, and ITP Aero. As discussed earlier, using data on total GHG emissions for each company, the proportion of company sales that are military, and the proportion of employees based in Spain, we have estimated both the total GHG emissions for their operations based in Spain, and figures for GHG emissions per employee. Only emissions classified as scope 1 (direct emissions from company sites or equipment) and scope 2 (emissions that occur elsewhere resulting from electricity and heat used by the company) are included.
Table 8.4 – Carbon emissions and other key data for leading Spanish military technology companies, 2019131
Company / Parent countrySpanish employees
(military only) % military salesSpanish military GHG
emissions (ktCO2e)aGHG emissions intensity
(tCO2e per employee)a
Airbus / Trans-European 8,100 59% 59.0 7.3
Navantia / Spain 5,007 95% 9.6 1.9
Indra / Spain 4,880 18% 1.8 0.2
Thales / France 570 45% 1.6 2.8
ITP Aero / Spain 484 16% 0.9 1.9
Totalb 19,000 73 3.8c
a Scopes 1 and 2 onlyb Figures have been roundedc Weighted average (mean)

Under the radar: The Carbon Footprint of Europe’s military sectors | 39
These figures show Airbus with the largest military-re-lated GHG emissions within Spain. Across companies, they also show marked variation in GHG emissions per employee – for many of the reasons discussed in section 3.3. The figures indicate that the Spanish military technology industry has the lowest level of GHG emissions per employee of the six case study countries we investigated. This is likely due to the use of renewable energy sources. For example, in the Spanish facilities owned by ITP Aero 100% of its electricity now comes from renewable sources,132 while at Indra, the figure is 75%.133 Nevertheless, the figures do seem surprisingly low compared with other countries.
Note that some of the leading military technology companies that operate large facilities in Spain do not publicly publish data on their GHG emissions, including Aernnova,134 and EXPAL.135
We have used the weighted average of GHG emis-sions per employee from Table 8.4 as the basis of an estimate for the military technology sector in Spain as a whole – as shown in Table 8.5. By multiplying this by the number of employees in the sector, we estimate the total emissions (scopes 1 and 2) to be approximately 83,000 tCO2e. This is the lowest figure among the six countries in this study since the industry is relatively small and the GHG intensity is compar-atively low.
Table 8.5 – Estimates for carbon emissions for Spanish military technology industry as a whole, 2019
Spanish employees136
Spanish military
GHG emissions (ktCO2e)
GHG emissions intensity
(tCO2e per employee)
Scopes 1+222,000
83 3.8
Carbon footprint 694 31.6
An estimate for the carbon footprint for the sector is also given in Table 7.4. This estimate uses data from Thales, which has estimated the carbon footprint of its whole company. Although this company is based in France (see section 3.3), some of its operations are located in Spain, and we considered its figures to be broadly indicative of the Spanish military technology industry as a whole. Using these figures, we calculate the carbon footprint per employee to be 31.6 tCO2e, which is more than eight times the
132 ITP Aero (2019). Sustainability Report 2019, https://www.itpaero.com/en/publications.html 133 Indra (2019). Sustainability Report 2019, https://www.indracompany.com/en/accionistas/memoria-cuentas-anuales 134 Aernnova website, http://www.aernnova.com/en135 Expal website, https://www.expalsystems.com/en136 Centre Delàs d’Estudis per la Pau (2017). The weapons bubble and the military industry in Spain. http://centredelas.org/publicacions/
informe-33-la-burbuja-de-las-armas-y-la-industria-militar-en-espana-los-programas-especiales-de-armamento/?lang=en
level for direct emissions, demonstrating the carbon intensive nature of the industry’s supply chain. As such, we estimate the carbon footprint for the entire industry to be approximately 694,000 tCO2e.
ESTIMATE OF TOTAL MILITARY GHG EMISSIONS
To estimate the territorial (production-based) emis-sions of the Spanish military sectors, bearing in mind the major data gaps, we assumed that the nation’s military bases have similar total emissions to its mobile sector – i.e. they lie somewhere between the situations in France and Germany. By adding the scope 1 and 2 emissions of the military technology industry, together with an estimate for other with-in-country supply chain emissions, we get an estimate of 1.1 million tCO2e – as shown in Table 5.6. This estimate should be assumed to be conservative as it is based on figures for the military submitted to the UNFCCC, which tend to be under-reported.
Table 8.6 – Territorial GHG emissions of the Spanish military, 2018/19
GHG emissions (ktCO2e)
Armed forces (see section 8.2) - Stationary - Mobile
447447
Military technology industry(see section 8.3) 83
Other within-country supply chain emissions (see section 1.5) 112
Total 1,089
For the carbon footprint (consumption-based emis-sions), we have used a scaling factor based on a lifecycle assessment of the UK military, as discussed in section 1.5, to give an estimate of the indirect emissions and thus an overall total. Thus, we estimate the carbon footprint of the Spanish military to be approximately 2.8 million tCO2e, as shown in Table 8.7.
Table 8.7 – Carbon footprint of the Spanish military, 2018/19
GHG emissions (ktCO2e)
Armed forces - Stationary - Mobile
447447
Indirect emissions 1,900
Total 2,794

40 | Under the radar: The Carbon Footprint of Europe’s military sectors

Under the radar: The Carbon Footprint of Europe’s military sectors | 41
OTHER EU MEMBER STATES
ADDITIONAL DATA FROM SWEDEN, BELGIUM AND ROMANIA
Additional GHG emissions data was obtained from three other EU Member States – Sweden, Belgium, and Romania – and has been useful in our wider analysis of the military sector.
Sweden is home to Saab, which is the EU’s ninth largest military technology corporation (see Table 1.2). It also publishes a comparatively large amount of data on its GHG emissions, which makes it a useful addition to the case studies covered in sections 3 to 8. Key data is given in Table 9.1. In addition to figures for scope 1 and scope 2 emissions, Saab publishes significant data on its scope 3 emissions – including this brings the GHG emissions per employee to 4.0 tCO2e.
Table 9.1 – GHG emissions and other key data for Saab, 2019137
Swedish employees (military sales only)
% military
sales
Swedish military GHG
emissions (kt CO2e)a
GHG emissions intensity
(t CO2e per employee)a
12,250 85% 25.6 2.1
a Scopes 1 and 2 only
In common with many EU nations, Belgium only explicitly reports GHG emissions data to the UNFCCC for ‘mobile’ military activities, and not ‘stationary’ ones (see section 9.22). However, a military source has provided a figure for the total GHG emissions
137 References for this data can be found in section 12138 We assume this figure covers scope 1 and 2 emissions. Parrein P-J (2014). Climate impact on Defence. Royal Higher Institute for Defence. http://www.rhid.be/website/
images/livres/rmb/08/rmb08-12.pdf 139 UNFCCC (2020). Belgium: 2020 Common Reporting Format (CRF) Table. https://unfccc.int/documents/224890 140 References for this data can be found in section 12141 The reported figures appear to include GHG emissions for scopes 1 and 2 only.
of the Belgian military for 2013 as 339,000 tCO2e.138 This was more than three times higher than the figure for mobile activities only that was reported that year to the UNFCCC – 103,000 tCO2e.139 We were unable to uncover more recent figures for the total military GHG emissions of Belgium.
Recent GHG emissions figures reported by the Dutch corporation, Damen Shipyards,140 provided a useful insight into the GHG emissions intensity of the military technology industry in Romania. Damen operates a shipyard at Galati in the east of the country. Figures reported for 2016 for the site resulted in an estimate of 15.2 tCO2e per employee – which is high compared with estimates for other companies in this study.141 Following action to reduce emissions, the figure for 2017 fell to 6.9 tCO2e per employee. This again il-lustrates the problem of the high emissions levels present in Eastern European industry – as discussed in section 7.3 – but also the possibilities for mitigation actions to reduce them.
EU NATIONS REPORTING THROUGH UNFCCC
Military GHG emissions should be reported to the UNFCCC through national reports and a combined report for the EU, under the category ‘1.A.5 emis-sions’. However, EU Member States vary significantly in the way data is submitted, sometimes including some military data in other categories or including significant civilian data in this category. A summary of all the national figures for military GHG emissions
09
This section includes available data from other EU Member States that is considered of interest to this study.

42 | Under the radar: The Carbon Footprint of Europe’s military sectors
reported to the UNFCCC for the 27 Member States is given in Table 9.2.
The poor quality of information presented here again illustrates the need to improve both the openness and consistency of data submitted to the UNFCCC
on military GHG emissions. While this data is patchy, it can nevertheless be used to make an estimate of the total military GHG emissions of EU Member States – which we attempt in section 10.1.
Table 9.2 – GHG emissions for EU Member States as reported to the UNFCCC under category 1.A.5, 2018
Data quality category Member State GHG emissions (ktCO2e) % Stationary % Mobile
Military data that seems complete
Germany 752 59% 41%
Slovakia 89 85% 15%
Cyprus 24 79% 11%
Military data that seems partial
Spain 451 0% 100%
Italy 351 0% 100%
Czechia 322 0% 100%
Denmark 218 0% 100%
Sweden 170 0% 100%
Netherlands 154 0% 100%
Greece 124 0% 100%
Belgium 107 0% 100%
Portugal 59 0% 100%
Austria 52 0% 100%
Estonia 50 0% 100%
Hungary 29 0% 100%
Latvia 20 0% 100%
Lithuania 20 0% 100%
Slovenia 4 0% 100%
Malta 3 0% 100%
Luxembourg 0 0% 100%
Military data that includes significant civilian sources
Finland 955 100% 0%
Romania 619 100% 0%
Military data not clearly reported
France NO/IE - -
Poland NO/IE - -
Ireland IE - -
Croatia NO/IE - -
Bulgaria NO - -
NO – data reported as ‘not occurring’; IE – data reported as ‘included elsewhere’ NB There are some small discrepancies between figures in this table and those in Tables 4.3, 5.3, 6.3 and 8.3 due to those tables not including non-CO2 GHG emissions.
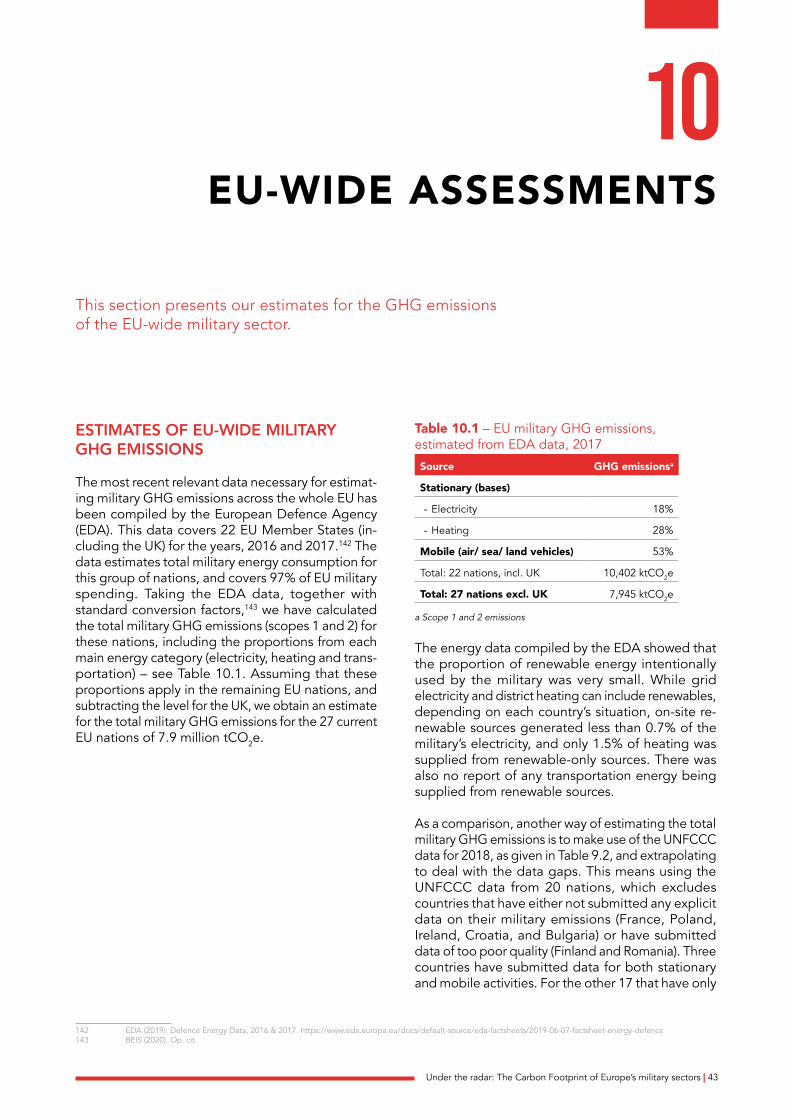
Under the radar: The Carbon Footprint of Europe’s military sectors | 43
EU-WIDE ASSESSMENTS
This section presents our estimates for the GHG emissions of the EU-wide military sector.
ESTIMATES OF EU-WIDE MILITARY GHG EMISSIONS
The most recent relevant data necessary for estimat-ing military GHG emissions across the whole EU has been compiled by the European Defence Agency (EDA). This data covers 22 EU Member States (in-cluding the UK) for the years, 2016 and 2017.142 The data estimates total military energy consumption for this group of nations, and covers 97% of EU military spending. Taking the EDA data, together with standard conversion factors,143 we have calculated the total military GHG emissions (scopes 1 and 2) for these nations, including the proportions from each main energy category (electricity, heating and trans-portation) – see Table 10.1. Assuming that these proportions apply in the remaining EU nations, and subtracting the level for the UK, we obtain an estimate for the total military GHG emissions for the 27 current EU nations of 7.9 million tCO2e.
142 EDA (2019). Defence Energy Data, 2016 & 2017. https://www.eda.europa.eu/docs/default-source/eda-factsheets/2019-06-07-factsheet-energy-defence 143 BEIS (2020). Op. cit.
Table 10.1 – EU military GHG emissions, estimated from EDA data, 2017
Source GHG emissionsa
Stationary (bases)
- Electricity 18%
- Heating 28%
Mobile (air/ sea/ land vehicles) 53%
Total: 22 nations, incl. UK 10,402 ktCO2e
Total: 27 nations excl. UK 7,945 ktCO2e
a Scope 1 and 2 emissions
The energy data compiled by the EDA showed that the proportion of renewable energy intentionally used by the military was very small. While grid electricity and district heating can include renewables, depending on each country’s situation, on-site re-newable sources generated less than 0.7% of the military’s electricity, and only 1.5% of heating was supplied from renewable-only sources. There was also no report of any transportation energy being supplied from renewable sources.
As a comparison, another way of estimating the total military GHG emissions is to make use of the UNFCCC data for 2018, as given in Table 9.2, and extrapolating to deal with the data gaps. This means using the UNFCCC data from 20 nations, which excludes countries that have either not submitted any explicit data on their military emissions (France, Poland, Ireland, Croatia, and Bulgaria) or have submitted data of too poor quality (Finland and Romania). Three countries have submitted data for both stationary and mobile activities. For the other 17 that have only
10
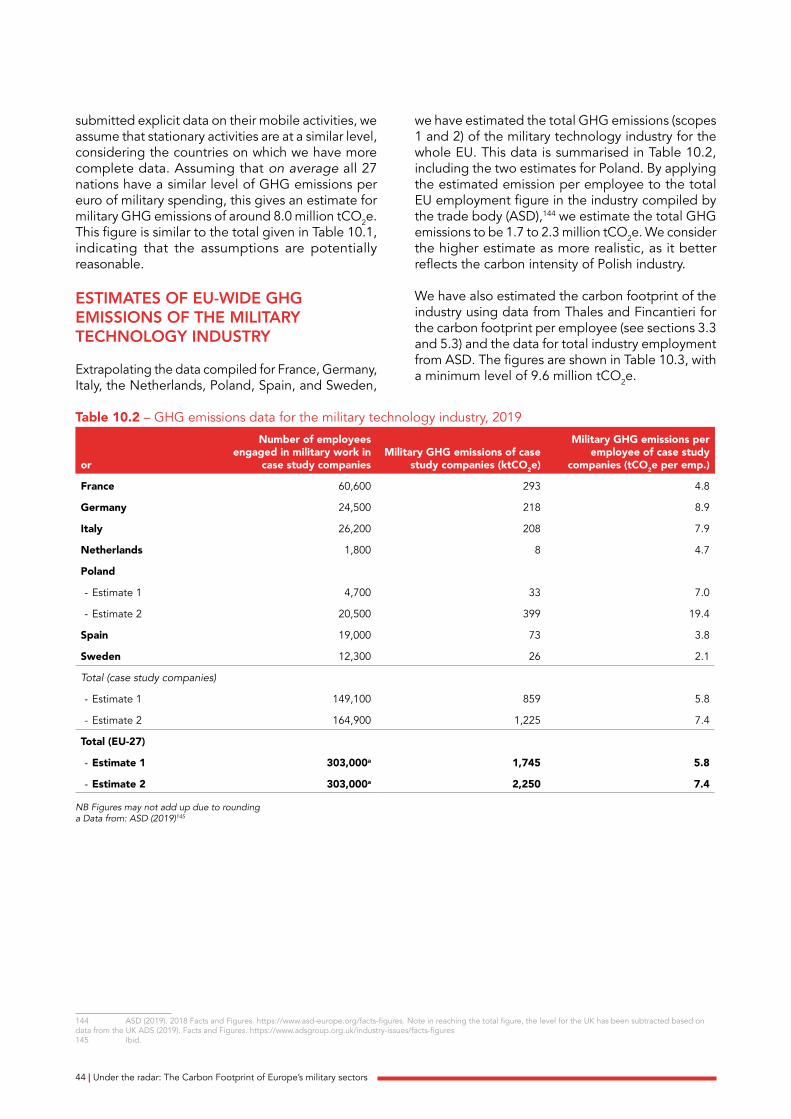
44 | Under the radar: The Carbon Footprint of Europe’s military sectors
submitted explicit data on their mobile activities, we assume that stationary activities are at a similar level, considering the countries on which we have more complete data. Assuming that on average all 27 nations have a similar level of GHG emissions per euro of military spending, this gives an estimate for military GHG emissions of around 8.0 million tCO2e. This figure is similar to the total given in Table 10.1, indicating that the assumptions are potentially reasonable.
ESTIMATES OF EU-WIDE GHG EMISSIONS OF THE MILITARY TECHNOLOGY INDUSTRY
Extrapolating the data compiled for France, Germany, Italy, the Netherlands, Poland, Spain, and Sweden,
144 ASD (2019). 2018 Facts and Figures. https://www.asd-europe.org/facts-figures. Note in reaching the total figure, the level for the UK has been subtracted based on data from the UK ADS (2019). Facts and Figures. https://www.adsgroup.org.uk/industry-issues/facts-figures 145 Ibid.
we have estimated the total GHG emissions (scopes 1 and 2) of the military technology industry for the whole EU. This data is summarised in Table 10.2, including the two estimates for Poland. By applying the estimated emission per employee to the total EU employment figure in the industry compiled by the trade body (ASD),144 we estimate the total GHG emissions to be 1.7 to 2.3 million tCO2e. We consider the higher estimate as more realistic, as it better reflects the carbon intensity of Polish industry.
We have also estimated the carbon footprint of the industry using data from Thales and Fincantieri for the carbon footprint per employee (see sections 3.3 and 5.3) and the data for total industry employment from ASD. The figures are shown in Table 10.3, with a minimum level of 9.6 million tCO2e.
Table 10.2 – GHG emissions data for the military technology industry, 2019
or
Number of employees engaged in military work in
case study companiesMilitary GHG emissions of case
study companies (ktCO2e)
Military GHG emissions per employee of case study
companies (tCO2e per emp.)
France 60,600 293 4.8
Germany 24,500 218 8.9
Italy 26,200 208 7.9
Netherlands 1,800 8 4.7
Poland
- Estimate 1 4,700 33 7.0
- Estimate 2 20,500 399 19.4
Spain 19,000 73 3.8
Sweden 12,300 26 2.1
Total (case study companies)
- Estimate 1 149,100 859 5.8
- Estimate 2 164,900 1,225 7.4
Total (EU-27)
- Estimate 1 303,000a 1,745 5.8
- Estimate 2 303,000a 2,250 7.4
NB Figures may not add up due to roundinga Data from: ASD (2019)145

Under the radar: The Carbon Footprint of Europe’s military sectors | 45
Table 10.3 – Carbon footprint estimates of the EU military technology industry, 2019
Carbon footprint (MtCO2e)
Estimate 1: based on Thales data 9.56
Estimate 2: based on Fincantieri data 12.94
COMBINED ESTIMATES OF EU-WIDE GHG EMISSIONS OF THE MILITARY-INDUSTRIAL SECTORS
We have estimated the EU-wide overarching totals for GHG emission levels for the combined sectors of the armed forces and military technology industry.
In Table 10.4 –, we give the figures for the produc-tion-based/territorial emissions – for the EU’s militaries (scopes 1 and 2), the military technology industry (scopes 1 and 2), and an estimate for their additional within-country supply chains within the EU, based on research on the situation in the UK. This gives a total of 13.2 million tCO2e. Comparing this with data published by the European Environment Agency indicates that the total GHG emissions of the com-bined military-industrial sectors represent approxi-mately 0.35% of total GHG emissions reported for the EU.146 However, we should bear in mind the poor quality of data reporting that we have discovered throughout these sectors, so there are grounds for considering this a rather conservative estimate.
Table 10.4 – Territorial GHG emissions of the EU’s militaries
GHG emissions (ktCO2e)
Militariesa (see section 10.1) 7,945
Military technology industryb (see section 10.2) 2,250
Within-EU supply chainb
(see section 1.5) 3,036
Total 13,231
a 2017 data b 2019 data
146 Total GHG emissions reported for the EU in 2018 were 3,764 million tCO2e, excluding the United Kingdom. Table 2.3 of European Environment Agency (2020). Annual European Union greenhouse gas inventory 1990–2018 and inventory report 2020. https://www.eea.europa.eu//publications/european-union-greenhouse-gas-inventory-2020
147 An average car (using the UK as an example) – assuming average mileage and fuel consumption – emits approximately 1.8 tCO2 per year. Calculation based on figures from: RAC Foundation (2020). Motoring FAQs (Environment, A6; Mobility, A25). https://www.racfoundation.org/motoring-faqs
In Table 10.5, we give figures for the consump-tion-based emissions/carbon footprint, including a breakdown between military emissions and indirect upstream emissions, based on research on the situ-ation in Norway (see section 1.5). This gives a total of 24.8 million tCO2e.
Table 10.5 – Carbon footprint of the EU’s militaries, 2017
GHG emissions (ktCO2e)
Militaries (see section 10.1) 7,945
Indirect emissions (see section 1.5) 16,883
Total 24,828
Regarding a comparison for the carbon footprint of the military-industrial sector, one commonly used yardstick is car emissions. The direct CO2 emissions of an average car driven an average mileage in a year in a European country is approximately 1.8 tCO2e.147 Hence, the EU’s military carbon footprint is equivalent to nearly 14 million cars.

46 | Under the radar: The Carbon Footprint of Europe’s military sectors

Under the radar: The Carbon Footprint of Europe’s military sectors | 47
STUDY FINDINGS AND RECOMMENDATIONS
OVERVIEW
This study set out to estimate the carbon footprint of the European Union’s military sectors, as well as critically examining related policies and practices. The estimates are given in Table 11.1 and Table 11.2, and we regard them as conservative. For comparison,
Table 11.1 also includes figures published by relevant national and international bodies. The carbon foot-print of EU military expenditure in 2019 was estimated to be about 24.8 million tCO2e, which is equivalent to the annual emissions of approximately 14 million average cars.
Table 11.1 – Carbon footprint and other GHG emissions data for the key military sectors of European Union, 2019
EU nation
Military GHG emissions(UNFCCC)a
MtCO2e
Military GHG emissions(National/EU)b
MtCO2e
Estimated GHG emissions
(this study)c
MtCO2e
Carbon footprint (this study)
MtCO2e
France Not reported 2.23d 4.56 8.38
Germany 0.75 1.45 3.12 4.53
Italy 0.34 Not found 1.84 2.13
Netherlands 0.15 0.40 0.61 1.25
Poland Not reported Not foundInsufficient
dataInsufficient
data
Spain 0.45 Not found 1.09 2.79
EU total (27 nations) 4.52e 7.95f 13.23 24.83
a 2018 figures, as reported to UNFCCC. Includes ‘scope 1 and 2 emissions’ of military bases and military vehicles (air/sea/land)b As reported by national bodies/EU. Includes ‘scope 1 and 2 emissions’ of military bases and military vehicles (air/sea/land)c Estimated for the combined military industrial sectors. Includes ‘scope 1 and 2 emissions’ of military bases and vehicles, military technology industry, and
additional within-country supply chain d Our calculation based on figures provided in a national reporte An unspecified level of civilian emissions is included in this figuref Our calculation based on EDA energy consumption figures for 2017
11
This section presents the study findings and our recommended minimum actions.

48 | Under the radar: The Carbon Footprint of Europe’s military sectors
Table 11.2 – Five corporations with largest military-related GHG emissions in case study nations, 2019
Main country of operation
GHG emissions of military sales in case
study nations (ktCO2e)a
Military GHG emissions per employee (tCO2e/
emp.)a
Employees in military tech divisions in case
study nationsb
PGZ Poland 366c 23.2c 15,800
Airbus France/ Germany 300 7.3 41,200
Leonardo Italy 200 8.2 24,500
Rheinmetall Germany 95 14.9 6,400
Thales France 63 2.8 22,700
a ‘Scope 1 and 2 emissions’b Figures have been roundedc Figures have been estimated (see section 7.3)
148 TCFD (2020). Status report, https://assets.bbhub.io/company/sites/60/2020/09/2020-TCFD_Status-Report.pdf
TRANSPARENCY AND ACCURACY OF GHG EMISSIONS REPORTING
Key findings
• The transparency and accuracy of GHG emissions reporting within the military sectors was found to be low, and we noted the following key deficiencies in the data for the six case study countries: - Omissions, under-reporting, and/or unclear data were common in military GHG emissions reported to the UN Framework Convention on Climate Change (France, Germany, Italy, Netherlands, Poland, Spain);
- No national totals for military GHG emissions were given in publicly available official reports (France, Italy, Poland, Spain);
- Large fractions of the military technology industry did not publicly declare GHG emissions data (Germany, Netherlands, Poland).
• There was little evidence that the combined GHG emissions of the military, the military technology industry, and their supply chains has been examined in individual EU nations, or the EU as a whole. Given the carbon intensive nature of the manufac-ture of military technologies, such shortcomings are especially significant.
• National security was often cited as a reason for not publishing data. However, given the current level of technical, financial and environmental data already publicly available on the militaries of EU (and other) nations, this is an unconvincing argu-ment, especially since several EU nations already publish data.
• GHG emissions data quality standards within militaries were found to be generally lower than in the civilian/commercial sectors. Even so, there is recognition that significant improvements in re-porting standards are also needed in the commer-
cial sector – as noted in the latest status report of the Task Force on Climate-Related Financial Disclosures.148 The status report identified the need for consistency in how indirect GHG emissions from purchased goods, equipment and services are measured. Given military reliance on such purchas-es, the sector should follow the example of cli-mate-leading commercial organisations.
• Some military technology corporations did not publicly publish GHG emissions data. The largest of these which we examined were: PGZ, MBDA, Hensoldt, KMW, and Nexter. None provided emissions data in response to our requests.
• Without full and transparent reporting on GHG emissions, the monitoring of efforts to reduce emissions will be unreliable and it will not be clear whether environmental policy objectives are being met.
• No EU militaries attempt to report on the GHG emissions related to weapons use on the battlefield, e.g. due to destroying fuel depots, or include emissions related to post-conflict reconstruction.
Minimum required actions
• All EU nations should publish national data on the GHG emissions of their militaries and military technology industries as standard practice. Reporting should be transparent, consistent and comparative. This would set a strong precedent for global reporting. International bodies – such as the European Commission and UNFCCC – should facilitate this through improved reporting standards.
• Militaries should adopt best practice emissions reporting from leaders in the civilian industrial sectors – including in how to report on with supply chain emissions.

Under the radar: The Carbon Footprint of Europe’s military sectors | 49
• All significant military technology corporations should be required to publicly publish GHG emis-sions data on their operations.
• All GHG emission reporting by militaries and military technology corporations should be exter-nally audited and independently verified.
• Effort should be made to evaluate the GHG emis-sions related to the conduct of hostilities and post-conflict recovery and reconstruction.
MILITARY GHG EMISSIONS: SIZE AND DISTRIBUTION
Findings
• France was found to contribute approximately one-third of the total carbon footprint for the EU military. This was due to its large armed forces and military technology industrial sector. Other major contributors to the total were Germany (18%), Spain (11%), and Italy (9%). We were unable to make an estimate for Poland because we could not access country-specific data on the GHG emissions of its armed forces.
• Poland’s military technology industry was estimated to have the highest GHG emissions and was re-sponsible for about 18% of the EU total.149 A key reason for this was the high GHG emissions intensity of Poland’s electricity grid, which relies heavily on coal. Other high emitters were France (13%), Germany (10%), and Italy (9%).
• PGZ, Airbus, Leonardo, Rheinmetall, and Thales were judged to have the highest GHG emissions of the military technology companies examined.
REDUCING MILITARY GHG EMISSIONS: POLICIES AND TECHNOLOGIES
Findings
• Current trends in the levels of military GHG emis-sions in the EU are hard to discern due to lack of data. The combination of the upward trend in military expenditure to reach the NATO target of 2% of GDP, technology modernisation programmes and NATO/EU deployments outside of Europe all risk fuelling an increase in emissions. Ongoing energy efficiency programmes and moves to use more renewable energy have the potential to re-duce emissions.
• Policies to mitigate military GHG emissions broadly fit into four categories: 1. Reform of national and international security
strategies – this would involve diplomatic efforts
149 Scope 1 and 2 emissions only – see section 10.2.150 See, for example: Anderson K (2012). The inconvenient truth of carbon offsets. Nature, vol.484, p.7. https://www.nature.com/news/
the-inconvenient-truth-of-carbon-offsets-1.10373
to reduce international tensions, and improve arms control and disarmament treaties, as well as a stronger focus on using resources to achieve ‘human security’ goals. All of these could lead to reduced armed deployments. We found no evidence that these options were under consid-eration by governments as part of wider efforts to reduce GHG emissions.
2. Less carbon intensive military technologies – these include energy efficiency improvements, switching to non-fossil fuel energy sources or procurement programmes to reduce carbon emissions in the supply chain. The lack of data and reporting makes it difficult to fully evaluate the impact of these policies across the EU. In any case, reducing the purchase, deployment, and use of all military equipment, including low-carbon technologies remains instrumental in cutting GHG emissions.
3. Environmental management options at military sites – this includes land management, energy efficiency improvement, switching to renewable energy suppliers, installing on-site renewables, using electric vehicles and development of synthetic fuels. The introduction of new synthetic fuels requires a full assessment of potential environmental impacts from their development, manufacture and use. Options such as small nuclear power plants are also problematic on cost, environmental, safety and security grounds. Some national programmes appeared to be making a significant difference, e.g. the Netherlands switching to grid-based 100% re-newable electricity for all its military bases. However, the lack of data and reporting again makes it difficult to fully evaluate the impact of these policies across the EU. In any case, as above, reducing military activity and deployment of military personnel remains instrumental in cutting GHG emissions.
4. Offsetting emissions – this is where an emitter pays another body to reduce emissions on their behalf. While we found no specific detail of planned offsetting policy by the military, offsetting is highly controversial since it potentially under-mines efforts to reduce emissions at source.150
• Overarching military strategies to improve energy efficiency and adopt renewable energy solutions benefit military operational resilience by, reducing reliance on logistics and supply convoys. These strategies are not necessarily driven by the goal to reduce GHG emissions. It is important that the benefits from improved energy efficiency and use of renewables do not just support on-going military

50 | Under the radar: The Carbon Footprint of Europe’s military sectors
policies, without governments looking at how changes in military strategies themselves can re-duce GHG emissions.
• Military exemptions are currently in place regarding energy efficiency requirements. Energy Efficiency Directive 2012/27/EU for example excludes certain buildings owned by the armed forces and energy performance criteria do not apply to contracts for the supply of military equipment. We do not know how widely these exemptions are being applied.
Minimum required actions
• A review is urgently needed of national and inter-national security strategies to examine the potential to reduce the deployment of armed force – and hence reduce GHG emissions in ways not yet se-riously considered by militaries in the EU (or elsewhere). This should include: - Assessing the potential of arms control and disarmament initiatives to reduce emissions;
- Examining the potential for less confrontational military force structures; and
- Re-evaluating policies from the perspective of ‘human security’ rather than just ‘national secu-rity’, which would refocus resources on tackling the roots of insecurity, including poverty, inequal-ity, ill-health, and environmental degradation.
• While it may be difficult to estimate the emissions reduction associated with such activities, the po-tential for win-win opportunities for both improved international security and wider social and envi-ronmental benefits merit their serious consideration.
• Demanding targets should be implemented for the reduction of military GHG emissions – consistent with the 1.5°C level specified by the Paris Agreement. This should include targets for switch-ing to renewable energy.
• As a minimum, an assessment of EU-wide progress towards the recommendations of the 2015 NATO energy review is required, as well as progress to-wards the environmental recommendations of the EU Military Concept, which covered similar issues.151 This would provide crucial data in assessing whether military GHG emissions are falling and, if they are, which policies and practices are having a positive effect.
151 EEAS (2012). 01574/12 European Union Military Concept on Environmental Protection and Energy Efficiency for EU-led military operations, https://data.consilium.europa.eu/doc/document/ST-13758-2012-INIT/en/pdf
152 Ministry of Armed Forces, France website, ‘The Ministry of the Armed Forces continues its commitment to biodiversity’, 22.03.19, https://www.defense.gouv.fr/english/actualites/articles/le-ministere-des-armees-poursuit-son-engagement-en-faveur-de-la-biodiversite
153 Goldammer, J. G. et al (2016). Development of technologies and methods for the application of prescribed fire [..], https://gfmc.online/globalnetworks/seeurope/GFMC-Publication-RX-Burning-UXO-Terrain-2016.pdf
• Military-owned land should be managed both to improve carbon sequestration and biodiversity (e.g. for example by tree-planting and other nature-based solutions), as well as being used to generate on-site renewable energy where appropriate. Militaries often own a great deal of land – for example, in France, the Ministry of Armed Forces owns around 242,000 hectares,152 and in Germany, there are an estimated 685,000 hectares of active and aban-doned military sites.153 The opportunities for action are significant but this must not be used as a substitute for reducing GHG emissions at source. Best practice land management options should be pursued and these should be monitored to ensure high standards are reached.
• Taking part in schemes to offset GHG emissions should be avoided.
• A review of Energy Efficiency Directive 2012/27/EU is required, with evaluation on how widely exemptions are applied on military contracts and across the military estate.
• Policies for the low carbon procurement of military equipment, other goods and services, should be put in place with contractual obligations to ensure that suppliers are reporting their GHG emissions and implementing measures to markedly reduce them.
Under the radar: The Carbon Footprint of Europe’s military sectors | 51
LIST OF DATA SOURCES FROM INDUSTRY
12
AIRBUS. Annual Report 2019 Worldwide presence
DAMEN SHIPYARDS. Corporate Social Responsibility Report 2018; Sustainability Report 2017 Galati (Romania)
DASSAULT AVIATION. Annual Report 2019
FINCANTIERI. Annual report 2019 Environmental aspects: greenhouse gases: 2019 data
INDRA. Annual Report 2019; Sustainability Report 2019
ITP AERO. Sustainability Report 2019. Email correspondence, 03/11/20
LOCKHEED MARTIN. Sustainability Report 2019
LEONARDO. Main environmental data and information: 2019 data environment & about-us
MELROSE/ GKN/ FOKKER. Melrose Annual Report 2019 Fokker Services: Profile
NAVAL GROUP. Financial Report 2019
NAVANTIA. Corporate Social Responsibility Report 2017
NORTHROP GRUMMAN. Sustainability Report 2019 Litef (Germany) Italia
PGZ. Grupapgz IISS (2020). The Military Balance 2020
RAYTHEON. Annual Report 2018 Corporate Responsibility Report 2018 Raytheon in Germany A hub for defence (Poland)
RHEINMETALL. Annual Report 2019 Corporate Responsibility Report 2017
SAAB. Annual Report 2019; Sustainability Report 2019
SAFRAN. Universal Registration Document 2019
THALES. Universal Registration Document 2019

PREPARED FOR:
The Left in the European ParliamentRue Wietz 43
B-1047 Brusselswww.left.eu
PREPARED BY:
Conflict and Environment Observatory
Scout RoadMytholmroyd
West Yorkshire, HX7 5HZUnited Kingdom
T: +44 (0)300 302 1130E: [email protected]
www.ceobs.org
Scientists for Global Responsibility
2 West RoadLancaster, LA1 5PG
United KingdomT: +44 (0)1524 298601