Embed Size (px)
Citation preview
Journal of Clinical Psychiatry, in press
The CAD-MDD:
A Computerized Adaptive Diagnostic Screening Tool for Depression
Robert D. Gibbons Ph.D.1 Giles Hooker Ph.D.2
Matthew D. Finkelman Ph.D.3 David J. Weiss Ph.D.4 Paul A. Pilkonis Ph.D.5
Ellen Frank Ph.D.5
Tara Moore M.A., M.P.H.5 David J. Kupfer M.D.5
April 2013
1Center for Health Statistics, University of Chicago, Chicago IL
2Department of Statistics, Cornell University, Ithaca NY 3Department of Public Health and Community Service, Tufts University School of Dental
Medicine, Boston MA 4Department of Psychology, University of Minnesota, Minneapolis MN 5Western Psychiatric Institute, University of Pittsburgh, Pittsburgh PA
Corresponding Author: Robert D. Gibbons, Ph.D. Director, Center for Health Statistics Professor of Biostatistics Departments of Medicine and Health Studies University of Chicago 5841 S. Maryland Avenue MC 2007 office W260 Chicago IL 60637 773-834-8692 773-702-1979 (fax) [email protected]

Acknowledgements: This work was supported by NIMH grant R01-MH66302. We would like to acknowledge the outstanding support of R. Darrell Bock Ph.D. University of Chicago (technical comments on methodology), Scott Turkin M.D. DuBois Community Mental Health Center (data collection), Damara Walters M.A. University of Pittsburgh (patient recruitment), Suzanne Lawrence M.A. University of Pittsburgh (diagnostic assessments), and Victoria Grochocinski Ph.D. University of Pittsburgh (database administration). Dr. Turkin has been a speaker for Forest and Sunvovion pharmaceutical companies. Drs. Bock and Grochocinski, and Ms. Walters and Lawrence report no conflicts of interest. The authors are also indebted to the reviewers for many excellent comments and suggestions. The CAD-MDD will be made available for routine administration (by the end of 2013) through Adaptive Testing Technologies (www.adaptive testingtechnologies.com) in which Drs. Gibbons, Kupfer, Frank, Weiss and Pilkonis have financial interests. Dr. Frank has been a member of advisory boards for and received honoraria from Servier International, and receives royalties from Guilford Press, the American Psychological Association. Dr. Kupfer is a consultant for the American Psychiatric Association.
Abstract
Objective: To develop a computerized adaptive diagnostic (CAD) screening tool for depression
that decreases patient and clinician burden and increases sensitivity and specificity for clinician-
based DSM-IV diagnosis of major depressive disorder (MDD).
Method: 656 individuals with and without minor and major depression were recruited from a
psychiatric clinic, community mental health center, and through public announcements (controls
without depression). The item bank consists of 88 depression scale items drawn from 73
depression measures. The focus of this study was the development of the CAD-MDD diagnostic
screening tool based on a decision-theoretic approach (random forests and decision trees).
Sensitivity and specificity for predicting clinician-based SCID DSM-IV diagnoses of MDD were
the primary outcomes. Diagnostic screening accuracy was then compared to the PHQ-9.
Results: An average of 4 items per participant was required (maximum of 6 items). Overall
sensitivity and specificity were 0.95 and 0.87 respectively. For the PHQ-9, sensitivity was 0.70
and specificity was 0.91.
Conclusion: High sensitivity and reasonable specificity for a clinician-based DSM-IV diagnosis
of depression can be obtained using an average of 4 adaptively administered self-report items
in less than one minute. Relative to the currently used PHQ-9, the CAD-MDD dramatically
increased sensitivity while maintaining similar specificity. As such, the CAD-MDD will identify
more true positives (lower false negative rate) than the PHQ-9 using half the number of items.
Inexpensive (relative to clinical assessment), efficient and accurate screening of depression in
primary care settings, psychiatric epidemiology, molecular genetics, and global health are all
direct applications of the current system.
Introduction
With recent developments in multidimensional item response theory and computerized
adaptive testing (1), the ability to develop large-scale screening programs for the measurement
of depressive severity and related mental health disorders is now possible. Large item-banks
consisting of hundreds of items can be constructed and adaptively administered using a handful
of optimally targeted items for each individual, producing precise measurements with small fixed
levels of uncertainty. This contrasts with the traditional approach of fixed-length tests that allow
measurement uncertainty to vary from participant to participant. We have previously developed
a computerized adaptive test for depression called the CAT-Depression Inventory or CAT-DI,
which requires an average of 12 items, yet maintains a correlation of 0.95 with the almost 400
item bank score (1). However, in many cases, the goal of screening is to assess the likelihood
of an underlying psychiatric disorder, such as major depressive disorder (MDD), rather than
obtaining a dimensional measurement of the severity of that disorder. While empirically derived
cut-points on an underlying continuous measure can, in certain cases, yield high sensitivity and
specificity (1), this is not the direct goal of the measurement process, rather a fortuitous
byproduct.
An alternative approach to traditional diagnostic assessment based on lengthy clinical
interviews is computerized adaptive diagnosis (CAD) in which individuals answer a series of
symptom questions until there is high probability that they either do or do not have the diagnosis
(e.g., MDD) in question. To produce such a diagnostic screening system requires a large item
bank which has been administered to large groups of participants who do and do not meet
criteria for the disorder based on an assessment for the disorder using trained clinical
interviewers following an established diagnostic system. These data are then used to calibrate
the CAD system such that the probability of having the diagnosis can be assessed based on
any pattern of responses to the set of administered items for that particular individual. The
adaptive part of the algorithm selects the next most informative item to administer based on the

responses to the items that have been previously administered. Unlike Computerized Adaptive
Testing (CAT) based on Item Response Theory (IRT) in which the goal is to estimate the
underlying severity of the disorder with a fixed level of uncertainty, the goal of CAD is to
estimate the likelihood that a clinical interview would have obtained a positive or negative
diagnosis with a specified level of confidence. While CAT is based on IRT, CAD is based on
decision-theoretic models such as decision trees and random forests (2) and while the goal of
CAT is to administer items at the point of maximum information regarding a person’s estimated
level of impairment, the goal of CAD is to administer items at the point at which the probability
shifts from a negative to a positive diagnosis.
Although CAT and CAD are based on very different underlying statistical ideas, with very
different goals, they are in fact complementary. For example, in screening patients for
depression in primary care, we may initially screen patients for the presence or absence of MDD
using CAD and then monitor their response to treatment in terms of changes in their depressive
severity using CAT. The purpose of this paper is to illustrate the use of CAD for MDD using a
large item bank drawn from the DSM-IV depression diagnostic system in a sample of individuals
seeking treatment for depression (some of whom did and some of whom did not meet DSM-IV
criteria for MDD) and non-psychiatric controls.
In this context, it is important to draw distinctions between diagnosis, screening, and
case finding. Screening is used in a population to identify an unrecognized disease in
individuals for whom the symptoms of the disease have not yet led to its recognition. Case
finding involves identification of risk factors (e.g., family history) which increase the likelihood of
identifying the disease, typically in a much smaller sample from the population, often for the
purpose of conducting a scientific study in patients who have the disease of interest. The CAD-
MDD is a screening measure, not a case-finding measure. Screening measures, like the CAD-
MDD, are not diagnostic measures because they do not estimate the potential for the disease;
rather, they confirm the presence or absence of the disease in symptomatic individuals.
Typically, screening instruments are brief and noninvasive and are chosen to maximize
sensitivity. Conversely, diagnostic tests are always more invasive and more costly in terms of
time or financial commitments and focus on high specificity to rule out true negatives.
Methods
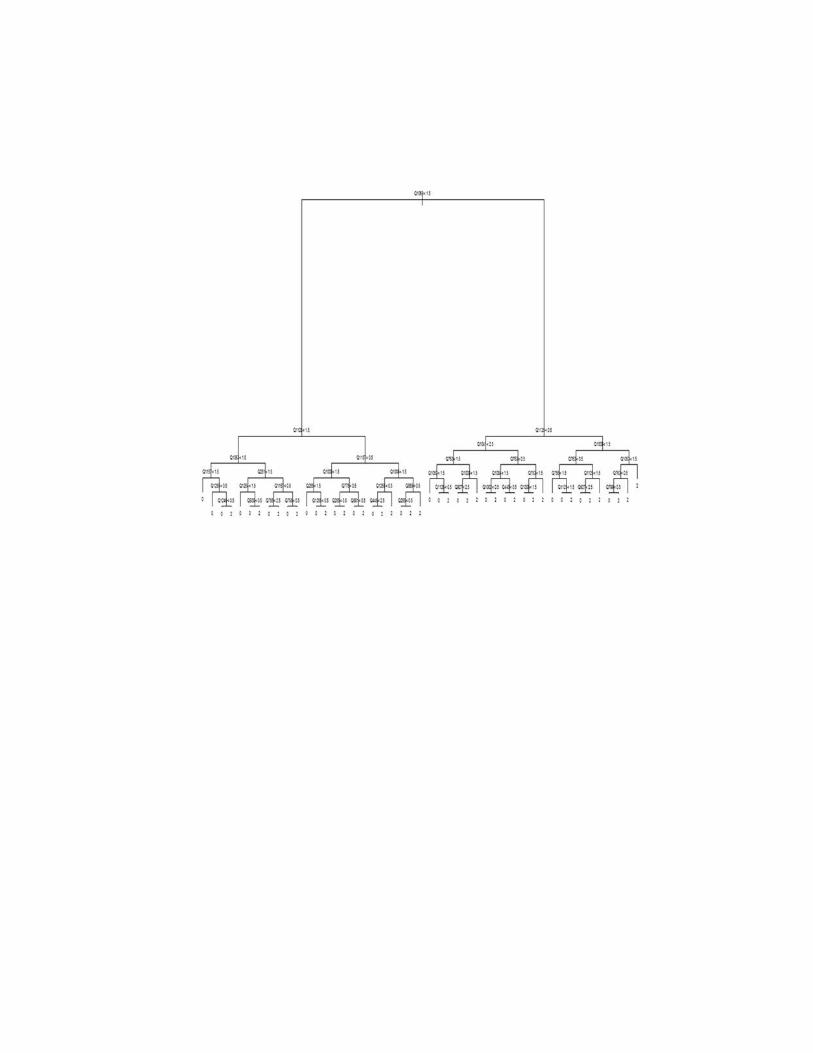
Statistical Methods: Our methods are based on representing the classification of study
participants as a decision tree. Decision trees (3-4) represent a model in terms of a flow chart
(see Figure 1). Decisions are made by traversing the tree starting from the top node. At each
node in the tree, a participant is asked to respond to a particular item (denoted by Qxxxx in
Figure 1). The participant progresses down the tree to the node to the left if his or her response
is less than the cut-off value for the node and to the right, otherwise (denoted by the inequality
operators and numbers in Figure 1). The bottom node of the tree reports a classification for the
participant (0 = non-MDD, and 2=MDD in Figure 1, with the value 1 reserved for minor
depression and dysthymia). Decision trees are appealing in this context since they allow the
set of items presented to adapt to the responses already provided – going left at a node may
result in a very different set of items being presented as compared to going right. This has the
potential to considerably shorten the length of the instrument.
Place Figure 1 Here
Despite their appeal, decision trees have frequently suffered from poor performance (5).
This is because algorithms used to build trees from data can exhibit sensitivity to small changes
in the data sets that are provided. Instead, ensemble models constructed of averages of
hundreds of decision trees have received considerable attention in statistics and machine
learning (2, 6-8). These models provide significant improvements in predictive performance as

compared to individual trees. However, averaging hundreds of trees destroys the adaptive
testing structure that makes them appealing for the purposes of medical questionnaires.
In order to obtain both the advantages of individual trees and the accuracy of ensemble models,
we used a combined approach. We first fit a type of ensemble model called a random forest (2)
to the data. Random forests were chosen because they require minimal human intervention and
have historically exhibited good performance across a wide range of domains (2,5). We then
generated a very large artificial data set in which the items mimicked the distribution of the items
in the original data set. A single tree was then estimated on this artificial data set with the
intention of mimicking the output of the random forest as closely as possible while using enough
data to reduce the sensitivity of the tree to small perturbations.
In our implementation, all estimation was performed in the R statistical programing
language, RandomForest (9), to estimate the random forest and rpart to estimate the final
decision tree. Trees of depth 6 and 11 items each were used in the analysis. Cross-validation
was performed by dividing the data into 10 sub-groups and for each subgroup we used 9 groups
to build the model and testing was then performed on the 10th group.
We studied the ability of the CAD-MDD to reproduce clinician-based SCID DSM
diagnostic interview diagnoses of MDD using sensitivity, specificity, positive predictive value
(PPV) and negative predictive value (NPV). PPV is the proportion of people who screen
positive for MDD that have a confirmed DSM diagnosis of MDD and is therefore a good case-
finding measure. NPV is the proportion of people who screen negative for MDD that do not
have MDD based on a complete diagnostic interview and is therefore a good screening
measure. Tests with low false positive rates will have high PPV and tests with low false
negative rates will have high NPV.
Patient Population: Psychiatric participants for this study were male and female treatment-
seeking outpatients (n=259) between 18 and 80 years of age and non-psychiatric controls

(n=397). Patients were recruited from two facilities, the Bellefield Clinic at the University of
Pittsburgh (WPIC), and a community clinic at DuBois Regional Medical Center (RMC) which
provides comprehensive inpatient and outpatient psychiatric care. Patient participants were
recruited through advertisements, the WPIC outpatient clinics and clinician referrals and
screened at both WPIC and Dubois for eligibility as described below. Non-psychiatric controls
were recruited through advertisements (flyers, ads, etc.), and were screened by a trained
clinical interviewer to ensure that they had not been in treatment for the past two years, which
was also corroborated by medical records. All clinic and community clinic patients received a
full SCID diagnostic interview. No one refused to use the computer, as this was described as
part of the study before enrollment. Any participant with computer or language issues was
given assistance.
Exclusion criteria included the following:
Psychiatric participants:
• History of schizophrenia, schizoaffective disorder, or psychosis
• Organic neuropsychiatric syndromes (e.g., Alzheimer’s disease or other forms of dementia,
Parkinson’s disease, etc.)
• Drug or alcohol dependence within the past three months (however, patients with episodic
abuse related to mood episodes were not excluded)
• Inpatient treatment status
• Individuals who were unable or unwilling to provide informed consent.
Non-psychiatric controls:
• Any psychiatric diagnosis within the past 24 months
• Treatment for a psychiatric problem within the past 24 months
• Positive responses to phone screen questions regarding depressive symptoms
• History of schizophrenia, schizoaffective disorder, or psychosis
• Individuals who were unable or unwilling to provide informed consent.
Demographic information is displayed in Table 1. Race includes multiple races per individual
when appropriate, so the percentages sum to a value greater than 100%. If it was determined
during the diagnostic interview that the participant was not eligible (because of a diagnosis of
bipolar, psychosis, or substance abuse), they were excluded from the study. This was not
typical, but did happen usually because the potential participant either lied during screening or
did not know their diagnosis (i.e., said they were treated for depression, but they were actually
treated for bipolar and were currently in a depressed episode). All eligible patients completed
the study.
Item Bank: Eighty-eight depression scale items were identified as aligned with current DSM-IV
MDD diagnosis, based on content review by expert judges. The items were chosen from an
extensive literature search in Medline, Psychinfo, and HAPI databases. They were based on 73
frequently-used depression measures [e.g., Center for Epidemiologic Studies Depression Scale
(CES-D), Beck Depression Inventory (BDI), Mood and Anxiety Symptom Questionnaire
(MASQ), Inventory of Depression Symptoms (IDS), Crown-Crisp Experiential Index (CCEI), and
Minnesota Multiphasic Personality Inventory (MMPI)] and a total of 501 depression items. Items
selected for inclusion into this item bank were those that are aligned with the following nine
DSM-IV criteria for MDD diagnosis: Depressed mood, loss of interest or pleasure in activities,
loss or gain of weight, insomnia or hypersomnia, agitation or slowed behavior, fatigue, thoughts
of worthlessness or guilt, inability to think or concentrate, and suicidality. Final items selected
were all in the public domain. Patients were also administered the Patient Health Questionnaire
(PHQ-9; 10) via paper and pencil. For comparison purposes, we followed PHQ guidelines for

making a tentative depression diagnosis as (a) endorsed > 5 symptoms as at least “more than
half the days” on questions Q1 – Q8, or Q9 (suicide question) if it is present at all, (b) endorsed
questions Q1 or Q2 as at least “more than half the days,” and (c) endorsed functional
impairment, Q10>1. We also considered the PHQ-2 depressive diagnostic screen of a score of
3 or more on the 1st two items of the PHQ-9, and the PHQ-9 depressive diagnostic screen of a
score of 10 or more on all 9 items.
Diagnosis: The diagnosis of MDD was made by a trained clinical interviewer using the
Structured Clinical Interview for DSM-IV Axis I Mood Disorders (SCID; 11). As depression
represents a continuum from mild symptoms to intermediate states like partial remission to
major depression, we wanted to choose a diagnostic interview that would allow for such
specificity in diagnoses. The SCID also allowed us to rule out other Axis I disorders such as
anxiety disorders. Five interviewers were used during the course of the study. All had master’s
level training in psychology, counseling, or social work and job experience in mental health
settings. Interviewers were trained using a library of videotaped SCID interviews. Training and
discussion focused on developing common rating conventions, including a shared
understanding of thresholds for severity to be used on each of the SCID items (12). Five
additional interviews were reviewed by the team throughout the duration of the project to avoid
rater drift (12). Inter-rater reliability of the SCID MDD diagnoses was determined for 5 raters
based on 13 subjects. The agreement was excellent (kappa=0.92, se=0.10, p<0.001).
The CAT-MDD received expedited approval from the University of Pittsburgh Institutional
Review Board on a yearly basis, with no adverse events or ethical issues reported.
Results
A total of 656 patients were screened with 134 patients meeting criteria for MDD, 27 with
minor depression, and 495 patients did not meet criteria for either major or minor depression.
Results were similar for trees of 6 and 11 nodes; therefore the 6-node tree was selected as the
most parsimonious choice. An average of 4.2 items per participant (max = 6) was administered.
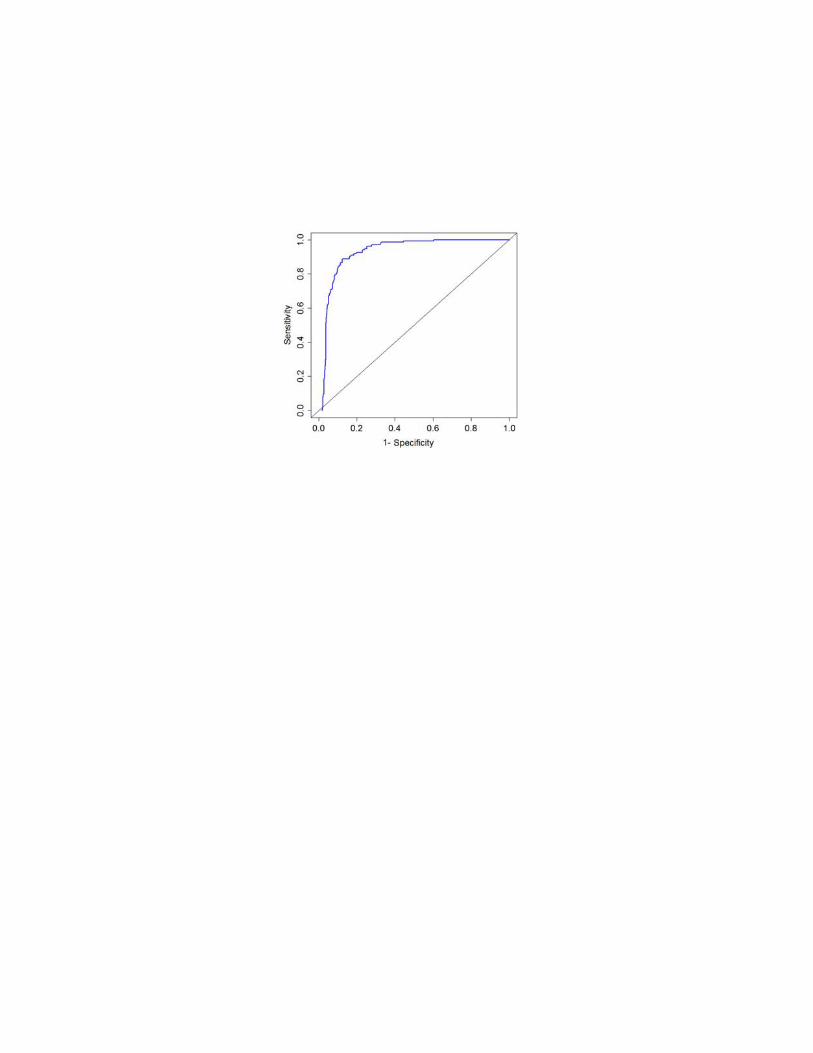
The overall sensitivity and specificity for MDD were 0.95 and 0.87 respectively. Following
cross-validation, results were similar (sensitivity = 0.94 and specificity = 0.82). Figure 2 displays
the entire cross-validated ROC curve, showing the balance between sensitivity (true positives)
and 1-specificity (false positives) throughout the decision space. By comparison, the PHQ-9
MDD diagnostic screen provided sensitivity of 0.70 and specificity of 0.91; the PHQ-9 screen for
both other depressive disorder and MDD provided sensitivity of 0.83 and specificity of 0.82;
PHQ-2 sensitivity of 0.86 and specificity of 0.86; and simple PHQ-9 screen (total score of 10 or
more) sensitivity of 0.85 and specificity of 0.79.
Place Figure 2 Here
For the CAD-MDD, PPV was 0.66 95% CI (0.62, 0.68) and NPV was 0.98 95% CI (0.97, 0.99).
For the PHQ-9, PPV was 0.81 95% CI (0.72, 0.88) and NPV was 0.84 95% CI (0.80, 0.88).
Among patients with minor depressive disorder, 20/27 = 0.74 (or 74%) were classified as
having a depressive disorder, whereas the other 26% were classified as non-depressed cases.
This finding reveals that roughly three quarters of patients with minor depression or dysthymia
will be identified via this screening tool.
To illustrate the methodology, two sample testing sessions and the questions and
responses that were administered to a low-severity patient without MDD and a high severity
patient with MDD are presented in Table 2. The resulting MDD diagnoses were negative for the
1st patient with confidence of 96.4% and positive for the 2nd patient with confidence of 99.3%.
Overall, the average assessment time was 46 seconds (standard deviation = 29 seconds).
Faster times are likely using a touch-screen interface as illustrated by the testing times of 36
seconds using this interface in Table 2.
In terms of patient satisfaction, 94.4% gave a positive overall rating of the computer
questionnaire, and 91% said they would prefer to answer these questions on a computer. 97%
of participants stated that they tried to answer honestly and accurately with the remainder
answering “neutral.” In response to the question “how much did the questions describe your
experience with mood problems?” 30.8% answered “A great deal” 38.2% answered “Very much”
and 24.6% answered “Somewhat.”
Discussion
Results of this study reveal that we can achieve high sensitivity and reasonable
specificity for a clinician-based DSM-IV diagnosis of depression, using an average of 4 self-
report items. The entire diagnostic screening test requires less than a minute and can be
administered via a cloud-computing environment over the Internet to smart-phones, tablets,
notebooks, and personal computers. Cross-validated sensitivity of 0.94 indicates that we will
rarely miss a validated case of current depressive disorder and the cross-validated specificity of
0.82 indicates that approximately 18% of patients that did not meet criteria for MDD would be
identified as having a possible depressive disorder and would require further evaluation and/or
treatment. Results for the PHQ were more varied. The PHQ-9 depression diagnostic screen
algorithm had high specificity of 0.91 (i.e., low false positive rate) but poor sensitivity 0.70 (high
false negative rate). The simple PHQ-2 appeared to provide a better balance with sensitivity
and specificity of 0.86 (from 0.70 and 0.91) and the simple PHQ-9 threshold of 10 or more
increased sensitivity to 0.85 (from 0.70), at the cost of decreasing specificity to 0.79 (from 0.91).
Compared with all of the PHQ scoring methods, the CAD-MDD produced considerably higher
sensitivity with comparable specificity.
The PPV and NPV estimates point out important differences between the CAD-MDD and
PHQ-9 and their utility for diagnostic screening. The exceptionally high NPV indicates that it is
extremely rare that the CAD-MDD will miss a real case, which is consistent with the high
sensitivity of the CAD-MDD. The lower NPV for the PHQ-9 is consistent with the lower
sensitivity and indicates that a fair number of true cases will be screened negative. By contrast,
the PHQ-9 has higher PPV and specificity, indicating that when it is positive, there is high
probability that it is a true case. As previously noted this makes the PHQ-9 better for case
finding than diagnostic screening; however, this is not the real objective of either test. It should
be noted that PPV and NPV are highly dependent on prevalence. The prevalence in our study
may not be representative of the prevalence of MDD in the general population, making these
measures of validity less useful.
We have evaluated the CAD-MDD in psychiatric settings to ensure that we have a large
number of true cases so that we can obtain a function that maximally differentiates cases from
controls. We have also included a large number of non-psychiatric controls to insure that the
CAD-MDD will work well both in mental health and non-mental health settings. Ultimately the
use of the CAD-MDD will be in settings such as primary care where treatment is not necessarily
for a psychiatric indication and its role as an effective screener can be the primary focus. In
psychiatric populations, the CAT-DI would usually be used to monitor the effectiveness of
treatment in patients presenting with a psychiatric illness.
Traditional fixed-length short-form tests such as the PHQ-9 have been used both for the
purpose of diagnostic screening and measurement of severity. At first, this may seem
advantageous, but it is not. The measurement of severity should focus on maximizing
information at the true level of severity of the individual. By contrast, a screening measure
should focus on maximizing information at the point at which the diagnosis shifts from negative
to positive. These are two very different types of measurement problems and lead to very
different statistical foundations. Developing different instruments for screening (e.g. the CAD-
MDD) and measurement (the CAT-DI) increases both accuracy and precision and minimizes
burden because those patients screening positive will have only taken an average of 4 items
rather than an average of 12 items used to measure severity.
There are several limitations of this study. The patient sample was largely a psychiatric
sample, and it is unclear what the sensitivity and specificity of the CAD-MDD is in a primary care
setting or medical inpatient setting. While the overall rate of MDD in the full sample of patients
and controls based on the SCID was 20.4%, among the psychiatric patient sample, the rate was
51.7%, which is considerably higher than would be observed in general medical settings. The
decision trees were based on an adult sample from the Pittsburgh area and as a consequence
may not directly apply to the assessment of depression in children, the elderly, or cultural
groups such as Latinos not represented in the Pittsburgh area. Further study of the
generalizability of our results to these populations is required. While sensitivity of the CAD-
MDD is extremely high, specificity is more modest. This may, in fact, be an advantage for large-
scale screening where patients who do not meet DSM criteria for MDD may still have significant
psychopathology and deserve further assessment. Finally, we excluded subjects with current
substance abuse. Further study of the generalizability of our results to patients with substance
abuse would be of considerable interest.
Recent developments in the IRT/CAT literature in the area of diagnostic classification
are also starting to emerge (13, 14). The principal difference between the CAD-MDD and
diagnostic classification CAT is that the former requires an external criterion such as a clinician-
based diagnosis and the latter involves a latent classification (14). The basic idea is to adapt
CAT to an underlying latent class model for an underlying binary classification instead of the
traditional use of CAT for a continuous latent variable based on IRT. Although beyond the
scope of this paper, it would be quite interesting to compare the results of the current approach
in which an external criterion is used to the alternative criterion-free approach based on an
underlying latent class model.

Not surprisingly, the results of our study revealed that the CAD-MDD is even more
sensitive and specific for diagnostic screening than the CAT-DI, which was developed to provide
a dimensional severity measure of depression. What is surprising is that it can achieve these
levels of sensitivity and specificity using an average of only 4 items. We now have the ability to
efficiently screen large populations for MDD. Additional potential applications include screening
depression in primary care, assessing mental health phenotypes for genetic studies, and large-
scale psychiatric epidemiologic studies.
References
1. Gibbons RD, Weiss DJ, Pilkonis PA, Frank E, Moore T, Kim JB and Kupfer DJ. The CAT-DI: A computerized adaptive test for depression. Archives of General Psychiatry. 2012;69:1104-1112.
2. Brieman L. Random Forests. Machine Learning. 2001;45:5-32.
3. Brieman L, Friedman JH, Olshen R, Stone C. Classification and Regression Trees.
Wadsworth, 1984.
4. Quinlan R, C4.5: Programs for Machine Learning. Morgan Kaufmann, 1993.
5. Hastie T, Tibshirani R, Friedman JH. Elements of Statistical Learning. Springer, 2009.
6. Brieman L. Bagging Predictors. Machine Learning. 1996;24:123-140
7. Freund Y, Shapire R. Experiments with a New Boosting Algorithm, Machine Learning: Proceedings of the Thirteenth International Conference, Morgan Kauffman, pp148-156, 1996.
8. Friedman JH. Greedy Function Approximation: A Gradient Boosting Machine, Annals of
Statistics. 2001;29:1189-1232.
9. Liaw A, Wiener M. Classification and Regression by Random Forest. R News. 2002;2:18-22.
10. Kroenke K, Spitzer RL, Williams JBW. The PHQ-9: Validity of a Brief Depression
Severity Measure. J Gen Intern Med, 2001;16(9):606–613.
11. First MB, Spitzer RL, Gibbon M, Williams JBW. Structured Clinical Interview for DSM-IV Axis I Disorders – Patient Edition (SCID-I/P, Version 2.0, Biometrics Research Department, New York State Psychiatric Institute, 1995.
12. Kobak KA, Brown B, Sharp L, Levy-Mack H, Wells K, Ockun F, Williams JB. Sources of unreliability in depression ratings. J Clin Psychopharmacol. 2009;29:82-85.
13. Smits N, Cuijpers P, van Stratan A. Applying computerized adaptive testing to the CES-D: A simulation study. Psychiatry Research. 2011;188:147-155.
14. Cheng Y, When cognitive diagnosis meets computerized adaptive testing: CD-CAT, Psychometrika, 2009;74:619-632.
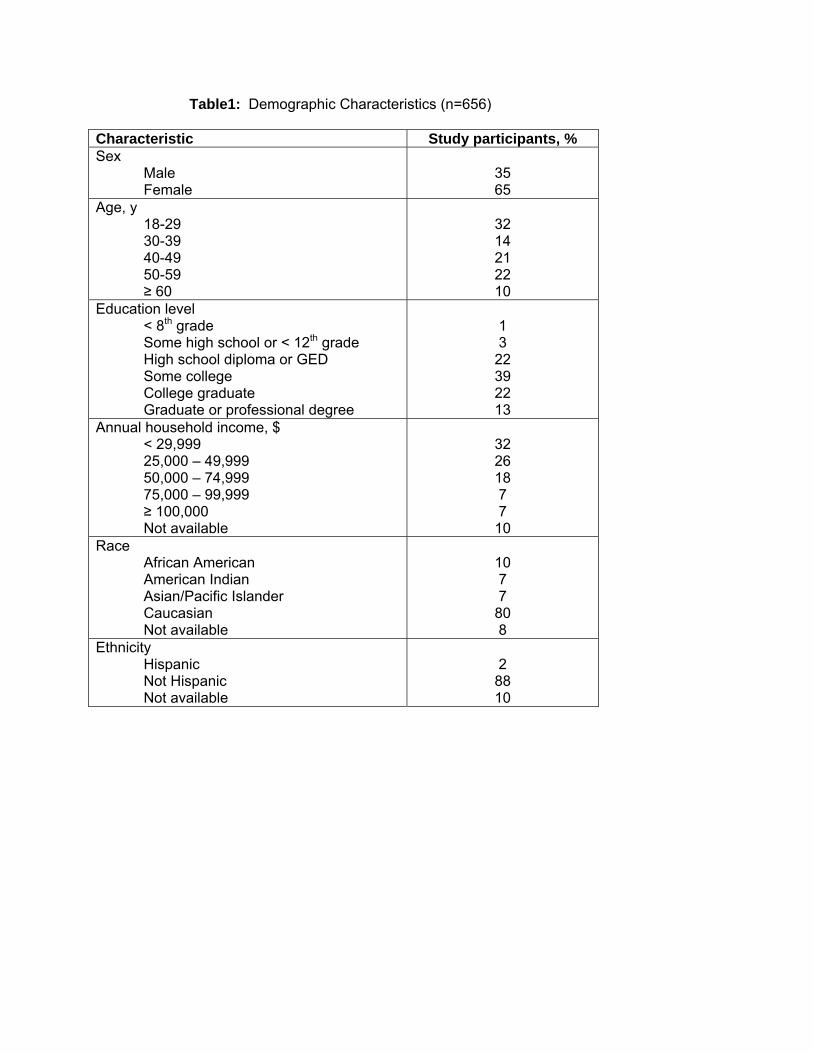
Table1: Demographic Characteristics (n=656)
Characteristic Study participants, % Sex
Male Female
35 65
Age, y 18-29 30-39 40-49 50-59 ≥ 60
32 14 21 22 10
Education level < 8th grade Some high school or < 12th grade High school diploma or GED Some college College graduate Graduate or professional degree
1 3
22 39 22 13
Annual household income, $ < 29,999 25,000 – 49,999 50,000 – 74,999 75,000 – 99,999 ≥ 100,000 Not available
32 26 18 7 7
10 Race
African American American Indian Asian/Pacific Islander Caucasian Not available
10 7 7
80 8
Ethnicity Hispanic Not Hispanic Not available
2
88 10
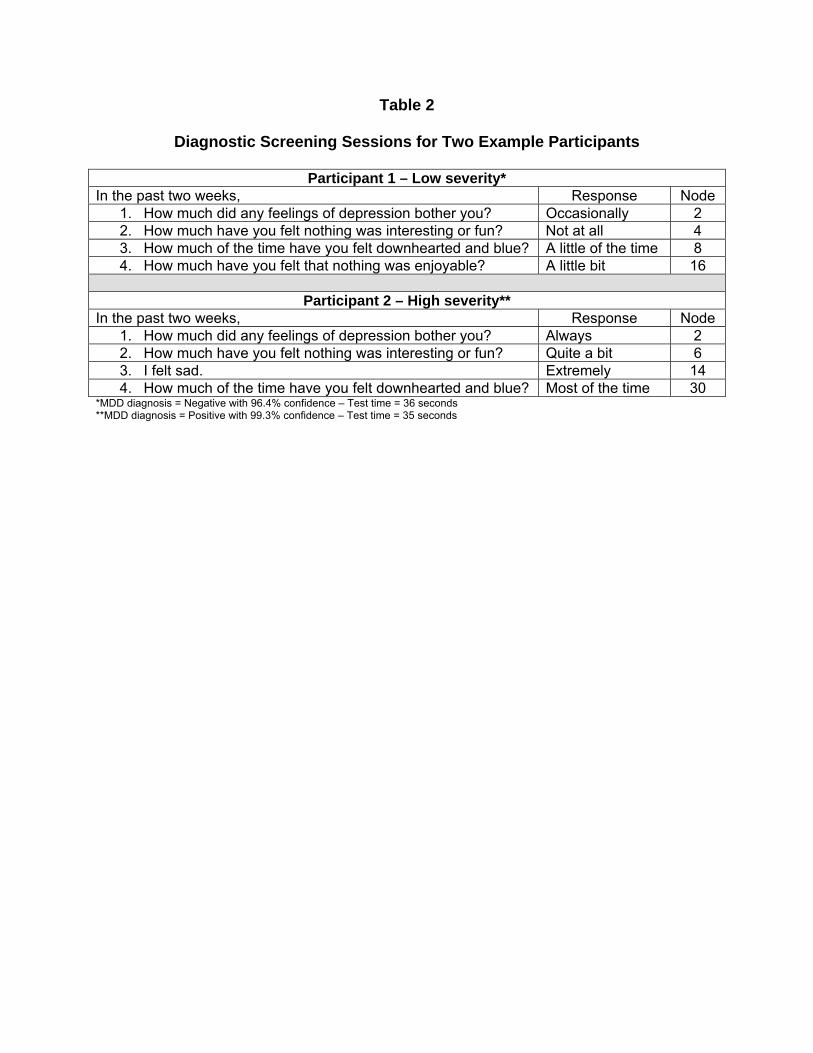
Table 2
Diagnostic Screening Sessions for Two Example Participants
Participant 1 – Low severity* In the past two weeks, Response Node
1. How much did any feelings of depression bother you? Occasionally 2 2. How much have you felt nothing was interesting or fun? Not at all 4 3. How much of the time have you felt downhearted and blue? A little of the time 8 4. How much have you felt that nothing was enjoyable? A little bit 16
Participant 2 – High severity**
In the past two weeks, Response Node 1. How much did any feelings of depression bother you? Always 2 2. How much have you felt nothing was interesting or fun? Quite a bit 6 3. I felt sad. Extremely 14 4. How much of the time have you felt downhearted and blue? Most of the time 30
*MDD diagnosis = Negative with 96.4% confidence – Test time = 36 seconds **MDD diagnosis = Positive with 99.3% confidence – Test time = 35 seconds

Figure Legends Figure 1: Example Decision Tree Figure 2: Cross-validated (CV) Receiver Operator Characteristic (ROC) Curve