Embed Size (px)
Citation preview

The Burning Question -Chlorine & Dioxin
Written by Pat CostnerApril 1997
Table of ContentsForeword
Executive Summary
Introduction
Chapter 1: Scope of the ASME Report• Dioxin Output• Dioxin Stack Emissions• Dioxin Concentrations in Stack Gases• Chlorine Input• Chlorine Input to Municipal Combustors and Medical Waste Incinerators• Chlorine Input to Hazardous Waste Incinerators and Boilers and Industrial FurnacesChapter 2: Statistical Analysis• Basic Elements of Statistical Analysis• Sample Size and QualityChapter 3: Confounding Factors• Design and Operating Conditions• Sample Collection and Analysis• Limitations to Data from Full-Scale CombustorsChapter 4: Municipal Waste Combustors• Analysis by Rigo et al.• Greenpeace Analysis of Raw Data from Rigo et al.• Table 4-1: Municipal Waste Combustors - Statistical Values by Rigo et al.• Table 4-2: Municipal Waste Combustors - Statistical Values by Greenpeace• Table 4-3: Municipal Waste Combustors - Locations and Numbers (inserted in text)Chapter 5: Medical Waste Incinerators• Analysis by Rigo et al.• Greenpeace Analysis of Raw Data from Rigo et al.• Table 5-1: Medical Waste Incinerators - Statistical Values by Rigo et al.• Table 5-2: Medical Waste Incinerators - Statistical Values by GreenpeaceChapter 6: Hazardous Waste Incinerators• Comparisons of Percent Chlorine in Feed and Dioxin Concentrations• Comparisons of Chlorine Feedrates and Dioxin Concentrations• Table 6-1: Hazardous Waste Incinerators - Statistical Values by Rigo et al. (Percent
Chlorine in Feed vs. Dioxin Concentrations)• Table 6-2: Hazardous Waste Incinerators - Statistical Values by Greenpeace (Percent
Chlorine in Feed vs. Dioxin Concentrations)• Table 6-3: Hazardous Waste Incinerators - Statistical Values by Greenpeace
(Chlorine Feedrate vs. Dioxin Concentrations)Chapter 7: Boilers and Industrial Furnaces

Chapter 8: Cement Kilns• Analysis by Rigo et al.• Greenpeace Analysis of Raw Data from Rigo et al.• Table 8-1: Cement Kilns - Chlorine Feedrates vs. Dioxin Concentrations in Gas
Streams, Raw Data from Rigo et al.Chapter 9: Biomass CombustorsChapter 10: Hydrogen Chloride Concentrations in Stack Gases as
Indicators of Chlorine Input• Non-Synchronicity of HCI and Dioxin Data• Conversion of Chlorine in Wastes to Hydrogen Chloride (HCI)• Accuracy and Precision of Hydrogen Chloride MeasurementsChapter 11: Quality and Comparability of Dioxin Data• Factors Affecting Data Quality• Limitations of USEPA Method 23
FiguresFigure 4-1: Municipal Waste Combustors - Correlation Coefficients from Rigo et al.Figure 4-2: Municipal Waste Combustors - Scatter Plot from Rigo et al.Figure 4-3:Municipal Waste Combustors - MERC aggregate dataFigure 4-4: Municipal Waste Combustors - MERC Stack DataFigure 4-5: Municipal Waste Combustors - MERC Outlet DataFigure 4-6: Municipal Waste Combustors - Correlation Coefficients by GreenpeaceFigure 5-1: Medical Waste Incinerators - Statistical Values by Rigo et al.Figure 5-2: Medical Waste Incinerators - Scatter Plot by Rigo et al.Figure 5-3: Medical Waste Incinerators - Scatter Plot by Rigo et al.Figure 5-4: Medical Waste Incinerators - Statistical Values by GreenpeaceFigure 6-1: Hazardous Waste Incinerators - Statistical Values by Rigo et al.Figure 6-2: Hazardous Waste Incinerators - Scatter Plot by Rigo et al.Figure 6-3: Hazardous Waste Incinerators - Scatter Plot by Rigo et al.Figure 6-4: Hazardous Waste Incinerators - Statistical Values by Greenpeace (Percent
Chlorine in Feed vs. Dioxin Concentrations)Figure 6-5: Hazardous Waste Incinerators - Statistical Values by Greenpeace (Chlorine
Feedrate vs. Dioxin Concentrations)Figure 6-6: Hazardous Waste Incinerators - Statistical Values by Greenpeace of
Aggregated and Individual Data SetsFigure 6-7: Hazardous Waste Incinerators - Statistical Values by Greenpeace:
Comparison of Correlation Coefficients for Percent Chlorine in Feed versus DioxinConcentrations with Correlation Coefficients for Chlorine Feedrates versus DioxinConcentrations
Figure 8-1: Cement Kilns - Statistical Values by Greenpeace (Chlorine Feedrate versusDioxin Concentrations)

ForewordIn 1995, a new scientific study emerged in policy debates around the world concerningdioxin prevention strategies. The conclusions of the study, by H. G. Rigo et al. entitled"The Relationship Between Chlorine in Waste Streams and Dioxin Emissions FromWaste Combustor Stacks," published by the American Society of Mechanical Engineers(ASME), are used to support the contention that there is no link between PVC or chlorinewaste inputs to incinerators and the amount of dioxin output. This study is frequentlycited by the chlorine industry as an authoritative rebuttal to cleaner material substitutionpolicies.
Greenpeace decided to ask our Science Unit to review the ASME study for two reasons:
1. The conclusions point in a different direction than most other published technicalliterature on the topic; and
2. Primary funding ($150,000 US) for the study was provided by the Vinyl Institute(VI), a trade association representing corporations that manufacture polyvinylchloride plastic (PVC) and its chemical feedstocks.
Our review shows that a surprisingly higher degree of correlation exists betweenchlorine input and dioxin stack emissions than is concluded by the ASME report. Overand above these discrepancies, the data and methodologies are inappropriate and/orunreliable for assessing the relationship between chlorine inputs and dioxi n outputs fromincinerators.
Independent Investigation Needed
Our review raises serious questions about Rigo et al.'s methodology and the validity ofthe study's conclusions.
Greenpeace therefore calls upon the American Society of Mechanical Engineers andothers to carry out a new review and an independent investigation into the Rigo study andits conclusions. An independent review should evaluate the statistical methodologiesused, the appropriateness and reliability of using surrogates for chlorine inputs and dioxinoutputs, the reliability of the data used, and limiting the analysis to air emissions ofdioxin instead of total dioxin output.
We suggest that the following are some of the questions that should also be asked:
• Was the Rigo et al. study diligently and rigorously peer reviewed by scientists withno financial ties to the Vinyl Institute and its members?
• Is it possible that Rigo's perception of his client's expectations might haveinappropriately biased the study's design and/or its reported conclusions?

• Did the American Society of Mechanical Engineers properly oversee the work andguarantee its integrity?
• To what extent has the Rigo et al. study and its conclusions affected policy decisionsby government agencies and/or by private sector decision-makers?
How and Why the ASME Study was Commissioned
The Vinyl Institute needed a report to aggressively defend PVC during dioxin discussionsin the USA. On September 6, 1994, one week prior to the scheduled release of the DraftDioxin Reassessment Report by the United States Environmental Protection Agency(EPA), Robert Burnett, the Executive Director of VI, circulated an internal memorandumon crisis management to the members of his Executive Board. Attached to thememorandum was a plan entitled: "Crisis Communications Protocol for the VinylInstitute" that had been prepared by a special VI working group.
Burnett, whose organization represents the American corporations that manufacture andmarket PVC, was expecting the worst. His group's "Crisis Communications Protocol"starts with a "Situation Analysis" that states:
"EPA will likely conclude that the incineration of chlorinated compoundsis the single largest known contributor to dioxin."
The "Situation Analysis" also asserts:
"Because of the aggressive tactics of Greenpeace and others pointing toPVC as a primary source of dioxin, we believe that PVC will bespecifically mentioned [in the EPA report], and potentially slated forfurther regulation. This belief is supported by recent communications withEPA officials by Bob Burnett on behalf of the Vinyl Institute and membersof the Vinyl Institute on behalf of their individual companies."
As it turned out, in this instance, VI's concerns were not fully warranted. It appears BobBurnett and his associates, in their "communications with EPA officials" had been morepersuasive than they thought. Although EPA's report did contain much evidence thatpoints towards the conclusions Burnett and his organization most feared, the Agencychose not to highlight PVC or other chlorinated compounds as primary sources of dioxinin its 1994 report release.
But VI understood that this issue was not going away. With the immediate crisis in hand,activity shifted to what the memorandum defined as VI's two "long-term goals of crisiscommunication: To avoid deselection of PVC by major customers; and to preventpunitive regulation of PVC."

The means to achieve this, as detailed in the memorandum, includes activities to:
"…aggressively defend the industry's credibility through the use of thirdparty sources to debunk Greenpeace's — or even EPA's — misleadingclaims."
This is where Rigo enters the picture. VI made a decision whose effect would be tonominate and encourage Rigo to serve in a role that might be described as "VI designatedthird party." As outlined in the Crisis Communication Protocol, the third party's assignedrole is to debunk the conclusion "that the incineration of chlorinated compounds is thesingle largest known contributor to dioxin."
The way this was achieved is described in a memorandum dated August, 22, 1994 fromDon Goodman, chairman of VI's Incineration Task Force. Membership in this smallworking group included representatives of Geon, Dow and Oxychem, three of the largestUS producers of PVC and its feedstock chemicals. The Chlorine Chemistry Council ofthe Chemical Manufacturers Association (CCC) was also represented. The Goodmanmemo begins:
"The Vinyl Institute has created an Incineration Task Force inanticipation of adverse EPA actions regarding dioxins and furans. Afterthe dioxin reassessment, we believe EPA will focus on dioxins fromincineration, particularly the incineration of municipal waste (MSW),hospital waste (MW), and plant industrial waste (HWI & BIF) containing(high) levels of PVC and HCL."
An academic named Dick Magee also served as a member of the Incineration Task Force.Magee was the author of a 1989 study for the Society of Plastics Industry that had foundno link between PVC and dioxin emissions from municipal incinerators. Within VI,Magee had earned the title "Lead Contact" for incineration projects according to anAugust 1993 VI Status Report. He also served as an active member of ASME.
According to Goodman's memo:
"Dick Magee brought forward a proposal from the American Society ofMechanical Engineers (ASME) to hire Rigo & Rigo Associates, Inc. ofCleveland, Ohio. The purpose of ASME as the contractor is to provideunassailable objectivity to the study. The ASME oversight and reviewcommittee will bring independent reviewers (including EPA members) andhigh level peer reviewed documentation and reports."
The memo goes on to state that the VI Incineration Task Force:
"interviewed Dr. H. Gregory (Greg) Rigo, principal of Rigo & RigoAssociates, Inc. by phone and found him to be extremely knowledgeable ...

He is also user friendly (i.e. willing to set his priorities to our needs) andappears to be sympathetic to Plastics, Vinyl, PVC and Cl2."
In discussing the amount of money VI would need to pay Rigo and the ASME to performthe study, Goodman clearly implied in his memo that working group members werealready assuming that Rigo's study, when completed, would reach conclusions in supportof VI's objectives. The memo proposes a budget item to provide funds that could be usedto allow Rigo to advocate on behalf of VI policy using his anticipated report as a basis.At this time, the study that would provide a basis for this report had not yet been designednor had any work on it begun. As the memo states:
"Since there are many unanswered questions regarding dioxins and sinceVI may want to use Greg Rigo as an expert witness or advocate to talkabout the report, I am proposing an additional $20,000 as a contingencyfund."
One can conclude from the above that there was some expectation that Rigo's study, onbehalf of the ASME, would produce conclusions that would be useful to VI.
Often, chemical industry representatives refer to this study as a joint"government/industry" project. This is not altogether untrue.
A small portion of funds provided to the study (under $15,000 US) came fromEnvironment Canada. In addition, some employees of the US EPA provided peer review.One US EPA employee, James Kilgroe, not only provided peer review, but also traveledto Amsterdam, the Netherlands and formally presented the ASME study and its findingsto a meeting of the 16th International Symposium on Chlorinated Dioxins, PCBs andRelated Compounds.
Did peer reviewers working for the US EPA diligently and rigorously do their work? WasKilgroe authorized to present the ASME study at the Amsterdam scientific conference?In doing so, did Kilgroe convey to others present that the US EPA endorses the ASMEstudy and its conclusions?
We would also like to know whether Environment Canada considers itself to be a sponsorof this study. (In our phone interviews, it seemed to downplay its involvement.) And ifthey do consider themselves a sponsor, did Environment Canada perform its ownindependent assessment of the validity of the study's methodology and the reliability ofits reported conclusions?
Cleaner Materials Policies Challenged
Scientific integrity, however, is not the only question that potentially arises. Rigo et al.'sstudy and its conclusions have been widely and effectively used to influence publicpolicy decisions by governments in several countries and also purchasing decisionswithin the private sector.
Chemical industry representatives cite ASME as proof that incineration of chlorinatedcompounds does not contribute to dioxin generation and release. A fact sheet distributedby the CCC entitled "Waste Combustors and Dioxin" cites Rigo et al. as its authority forthe assertion that "…the amount of chlorinated wastes burned in a combustor[incinerator] does not correlate to dioxin emissions from these facilities."
The PVC industry, in particular, has used Rigo et al. to counter arguments put forward byadvocates for public health and the environment who propose alternative cleanermaterials policies to prevent dioxin generation at its source. Alternative materials policiesstem from two circumstances: (1) dioxins are formed when materials containing carbon,hydrogen, oxygen and chlorine are subjected to elevated temperatures, such as those ofwaste combustors and accidental fires, as well as other reactive conditions; and (2) inmost cases, chlorine is the limiting element for dioxin formation, since carbon, hydrogen,and oxygen are typically present in far greater abundance. With an alternative materialspolicy, the material that provides the chlorine for dioxin formation is replaced by anappropriate, chlorine-free material.
This is a practical way to prevent dioxin generation. As an example, PVC is the singlelargest use of global elemental chlorine, and its production is expanding. It is also knownthat dioxin is generated as a byproduct during its production, on a site specific basis, aswell as via its use or disposal when burned. These are strong grounds for believing PVCis responsible for a substantial and growing proportion of global dioxin production andemissions. While cleaner substitutes exist for almost all uses of PVC, their adoption isheavily challenged by the chlorine industry.
At present, the most contentious issue around dioxin abatement strategies is on PVC andincineration. Chemical industry representatives strongly dispute the assertion that dioxinis generated by incinerators. As a result of the combustion of PVC plastic, chlorinatedsolvents and other chlorinated organic materials. To make this case, industryrepresentatives generally cite Rigo et al. because much of the other technical literature onthis topic points in the opposite direction.
Case Examples
Once an evaluation of the Rigo et al. study method and conclusions has been completed,it is important to review how this study's conclusions have been used in efforts toinfluence public policy. We conclude with a number of case examples from severalregions of the world.
1) PVC and Hospital Waste in the USA
Kip Howlett, Managing Director of the CCC, sent a letter dated August 29, 1996 toAnthony Robbins, M.D., editor of Public Health Reports, the Journal of the US PublicHealth Service. The letter protests the Journal's publication of an article entitled:
"Hospitals and Plastics: Dioxin Prevention and Medical Waste Incineration." Howlettasserts:
"The author incorrectly states that 'Iatrogenic* dioxin pollution can belargely eliminated by replacing PVC products with alternative materials.'In a government/industry funded peer-reviewed study conducted under theauspices of the American Society of Mechanical Engineers, the findingsregarding waste streams and incinerators were conclusive: 'The failure tofind simultaneous increases in most cases and finding a few inverserelationships, indicates that whatever effect waste feed chlorine has on[dioxin] concentrations in combustor flue gases, it is smaller than theinfluence of the causative factors.'"
Robbins also received a second letter of complaint from William Carroll of OccidentalChemical who challenged the competence of the authors and the judgment of thejournal's editor. After quoting ASME, Carroll's letter continues:
"Perhaps it would be of greater service to your readers to publish an articleon medical waste incineration written by a technical expert in the field."
Later in 1996, the authors of the journal article introduced a resolution at the annualmeeting of the American Public Health Association (APHA) restating the article'sarguments and its recommendations to hospitals. Despite active lobbying from the CCCand other chemical industry interests against the APHA resolution, it was unanimouslyadopted. The resolution calls on health care facilities to explore ways to reduce oreliminate their use of PVC and adopt policies to encourage these practices.
2) PVC Packaging in Spain
Issues surrounding municipal incineration have been fiercely debated in Spain for manyyears. In 1995, in response to concerns about dioxin generation from incinerators, theSpanish government proposed a measure that would achieve a twenty percent reductionin PVC packaging within five years. Intense lobbying and a change in political parties ledto the initiative being dropped. However, opposition parties tried to bring PVC reductionback to the political table. During this time the PVC industry initiated and has sinceintensified its campaign to promote PVC as an environmentally sound material.
Support for PVC is organized in Spain by the largest public relations firm in the world,Burson-Marsteller. Employees of this firm accompany the PVC industry in lobbying andpublic outreach work. They aggressively target communities who propose PVC reductionpolicies and particularly target journalists who write critically about PVC products anddioxin. An article opposing PVC or incineration is often followed by a phone call to thejournal's owners complaining of bias and distorted facts. In response, APIA, the Spanishassociation of environmental journalists, awarded Burson-Marsteller its anti-environmental award for 1996.

One pro-PVC leaflet distributed by Burson-Marsteller is entitled "The Reality of PVCversus Greenpeace Accusations." This leaflet cites ASME, 1995 as its reference for theassertion: "…the emissions of dioxins from municipal incinerators is independent of thepresence of PVC in the waste."
Another document distributed by Burson-Marsteller is an October, 1996 paper signed bythe National Association of Electrochemistry (whose address is the same as that ofSolvay, one of Spain's largest chlorine producers). This paper cites ASME to conclude:
“ . . .there is no relation between production of dioxins in municipal wasteincinerators and PVC content of waste. A recent study promoted by theAmerican Society of Mechanical Engineers in the USA entitled, 'TheRelationship Between Chlorine in Waste Streams and Dioxin Emissionsfrom Waste Combustor Stacks' 6/1/95, confirms the conclusion indicatedabove. This study is based on the analysis of more than 1,700 samplesfrom 155 incinerators."
In 1997, in a public debate about packaging regulations in Spain, Solvay made apresentation entitled "What are the consequences of the packaging law for the PVCindustry?" It concludes:
"…In-depth studies clearly show the fault of pseudo scientific claims of theradical environmental groups. In favour of PVC we can cite the recentstudy made by Dr. Rappe, the world's most prestigious expert on dioxin,as well as from the American Society of Mechanical Engineers, theSwedish Environmental Agency and the USA EPA. All of themcategorically state that there is no relationship between PVC content inwastes and the formation of dioxin in the treatment plants that comply tothe European Union Directive on Incineration."
3) Global Negotiations on Persistent Organic Pollutants
As reported in Chemical Week, February 26, 1997:
"The international community aims to establish a legally binding treaty onpersistent organic pollutants (POPs) by 2000. Detailed negotiations willbegin early next year under the umbrella of the UN EnvironmentalProgram (UNEP) and the Intergovernmental Forum on Chemical Safety(IFCS)."
The goal of such an international agreement will be to mandate action by governments toreduce and /or eliminate POPs. These are highly toxic substances that can travel longdistances across international boundaries on air and water currents. Action will start witha short list that includes certain chlorinated pesticides such as DDT, chlordane andheptachlor, as well as dioxins and furans.
Chemical Week reports that while the chemical industry is not overly concerned withmany of the issues that will be addressed during intergovernmental POPs negotiations,
"…the industry is keeping a close eye on regulation of dioxins and furans,which can be released during production, use and destruction of manychlorinated organic compounds. 'We want to make sure any regulation isbased on sound science,' says Kip Howlett, executive director of theChlorine Chemistry Council."
When Howlett says "sound science," however, what he really means is "Vinyl Institutescience."
During 1996, two meetings were held at which the scientific and technical framework forintergovernmental negotiations on POPs were debated and established. One took place inMarch in Canberra, Australia; the other in June in Manila, the Philippines. At bothmeetings, chemical industry representatives distributed copies of the Executive Summaryof Rigo et al. together with explanatory materials. During the Canberra meeting, forexample, VI distributed a press release stating:
"The world's vinyl plastic industry today shared with officials attending aUnited Nations conference here the results of tests in the United States,Europe, Japan and Australia underscoring the positive environmentalperformance of the vinyl production process and of vinyl productsthroughout their life cycle."
Among the findings cited:
"An exhaustive study by the American Society of Mechanical Engineers(ASME International) which analyzed 1,900 results from incinerator stacktests worldwide and concluded that there is no direct relationship betweenchlorine and dioxin in incineration."
Greenpeace representatives at the meetings argued that an effective global policypointing toward dioxin elimination must incorporate measures that will encouragesubstitution of appropriate alternative materials for PVC and for other dioxin precursormaterials. In preliminary negotiations, governments decided to consider both approachesfor dioxin abatement: alternative materials policies and improved pollution controldevices. Without a doubt, intense international debate will now take place.
4) PVC Waste Report in Sweden
In 1996 the Swedish government set up a Chemical Committee to review Swedishpolicies including a review of hazards from the PVC lifecycle. A governmentcommission had declared that PVC had no place in a sustainable society and this led tocalls for a phase-out implementation program. The Swedish Environmental ProtectionAgency was given the task of reviewing PVC waste management and in a 1996

government report entitled "Disposal of PVC Waste" that cites the ASME report, itconcludes:
"A reduction in the PVC content of waste will not change the amount ofemissions from dioxins in flue gases from waste incineration plants inSweden."
Using this and other submissions, the Chemical Committee is due to report to theSwedish government by June 1997.
5) PVC Building Materials in Australia
An Australian report entitled "The Environmental Aspects of the Use of PVC in BuildingProducts" was commissioned by the Plastics and Chemicals Industries Association ofAustralia. It discusses the incineration of PVC waste and concludes:
"In a report published by the American Society of Mechanical Engineers(ASME, 1995) it was concluded from existing data that the dioxinconcentrations in flue gas from MSW incinerators could not be correlatedwith fuel chlorine content. Any effect that chlorine had on the dioxinconcentrations from commercial scale systems was masked by the effect ofthe air pollution control system temperature, ash chemistry, combustionconditions, measurement imprecision, and localized flow stratification."
This has been used by the Australian PVC industry in an effort to weaken the Sydney2000 Olympic Guidelines which incorporate the concept of ecologically sustainabledevelopment, including "minimizing and ideally avoiding the use of chlorine basedproducts (organochlorines) such as PCBs, PVC and chlorine bleached paper."
6) The Barcelona Convention for the Mediterranean
In June 1995, the Barcelona Convention for the Protection of the Mediterranean SeaAgainst Pollution from Land-Based Sources, decided to eliminate by 2005 the greatestpossible number of substances which are toxic, persistent and liable to bioaccumulate, inparticular organohalogens. The following year, a Meeting of Experts was convened inAthens and agreed to binding regional action plans and programs to phase-out toxic,persistent and bioaccumulative inputs with measures and timetables for theirimplementation.
The protocol was signed by 14 countries bordering the Mediterranean: Albania, Croatia,Cyprus, France, Greece, Israel, Italy, Malta, Monaco, Morocco, Slovenia, Spain, Tunisiaand Turkey. Then, in October 1996, at a conference to develop strategies for action, aUNEP background document was presented. It noted:
"Total disagreement to PVC phase-out as a strategy to reduce emissionsof dioxins and furans to the environment was expressed by industry

participants in the preparatory process towards the present BackgroundDocument...The hypothesis that there exists a relation between fuelchlorine content and combustor flue gas dioxins concentrations, includingall the chlorinated dibenzo(p)dioxins and dibenzofuran isomers was notconfirmed by ASME-controlled research and several other studies."
With the ASME report as the defense to take no action, the UNEP meeting resulted in astrangling debate. At issue was a dioxin elimination policy based on incineration design.The final draft document did not set any timelines or strategies towards achieving thedecision to eliminate organohalogen inputs into the Mediterranean. The mandate given tothis meeting did not result in timelines and specific elimination goals as requested by theprior Meeting of Experts in Athens.
Conclusion
As we have shown, the ASME report has been widely used to obstruct cleaner materialspolicies. Given the serious wildlife and human health dangers associated with dioxinexposure, Greenpeace calls upon ASME to carry out a new review and an independentinvestigation of the report's conclusions. In addition, governments should withdraw anyuse of the ASME report pending the outcome of the investigation.
Jack Weinberg, Team Leader, Greenpeace International Working Groupon Persistent Organic Pollutants (POPs);
Lisa Finaldi, Coordinator, Greenpeace International Toxics Campaign

Executive SummaryIn 1995, the American Society of Mechanical Engineers (ASME) published the report,"The Relationship Between Chlorine in Waste Streams and Dioxin Emissions FromWaste Combustor Stacks," [a] which was prepared by H.G. Rigo, A.J. Chandler and W.S.Lanier. Funding was provided by The Vinyl Institute and the Chlorine ChemistryCouncil, with a minor contribution by Environment Canada.
Scope of the Report by Rigo et al.
The report by Rigo et al. addresses several aspects of the chlorine input/dioxin outputissue. However, the quantitative relationship between chlorine input and dioxin outputfrom combustors is the issue of greatest interest from public health and environmentalperspectives. For that reason, this review focuses on those segments of the report thatpertain to this issue.
The study by Rigo et al. does not evaluate the relationship between chlorine input andtotal dioxin output from combustors. That is, they do not examine the relationshipbetween the quantity of chlorine fed into a combustor over a specific period of time andthe quantity of dioxins that is released in stack gases, fly ash, and other residues duringthe same period.
Depending on the category of combustor, Rigo et al. compare dioxin concentrations incombustora gases to one or more of the following measures:
• Hydrogen chloride (HCl) concentrations in stack gases;• Percent chlorine in feed; and• For cement kilns only, chlorine feedrates normalized to daily production rates.
The relationships of these measures to the actual focus of concern — chlorine input anddioxin output — determine in large part the relevance of the report.
Greenpeace reviewed this report and concluded that Rigo et al. used inappropriate and/orunreliable surrogate measures for chlorine inputs and dioxin outputs from combustors.Consequently, the results of their statistical analyses do not provide a valid basis forassessing the relationship between chlorine input and the amount of dioxin generated andreleased by full-scale waste combustors.
It is not surprising that Rigo et al. conclude that the data examined show little correlation(or even negative correlations). It is surprising, however, that the statistical valuescalculated by Rigo et al. and presented in the appendices of their report do not appear tobe consistent with their conclusions.

Inconsistencies in the Report by Rigo et al.
Municipal Waste CombustorsRigo et al. conclusion: "On a facility-by-facility basis, 17 [municipal waste combustion]facilities displayed no relationship — two increased and one decreased."
Greenpeace review of statistical analyses by Rigo et al.: At 15 of 22 municipal wastecombustion facilities, dioxin concentrations in combustor gases increased at higherconcentrations of hydrogen chloride in stack gases (an indicator of chlorinefeedrate).[b] The positive correlation coefficients calculated by Rigo et al. for these 15facilities were statistically significant with greater than 95 percent confidence at fivefacilities, greater than 90 percent confidence at two facilities and less than 80 percent atthe remaining eight. Among the seven facilities where Rigo et al. found negativecorrelations, none was statistically significant at the 95 percent confidence level; onereached a confidence level greater than 90 percent; and the remaining six were below 80percent.
Medical Waste IncineratorsRigo et al. conclusion: "Of the 17 medical waste incinerators with sufficient simultaneousdata to explore the relationship, 14 showed no statistically significant trend, twoincreased and one decreased."
Greenpeace review of statistical analyses by Rigo et al.: At 10 of 15 medical wasteincinerators, dioxin concentrations in combustor gases increased at higher hydrogenchloride concentrations in stack gases. The positive correlations found by Rigo et al.for the data from these 10 incinerators were statistically significant with greater than 95percent confidence at two incinerators; greater than 90 percent confidence at one; greaterthan 80 percent confidence at two; and less than 80 percent at five. At the sevenincinerators where negative correlations were found, statistical significance greater than95 percent confidence was noted at one incinerator, while confidence levels were lessthan 80 percent at four. Statistical evaluations of data from the remaining two facilitieswere invalid: for one unit, hydrogen chloride concentrations were measured followingtreatment for removal of such acid gases; and, in the other, only two data pairs werepresented.
Cement KilnsRigo et al. conclusion: "Cement kiln chlorine feed rate has no discernible influence onthe nature or quantity of PCDD/F [dioxins] emitted from the stacks of these facilities."
Greenpeace analysis of data from Rigo et al.: At 14 of 23 cement kilns, higher chlorinefeed-rates were accompanied by increased dioxin concentrations in combustorgases. Rigo et al. presented no statistical values for individual cement kilns in theirreport. Instead, they based their conclusion on a scatter plot of the aggregated data fromthe kilns, in which dioxin concentrations are plotted against chlorine feedrates normalizedto daily clinker output. No clinker output data are included in their report. Statisticalanalyses of chlorine feedrates and dioxin concentrations given for individual kilns in their

report show that increasing chlorine feedrates were accompanied by greater dioxinconcentrations in gas streams. Positive correlations were statistically significant withgreater than 95 percent confidence at three kilns; greater than 80 percent confidence attwo kilns; and less than 80 percent confidence at nine. Of the nine kilns where dioxinconcentrations decreased at higher chlorine feedrates, no negative correlation wasstatistically significant at a 95 percent confidence level. At two kilns, negativecorrelations were statistically significant with greater than 80 percent confidence, whileconfidence levels were less than 80 percent at the remaining seven.
Hazardous Waste IncineratorsRigo et al. conclusion: "The available data indicate that, depending on the hazardouswaste incinerator, changing chlorine concentration can have no observable effect (20facilities); increase PCDD/F concentrations (4 facilities); or decrease PCDD/Fconcentrations (4 facilities)."
Greenpeace analysis of data from Rigo et al.: No conclusions can be drawn from thesedata about the relationship between chlorine input and dioxin concentrations instack gases of hazardous waste incinerators. Rigo et al. did not calculate statisticalvalues for individual hazardous waste incinerators from data describing chlorine inputand dioxin output from the stack. They compared percent chlorine in feed and dioxinconcentrations in stack gases. This comparison would have been valid if the wastefeedrates and stack gas flowrates had been held constant during the trial burns and othertests that were the sources of these data. However, reports describing these efforts showthat both waste feedrates and stack gas flowrates were not constant, but fluctuated oversubstantial ranges.
Boilers and Industrial FurnacesRigo et al. conclusions: Two contradictory conclusions were presented: (1) "There is toolittle hazardous waste fired boiler data to reach firm conclusions," and (2) "Chlorinefeed concentration is inversely related to PCDD/F concentrations at the stack for thisvery limited data set."
Greenpeace analysis of data from Rigo et al.: No conclusions can be drawn from thesedata about the relationship between chlorine input and dioxin concentrations instack gases of boilers and industrial furnaces. Rigo et al. present no statistical analysesfor individual boilers and industrial furnaces. Their second conclusion is apparently basedon a scatter plot of percent chlorine in feed versus dioxin values from the threecombustors for which these data were available. However, a comparison of these twomeasures is valid only when waste feedrates and stack gas flowrates are held constant,which was not shown to be the case for these combustors. As a result, their firstconclusion is the more accurate of the two.
Biomass CombustorsRigo et al conclusions: Two contradictory conclusions are presented in the report: (1)"Given the variation in PCDD/F concentrations over the range of chlorine feedconcentrations and stack HCl concentrations, there is too little data to draw any

definitive conclusions," and (2) "There does not appear to be any relationship betweenchlorine in the waste feed to biomass fired furnaces and PCDD/F concentrations."
Greenpeace analysis of data from Rigo et al.: No conclusions can be drawn from thesedata about the relationship between chlorine input and dioxin concentrations instack gases of biomass combustors. Rigo et al. present no statistical values forindividual biomass combustors in their report. Instead, they apparently rely on two scatterplots: (1) an aggregation of dioxin concentrations in combustor gases versus percentchlorine in feed for three combustors, and (2) an aggregation of dioxin concentrations incombustor gases versus hydrogen chloride concentrations in combustor gases from threefacilities with five combustors. No conclusions can be drawn from their first scatter plot,since there are no data describing waste feedrates and stack gas flowrates and noevidence that these variables were held constant. Data from the five combustors in theirsecond aggregate plot were insufficient to allow statistical evaluation: four combustorshad only one data pair each, while the remaining combustor had only two data pairs. As aresult, no conclusions can be drawn from these data.
Limitations of Design and Execution of Study by Rigo et al.The following factors must be taken into account in relation to the evaluation by Rigo etal.of the relationship between selected measures used as indicators of chlorine input anddioxin concentrations in combustor gases:
• The study by Rigo et al. does not answer the question, "Does chlorine inputinfluence dioxin output from combustors?"
Rigo et al. offer no evidence that dioxin concentrations in air emissions correlate withthe total dioxin outputs of the full-scale combustors in their study. Indeed, such acorrelation would be unexpected: while air pollution control devices capture dioxinsfrom stack gases and deposit them in other combustor residues, some of these devicesalso enhance the formation of dioxins. As a result, the quantity of dioxins released instack gases is, as suggested by one study, relatively independent of total dioxinoutput. In other words, even if statistical analyses of data describing chlorine inputand dioxin stack emissions from full-scale combustors are carried out rigorously withappropriate, accurate measures, the results of such analyses cannot be presumed toreflect the relationship between chlorine input and total dioxin output.
• Rigo et al. compared two measures — those used as indicators of chlorine input anddioxin concentrations in combustor gases — that are either inappropriate forcomparison or have margins of error too great to support rigorous statisticalevaluation.
Chlorine Input: Of the two indicators of chlorine input used by Rigo et al., onemeasure — the percent of chlorine in waste feed — is insufficient unless wastefeedrates are held constant, which was not shown to be the case for the combustors inthis study. The other measure — the concentration of hydrogen chloride in stack

gases — is not a reliable indicator of chlorine input and has margins of error too highto support rigorous statistical evaluation.
Dioxin Output: Rigo et al. obtained their data describing dioxin concentrations incombustor gases from sources in several countries with no common method forsampling and analysis of such gases. Moreover, the data were taken from archivalrecords of early studies as well as reports from relatively current trial burns and othertests. Even contemporary data obtained by a single sampling method and analyzed bya single laboratory are known to have margins of error as high as +/- 30 percent.Consequently, the data relied on by Rigo et al. can be expected to have even highermargins of error.
• Rigo et al. defined and then tested a hypothesis of limited value by applyingstatistical methods of questionable suitability to measures that not only appearto be inappropriate but also have levels of uncertainty so high as to render themunsuitable for rigorous statistical analysis.
Notes
a The title of their report and much of the language in its text suggest that Rigo et al. compared variouschlorine-related measures to dioxins in stack emissions. However, when evaluating some combustors, theypooled data describing dioxin concentrations in stack gases with data from other sampling locations in theprocess train, e.g., boiler outlets, secondary combustion chamber outlets, etc.
b Differences between the total number of facilities addressed in the conclusions by Rigo et al. and thosecited by Greenpeace are fully explained for this and the other combustor categories in the body of thereview.

IntroductionDioxin [a] generation occurs during combustion or other reactions when both organicmatter and an available chlorine source are present. Much evidence suggests that theglobal dioxin burden stems primarily from the life-cycle [b] of chlorine-containingsynthetic organic materials (e.g., polyvinyl chloride (PVC) plastic, chlorinated solvents,chlorinated pesticides, chlorine-based bleaching agents, etc.). For this reason, theelimination of dioxin generation at the source can best be achieved, in many cases, bysubstituting chlorine-free alternative materials. Indeed, many technically feasible andeconomically competitive cleaner products and processes already exist. In wastecombustion systems, chlorine is the limiting element for dioxin formation. This suggeststhat the total dioxin outputc from these systems can be reduced and/or eliminated througha materials policy that curbs chlorine input, as pointed out by an advisory group for theU.K. Department of the Environment: [1]
"One of the more obvious primary ways of minimizing TOMPS [toxicorganic micropollutants, e.g., dioxins] in incinerators and in otherthermal processes is to try to avoid (or reduce) TOMPS, their precursorsor fundamental species (such as chlorine or bromine) being included inthe feedstock."
Materials policies have already been incorporated into some dioxin abatement efforts:
• A 1996 report from the Intergovernmental Forum on Chemical Safety (IFCS)concluded that it was appropriate and important to consider materials policies indeveloping strategies to minimize and/or eliminate releases of both thepolychlorinated and polybrominated dioxins and furans; [2]
• The Governing Council of the United Nations Environmental Programme adopted therecommendations of the IFCS report on Feb. 7, 1997, as part of the process ofachieving a global, legally binding agreement to eliminate or reduce persistentorganic pollutants in the global environment; [3]
• On November 22, 1996, the American Public Health Association adopted a resolutionurging health care facilities and suppliers to reduce or eliminate their use of PVC andother chlorinated plastics that are currently disposed of in medical waste incinerators;[4]
• The Central Pollution Control Board of India ruled in July 1996 that polyvinylchloride (PVC) can no longer be burned in medical waste incinerators; [5]
• In 1994, the International Joint Commission (IJC) between the U.S. and Canadarecommended that "...the Parties ... alter production processes and feedstockchemicals so that dioxin, furan and hexachlorobenzene no longer result asbyproducts" and "... develop timetables to sunset the use of chlorine and chlorine-containing compounds as industrial feedstocks and that the means of reducing oreliminating other uses be examined." [6] This followed the IJC's 1992 conclusion:"We know that when chlorine is used as a feedstock in a manufacturing process, onecannot necessarily predict or control which chlorinated organics will result and in
what quantity. Accordingly, the Commission concludes that the use of chlorine and itscompounds should be avoided in the manufacturing process;" [7] and
• In 1992, the German Federal Government enacted a prohibition against usingchlorinated and brominated compounds as petrol additives to reduce dioxin releasevia car exhausts. [8]
Scientific support for such materials policies is found among the many studies in whichdioxin output from incinerators and other combustors has been shown to increase aschlorine input is elevated. In a smaller number of studies, no relationship has been foundbetween chlorine input and dioxin output.
One of the more recent and widely-publicized studies from the latter category and thesubject of this review is "The Relationship Between Chlorine in Waste Streams andDioxin Emissions from Waste Combustor Stacks," by H. Gregor Rigo, A. John Chandlerand W. Steven Lanier. This report is sometimes referred to as the ASME report or theRigo report.
Primary funding for the report of some $150,000 came from the Vinyl Institute, whichselected the American Society of Mechanical Engineers as contractor to "provideunassailable objectivity to the study." [9] Nonetheless, there appear to be strikingdiscrepancies between the authors' conclusions and the statistical findings presented intheir report.
Over and above the obvious discrepancies, it seems that Rigo et al. chose to test ahypothesis of limited value by applying a statistical method of questionable suitability tomeasures that not only appear to be inappropriate but also have levels of uncertainty sohigh as to render them unsuitable for rigorous statistical analysis. This review addressesthese and other aspects of the report by Rigo et al.
Notes
a The terms "dioxin" and "dioxins" include all of the polychlorinated dibenzo-p-dioxins (PCDDs) anddibenzofurans (PCDFs).b The term "life-cycle" includes extraction of raw materials, their processing into the usable or salableproduct, the use of that product, recycling (if any) of the discarded product, accidental or deliberatecombustion (e.g., building fires), treatment for disposal (if any) of the discarded product (e.g., incineration),and the return into the environment of the discarded product and/or the residues of its treatment.c Total dioxin output includes the quantity of dioxins released in stack gases as well as that released in flyash, bottom ash, and other residues, such as scrubber water, filtercake from scrubber water treatment, etc..
1 Air Pollution Abatement Review Group, "Report on the Abatement of Toxic Organic Micropollutants(TOMPS) from Stationary Sources 1995," Prepared at the request of Air Quality Division, Department ofthe Environment, AEA Technology, National Technology Centre, Abingdon, Oxfordshire, UK, 1995.2 Intergovernmental Forum on Chemical Safety, "IFCS Ad Hoc Working Group on Persistent OrganicPollutants Meeting: Final Report," Geneva: IFCS Secretariat, c/o World Health Organization, 21-22 June1996.3 United Nations Environmental Programme, "International Action to Protect Human Health and theEnvironment Through Measures Which Will Reduce and/or Eliminate Emissions and Discharges ofPersistent Organic Pollutants, Including the Development of an International, Legally-Binding Instrument,"

Decision Taken By Nineteenth Session of the UNEP Governing Council, Nairobi, 7 February, 1997,Geneva: United Nations Environmental Programme, February 1997.4 American Public Health Association, Resolution Adopted at the 124th Annual Meeting, New York City,New York, 20 November 1996.5 Central Pollution Control Board, Ministry of Environment and Forests, Government of India,"Environmental Standards and Guidelines for Management of Hazardous Waste," New Delhi, India, 12July 1996.6 International Joint Commission, "Seventh Biennial Report on Great Lakes Water Quality," ISBN 1-895085-74-8, Washington, D.C.: International Joint Commission, 1994.7 International Joint Commission, "Sixth Biennial Report on Great Lakes Water Quality," ISBN 1-895085-36-5, Washington, D.C.: International Joint Commission, 1992.8 Schulz, D., PCDD/PCDF - German policy and measures to protect man and the environment,Chemosphere 27 (1-3): 501- 507 (1993).9 Goodman, D., "Incineration Task Force," August 22, 1994.

Chapter 1: Scope of the ASME ReportThe ASME report addresses several aspects of the chlorine input/dioxin output issue.However, the quantitative relationship between chlorine input and dioxin output fromfull-scale combustors is the issue of greatest interest from public health andenvironmental perspectives. For that reason, this review focuses on those segments of theASME report that pertain to this issue. The study by Rigo et al. does not evaluate therelationship between chlorine input and total dioxin output from combustors. i.e., they donot examine the relationship between the quantity of chlorine fed into a combustor over aspecific period of time and the quantity of dioxins that is released in stack gases, fly ash,and other residues during the same period.
Depending on the category of combustor, Rigo et al. compare dioxin concentrations incombustor [a] gases to one or more of the following chlorine-related measures:
• Hydrogen chloride (HCI) concentrations in stack gases;• Percent chlorine in feed; and• For cement kilns, chlorine feedrates normalized to daily clinker [b] production.
The relationships of these measures to the actual measures of concern, chlorine input anddioxin output, determine in large part the relevance of the ASME report.
Dioxin Output
According to its title, the study by Rigo et al. compares chlorine in waste streams todioxin stack emissions. The selection of dioxins in stack emissions rather than totaldioxin output for this comparison brings into question the methodology, findings andconclusions of their study.
Dioxin Stack Emissions
Dioxin stack emissions [c] are only one, commonly small, portion of a full-scalecombustor's dioxin output. For example, a study of eleven European municipal wastecombustors found that stack emissions accounted for less than 12 percent of dioxinoutput. The major share was distributed among fly ash, bottom ash, and other residues.[1] Dioxin stack emissions have been characterized as "nearly independent of thePCDD/F concentrations in the raw gas." [2] This suggests that dioxin stack emissionscorrelate poorly, if at all, to total dioxin output.
It is well known that both the magnitude of the dioxin output and its pattern ofdistribution among combustor residues is influenced by numerous factors. For example,depending on the materials from which they are constructed, wet scrubbers can eitherreduce or increase dioxins in stack emissions and alter the PCDD/F profile, while addingto the dioxin load in scrubber water and subsequent treatment residues, such as filtercake. [3] Other methods that reduce dioxin stack emissions may increase total dioxinoutput, as has been observed with carbon injection. [4]
In summary, an evaluation of the relationship between chlorine input and dioxin stackemissions from full-scale combustors, such as this study by Rigo et al., provides little ifany insight into the relationship between chlorine input and total dioxin output.
Dioxin Concentrations in Stack Gases
Dioxin concentrations in stack gases may be determined using a number of sampling andanalytical protocols which, in some cases, have been further modified. Most of thesemethods have changed considerably during the period of time between the oldest (1984)and the most recent (1994) data in the ASME report's database, as alluded to by theauthors: [5]
Rigo et al.: "Reports from the mid-1980's do not reflect the level of detailfound in PCDD/F tests conducted in the 1990's ..."
Even with modern procedures applied by a single laboratory to replicate samples from asingle combustor over a fixed time period, dioxin measurements may have relatively highmargins of error, as acknowledged by Rigo et al.: [6]
"TNO (1994) reports that the total PCDD/F concentration uncertainty is+/- 30% for raw data. Extending the analysis to include the effect ofdiluent correction (Hamil and Thomas, 1976) raises the uncertainty to +/-35%."
Other studies have found replicate measurements of dioxins in combustor emissions tovary by as much as three orders of magnitude. [7]
Rigo et al. aggregated dioxin measurements taken at the stack with those taken at othersites, such as boiler outlets, secondary combustion chamber outlets, etc. Due todifferences in temperature and other factors that affect both formation and capture rates,dioxin concentrations in samples from these various sites commonly span a very widerange. As a result, the overall uncertainties of the dioxin measurements used in the studyby Rigo et al. can be expected to be even greater than those for stack concentrations only.
Given the great uncertainties and poor precision of dioxin measurements, which arediscussed in more detail in Section 11, small numbers of single-measurement values fordioxin concentrations in combustor emissions, such as those relied upon in many cases byRigo et al., cannot be expected to meet stringent criteria necessary for statistical analysis.
Chlorine Input
Rigo et al. frequently employ language indicating that they used chlorine input in theirevaluations. However, no direct measures of chlorine input were used in their analyses ofmunicipal solid waste combustors, medical waste incinerators, hazardous wasteincinerators, boilers and industrial furnaces, or biomass combustors. In their analysis of

cement kilns, Rigo et al. compared dioxin concentrations in stack gases with chlorinefeedrates that were normalized relative to clinker production rates, which they did notdisclose.
Chlorine Input to Municipal Solid Waste Combustors and Medical WasteIncinerators
For municipal solid waste combustors and medical waste incinerators , Rigo et al.compared dioxin concentrations in gas streams to a surrogate based on output chemistry.The use of this surrogate, hydrogen chloride (HCl) concentrations in stack gases, ispredicated on the assumption that "all the chlorine in the waste is converted to HCl orCl2 and not tied-up in the residue." [8] This assumption is contradicted by numerousstudies, as discussed in greater detail in Section 10.2. For example, the efficiency withwhich the chlorine in materials fed into a combustor is converted into HCl may varyaccording to the chemical nature of the chlorine, [9] the design of the incinerator, [10]and other factors.
It is also important to note that the measurements of HCl taken during testing of thecombustors in the ASME study differed greatly from sampling emissions for dioxincontent in the length of time required for sampling. I.e., these two measures were nottruly synchronous. This is evident from the description of sampling procedures given byRigo et al.: [11]
"The uncontrolled HCl data comes from a single 1 hour test conductedduring the 6 hour PCDD/F sampling period. This is typical of much of theavailable data since the sampling times for HCl and PCDD/Fdeterminations are different."
Some HCl data may result from even briefer sampling times, for instance near-instantaneous determinations with continuous emissions monitors, while sampling fordioxin analyses sometimes requires considerably more than 6 hours. For example, inGermany, stack samples for dioxin determinations may be collected over a period of 16hours. [12] Particularly with highly heterogeneous wastes, such as municipal and medicalwastes, there is little basis for assuming that one HCl measurement made over a briefperiod is representative of HCl concentrations during the 4-16 hours throughout which astack sample is collected for dioxin analysis.
There are also several different methods and modifications of these methods that are usedfor measuring HCl in stack gases. These can give widely disparate results, as describedby USEPA [13] and acknowledged by Rigo et al. [14] (See Section 10.3 for a moredetailed discussion of the limitations of analytical methods for HCl).
Even in carefully controlled experiments at one full-scale combustor, the margin of errorof HCl measurements was +/- 28 percent. [15] In short, HCl concentrations in stack gasesare not highly reliable or accurate indicators of chlorine input to full-scale municipalwaste combustors and medical waste incinerators.

Chlorine Input to Hazardous Waste Incinerators and Boilers and IndustrialFurnaces
The ASME report's database includes chlorine feedrates for hazardous waste incineratorsand boilers and industrial furnaces. However, Rigo et al. did not assess the relationshipbetween chlorine feedrates and dioxin emission rates. They compared percent chlorine infeed and dioxin concentrations in stack gases. Percent chlorine in feed simply describesthe composition of the feed material and, in the absence of feedrates, tells little about theactual quantity of chlorine that is fed into a combustor. Consequently, it is an appropriatesurrogate for chlorine input only when assessing data from one combustor with a constantwaste feedrate or when used in combination with data describing waste feedrates.
As the report's database shows, chlorine feedrates to the combustors in this study wereseldom constant, even though percent chlorine in feed often was. In other words, percentchlorine in feed cannot be regarded as a reliable, accurate surrogate measure of chlorineinput to the full-scale hazardous waste incinerators, boilers and industrial furnaces, andother combustors evaluated by Rigo et al.
Notes
a The title of their report and much of the language in its text suggest that Rigo et al. compared variouschlorine-related measures to dioxins in stack emissions. However, when evaluating some combustors, theypooled data describing dioxin concentrations in stack gases with data from other sampling locations in theprocess train, e.g., boiler outlets, secondary combustion chamber outlets, etc.b “Clinker” is the material that is collected from the cement kiln and ground into cement.c In this review, the term “emissions” is used to refer only to stack emissions, e.g., the quantity of dioxinsreleased from a combustor’s stack. (See also footnote “a”).
1 Huang, H., and Beukens, A. On the mechanisms of dioxin formation in combustion processes.Chemosphere 31 (9): 4099-4117 (1995).2 Kreisz, S., Hunsinger, H., and Vogg, H. Wet scrubbers - a potential PCDD/F Source? Chemosphere 32(1): 73-78 (1996).3 Ibid.4 Lamb, C., Rollins Environmental, Houston, Texas. Comments offered at EPA Dioxin Workshop onFormation Processes and Sources, Chevy Chase, Maryland, November 18-20, 1996.5 Rigo et al., p. 2-14.6 Rigo et al., p. 2-51.7 Air Pollution Abatement Review Group, “Report on the Abatement of Toxic Organic Micropollutants(TOMPS) from Stationary Sources 1995,” Prepared at the request of Air Quality Division, Department ofthe Environment, AEA Technology, National Technology Centre, Abingdon, Oxfordshire, UK, 1995.8 Rigo et al., p. 3-2.9 Sonnenberg, L., and Nichols, K. Emissions of hydrochloric acid, PCDD and PCDF from the combustionof chlorine-containing kraft pulp mill bleach plant waste. Chemosphere 31 (10): 4207-4223 (1995).10 Kanters, M.J., Van Nispen, R., Louw, R., and Mulder, P. Chlorine input and chlorophenol emission inthe lab-scale combustion of municipal solid waste. Environ. Sci. Technol. 30(7): 2121-2126 (1996).11 Rigo et al., p. 2-48.12 Funcke, W., and Linneman, H. Sampling of polychlorinated dibenzofurans (PCDF) anddibenzo(p)dioxins in emissions from combustion facilities using an adsorption method. Chemosphere 24(11): 1563-1572 (1992).13 Johnston, L. “Stack Sampling Methods for Halogens and Halogen Acids,” PB96-184452, ResearchTriangle Park, NC: U.S. Environmental Protection Agency, 1996.

14 Rigo et al., p. 4-12.15 Lenoir, D., Kaune, A., Hutzinger, O., Mutzenich, G., and Horch, K. Influence of operating parametersand fuel type on PCDD/F emissions from a fluidized bed incinerator. Chemosphere 23 (8-10): 1491-1500(1991).
Chapter 2: Statistical AnalysisThe validity of any statistical analysis depends on many factors including the relevancyof the data, sample size, and sample quality. If the data are not sound measures or are ofpoor quality, the utility of the resulting analyses will be greatly decreased or eliminatedentirely.
Rigo et al. evaluated the relationship of measures related to chlorine input and dioxinconcentrations in combustor gases primarily in two ways: (1) simple correlation analysisand (2) multivariate analysis. Each approach has certain limitations. Further, their usewas based on the unsupported assumption that the combustors in their study wereoperating in a state of thermodynamic equilibrium during sampling and analysis.
Correlation analysis is useful when performed on two variables that have a linearrelationship. However, if their relationship is exponential, as was suggested for chlorineinput and dioxin output by De Fre and Rymen (1989) [1], these variables will necessarilyshow a reduced correlation due to model misspecification — use of the wrong model. Onthe other hand, in multiple comparisons such as those in the ASME study, somecorrelations will occur simply as a matter of chance.
Rigo et al. carried out multivariate analyses on data from several of the municipal wastecombustors in their study and the aggregated data from municipal waste combustors,medical waste combustors, hazardous waste incinerators and cement kilns. One importantfactor governing the usefulness of such analyses is the state of knowledge of the reactionmechanism or mechanisms of dioxin formation. If reaction mechanisms are notsufficiently understood to allow adequate mathematical modeling, multivariate analysiscan, like correlation analysis, have misleading results: [2]
“...[T]he statistical efficiency of multivariate models comes at a price,which is the assumption that a given mathematical form describes therelation of study variables. ... If the model is incorrect, however, theimproved efficiency may be negated by an intolerable degree of bias;furthermore, the bias will not be detected without special efforts, and thecaution that such efforts characterize can easily be eroded by theseductive appeal of a neat, efficient-looking model.”
Much has been learned about dioxin formation during combustion. However, muchremains to be learned. In particular, little is known about competing and/orcomplementary formation pathways and their interactions within the complex,constantly-fluctuating environment of a full-scale incinerator.
Correlation analyses are the only statistical evaluations presented by Rigo et al. for all ofthe individual municipal waste combustors, medical waste incinerators and hazardouswaste incinerators in their study. Consequently, this review focuses primarily on thestatistical values obtained by this method, which served as the basis of their facility-specific conclusions.

Basic Elements of Statistical Analysis
When small numbers of samples are used to characterize a large population, they must becarefully randomized in order to be meaningful. The randomization should be appliedboth to the combustors representing the population of combustors as well as to the datacollected from each individual combustor. Correlation coefficients calculated onrelatively small samples are often unreliable since they are subject to considerable chancefluctuations, [3] and are less likely to yield statistically significant results.
The study by Rigo et al. was designed to test the “...hypothesis that fuel chlorine contentand combustor flue gas PCDD/F concentrations are related...” [4] In an analysis such asthis, statisticians always define two hypotheses: the alternative hypothesis and the nullhypothesis. In this case, the alternative hypothesis is the premise described above by Rigoet al. The unstated null hypothesis is that fuel chlorine content has no effect on dioxinconcentrations in combustor flue gas.
It is important to note that the alternate hypothesis defined by Rigo et al. suffers from twoserious flaws: (1) those portions of the total dioxin output that are distributed to ash andother residues are not considered; and (2) comparisons of fuel chlorine content and dioxinconcentrations in stack gases are meaningful only under certain conditions – constantwaste feedrates and stack gas flowrates – which did not exist at many of the facilitieswhen the data used by Rigo et al. were collected. The more meaningful alternatehypothesis, which was not tested by Rigo et al., is the hypothesis that chlorine input andtotal dioxin output are related.
The null hypothesis is actually the hypothesis that is tested in statistical analysis. [a] If theresults of analysis lead to the rejection of the null hypothesis, then the alternatehypothesis is accepted. A key decision made by statisticians in designing a statisticalstudy is choosing the confidence level – the critical probability level at which the nullhypothesis will be rejected.
In other words, in their statistical analyses, Rigo et al. were actually testing the premisethat the mass of chlorine input to combustors has no relationship to the quantity ofdioxins emitted in stack gases. Rigo et al. chose their criteria for rejecting this nullhypothesis as follows: [5]
“Statistically significant findings had to exceed the 95% confidence leveland be found in two or more similar test programs to attribute probablecausality to the relationship. Finding the same behavior in the majority ofexperiments where it should appear is needed to confirm probablecausality.”
By selecting a stringent confidence level, greater than 95 percent (>95 percent), Rigo etal. reduced the likelihood of “false positive” errors [b] – concluding that there is no
relationship between chlorine input and dioxin emissions when, in fact it does exist. Itappears, therefore, that the data may have been collated and analyzed with a pre-determined outcome in mind.
Sample Size and Quality
Rigo et al. describe their database as containing over 1,900 test results from 169combustion facilities in seven categories: municipal waste combustors, medical wasteincinerators, hazardous waste incinerators, boilers and industrial furnaces, cement kilns,biomass combustors, and laboratory-, bench- and pilot-scale combustors. [6]
Rigo et al. offer no evidence that the combustors in their database were randomlyselected from the wide array of combustors for which relevant data are available. Indeed,as documented in the sections of this review that are devoted to each of the six full-scalecombustor categories, Rigo et al. also omitted some of the combustors in their databasefrom their analyses. In other words, the sample of combustors selected by Rigo et al. forstatistical analysis may contain significant bias.
The validity of any statistical analysis also depends on the quantity of data available.Whether sufficient data exist for each combustor to lend sufficient power to the analysesby Rigo et al. is questionable. As discussed in the sections devoted to each combustorcategories, the answer to this question is “No.” Furthermore, numerous inconsistenciesare apparent from which data were used in the facility-specific statistical analyses.
Notes
a “We evaluate the null hypothesis by assuming it is true and test the reasonableness of this assumption bycalculating the probability of getting the results if chance alone is operating. If the obtained probabilityturns out to be equal or less than a critical probability level called the alpha (a) level, we reject the nullhypothesis. Rejecting the null hypothesis allows us, then to accept indirectly the alternative hypothesissince, if the experiment is done properly, it is the only other possible explanation.” from Pagano, R.R.,“Understanding Statistics in the Behavioral Sciences,” Second Edition, St. Paul, MN: West PublishingCompany, 1986.b In decision theory, this is known as a “Type I Error,” a conclusion that an important relationship existswhen there is actually none. A “Type II Error” is a conclusion that an important relationship does not existwhen it actually does. From Freund, J., “Modern Elementary Statistics,” Fourth Edition, Englewood Cliffs,NJ: Prentice-Hall, Inc., 1973.
1 De Fre, R., and Rymen, T. PCDD and PCDF formation from hydrocarbon combustion in the presence ofhydrogen chloride. Chemosphere 19: 331-336 (1989).2 Rothman, “Modern Epidemiology,” Boston, Massachusetts: Little, Brown and Company, 1986, pp. 306-307.3 Freund, J.E., “Modern Elementary Statistics,” 4th Edition, ISBN 0-13-593475-3, Englewood Cliffs, NJ:Prentice-Hall, Inc., 1973.4 Rigo et al. p. 1.5 Rigo et al., p. 1-7.6 Rigo et al., p. v.

Chapter 3: Confounding FactorsRigo et al. identified a number of factors that may have confounded the results of otherstudies in which chlorine input and dioxin emissions exhibited positive relationships. Insome cases they noted the potential influence of such factors when their analyses of thedata from these studies corroborated the original findings. However, Rigo et al. gave littleor no consideration to these same factors when drawing conclusions from their facility-specific analyses.
For example, Rigo et al. discuss outliers and their influences on statistical outcomes, andthey sometimes identified and set aside outliers in their critiques of other studies withpositive outcomes. In their own study, however, they used all data points in theirstatistical calculations.
Many of the confounding factors are quite general, such as “...no ash catalyst chemistries(copper and iron), no mass balances, incomplete data ....” [1] Others can be grouped intothe two general categories below.
Design and Operating Conditions
In the ASME report, numerous factors related to the design and operation of combustionfacilities are identified as influencing emission data, e.g., “... flue gas temperature,intentional experimental changes, salt versus organochloride spiking, designdifferences...” [2]; “ ... flue gas moisture ...” [3]; “...different types of waste combustorsand APCS [air pollution control systems]...” [4]; “... time to reach stabilization ... from aminimum of three hours to more than eight hours from a cold start... ” [5], also describedas “... lag in system response ...” [6] and “... facility ... and start-up condition effects ...”.[7]
Another interesting factor discussed by Rigo et al. is the “fly wheel effect,” [8], in whichthe release of dioxins following the input of chlorine containing materials is delayed andprotracted. They caution that “failure to provide adequate stabilization time betweenconditions calls into question identification of the cause of any change in PCDD/Fconcentrations. ...”.[9]
Rigo et al. acknowledge that “different facilities behave in dissimilar manners” [10] andthat changes in the “underlying waste stream” [11], and waste characteristics, such as“sludge burning” [12], influence the results of input/emissions data. They also note that“[s]tack chlorine level changes and PCDD concentration changes are both induced bythe APCS,” confounding results for some combustors. [13] For example, they observedthat “ ... stack concentrations vary between units with no APCS and those with advancedAPCS.”
While evaluating the results of several studies in which a positive correlation betweenchlorine input and dioxin output was found, they drew particular attention to theimportance of timing. For example, they observed in one case that “... PCDD/F

concentrations may not have reached steady state levels for the intended operatingcondition and confounded data may be being analyzed.” [14] In another they noted asfollows:
Rigo et al.: “Runs conducted first thing in the morning after operating thefurnace overnight on normal MSW would have had a different amount ofcross-contamination than a test conducted shortly after a change incondition.” [15]
Sample Collection and Analysis
Rigo et al. also identified confounding factors related to sample collection and analysis.For example, in their critiques of other studies, they made frequent references to thesignificance of “sampling location,” [16] alluding to differences in “... tests performed atdifferent locations (i.e., boiler outlet, stack, etc.)”. [17] In one of their critiques, theycautioned as follows:
Rigo et al. “Sample location and sampling conditions are potentiallyimportant confounding variables ....” [18]
In another, they explicitly noted “...the influence of sampling location on PCDD/Fconcentrations ...” [19]. For example, they commented as follows:
Rigo et al.: “In the case of furnace outlet data, interpretation mustrecognize that PCDD/F test methods have not been validated at thislocation. High temperature sampling could result in catalytic destructionof PCDD/F ...”; [20]
In evaluating other studies, the authors of the ASME report also acknowledgedconfounding factors related to sample analysis. For example, they noted “... limitations inthe sampling and analysis techniques at low concentrations ...” [21] and referred severaltimes to “... laboratory ... effects ...” [22], e.g., “... low laboratory recoveries ...”. [23] Intheir assessment of another study, they noted as follows:
Rigo et al.: “The most obvious difference identified between tests at agiven facility was attributed to analytical laboratory difference.” [24]
In particular, Rigo et al. also acknowledged problems encountered when assessing lowdioxin concentrations, drawing attention to “…the U.S. practice of reporting BelowQuantitation Limits [BQL] and BDL results as zeros rather than as best estimates andthe detection limit.” [25] They identified difficulties caused by “...between laboratorydifferences or numerous low and BDL [below detection limit] concentrations in thesamples” [26] and “different numbers of below detection limit [BDL] results”. [27]
Another confounding factor identified by Rigo et al. in their evaluations of other studieswere sampling train contamination, as follows:

Rigo et al: “Significantly different results, either in terms of the signatureor the quantity of material, in any triplicate during a particular test seriescould result from either the lack of equilibration time before testingstarted or from sampling train contamination.” [28]
Rigo et al.: “Great care is exercised when recovering and cleaningMethod 23 sampling trains, yet USEPA reported in the method evaluation(MRI, 1990) that trains should not be switched between clean and dirtylocations due to possible hysteresis effects.” [29]
It is difficult to see the rationale for the use of such data to investigate correlationsbetween chlorine input and dioxin output from full-scale combustors. As discussedbelow, others have concluded that such efforts are too simplistic for the complexities ofinteractive, multiple pathways of formation of micropollutants such as dioxin that aretaking place within the constantly fluctuating environment of full-scale combustionsystems.
Limitations of Data from Full-Scale Combustors
As mentioned earlier, Rigo et al. relied on data obtained during trial burns, compliancetests and other similar projects that were, in most cases, carried out for some purposeother than exploring the relationship between chlorine input and dioxin emissions. Manyregard the acquisition from full-scale combustors of data that is sufficiently reliable forsuch comparisons to be difficult, if not impossible, even when tests are designed andcarried out for that specific purpose. For example, the Danish Ministry of theEnvironment offered the following observations about other studies that have exploredthe relationship of chlorine input to combustors and dioxin output: [30]
“Reports are released which conclude that there is no correlation betweenthe dioxin formation and the PVC content in the waste and reports arereleased which conclude that there is a correlation. It seems most likelythat in the test design and running of the tests, there are many difficultiesin keeping all relevant parameters constant (e.g., combustion conditions)and one variable only (e.g., chlorine content).”
Cains and Dyke (1994), researchers in the United Kingdom are similarly critical ofattempts to define the relationship of chlorine input and dioxin output by comparing dataobtained from full-scale waste combustors: [31]
“Generally, the global comparisons in this work have not identified clearcausal effects. ... This is hardly surprising, given that each plant isdesigned to work under a specific set of conditions with specific types offeedstock.”
Other leading European researchers, such as Fangmark et al. (1991) have pointed out thedifficulties of acquiring useful data from directed experiments with full-scale combustors:[32]
“...[M]ajor drawbacks with full scale studies are that it is difficult tocontrol operating parameters such as temperatures, CO concentrations,and fuel composition which collectively make it impossible to performexperiments that are fully comparable.”
Commenting on the U.S. Environmental Protection Agency Waste Incineration ResearchProgram in 1996, the Agency’s Science Advisory Board was both blunt and succinct onthe topic of full-scale combustor data, as follows: [33]
“In fact, the variability in full-scale performance is unlikely to result inany meaningful data at all.”
As discussed earlier, evidence of any discernible trend from statistical evaluations of thedata in the ASME database must be regarded as most unexpected.
Notes
1 Rigo et al., p. 22 Rigo et al., p. 3.3 Rigo et al., p. 2-484 Rigo et al., p. 1-4.5 Rigo et al., p. 2-21.6 Rigo et al., p. 2-30.7 Rigo et al., p. 2-40.8 Rigo et al., p. 2-32.9 Rigo et al., p. 2-55.10 Rigo et al., p. 2-38.11 Rigo et al., p. 2-46.12 Rigo et al., p. 2-38.13 Rigo et al., p. 3-12.14 Rigo et al., p. 2-40.15 Rigo et al., p. 2-54.16 Rigo et al., p. 3.17 Rigo et al., p. 6.18 Rigo et al., p. 2-8.19 Rigo et al., p. 2-4220 Rigo et al., p. 2-8.21 Rigo et al., p. 2-28.22 Rigo et al., p. 2-40.23 Rigo et al., p. 2-50.24 Rigo et al., p. 2-36.25 Rigo et al., p. 2-36.26 Rigo et al., p. 2-40.27 Rigo et al., p. 6.28 Rigo et al., p. 2-31.29 Rigo et al., pp. 2-31 to p. 2-32.

30 Moller, S., Larsen, J., Jelnes, J.E., Faergemann, H., Ottosen, L.M., and Knudsen, F.E., “EnvironmentalAspects of PVC,” Environmental Project No. 313, Denmark: Ministry of the Environment, DanishEnvironmental Protection Agency, 1995.31 Cains, P.W., and Dyke, P., Chlorinated dibenzodioxin and dibenzofuran emissions from wastecombustion plants in the U.K. Chemosphere 28 (12): 2109-2119 (1994).32 Fangmark, I., Marklund, S., Rappe, C., Stromberg, B., and Berge, N. Use of a synthetic refuse in a pilotcombustion system for optimizing dioxin emission, Part II. Chemosphere 23 (8-10): 1233-1242 (1991).33 U.S. Environmental Protection Agency Science Advisory Board, “Review of the Waste IncinerationResearch Program,” Draft. Washington, D.C., 1 May 1996.

Chapter 4: Municipal Waste CombustorsRigo et al. began their discussion of this category by stating, “Data from the 63 MWCfacilities in the database were used in this portion of the study.” [1] Later in their report,the number of facilitiesa relied on for their quantitative evaluation is reported as 27facilities that have 38 individual combustors. [2] In yet another section, the number isgiven as 26 facilities that have 31 combustors. [3] Finally, in their summary findings formunicipal waste combustors, Rigo et al. refer to 20 facilities with no indication of theiridentities or the number of combustors at these facilities. [4] These inconsistencies needto be addressed.
Analyses by Rigo et al.
For municipal waste combustors, Rigo et al. assumed hydrogen chloride (HCl)concentrations in stack gases to be reliable indicators of chlorine feedrates. According toRigo et al., their statistical analyses of the relationship between the stack gasconcentrations of HCl and dioxin led to the following conclusion: [5]
Rigo et al.: “On a facility-by-facility basis, 17 [municipal wastecombustion] facilities displayed no relationship — two increased and onedecreased.”
This conclusion can be compared to the statistical values calculated by Rigo et al. whichwere excerpted from Appendix D-1 of their report and listed in Table 4-1. These valuesand their associated confidence levels can be summarized as follows:
On a facility-by-facility basis, a positive relationship between HCl anddioxin concentrations was found at 15 of 22 municipal waste combustionfacilities. This positive correlation was statistically significant atconfidence levels >95 percent at five facilities; >90 percent at twofacilities; and <80 percent at the remaining eight facilities. Among thefacilities exhibiting a negative correlation, this relationship wasstatistically significant at a confidence level> 90 percent at one facility,while the remaining six had confidence levels <80 percent.
Table 4-1 Municipal Waste Combustors
Statistical Data from Rigo et al.
Positive Correlation at >95% Confidence Level
RRID Facility n R p153 Detroit 6 0.94794 0.0040191 Helsingor 8 0.79663 0.018044 Lancaster (3 Combustors*) 18 0.50202 0.033851 Pittsfield (Vicon) (3 Sampling Sites**) 38 0.46688 0.003119 Refa (2 Test Periods**) 30 0.36768 0.0456

Positive Correlation at >90% Confidence Level
RRID Facility n R p188 Kara 15 0.47298 0.0750189 Reno Syd (2 Test Periods) 33 0.31156 0.0776
Positive Correlation at Confidence Levels <80%
RRID Facility n R p156 Hartford (2 Sampling Sites) 26 0.02270 0.912371 Horsholm (SO2 Reagent) 26 0.25478 0.2091
150 MERC (2 Sampling Sites) 8 0.12076 0.775892 Quebec 13 0.10524 0.7322
145 Quebec SS (3 Sampling Sites) 35 0.01812 0.9177171 Roosendaal 3 0.89936 0.2881196 Thyra 7 0.16151 0.729489 Wurtzburg (3 Sampling Sites) 30 0.14258 0.4523
Negative Correlation at >90% Confidence Level
RRID Facility n R p100 Albertslun 11 -0.53511 0.0898
Negative Correlation at Confidence Levels <80%
RRID Facility n R p217 Amager 8 -0.49805 0.2091197 Brondby 14 -0.24906 0.3905168 Oswego (3 Sampling Sites) 21 -0.25401 0.2665175 PRRI 7 -0.03593 0.9390187 Reno Nord (3 Test Periods) 37 -0.21551 0.208980 Westchester (3 Sampling Sites) 37 -0.0560 0.7420
No Regression Results Presented by Rigo et al.
RRID Facility n R p202 Arhus Nord94 AVR
116 Leeuwarden91 PEI
169 Sioux Center176 Zaanstad
No Simultaneous Measures of HCI and Dioxins in Database
RRID Facility n R p179 AVI95 Gevudo
* Rigo et al. combined data from three separate combustors at this facility.

**Dioxin data were collected not only from the stack but other locations as well and these data wereaggregated for analysis by Rigo et al.***Dioxin and HCI data were collected during tests separated by periods of time ranging from weeks toyears.
As illustrated in Figure 4-1, the statistical values from the ASME report clearly show thepredominance of positive correlation. In contrast, Rigo et al. presented the aggregateddata in a scatter plot, reproduced as Figure 4-2, in which no relationship is discernible.
As noted above, Rigo et al. included 20 facilities in their conclusion for this combustorcategory. [6] In contrast, a review of Appendix D-1 of the ASME report indicates thatthey carried out statistical evaluations of data from 22 municipal waste combustionfacilities. Moreover, their database in Appendix C-1 contains the requisite HCl anddioxin data for 28 facilities. This suggests that, of 28 facilities included in their database,one quarter were excluded from the final evaluation. No acknowledgment or explanationwas given for these omissions.
Data were handled in such a way that any relationship between HCl and dioxin isunlikely to have been discernible. As mentioned earlier, Rigo et al. commingled datafrom three separate combustors and performed a statistical analysis of these aggregateddata, rather than analyzing each individual combustor. For four facilities, theycommingled data from two test series, which were conducted as much as a year apart.
Rigo et al. acknowledged and discussed “...the influence of sampling location onPCDD/F [dioxin] concentrations.” [7] Nonetheless, at 11 MWC facilities, theycompared HCl concentrations with mixtures of dioxin measurements that included notonly samples taken at the stack but also those taken at other points in the system, e.g., theboiler outlet, secondary combustion chamber outlet, etc.
This aggregation of data across implicit barriers obviously obscured the relationshipbetween HCl and dioxin. For example, when Rigo et al. commingled dioxinmeasurements taken at the stack with those taken at the boiler outlet at one municipalwaste combustor, their comparison of these aggregated data with HCl concentrationsshowed only a very weak positive correlation coefficient of negligible significance, asshown in Figure 4-3. However, when data from these two sampling sites were analyzedseparately, HCl and dioxin concentrations showed a very strong positive correlation withhigh confidence at each sampling site, as illustrated in Figures 4-4 and 4-5.
Greenpeace Analyses of Raw Data from Rigo et al.
As described earlier, the ASME database contains data identified as simultaneousmeasures of HCl and dioxin concentrations in the stack gases of 28 municipal wastecombustion facilities. Following the same general approach as that by Rigo et al.,correlation coefficients and p-values were calculated using the logarithms of thesevariables. [b] As shown by the results listed in Table 4-2, these analyses by Greenpeacecorroborated, with a few exceptions, the statistical values presented by Rigo et al.

At 20 of the 28 facilities, HCl and dioxin concentrations showed a positive correlation, asshown in Figure 4-6. In other words, at some 70 percent of the municipal wastecombustion facilities in the ASME database, dioxin concentrations increased with risingHCl concentrations. This positive trend was statistically significant at five facilities with>95 percent confidence; >90 percent confidence at three; and <80 percent confidence attwelve. Data from eight facilities exhibited a negative correlation which was statisticallysignificant at one facility with >95 percent confidence; one facility, >90 percentconfidence; and <80 percent at five.
Evidence of any dominant trend, whether positive or negative, from data so diverse inorigins as that from these 28 facilities is entirely unexpected. These data were producedby a mixture of constantly evolving sampling and analysis methods, coming as they dofrom facilities in five different countries with no common method [8] during a periodwhen sampling and analysis methods were undergoing considerable change. As discussedin greater detail in Sections 10 and 11, these and related factors can be expected to yielddata that vary greatly in their precision and accuracy and, consequently, theircomparability.
As indicated in Table 4-3, these evaluations of the relationship of HCl and dioxinconcentrations in stack gases of municipal waste combustors are based on a very small,non-random sample of these combustors. The 28 facilities for which the ASME databasecontains both HCl and dioxin data represent only 1.1 percent of the 2,583 MWCsoperating in 13 of the industrialized nations. [9]
In their report, Rigo et al. also discussed having aggregated and analyzed HCl and dioxindata from ten of the Danish MWC facilities, which constituted the largest block of MWCfacilities in their assessment. They reported a “weak [positive] relationship ... thatconfirms the original findings.”10
Their statistical values cannot be corroborated since they did not present their analysis.However, their finding of a weak positive relationship between HCl and dioxin wasconfirmed by reanalysis of the aggregated data. The reanalysis also showed that, althoughthe positive correlation is weak (r = 0.1485), it is statistically significant with a very highdegree of confidence, e.g., >95 percent.
In summary, despite many factors that can be expected to obscure any dominant trend inthe relationship of HCl and dioxin concentrations in stack gases, both the analysis byRigo et al. and the analysis by Greenpeace reveal that increasing HCl concentrations wereaccompanied by rising dioxin concentrations at two-thirds or more of the municipal wastecombustion facilities assessed.
Table 4-2 Municipal Waste Combustors
Statistical Values by Greenpeace

Positive Correlation at >95% Confidence Level
RRID Facility n R p153 Detroi 6 0.947957 0.00191191 Helsingor 8 0.811371 0.01144144 Lancaster (1991 & 1992) (3 Units) 18 0.503409 0.0323551 Pitssfield (Vicon)(3 Sampling Sites) 38 0.46717 0.003055
195 Refa (1987 & 1999) 30 0.370425 0.043584
Positive Correlation at >90% Confidence Level
RRID Facility n R p202 Arhus Nord 4 0.794256 0.161631188 Kara 15 0.489098 0.062741189 Reno Syd (2 Test Periods) 33 0.300072 0.089451
Positive Correlation at Confidence Levels <80%
RRID Facility n R p94 AVR 3 0.334092 0.75688
156 Hartford (2 Sampling Sites) 26 0.023061 0.91092971 Horsholm (with and without SO2 rgnt) 26 0.25486 0.20845
150 MERC (2 Sampling Sites) 8 0.121534 0.772949175 PRRI 7 0.025651 0.956109145 Quebec SS (3 Sampling Sites) 35 0.017494 0.92053187 Reno Nord (3 Test Periods) 37 0.203884 0.225907171 Roosendaal 3 0.899432 0.175847169 Sioux Center 9 0.0189 0.961337196 Thyra 7 0.212119 0.64463689 Wurtzburg (3 Sampling Sites) 30 0.14213 0.45351
176 Zaanstad 6 0.148469 0.776057
Negative Correlation at >95% Confidence Level
RRID Facility n R p116 Leeuwarden 3 -0.978437 0.041788
Negative Correlation at >90% Confidence Level
RRID Facility n R p100 Albertslund 11 -0.541314 0.082247
Negative Correlation at Confidence Levels <80%
RRID Facility n R p217 Amager 8 -0.493309 0.207375197 Brondby 14 -0.272172 0.345058168 Oswego (3 Sampling Sites) 21 -0.254012 0.26582491 PEI (2 Sampling Sites) 21 -0.145204 0.52962392 Quebec 13 -0.10532 0.73589680 Westchester (3 Sampling Sites) 37 -0.056064 0.741664

No Simultaneous Measures of HCI and Dioxins in Rigo Database
RRID Facility n R p179 AVI95 Gevudo
Table 4-3 Municipal Waste Combustors in ASME Report
Location Facilities Combustors Percent of Nation’s MWCS10Denmark 11 11 22%United States 8 10 <5%Canada 4 4 23%Netherlands 4 4 27%Germany 1 1 2%
Notes
a Rigo et al. use the terms “facility” and “facilities” to mean a site or sites at which there are one or morecombustors. In a search of Appendix C-1 of the ASME report, only one municipal waste combustionfacility was found to be the site of more than one combustor with the requisite HCl and dioxin data. Ratherthan evaluating each of the three combustors at this site, Rigo et al. aggregated the data and calculated asingle correlation coefficient and other statistical values.b Rigo et al. carried out their statistical evaluations using the logarithms of HCl concentrations and dioxinconcentrations, converted to picomoles per dry standard cubic meter. The analyses by Greenpeace werecarried out using the logarithms of HCl concentrations and dioxin concentrations, expressed as nanogramsper dry standard cubic meter. Comparisons of the two methods of expressing dioxin concentrations showedno significant difference.
1 Rigo et al., p. 4.2 Rigo et al., Table 2.3-1, pp. 2-10 to 2-13.3 Rigo et al. Rigo et al., p. 2-9.4 Rigo et al., p. 2-63.5 Rigo et al., p. 2-66.6 Rigo et al., p. 2-63.7 Rigo et al., p. 2-42.8 Liem, A.K.D., and van Zorge, J.A. Dioxins and related compounds: Status and regulatory aspects.Environ. Sci. & Pollut. Res. 2 (1): 46-56 (1995).9 Ibid.10 Ibid.

Chapter 5: Medical Waste IncineratorsTwo of the medical waste incinerators in the quantitative assessment by Rigo et al. werelocated in Denmark, while the remainder were in the U.S. The data from theseincinerators were collected during tests carried out between 1986 and 1993. It is alsoimportant to note that, according to the ASME database, most but not all of the U.S.-based medical waste incinerators were burning both medical waste and municipal solidwaste while the emission data were obtained.
Analyses by Rigo et al.
Again using HCl as a surrogate for chlorine feedrate, Rigo et al. assessed the relationshipbetween HCl and dioxin concentrations in gas streams of medical waste incinerators andconcluded as follows: [1]
Rigo et al.: “Of the 17 plants [medical waste incinerators] with sufficientsimultaneous data to explore the relationship, 14 showed no statisticallysignificant trend, two increased and one decreased.”
In Table 3.4-1 of their report, Rigo et al. listed 19 medical waste incineration facilitieswith one combustor each. [2] In Figure 3.5-4, a scatter plot of HCl versus dioxinconcentrations, they listed 24 facilities. Included among these are six incinerators forwhich no uncontrolled HCl data are presented in their database; one which has only twodata pairs, which are too few for statistical analysis; and one which is not listed in theirdatabase.
Rigo et al. presented statistical analyses for only 18 medical waste incinerators inAppendix D-2 of their report. [3] However, complete analysis should be possible for only15 of these, since there are no suitable HCl data in the ASME report’s database for twounits and there are only two data pairs for the third. [4] In their statistical analyses of thedata from five medical waste incinerators, Rigo et al. calculated correlation coefficientsusing dioxin data that consisted of the commingled values obtained at both the stack andat other sampling locations.
According to statistical values excerpted from the ASME report and presented in Table 5-1, Rigo et al. actually found that increasing HCl concentrations were associated withhigher dioxin concentrations at two-thirds of the medical waste incinerators in theirstudy. The results of their analyses and associated confidence levels are illustrated inFigure 5-1 and summarized as follows:
Concentrations of HCl and dioxin exhibited a positive correlation at 10 of15 medical waste incinerators. Among these, confidence levels were >95percent at two facilities, >90 percent at one, >80 percent at two, and <80percent at five. At the remaining five medical waste incinerators, HCl anddioxin showed a negative correlation with >95 percent confidence at onefacility and <80 percent confidence at four facilities.

The predominance of positive correlations that was found in the facility-specific analysesby Rigo et al. is readily visible in Figure 5-1. It is interesting to compare this depiction ofRigo et al.’s statistical values with the graphical presentations of medical wasteincinerator data given in their report and shown here in Figures 5-2 and 5-3.
Table 5-1 Medical Waste Incinerators
Statistical Data from Rigo et al.
Positive Correlation at >95% Confidence Level
RRID Facility n R P84 AMI Central 9 0.97287 0.0000
203 Frederikssund 6 0.96237 0.0021
Positive Correlation at >90% Confidence Level
RRID Facility n R p214 Borgess (2 Sampling Sites) 11 0.55923 0.0737
Positive Correlation at >80% Confidence Level
RRID Facility n R p190 Kaiser (2 Sampling Sites) 4 0.89140 0.1086207 Lenoir 9 0.55092 0.1242
Positive Correlation at Confidence Levels <80%
RRID Facility n R p208 Cape Fear 9 0.41341 0.2687132 Cedars Sinai (2 Sampling Sites) 5 0.42033 0.4810198 St. Bernardines 3 0.74254 0.4672199 Sutter 3 0.47290 0.6864211 U. of Michigan (2 Sampling Sites) 6 0.30728 0.5536
Negative Correlation at >95% Confidence Level
RRID Facility n R p213 Morristown (2 Sampling Sites) (Hg Rgnt) 12 -0.86203 0.0003
Negative Correlation at >80% Confidence Level
RRID Facility n R p
Negative Correlation at Confidence Levels <80%
RRID Facility n R p193 Huldovre 6 -0.14038 0.790846 Rochester 3 -0.86035 0.3405

206 Stanford 6 -0.06997 0.8952205 USC Medical 3 -0.2137 0.8629
Miscellaneous Facilities
RRID Facility n R p385 Clean Harbors [1]123 Humber [2]126 Jordan Hospital [3]197 St. Agnes [4]
1 No linear regression was presented for this facility.2 The database contains no uncontrolled HCl data for this facility.3 Rigo et al. performed a linear regression on the data from this facility. However, their database containsno uncontrolled HCl data for this facility.4 This facility had only 2 datapoints, which are not sufficient to determine a valid correlation coefficient.
Greenpeace Analyses of Raw Data from Rigo et al.
As noted above, the assessment of medical waste incinerators presented in the ASMEreport suffers from numerous inconsistencies. However, using the same generalprocedures followed by Rigo et al., Greenpeace calculated the correlation coefficients forHCl and dioxin concentrations listed in Table 5-2. These statistical values, which are alsoillustrated in Figure 5-4, can be summarized as follows:
Increasing HCl concentrations were associated with elevated dioxinconcentrations at 11 of 16 medical waste incinerators. The positivecorrelations of these variables were statistically significant as follows: twoincinerators, >95 percent confidence; one, >90 percent confidence; two,>80 percent confidence; and six, <80 percent confidence. HCl and dioxinwere found to correlate negatively at five facilities. The correlations werestatistically significant at a confidence level of >95 percent at oneincinerator and <80 percent at the remaining four.
Statistical analyses by both Rigo et al. and Greenpeace show that dioxin concentrationsrose with increasing HCl concentrations at two-thirds of the medical waste incinerators.As expected from data of diverse quality, confidence levels for the correlations weregenerally low. However, the levels of confidence achieved also support the predominanceof positive correlations.
Table 5-2 Medical Waste Incinerators
Greenpeace Analysis of Raw Data

Positive Correlation at >95% Confidence Level
RRID Facility n R p84 AMI Central 9 0.97486 2.8E-06
203 Frederikssund 6 0.962124 0.000882
Positive Correlation at >90% Confidence Level
RRID Facility n R p215 Borgess (2 Sampling Sites) 11 0.552641 0.074707
Positive Correlation at >80% Confidence Level
RRID Facility n R p190 Kaiser (2 Sampling Sites) 4 0.895964 0.06495207 Lenoir 9 0.551837 0.118102
Positive Correlation at Confidence Levels <80%
RRID Facility n R p208 Cape Fear 9 0.399071 0.282772132 Cedars Sinai (2 Sampling Sites) 5 0.417155 0.471115198 St. Bernardines 3 0.778409 0.340729206 Stanford (2 Sampling Sites) 6 0.053518 0.918807199 Sutter 3 0.450886 0.663621211 U. of Michigan (2 Sampling Sites) 6 0.320412 0.528754
Negative Correlation at >95% Confidence Level
RRID Facility n R p213 Morristown (2 Sampling Sites) (w/ and
w/out Hg Rgnt)12 0.870075 0.000165
Negative Correlation at Confidence Levels <80%
RRID Facility n R p385 Clean Harbors 3 -0.88543 0.197057192 Huldovre 6 0.172904 0.73982546 Rochester 3 0.872636 0.215877
205 USC Medical 3 0.255359 0.816416

Miscellaneous Facilities
RRID Facilities n R p126 Jordan Hospital*123 Humber*197 St. Agnes**
* The database contains no uncontrolled HCl data for this facility.** This facility had only two datapoints, which are not sufficient for a valid linear regression.
Notes
1 Rigo et al., p. 3-22.2 Rigo et al., p. 3-7 to 3-9.3 Rigo et al., Appendix D-2.4 Rigo et al., Appendix C-2.

Chapter 6: Hazardous Waste IncineratorsOther than one Canadian facility, all hazardous waste incinerators for which locationswere disclosed were at U.S.-based facilities. The data were obtained at most of theseunits between 1986 and 1994. However, test dates were not given in all cases.
Comparisons of Percent Chlorine in Feed and Dioxin Concentration in Stack Gases
For their assessment of hazardous waste incinerators, Rigo et al. evaluated therelationship of percent chlorine in feed to dioxin concentrations in stack gasesa. Based onstatistical analyses of these data for each unit, they reached the following conclusions:
Rigo et al.: “A variable relationship was found; 18 of 28 [hazardouswaste incineration] units with simultaneous PCDD/F and chlorinecharacterization information display no statistically significantrelationship. Five facilities show an increase in PCDD/F concentrationswith increased chlorine in the feed and five facilities show a decrease.”[1]
Rigo et al.: “The available data indicate that, depending on the plant[hazardous waste incinerator], changing chlorine concentration can haveno observable effect (20 facilities); increase PCDD/F concentrations (4facilities); or decrease PCDD/F concentrations (4 facilities).” [2]
These two conclusions, while moderately inconsistent, are not surprising, given thenature of the variables compared. Percent chlorine in feed is the quantity of chlorine in agiven amount of feed. In itself, this measure reveals little about the rate at which chlorineis fed into an incinerator. The latter measure, chlorine feedrate, is obtained by multiplyingpercent chlorine in feed and waste feedrate. Similarly, the dioxin concentration in stackgas must be multiplied by the stack gas flowrate to determine the dioxin emission rate.
Comparison of these two measures — percent chlorine in feed and dioxin concentrationin stack gas — is meaningful only when waste feedrates and stack gas flowrates are heldconstant. If waste feedrate increases, chlorine feedrate will also increase, even though thepercent chlorine in feed may remain the same. Similarly, if stack gas flowrate increases,dioxin emissions increase even though dioxin concentration may not change.
Appendix C-3 of the ASME report contains both percent chlorine in feed and chlorinefeedrates for many of the same hazardous waste incinerators. For the overwhelmingmajority of these units, chlorine feedrates were varied during emissions testing,sometimes by more than six-fold during a single test series.
No stack gas flowrates are given by Rigo et al. However, according to the trial burnreport for one of the incinerators in the ASME database, stack gas flowrates fluctuated by+/- 17 percent in tests carried out at the same waste feedrate. During all six tests of this
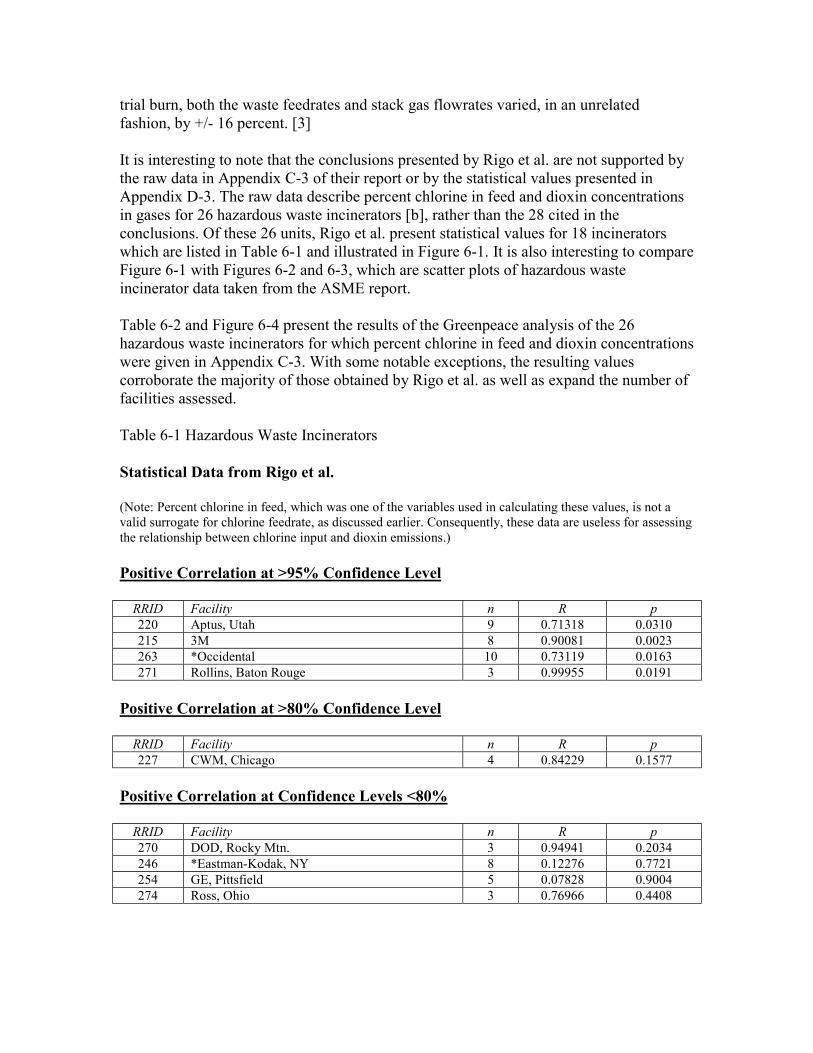
trial burn, both the waste feedrates and stack gas flowrates varied, in an unrelatedfashion, by +/- 16 percent. [3]
It is interesting to note that the conclusions presented by Rigo et al. are not supported bythe raw data in Appendix C-3 of their report or by the statistical values presented inAppendix D-3. The raw data describe percent chlorine in feed and dioxin concentrationsin gases for 26 hazardous waste incinerators [b], rather than the 28 cited in theconclusions. Of these 26 units, Rigo et al. present statistical values for 18 incineratorswhich are listed in Table 6-1 and illustrated in Figure 6-1. It is also interesting to compareFigure 6-1 with Figures 6-2 and 6-3, which are scatter plots of hazardous wasteincinerator data taken from the ASME report.
Table 6-2 and Figure 6-4 present the results of the Greenpeace analysis of the 26hazardous waste incinerators for which percent chlorine in feed and dioxin concentrationswere given in Appendix C-3. With some notable exceptions, the resulting valuescorroborate the majority of those obtained by Rigo et al. as well as expand the number offacilities assessed.
Table 6-1 Hazardous Waste Incinerators
Statistical Data from Rigo et al.
(Note: Percent chlorine in feed, which was one of the variables used in calculating these values, is not avalid surrogate for chlorine feedrate, as discussed earlier. Consequently, these data are useless for assessingthe relationship between chlorine input and dioxin emissions.)
Positive Correlation at >95% Confidence Level
RRID Facility n R p220 Aptus, Utah 9 0.71318 0.0310215 3M 8 0.90081 0.0023263 *Occidental 10 0.73119 0.0163271 Rollins, Baton Rouge 3 0.99955 0.0191
Positive Correlation at >80% Confidence Level
RRID Facility n R p227 CWM, Chicago 4 0.84229 0.1577
Positive Correlation at Confidence Levels <80%
RRID Facility n R p270 DOD, Rocky Mtn. 3 0.94941 0.2034246 *Eastman-Kodak, NY 8 0.12276 0.7721254 GE, Pittsfield 5 0.07828 0.9004274 Ross, Ohio 3 0.76966 0.4408

Negative Correlation at >95% Confidence Level
RRID Facility n R p219 *Aptus, Kansas 14 -0.78443 0.0009399 Confidential B 6 -0.82516 0.0432388 *CWM, Texas 9 -0.66592 0.0502283 *WTI, Ohio 22 -0.58711 0.0041
Negative Correlation at >80% Confidence Level
RRID Facility n R p273 *Rollins, Deer Park 5 -0.68146 0.2052
Negative Correlation at Confidence Levels <80%
RRID Facility n R p230 Chevron, Richmond 6 -0.3213 0.9518231 *Ciba, Baton Rouge 3 -0.36347 0.7632268 Pfizer 3 -0.86516 0.3344282 Vulcan, KS 5 -0.13712 0.8260
Miscellaneous Facilities
RRID Facility n R p224 BROS Lagoon**398 Confidential A**400 Confidential C**396 Dow, Canada A**238 Dow Midland**239 Dow, Plaquemine***252 GE, Waterford**382 New Bedford**389 Waste Tech, LA**
*Data were collected during two or more tests that were conducted at different times and aggregated foranalysis.**No linear regression is presented for this facility.***The database contains no data describing percent chlorine in feed for these facilities.
Comparisons of Chlorine Feedrate and Dioxin Concentration
As noted earlier, chlorine feedrates for some of the hazardous waste incinerators can alsobe found in the ASME database. The relationship of these feedrates with dioxinconcentrations were evaluated using the same general procedure as that used by Rigo etal. in their comparisons of percent chlorine in feed and dioxin concentrations. As shownby the results, which are presented in Table 6-3 and illustrated in Figure 6-5, correlationsbetween chlorine feedrate and dioxin concentrations in stack gases were positive atslightly more than half of the hazardous waste incinerators. The results of these analysescan be summarized as follows:

The ASME database contains both chlorine feedrate and dioxinconcentrations in stack gases for 24 hazardous waste incinerators. Among11 of these units, chlorine feedrates and dioxin concentrations exhibitedstatistically significant positive correlations as follows: three units, >95percent confidence; three units, >80 percent; and five units, 95 percentconfidence, two incinerators; and It should be noted that the relationshipbetween chlorine input and dioxin concentrations cannot be accuratelyevaluated by using chlorine feedrate in the comparison unless stack gasflowrates are held constant. Otherwise, chlorine feedrate, which isnormally expressed as mass per unit of time (e.g., kilograms per hour)must be compared to the dioxin emission rate, which is obtained whendioxin concentration is multiplied by stack gas flowrate.
Dioxin emission rates of the hazardous waste incinerators in the ASME study cannot becalculated, since stack gas flowrates are not presented in the database. As a consequence,the above conclusion can only be regarded as indicative, within the limits of thefluctuations of stack gas flowrates during each test series at each incinerator, of apredominantly positive relationship between chlorine feedrates and dioxin emission rates.
It must be pointed out again that these results were obtained by following the practice ofRigo et al. of aggregating data that were collected during two or more separate test seriescarried out at the same facility. The correlation coefficients of the aggregated data are, asexpected, often quite different from the correlation coefficients of the data for eachindividual test series. This is illustrated in Figure 6-6 by comparing coefficients fromaggregated data (denoted by the facility identification numbers, 219, 231 and 246) withthose of the individual test series (e.g., 219-86 and 219-90). The disparities shown in thisfigure attest to the errors that can be introduced by aggregation of data in this way.
Figure 6-7 allows a comparison of Rigo et al.’s correlation coefficients for percentchlorine in feed and dioxin concentration with the correlation coefficients for chlorinefeedrate and dioxin concentration for all of those hazardous waste incinerators for whichthe ASME database contained such data. The results are, as expected, often strikinglydifferent. This further emphasizes the unsuitability of percent chlorine in feed as asurrogate for chlorine feedrate.
In summary, the statistical analyses carried out by Rigo et al. on percent chlorine in feedand dioxin concentrations in stack gases of hazardous waste incinerators areinappropriate for assessment of the relationship between chlorine input and dioxinemissions from hazardous waste incinerators. Greenpeace analyses of chlorine feedratesand dioxin concentrations in stack gases show a slight predominance of positivecorrelations. This finding suggests, in turn, that there may be a slight predominance ofpositive correlations between chlorine feedrate and rates of dioxin emissions, whichcannot be confirmed in the absence of stack gas flowrates.

Table 6-2 Hazardous Waste Incinerators
Reanalysis of Percent Chlorine in Feed vs PCDD/Fs
Positive Correlation at >95% Confidence Level
RRID Facility n R p220 Aptus, Utah 9 0.714934 0.026852388 *CWM,Texas (1990, 92, 92, & 94 Tests) 26 0.801854 6.9E-07215 3M 8 0.905036 0.001236263 *Occidental (1986 & 1987 Tests) 13 0.641864 0.016769271 Rollins, Baton Rouge 3 0.9976609 0.004766
Positive Correlation at >80% Confidence Level
RRID Facility n R p227 CWM, Chicago 4 0.825204 0.130728
Positive Correlation at Confidence Levels <80%
RRID Facility n R p238 Dow Midland 4 0.473916 0.501946246 *Eastman-Kodak, NY (1986 & 1992 Tests) 8 0.090549 0.830118251 GE, Pittsfield 5 0.058321 0.924271382 New Bedford 3 0.44227 0.670754389 Waste Tech., LA 3 0.418208 0.690437
Negative Correlation at >95% Confidence Level
RRID Facility n R p219 *Aptus, Kansas (1986 & 90 Tests) 18 -0.797293 6.1E-05399 Confidential B 6 -0.844738 0.025185273 *Rollins, Deer Park (1987 & 88 Tests) 8 -0.945824 0.000188283 *WTI, Ohio (2 Test Series) 22 -0.581595 0.00433
Negative Correlation at >80% Confidence Level
RRID Facility n R P231 *Ciba, Baton Rouge (1988 & 93 Tests) 6 -0.695238 0.11085
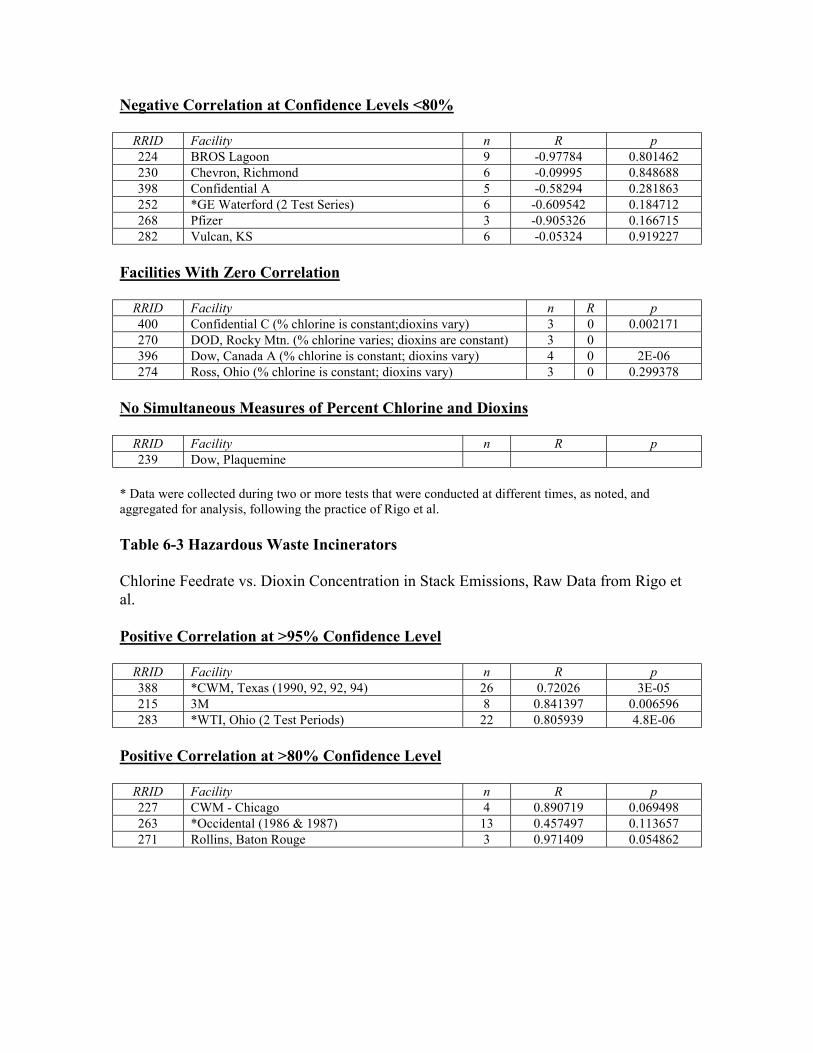
Negative Correlation at Confidence Levels <80%
RRID Facility n R p224 BROS Lagoon 9 -0.97784 0.801462230 Chevron, Richmond 6 -0.09995 0.848688398 Confidential A 5 -0.58294 0.281863252 *GE Waterford (2 Test Series) 6 -0.609542 0.184712268 Pfizer 3 -0.905326 0.166715282 Vulcan, KS 6 -0.05324 0.919227
Facilities With Zero Correlation
RRID Facility n R p400 Confidential C (% chlorine is constant;dioxins vary) 3 0 0.002171270 DOD, Rocky Mtn. (% chlorine varies; dioxins are constant) 3 0396 Dow, Canada A (% chlorine is constant; dioxins vary) 4 0 2E-06274 Ross, Ohio (% chlorine is constant; dioxins vary) 3 0 0.299378
No Simultaneous Measures of Percent Chlorine and Dioxins
RRID Facility n R p239 Dow, Plaquemine
* Data were collected during two or more tests that were conducted at different times, as noted, andaggregated for analysis, following the practice of Rigo et al.
Table 6-3 Hazardous Waste Incinerators
Chlorine Feedrate vs. Dioxin Concentration in Stack Emissions, Raw Data from Rigo etal.
Positive Correlation at >95% Confidence Level
RRID Facility n R p388 *CWM, Texas (1990, 92, 92, 94) 26 0.72026 3E-05215 3M 8 0.841397 0.006596283 *WTI, Ohio (2 Test Periods) 22 0.805939 4.8E-06
Positive Correlation at >80% Confidence Level
RRID Facility n R p227 CWM - Chicago 4 0.890719 0.069498263 *Occidental (1986 & 1987) 13 0.457497 0.113657271 Rollins, Baton Rouge 3 0.971409 0.054862

Positive Correlation at <80% Confidence Level
RRID Facility n R p238 Dow Midland 4 0.700321 0.259405251 GE - Pittsfield 5 0.072897 0.905367274 Ross 3 0.785959 0.331496282 Vulcan 6 0.407514 0.413014389 Waste Tech 3 0.910654 0.158355
Negative Correlation at >95% Confidence Level
RRID Facility n R p246 *Eastman (1986 & 1992) 8 -0.741909 0.030183273 *Rollins, Deer Park (1987 & 1988) 8 -0.73496 0.032711
Negative Correlation at <80% Confidence Level
RRID Facility n R p219 *Aptus, KS (1986 &1990) 18 -0.110946 0.660843220 Aptus, UT 9 -0.411031 0.26708224 Bros Lagoon 9 -0.28777 0.449556230 Chevron 6 -0.126055 0.80951231 *Ciba (1988 & 1993) 6 -0.571932 0.221973252 *GE - Waterford (1991 & 1992) 6 -0.541819 0.253718268 Pfizer 3 -0.821056 0.286945
Facilities With Zero Correlation
RRID Facility n R p400 Confidential C 3 7.7E-15 0.002171270 DOD 3 ERR 0.53241396 Dow Canada A 4 0 0.000743392 New Bedford 3 5E-16 0.051768
Facilities With No Chlorine Feedrate Data
RRID Facility n R p398 Confidential A - No Cl Feedrate399 Confidential B - No Cl Feedrate
* Data were collected from these facilities during two or more tests that were conducted at different times,as noted, and aggregated for analysis, following the practice of Rigo et al.

Notes
a Unlike other combustor categories, all dioxin concentrations for hazardous waste incinerators weremeasured at the stack.b Twenty-two of 26 hazardous waste incinerators are located in the U.S.; one, in Canada; and three,undisclosed. Ten of the U.S. facilities are listed by the U.S. Environmental Protection Agency ascommercial hazardous waste incinerators, of which the Agency lists a total of 37. The remaining U.S.-based units evaluated by Rigo et al. include incinerators at Superfund sites and proprietary, on-sitecombustors owned and operated by particular industries for their own waste streams.
1 Rigo et al., pp. 7 and 8.2 Rigo et al., p. 4-20.3 Radian Corporation, “Trial Burn Test Report, Aptus Incineration Facility, Coffeyville, Kansas,” Herndon,Virginia: Radian Corporation, December 1991.

Chapter 7: Boilers and Industrial FurnacesRigo et al. compared percent chlorine in feed, rather than chlorine feedrate, to dioxinconcentrations in gas streams in their assessment of boilers and industrial furnaces.Rather than facility-specific statistical analyses, they prepared an aggregate scatter plot ofpercent chlorine in feed versus dioxin concentrations for these combustors, whichapparently served as the basis for the following contradictory conclusions: [1]
Rigo et al.: “There is too little hazardous waste fired boiler data to reachfirm conclusions.”
Rigo et al.: “Chlorine feed concentration is inversely related to PCDD/Fconcentrations at the stack for this very limited data set.”
Although Rigo et al. noted that their “database includes PCDD/F data for five boilers,”[2] they did not make clear the fact that only three of these units have both dioxin andchlorine-related measures. [3] Percent chlorine in feed data are provided for all threeunits. However, at each unit, all dioxin concentrations were measured at the same percentchlorine in feed. This can also be seen in the scatter plot prepared by Rigo et al. [4]
With no variation in percent chlorine in feed, it is impossible to determine whether or notdioxin concentrations change when percent chlorine in feed changes, even if such acomparison were valid. (As discussed earlier, percent chlorine in feed is a valid surrogatefor chlorine feedrate only when considering an individual combustor for which both thewaste feedrate and stack gas flowrates are held constant.)
Chlorine feedrate data are also provided for one unit. However, the feedrate was heldconstant for all dioxin determinations. Consequently, these data cannot be used fordetermining the relationship of chlorine input and dioxin concentrations in stack gases.
In summary, the data in the ASME report are not useful for evaluating the relationshipbetween chlorine input to boilers and industrial furnaces and dioxin concentrations instack gases.
Notes
1 Rigo et al., p. 4-36.2 Rigo et al., p. 4-21.3 Rigo et al., Appendix C-4.4 Rigo et al., p. 4-25.

Chapter 8: Cement KilnsAll of the facilities are located in the U.S. and their emission data were obtained duringthe period of 1992-1994. According to the ASME database, most of these cement kilnswere burning both hazardous waste and commercial solid waste during testing, while atleast one was co-firing municipal solid waste. It is not clear that the chlorine content ofthese co-fired materials were reflected in the data describing chlorine feedrate andpercent chlorine in feed.
Analyses by Rigo et al.
Rigo et al. do not present facility-specific or combustor-specific statistical analyses forthe cement kilns in their study, all of which were sited in the U.S. Instead, they offer ascatter plot of the aggregated data from the kilns, showing dioxin concentrations atchlorine feedrates normalized to daily clinker outputs. The aggregate scatter plot lists 20facilities, several of which have multiple kilns. [1] However, their database contains nochlorine feedrate data for the kilns at six of the 20 facilities included in the plot. Since noclinker output data are included in their report, the following conclusion cannot becorroborated: [2]
Rigo et al.: “Cement kiln chlorine feed rate has no discernible influenceon the nature or quantity of PCDD/F emitted from the stacks of thesefacilities.”
Greenpeace Analysis of Raw Data from Rigo et al.
Statistical analyses of the chlorine feedrates and related dioxin concentrations given inAppendix C-5 of the ASME report show that increasing chlorine feedrates wereaccompanied by increasing dioxin concentrations at 14 of 23 cement kilns, as listed inTable 8-1 and illustrated in Figure 8-1. The conclusion that can be drawn from theseanalyses is as follows:
Fourteen of 23 cement kilns exhibited positive correlations betweenchlorine feedrate and dioxin concentrations in gas streams. At three kilns,this positive relationship was statistically significant with >95 percentconfidence; at two, >80 percent confidence; and, at the remaining nine,<80 percent confidence. Of the nine kilns that evidenced negativecorrelations, two showed statistical significant at >80 percent confidencelevels while the remaining seven had confidence levels of <80 percent.
As discussed earlier, these comparisons of chlorine feedrates and dioxin concentrations ingas streams are useful for evaluating the relationship of chlorine feedrates and dioxinemission rates only to the extent that stack gas flowrates were held constant duringindividual test series at the individual kilns. In the absence of substantiating flowratedata, they can only be regarded as suggestive.

In summary, due to insufficient data, the conclusion presented by Rigo et al. on therelationship between chlorine feedrates normalized to daily clinker output and dioxinconcentrations in gas streams from cement kilns cannot be corroborated. However,statistical analyses of chlorine feedrates and dioxin concentrations taken from the ASMEdatabase show that dioxin concentrations increased with increasing chlorine feedrates at60 percent of the cement kilns evaluated. This suggests that increases in chlorinefeedrates were generally accompanied by increased dioxin emission rates.
Table 8-1 Cement Kilns
Chlorine Feedrate vs. Dioxin Concentrations in Gas Streams, Raw Data from Rigo et al.
Positive Correlation at >95% Confidence Level
RRID Facility n R p316 *Chanute(Unit 1)(1992, 93 & 94) 15 0.707855 0.00282447 Holly Hill(Unit 1) 6 0.95665 0.00122647 Holly Hill(Unit 2) 5 0.991629 0.000185
Positive Correlation at >80% Confidence Level
RRID Facility n R p200 *Freedonia(Unit 1)(1992 & 93) 11 0.495825 0.117518312 Knoxville 6 0.655411 0.143161

Positive Correlation at <80% Confidence Level
RRID Facility n R p201 Alpina (Unit 5) 3 0.737013 0.389377294 Bath (Unit 2) 3 0.282297 0.796286311 Fairborn (Unit 1)(All Sampling Sites) 9 0.08463 0.79321862 Foreman (Unit 2) 6 0.437149 0.375646
200 Fredonia (Unit 2)(1993) 3 0.115437 0.918101313 Kosmosdale 3 0.85032 0.24752164 Logansport 4 0.216318 0.774545
317 Louisville (Unit 1) 5 0.391289 0.502313317 Louisville (Unit 2) 4 0.687096 0.273453
Negative Correlation at >80% Confidence Level
RRID Facility n R p293 Artesia 3 -0.953992 0.086199302 Essroc (All Sampling Sites) 9 -0.53949 0.12848
Negative Correlation at <80% Confidence Level
RRID Facility n R p294 Bath (Unit 1) 3 -0.806321 0.305989316 *Chanute (Unit 2) (1992 & 94) 14 -0.088857 0.76219349 Clarksville 6 -0.497279 0.30353462 Foreman (Unit 1) 4 -0.612941 0.35277762 Foreman (Unit 3) 3 -0.67011 0.46192
304 Wampum (Unit 3) 5 -0.331552 0.5756304 Wampum (Unit 12) 3 -0.752886 0.371101
* Data were collected at two or more tests, as noted, and, following the practice of Rigo et al., these datawere aggregated for analysis.
Notes
1 Rigo et al., p. 4-34.2 Rigo et al., p. 4-36.

Chapter 9: Biomass CombustorsRigo et al. list nine biomass combustors in Table 5.3-1 of their report. [1] However, theirdatabase includes eight units; five of these are accompanied by data describing dioxinconcentrations and one or more of the following chlorine-related measures: HClemissions, percent chlorine in feed and chlorine feedrate. [2] Although not listed as suchin the database, one of the five (RRID 144) is apparently a facility with two combustors.[3]
These five biomass combustion facilities are located as follows: Canada, two; UnitedKingdom, one facility with two combustors; Netherlands, one; and United States, one.For their emissions data, the time of origin ranged from 1987 to 1994, with no date givenfor one facility.
Rigo et al. do not present facility-specific or combustor-specific statistical analyses forthe biomass combustors. Instead, they provide two scatter plots: one with dioxinconcentrations versus percent chlorine in feed for three facilities with one combustoreach, and one with dioxin concentrations versus uncontrolled HCl concentrations forthree facilities with a total of five combustors. These two aggregate scatter plots led totwo contradictory conclusions: [4]
Rigo et al.: “Given the variation in PCDD/F concentrations over therange of chlorine feed concentrations and stack HCl concentrations, thereis too little data to draw any definitive conclusions.”
Rigo et al.: “There does not appear to be any relationship betweenchlorine in the waste fed to biomass fired furnaces and PCDD/Fconcentrations.”
As described earlier, the comparison of percent chlorine in feed with dioxin concentrationin stack gas is meaningful only under certain circumstances — constant feedrate andstack flowrate. As a consequence, little if anything can be concluded about therelationship between chlorine input and dioxin emissions at the three biomass combustorsfor which Rigo et al. used percent chlorine in feed as a surrogate for chlorine input.
Rigo et al. used HCl concentration as a surrogate for chlorine input for two biomasscombustion facilities having a total of five individual combustors. However, for each ofthese combustors, there were insufficient data in the ASME report’s database fordetermining the relationship between HCl and dioxin concentrations: four of thecombustors had only one data pair — one HCl value associated with one dioxin value —and the fifth unit had only two data pairs.
In summary, the data presented by Rigo et al. are insufficient to allow evaluation of therelationship between chlorine input and dioxin emissions from biomass combustors.

Notes
1 Rigo et al., p. 5-5.2 Rigo et al., Appendix C-7.3 Rigo et al., p. 5-10 (Figure 5.4-1).4 Rigo et al., p. 5-11.

Chapter 10: Hydrogen Chloride Concentrations inStack Gases as Indicators of Chlorine InputFor their evaluation of the relationship of chlorine input and dioxin emissions frommunicipal waste combustors and medical waste incinerators, Rigo et al. comparedhydrogen chloride (HCl) concentrations in stack gases and dioxin concentrationsmeasured at the stack and other locations. As discussed below, HCl concentrations instack gases of full-scale combustors are not reliable indicators of chlorine input.Moreover, the methods used for sampling and analysis of HCl in combustor gases aresubject to considerable imprecision and bias.
Municipal and medical wastes are quite heterogeneous so that chlorine content can varywidely within a relatively brief period. Likewise, both waste feedrates and, consequently,chlorine feedrates as well as stack gas flowrates also can fluctuate over wide ranges. As aresult, to ensure their comparability, stack gases samples for HCl and dioxin analysesmust be collected over the same period of time.
Non-Synchronicity of HC1 and Dioxin Data
At several points in their report, Rigo et al. describe their HCl and dioxin data as beingsimultaneous. However, based on their description of sampling procedures, these datawere not actually collected over the same time period: [1]
Rigo et al.: “The uncontrolled HCl data comes from a single 1 hour testconducted during the 6 hour PCDD/F sampling period. This is typical ofmuch of the available data since the sampling times for HCl and PCDD/Fdeterminations are different.”
In some cases, the dioxin sampling period may exceed the four to six hour periodrequired by many methods. For example, according to Funcke et al. (1993), the durationof stack sampling for dioxins “has to be between 6 to 16 hours.” [2]
Since gas flowrates at the stack differ considerably from those at sampling pointsupstream in a combustion system, direct comparisons of HCl concentrations at the stackwith dioxin concentrations taken at other points will necessarily lead to erroneousconclusions. Neither the necessary flowrate data nor acknowledgment of this issue aregiven in the ASME report.
Conversion of Chlorine in Wastes to Hydrogen Chloride Emissions
Rigo et al. used HCl concentration in stack gases as a surrogate for chlorine input basedon the assumption that essentially 100 percent of all forms of chlorine in combustedmaterials is converted into HCl and deposition in ashes is insignificant:

Rigo et al.: “ ... the input chlorine level is usually inferred fromuncontrolled flue gas HCl concentration data on the assumption that littlechlorine is tied up by the ash. Some limited North American studiescontaining both HCl data and MSW [municipal solid waste] chlorinecontent verify the reasonableness of the stoichiometric releaseassumption....” [3]
Rigo et al.: “The HCl data provide a direct indication of the waste feedchlorine content for MWI [medical waste incinerator] facilities withoutacid gas control equipment if all the chlorine in the waste is converted toHCl or Cl2 and not tied-up in the residue.” [4]
This assumption is not, however, supported by other studies. For example, in developinga method to estimate the HCl emission potential of wastes destined for incineration, theUnited States Environmental Protection Agency (USEPA) found HCl formation todepend strongly on the chemical form of the chlorine. While organically-bound chlorinewas “essentially completely converted to HCl,” conversion of inorganic chlorides, suchas sodium chloride, proceeded considerably less efficiently (e.g., 30 to 50 percentconversion), varying according to other factors, such as moisture content. [5]
Researchers for the United States Department of Energy found that “measured offgasHCl concentrations ranged from 63% to 1% of the theoretical HCl emissions.” Theypostulated that the remaining chlorine that was not emitted as HCl went into theformation of chlorinated metal compounds. [6]
In their recent study, Kanters et al. (1996) found a substantial fraction of chlorinesequestered in ash and conversion of chlorine to HCl that was non-stoichiometric,varying, in the case of sodium chloride, with incinerator operating conditions, as follows:[7]
“Origin of Hydrochloric Acid. Organic and inorganic chloride areequally abundant in regular MSW, and the HCl emission versus chlorideremaining in the ash was found to be about 80/20. Ashes are usuallyalkaline in nature and therefore are capable of retaining the HCl throughsalt formation. However, at least a part of the original inorganic chlorideis emitted as HCl. ... in the most realistic experiment, with the addition ofaqueous NaCl to compostables and using humidified air, a HCl emissionof 50-60% of the NaCl intake was observed; ca. 25% of the Cl remainedin the ash. The remainder has probably been deposited on the wall. ... Thedegree of conversion of NaCl to HCl varies with the operating conditionsand the design of the incinerator.”
Sonnenberg and Nichols (1995) found, in tests at a full-scale incinerator burning bleachplant solids from a kraft pulp mill, that only 5 percent of total chlorine in the waste wasemitted as HCl. This was regarded as consistent with earlier studies showing that most
organic chlorine is trapped as sodium chloride when the materials burned contain a molarexcess of sodium over chlorine. [8]
In summary, during high temperature combustion, the conversion of both organicchlorine and inorganic chlorine into HCl varies with the design and operating conditionsof the combustor and waste feed characteristics. In general, conversion of organicchlorine seems to be more efficient and less variable than that of inorganic chlorine. As aconsequence, HCl concentrations in stack gases are not reliable surrogates for chlorinefeedrates in statistical evaluations of full-scale combustors.
Accuracy and Precision of Hydrogen Chloride Measurements
In addition to the limitations of HCl as an indicator of waste chlorine content, HClanalyses also suffer from a notable lack of precision. Even in a closely controlled studycarried out on the same combustor, using the same sampling and analytical procedures,HCl measurements exhibited a standard deviation of +/- 28 percent. [9]
There is no internationally accepted protocol for HCl sampling and analysis. Indeed, mostcountries have no national protocols. For instance, in the absence of a national protocol,USEPA has issued recommendations advising those carrying out HCl sampling andanalysis to avoid using certain resin traps to collect samples for HCl analysis due topotential contamination of the resin and/or retention of HCl on the resin. [10]
In a recent USEPA-sponsored survey of methods of sampling and analyzing for HCl,Johnston (1996) described in detail the vulnerabilities and problems encountered withtwo USEPA methods as well as two proposed methods. For example, two methods wereconfirmed to have a variable, negative bias at low concentrations, which seemed tocorrelate better with gas stream moisture content than with HCl concentration. Thepresence of alkaline particulate matter in gas streams was also identified as a source ofnegative bias, which varied with the composition of the particulates. A positive bias wasnoted when ammonium chloride was present in stack gases. [11]
In simultaneous tests of a USEPA method and a confirmed instrumental method formonitoring HCl emissions from cement, the USEPA method produced results that“ranged from being low by a factor of 2 to extremely low by a factor of 30.” Laboratoryspiking studies with this method found it to yield results that were low by factors of threeto five. [12]
The imprecise nature of HCl measurements are well illustrated by the ASME report itself.For example, while burning “normal solid waste feed” in the Horsholm incinerator, withno extra chlorine input and no sulfur dioxide reagent, the highest HCl concentration was1.5 times greater than the lowest measure. With no extra chlorine and addition of a sulfurdioxide reagent at a constant rate, HCl concentrations varied by as much as tenfold. [13]At the Sioux Center municipal waste incinerator, HCl concentrations varied from 71.7 to240.8 ppm while wastes that were reported as containing zero percent chlorine wereburned. [14]
In their discussion of cement kilns, Rigo et al. found that, in simultaneous analyses,USEPA Method 26 indicated HCl concentrations of 35-40 ppm (while a FTIR** analyzerreported no HCl). This led the authors of the ASME report to conclude as follows: [15]
Rigo et al.: “Hence, reported HCl concentrations are suspect.”
In summary, the methods used for sampling and analysis of HCl in stack gases of full-scale combustors do not have the accuracy and precision sufficient to yield meaningfulresults in statistical evaluations such as those carried out by Rigo et al.
Notes
1 Rigo et al., p. 2-48.2 Funcke, W., Linneman, H., and Philipp, C. Long-term sampling method for polychlorinateddibenzofurans (PCDFs) and dibenzo(p)dioxins (PCDDs) in flue gas of combustion facilities. Chemosphere26 (12): 2097-2101 (1993)3 Rigo et al., p. 2-3.4 Rigo et al, p. 3-2.5 Peterson, M.R., Albritton, J.R., and Jayanty, R.K.M. Laboratory Method to Estimate Hydrogen ChlorideEmission Potential Before Incineration of a Waste.EPA/600/S3-90/054. Research Triangle Park, NC: USEPA, August 1990.6 Burns, D.B., “Final Report Consolidated Incineration Facility Metals Partitioning Test (U),” WSRC-TR-93-623, Aiken, SC: U.S. Department of Energy, Savannah River Technology Center, August 31, 1993.7 Kanters, M.J., Van Nispen, R., Louw, R., and Mulder, P. Chlorine input and chlorophenol emission in thelab-scale combustion of municipal solid waste. Environ. Sci. Technol. 30 (7): 21121-2126 (1996)8 Sonnenberg, L., and Nichols, K. Emissions of hydrochloric acid, PCDD and PCDF from the combustionof chlorine-containing kraft pulp mill bleach plant waste. Chemosphere 31 (10): 4207-4223 (1995).9 Lenoir, D., Kaune, A., Hutzinger, O., Mutzenich, G., and Horch, K. Influence of operating parametersand fuel type on PCDD/F emissions from a fluidized bed incinerator. Chemosphere 23 (8-10): 1491-1500(1991).10 U.S. Environmental Protection Agency, “Hazardous Waste Incineration Measurement GuidanceManual: Volume III of the Hazardous Waste Incineration Guidance Series,” EPA/625/6-89/021,Washington, D.C.: U.S. Environmental Protection Agency, June 1989.11 Ibid.12 Ibid.13 Rigo et al., Appendix C-1.14 Ibid.15 Rigo et al., p. 4-24.

Chapter 11: Quality and Comparability of DioxinDataSome of the data relied on by Rigo et al. originated as long ago as 1983, while otherswere collected as recently as 1994. During this period of time, there were markedimprovements in the methods used for sampling and analyzing dioxins in combustorgases.
In 1984, the USEPA method was directed toward only one of the dioxins - 2,3,7,8-tetrachlorodibenzo-p-dioxin (2,3,7,8-TCDD) - and had a detection limit of 1 to 5micrograms per cubic meter with a stack gas sample of 5 cubic meters. [1] With themethods used today, all dioxins are measured in stack gases and reported (expressed asequivalents of 2,3,7,8-TCDD) at concentrations more than a thousand times lower.
As existing methods of sampling and analysis were modified and new methods developedduring 1983-1994, the quality of the dioxin data obtained also changed. As aconsequence, the dioxin data evaluated by Rigo et al. are quite diverse in quality.
While Rigo et al. rather subtly acknowledge that methods of sampling and analysis havechanged over time, they do not address the impacts of such changes on the quality and,thus, the comparability of the data in the ASME database. They do, however, discountdifferences in sampling and analysis methods that are more geographic in nature, asfollows: [2]
Rigo et al.: “The data used in this project came from around the world.While North American sampling and analytical methods at any point intime are essentially the same, European techniques are slightly different.These data have been included, however, in this study because severalresearchers have compared the various methods and showed littledifference in total concentrations...”
This assessment by Rigo et al. contrasts rather starkly with the findings of otherscientists. In their review, Liem and van Zorge (1995) reported that there are still novalidated European standards for sampling and measuring dioxins in exhaust gases fromstationary sources, pointing out the uncertainty of dioxin values and their limitedcomparability as follows: [3]
“Several interlaboratory comparison studies have shown that analyticalresults may differ substantially (e.g., WHO, 1989 and 1991). ...Therefore,it should be taken into account that the numerous data used to estimatedioxin emissions ...are only of limited comparability. ...The analyticaluncertainty will influence largely the comparisons between the estimateddioxin emissions for the several countries.”

Johnke and Stelzner (1992) have identified several factors that limit the comparability ofdata from German municipal waste combustors. As shown below, these factors areequally germane to the study by Rigo et al: [4]
“The measurements were carried out from 1985 to 1990. ...Thecomparability of the measurement data was a question that arose especial[sic] in the overall evaluation of the measurement programme, since thesampling equipment and analytical methods used for the measurementsdiffered. This was due to the following reasons:
• The great length of time over which the programme extended, duringwhich numerous improvements to the measurement technology weremade.
• The large number of measurement institutes and analyticallaboratories participating. ... The uncertainties resulting from the useof differing sampling equipment and analytical methods cannot beassessed precisely. ... A sensible approach therefore seems to be tocarry out an evaluation that takes all measurement data into accountin a differentiated manner.”
Recent studies in the U.K. have found a margin of error of 50 percent for dioxin emissiondata. [5] However, authors of an ECETOC technical report remarked that, in samplingand analysis of combustor gases for dioxins, “...the results from different laboratoriesmay differ by as much as one order of magnitude, particularly at low levels.” They alsodescribed a report by Marklund (1990) of parallel sampling by five different samplingtechniques and analyses by two different laboratories in which dioxin concentrationsdiffered by as much as 2.7 times for different sampling procedures and 1.8 times for thesame procedure. [6]
In their comparative study of five different techniques for sampling flue gases fordioxins, Marklund et al. (1992) found as follows: [7]
“Most countries have their own sampling methods and sampling protocolsfor PCDDs and PCDFs in flue gases, and most also have their ownanalytical procedures. ... Comparable results were obtained with allsampling procedures when the results were NOT compensated forincomplete sampling recoveries and the recoveries for the pre-samplingspikes were highly erratic.” [Emphasis in original]
Rigo et al. recognized the relatively high margin of error of contemporary data asfollows: [8]
Rigo et al.: “TNO (1994) reports that the total PCDD/F [dioxin]concentration uncertainty is +/- 30% for raw data. Extending the analysisto include the effect of diluent correction (Hamil and Thomas, 1976)raises the uncertainty to +/- 35%.”

Nonetheless, in their conclusions, Rigo et al. made no mention of the severity of thelimitations imposed on comparisons of data having margins of error as large as thoseencountered in their database.
Factors Affecting Data Quality
In a particularly interesting finding, the European Standards body CEN reported thatagreement between methods depends strongly on the type of combustor tested. Wheredioxins occurred primarily in the gas phase, different methods showed generally goodagreement. In contrast, results differed by three orders of magnitude when the majority ofthe dioxins were bound to particles. [9] In other words, the distribution of dioxinsbetween the gas phase and particles is an important factor in both the accuracy and thevariability of data.
The difficulties presented in quantifying particle-bound dioxins are illustrated by thestudy by Fangmark (1990) in which the polyurethane foam plugs used in some methodswere shown to have poor capture of small particulates (< 2 microns). Fangmark (1990)noted as follows: [10]
“The small particle fraction must therefore be included in the flue gassample in order to obtain true values and not underestimate theconcentrations of PCDDs and PCDFs.”
Similarly, Hunsinger et al. (1996) found that other filter materials that are also used insome methods had a great influence on the dioxin concentrations obtained: “...at hightemperatures (240º C) PCDD/F concentrations were found to be much smaller for thequartz filter compared to the PTFE filter.” [11]
Commenting on the difficulties of sampling combustor stacks, Janssens et al. (1992)noted “...the possibility of serious artifacts occurring in situ during the sampling of thehot effluent.” Comparing sample collection with analysis, they concluded, “Much largererrors can be made during the sample collection in the stacks of incinerators.” [12]Funcke et al. (1992) warned that “...possible non-homogeneities in the flue gas channelhave to be taken into consideration” in a comparison of different sampling methods usedin Germany. [13]
Other very important, but seldom-reported issues affecting data quality are deviationsfrom the approved procedures during the application of stack sampling and analysismethods. In 1995, U.K. reviewers reported that departures from written protocols andaccepted practices are common: [14]
“... [F]ew UK sampling teams claim to follow Method 23 in detail. ... [I]thas become clear that much UK sampling work has been carried outwithout the analysis of blank samples, with incompletely cleanedapparatus and with unsuitable sampling positions leading to the use of

flexible hoses which have been shown to retain significant quantities ofTOMPS [toxic organic micropollutants, including dioxin].”
In their evaluation of two Swedish stack sampling methods, Fangmark et al. (1990)observed, “It is not unusual to accept a lower degree of precision during samplingcompared to the analytical precision, though weaknesses in sampling methodology andsampling strategy could spoil the relevance of many results.” [15]
Limitations of USEPA Method 23
USEPA Method 23 has gained favor in many countries. For example, this method hasbeen described as “the favoured approach in the UK because of the commercialavailability of the apparatus, the versatility of the equipment for measuring otherpollutants such as heavy metals or particles and the lack of customer acceptance of othermethods.” [16]
Wide acceptance notwithstanding, Method 23 has numerous shortcomings. Some are lessserious, external issues that can be resolved by external measures. For example, thecomplexity of the sampling train makes it difficult to assemble and to operate correctly,leading operating personnel to deviate from approved procedures. [17]
Others, such as those that are intrinsic to the method, are less easily resolved. WhenUSEPA scientists assessed the predecessor to Method 23, Modified Method 5 (MM5),they measured the recovery of dioxin congeners that were introduced through both staticand dynamic spiking. For dynamic spiking, isotopic dioxin congeners were injected intothe front end of a sampling train while combustor stack gases were sampled. [18]
With a lab-scale combustor, MM5 had recoveries of dynamically spiked congenersranging from 50 to 99 percent. However, at the full-scale incinerator, “recovery of thedynamic spikes had an overall average of 21% and were moderately variable.”
During this same study, USEPA also pursued methods for improving spike recoveriesand, thus, the overall accuracy and precision of the method. For example, the overallrecovery of dynamically spiked isotopic dioxin congeners was increased to 26 percent byextracting sample filters with benzene rather than the dichloromethane specified in themethod.
Considerably greater improvements were noted when the back-half glassware of theMM5 sampling train was coated with a thin layer of a special grease. At the full-scaleincinerator, rinsing the coated back-half glassware with toluene resulted in recoveriesranging from 62.9 to 107 percent, although precision was relatively poor.
When USEPA officially replaced MM5 with Method 23 in 1991, the Agency did notincorporate the changes that had led to markedly higher recoveries during dynamicspiking, albeit with poor precision. [19] Since the only substantive difference betweenMM5 and Method 23 is the substitution of toluene for dichloromethane during extraction,

the overall recovery of Method 23 can be expected to be at or near the 26 percentachieved with MM5.
Takeshita et al. (1995) recently identified three “controversial problems in theapplication of XAD-2 resin as an adsorbent for the sampling of PCDD/F in flue gas” inUSEPA Method 23: [20]
• “One of the most important problems is the efficiency in trapping PCDD/F,especially in gaseous form.” The limited adsorbency of the XAD-2 resin requires abackup system downstream from the resin column.
• Method 23 specifies that a condenser is placed immediately upstream from the resincolumn: “...[W]ater condensed by the cooler may cover the XAD-2 resinnonuniformly, occasionally resulting in partial routing of flue gas in the column.Under such a condition, flue gas introduced into the system would preferentially passthrough the dry XAD-2 resin, avoiding the wet area with higher air resistance,resulting in incomplete trapping of PCDD/F in the flue gas.”
• “Since the XAD-2 resin after sampling may be moist, this would disturb theextraction of PCDD/F from the resin by nonpolar solvents. In addition, the XAD-2resin generally contains several monomers of the resin raw materials ... that would besimultaneously extracted in the separation of PCDD/F, and they may disturb theanalysis of PCDD/F by gas chromatography/low resolution mass spectrometry.”
Another recent study involving USEPA Modified Method 5 (also known as Method 23)raises the possibility that dioxin concentrations measured using this method may varyaccording to the concentrations of HCl in stack gases. Tan and Liem (1996) reported thathigher HCl in stack gases resulted in lower recoveries of certain semi-volatiles bydesorbing them from the XAD-2 resin during sampling. At low HCl concentrations, suchas those commonly found after acid gas scrubbers, recovery efficiencies for allchlorophenols averaged 95 percent. At higher HCl levels, recovery of less chlorinatedspecies, such as 4-chlorophenol, was as low as 16 percent. More highly chlorinatedspecies were less affected, with pentachlorophenol recoveries as high as 89 percent. [21]
The quantification of dioxins in combustor gases, as has been made obvious by thepreceding discussion, is quite accurately and succinctly described by Unsworth et al.(1995) as follows: [22]
“There are no standard repeatability or reproducibility values availablefor dioxin concentration in flue gases — significant potential sources oferror occur in both the sampling and analysis procedures.”
Given these constraints, it seems unlikely that any relationships would arise from thestatistical analyses employed. Although these issues are raised by Rigo et al., they are notsufficiently addressed as contributing factors to poor correlations with regard to their ownanalyses and interpretations.

With this extent of uncertainty in mind, it is quite surprising that a preponderance ofpositive relationships between chlorine input and dioxin stack emissions was evidentamong the statistical values calculated by Rigo et al. for individual full-scale municipalwaste, medical waste and hazardous waste combustors as well as by the values calculatedby Greenpeace for cement kilns. Perhaps these findings are indicative of strongerunderlying trends linking chlorine input with dioxin concentrations in stack emissions, atleast in certain types of combustors. In any event, these findings appear to heighten theprobability that evaluation of more appropriate, accurate data (e.g., dioxin concentrationsin other combustor residues, production rates of the residues, stack gas flowrates, wastefeedrates or chlorine feedrates, etc.) would have found chlorine input to correlatepositively with total dioxin output from the full-scale combustors in this study.
Notes
1 Harris, J.C., Larsen, D.J., Rechsteiner, C.E., and Thrun, K.E., “Sampling and Analysis Methods forHazardous Waste Combustion,” EPA-600/884-002, Washington, D.C.: U.S. Environmental ProtectionAgency, February 1984.2 Rigo et al., p. A-1.3 Liem, A.K.Djien, Job. A. van Zorge. Dioxins and Related Compounds: Status and Regulatory Aspects.Environ. Sci. and Pollut. Res. 2(1): 46-56 (1995).4 Johnke, B., and Stelzner, E., “Results of the German dioxin measurement programme at MSWincinerators,” Waste Management & Research 10: 345-355 (1992).5 Air Pollution Abatement Review Group, “Report on the Abatement of Toxic Organic Micropollutants(TOMPS) from Stationary Sources 1995,” Prepared at the request of Air Quality Division, Department ofthe Environment, AEA Technology, National Technology Centre, Abingdon, Oxfordshire, UK, 1995.6 ECETOC, “Technical Report No. 49: Exposure of Man to Dioxins: A Perspective on Industrial WasteIncineration,” Second Edition, Brussels, September 1992.7Marklund, S., Soderstrom, G., Ljung, K., Rappe, C., Kraft, M., Hagenmaier, H. Parallel sampling fordioxins using various sampling techniques at a Swedish municipal solid waste incinerator. Waste Manage.& Research 10: 21-36 (1992)8Rigo et al., p. 2-51.9 Air Pollution Abatement Review Group, “Report on the Abatement of Toxic Organic Micropollutants(TOMPS) from Stationary Sources 1995,” Prepared at the request of Air Quality Division, Department ofthe Environment, AEA Technology, National Technology Centre, Abingdon, Oxfordshire, UK, 1995.10 Fangmark, I., Wikstrom, L-E, Marklund, S., Rappe, C., “Studies on sampling methods for PCDDs andPCDFs in stack emissions,” Chemosphere 20 (10-12): 1333-1340 (1990).11 Hunsinger, H., Kreisz, S., and Vogg, H. Experiences gained from the sampling of chlorine aromatics inthe raw gas of waste incineration plants - conclusions with regard to dedusting technology. Chemosphere32 (1): 109-118 (1996)12 Janssens, J.J., Daelmans, F.F. and Schepens, P.J.C. Sampling incinerator effluents for PCDDs andPCDFs: A critical evaluation of existing sampling procedures. Chemosphere 25 (710): 1323-1332 (1992)13 Funcke, W., and Linneman, H. Sampling of polychlorinated dibenzofurans (PCDF) anddibenzo(p)dioxins in emissions from combustion facilities using an adsorption method. Chemosphere24(11): 1563-1572 (1992)14 Air Pollution Abatement Review Group, “Report on the Abatement of Toxic Organic Micropollutants(TOMPS) from Stationary Sources 1995,” Prepared at the request of Air Quality Division, Department ofthe Environment, AEA Technology, National Technology Centre, Abingdon, Oxfordshire, UK, 1995.15 Fangmark, I., Wikstrom, L-E, Marklund, S., Rappe, C., “Studies on sampling methods for PCDDs andPCDFs in stack emissions,” Chemosphere 20 (10-12): 1333-1340 (1990).16 Air Pollution Abatement Review Group, “Report on the Abatement of Toxic Organic Micropollutants(TOMPS) from Stationary Sources 1995,” Prepared at the request of Air Quality Division, Department ofthe Environment, AEA Technology, National Technology Centre, Abingdon, Oxfordshire, UK, 1995.

17 Air Pollution Abatement Review Group, “Report on the Abatement of Toxic Organic Micropollutants(TOMPS) from Stationary Sources 1995,” Prepared at the request of Air Quality Division, Department ofthe Environment, AEA Technology, National Technology Centre, Abingdon, Oxfordshire, UK, 1995.18 Coates, J.T., “Validation of Emission Test Method for PCDDs and PCDFs,” EPA/600/3-90/007, U.S.Environmental Protection Agency, Research Triangle Park, NC, March 1990.19 United States Environmental Protection Agency, “Standards of Performance for New StationarySources; Addition of Methods for Measurement of Polychlorinated Dibenzo-p-Dioxins, PolychlorinatedDibenzofurans, and Hydrogen Chloride Emissions From Stationary Sources,” Federal Register, Vol. 56,No. 30, Wednesday, February 13, 1991, pp. 5758-5775.20 Takeshita, R., Akimoto, Y., and Nito, S. Effective sampling system for polychlorinated dibenzo-p-dioxins and polychlorinated dibenzofurans in flue gas from municipal solid incinerators. Environ. Sci.Technol. 29(5): 1186-1194 (1995).21 Tan, L.K. and Liem, A.J. Effect of hydrochloric acid on sampling and analysis of semivolatile organiccompounds in incineration flue gas. 1. Chlorophenols. Environ. Sci. Technol. 30(3): 1053-1060, 1996.22 Unsworth, J.F., Felix, A., Broadbent, C.P., and Adkins, N.J. Dioxin issues in the thermal oxidativeprocessing of mercury contaminated wastes. TransIChemE, Vol.73, Part B, pp.123-31. May 1995.
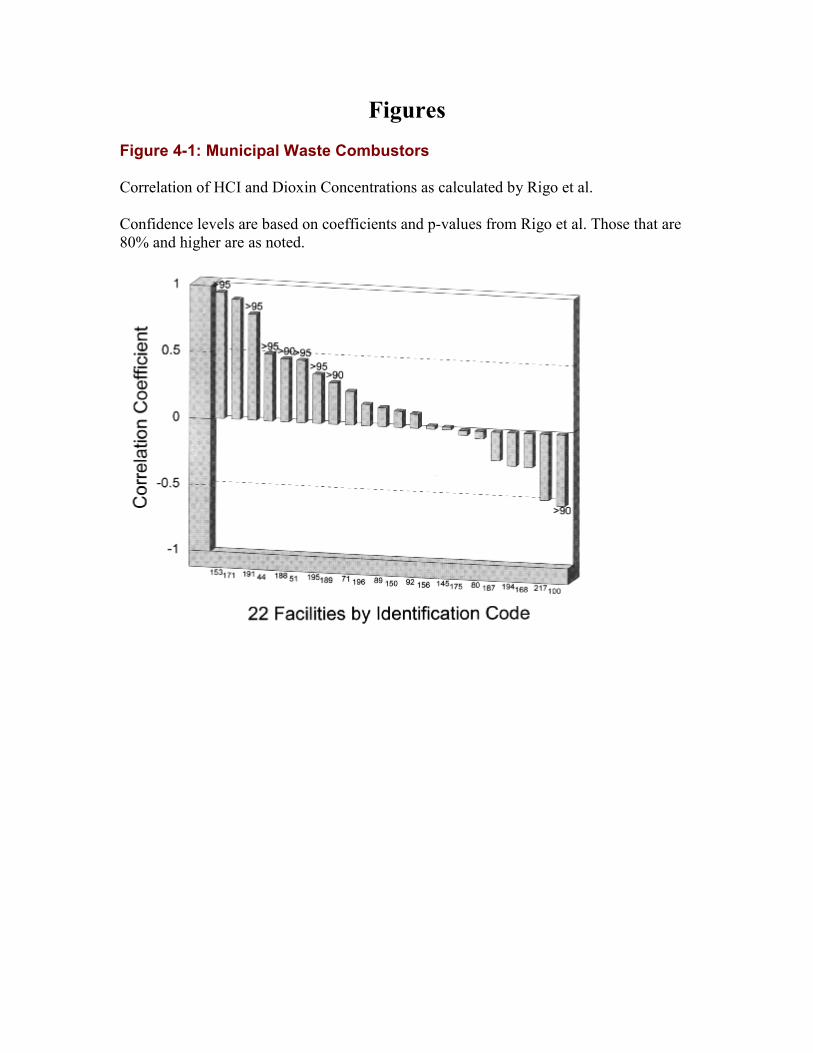
FiguresFigure 4-1: Municipal Waste Combustors
Correlation of HCI and Dioxin Concentrations as calculated by Rigo et al.
Confidence levels are based on coefficients and p-values from Rigo et al. Those that are80% and higher are as noted.

Figure 4-2: Municipal Waste Combustors
Scatter Plot from Rigo et al.

Figure 4-3: Municipal Waste Combustors
Figure 4-4: Municipal Waste Combustors

Figure 4-5: Municipal Waste Combustors
Figure 4-6: Municipal Waste Combustors

Figure 5-1: Medical Waste Incinerators
Statistical Values by Rigo et al.
Correlation of HCI and Dioxin Concentrations, as calculated by Rigo et al.
Figure 5-2: Medical Waste Incinerators
Scatter Plot by Rigo et al.

Figure 5-3: Medical Waste Incinerators

Figure 5-4: Medical Waste Incinerators

Figure 6-1 Hazardous Waste Incinerators
Correlation of Percent Chlorine in Feed and Dioxin, as Calculated by Rigo et al.
Note: The data in this graph are not useful for assessing the relationship between chlorineinput and dioxin emissions.

Figure 6-2 Hazardous Waste Incinerators
Scatter Plot by Rigo et al.
Figure 6-3 Hazardous Waste Incinerators
Scatter Plot by Rigo et al.


Figure 6-4 Hazardous Waste Incinerators
Correlation of Percent Chlorine in Feed and Dioxin Concentrations. - Greenpeace

Figure 6-5 Hazardous Waste Incinerators
Chlorine Feedrate vs. Dioxin Concentrations - Greenpeace Analysis

Figure 6-6 Hazardous Waste Incinerators
Effects of Aggregating Data Sets. Chlorine Feedrates vs. PCDD/Fs.
Figure 6-7 Hazardous Waste Incinerators
Comparison of Correlation Coefficients for Chlorine Feedrate vs. PCDD/Fs and PercentChlorine in Feed vs. PCDD/Fs.

Figure 8-1 Cement Kilns
Relationship of Chlorine Feedrate and Dioxin Concentrations. Greenpeace Analysis ofData from ASME Database.

Acknowledgements
Thanks to the Following Contributors:
Editorial Assistance: Charlie Cray, Lisa Finaldi, Rick Hind, Paul Johnston, KathyO'Keefe, Beverley Thorpe, Bill Walsh, Jack Weinberg
Production Assistance: Robert King, Jay Townsend
Special Thanks to: Barry Commoner, CBNS, Queens College, Flushing, New York,USA; Paul Connett, St. Lawrence University, Canton, New York, USA; David Santillo,Greenpeace International Science Unit, Exeter University, Exeter, Devon, U.K.; and TomWebster, Boston University School of Public Health, Boston, Massachusetts, USA, forreviewing the draft of the report.
In addition, thanks are due to Tom Hotard and J. Pat Valentik for their assistance withstatistical matters and to Jack Weinberg, Lisa Finaldi, Beverley Thorpe for their adviceand encouragement.
This document was funded by Greenpeace International.
This report © Greenpeace 1997, ISBN 90-73361-33-8