Embed Size (px)
Citation preview
Asthma and lower airway disease
The burden of adult asthma in the United States: Evidencefrom the Medical Expenditure Panel Survey
Patrick W. Sullivan, PhD,a Vahram H. Ghushchyan, PhD,b Julia F. Slejko, BA,b Vasily Belozeroff, PhD,c Denise R. Globe,
PhD,c and Shao-Lee Lin, MD, PhDd Denver, Colo, and Thousand Oaks, Calif
Abbreviations used
ICD-9: International Classification of Diseases, Ninth Revision
MEPS: Medical Expenditure Panel Survey
NCC: Number of chronic conditions
US: United States
Background: It is important to have an accurate picture of thesources and extent of medical expenditures and productivity lossto understand the nature and scope of the burden of asthma inthe United States (US).Objective: The current study aims to provide recent nationallyrepresentative estimates of direct and productivity-related costsattributable to asthma in adults in the US.Methods: The 2003 and 2005 Medical Expenditure PanelSurveys were used to estimate the effect of asthma on medicalexpenditures, use, productivity, and chronic comorbidity amongadults (>_18 years). Productivity-related outcome variablesincluded employment, annual wages, missed work days, daysspent sick in bed, and activity limitations. Multivariateregression was conducted, controlling for sociodemographicsand comorbidity.Results: Of 47,033 adults, 2,003 reported asthma. Comparedwith those without, subjects with asthma were significantly lesslikely to be employed (odds ratio, 0.78), spent 1.4 more days sickin bed annually, and were significantly more likely to haveactivity limitations or to be unable to work. Adults with asthmaincurred an additional $1,907 (2008 US dollars) annually andexperienced higher health care use and comorbidity. The totalnational medical expenditure attributable to adult asthma was$18 billion. Adults with asthma were more likely to be coveredby Medicaid (30%) than the general adult population (10%).The largest contributors to medical expenditures for adults withasthma were prescription drugs, followed by inpatienthospitalizations and home health care.Conclusions: In recent national data adult asthma is associatedwith a significant deleterious effect on direct and indirect costsin the US. (J Allergy Clin Immunol 2011;127:363-9.)
Key words: Medical expenditures, productivity, insurance coverage,utilization outcomes, economic burden, cost analyses, insurancetrends
From aRegis University School of Pharmacy, Denver; bthe University of Colorado Den-
ver, Pharmaceutical Outcomes Research Program, Department of Clinical Pharmacy;
and cGlobal Health Economics and dClinical Development, Amgen, Inc, Thousand
Oaks.
Supported by a research grant from Amgen, Inc.
Disclosure of potential conflict of interest: P. W. Sullivan and V. H. Ghushchyan have
received research support from Amgen, Inc. V. Belozeroff, S. Lin, and D. R. Globe are
employed by Amgen, Inc. The rest of the authors have declared that they have no
conflict of interest.
Received for publication May 1, 2010; revised October 18, 2010; accepted for publica-
tion October 20, 2010.
Reprint requests: Patrick W. Sullivan, PhD, Regis University School of Pharmacy, 3333
Regis Blvd, H-28, Denver, CO 80221. E-mail: [email protected].
0091-6749/$36.00
� 2011 American Academy of Allergy, Asthma & Immunology
doi:10.1016/j.jaci.2010.10.042
Asthma is a chronic inflammatory lung disease that affects anestimated 23 million Americans (16 million adults), of whom atleast 12 million experience an asthma attack every year.1 Thesymptoms of asthma cause significant burden. leading to chronic,episodic, and often dramatic effects on patients’ lives. Numerousstudies worldwide have documented the significant negative ef-fect of asthma on health care expenditures.2 In addition to its ef-fect on direct costs, asthma has been shown to have a deleteriouseffect on productivity in a variety of studies throughout theworld.2 The prevalence of the disease coupled with the signifi-cantly increasedmedical expenditures and productivity loss resultin a large economic burden attributable to asthma.To understand the nature and scope of the burden of asthma in
the United States (US), it is important to have an accuratedescription of the extent and characteristics of medical expendi-tures and productivity loss in the nation. This national level ofanalysis can provide essential information about the burden ofasthma and can help inform national guidelines and health policy.The burden has been estimated previously in studies usingnationally representative data.3-6 Although there is valuable evi-dence in these previously published studies, available therapies,treatment patterns, and incidence rates change over time. In addi-tion, a comprehensive assessment of the direct and indirect (pro-ductivity-related) costs associated with asthma in recentnationally representative data is needed.The objective of the current study was to provide an assessment
of the direct and indirect costs attributable to asthma in adults inthe US. We assessed the effect of asthma on (1) productivity, (2)use, (3) medical expenditures, and (4) comorbidity burden. Inaddition, we estimated (5) the total national medical expendituresattributable to asthma, (6) the relative proportion of sources ofmedical expenditures (eg, hospitalizations and prescriptiondrugs), and (7) the proportion ofmedical expenditures contributedby different payers, including Medicare, Medicaid, and others.
METHODS
Data sourceThe Medical Expenditure Panel Survey (MEPS) is a nationally represen-
tative Department of Pharmacy Practice, survey of the US civilian,
363
J ALLERGY CLIN IMMUNOL
FEBRUARY 2011
364 SULLIVAN ET AL
noninstitutionalized population.7 It is an overlapping panel design in which
each cohort is followed for 2 years. Respondents complete the battery of ques-
tions in each round (there are 3 rounds per year). The MEPS Household Com-
ponent contains detailed self-reported information on demographic and
socioeconomic characteristics, health conditions, insurance status, smoking
status, use and cost of health care services, employment, and missed work
days. MEPS collects data on use and expenditures of office- and hospital-
based care, home health care, dental services, vision aids, and prescribedmed-
icines. The MEPS Medical Provider Component is a follow-back survey that
collects detailed information from a sample of pharmacies and health care pro-
viders used by MEPS respondents. The Medical Provider Component supple-
ments and validates information on medical use, pharmacy events, and
expenditures. Further details on MEPS are available at www.meps.ahrq.gov
and in Appendix E1 in this article’s Online Repository at www.jacionline.org.
Study populationThe analytic sample for use, medical expenditures, comorbidity, and
productivity included pooled 2003 and 2005 data on adults (>_18 years of age).
These survey years were chosen because they were the most recently available
(at the time of analysis) and ensured an adequate sample size (2004 data were
excluded because of potential duplication of subjects).
MEPS contains information on medical conditions based on self-reported
medical and pharmacy use and self-reported conditions, which are then
mapped to 693 three-digit International Classification of Diseases, Ninth
Revision (ICD-9) codes by professional coders. The medical condition–level
data were merged to the individual data to form an individual-level analytic
sample.
Outcome (dependent) variablesDependent variables included (1) productivity, (2) use, (3) medical
expenditures, and (4) comorbidity burden. Productivity-related dependent
variables included employment, annual wages, missed work days, days spent
sick in bed, and activity limitations and inability. Subjects employed at any
time during the year were classified as employed. The subject’s annual wage
included all income from salary and wages. Employed subjects were asked in
each round howmany days (half-day or more) of work theymissed because of
illness or injury. Subsequently, subjects were asked how many missed work
days were spent in bed at least half the day. All subjects (whether employed
or not) were asked about days other than those reported for work or school
in which they spent at least a half day in bed because of illness or injury (these
are referred to as nonwork days). The latter question is the onlymeasure of lost
days for unemployed subjects (eg, retirees or homemakers); nonwork days
would also include weekends or other days off for those who are employed.
MEPS also includes specific questions about whether subjects experienced
work or housework limitations and whether they were unable to work, do
housework, or go to school. These are referred to as ‘‘activity limitation’’ or
‘‘activity inability.’’
Use variables included office-based visits, hospital visits, and prescriptions.
All use variables were reported on an annual basis. Medical expenditures
included everything that was paid for health care services. More specifically,
expenditures in MEPS are defined as the sum of direct payments for care
provided during the year, including out-of-pocket payments and payments by
private insurance, Medicaid, Medicare, and other sources (for more informa-
tion, see Appendix E1 in this article Online Repository).7
A variable was constructed from all reported chronic ICD-9 codes to
capture comorbidity burden. For this analysis, the total number of reported
chronic conditions minus asthma were added together to create a count
variable called the number of chronic conditions (NCC). We used the NCC
variable as the main measure of generic comorbidity burden.
In addition to the 4 aforementioned dependent variables, 3 additional
outcomes were estimated from the expenditure information: the total national
medical expenditures attributable to asthma in the US, the relative proportion
of different types of medical expenditures (eg, hospitalizations vs prescription
drugs), and the proportion of total medical expenditures contributed by
different payers (eg, Medicare and Medicaid).
Independent variablesThe presence of asthma was identified by ICD-9 code 493. Only subjects
who had some expenditure or encounter with the medical system within the
year (either 2003 or 2005) related to ICD-9 code 493 were categorized as
having asthma. In addition, several sociodemographic characteristics were
used in the statistical analysis to control for confounding: education, poverty
category, insurance coverage, race, ethnicity, age, sex, smoking status, and
physical activity (for more information, see Appendix E1 in this article’s
Online Repository).
Statistical analysisThe current research used STATA9.2 software (StataCorp, College Station,
Tex) to adjust for the complex sample design in all analyses to ensure
nationally representative estimates. All analyses (unadjusted andmultivariate)
incorporated MEPS person-level weights and variance adjustment weights
(strata and primary sampling unit) and are thus nationally representative. De-
scriptive statistics were used to explore associations of asthma subgroups with
all outcomes and potential confounding factors. Multivariable analysis adjust-
ing for potential confounders used the methods described below (for more
information, see Appendix E1 in this article’s Online Repository).
Productivity. The number of missed work days and the number of
days spent sick in bed per year were treated as count variables. Negative
binomial regression and zero-inflated negative binomial regression8 were used
to regress the number of missed work days and sick days on asthma (yes/no)
controlling for age, sex, race, ethnicity, income, education, smoking status,
and comorbidity (NCC). Zero-inflated negative binomial regression addresses
count data, as well as the clustering of zero-outcome observations, as is com-
mon with these specific outcomes. Logistic regression was used to regress the
dichotomous activity limitation and inability variables on asthma (yes/no),
controlling for sociodemographics and comorbidity (NCC). Logistic regres-
sion was also used to regress employment on asthma (yes/no), controlling
for age, sex, race, ethnicity, education, smoking status, and comorbidity
(NCC). To estimate the effect of asthma on annual wages, a maximum likeli-
hood Heckman selection model9,10 was used, with logarithmic transformation
of annual wages and smearing retransformation11 by using the naive (normal)
assumption for residuals. Wage data were inflated to US dollars.
Medical utilization. Health care use was estimated by using
negative binomial and zero-inflated negative binomial regression. Office-
based visits, outpatient visits, emergency department visits, hospital dis-
charges, and number of prescriptions were regressed on asthma (yes/no),
controlling for age, sex, race, ethnicity, income, education, smoking status,
insurance status, and comorbidity (NCC).
Medical expenditures. Medical expenditure analysis also used the
Heckman selection method, with logarithmic transformation of expenditures
and smearing retransformation using the naive assumption to account for the
large number of zero observations and the skewed nature of cost data. The
marginal cost attributable to asthma was estimated from the expenditure
equation, controlling for potential confounders: age, sex, race, ethnicity,
income, smoking status, insurance status, and comorbidity (NCC). Then the
marginal cost was calculated by using the smearing retransformation method.
Expenditure data were inflated to 2008 US dollars as a common year by using
the Medical Care component of the Consumer Price Index.12 By using the
MEPS person-level weights, the per-person medical costs attributable to
asthma were aggregated to calculate the total national burden of medical
expenditures attributable to asthma for adults in the US.
Comorbidity. Negative binomial and zero-inflated negative binomial
regression were also used to examine the number of comorbid conditions
associated with asthma by regressing NCC on asthma (yes/no), controlling for
age, sex, race, ethnicity, income, education, and smoking status.
RESULTS
Unadjusted descriptive statisticsOf the 47,033 adults in MEPS, 2,003 subjects reported an
encounter for asthma. Details of the study sample and
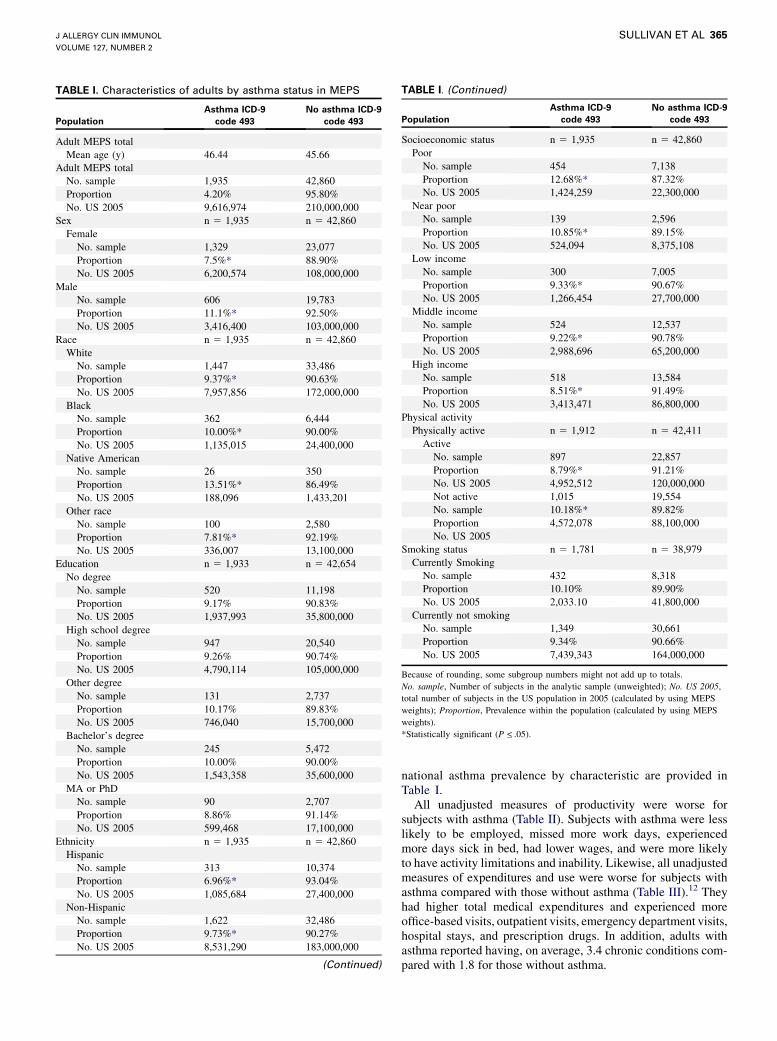
TABLE I. Characteristics of adults by asthma status in MEPS
Population
Asthma ICD-9
code 493
No asthma ICD-9
code 493
Adult MEPS total
Mean age (y) 46.44 45.66
Adult MEPS total
No. sample 1,935 42,860
Proportion 4.20% 95.80%
No. US 2005 9,616,974 210,000,000
Sex n 5 1,935 n 5 42,860
Female
No. sample 1,329 23,077
Proportion 7.5%* 88.90%
No. US 2005 6,200,574 108,000,000
Male
No. sample 606 19,783
Proportion 11.1%* 92.50%
No. US 2005 3,416,400 103,000,000
Race n 5 1,935 n 5 42,860
White
No. sample 1,447 33,486
Proportion 9.37%* 90.63%
No. US 2005 7,957,856 172,000,000
Black
No. sample 362 6,444
Proportion 10.00%* 90.00%
No. US 2005 1,135,015 24,400,000
Native American
No. sample 26 350
Proportion 13.51%* 86.49%
No. US 2005 188,096 1,433,201
Other race
No. sample 100 2,580
Proportion 7.81%* 92.19%
No. US 2005 336,007 13,100,000
Education n 5 1,933 n 5 42,654
No degree
No. sample 520 11,198
Proportion 9.17% 90.83%
No. US 2005 1,937,993 35,800,000
High school degree
No. sample 947 20,540
Proportion 9.26% 90.74%
No. US 2005 4,790,114 105,000,000
Other degree
No. sample 131 2,737
Proportion 10.17% 89.83%
No. US 2005 746,040 15,700,000
Bachelor’s degree
No. sample 245 5,472
Proportion 10.00% 90.00%
No. US 2005 1,543,358 35,600,000
MA or PhD
No. sample 90 2,707
Proportion 8.86% 91.14%
No. US 2005 599,468 17,100,000
Ethnicity n 5 1,935 n 5 42,860
Hispanic
No. sample 313 10,374
Proportion 6.96%* 93.04%
No. US 2005 1,085,684 27,400,000
Non-Hispanic
No. sample 1,622 32,486
Proportion 9.73%* 90.27%
No. US 2005 8,531,290 183,000,000
(Continued)
TABLE I. (Continued)
Population
Asthma ICD-9
code 493
No asthma ICD-9
code 493
Socioeconomic status n 5 1,935 n 5 42,860
Poor
No. sample 454 7,138
Proportion 12.68%* 87.32%
No. US 2005 1,424,259 22,300,000
Near poor
No. sample 139 2,596
Proportion 10.85%* 89.15%
No. US 2005 524,094 8,375,108
Low income
No. sample 300 7,005
Proportion 9.33%* 90.67%
No. US 2005 1,266,454 27,700,000
Middle income
No. sample 524 12,537
Proportion 9.22%* 90.78%
No. US 2005 2,988,696 65,200,000
High income
No. sample 518 13,584
Proportion 8.51%* 91.49%
No. US 2005 3,413,471 86,800,000
Physical activity
Physically active n 5 1,912 n 5 42,411
Active
No. sample 897 22,857
Proportion 8.79%* 91.21%
No. US 2005 4,952,512 120,000,000
Not active 1,015 19,554
No. sample 10.18%* 89.82%
Proportion 4,572,078 88,100,000
No. US 2005
Smoking status n 5 1,781 n 5 38,979
Currently Smoking
No. sample 432 8,318
Proportion 10.10% 89.90%
No. US 2005 2,033.10 41,800,000
Currently not smoking
No. sample 1,349 30,661
Proportion 9.34% 90.66%
No. US 2005 7,439,343 164,000,000
Because of rounding, some subgroup numbers might not add up to totals.
No. sample, Number of subjects in the analytic sample (unweighted); No. US 2005,
total number of subjects in the US population in 2005 (calculated by using MEPS
weights); Proportion, Prevalence within the population (calculated by using MEPS
weights).
*Statistically significant (P <_ .05).
J ALLERGY CLIN IMMUNOL
VOLUME 127, NUMBER 2
SULLIVAN ET AL 365
national asthma prevalence by characteristic are provided inTable I.All unadjusted measures of productivity were worse for
subjects with asthma (Table II). Subjects with asthma were lesslikely to be employed, missed more work days, experiencedmore days sick in bed, had lower wages, and were more likelyto have activity limitations and inability. Likewise, all unadjustedmeasures of expenditures and use were worse for subjects withasthma compared with those without asthma (Table III).12 Theyhad higher total medical expenditures and experienced moreoffice-based visits, outpatient visits, emergency department visits,hospital stays, and prescription drugs. In addition, adults withasthma reported having, on average, 3.4 chronic conditions com-pared with 1.8 for those without asthma.
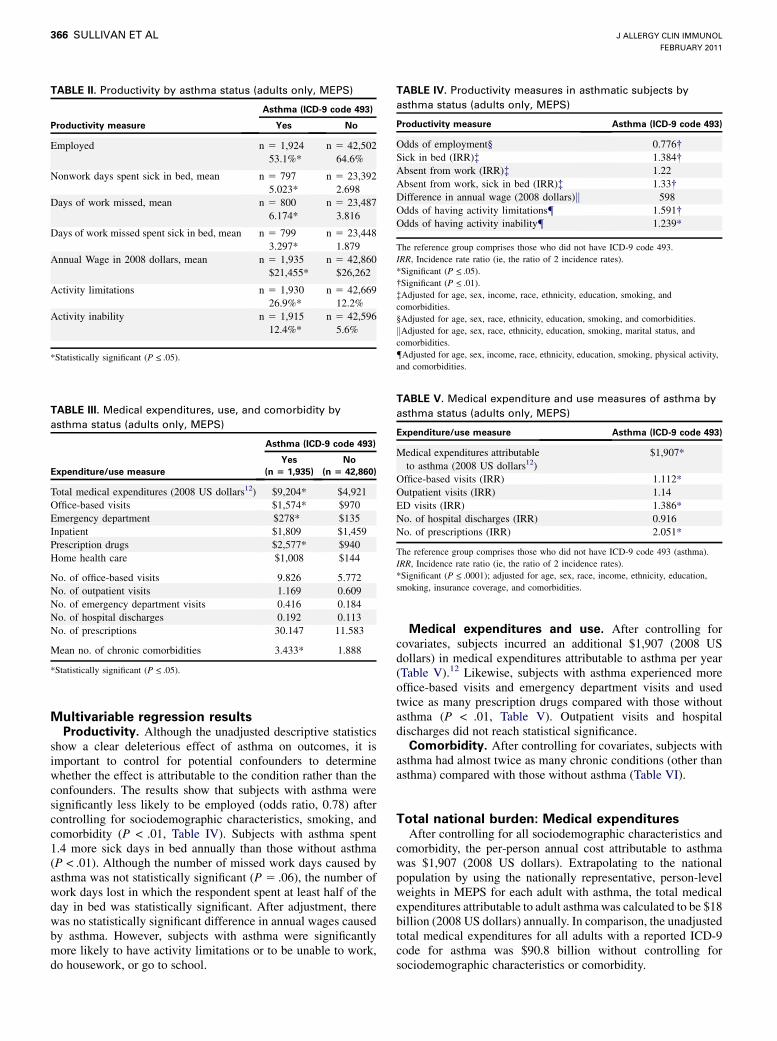
TABLE II. Productivity by asthma status (adults only, MEPS)
Asthma (ICD-9 code 493)
Productivity measure Yes No
Employed n 5 1,924
53.1%*
n 5 42,502
64.6%
Nonwork days spent sick in bed, mean n 5 797
5.023*
n 5 23,392
2.698
Days of work missed, mean n 5 800
6.174*
n 5 23,487
3.816
Days of work missed spent sick in bed, mean n 5 799
3.297*
n 5 23,448
1.879
Annual Wage in 2008 dollars, mean n 5 1,935
$21,455*
n 5 42,860
$26,262
Activity limitations n 5 1,930
26.9%*
n 5 42,669
12.2%
Activity inability n 5 1,915
12.4%*
n 5 42,596
5.6%
*Statistically significant (P <_ .05).
TABLE III. Medical expenditures, use, and comorbidity by
asthma status (adults only, MEPS)
Asthma (ICD-9 code 493)
Expenditure/use measure
Yes
(n 5 1,935)
No
(n 5 42,860)
Total medical expenditures (2008 US dollars12) $9,204* $4,921
Office-based visits $1,574* $970
Emergency department $278* $135
Inpatient $1,809 $1,459
Prescription drugs $2,577* $940
Home health care $1,008 $144
No. of office-based visits 9.826 5.772
No. of outpatient visits 1.169 0.609
No. of emergency department visits 0.416 0.184
No. of hospital discharges 0.192 0.113
No. of prescriptions 30.147 11.583
Mean no. of chronic comorbidities 3.433* 1.888
*Statistically significant (P <_ .05).
TABLE IV. Productivity measures in asthmatic subjects by
asthma status (adults only, MEPS)
Productivity measure Asthma (ICD-9 code 493)
Odds of employment§ 0.776�Sick in bed (IRR)� 1.384�Absent from work (IRR)� 1.22
Absent from work, sick in bed (IRR)� 1.33�Difference in annual wage (2008 dollars)k 598
Odds of having activity limitations{ 1.591�Odds of having activity inability{ 1.239*
The reference group comprises those who did not have ICD-9 code 493.
IRR, Incidence rate ratio (ie, the ratio of 2 incidence rates).
*Significant (P <_ .05).
�Significant (P <_ .01).
�Adjusted for age, sex, income, race, ethnicity, education, smoking, and
comorbidities.
§Adjusted for age, sex, race, ethnicity, education, smoking, and comorbidities.
kAdjusted for age, sex, race, ethnicity, education, smoking, marital status, and
comorbidities.
{Adjusted for age, sex, income, race, ethnicity, education, smoking, physical activity,
and comorbidities.
TABLE V. Medical expenditure and use measures of asthma by
asthma status (adults only, MEPS)
Expenditure/use measure Asthma (ICD-9 code 493)
Medical expenditures attributable
to asthma (2008 US dollars12)
$1,907*
Office-based visits (IRR) 1.112*
Outpatient visits (IRR) 1.14
ED visits (IRR) 1.386*
No. of hospital discharges (IRR) 0.916
No. of prescriptions (IRR) 2.051*
The reference group comprises those who did not have ICD-9 code 493 (asthma).
IRR, Incidence rate ratio (ie, the ratio of 2 incidence rates).
*Significant (P <_ .0001); adjusted for age, sex, race, income, ethnicity, education,
smoking, insurance coverage, and comorbidities.
J ALLERGY CLIN IMMUNOL
FEBRUARY 2011
366 SULLIVAN ET AL
Multivariable regression resultsProductivity. Although the unadjusted descriptive statistics
show a clear deleterious effect of asthma on outcomes, it isimportant to control for potential confounders to determinewhether the effect is attributable to the condition rather than theconfounders. The results show that subjects with asthma weresignificantly less likely to be employed (odds ratio, 0.78) aftercontrolling for sociodemographic characteristics, smoking, andcomorbidity (P < .01, Table IV). Subjects with asthma spent1.4 more sick days in bed annually than those without asthma(P < .01). Although the number of missed work days caused byasthma was not statistically significant (P 5 .06), the number ofwork days lost in which the respondent spent at least half of theday in bed was statistically significant. After adjustment, therewas no statistically significant difference in annual wages causedby asthma. However, subjects with asthma were significantlymore likely to have activity limitations or to be unable to work,do housework, or go to school.
Medical expenditures and use. After controlling forcovariates, subjects incurred an additional $1,907 (2008 USdollars) in medical expenditures attributable to asthma per year(Table V).12 Likewise, subjects with asthma experienced moreoffice-based visits and emergency department visits and usedtwice as many prescription drugs compared with those withoutasthma (P < .01, Table V). Outpatient visits and hospitaldischarges did not reach statistical significance.Comorbidity. After controlling for covariates, subjects with
asthma had almost twice as many chronic conditions (other thanasthma) compared with those without asthma (Table VI).
Total national burden: Medical expendituresAfter controlling for all sociodemographic characteristics and
comorbidity, the per-person annual cost attributable to asthmawas $1,907 (2008 US dollars). Extrapolating to the nationalpopulation by using the nationally representative, person-levelweights in MEPS for each adult with asthma, the total medicalexpenditures attributable to adult asthmawas calculated to be $18billion (2008 US dollars) annually. In comparison, the unadjustedtotal medical expenditures for all adults with a reported ICD-9code for asthma was $90.8 billion without controlling forsociodemographic characteristics or comorbidity.
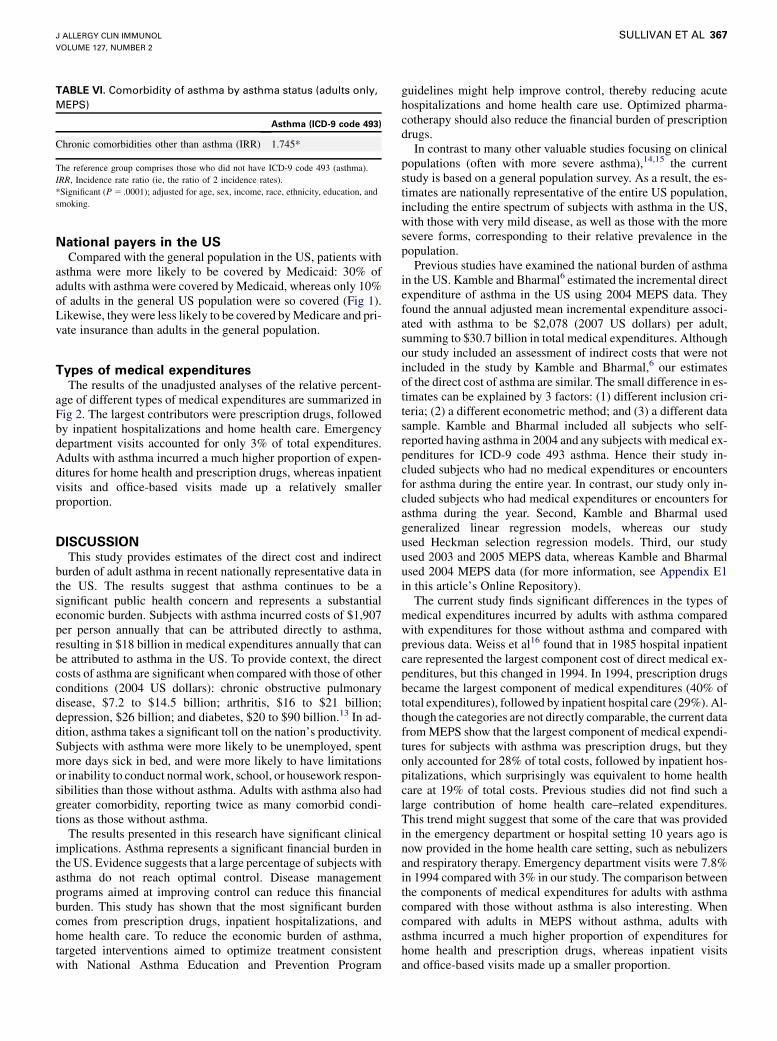
TABLE VI. Comorbidity of asthma by asthma status (adults only,
MEPS)
Asthma (ICD-9 code 493)
Chronic comorbidities other than asthma (IRR) 1.745*
The reference group comprises those who did not have ICD-9 code 493 (asthma).
IRR, Incidence rate ratio (ie, the ratio of 2 incidence rates).
*Significant (P 5 .0001); adjusted for age, sex, income, race, ethnicity, education, and
smoking.
J ALLERGY CLIN IMMUNOL
VOLUME 127, NUMBER 2
SULLIVAN ET AL 367
National payers in the USCompared with the general population in the US, patients with
asthma were more likely to be covered by Medicaid: 30% ofadults with asthma were covered byMedicaid, whereas only 10%of adults in the general US population were so covered (Fig 1).Likewise, theywere less likely to be covered byMedicare and pri-vate insurance than adults in the general population.
Types of medical expendituresThe results of the unadjusted analyses of the relative percent-
age of different types of medical expenditures are summarized inFig 2. The largest contributors were prescription drugs, followedby inpatient hospitalizations and home health care. Emergencydepartment visits accounted for only 3% of total expenditures.Adults with asthma incurred a much higher proportion of expen-ditures for home health and prescription drugs, whereas inpatientvisits and office-based visits made up a relatively smallerproportion.
DISCUSSIONThis study provides estimates of the direct cost and indirect
burden of adult asthma in recent nationally representative data inthe US. The results suggest that asthma continues to be asignificant public health concern and represents a substantialeconomic burden. Subjects with asthma incurred costs of $1,907per person annually that can be attributed directly to asthma,resulting in $18 billion in medical expenditures annually that canbe attributed to asthma in the US. To provide context, the directcosts of asthma are significant when compared with those of otherconditions (2004 US dollars): chronic obstructive pulmonarydisease, $7.2 to $14.5 billion; arthritis, $16 to $21 billion;depression, $26 billion; and diabetes, $20 to $90 billion.13 In ad-dition, asthma takes a significant toll on the nation’s productivity.Subjects with asthma were more likely to be unemployed, spentmore days sick in bed, and were more likely to have limitationsor inability to conduct normal work, school, or housework respon-sibilities than those without asthma. Adults with asthma also hadgreater comorbidity, reporting twice as many comorbid condi-tions as those without asthma.The results presented in this research have significant clinical
implications. Asthma represents a significant financial burden inthe US. Evidence suggests that a large percentage of subjects withasthma do not reach optimal control. Disease managementprograms aimed at improving control can reduce this financialburden. This study has shown that the most significant burdencomes from prescription drugs, inpatient hospitalizations, andhome health care. To reduce the economic burden of asthma,targeted interventions aimed to optimize treatment consistentwith National Asthma Education and Prevention Program
guidelines might help improve control, thereby reducing acutehospitalizations and home health care use. Optimized pharma-cotherapy should also reduce the financial burden of prescriptiondrugs.In contrast to many other valuable studies focusing on clinical
populations (often with more severe asthma),14,15 the currentstudy is based on a general population survey. As a result, the es-timates are nationally representative of the entire US population,including the entire spectrum of subjects with asthma in the US,with those with very mild disease, as well as those with the moresevere forms, corresponding to their relative prevalence in thepopulation.Previous studies have examined the national burden of asthma
in the US. Kamble and Bharmal6 estimated the incremental directexpenditure of asthma in the US using 2004 MEPS data. Theyfound the annual adjusted mean incremental expenditure associ-ated with asthma to be $2,078 (2007 US dollars) per adult,summing to $30.7 billion in total medical expenditures. Althoughour study included an assessment of indirect costs that were notincluded in the study by Kamble and Bharmal,6 our estimatesof the direct cost of asthma are similar. The small difference in es-timates can be explained by 3 factors: (1) different inclusion cri-teria; (2) a different econometric method; and (3) a different datasample. Kamble and Bharmal included all subjects who self-reported having asthma in 2004 and any subjects with medical ex-penditures for ICD-9 code 493 asthma. Hence their study in-cluded subjects who had no medical expenditures or encountersfor asthma during the entire year. In contrast, our study only in-cluded subjects who had medical expenditures or encounters forasthma during the year. Second, Kamble and Bharmal usedgeneralized linear regression models, whereas our studyused Heckman selection regression models. Third, our studyused 2003 and 2005 MEPS data, whereas Kamble and Bharmalused 2004 MEPS data (for more information, see Appendix E1in this article’s Online Repository).The current study finds significant differences in the types of
medical expenditures incurred by adults with asthma comparedwith expenditures for those without asthma and compared withprevious data. Weiss et al16 found that in 1985 hospital inpatientcare represented the largest component cost of direct medical ex-penditures, but this changed in 1994. In 1994, prescription drugsbecame the largest component of medical expenditures (40% oftotal expenditures), followed by inpatient hospital care (29%). Al-though the categories are not directly comparable, the current datafromMEPS show that the largest component of medical expendi-tures for subjects with asthma was prescription drugs, but theyonly accounted for 28% of total costs, followed by inpatient hos-pitalizations, which surprisingly was equivalent to home healthcare at 19% of total costs. Previous studies did not find such alarge contribution of home health care–related expenditures.This trend might suggest that some of the care that was providedin the emergency department or hospital setting 10 years ago isnow provided in the home health care setting, such as nebulizersand respiratory therapy. Emergency department visits were 7.8%in 1994 compared with 3% in our study. The comparison betweenthe components of medical expenditures for adults with asthmacompared with those without asthma is also interesting. Whencompared with adults in MEPS without asthma, adults withasthma incurred a much higher proportion of expenditures forhome health and prescription drugs, whereas inpatient visitsand office-based visits made up a smaller proportion.
FIG 1. Expenditures by source of payment (MEPS).
FIG 2. Expenditures by use type (MEPS).
J ALLERGY CLIN IMMUNOL
FEBRUARY 2011
368 SULLIVAN ET AL
Therewere also some interesting findings when considering theresults of the relative contribution of national payers to medicalexpenditures for asthma. The results of this study showed thatmedical expenditures for asthma were much more likely to bepaid by Medicaid than other expenditures: 10% of adults in thegeneral US population were covered by Medicaid, whereas 30%of adults with asthmawere covered byMedicaid. Similarly, adultswith asthma were less likely to be covered by Medicare andprivate insurance than adults in the general population. Perhapsthis reflects the population characteristics of adults with asthma inthe US seen in Table I: asthmatic patients were disproportionatelypoor and might be more likely to receiveMedicaid. Overall, how-ever, the disproportionately larger amount of asthma-relatedmed-ical expenditures paid by Medicaid has important implicationswhen considering the vast Medicaid expansion that will be imple-mented under new health care legislation.The results of the current study showed a mixed effect on
productivity compared with previous publications. The effect ofasthma on missed work can be measured in 3 ways: absenteeism(absence from work), presenteeism (present at work but notfunctioning at full productive capacity), and unemployment. Thecurrent study used the MEPS question regarding the number ofmissed work days to ascertain absenteeism. In addition, employ-ment status was used to measure unemployment. There were nospecific measures of presenteeism; however, the questions aboutlimitations and inability to perform normal work, school, or
housework might be a surrogate measure. Lost productivity forsubjects who were not employed (eg, retirees or homemakers)was captured by the question regarding days spent sick in bed(other than for work or school). The results of our study show thatasthma has a significant effect on employment and limitations/inability to work, but given that an individual is employed, therewas no statistically significant difference in absenteeism (missedwork days). Therewas a statistically significant difference in daysspent sick in bed (other than work or school), suggesting reducedproductivity for those who are not employed. Many previousstudies have shown a deleterious effect of asthma on productivityandwork loss in the US.2-5,17-19 Some of these studies have shownan increase in missed work days associated with asthma. It is un-clear why our study did not find this result (for more information,see Appendix E1 in this article’s Online Repository).This research is not without limitations. The annual prevalence
of adult asthma in this study was only 4.2% compared with 7.3%estimated by the US Centers for Disease Control and Preven-tion.20 Surveys such as MEPS and the National Health InterviewSurvey are based on self-report and hence might be subject tomisclassification bias. The case definition of asthma used in thisresearch was based on whether the subject reported having a med-ical visit or prescription for asthma in the survey year. This defi-nition excludes subjects who have asthma but have not needed toencounter the medical system or might not accurately recall hav-ing asthma-related medical visits. Previous research has shown
J ALLERGY CLIN IMMUNOL
VOLUME 127, NUMBER 2
SULLIVAN ET AL 369
that self-reported conditions might be underreported, and theextent might vary by race and ethnicity. MEPS is also limited incapturing differences in disease severity. The current study didnot include absenteeism or lost productivity caused by prematuremortality. Despite the limitations, this study provides an impor-tant overview of the burden of asthma in a nationally representa-tive general population sample of the US.In conclusion, in recent national data asthma is associated with
a significant deleterious effect on direct and indirect costs in theUS.
Key messages
d In recent national data, adult asthma is associated with asignificant deleterious effect on direct and productivity-related costs in the US.
d Adult asthma results in $18 billion in medical expendi-tures in the US annually.
d Adults with asthma are more likely to receive Medicaidthan those without asthma.
REFERENCES
1. National Institutes of Health, National Heart, Lung, and Blood Institute. Morbidity
and mortality: 2007 chart book on cardiovascular, lung, and blood diseases.
Bethesda: National Heart, Lung, and Blood Institute; 2007.
2. Bahadori K, Doyle-Waters MM, Marra C, Lynd L, Alasaly K, Swiston J, et al.
Economic burden of asthma: a systematic review. BMC Pulm Med 2009;9:24.
3. Smith DH, Malone DC, Lawson KA, Okamoto LJ, Battista C, Saunders WB. A
national estimate of the economic costs of asthma. Am J Respir Crit Care Med
1997;156:787-93.
4. Wang LY, Zhong Y, Wheeler L. Direct and indirect costs of asthma in school-age
children. Prev Chronic Dis 2005;2:A11.
5. Weiss KB, Gergen PJ, Hodgson TA. An economic evaluation of asthma in the
United States. N Engl J Med 1992;326:862-6.
6. Kamble S, Bharmal M. Incremental direct expenditure of treating asthma in the
United States. J Asthma 2009;46:73-80.
7. Medical Expenditure Panel Survey. HC-097 2005 Full year consolidated data file.
Rockville: Agency for Healthcare Research and Quality Center for Financing, Ac-
cess, and Cost Trends; 2007.
8. Cameron AC, Trivedi PK. Regression analysis of count data. Cambridge (UK):
Cambridge University Press; 1998.
9. Heckman JJ. The common structure of statistical models of truncation, sample se-
lection, and limited dependent variables and a sample estimator for such models.
Ann Econ Soc Meas 1976;5:475-92.
10. Heckman JJ. Sample selection bias as a specification error. Econometrica 1979;47:
153-61.
11. Duan N. Smearing estimate: a nonparametric retransformation method. J Am Stat
Assoc 1983;78:605-10.
12. Bureau of Labor Statistics. Public data query. Consumer price index—all urban
consumers (current series)—medical care. Available at: http://data.bls.gov/PDQ/
outside.jsp?survey5cu. Accessed December 28, 2009.
13. RTI International. Cost-of-illness summaries for selected conditions. Research Tri-
angle Park (NC): RTI International; 2006.
14. Chen H, Gould MK, Blanc PD, Miller DP, Karnath TV, Sullivan SD, et al. Asthma
control, severity, and quality of life: quantifying the effect of uncontrolled disease.
J Allergy Clin Immunol 2007;120:396-402.
15. Dolan CM, Fraher KE, Bleecker ER, Borish L, Chipps B, Hayden ML, et al. Design
and baseline characteristics of the epidemiology and natural history of asthma: Out-
comes and Treatment Regimens (TENOR) study: a large cohort of patients with se-
vere or difficult-to-treat asthma. Ann Allergy Asthma Immunol 2004;92:32-9.
16. Weiss KB, Sullivan SD, Lyttle CS. Trends in the cost of illness for asthma in the
United States, 1985-1994. J Allergy Clin Immunol 2000;106:493-9.
17. Cisternas MG, Blanc PD, Yen IH, Katz PP, Earnest G, Eisner MD, et al. A com-
prehensive study of the direct and indirect costs of adult asthma. J Allergy Clin Im-
munol 2003;111:1212-8.
18. Birnbaum HG, Berger WE, Greenberg PE, Holland M, Auerbach R, Atkins KM,
et al. Direct and indirect costs of asthma to an employer. J Allergy Clin Immunol
2002;109:264-70.
19. Gendo K, Sullivan SD, Lozano P, Finkelstein JA, Fuhlbrigge A, Weiss KB. Re-
source costs for asthma-related care among pediatric patients in managed care.
Ann Allergy Asthma Immunol 2003;91:251-7.
20. Centers for Disease Control and Prevention. National health interview survey, Na-
tional Center for Health Statistics. Available at: http://www.cdc.gov/asthma/nhis/
06/table4-1.htm. Accessed January 2, 2011.
J ALLERGY CLIN IMMUNOL
FEBRUARY 2011
369.e1 SULLIVAN ET AL
APPENDIX E1
DEPENDENT VARIABLES
Productivity relatedEmployment: Subjects employed at any time during the year
were classified as being employed.Annual wages: The subjects’ self-reported annual wage in-
cluded all income from salary and wages for the year.Missed work days: Employed subjects were asked in each
round howmany days (half-day or more) of work they missed be-cause of illness or injury and how many days were missed inwhich at least half the day was spent in bed.Missed work days spent in bed: Employed subjects were asked
in each round how many days (half-day or more) of work theymissed in which at least half the day was spent in bed.Days spent sick in bed: All subjects (whether employed or not)
were asked about days other than those reported for work orschool in which they spent at least a half day in bed because ofillness or injury (these are referred to as nonwork days). The latterquestion is the only measure of lost days for unemployed subjects(eg, retirees or homemakers). Nonwork days would also includeweekends or other days off for those who were employed.Activity limitations: MEPS includes specific questions about
whether subjects experienced work or housework limitationsand whether they were unable to work, do housework, or go toschool: ‘‘Were you limited in your ability to do work, houseworkor go to school?’’ ‘‘Were you unable to do work, housework or goto school?’’ These are referred to as ‘‘activity limitation’’ or ‘‘ac-tivity inability.’’
Use relatedOffice-based visits: The total number of office-based visits
within the year were added together. All use variables were re-ported on an annual basis.Hospital visits: Hospital visits included the total number of out-
patient visits, hospital discharges, and emergency departmentvisits in the year.Prescription drugs: Prescriptions were reported as a count of
all prescribed medications purchased during the year and in-cluded initial purchases and refills.Medical expenditures: Medical expenditures were summed to-
gether for all use events and included all sources of payments,thereby reflecting actual costs and not charges. Expenditureswere defined as the sum of all the direct payments for care pro-vided during the year, including out-of-pocket payments and pay-ments by private insurance, Medicare, Medicaid, and all othersources.
ComorbidityNumber of chronic conditions: Avariable was constructed from
all reported chronic ICD-9 codes to capture comorbidity burden.For this analysis, the total number of reported chronic conditionsminus asthma were added together to create a count variablecalled the NCC. We used the NCC variable as the main measureof generic comorbidity burden.
INDEPENDENT VARIABLESAsthma: The presence of asthma was identified by ICD-9 code
493. Only subjects who had some expenditure or encounter withthemedical systemwithin the year (either 2003 or 2005) related to
ICD-9 code 493 were categorized as having asthma. All otherswere categorized as not having asthma.Education: Education was categorized as high school not com-
pleted, high school completed, other degree, Bachelor’s degree,Master’s degree, or PhD.Poverty category: Socioeconomic status was categorized based
on the federal poverty level as poor (<100%), near poor (100% to125%), low income (125% to 200%), middle income (200% to400%), or high income (>_400%). The federal poverty thresholdfor a family of 4 in the contiguous US was $19,350 in 2005.For more information, please see http://aspe.hhs.gov/poverty/05poverty.shtml.Insurance coverage: Insurance coveragewas classified as unin-
sured, private insurance, or public insurance.Race: Race was categorized as white, black, American In-
dian, or ‘‘other’’ (a composite category, including Asian, PacificIslander, and any other race not included in the first 3categories).Age: Age was grouped in the following categories: 18 to 29, 30
to 39, 40 to 49, 50 to 59, 60 to 69, 70 to 79, and 80 or more years.Ethnicity: Ethnicity was categorized as Hispanic or non-
Hispanic.Smoking status: Smoking status included current smoker and
not current smoker.Physical activity: Physical activity was measured as whether
the respondent spent a half hour or more in moderate-to-vigorousactivity at least 3 times a week.
Statistical analysisCovariates were chosen based on their theoretical association
with the outcome variable and suitability for the model. Forexample, in the model with employed (yes/no) as the dependentvariable, income was omitted as an independent variable becauseof the dual causeway. Other covariates were included becausethey had a strong theoretical relationship with the outcome (eg,insurance coverage and medical expenditures/use, physical ac-tivity, and activity limitations). All analyses (unadjusted andmultivariate) incorporated MEPS person-level weights and var-iance adjustment weights (strata and primary sampling unit) andare thus nationally representative.
MEPSThe following information is taken directly from the MEPS
Web siteE1:1.0 Household ComponentThe Medical Expenditure Panel Survey (MEPS) provides
nationally representative estimates of health care use, expendi-tures, sources of payment, and health insurance coverage for theU.S. civilian non-institutionalized population. The MEPS House-hold Component (HC) also provides estimates of respondents’health status, demographic and socio-economic characteristics,employment, access to care, and satisfaction with health care.Estimates can be produced for individuals, families, and selectedpopulation subgroups. The panel design of the survey, whichincludes 5 Rounds of interviews covering 2 full calendar years,provides data for examining person level changes in selectedvariables such as expenditures, health insurance coverage, andhealth status. Using computer assisted personal interviewing(CAPI) technology, information about each household member iscollected, and the survey builds on this information from
J ALLERGY CLIN IMMUNOL
VOLUME 127, NUMBER 2
SULLIVAN ET AL 369.e2
interview to interview. All data for a sampled household arereported by a single household respondent.The MEPS-HC was initiated in 1996. Each year a new panel of
sample households is selected. Because the data collected arecomparable to those from earlier medical expenditure surveysconducted in 1977 and 1987, it is possible to analyze long-termtrends. Each annual MEPS-HC sample size is about 15,000households. Data can be analyzed at either the person or eventlevel. Data must be weighted to produce national estimates.The set of households selected for each panel of the MEPS HC
is a subsample of households participating in the previous year’sNational Health Interview Survey (NHIS) conducted by theNational Center for Health Statistics. The NHIS sampling frameprovides a nationally representative sample of the U.S. civiliannon-institutionalized population and reflects an oversample ofblacks and Hispanics. MEPS oversamples additional policyrelevant sub-groups such as Asians and low income households.The linkage of the MEPS to the previous year’s NHIS providesadditional data for longitudinal analytic purposes.2.0 Medical Provider ComponentUpon completion of the household CAPI interview and
obtaining permission from the household survey respondents, asample of medical providers are contacted by telephone to obtaininformation that household respondents can not accurately pro-vide. This part of the MEPS is called the Medical ProviderComponent (MPC) and information is collected on dates of visit,diagnosis and procedure codes, charges and payments. ThePharmacy Component (PC), a subcomponent of the MPC, doesnot collect charges or diagnosis and procedure codes but doescollect drug detail information, including National Drug Code(NDC) and medicine name, as well as date filled and sources andamounts of payment. The MPC is not designed to yield nationalestimates. It is primarily used as an imputation source tosupplement/replace household reported expenditure information.2.6.10 Utilization, Expenditures and Source of Payment Var-
iables (TOTTCH05-RXOSR05)The MEPS Household Component (HC) collects data in each
round on use and expenditures for office- and hospital-basedcare, home health care, dental services, vision aids, and pre-scribed medicines. Data were collected for each sample person atthe event level (e.g., doctor visit, hospital stay) and summedacross Rounds 3-5 for Panel 9 (excluding 2004 events covered inRound 3) and across Rounds 1-3 for Panel 10 (excluding 2006events covered in Round 3) to produce the annual utilization andexpenditure data for 2005. In addition, the MEPS MedicalProvider Component (MPC) is a follow-back survey that col-lected data from a sample of medical providers and pharmaciesthat were used by sample persons in 2005. Expenditure datacollected in the MPC are generally regarded as more accuratethan information collected in the HC and were used to improvethe overall quality of MEPS expenditure data in this file (seebelow for description of methodology used to develop expendi-ture data).This file contains utilization and expenditure variables for
several categories of health care services. In general, there is oneutilization variable (based on HC responses only), 13 expenditurevariables (derived from both HC and MPC responses), and onecharge variable for each category of health care service. Theutilization variable is typically a count of the number of medicalevents reported for the category. The 13 expenditure variablesconsist of an aggregate total payments variable, 10 main
component source of payment category variables, and twoadditional source of payment category variables (see below fordescription of source of payment categories). Expenditure vari-ables for all categories of health care combined are also provided.These variables generally represent a full year of use andexpenditures. However, for persons who were not is scope forthe entire year, these variables reflect the period of eligibility.2.6.10.1 Expenditures DefinitionExpenditures on this file refer to what is paid for health care
services. More specifically, expenditures in MEPS are defined asthe sum of direct payments for care provided during the year,including out-of-pocket payments and payments by privateinsurance, Medicaid, Medicare, and other sources. Payments forover-the-counter drugs are not included in MEPS total expendi-tures. Indirect payments not related to specific medical events,such as Medicaid Disproportionate Share and Medicare DirectMedical Education subsidies, are also not included.The definition of expenditures used in MEPS is somewhat
different from the 1987 NMES and 1987 NMCES surveys wherecharges rather than sum of payments were used to measureexpenditures. This changewas adopted because charges became aless appropriate proxy for medical expenditures during the 1990sdue to the increasingly common practice of discounting charges.Another change from the two prior surveys is that chargesassociated with uncollected liability, bad debt, and charitablecare (unless provided by a public clinic or hospital) are notcounted as expenditures because there are no payments associatedwith those classifications.While the concept of expenditures in MEPS has been
operationalized as payments for health care services, variablesreflecting charges for services received are also provided on thefile (see below). Analysts should use caution when working withthe charge variables because they do not typically represent actualdollars exchanged for services or the resource costs of thoseservices.Data Sources on ExpendituresThe expenditure data included on this file were derived from
the MEPS Household and Medical Provider Components. OnlyHC data were collected for nonphysician visits, dental and visionservices, other medical equipment and services, and home healthcare not provided by an agency while data on expenditures forcare provided by home health agencies were only collected in theMPC. In addition to HC data, MPC data were collected for someoffice-based visits to physicians (or medical providers supervisedby physicians), hospital-based events (e.g., inpatient stays,emergency room visits, and outpatient department visits), andprescribed medicines. For these types of events, MPC data wereused if complete; otherwise, HC data were used if complete.Missing data for events where HC data were not complete andMPC datawere not collected or completewere derived through animputation process (see below).A series of logical edits were applied to both the HC and
MPC data to correct for several problems including, but notlimited to, outliers, copayments or charges reported as totalpayments, and reimbursed amounts that were reported as out-of-pocket payments. In addition, edits were implemented tocorrect for misclassifications between Medicare and Medicaidand between Medicare HMOs and private HMOs as paymentsources. Data were not edited to insure complete consistencybetween the health insurance and source of payment variableson the file.
REFERENCES
E1. Medical Expenditure Panel Survey. HC-097 2005 full year consolidated data file.
Rockville: Agency for Healthcare Research and Quality Center for Financing,
Access, and Cost Trends; 2007.
E2. Kamble S, Bharmal M. Incremental direct expenditure of treating asthma in the
United States. J Asthma 2009;46:73-80.
E3. Wang LY, Zhong Y, Wheeler L. Direct and indirect costs of asthma in school-age
children. Prev Chronic Dis 2005;2:A11.
E4. Bureau of Labor Statistics. public data query. consumer price index—all urban
consumers (current series)—medical care. Available at: http://data.bls.gov/
PDQ/outside.jsp?survey5cu. Accessed December 28, 2009.
E5. Weiss KB, Gergen PJ, Hodgson TA. An economic evaluation of asthma in the
United States. N Engl J Med 1992;326:862-6.
E6. Weiss KB, Sullivan SD, Lyttle CS. Trends in the cost of illness for asthma in the
United States, 1985-1994. J Allergy Clin Immunol 2000;106:493-9.
E7. Smith DH, Malone DC, Lawson KA, Okamoto LJ, Battista C, Saunders WB. A
national estimate of the economic costs of asthma. Am J Respir Crit Care Med
1997;156:787-93.
E8. National Institutes of Health, National Heart, Lung, and Blood Institute. Data fact
sheet: asthma statistics. Bethesda: National Heart, Lung, and Blood Institute;
1999.
E9. Yelin E, Trupin L, Cisternas M, Eisner M, Katz P, Blanc P. A national study of
medical care expenditures for respiratory conditions. Eur Respir J 2002;19:
414-21.
E10. Bahadori K, Doyle-Waters MM, Marra C, Lynd L, Alasaly K, Swoiston J, et al.
Economic burden of asthma: a systematic review. BMC Pulm Med 2009;9:24.
E11. Cisternas MG, Blanc PD, Yen IH, Katz PP, Earnest G, Eisner MD, et al. A com-
prehensive study of the direct and indirect costs of adult asthma. J Allergy Clin
Immunol 2003;111:1212-8.
J ALLERGY CLIN IMMUNOL
FEBRUARY 2011
369.e3 SULLIVAN ET AL
DISCUSSION
Comparison with previous literatureOther than Kamble and Bharmal,E2there are also several older
publications. Although some share similar nationally representa-tive data sources, the results of the current study are difficult tocompare with those of prior studies because their data are mucholder. In addition, this study uses a series of different statisticalmodels and limits the scope to adults only.Using the 1996MedicalExpenditure Panel Survey,Wang et alE3 estimated the total (directand indirect) cost of asthma in children. They estimated a total costof $2.3 billion (2008 US dollarsE4). Weiss et alE5 estimated the to-tal burden (direct and indirect) of asthma to be $7.2 billion (2008US dollarsE4) by using the 1985National Center for Health Statis-tics data. In an update,Weiss et alE5 estimated the total direct costsof asthma in 1994 again using the National Center for HealthStatistics data and found the total to be $18.5 billionE6 (2008 USdollarsE4). Smith et alE7 used the 1987NationalMedical Expendi-ture Survey to estimate the total burden (direct and indirect) at$8.2 billion (2008 US dollarsE4). The National Heart, Lung, andBlood Institute estimated the cost of asthma in 1998 to be $11.3billion, with $8 billion in direct costs and $4 billion in indirectcosts (2008 US dollarsE4).E8 Although not asthma specific, Yelinet alE9 examined the 1996Medical Expenditure Panel Survey andestimated the total national burden (direct costs only) because ofall respiratory disorders to be $72.3 billion (2008 US dollarsE4).There have also been other nonnationally representative studiesto examine the per-person cost of asthma.E10 For example, Cis-ternas et alE11 used a clinical cohort of adults with asthma fromNorthern California in 1998 to estimate a total cost of $7,387per person ($4,782 in direct and $2,605 in indirect costs) associ-ated with asthma (2008 US dollarsE4). In comparison, the currentanalysis provides more recent nationally representative estimatesof the direct and indirect costs of adult asthma.Our estimates of the total national burden of medical expen-
ditures for adults is similar to the 1994 estimate of Weiss et alE5
after inflation to 2008 US dollars. However, Weiss et al’s estimateincluded children, whereas ours is limited to adults. Our per-per-son total medical expenditures attributable to asthma were lowerthan estimates by Cisternas et alE11 When juxtaposing our esti-mates to previous published estimates; however, it is importantto note that other approaches to estimating costs associated withasthma might not control for sociodemographic characteristicsor comorbidity. For example, the unadjusted per-person medicalexpenditures in this study (see Table III) were estimated to be$9,204 for adults with asthma. In comparison, adults withoutasthma incurred $4,921 annually in medical expenditures. Theunadjusted total national cost of asthma in this study was $90.8billion. This study used a very restrictive set of regression modelsto estimate the isolated effect of asthma on outcomes. The studydesign took advantage of the rich MEPS data and controlled fornumerous important confounding factors, such as age, sex, race,ethnicity, education, income, smoking status, marital status, phys-ical activity, and comorbidity. The results are robust estimates ofthe attributable effect of asthma on outcomes. This is an importantapproach, especially considering the observed associations be-tween asthma and income, comorbidity, sex, ethnicity, race,
education, and physical activity seen in the unadjusted descriptivestatistics presented in Table I.
Missed workThere are many possible explanations why the results were not
statistically significant for the number of missed work days. First,MEPS is a general population survey, and as such, there are manypatients with mild disease in the sample because there is a higherprevalence of mild asthma in the US.Second, our study used different statistical analyses to assess
the attributable effect of asthma on missed work days. We used aHeckman selection model that incorporates the probability that asubject is employed and then estimates the number of missedwork days conditional on being employed. Statistical models thatdo not incorporate the high percentage of subjects who areunemployed and therefore have zero missed work days might bemore likely to overestimate the number of missed work days in anentire sample. In addition, our regression model controlled formany other covariates that other studies did not include. Forexample, the unadjusted number of missed work days in MEPSwas 6.2 for subjects with asthma versus 3.8 for those without.Nonetheless, we believe our approach is the most robust.Third, the survey question is based on recall, and there might be
some element of inaccuracy in the question design or method ofelicitation that is resulting in a biased measure.Fourth, the most recent analysis in a general population survey
in the US is more than 2 decades old. It is possible that newertreatment patterns are achieving some success. This latterassumption is not substantiated by our results and would be agood topic for future research.