Embed Size (px)
Citation preview

THE BROOKINGS INSTITUTION | NOVEMBER 2017
Balancing Act: Schools, Neighborhoods and Racial Imbalance
Grover J. “Russ” Whitehurst Richard V. Reeves
Senior Fellow Senior Fellow
Nathan Joo Edward Rodrigue
Senior Research Assistant Former Senior Research Assistant

ECONOMIC STUDIES AT BROOKINGS
0 /// Balancing Act: Schools, Neighborhoods, and Racial Imbalance
Contents
SUMMARY ........................................................................................................................................................ 1
CHAPTER 1: School segregation background ................................................................................................. 5
History and context ......................................................................................................................................... 5
Trends in racial segregation ............................................................................................................................ 6
Why does school segregation matter? ............................................................................................................ 7
CHAPTER 2: Measures of racial segregation and concentration in schools ................................................. 9
CHAPTER 3: Data and methodology............................................................................................................. 10
Data................................................................................................................................................................. 10
Methodology ................................................................................................................................................... 11
CHAPTER 4: Result 1 – Most schools look like their neighborhoods ......................................................... 14
CHAPTER 5: Results 2 – Outliers in terms of racial imbalance – more black, less white ......................... 15
CHAPTER 6: Result 3 – Charters show more racial imbalance ................................................................. 20
Racial imbalance by school type .................................................................................................................. 20
Outlier status for racial imbalance and school type ..................................................................................... 21
CHAPTER 8: Result 4 – Why do charters exhibit higher levels of imbalance? It’s complicated ............... 22
CHAPTER 9: Result 5 – Racially imbalanced schools are concentrated in a handful of states ................. 23
CHAPTER 10: School district boundaries divide some communities along racial lines ............................ 25
Long Island, New York .................................................................................................................................. 26
Camden, New Jersey ..................................................................................................................................... 29
CHAPTER 10: Conclusion .............................................................................................................................. 33
Tables and Figures ............................................................................................................................................. 35
References .......................................................................................................................................................... 47

ECONOMIC STUDIES AT BROOKINGS
1 /// Balancing Act: Schools, Neighborhoods, and Racial Imbalance
SUMMARY
1. As outlined in our previous report on the subject, school segregation by race has declined since the 1960s, largely because of the increase in the Hispanic school population. That said, white segregation has been more or less flat since the 1990s.
2. The segregation of schools by race remains high, however. Noteworthy is the continued separation of white and black students. This could have various negative consequences, from social isolation to academic outcomes.
3. In this paper, and accompanying online interactive, we investigate the racial composition of schools, compared to the neighborhoods in which they are located. School segregation inevitably reflects, to a greater or lesser extent, neighborhood segregation - especially when enrollment criteria are based on geography. We construct a “racial imbalance measure” for every non-private (including traditional public schools, charter schools and magnet schools) school in the U.S., comparing the racial composition of each school to that of its surrounding neighborhood. (We use a 2-mile radius to match schools to nearby Census blocks within the school’s district; but the findings are largely the same for other distances and approaches).
Result 1: Most schools look like their neighborhoods
Our headline finding is that schools look a lot like the communities they are located in, at least within school districts. The average public school is about 3 percent less white, 2 percent more black, 1 percent more Hispanic, and 0.3 percent more Asian than its surrounding neighborhood. To a very large extent, school segregation is a mechanical result of residential segregation. America’s schools, by and large, look like America’s neighborhoods.
Result 2: Outliers in terms of racial imbalance: more black, less white
To look more closely at schools with high racial imbalance scores, we identify outliers relative to within-state distributions of racial imbalance for public schools. We find two main groups of outlier schools: those with lower white representation than in their neighborhoods, and those with higher black representation. Of all the schools in the U.S., 33 percent (28,705 schools) are defined as outliers, with significant state-level over- or underrepresentation of at least one race.

ECONOMIC STUDIES AT BROOKINGS
2 /// Balancing Act: Schools, Neighborhoods, and Racial Imbalance
Result 3: Charters show more racial imbalance
Charter schools, on average, have higher racial imbalance scores than traditional public schools, especially in terms of black student imbalance. The proportion of outliers among charter schools in terms of white, black and Hispanic overrepresentation are about 11, 19, and 2 per-centage points higher, respectively, than for traditional public schools.
Result 4: Why do charters exhibit higher levels of imbalance: it’s complicated
Few easily discernable factors seem to predict the degree to which some charters exhibit higher racial imbalances than others. Correlations exist, but causal relationships are not clear. That said, the charter sector in large metropolitan areas where charters are more likely to be nearby (within a mile of) equivalent-grade-level traditional public schools and other charter schools ex-hibits more substantial imbalances.
Result 5: Some states show more racial imbalances than others
There are big differences among states, in part because of big differences in their overall racial composition. There are two common patterns for schools across the nation:
1. The white share of the school population is often less than what the surrounding neigh-borhood would indicate, potentially because of white student enrollment in private schools (which are not represented in our data).
2. The share of blacks in the school tends to be more than what the surrounding neighbor-hood benchmark would indicate.
However, states exhibit different distributions of these types of marginal underrepresentation or overrepresentation of different races. Take the first metric, white underrepresentation: in New York, Ohio, Kentucky, and Iowa more than 8 percent of schools can be classified as having substantially fewer white students in their schools than the surrounding neighborhood, given their state’s demographic composition. On the latter metric, black overrepresentation, different states stand out. In Arkansas, Indiana, and Ohio more than 15 percent of schools have substan-tially higher shares of black students compared to what the surrounding neighborhood would indicate.
ECONOMIC STUDIES AT BROOKINGS
3 /// Balancing Act: Schools, Neighborhoods, and Racial Imbalance
Result 6: School district boundaries divide some communities along racial lines
District boundaries influence the racial imbalance of schools, in some cases significantly. Our main racial imbalance measure compares schools to their surrounding neighborhood within a school district. The intuition here is that in general, students can only attend schools in their own school district. But district boundaries themselves may divide neighborhoods along racial lines, in which case our measure will understate racial imbalance in schools. As we showed in our previous paper, while racial segregation of schools within school districts has declined in re-cent decades, segregation between districts has increased. This is a topical question, given the growing frequency of schools attempting to secede from their larger existing districts. We test the influence of district boundaries on the racial imbalance of schools by relaxing the within-district condition in two areas: Long Island, New York and Camden, New Jersey. We find that in these areas, district boundaries can make a big difference. For example, the schools in Floral Park-Bellrose Union Free School District, NY have an overall racial imbalance score of around -1 percent for whites and just under 1 percent for blacks when we retain the within-dis-trict condition for neighborhoods: in other words, the schools appear to mirror their neighbor-hoods almost perfectly. But when the within-district condition is removed, the racial imbalance score for whites is +42 percent, and for blacks is -23 percent. It is the district itself that is segre-gated here. Long Island is unusual in having a very large number (125) of very small school dis-tricts. But the point holds more generally. Our overall results suggest that while schools mostly look like the neighborhoods they serve that are contained within their district, in some places, this is in part because of the way district boundaries divide geographically proximate neighbor-hoods along lines that separate families by race and income.
Conclusion
Much of the action in terms of out of balance racial concentration in America’s schools tends to be the result of residential segregation patterns, and, in some cases, district-level boundaries. Part of the promise of charter schools lies in freeing children from these constraints. How much of this promise do they fulfill? According to our data, charter schools seem to play a heteroge-neous role. The average charter school is approximately 34 percent white, 28 percent black and 29 percent Hispanic. This is approximately 22 percent less white, 14 percent more black, and 8 percent more Hispanic than non-charter public schools.1 On average, they do this by be-ing about 2 percent less white, 6 percent more black, and 3 percent less Hispanic than the sur-rounding neighborhood. However, as figures 2-7 in our Appendix demonstrate, the variance
. . . 1 The average non-charter public school is 56 percent white, 14 percent black, and 21 percent Hispanic.

ECONOMIC STUDIES AT BROOKINGS
4 /// Balancing Act: Schools, Neighborhoods, and Racial Imbalance
around these averages can be substantial and is a striking feature of charter schools. Any re-sponsible reading of the data suggests that charter schools are neither uniformly integrative nor segregative. While we can draw some minor conclusions about where and when charters are associated with a more pronounced imbalance measure, the picture that emerges is a highly granular one that depends on both the goals policymakers are aiming for and the locali-ties in which they aim to affect that change. In providing a rich dataset that captures all public schools across the nation, we aim to give local policymakers the tools necessary to accomplish their goals.

ECONOMIC STUDIES AT BROOKINGS
5 /// Balancing Act: Schools, Neighborhoods, and Racial Imbalance
CHAPTER 1: School segregation background
The racial mix of students in U.S. schools is, for obvious reasons, a source of great interest and concern. In the decades since Brown v Board, attempts to desegregate schools, through both busing and court orders, and the controversy that surrounds them have continued. In a previous paper, “Segregation, race, and charter schools: What do we know?”, we examined long-terms trends in the racial composition of schools, as well as different approaches to meas-uring segregation, with a particular focus on the role of charter schools. In this paper, we make a contribution to the empirical literature by calculating the racial balance of the 86,109 publicly-funded schools in the U.S., compared to the neighborhoods within which they are located. In the following chapters we describe our approach and main results. First, we provide some back-ground, including a recap of our earlier paper.
History and context
School segregation and efforts to reverse it have been a topic of persistent tension in the United States. One source of controversy: busing and transportation. From the South Boston riots in 1974, in which hundreds of whites failed to show up at school or threw rocks and stones at 20 school buses carrying students from predominantly black Roxbury to South Boston, to modern day complaints in Jefferson County, Alabama that such policies inhibit local “control over the geographic composition of the student body,” efforts to integrate schools remain fraught. The Supreme Court has upheld the constitutionality of busing and some voluntary integration policies in the service of school integration, but the legal force driving desegregation has weak-ened. In Milliken v. Bradley, the court ruled that integration across district lines can only be en-forced if evidence of deliberate discrimination by multiple districts can be supplied. In a land-mark 2007 case involving the Seattle and Louisville school districts, the Court ruled that the use of an individual’s race in school assignment decisions was unconstitutional. Since then many lo-calities, like Wake County (which includes the city of Raleigh), Boston, Charlotte, and Seattle have ended or substantially curtailed their efforts at K-12 school racial integration.2 As things stand, it seems highly unlikely that there will be renewed efforts to further integrate schools from the federal government or courts. So: how far have we got?
. . . 2 More information on the history of the rollback of racial school integration: http://www.thestranger.com/fea-
ture/2016/04/13/23945368/how-seattle-gave-up-on-busing-and-allowed-its-public-schools-to-become-alarmingly-resegre-
gated
https://www.newyorker.com/news/news-desk/the-desegregation-and-resegregation-of-charlottes-schools

ECONOMIC STUDIES AT BROOKINGS
6 /// Balancing Act: Schools, Neighborhoods, and Racial Imbalance
Trends in racial segregation
U.S. schools, taken as a whole, are much more racially diverse than a few decades ago, largely because of big increases in the number of Hispanic and Asian American students:
While schools have become more diverse, white and black students remain very separate. While black and white students have become much more likely to share classrooms with His-panics, blacks and whites are not more likely to share classrooms with each other than they were decades ago (Logan et al., 2017), as we highlighted in our last paper:
81%
67%60%
50%
15%
16%
17%
16%
5%
12%17%
25%
3% 4%5%
0%
10%
20%
30%
40%
50%
60%
70%
80%
90%
100%
1968 1991 2001 2014
Year
Figure 1: Public school enrollment by race, 1968-2014
NativeAmerican
Asian
Hispanic
Black
White
Source: 1969, 1991, and 2001 data from: Gary Orfield and Erica Frankenberg, with Jongyeon Ee and John Kuscera, "Brown at 60: GreatProgress, a Long Retreat and an Uncertain Future" (Los Angeles: The Civil Rights Project at UCLA, 2014).Fall 2014 data from: National Center for Education Statistics, "Racial/Ethnic Enrollment in Public Schools," May 2017

ECONOMIC STUDIES AT BROOKINGS
7 /// Balancing Act: Schools, Neighborhoods, and Racial Imbalance
While many school districts are less racially segregated, largely for the reasons described above, school segregation by family income has increased since 1990 - both within and between school districts.
Why does school segregation matter?
In our previous paper, “Segregation, race, and charter schools: What do we know?” we exam-ined in some detail the literature on school segregation and its potential impacts. There is strong evidence that the average outcomes for students in schools with high rates of poverty are worse than those in more economically integrated schools. Black and Hispanic students are much more likely to be poor themselves, and to attend schools with a high proportion of poor students. Race and economic status are highly correlated: black students are four times as likely to be in a high-poverty school as a low-poverty one; for whites the ratio is the other way around:
0
10
20
30
40
50
60
70
80
90
100
1970 1980 1990 2000 2010
Year
Figure 2: School racial segregation
measures (within-district)
White-whiteisolation
Black-blackisolation
Black-whitedissimilarity
Black-whiteexposure
Black-Hispanicexposure
White-Hispanicexposure
White-blackexposure
Source: John R. Logan, Weiwei Zhang, and Deirdre Oakley.(2017). "Court Orders, White Flight, and School District Segregation, 1970-2010."

ECONOMIC STUDIES AT BROOKINGS
8 /// Balancing Act: Schools, Neighborhoods, and Racial Imbalance
The relationship between racial segregation and educational outcomes is explained by eco-nomic segregation, and the overlap of race and poverty (in essence: black kids are not scoring worse because they are black, but because they tend to be poor). As we concluded then:
The weight of evidence suggests that, at least in the context of the education system, the worse educational outcomes for minority students are the result not of the racial composition of their schools, but the economic backgrounds of their fellow students, and the quality of the school itself—both of which are strongly correlated with race.
There is a then a complex and shifting interaction between race, place, poverty and schooling. The goals of more racial integration, more mixed neighborhoods, more economic integration, and better schools are all important, but will not always run easily together. There may of course be many reasons to be troubled by the racial segregation of schools, above and beyond narrow educational outcomes. Those are questions that lie beyond the scope of this paper. Ra-ther our goal in what follows is simply to set out as clearly as possible the facts on the ground.
29%
7% 8%8%
45% 45%
0%
5%
10%
15%
20%
25%
30%
35%
40%
45%
50%
White Black Hispanic
Figure 3: Exposure to low- and high-poverty schools by race, 2012-13
Percent inlow-povertyschool(<25%studentson FRPL)
Percent inhigh-povertyschool(>75%studentson FRPL)
Source: U.S. Department of Education, National Center for Education Statistics, Common Core of Data (CCD), "Public Elementary/Secondary School Universe Survey," 2012-13 (This table was prepared December 2014)

ECONOMIC STUDIES AT BROOKINGS
9 /// Balancing Act: Schools, Neighborhoods, and Racial Imbalance
CHAPTER 2: Measures of racial segregation and concentration in schools
School segregation is notoriously difficult to measure well. The reason is threefold. First, racial categories can be difficult to pin down, especially where ethnicity and race overlap.3 Second, the growing number of multiracial youth makes assigning simple racial identifiers to individual students more dubious. Third, measuring segregation among a set of several groups as opposed to just black versus white (what has historically been most relevant) is, as a statistical matter, mechanically more challenging.
We reviewed the primary indices to measure segregation in our previous paper: (a) the expo-sure index, (b) the isolation index, (c) the dissimilarity index, (d) the divergence index, and (e) the Theil index.
Each of these measures suffers from one or more disadvantages with respect to the goal of providing a practical and easily understood way of identifying schools that are racially out of balance. These include disregard of the demographics of the neighborhoods surrounding a school, insensitivity to the full range of racial categories with respect to which a school can be out of balance, a focus on the diversity of a school’s population rather than its overrepresenta-tion or underrepresentation of racial groups, and the use of indexes that have no intuitive meaning (see Appendix for more detail).
The intent and purpose of this paper is to provide local policymakers and citizens with accurate and granular information that they can understand and use. Thus, we offer a new measure that represents racial imbalances of schools versus neighborhoods, as determined by the percent-age point difference for each racial category between its share of the school population and its share of the population under 18 years old in the surrounding neighborhood.
. . .
3 Note that the definition of Hispanic in this paper includes all persons of Cuban, Mexican, Puerto Rican, South or Central
American, or other Spanish culture or origin, regardless of race.

ECONOMIC STUDIES AT BROOKINGS
10 /// Balancing Act: Schools, Neighborhoods, and Racial Imbalance
CHAPTER 3: Data and methodology
School segregation inevitably reflects, to a greater or lesser extent, neighborhood segregation, especially when enrollment criteria are based on geography. Segregated cities plus neighbor-hood-based admissions make for segregated schools. The question we focus on here is the bal-ance between schools and neighborhoods in terms of racial composition, within school districts. Specifically, we construct a “racial imbalance measure” for every non-private (includes traditional public, charter, and magnet schools) school in the U.S. The methodology required us to:
a. Collect data on the racial composition of each school b. Match schools to school districts c. Define the neighborhood around the school for comparison d. Collect data on the racial composition of these neighborhoods e. Calculate the racial balance of the school versus neighborhood
The steps for this procedure are outlined in more detail, and with one specific example, in the Appendix. What follows is a quick review of data sources and the matching method so that read-ers are aware of how imbalance scores were constructed.
Data
i. School Data
To identify school enrollment and demographics, we used the National Center for Educa-tion Statistics (NCES) Common Core Data (CCD) for the School Year 2013-2014. Our sam-ple excludes those schools with fewer than 25 students4; non-regular schools (vocational, alternative, and special education schools); virtual schools; schools without charters; Head Start schools; and schools whose highest grade of enrollment was pre-kindergarten. The total number of schools in our resulting sample is 86,109.
ii. Neighborhood Data
To generate demographic data, and specifically racial composition, for surrounding neigh-borhoods, we used the National Historical Geographic Information System (NHGIS) Cen-sus data on block geographic boundaries and demographics in 2010. To align with NCES definitions of race, we use the designations of Hispanic, White non-Hispanic, Black non-
. . . 4 Using the variable “Total Students All Grades, Excludes Adult Education Learners”

ECONOMIC STUDIES AT BROOKINGS
11 /// Balancing Act: Schools, Neighborhoods, and Racial Imbalance
Hispanic, Asian non-Hispanic, and other non-Hispanic.5 For each identified neighborhood the sum of each of these populations under 18 years of age is divided by the total popu-lation under 18 years of age in all relevant Census blocks to generate neighborhood shares by race.
Methodology
iii. Defining Neighborhoods
To compare schools to their surrounding neighborhoods, we first define the appropriate geographical area. We tested two approaches: one based on distance and another based on matching according to a school’s population size.6 In both cases, we use Cen-sus blocks to construct the neighborhood and calculate its racial composition. And in both cases, only Census blocks within the school’s district were included in the sur-rounding neighborhood. (See Chapter 10 for results without the within-district rule in selected areas).
Radius approach. Here, the surrounding neighborhood is defined as the ar-eas within a certain radius of the school. Specifically, when the geographic center of a census block fell within the particular radius, this block was in-cluded in the surrounding neighborhood for the purposes of our calculation. We calculated racial imbalance measures for all schools using a radius of half a mile, two miles and five miles. We highlight the results for two-mile neigh-borhoods, but the results for the other radii, which are similar, are reported in the Appendix.
Fill approach. As an alternative to imposing a radius, we also created sur-rounding neighborhoods by expanding out from the school until the youth population (under age 18) of the census blocks matched the enrollment level of the school (or some multiple of that level). The results for a “fill ratio” of 1, 2, and 5 are reported in the Appendix.
. . . 5 NCES statistical standards state that “Aggregated data reported by education institutions about students, faculty, or staff will
follow the Department of Education October 2007 final guidance on ethnicity and race data… Per the Department guidance, the
institutions will report aggregate data on ethnicity and race of their students, faculty, or staff to the Department of Education us-
ing the following categories: Hispanic or Latino, of any race; American Indian or Alaska Native, not Hispanic or Latino; Asian,
not Hispanic or Latino; Black, not Hispanic or Latino; Native Hawaiian or Other Pacific Islander, not Hispanic or Latino; White,
not Hispanic or Latino; Two or more races, not Hispanic or Latino.” For more information see-
https://nces.ed.gov/statprog/2002/std1_5.asp.
6 Population size calculations for neighborhoods based on the population under age 18 in each Census block.
ECONOMIC STUDIES AT BROOKINGS
12 /// Balancing Act: Schools, Neighborhoods, and Racial Imbalance
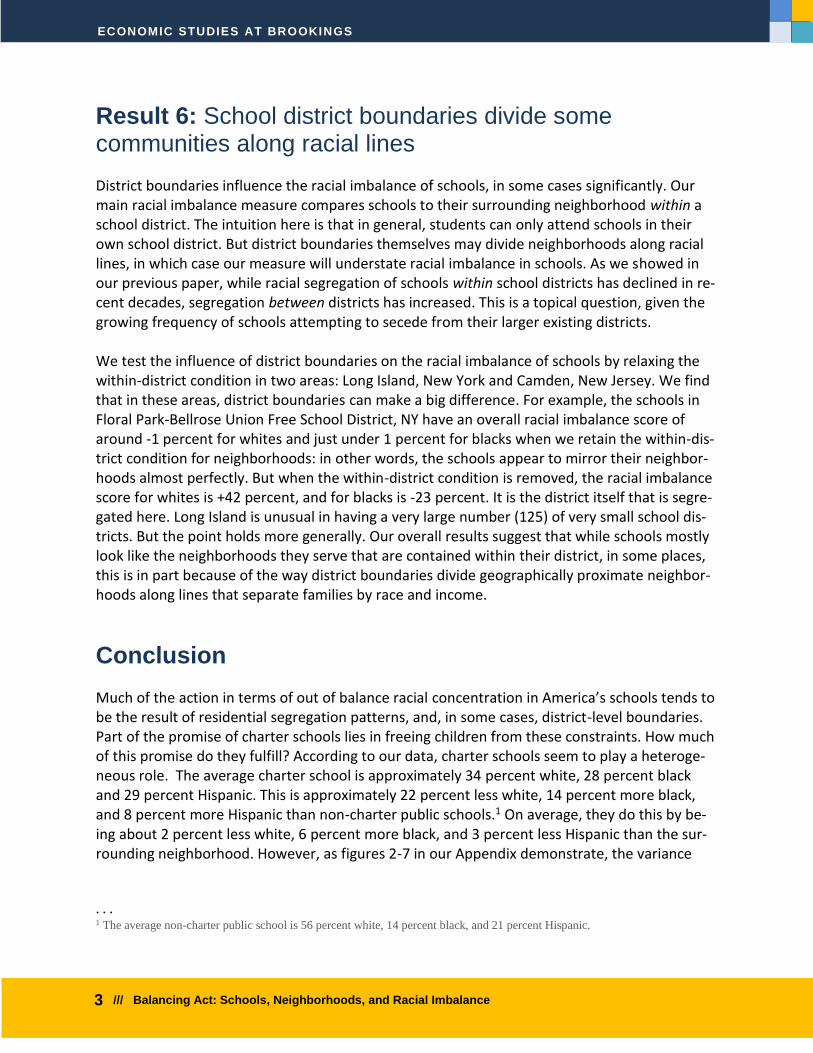
The radius approach is simple and easy to understand, but is insensitive to population density: a two-mile radius will have a much bigger population in a city than in a rural area. The fill method takes account of density. But in some cities, the school can be “filled” within a block or two, while the actual school population is drawn from a much wider area. We generated results for both methods. These are reported in the data supplement file of the Appendix. The overall findings are similar under either approach: the matrix of correlations between all approaches is in the Appendix. For the remainder of this analy-sis we use results generated using a 2-mile radius. The graphic below demonstrates how that matching process was performed for all statistics reported in this paper (with the exception of chapter 10 where we intentionally drop step 3 for a set of specific locali-ties):
Figure A:
iv. Comparing schools to neighborhoods
The last step is to compare the racial composition of each school with the racial compo-sition of the school’s surrounding neighborhood. Here we simply compare the represen-tation of each racial group in the school and the neighborhood to generate a “racial im-balance” score, i.e., the difference between the two in percentage point terms. If 60 per-cent of the students in a school are white, and 50 percent of the under 18 population living in the surrounding neighborhood is white, the white racial imbalance score is +10
ECONOMIC STUDIES AT BROOKINGS
13 /// Balancing Act: Schools, Neighborhoods, and Racial Imbalance
percent. If just 40 percent of the students in the school are white, the white racial imbal-ance score is -10 percent. We show scores for five racial groups: white, black, Hispanic, Asian and other (there is insufficient data to show scores for smaller racial groups).

ECONOMIC STUDIES AT BROOKINGS
14 /// Balancing Act: Schools, Neighborhoods, and Racial Imbalance
CHAPTER 4: Result 1 – Most schools look like their neighborhoods
Our main finding is that schools are similar, in terms of racial composition, to the neighbor-hoods in which they are located within school districts. The average U.S. public school (includ-ing charter and magnet schools) is 2.6 percent less white, 1.8 percent more black, and 0.9 per-cent more Hispanic than its surrounding neighborhood (using the two-mile radius). The median U.S. school mirrors the local neighborhood even more closely, as Figure 4 shows. (Note that throughout the paper, results for Asians and Other race categories are not shown in Figures, because of the small sample size, but are reported in our tables).
To a very large extent, then, school segregation is the near-automatic result of residential seg-regation. America’s schools look like America’s neighborhoods. But as the difference between the mean and median results suggests, there are exceptions to this rule; we turn to these outli-ers next.
-5
-4
-3
-2
-1
0
1
2
3
4
5
Mean Median
Perc
en
tag
e p
oin
t d
iffe
ren
ce b
etw
een
sch
oo
l an
d
neig
hb
orh
oo
d
Figure 4: School racial imbalances accross all US public schools, mean and median
White
Black
Hispanic
Source: Authors' analysis of National Center for Education Statistics (NCES) Common Core Data (CCD) for the School Year 2013-2014

ECONOMIC STUDIES AT BROOKINGS
15 /// Balancing Act: Schools, Neighborhoods, and Racial Imbalance
CHAPTER 5: Results 2 – Outliers in terms of racial imbalance – more black, less white
While most schools have low racial imbalances compared to their surrounding neighborhoods, there are some striking exceptions. We therefore defined and examined the schools who were outliers in terms of racial imbalance. Of all the schools in the U.S., 33.33 percent are defined as an outlier, with significant over- or underrepresentation of at least one race. The two most prevalent groups of outlier schools: those with lower white representation than in their neigh-borhoods, and/or with higher black representation.
i. Defining outlier schools
ii. More black, less white: results
iii. Caveats and warnings
i. Defining outlier schools
We define outliers using interquartile ranges (IQR) of the distribution of school racial im-balance scores for each racial category. The IQR is a standard statistical technique for defining outliers in a distribution. Importantly, we use the distribution within each state to generate the outliers. The reason for taking within-state imbalance distributions is twofold. The first is that many states remain under court-ordered desegregation orders that may intentionally alter the degree of resemblance between schools and neighbor-hoods in a non-voluntary manner. The second is that states’ racial compositions differ, leading to either wider or narrow ranges of imbalance scores. This means, importantly, that the threshold for outliers is different in each state (see Tables 2, 3, and 4). To illustrate the approach, take whites in Illinois. First, we calculate the white racial im-balance score for each school in the state, producing this distribution:

ECONOMIC STUDIES AT BROOKINGS
16 /// Balancing Act: Schools, Neighborhoods, and Racial Imbalance
Figure B.1
Second, we calculate the IQR for this distribution. This is simply the percentage point gap between the thresholds for the top and bottom quartiles (in other words, the 25th and 75th percentiles). In Illinois, for whites, the IQR is around 8%:
Figure B.2
Third, we multiply the IQR by 1.5: this is done so that, assuming a normal distribution, a reasonable level of exclusivity is met. In this case, 8 × 1.5 = 12.
Fourth, we add 12 (i.e. the IQR × 1.5) to the 75th percentile, and subtract it from the 25th percentile, to generate the high and low outliers. Any Illinois school with a white

ECONOMIC STUDIES AT BROOKINGS
17 /// Balancing Act: Schools, Neighborhoods, and Racial Imbalance
overrepresentation number above 13% is a high outlier. Any school with a white un-derrepresentation below -19% is a low outlier:
Figure B.3
ECONOMIC STUDIES AT BROOKINGS
18 /// Balancing Act: Schools, Neighborhoods, and Racial Imbalance
ii. More black, less white: results
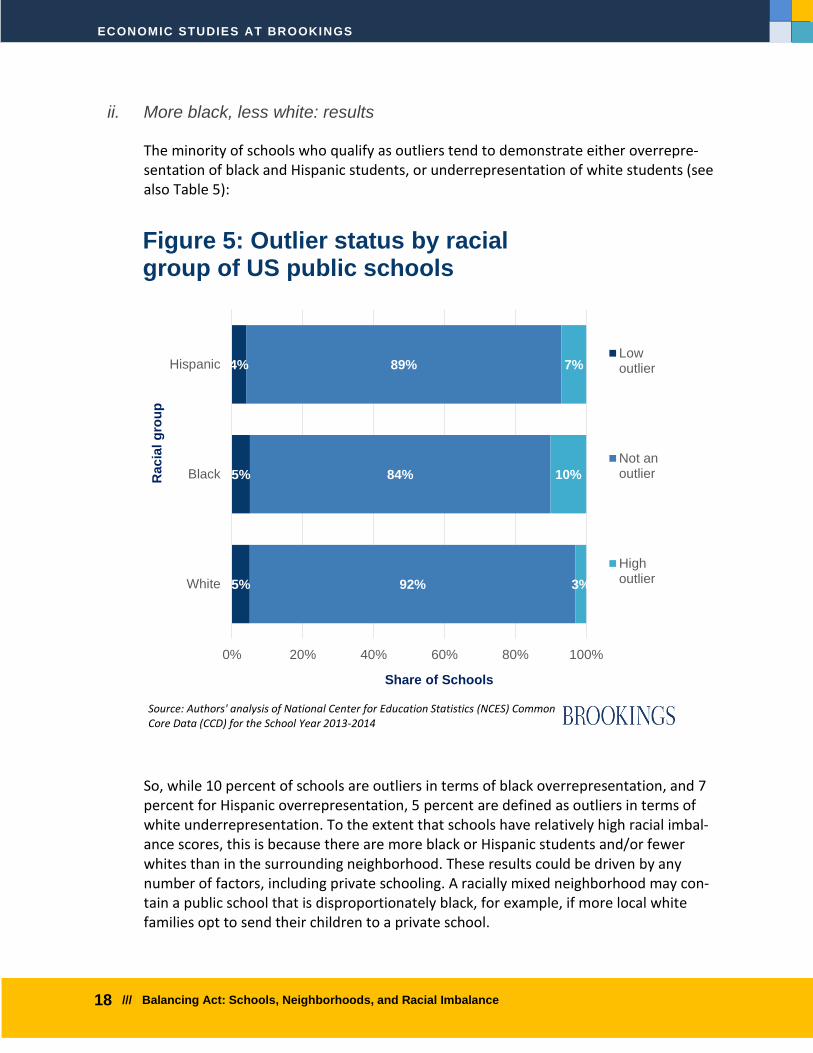
The minority of schools who qualify as outliers tend to demonstrate either overrepre-sentation of black and Hispanic students, or underrepresentation of white students (see also Table 5):
So, while 10 percent of schools are outliers in terms of black overrepresentation, and 7 percent for Hispanic overrepresentation, 5 percent are defined as outliers in terms of white underrepresentation. To the extent that schools have relatively high racial imbal-ance scores, this is because there are more black or Hispanic students and/or fewer whites than in the surrounding neighborhood. These results could be driven by any number of factors, including private schooling. A racially mixed neighborhood may con-tain a public school that is disproportionately black, for example, if more local white families opt to send their children to a private school.
5%
5%
4%
92%
84%
89%
3%
10%
7%
0% 20% 40% 60% 80% 100%
White
Black
Hispanic
Share of Schools
Racia
l g
rou
p
Figure 5: Outlier status by racial group of US public schools
Lowoutlier
Not anoutlier
Highoutlier
Source: Authors' analysis of National Center for Education Statistics (NCES) Common Core Data (CCD) for the School Year 2013-2014

ECONOMIC STUDIES AT BROOKINGS
19 /// Balancing Act: Schools, Neighborhoods, and Racial Imbalance
iii. Caveats and warnings
Some caveats and warning are required when considering our results for outlier schools:
First, as already noted, outliers are defined using state level distributions. For example, to count as a high outlier in terms of white representation in the South Carolina requires a gap of +30 percentage points; in Vermont, the threshold is +7. (For the outlier thresh-olds for each state by race, see Tables 2, 3, and 4).
Second, our outlier measures are insensitive to the absolute share of any racial group in a particular neighborhood. A school with a student population that is 30 percent black in a neighborhood that is 10 percent black will show up as having black overrepresentation of +20. A school that has a student population that is 80 percent black in a neighbor-hood that is 60 percent black will show up identically; but may be interpreted differently by some observers. Third, intentional strategies to integrate schools (for example, busing or court-ordered desegregation) may lead to over- or underrepresentation of particular racial groups compared to their surrounding neighborhoods. Fourth, greater school choice, through charter schools and open enrollment in tradi-tional public schools, could also make schools look less like their immediate neighbor-hoods, as students can travel outside their neighborhoods to attend their school of choice. Fifth, a school may be categorized as an outlier because it offers specific and specialized curriculum. This may attract students from much wider geographical area. For example, Spanish-language schools may have a high representation of Hispanic students by com-parison to the immediate surrounding area.

ECONOMIC STUDIES AT BROOKINGS
20 /// Balancing Act: Schools, Neighborhoods, and Racial Imbalance
CHAPTER 6: Result 3 – Charters show more racial imbalance
One of our research questions is whether charter schools differ from traditional public schools in terms of racial imbalance. We compare charters and traditional public schools in terms of overall racial imbalance and in terms of outlier status. In short, we find that charter schools, on average, have higher racial imbalance scores, especially in terms of black imbalance.
Racial imbalance by school type
Charter schools tend to have higher levels of black racial concentration than their surrounding neighborhoods, as Figure 6 and Table 1 show. The mean racial imbalance score in traditional public schools for black students is +1.6 percent; in charters the mean score is +5.7 percent. Hispanics by contrast are underrepresented in charter schools, compared to the surrounding neighborhood.
-4
-3
-2
-1
0
1
2
3
4
5
6
7
White Black Hispanic White Black Hispanic
Mean Median
Perc
en
tag
e p
oin
t d
iffe
ren
ce b
etw
een
sch
oo
l an
d
ne
igh
bo
rho
od
Racial imbalance: TPS vs Charter schools
TraditionalPublicSchool
CharterSchool
Source: Authors' analysis of National Center for Education Statistics (NCES) Common Core Data (CCD) for the School Year 2013-2014

ECONOMIC STUDIES AT BROOKINGS
21 /// Balancing Act: Schools, Neighborhoods, and Racial Imbalance
Outlier status for racial imbalance and school type
Given these overall trends, we would expect higher rates of outliers in terms of racial imbalance among charters. This is indeed what we find, especially for black imbalance. The proportion of charter schools that are high outliers in terms of black racial imbal-ance relative to neighborhood is three times that of traditional public schools (28 per-cent compared to 9 percent).
The proportions of high outliers among charter schools in terms of white and Hispanic imbalances are about 11 and 2 percentage points higher, respectively, than for tradi-tional public schools. The proportions of charter schools that are low outliers (i.e., with underrepresentation) in terms of white, black and Hispanic racial imbalances are about 6, 8, and 15 percentage points higher than in traditional public schools:
0
5
10
15
20
25
30
High Low
Perc
en
t cla
ssif
ied
as s
tate
ou
tlie
r
Type of outlier
Figure 7: Outlier rates, TPS vs. Charter schools
White TPS
WhiteCharter
Black TPS
BlackCharter
HispanicTPS
HispanicCharter
Source: Authors' analysis of National Center for Education Statistics (NCES) Common Core Data (CCD) for the School Year 2013-2014

ECONOMIC STUDIES AT BROOKINGS
22 /// Balancing Act: Schools, Neighborhoods, and Racial Imbalance
CHAPTER 8: Result 4 – Why do charters exhibit higher levels of imbalance? It’s complicated
While more questions than answers remain about the channels through which charters end up with higher levels and variances of racial imbalance than traditional public schools, we can say a few things, the most obvious of which is that charters are schools of choice whereas most tradi-tional public schools enroll students in the school to which their place of residence is closest. Thus, whereas a traditional public school that is not part of an open enrollment system will nec-essarily mirror the demographics of its neighborhood to a high degree, this need not be the case for a charter school that can recruit students from out of its neighborhood. That said, we do not know which particular characteristics or conditions causally exacerbate ra-cial imbalances among charter schools. The best we can do with the data at our disposal is ex-amine correlations between the conditions a specific charter school operates in and its racial imbalances (see Appendix for a full set of correlations). For example, we find no substantial cor-relation between the quality of statewide charter school laws and racial imbalances. At the same time, large metropolitan areas with a greater share of charter schools and equivalent-grade-level traditional public schools that are geographically close to each other, exhibit moder-ately larger imbalance scores in their charter sector than metro areas in which schools are more geographically dispersed (see Appendix for more detail). In short, there is much more to understand about the factors in play that lead charter schools to differ among themselves in their racial imbalance. And explanations for why charter schools have a large range of imbalance scores are likely to require granular and local information.

ECONOMIC STUDIES AT BROOKINGS
23 /// Balancing Act: Schools, Neighborhoods, and Racial Imbalance
CHAPTER 9: Result 5 – Racially imbalanced schools are concentrated in a handful of states
So far, we have presented results for all schools in the U.S. (though recall that we generate out-liers using state-level distributions). There are of course huge differences among states, not least in terms of overall population size, racial composition, and the balance between urban and rural populations. This translates into significant state-level variation in the racial imbalance of schools. Recall that the average U.S. public school is about 3 percent less white, 2 percent more black, and 1 percent more Hispanic than its surrounding neighborhood. But the picture is very differ-ent in certain states, as Figure 8 shows (the results for each state are listed in Table 6):
In the regions with higher minority concentration, the South (for black Americans) and the West and Florida (for Hispanic Americans) the chances of seeing larger racial imbalances in public
-8
-6
-4
-2
0
2
4
6
8
White Black Hispanic
Perc
en
tag
e p
oin
t d
iffe
ren
ce b
etw
een
sch
oo
l an
d
neig
hb
orh
oo
d
Racial category
Figure 8: Median racial imbalance scores by state
*Nationalaverage
MS
DC
IL
CA
NV
PA
FL
Source: Authors' analysis of National Center for Education Statistics (NCES) Common Core Data (CCD) for the School Year 2013-2014

ECONOMIC STUDIES AT BROOKINGS
24 /// Balancing Act: Schools, Neighborhoods, and Racial Imbalance
schools increases. Whether this is because more minority density translates into more oppor-tunity for minority populations to freely form more homogenous schools by choice or because it translates into increased propensity for white-flight from the school system, we cannot an-swer in this paper. A similar pattern can be seen in the distribution of schools that are outliers in terms of racial imbalance (noting again that our outliers are defined using state-level distributions, which in turn are influenced by state demographics). More than 15 percent of the schools in Arkansas, Indiana, and Ohio are outliers with respect to their neighborhoods in terms of black overrepre-sentation, relative to all public schools in each state. In New York, Ohio, Kentucky, and Iowa more than 8 percent of schools are classified as outliers with respect to their neighborhoods in terms of white underrepresentation, relative to all public schools in each state (see Table 7 for results on all states).

ECONOMIC STUDIES AT BROOKINGS
25 /// Balancing Act: Schools, Neighborhoods, and Racial Imbalance
CHAPTER 10: School district boundaries divide some communities along racial lines
For all the results presented thus far, the racial composition of schools has been compared to their surrounding neighborhood (i.e., census blocks with a centroid inside the two-mile radius) within a school district. The intuition here is that, in general, students can only attend schools in their own school district. But as we showed in our previous paper, trends in the racial segregation of schools within school districts and the degree of segregation between districts do not always go in the same direction. If district boundaries themselves divide neighborhoods along racial lines, our main measure may understate racial imbalance in schools. If a district boundary is near a school, and has the effect of excluding nearby students of a particular race, the school may look more ra-cially balanced than it would be in the absence of the district boundary. Obviously, this risk is greater in geographically smaller school districts because schools are more likely to be close to the geographical boundaries of these districts than they are in geographically large districts. This is a topical issue, given the growing movement towards secession of school districts, which some commentators fear will lead to greater racial segregation, but which is not visible using within-district measures. Since 2000, at least 71 communities across the country have at-tempted to create new, smaller school districts (47 of which have been successful), according to research by EdBuild.
Some studies suggest that that a proliferation of smaller school districts (say, with fewer than 1,000 students) leads to higher costs through lost economies of scale; perhaps as much as $1 billion a year nationally. But our focus here is on segregation rather than efficiency
We test the influence of district boundaries on the racial imbalance of schools by relaxing our within-district condition for creating the neighborhoods around schools in two areas with par-ticularly small or unusually-constructed districts: Long Island, New York and Camden, New Jer-sey. We find that in these places, and especially in certain districts, the boundaries can make a big difference to our measures of racial imbalance. (The results for each district in Long Island and Camden are in the Appendix in Tables A and B).

ECONOMIC STUDIES AT BROOKINGS
26 /// Balancing Act: Schools, Neighborhoods, and Racial Imbalance
Long Island, New York
Map 1: School district boundaries in Long Island
Source: NCES MapED Interactive
The school districts on Long Island are quite small (125 districts have been carved out of an is-land of just 1,400 square miles, with the typical district having only one high school). In some of these districts, the boundaries have a big impact on racial imbalance scores.
For example, the schools in Floral Park-Bellrose Union Free School District, NY have an overall racial imbalance score of around -1 percent for whites and just under 1 percent for blacks when we retain the within-district condition for neighborhood definition: in other words, the schools appear to mirror their neighborhoods almost perfectly. But when the within-district condition is removed, the racial imbalance score for whites is +42 percent, and for blacks is -23 percent. It is the district itself that is segregated.
Figure 9 shows the white racial imbalance score for the average school in the five districts where relaxing the within-district condition has the biggest effect:

ECONOMIC STUDIES AT BROOKINGS
27 /// Balancing Act: Schools, Neighborhoods, and Racial Imbalance
-50
-40
-30
-20
-10
0
10
20
30
40
50
FLORAL PARK-BELLEROSEUNION FREE
SCHOOL DISTRICT
GARDEN CITYUNION FREE
SCHOOL DISTRICT
WYANDANCHUNION FREE
SCHOOL DISTRICT
NORTH MERRICKUNION FREE
SCHOOL DISTRICT
ROCKVILLECENTRE UNIONFREE SCHOOL
DISTRICT
Perc
en
tag
e p
oin
t d
iffe
ren
ce b
etw
een
sch
oo
l an
d n
eig
hb
orh
oo
d
District
Figure 9: White imbalance, Long Island, by with and without district condition
Withdistrictcondition
Withoutdistrictcondition
Source: Authors' analysis of National Center for Education Statistics (NCES) Common Core Data (CCD) for the School Year 2013-2014
ECONOMIC STUDIES AT BROOKINGS
28 /// Balancing Act: Schools, Neighborhoods, and Racial Imbalance
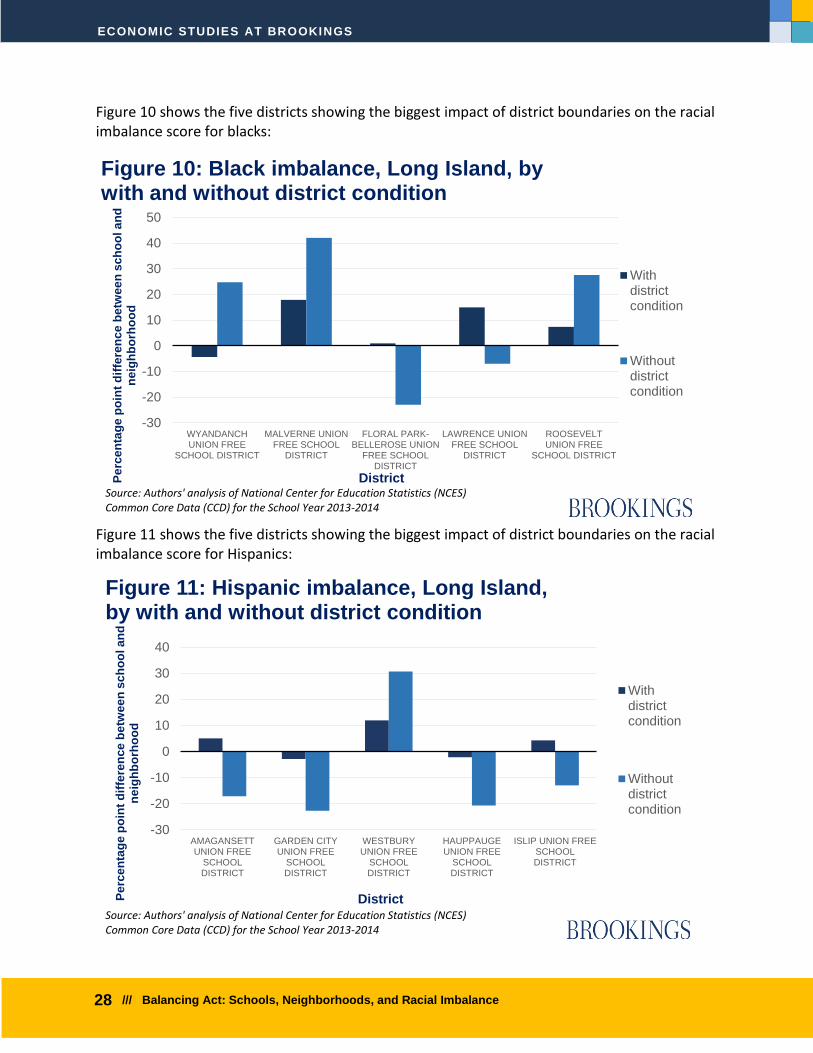
Figure 10 shows the five districts showing the biggest impact of district boundaries on the racial imbalance score for blacks:
Figure 11 shows the five districts showing the biggest impact of district boundaries on the racial imbalance score for Hispanics:
-30
-20
-10
0
10
20
30
40
50
WYANDANCHUNION FREE
SCHOOL DISTRICT
MALVERNE UNIONFREE SCHOOL
DISTRICT
FLORAL PARK-BELLEROSE UNION
FREE SCHOOLDISTRICT
LAWRENCE UNIONFREE SCHOOL
DISTRICT
ROOSEVELTUNION FREE
SCHOOL DISTRICT
Pe
rce
nta
ge
po
int
dif
fere
nc
e b
etw
ee
n s
ch
oo
l a
nd
n
eig
hb
orh
oo
d
District
Figure 10: Black imbalance, Long Island, by with and without district condition
Withdistrictcondition
Withoutdistrictcondition
Source: Authors' analysis of National Center for Education Statistics (NCES) Common Core Data (CCD) for the School Year 2013-2014
-30
-20
-10
0
10
20
30
40
AMAGANSETTUNION FREE
SCHOOLDISTRICT
GARDEN CITYUNION FREE
SCHOOLDISTRICT
WESTBURYUNION FREE
SCHOOLDISTRICT
HAUPPAUGEUNION FREE
SCHOOLDISTRICT
ISLIP UNION FREESCHOOLDISTRICT
Pe
rce
nta
ge
po
int
dif
fere
nc
e b
etw
ee
n s
ch
oo
l a
nd
n
eig
hb
orh
oo
d
District
Figure 11: Hispanic imbalance, Long Island, by with and without district condition
Withdistrictcondition
Withoutdistrictcondition
Source: Authors' analysis of National Center for Education Statistics (NCES) Common Core Data (CCD) for the School Year 2013-2014

ECONOMIC STUDIES AT BROOKINGS
29 /// Balancing Act: Schools, Neighborhoods, and Racial Imbalance
Camden, New Jersey
Map 2: School district boundaries in Camden and Burlington counties, NJ:
Source: NCES MapED Interactive
The Camden City School District, in Camden County, NJ, to the east of Philadelphia, serves a stu-dent population that is overwhelming poor and minority. The child poverty rate is 45 percent, 90 percent of students are eligible for free- or reduced- price lunches, and 48 percent are black

ECONOMIC STUDIES AT BROOKINGS
30 /// Balancing Act: Schools, Neighborhoods, and Racial Imbalance
and 50 percent are Hispanic (with just 0.5 percent white). Around Camden City there is an ar-chipelago of smaller school districts: in fact, there are about 32 within a five-mile radius, mostly with more affluent, whiter populations.
The racial imbalance scores for Camden City are much higher when the within-district condition is relaxed. The white score shifts from -1 percent to -9 percent, while the black score changes from 7 percent to 12 percent. However, Camden City is hardly the worst in the area in terms of its imbalance score.
Figures 12, 13, and 14 respectively show the white, black, and Hispanic scores for the average school in the set of districts that show the biggest consistent effects from loosening the within-district condition in the larger area of Camden and Burlington counties: Lawnside Borough, Gloucester City, Collingswood Borough, Oaklyn Borough, and Brooklawn Borough.
-80%
-60%
-40%
-20%
0%
20%
40%
LawnsideBorough
Gloucester City CollingswoodBorough
Oaklyn Borough BrooklawnBorough
Pe
rce
nta
ge
po
int
dif
fere
nc
e b
etw
ee
n s
ch
oo
l a
nd
n
eig
hb
orh
oo
d
District
Figure 12: White imbalance, Camden and Burlington Counties, NJ, by with and without district condition
With districtcondition
Withoutdistrictcondition
Source: Authors' analysis of National Center for Education Statistics (NCES) Common Core Data (CCD) for the School Year 2013-2014

ECONOMIC STUDIES AT BROOKINGS
31 /// Balancing Act: Schools, Neighborhoods, and Racial Imbalance
-30%
-20%
-10%
0%
10%
20%
30%
40%
50%
60%
70%
LawnsideBorough
Gloucester City CollingswoodBorough
Oaklyn Borough BrooklawnBoroughP
erc
en
tag
e p
oin
t d
iffe
ren
ce
be
twe
en
sc
ho
ol a
nd
n
eig
hb
orh
oo
d
District
Figure 13: Black imbalance, Camden and Burlington Counties, NJ, by with and without district condition
Withdistrictcondition
Withoutdistrictcondition
Source: Authors' analysis of National Center for Education Statistics (NCES) Common Core Data (CCD) for the School Year 2013-2014
-15%
-10%
-5%
0%
5%
10%
15%
20%
CollingswoodBorough
WoodlynneBorough
Oaklyn Borough Gloucester City BrooklawnBorough
Pe
rce
nta
ge
po
int
dif
fere
nc
e b
etw
ee
n s
ch
oo
l a
nd
n
eig
hb
orh
oo
d
District
Figure 14: Hispanic imbalance, Camden and Burlington Counties, NJ, by with and without district condition
Withdistrictcondition
Withoutdistrictcondition
Source: Authors' analysis of National Center for Education Statistics (NCES) Common Core Data (CCD) for the School Year 2013-2014

ECONOMIC STUDIES AT BROOKINGS
32 /// Balancing Act: Schools, Neighborhoods, and Racial Imbalance
Our overall results suggest that schools mostly look like the neighborhoods contained within their district. But it is clear that in certain areas, with very small or even “gerrymandered” school district boundaries, this is in part because segregation is taking place between school districts rather than within them. Here we have highlighted some of the more extreme cases in order to demonstrate the point. Long Island as an example of some of the most locally con-strained districts, and Camden as an example of a notable urban-suburban divide. It is im-portant to note that these are the exceptions rather than the rule. In most places, with geo-graphically larger school districts and boundaries that were formed long ago when population demographics were different, the district boundaries will not materially influence degrees of racial imbalance in individual schools.
ECONOMIC STUDIES AT BROOKINGS
33 /// Balancing Act: Schools, Neighborhoods, and Racial Imbalance
CHAPTER 10: Conclusion
One of the main messages of this report is that there is significant variation in the racial balance of schools in different places and for different school types. It is hard then to draw general con-clusions: we would urge readers of this papers, and users of the accompanying interactive, to look closely at particular places and individual schools. A number of key themes do however emerge:
1. Schools tend to look like their neighborhoods. This means that attempts to integrate schools are likely to require active efforts to buck trends of neighborhood and residen-tial racial segregation.
2. Patterns of school imbalance can be highly granular and are often a matter of local con-ditions, history, policy legacies, and underlying characteristics.
3. Charter schools tend to have a wider distribution of imbalance scores than traditional public schools; this may serve to reverse segregate trends in some cases and reinforce them in others.
4. Choices of school district boundaries can matter. The way in which school districts are drawn can substantially influence the racial imbalances between schools and surround-ing neighborhoods.
A charter school being more black than its surrounding neighborhood may be the result of in-tentional policy. The school’s organizers may have a priority of serving poor black families, and families that choose the school may prefer it because of that priority and because children with their own child’s racial and cultural background dominate the enrollment. People can have dif-ferent views about the desirability of this. If good education outcomes for the most disadvan-taged kids is the goal, integration may be a means to that end. But the success of many highly segregated urban charter schools suggests that it is not the only one. There are two simple stories that can be told about charter schools and racial segregation. One is that charters will deepen segregation, in part by allowing for blacks and whites to choose schools in which students of their race dominate enrollment. Another is that charters will lessen segregation by loosening the connection between neighborhood and school. Our research sug-gests that there is some truth to each of these stories, differing across place and time, but when taken alone, each is too simplistic. None of this is to say that successful efforts to desegregate schools should necessarily be aban-doned – it can be done, but it is uphill work. As two of the authors has argued in “Convenience plus a conscience: Lessons for school integration,” “school integration is not only a byproduct of residential segregation, but also a reflection of policy choices.” The variation in the racial composition of schools across different districts shows that it is possi-ble to increase integration. But it is important to be aware that this will be challenging given

ECONOMIC STUDIES AT BROOKINGS
34 /// Balancing Act: Schools, Neighborhoods, and Racial Imbalance
such high levels (still) of residential racial segregation, area based attendance policies, and a natural preference of many parents to send their children to a nearby school. Schools make the degree of residential segregation highly visible. School segregation is a symptom of residential segregation; which lies outside the scope of this paper. There are many normative goals that are relevant here: reducing gaps in school quality; reduc-ing racial and economic segregation of schools; reducing racial and economic segregation of neighborhoods; enhancing parental power and choice over their children’s education; allowing local communities a say in the provision of education; and so on. These goals may be comple-mentary; but just as often, they can be in tension. Our goal here has been to provide a solid em-pirical base upon which not only policymakers, but parents and other stakeholders, can base their work.

ECONOMIC STUDIES AT BROOKINGS
35 /// Balancing Act: Schools, Neighborhoods, and Racial Imbalance
Tables and Figures
Table 1. Mean and median imbalance measure by school type
Race Traditional Public School Charter School
Mean
White -2.78 -1.859
Black 1.556 5.721
Hispanic 1.23 -2.825
Median
White -1.501 -2.099
Black 0.2468 0.8449
Hispanic -0.0433 -2.118
Table 2. Different thresholds for low and high outlier classification by state, white imbal-
ance
State Low High
AK -17.97% 14.90%
L -28.61% 24.43%
AR -17.95% 19.54%
AZ -23.54% 19.25%
CA -19.50% 12.98%
CO -25.16% 20.25%
CT -18.07% 15.16%
DC -29.82% 16.82%
DE -42.75% 34.39%
FL -29.46% 20.97%
GA -28.38% 23.40%
HI -13.88% 16.00%

ECONOMIC STUDIES AT BROOKINGS
36 /// Balancing Act: Schools, Neighborhoods, and Racial Imbalance
IA -10.60% 9.21%
ID -13.19% 16.03%
IL -18.86% 13.29%
IN -17.74% 12.79%
KS -16.91% 14.20%
KY -13.40% 14.12%
LA -36.04% 25.78%
MA -20.37% 15.64%
MD -24.39% 15.45%
ME -6.91% 10.35%
MI -18.72% 16.39%
MN -20.41% 16.92%
MO -13.85% 13.59%
MS -30.82% 23.87%
MT -14.12% 14.79%
NC -29.98% 23.65%
ND -13.07% 12.87%
NE -16.29% 14.76%
NH -7.88% 9.70%
NJ -18.05% 14.96%
NM -22.64% 19.15%
NV -23.44% 17.15%
NY -26.14% 18.88%
OH -15.90% 12.58%
OK -24.08% 16.86%
OR -21.05% 18.33%
ECONOMIC STUDIES AT BROOKINGS
37 /// Balancing Act: Schools, Neighborhoods, and Racial Imbalance
PA -14.86% 12.38%
RI -18.50% 15.41%
SC -32.38% 27.99%
SD -12.42% 14.29%
TN -19.77% 17.59%
TX -19.56% 13.01%
UT -15.29% 17.28%
VA -27.91% 21.53%
VT -7.39% 10.55%
WA -21.01% 16.35%
WI -13.96% 12.60%
WV -5.57% 9.11%
WY -12.49% 14.44%

ECONOMIC STUDIES AT BROOKINGS
38 /// Balancing Act: Schools, Neighborhoods, and Racial Imbalance
Table 3. Different thresholds for low and high outlier classification by state, black imbal-
ance
State Low High
AK -1.49% 2.15%
AL -17.57% 24.37%
AR -4.73% 5.60%
AZ -3.91% 5.32%
CA -3.57% 4.10%
CO -2.23% 2.57%
CT -5.52% 7.95%
DC -27.25% 46.62%
DE -25.05% 35.65%
FL -17.44% 21.16%
GA -18.98% 23.15%
HI -1.80% 2.43%
IA -2.77% 3.59%
ID -1.18% 1.47%
IL -5.35% 6.86%
IN -3.75% 4.89%
KS -3.21% 4.07%
KY -4.91% 5.19%
LA -24.38% 35.30%
MA -4.52% 6.15%
MD -16.71% 21.48%
ME -2.29% 2.99%

ECONOMIC STUDIES AT BROOKINGS
39 /// Balancing Act: Schools, Neighborhoods, and Racial Imbalance
MI -6.93% 10.55%
MN -4.08% 5.68%
MO -5.61% 8.84%
MS -21.39% 31.92%
MT -0.83% 1.38%
NC -17.03% 19.17%
ND -2.47% 4.11%
NE -2.49% 3.46%
NH -1.82% 2.27%
NJ -6.89% 9.75%
NM -1.83% 2.16%
NV -5.17% 6.76%
NY -10.21% 14.98%
OH -5.65% 7.86%
OK -4.04% 5.19%
OR -1.81% 2.06%
PA -5.08% 7.55%
RI -3.95% 5.44%
SC -24.84% 29.19%
SD -1.23% 2.00%
TN -8.94% 12.53%
TX -6.72% 7.02%
UT -1.33% 1.49%
VA -11.85% 14.14%
VT -2.80% 2.78%
WA -2.41% 2.77%

ECONOMIC STUDIES AT BROOKINGS
40 /// Balancing Act: Schools, Neighborhoods, and Racial Imbalance
WI -3.10% 4.49%
WV -2.71% 3.22%
WY -1.21% 1.66%
Table 4. Different thresholds for low and high outlier classification by state, Hispanic im-
balance
State Low High
AK -8.53% 5.12%
AL -5.86% 4.38%
AR -7.45% 6.54%
AZ -21.21% 21.99%
CA -21.47% 26.60%
CO -19.60% 23.38%
CT -9.92% 11.44%
DC -15.59% 11.35%
DE -14.02% 13.34%
FL -16.20% 20.01%
GA -8.73% 8.99%
HI -18.41% 9.96%
IA -5.88% 5.97%
ID -12.66% 10.24%
IL -10.20% 10.68%
IN -7.20% 7.26%
KS -9.85% 10.15%
KY -5.31% 4.79%

ECONOMIC STUDIES AT BROOKINGS
41 /// Balancing Act: Schools, Neighborhoods, and Racial Imbalance
LA -4.99% 4.42%
MA -8.12% 10.25%
MD -7.83% 10.00%
ME -4.23% 3.03%
MI -6.28% 4.63%
MN -7.65% 6.61%
MO -5.41% 3.74%
MS -4.28% 2.70%
MT -8.18% 6.32%
NC -11.99% 14.23%
ND -6.14% 5.65%
NE -9.83% 10.51%
NH -4.77% 3.07%
NJ -12.46% 13.57%
NM -22.93% 22.81%
NV -18.53% 20.13%
NY -14.10% 15.77%
OH -4.89% 3.85%
OK -10.39% 9.35%
OR -14.98% 14.74%
PA -4.97% 3.78%
RI -9.52% 12.55%
SC -6.87% 6.48%
SD -5.84% 4.74%
TN -6.99% 6.38%
TX -15.75% 20.12%
ECONOMIC STUDIES AT BROOKINGS
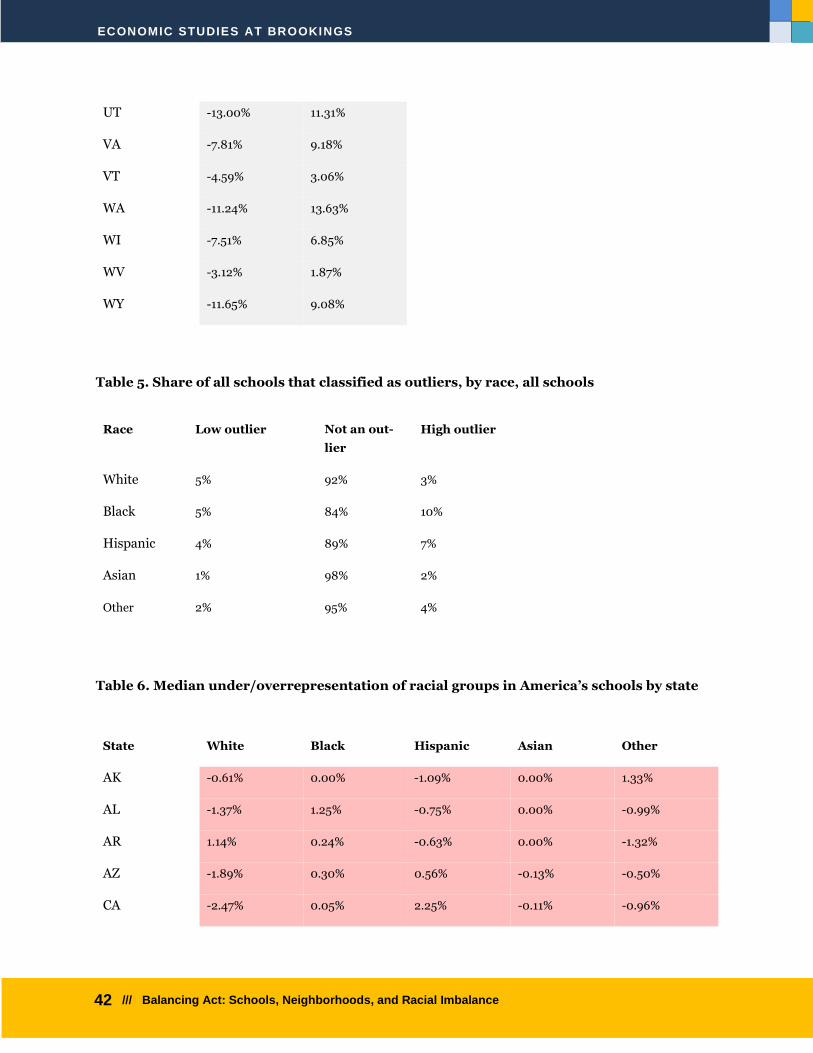
42 /// Balancing Act: Schools, Neighborhoods, and Racial Imbalance
UT -13.00% 11.31%
VA -7.81% 9.18%
VT -4.59% 3.06%
WA -11.24% 13.63%
WI -7.51% 6.85%
WV -3.12% 1.87%
WY -11.65% 9.08%
Table 5. Share of all schools that classified as outliers, by race, all schools
Race Low outlier Not an out-
lier
High outlier
White 5% 92% 3%
Black 5% 84% 10%
Hispanic 4% 89% 7%
Asian 1% 98% 2%
Other 2% 95% 4%
Table 6. Median under/overrepresentation of racial groups in America’s schools by state
State White Black Hispanic Asian Other
AK -0.61% 0.00% -1.09% 0.00% 1.33%
AL -1.37% 1.25% -0.75% 0.00% -0.99%
AR 1.14% 0.24% -0.63% 0.00% -1.32%
AZ -1.89% 0.30% 0.56% -0.13% -0.50%
CA -2.47% 0.05% 2.25% -0.11% -0.96%

ECONOMIC STUDIES AT BROOKINGS
43 /// Balancing Act: Schools, Neighborhoods, and Racial Imbalance
CO -2.04% 0.00% 1.24% 0.00% -0.28%
CT -1.11% 0.67% 0.16% 0.25% -1.33%
DC -6.62% 6.87% -2.02% -0.37% -2.17%
DE -2.58% 3.35% -0.43% 0.10% -2.46%
FL -4.25% 0.80% 0.77% -0.10% -0.42%
GA -2.33% 1.16% -0.25% -0.08% -0.23%
HI 0.60% 0.16% -3.92% 2.23% -1.53%
IA -0.53% 0.18% 0.03% 0.00% -0.11%
ID 1.54% 0.05% -1.43% 0.03% -0.78%
IL -1.61% 0.17% -0.39% 0.00% -0.03%
IN -1.42% 0.06% -0.14% 0.00% 0.60%
KS -0.97% 0.13% -0.02% 0.00% -0.16%
KY 0.85% 0.00% -0.33% 0.00% -0.91%
LA -4.11% 3.99% -0.44% 0.00% -1.04%
MA -1.78% 0.39% 0.37% 0.04% -1.16%
MD -3.50% 1.10% 0.50% 0.00% -0.84%
ME 1.61% 0.21% -0.71% 0.00% -1.61%
MI -0.29% 0.60% -0.91% 0.00% -1.27%
MN -0.54% 0.31% -0.59% 0.00% -0.89%
MO 0.51% 0.61% -0.79% 0.00% -1.38%
MS -2.81% 4.37% -0.69% 0.00% -0.81%
MT 0.54% 0.00% -1.15% 0.00% -0.24%
NC -2.88% 0.21% 0.69% 0.00% 0.02%
ND 0.16% 0.27% -0.06% 0.00% -0.79%
NE -0.08% 0.04% -0.03% 0.00% -0.33%
NH 1.13% 0.04% -0.86% 0.11% -0.85%

ECONOMIC STUDIES AT BROOKINGS
44 /// Balancing Act: Schools, Neighborhoods, and Racial Imbalance
NJ -1.44% 0.60% -0.15% 0.12% -1.97%
NM -1.65% 0.00% 0.58% 0.00% -0.78%
NV -3.59% 0.21% 0.47% -0.16% 0.75%
NY -2.10% 0.64% -0.32% 0.08% -1.69%
OH -0.60% 0.26% -0.57% 0.00% 0.00%
OK -3.27% 0.23% -0.79% 0.00% 1.49%
OR -0.72% 0.01% -0.53% 0.00% 0.05%
PA -0.55% 0.62% -0.65% 0.00% -0.92%
RI -0.62% 0.49% 0.76% -0.25% -1.75%
SC -2.22% 1.19% -0.32% 0.00% -0.35%
SD 0.67% 0.00% -0.38% 0.00% -1.12%
TN -0.10% 0.48% -0.36% 0.00% -1.69%
TX -2.40% -0.02% 1.90% 0.00% -0.23%
UT 1.13% 0.04% -1.09% 0.00% -0.77%
VA -1.91% 0.21% 0.22% 0.00% -0.49%
VT 2.04% 0.00% -0.57% 0.00% -1.14%
WA -1.94% 0.02% 1.00% 0.00% -0.54%
WI -0.23% 0.42% -0.42% 0.00% -0.69%
WV 1.63% 0.13% -0.57% 0.00% -1.29%
WY 1.15% 0.00% -1.44% 0.00% -0.43%

ECONOMIC STUDIES AT BROOKINGS
45 /// Balancing Act: Schools, Neighborhoods, and Racial Imbalance
Table 7: Outlier rates by state, percent of all schools
State White Black Hispanic Asian Other
Low High Low High Low High Low High Low High
AK 4.9 5.9 8.6 9.4 3 2.2 5.4 11.1 4.6 3.8
AL 4.5 1.3 2.7 6.1 6.7 8 0.1 7.4 1.8 5.2
AR 4.7 2.6 12.3 16.5 6.2 6.2 0.3 8.3 1.8 3.1
AZ 3.4 4.5 3.1 7.8 4.9 3.6 4.6 6.5 1.7 7.5
CA 5.9 5.4 6.8 10.8 3.8 4.4 7.4 8.4 2.7 5.8
CO 3.9 2.9 6.4 10 2.7 4.5 0.1 7.5 1.8 2.8
CT 5 4.9 7.8 9.5 7.7 9.8 1.6 5.7 0.3 1
DC 2.6 5.6 5.1 1.5 10.8 13.8 0 9.7 0.5 8.7
DE 0 2.2 1.1 3.8 8.6 8.6 0 7 0.5 0
FL 1.9 3.7 5.1 7.1 3 4.4 1 6.3 0.9 2.5
GA 3.5 3.5 5.6 4.3 4.5 8.1 3.2 8 0.6 1.8
HI 2.5 7.7 1.8 8.4 2.1 0 17.2 1.1 0.7 5.3
IA 8.1 3.1 4.2 8.2 4.2 7.3 0.7 7.4 1.2 1.5
ID 3.2 1.8 2.8 5.3 3.2 5.5 0 7.2 2.2 5.3
IL 6.2 1.7 7.7 13.7 7.1 11.4 3.3 10.5 0.9 3.7
IN 6.5 1.5 6.1 15.7 4.2 7.8 0.6 7.6 1.3 2.7
KS 4.5 1.8 3.7 10.1 3.4 6.7 0.9 9.5 2 3.3
KY 8.7 4.2 8 14.3 4 7.7 0.2 7.1 2.3 3
LA 2.8 2.5 2.9 3.5 2 7.8 0.2 8.3 1.8 3.1
MA 3.5 2.3 4.9 9.5 4.5 11 3.5 8.6 5.2 1.6
MD 3.5 3.4 4.2 4.5 2.3 9.8 2.3 8.7 0.3 1.7
ME 3 2.8 3 5.3 1.9 2.1 1.9 5.3 1.1 2.8
MI 7.2 1.6 2.8 14.3 4.8 6.8 1.3 7.4 1.6 2.5
MN 6.4 2.7 6 13.8 7.3 7.2 5.6 10.3 3.3 4.5
MO 7.3 1.4 2.9 12 5.1 5.5 1.4 8.3 0.9 1.9
MS 3.1 2.1 2.2 3 4.9 5.6 0 6.5 3.9 3.4
MT 4 1.1 6.8 11.4 1.1 1.3 0.2 9.5 1.4 5.3
NC 2.6 2.9 4.8 5.7 4 5.4 1.3 8.9 1.3 3.2
ND 6.1 3.4 0.2 7.9 4.3 4.5 0.9 15.5 3.6 4.7
NE 7.3 1.7 4.1 9.2 2.8 7.8 1.3 8.6 2.6 3.1
NH 3.9 2.8 3.4 4.1 4.7 3.9 0.6 4.3 1.1 1.7
NJ 5 2.1 6.2 10.8 4.1 7.8 5.4 9.7 1.9 2.9
NM 1.9 6.4 2.9 5.9 5.8 2.2 0.2 9 4.1 11.9
NV 1.7 6.2 4.2 8 6.9 2.6 0.9 5 1.2 2.1
NY 8.7 1.7 6 14 5.1 11.1 5.9 10.3 3.9 2.6
OH 8.2 1.8 4.4 16 5.6 5.6 0.4 7.8 1.9 2.7
OK 3 1.4 4.8 10.4 2.7 5.7 0.2 8.3 1 3.5
OR 4.1 2.7 4.1 6.9 4 6.5 0.9 8.3 1.2 4.8

ECONOMIC STUDIES AT BROOKINGS
46 /// Balancing Act: Schools, Neighborhoods, and Racial Imbalance
PA 7.7 2.6 4.3 13.4 6.6 9 0.1 10.2 1.7 4.3
RI 3.6 1.1 3.6 9.7 2.9 7.9 0.4 4.7 2.2 1.1
SC 1.8 2.2 2.7 3.2 3.6 6.7 0.1 4.5 1 1.7
SD 5.6 3.5 6.1 9.8 5.1 3.2 0 16.3 5.1 6.3
TN 6.4 2.9 5.1 12.1 4.3 8.5 0.5 7.4 0.8 1.5
TX 4.8 3.6 7.8 10.9 4.4 5 2.3 10.2 1.9 3.9
UT 5 2.5 2.2 6.5 3.7 6.4 0 7.6 2.1 3.8
VA 2 0.8 4.2 7.4 2.1 8.9 1.5 8 0.7 1.4
VT 4.1 1.4 1.7 4.1 2.7 2 0 8.4 2 2.7
WA 3 1.6 3.8 9.5 2.3 5.5 2.8 10.4 3.6 4.2
WI 6.8 3 4 13.1 5 7.2 3.7 8.8 1 3.9
WV 5.3 5 7.8 8.7 2.2 2.6 0.3 6.2 2.1 2.9
WY 2 3 2.7 8.1 2 3.4 0.3 4.4 1 3.4

ECONOMIC STUDIES AT BROOKINGS
47 /// Balancing Act: Schools, Neighborhoods, and Racial Imbalance
REFERENCES
Albright, Matthew. “Delaware schools-resegregating, report says.” (Delaware Online, 2014). http://www.delawareonline.com/story/news/education/2014/12/19/delaware-schools-re-segre-gating-report-says/20672823/.
Berger, Joseph. “Making Sense of School Consolidation.” (New York, NY: The New York Times, 2009). http://www.nytimes.com/2009/01/04/nyregion/long-island/04schoolli.html?mtrref=undefined
Booker, Kevin, Ron Zimmer, and Richard Buddin. “The Effects of Charter Schools on School Peer Compo-sition.” WR-306-EDU (Santa Monica, CA: RAND, 2005). http://www. rand.org/pubs/work-ing_papers/WR306.html
Boser, Ulrich. “Size Matters: A Look at School-District Consolidation.” (Washington, DC: The Center for American Progress, 2013). https://www.americanprogress.org/wp-content/up-loads/2013/08/SchoolDistrictSize.pdf
Clotfelter, Charles T. After Brown: The Rise and Retreat of School Desegregation (Princeton: Princeton University Press, 2004).
Cohodes, Sarah and Susan M. Dynarski. “Massachusetts charter cap holds back disadvantaged students.” (Washington, DC: The Brookings Institution, 2016). https://www.brookings.edu/research/mas-sachusetts-charter-cap-holds-back-disadvantaged-students/
Dobbie, Will and Roland G. Fryer, Jr., “Getting Beneath the Veil of Effective Schools: Evidence from New York City.” December 2012. http://scholar.harvard. edu/files/fryer/files/dobbie_fryer_revi-sion_final.pdf.
“Fractured: The Breakdown of America’s School Districts.” (EdBuild, 2017). https://edbuild.org/con-tent/fractured
Goldstein, Dana. “Integration and the ‘no excuses’ charter school movement.” The Washington Post, June 2, 2011, accessed October 10, 2016, https://www.washingtonpost.com/ blogs/wonkblog/post/in-tegration-and-the-no-excuses-charter-school-movement/2011/06/02/ AGmKLRHH_blog.html
Hannah-Jones, Nikole. “The Resegregation of Jefferson County,” (New York, NY: The New York Times, 2017). https://www.nytimes.com/2017/09/06/magazine/the-resegregation-of-jefferson-county.html?mtrref=www.google.com
Jacob, Brian A. “The evolution of the charter school market and the next generation of charter school re-search.” (Washington, DC: The Brookings Institution, 2017). https://www.brookings.edu/re-search/the-evolution-of-the-charter-school-market-and-the-next-generation-of-charter-school-research/
Kahlenberg, Richard D. “From All Walks of Life: A New Hope for School Integration.” American Educator (Winter 2012-13): 1-14.
Logan, John R. “Choosing Segregation: Racial Imbalance in American Public Schools, 1990-2000.” (Al-bany, NY: Lewis Mumford Center for Comparative Urban and Regional Research, 2002). https://s4.ad.brown.edu/Projects/USSchools/reports/report4.pdf
Logan, John, Deirdre Oakley, and Jacob Stowell. “School Segregation in Metropolitan Regions, 1970-2000: The Impacts of Policy Choices on Public Education.” American Journal of Sociology 113: 1611-1644.
ECONOMIC STUDIES AT BROOKINGS
48 /// Balancing Act: Schools, Neighborhoods, and Racial Imbalance
Nelson, Libby. “How school district boundaries are gerrymandered to keep poor kids segregated.” (Vox, 2015). https://www.vox.com/2015/7/24/9031729/school-districts-poverty
Ni, Yongmei. “Are Charter Schools More Racially Segregated than Traditional Public Schools?” Policy Re-port 30 (East Lansing, MI: The Education Policy Center at Michigan State University, March 2007). http://files.eric.ed.gov/fulltext/ED498628.pdf
Reardon, Sean F. and Ann Owens. “60 Years After Brown: Trends and Consequences of School Segrega-tion.” Annual Review of Sociology 40 (2014): 199-218.
Reardon, Sean F., Elena Grewal, Demetra Kalogrides, and Erica Greenberg. “Brown fades: The end of court-ordered school desegregation and the resegregation of American public schools.” Journal of Policy Analysis and Management 31 (2012): 876-904.
Reeves, Richard and Edward Rodrigue. “Convenience plus a conscience: Lessons for school integration.” (Washington, DC: The Brookings Institution, 2017). https://www.brookings.edu/research/con-venience-plus-a-conscience-lessons-for-school-integration/
Richards, Meredith Paige. “The Gerrymandering of School Attendance Zones and The Segregation of Pub-lic Schools: A Geospatial Analysis.” American Education Research Journal 51: 1119-1157. Available at http://journals.sagepub.com/doi/pdf/10.3102/0002831214553652
Russo, Alexander. “Diverse Charter Schools.” Education Next 13, no. 1 (Winter 2013): 28-34.
Ryan, Terry and Paul T. Hill. “In a changing rural America, what can charter schools offer?” (Washington, DC: The Brookings Institution, 2017). https://www.brookings.edu/blog/brown-center-chalk-board/2017/05/22/in-a-changing-rural-america-what-can-charter-schools-offer/.
Saporito, Salvatore and David Van Riper. “Do Irregularly Shaped School Attendance Zones Contribute to Racial Segregation or Integration?” Social currents 3 (2016): 64-83. Available at https://www.ncbi.nlm.nih.gov/pmc/articles/PMC5553557/
Siegel-Hawley, Genevieve, Kimberly Bridges, and Thomas J. Shields. “Solidifying Segregation or Promot-ing Diversity? School Closure and Rezoning in an Urban District.” Educational Administration Quarterly (2016): 1-35.
Stephen B. Billings, David J. Deming, and Jonah Rockoff, “School Segregation, Educational Attainment, and Crime: Evidence From the End of Busing in Charlotte Mecklenburg,” Quarterly Journal of Economics (2014): 435-476.
Stroub, Kori J. and Meredith P. Richards. “From Resegregation to Reintegration: Trends in the Ra-cial/Ethnic Segregation of Metropolitan Public Schools, 1993-2009.” American Educational Re-search Journal 50 (2013): 497-531.
Totenberg, Nina. “Supreme Court Quashes School Desegregation.” (Washington, DC: National Public Ra-dio, 2007). https://www.npr.org/templates/story/story.php?storyId=11598422
Valant, Jon. “Integrating charter schools and choice-based education systems.” (Washington, DC: The Brookings Institution, 2017). https://www.brookings.edu/blog/brown-center-chalk-board/2017/06/23/integrating-charter-schools-and-choice-based-education-systems/.
Walker, Michael and Subha Chakraborti. “An Asymmetrically Modified Boxplot for Exploratory Data Analysis.” Department of Information Systems, Statistics, and Management Science, The Uni-versity of Alabama (2013).
Cover photo source: https://www.flickr.com/photos/departmentofed/14143338033

ECONOMIC STUDIES AT BROOKINGS
49 /// Balancing Act: Schools, Neighborhoods, and Racial Imbalance
Whitehurst, Grover J. “Russ”, Richard Reeves, and Edward Rodrigue. “Segregation, race, and charter schools: What do we know?” (Washington, DC: The Brookings Institution, 2017). https://www.brookings.edu/research/segregation-race-and-charter-schools-what-do-we-know/.
The Center on Children and Families studies policies that affect the well-being of America’s children and their parents, especially children in less advantaged families. The Center addresses the issues of poverty, inequality, and lack of op-portunity in the United States and seeks to find more effective means of addressing these prob-lems.
Questions about the research? Email [email protected]. Be sure to include the title of this paper in your inquiry.
© 2017 The Brookings Institution | 1775 Massachusetts Ave., NW, Washington, DC 20036 | 202.797.6000