Embed Size (px)
Citation preview

The BPL Census and a Possible Alternative
Jean Drèze and Reetika Khera∗
1. Introduction
There has been much debate about alternative methodologies for the “BPL Census”, aimed at
identifying households for the purpose of social support (e.g. through the Public Distribution
System).1 These households are typically called “Below Poverty Line” households, hence the
acronym BPL. But there is no necessity for the selection to be based on a poverty line. In
fact, the current approach is not based on a poverty line, except possibly in the general sense
that one has to “draw the line” somewhere, in some space, to separate selected households
from other households. Due to the rather misleading reference to “poverty line” in the term
“BPL households”, the question of how to identify these households tends to get mixed up
with the distinct question of where and how to draw poverty lines. To delink the two issues,
we shall refer to these households as the “Social Assistance Base” (SAB), and avoid the BPL
acronym as far as possible.
This paper briefly explores the possibility of a simple method (we shall call it the “primary
method”) for the identification of SAB households, which relies exclusively on basic
exclusion and inclusion criteria. We begin by considering an “exclusion approach”, whereby
all households are entitled to social support (e.g. ration cards) except if they meet pre-
specified exclusion criteria. This can be described as a quasi-universal system, that is,
universal except for a slab of privileged households.
It is arguable whether a fully universal system would be better than a quasi-universal system
of this sort. On the one hand, there is no compelling reason to subsidise privileged
∗ Centre for Development Economics at the Delhi School of Economics. We are grateful to Sabina Alkire, Angus Deaton, Haris Gazdar, Aparna John, Sudha Narayanan, Abhijit Sen, Sanjeev Sharma and Madhura Swaminathan for helpful comments. Some of the proposals presented in this paper contributed to the deliberations that led to the preparation of the “N.C. Saxena Committee Report” (Government of India, 2009). 1 See Hirway (2003), Sundaram (2003), Jain (2004), Alkire and Seth (2008), Khera (2008), Swaminathan (2008), Anon (2009), Bose (2009), Government of India (2009), Mander and Mehrotra (2009), among others.

2
households, and others stand to gain from their exclusion, in so far as resources are limited.
On the other, universalism can help to create a broad, united stake in the integrity of social
services such as the Public Distribution System (PDS). It can also be argued that, in practice,
exclusion criteria are likely to be used against disadvantaged households. This note does not
make a case for the quasi-universal approach. Instead, we explore its feasibility and
implications. This is a useful step towards informed consideration of alternative approaches.
In the same spirit, we also explore an “inclusion approach”, whereby all households
belonging to pre-specified “priority groups” are entitled to social support. This principle can
be quite helpful in avoiding the pitfalls of targeting within priority groups, e.g. exclusion
errors and the divisive effects of targeting. Its power, however, depends on the extent to
which deprivation is associated with well-defined, observable household characteristics.
In the concluding sections of the paper, we consider four simple ways of combining
exclusion and inclusion criteria to construct a SAB list (analogous to the current “BPL list”).
A common feature of these different approaches is that every household can attribute its
inclusion in, or exclusion from, the list to a single criterion. This would involve statements
such as, “I am on the SAB list because I am landless”, or “I am not on the SAB list because I
own a car”. This feature can be of great help in facilitating participatory verification of the
BPL list, and in preventing fraud. In this respect, the “primary method” contrasts with the
current scoring methods, discussed in the next section.
Our examination of this primary method should be regarded as exploratory and illustrative.
The intention is to point to possible directions of further enquiry, including experimental
applications of this method, rather than to present definite recommendations. Whether any
convincing method of selecting SAB households actually exists is an open question.
Before we proceed, two clarifications are due. First, the issues discussed in this paper have
little to do with the current debate on poverty lines and poverty ratios. Indeed, as should be
clear from our opening remarks, there is no reason for the SAB list to “match” independent
poverty estimates. For instance, in the context of the Public Distribution System,
consideration must be given to the fact that the extent of nutritional deprivation in India is
much wider than the incidence of poverty, based on official poverty lines. How “broad” the
SAB list should be is certainly an important issue, but this issue cannot resolved by conflating

3
it with the equally important, but separate, issue of how and where poverty lines should be
drawn. Poverty estimation is one thing, and social support is another.
Second, the context of this enquiry is the government’s determination to proceed with the
next BPL Census, in anticipation of a possible expansion of the Public Distribution System.
We do not take it for granted that a BPL Census should be conducted at all. Indeed, as
discussed below, some of our findings can be read as reinforcing the case for universal as
opposed to targeted social support. However, in so far as the arguments for and against
universalization are linked with the issue of BPL Census methodology, the latter is still worth
investigating. Further, even in a universal system, there is a case for “differentiated
entitlements”, with underprivileged households getting more. That would require some
method of identifying underprivileged households, which is what this paper is about.
Following on this, we shall be particularly concerned with the danger of “exclusion errors”,
i.e. of leaving poor households out of the SAB list. This is because the PDS is supposed to
ensure food security for all, and because the right to food is a basic right of all citizens. This
concern with exclusion errors contrasts with the more common focus on “inclusion errors”
(including on the SAB list households that are not meant to be there) in the literature on
targeting, where the primary concern tends to be with the “cost-effectiveness” of public
expenditure. Of course, ultimately both exclusion and inclusion errors may be important, but
the main concern here is squarely with exclusion errors.
2. Scoring Methods and the BPL Imbroglio
The latest BPL Census, conducted in 2002, relied on a “scoring method” to identify BPL
households. This method involved 13 different criteria (reflecting asset ownership, education,
occupation, etc.), with a score of 0 to 4 assigned to each criterion, so that the aggregate score
ranges from 0 to 52. Based on this aggregate score, it is possible to “rank” all households in a
Gram Panchayat, Block, or District, and to select BPL households by applying a suitable cut-
off score. This method was devised as an improvement over earlier approaches, based on
income and related criteria (income being very difficult to assess in rural areas, these earlier
approaches were prone to errors and cheating). However, there were serious conceptual flaws
in the 2002 BPL criteria, and the whole method was, in any case, implemented in a haphazard
4
manner (partly because of its confused character). The result was a “hit or miss” BPL Census
that came under considerable criticism.2
The pitfalls of earlier BPL Censuses are illustrated in Table 1, where we present (in the first
column) the proportion of households with a BPL card in different quintiles of the Monthly
Per Capita Expenditure (MPCE) scale, based on National Sample Survey data for 2004-5.
Note that some of these BPL cards are based on the 2002 BPL Census, and others on the
1997 BPL Census. This is because, in many states, the distribution of BPL cards based on the
2002 census was still incomplete in 2004-5.3 With this qualification, Table 1 shows that
barely half of all households in the poorest MPCE quintile had a BPL card in 2004-5, while
18 per cent of households in the richest quintile had one. There is a similar mismatch between
BPL status and the National Family Health Survey’s “wealth index” for 2005-6 (second
column of Table 1).4 National Sample Survey data for 2004-5 also show high rates of
exclusion from the BPL list among disadvantaged social groups such as Scheduled Castes,
Scheduled Tribes, agricultural labourers, and landless households (Swaminathan, 2008).
The scoring method poses several problems. First, this method is prone to arbitrariness both
in terms of the indicators chosen and the scores assigned. To illustrate, it is not clear why, in
the 2002 BPL Census, a household that owned more than ten pieces of clothing was given the
same score as one where all the children go to school and do not work. Second, a BPL
Census based on the scoring method entails a formidable administrative challenge as well as
a major financial burden. With a whole list of indicators to be recorded for every household,
the scoring exercise is of comparable magnitude to the decennial Census of India! It is also
very expensive, bearing in mind not only direct costs such as those associated with training,
travel and other inputs but also the opportunity cost of the investigators’ time (often teachers
or other civil servants who are supposed to have other important duties).5
2 For a sample of field reports on the 2002 BL Census, see www.righttofoodindia.org. For critiques of the 2002 BPL Census method, see Sundaram (2003), Khera (2008) and Government of India (2009). 3 The distribution of new BPL cards was “stayed” by the Supreme Court in May 2003, and the stay was not vacated until 2006. 4 On this, see also Ram, Mohanty and Ram (2009). 5 For a sobering account of the administrative burden involved in recent BPL identification work in Bihar, see Kumar (2008).

5
Last but not least, the scoring method lacks transparency: most people, especially among
disadvantaged groups, are likely to find it difficult to understand. The aggregate scores, in
particular, are unlikely to mean much to them. This makes the entire process vulnerable to
manipulation. In particular, the scoring method does not lend itself to participatory
verification. Transparency and verifiability of household scores is essential to prevent abuses.
The recent N.C. Saxena Committee report proposes an improved method for the next BPL
Census, which involves the continuation of the scoring method in a simplified form.6 Instead
of 13 indicators with a scale of 0 to 4 for each, the report proposes just 5 indicators
(essentially focusing on community, land ownership, occupation, education, and old age or
illness), with an aggregate score ranging from 0 to 10. This is certainly a major improvement,
compared with the confused methodology of the 2002 BPL Census. But even this simplified
scoring method divides the community into 11 groups, each with a different score that does
not have a simple interpretation (all the more so as a particular score, say 7, can be obtained
in different ways from the component indicators). Aside from opening the door to cheating,
this makes the proposed method highly unsuitable for participatory implementation or
verification, which is supposed to be central to the Committee’s approach.
The resilience of the scoring method relates in part to the perceived need to impose pre-
specified “caps” on BPL coverage in a particular state or area. At the state level, for instance,
the number of BPL households is often expected to be consistent with independent poverty
estimates, calculated by the Planning Commission from National Sample Survey (NSS) data.
The Saxena Committee argues for higher poverty ratios (50 per cent at the national level), but
retains the insistence on caps – not only for each state but for each District, Block and Gram
Panchayat. Caps are relatively easy to meet in the scoring method: it is mainly a matter of
setting suitable cut-off scores. But imposing caps can be quite destructive, as discussed
below.
The “exclusion approach” explored in the next section does away with these caps. Instead,
the attempt is to construct an enlarged BPL (or, from now on, “SAB”) list by using exclusion
criteria only, i.e. by excluding households that own any of a pre-specified list of assets. 6 See Government of India (2009). The report was prepared by a 17-member expert group chaired by Dr. N.C. Saxena. Appended to it are individual comments from nine members, including several notes of dissent.

6
Different sets of exclusion criteria are examined, keeping the focus on simple, transparent
and verifiable criteria that can be easily understood by field investigators and village
communities. Unless stated otherwise, all figures are based on the third National Family
Health Survey (NFHS-3), conducted in 2005-6. Throughout this note, we focus specifically
on rural areas.
3. Exclusion Criteria
We begin with a simple list of durable assets: cars, refrigerators, landline telephones, scooters
and colour televisions. The composite asset “amenities” refers to having electricity, piped
water and a flush toilet (all three). Ownership of any of these assets (hereafter “baseline
assets”) constitutes the “baseline exclusion criteria”.
“Pucca house” is also considered as a possible exclusion criterion.7 However, there are two
issues here. First, some poor households live in pucca houses as beneficiaries of the Indira
Awas Yojana (IAY), a national programme of housing subsidies. In principle, one could
consider “pucca house other than IAY building” as an exclusion criterion, but this is not
possible with available data. Second, in some areas living in a pucca house is no indication of
economic prosperity, e.g. because stone houses are easy to build or because the weather
makes it hard to survive in a kaccha house. Perhaps a better exclusion criterion would be
“multi-storeyed pucca house”, but this is not a feasible criterion with NFHS data. As an
alternative, we consider “pucca house with more than one room for sleeping” (or “multi-room
pucca house” for short) as a possible exclusion criterion; this is a narrower exclusion criteria
than “pucca house”, but most probably broader than “multi-storeyed pucca house”.
Based on this, four sets of exclusion criteria have been formulated:
Set 1: Ownership of any of the baseline assets (“baseline exclusion criteria”).
Set 2: Ownership of any of the baseline assets, or of a pucca house.
Set 3: Ownership of any of the baseline assets, or of a multi-room pucca house.
7 Strictly speaking, what is being considered here is “living in a pucca house” rather than “owning a pucca house”. To keep things simple, the distinction is overlooked.

7
Set 4: Ownership of any of the baseline assets, or of at least 3 acres of irrigated-
equivalent land.8
Under Set 4, land ownership is calculated in terms of “irrigated-equivalent” land, with a 3:1
conversion ratio between irrigated and unirrigated land. For example, irrigated-equivalent
land ownership would be two acres for someone who owns two acres of irrigated land (and
no unirrigated land), or for someone who owns six acres of unirrigated land (and no irrigated
land), or for someone who owns one acre of irrigated land and three acres of unirrigated land.
We also experimented with conversion ratios other than 3, but since the results are not very
sensitive to the conversion ratio (within a reasonable range of 2 to 5), we restrict our
illustrative presentation to the 3:1 benchmark.
Table 2 reports the ownership of baseline assets among rural households in 2005-6, looking
first at different assets one by one (Table 2a), and then at different sets of exclusion criteria
(Table 2b). As expected, the proportion of households owning one of the baseline assets is
quite small for each specific asset (e.g. 6.6 per cent for fridge and 10.8 per cent for scooter).
However, the proportion of households owning “any” of these assets is quite substantial: 22.6
per cent for the baseline set. The proportion of households owning a pucca house is also
substantial (nearly 30 per cent), but as mentioned earlier, this is not a reliable exclusion
criterion.9
Table 3 presents the proportion of excluded households state-wise, for each set of exclusion
criteria. For instance, using the baseline exclusion criteria (Set 1), the proportion of excluded
households would vary from around 10 per cent in Bihar and Jharkhand to 67 per cent in
Kerala, with an all-India average of 22.6 per cent. The ranking of states, in terms of
proportion of excluded households, is fairly plausible and correlates quite well with standard
poverty estimates.
8 A cut-off of 5 acres was also explored, but this turned out to have little “bite”, in the sense that most of those with more than 5 acres of irrigated land would be excluded by the baseline criteria in any case. Even the 3 acres cut-off is rather blunt, as discussed below. 9 Interestingly, “ownership of a pucca house” was used as an exclusion criterion in the 1997 BPL Census (see Ram, Mohanty and Ram, 2009).

8
Comparing the first and last columns, we can see that adding a land criterion does not make
much difference, even with a relatively low cut-off of three acres of irrigated-equivalent land:
the entries in the two columns are quite similar, though there are significant differences in
specific states. An even lower cut-off would entail a serious risk of exclusion errors; the
conclusion seems to be that land ownership is not a particularly useful exclusion criterion.
Further examination of alternative land ownership criteria points in the same direction. From
now on, therefore, we ignore land ownership as an exclusion criterion.
What does make a difference is to add “pucca house” to the list of exclusion criteria, as we
can see from comparing the first two columns of Table 3. With this broader set of exclusion
criteria, the proportion of excluded households rises from 22.6 per cent to 36.7 per cent. This
is not very different from the benchmark ratio of 50 per cent for BPL households proposed in
the Saxena Committee. In other words, the “gap” between the exclusion approach and the
current scoring-based approaches is not necessarily large, depending on how the exclusion
criteria are defined. And if the gap (in terms of population coverage) is small, there may be a
good case for the exclusion approach, given the pitfalls of scoring methods.
While “pucca house” is probably too broad as an exclusion criterion, “multi-room pucca
house” has some plausibility (as would “multi-storeyed pucca house”, if the requisite data
were available). If this is added to the baseline criteria, the proportion of excluded household
is 28.7 per cent, more or less half-way between the proportions that emerge from the baseline
criteria with and without “pucca house” (Sets 1 and 2 respectively).
It is worth scrutinizing the proportion of excluded households in different socio-economic
groups, especially disadvantaged groups. This is the focus of Table 4. Looking first at the
poorest households, in terms of the NFHS “wealth index”, it is somewhat reassuring to find
that less than one per cent of these households would be excluded from the SAB list using the
baseline exclusion criteria. There is an element of circularity here, since the NFHS wealth
index is essentially an index of asset ownership, which includes our “baseline assets”.10
10 “The NFHS-3 wealth index is based on the following 33 assets and housing characteristics: household electrification; type of windows; drinking water source; type of toilet facility; type of flooring; material of exterior walls; type of roofing; cooking fuel; house ownership; number of household members per sleeping room; ownership of a bank or post-office account; and ownership of a mattress, a pressure cooker, a chair, a cot/bed, a table, an electric fan, a radio/transistor, a black and white television, a colour television, a sewing machine, a mobile telephone, any other telephone, a

9
Nevertheless, this finding is not entirely vacuous. It suggests that even crude asset ownership
criteria may work almost as well as a more comprehensive index, for this particular purpose.
Similarly, very few households categorised by the NFHS as having a “low standard of living”
would be excluded in the baseline scenario (first column in Table 4).11 However, 8 per cent
of them would be excluded if “pucca house” were to count as an exclusion criterion,
suggesting once again that this criterion is too broad.
Table 4 also shows that 13.8 per cent of Scheduled Caste (SC) households and 10.4 per cent
of Scheduled Tribe (ST) households would be excluded in the baseline scenario. It is difficult
to tell whether these should be regarded as “exclusion errors”, or whether most of these
households are indeed well-off in some sense. Answering that question would require an
independent standard of economic status, which is hard to define. Be that as it may, it can be
argued that excluding more than 10 per cent of SC/ST households would be “divisive”, even
if the excluded households are well-off in economic terms. A case could thus be made for
including all SC/ST households in the SAB list, even if they meet some of the exclusion
criteria. This is one argument for the “inclusion approach”, discussed below.12
Similar considerations apply to households headed by single women (in most cases, this
would mean a widow). As Table 4 indicates, 12.8 per cent of nuclear households headed by a
single woman would be excluded in the baseline scenario. Here the argument against
exclusion is not so much its divisive nature as the fact that, in rural India, households headed
by single women suffer many economic and social disadvantages that may not be captured in
computer, a refrigerator, a watch or clock, a bicycle, a motorcycle or scooter, an animal-drawn cart, a car, a water pump, a thresher, and a tractor.” (International Institute for Population Sciences, 2007, page 43). 11 The Standard of Living Index (SLI) is calculated by adding the scores of a household on the following criteria: house type (e.g. a score of 4 for pucca home, 2 for semi-pucca and 0 for kachha), toilet facility, source of lighting, main fuel for cooking, source of drinking water, separate room for cooking, ownership of house, of agricultural land, of irrigated land, of livestock, and of durable goods. The wealth index is computed using principal components analysis, whereas the SLI is a simple total of the component scores, ranging from 0 to 67 (International Institute for Population Sciences, 2000, pp. 40-41). In rural areas, 45 per cent of all households belong to the “low SLI” category, with a score below 15. 12 One commentator, however, pointed out that this argument is not conclusive, since the inclusion approach itself can be divisive, by reinforcing divisions between included groups (e.g. SC/ST households) and other groups.

10
asset-based indicators.13 Further, given the tremendous economic vulnerability of widow-
headed households in general, this is a case where it is particularly important to avoid
exclusion errors. This is another line of argument in favour of “inclusion criteria”.
4. Inclusion Criteria
We turn now to the possible use of “inclusion criteria” as a complement (or perhaps even a
substitute) for the exclusion approach. The idea is to identify possible priority groups that
would be entitled to social support (e.g. ration cards) as a matter of right, irrespective of other
criteria, such as exclusion criteria or “scores”. The notion of priority groups can be found in
some of the Supreme Court orders in the “right to food case” (PUCL vs Union of India and
Others, Civil Writ Petition 196 of 2001).14 For instance, one of these orders states that six
priority groups are entitled to Antyodaya cards as a matter of right.15 The idea of priority
groups is also used, to some extent, in the Saxena Committee report.16
Inclusion criteria (and the associated priority groups) could be used in several ways, with or
without the exclusion approach. First, they can be used to identify highly marginalized
groups that would have special entitlements (say, under the PDS). This is the idea of the
Supreme Court orders. As mentioned earlier, “universality” does not mean “uniformity”: the
PDS, for instance, could have universal or quasi-universal coverage, and yet give special
entitlements to disadvantaged households (e.g. under the Antyodaya programme).17
13 On the condition of widows in rural India, see e.g. Drèze (1990), Chen and Drèze (1995), Chen (1998), and the literature cited there. In studies of “the poorest of the poor” based on participatory identification methods, it is often found that a large proportion of the most deprived households are headed by widows and other single women; see e.g. Mukherjee (1992a, 1992b) and Sinha (1996). 14 These orders are available at www.righttofoodindia.org. For further discussion, see also Right to Food Campaign Secretariat (2008) and Saxena et al (various years). 15 These priority groups include “widows and other single women with no regular support”, “old persons with no regular support and no assured means of subsistence”, “households where... no adult member is available to engage in gainful employment outside the house”, and “primitive tribes”. This order (dated 2 May 2003) has been of great help in ensuring universal coverage of (so-called) Primitive Tribal Groups under the Antyodaya scheme. However, it has been largely ignored as far as some of the other priority groups are concerned, e.g. single women without support. 16 In this report, a relatively narrow collection of “priority groups” are listed for automatic inclusion in the BPL list. The main focus is on ultra-marginalised households such as “Primitive Tribal Groups”, homeless persons, bonded labourers and “destitute households dependent upon alms”. 17 On the Antyodaya programme, see e.g. Drèze (2002) and Jain and Shah (2005).

11
Second, inclusion criteria could be used to override exclusion criteria in the “exclusion
approach”. For instance, Scheduled Caste (SC) households could be automatically included
in the SAB list, irrespective of exclusion criteria. One possible motivation for this is to reduce
the risk of exclusion errors. Another is to avoid the divisive effects of the exclusion approach,
within particular communities.
Third, inclusion criteria could form the core of an alternative approach to the construction of
a SAB list. In this approach (let us call it the “inclusion approach”), the exercise begins by
selecting all households that meet any of the inclusion criteria. This is only the first step, and
there are various ways of thinking of the second step, which is the completion of the list. The
point of the first step is to protect the priority groups from exclusion errors. This is how
inclusion criteria are used in the Saxena Committee report – but in a relatively limited
manner, where priority groups are narrowly defined.
Note that the power of the inclusion approach depends on the extent to which poverty is
associated with specific vulnerabilities (e.g. landlessness), occupations (e.g. agricultural
labour), or other identifiable household characteristics. For instance, if it were the case that
poverty is primarily associated with landlessness, or that most landless households are poor,
then treating all landless households as a priority group would be a natural step in the
construction of a SAB list. In practice, however, these associations are far from tight.
Nevertheless, the approach is worth exploring.
As before, we try to keep the focus on simple, transparent and verifiable criteria. We begin by
considering five inclusion criteria that were used in an early draft of the proposed Right to
Food Act. With minor modifications, the corresponding priority groups are as follows:18
1. Households belonging to a Scheduled Caste or Scheduled Tribe.
2. Households with no agricultural land (or “landless households” for short).
3. Households with no adult member educated beyond Class 5.
18 The main modification concerns the fourth criterion. The initial formulation was “households where no adult member is available to engage in gainful employment outside the house”. This formulation takes note of the fact that households may be unable to take up gainful employment for a range of reasons, including for instance old age, illness, disability, and the demands of care-giving in the household. Due to data limitations, this has been replaced here with “households headed by single women”. This is a somewhat different category, though it overlaps with the original category.

12
4. Households headed by single women.
5. Households with at least one adult member working as an agricultural labourer
(“agricultural labour households” for short).19
Note that the first four criteria can be seen as “socio-economic disadvantages” that are likely
to be associated with poverty (though there may be exceptions, e.g. not all landless
households are poor). The fifth criterion is somewhat different. It is based on the idea that
agricultural labour tends to act as a “fallback” occupation in rural India – something that
people do when other employment opportunities are not available. The fact that there is a
close association between poverty and agricultural labour is relatively well documented.
Table 5 presents the proportion of rural households that meet these inclusion criteria. For any
pre-specified criterion, this proportion tends to be quite large (more than 30 per cent for four
of the five criteria being considered). More importantly, as many as 79 per cent of rural
households meet at least one of these inclusion criteria. In other words, a large majority of
rural households experience at least one of the basic socio-economic disadvantages examined
here. This can be seen as an argument for a universal or quasi-universal system of social
support in rural areas, especially in view of the exclusion errors that are inevitably involved
in any targeted system.
It is also striking that nearly half of all rural households meet at least two of the inclusion
criteria listed in Table 5. In a system of universal or quasi-universal social support with
special entitlements for the poorest households (similar to the current “Antyodaya”
programme under the PDS) these “doubly disadvantaged” households could be treated as a
priority group for the special list.20 Quite likely, this would go a long way in identifying the
poorest households. Further, it would help to ensure that the identification of the poorest
households is well integrated with the construction of the SAB list (if the latter is also based
19 Strictly speaking, the “adult members” considered here consist specifically of the woman respondent and her partner if any. All respondent women belong to the age group of 15-49 years. Note that the relevant occupation variables are missing or partly missing for about 20 per cent of sample households – all figures involving occupation data omit these households. 20 If one were to accept the Saxena Committee’s 50 per cent benchmark for BPL coverage, double disadvantage could also be explored as one possible, simpler alternative to the scoring method. However, this “double disadvantage” criterion is quite restrictive, and the fact that it roughly matches the 50 per cent benchmark highlights the conservative nature of that benchmark.

13
on inclusion and exclusion criteria), in contrast with the situation that prevails today, where
there is one set of principles for the BPL list, and another for the Antyodaya list. Possible
combined uses of exclusion and inclusion criteria are discussed in the next section.
5. Combining Exclusion and Inclusion Criteria
There are four elementary ways of combining exclusion and exclusion criteria for the purpose
of constructing a single SAB list. The reasoning is as follows.
Once exclusion and inclusion criteria have been defined, households can be partitioned into
four groups, depending on whether they meet exclusion criteria, inclusion criteria, both, or
none. A SAB list can be constructed by deciding, for each group, whether it should be
“selected” or “rejected”. It makes sense to select households that meet inclusion criteria but
not exclusion criteria, and to reject those that meet exclusion criteria but not inclusion
criteria. What about households that meet both or none? Depending on whether one selects or
rejects each of these two groups, four distinct approaches emerge:21
Exclusion approach: Reject a household if and only if it meets any of the exclusion criteria.
Inclusion approach: Select a household if and only if it meets any of the inclusion criteria.
Play-safe approach: Reject a household only if it meets exclusion criteria but not inclusion
criteria.
Restrictive approach: Select a household only if it meets inclusion criteria but not exclusion
criteria.
Note that the exclusion approach uses exclusion criteria only (inclusion criteria are not
required), and similarly, the inclusion approach uses inclusion criteria only. But both criteria
21 Note that in the method proposed in the Saxena Committee report, scoring is used to select households within the fourth group (households that do not meet either exclusion or inclusion criteria). The report does not discuss the possibility of any “overlap” between exclusion and inclusion criteria, so the third group is effectively ignored.
14
are used in the “play-safe” and “restrictive” approaches.22 In the play-safe approach,
inclusion criteria “override” exclusion criteria. In the restrictive approach, it is the reverse.
Note also that all these approaches would be the same if inclusion and exclusion criteria were
exact “mirror images” of each other (as when a single poverty line is used to include or
exclude households). It is the imperfect complementarity between inclusion and exclusion
criteria that leaves scope for distinct approaches.
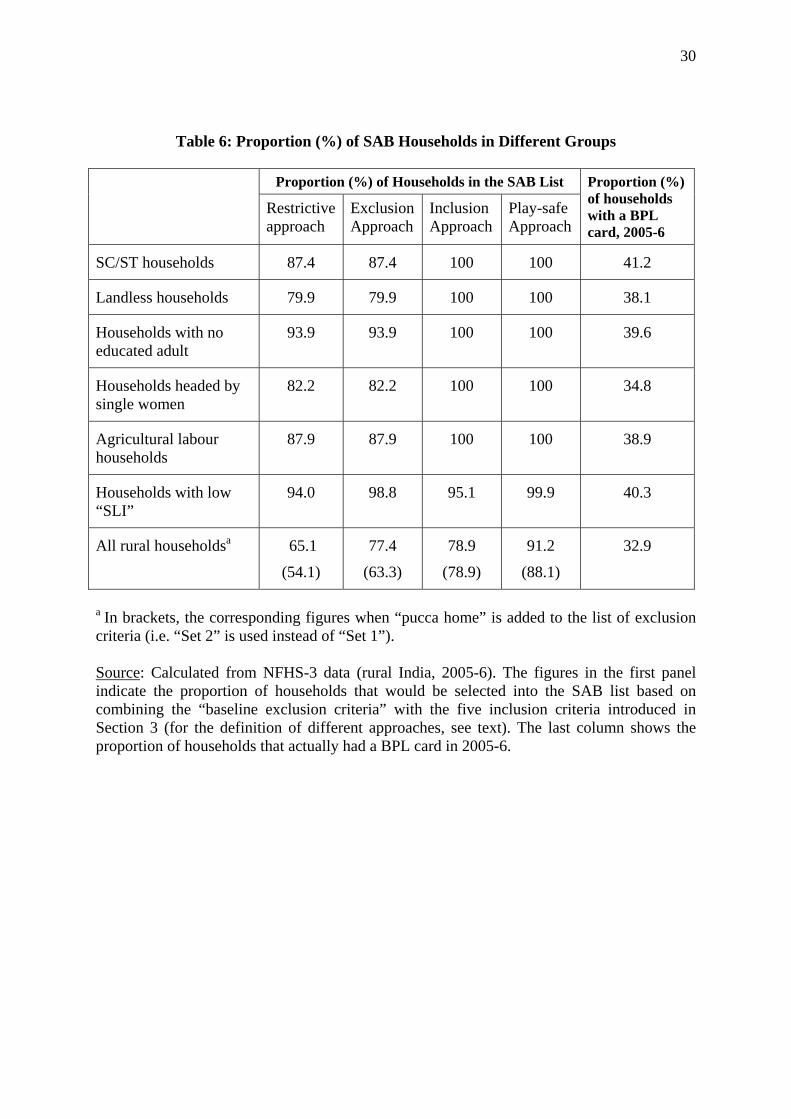
The implications of these alternative approaches are illustrated in Table 6. In this table (first
panel), we combine the “baseline exclusion criteria” with the inclusion criteria discussed in
the preceding section. Starting with the first column, we find that under the “restrictive
approach” (and with these specific criteria) 65 per cent of all rural households would be
included in the SAB list. Even under this restrictive approach, the SAB list would include 94
per cent of households with a “low standard of living” (based on the NFHS index). It is
doubtful that a scoring method of the sort proposed by the Saxena Committee would ensure
such a broad coverage of low-SLI households (even after raising the overall coverage
benchmark from 50 per cent to 65 per cent), bearing in mind not only the conceptual
problems associated with the scoring method but also – more importantly – the
implementation problems. However, missing even 6 per cent of low-SLI households can be a
serious issue, e.g. in the context of ensuring food security for all through the PDS.
Turning to the fourth column of Table 6, the “play-safe approach” has the obvious advantage
of reducing the risk of any exclusion error, in so far as exclusion criteria are overridden by
inclusion criteria. The other side of the coin is that almost everyone (more than 90 per cent of
all rural households) is on the SAB list. It is hard to see the case for this approach as opposed
to a universal approach, which dispenses with any targeting whatsoever at relatively little
extra cost (compared with the play-safe approach). Of course, the play-safe approach can be
made more restrictive by adding exclusion criteria (such as “pucca house”), or removing
inclusion criteria, but only at the risk of higher exclusion errors.
22 When both criteria are used, there is an important interdependence between exclusion and inclusion criteria. For instance, while “pucca house” is not generally a reliable exclusion criterion, as discussed earlier, it may be more acceptable when it is overridden by inclusion criteria (so that, say, a Scheduled Caste household living in a pucca house is selected rather than rejected). To put it another way, while “pucca house” is a dubious criterion in the exclusion approach, it may be more acceptable in the “play-safe” approach.

15
Turning finally to the middle columns, note first that the inclusion approach is not necessarily
more “inclusive” than the exclusion approach. Much depends on the specifics of exclusion
and inclusion criteria. In this case, SAB coverage happens to be much the same in both
approaches when “pucca home” is left out of the list of exclusion criteria. A more significant
difference is the composition of the SAB list. In the inclusion approach, all the priority
groups are included, by construction, and from that point of view this approach is “safer”. If
it were the case that all poor households belong to well-defined priority groups, there would
obviously be a strong case for the inclusion approach. But the circumstances that lead to
poverty can be quite diverse, and a comprehensive list of priority groups may be hard to
devise. As long as the list is incomplete, poor households outside the priority groups would
stand to gain from a switch from the inclusion approach to the exclusion approach. This can
be seen, for instance, from the fact that among households in the “low SLI” category, about 5
per cent would be rejected in the inclusion approach, compared with only 1.2 per cent in the
exclusion approach. Again, these patterns are contingent on the specifics of inclusion and
exclusion criteria, but nevertheless, there is a conceptual dilemma in the choice between
inclusion and exclusion approaches.
One possible extension of these approaches would be to allow Gram Panchayats or Gram Sabhas to
add further households to the SAB list (within pre-specified limits), in the event where any poor
households are “missed” by the primary method. Indeed, an exclusively statistical approach to the
construction of a SAB list is unlikely to be adequate – participatory methods also have a role, and not
just as a “verification” device. A “Gram Panchayat allowance” would also reduce the need for
complex appeal procedures, such as those introduced in the wake of the 2002 BPL Census, which
turned out to be cumbersome and ineffective.
Table 7 looks at the relationship between SAB selection and standard indicators of economic
status from another angle. Here the focus is on the proportion of SAB households in different
quintiles of the NFHS “wealth index” scale, under different approaches. This can be
compared with the second column of Table 1. It is easy to see that all these alternative
approaches produce a fairly strong correlation between economic status and SAB selection;
by contrast, the current distribution of BPL cards does not correlate particularly well with
economic status. In the case of the first two approaches, where exclusion criteria are used,
there is an element of “circularity” in this examination, as mentioned earlier (in so far as our
baseline exclusion criteria consist of assets that also enter in the computation of the wealth

16
index). However this does not apply to the last two approaches. The low discriminatory
power of earlier BPL Censuses can also be seen, yet again, from the last column of Table 6:
the proportion of households with a BPL card is not much higher than the all-India average
(32.9 per cent) for any of the disadvantaged groups listed there.
It is difficult to go beyond these general remarks without a more detailed analysis, based on
richer data sets, and also, more importantly, on field testing.23 Meanwhile, the main insight of
this analysis is as follows: there may be a real possibility of dispensing with scoring methods
based on informed use of inclusion and exclusion criteria. The main significance of this
observation is that inclusion and exclusion criteria are a matter of common knowledge in
village societies. Scores, even simple ones, are not. This lack of transparency facilitates
cheating, and obstructs people’s participation in the whole process. It also reinforces the need
for problematic “caps”, as discussed in the next section.
To illustrate the contrast, the “primary method” would make it relatively easy to summarise
the relevant characteristics of all households, and the reasons for their inclusion or exclusion
from the list, on a single sheet of paper for public display (say, at the Gram Panchayat office).
“Pro-active disclosure” practices of this type have proved quite effective, in other contexts, in
fostering people’s right to information and public vigilance.24 Public display would be much
harder to arrange, and much less useful in any case, when a scoring method is followed.
Recent experience (in the context of attempted “appeal procedures” for the 2002 BPL
Census) is quite sobering in this regard.
To take another example, in a recent field visit to Surguja district, we found that every house
had a prominently painted “mark” indicating the status of the household on the BPL list. This
was a simple way of publicising everyone’s BPL status, so that the cheats can be exposed.
And it seemed like a useful transparency measure, except that people were not necessarily
23 A useful illustration of the seriousness of data gaps is the absence, in the National Family Health Survey, of any data on disability. This makes it impossible to examine how disabled persons and their households should be treated in different approaches, e.g. whether “households headed by a disabled persons” or even “households with a disabled member” would be sensible priority groups. According to NSS data, 8.4 per cent of households in rural India include a disabled person (National Sample Survey Organisation, 2003). 24 For instance, pro-active disclosure of essential information is an essential principle of the National Rural Employment Guarantee Act (NREGA). In some states, notably Rajasthan, it has been of great help in preventing corruption.

17
clear as to who was entitled to a BPL card in the first place, given the intricacies of the
scoring method used in the 2002 BPL Census. This transparency device is likely to be much
more effective when the BPL (or SAB) list is based on simple exclusion and inclusion
criteria.
6. The Question of “Caps”
At this point, we should return briefly to the thorny issue of “caps” on the BPL (or SAB) list.
In earlier methods, including the improved method proposed by the Saxena Committee, the
Central Government imposes caps on the number of BPL households in each state. These
caps are expected to be translated by the state governments into corresponding caps at the
District, Block or even Gram Panchayat level. For instance, the Saxena Committee report
suggests caps at the Gram Panchayat level, based on a rather convoluted method.25
There are two common, related arguments for imposing these caps. First, the Central
Government seems to be concerned to “contain” the overall coverage of the BPL list (the
Saxena Committee report itself argues for a 50 per cent target at the national level, for rural
areas). The national target, naturally, needs to be distributed between states, and from there it
tends to “percolate” to lower levels. For instance, poverty estimates are typically used –
rightly or wrongly - to translate the national target into state quotas, in such a manner that
state quotas are equal or proportional to poverty rates. State governments, in turn, find
themselves having to allocate their quota between districts, and so on lower down.
Second, caps are also seen as a protection against cheating. Indeed, when there are caps at the
Gram Panchayat level, eligible households have a strong incentive to keep an eye on the BPL 25 Briefly, this method is as follows. First, the state’s “quota” of BPL cards is distributed across districts based on a summary index that gives “equal weightage to three indicators: the ratio of SC/ST population in that district as a percentage of total SC/ST population in the state, the inverse of agricultural production per rural person, and agricultural wage rate of the district”. Second, the district quota is distributed among Blocks in a manner that is left to the state government or district authorities, although the committee suggests that it could be based on the following indicators: “double cropped or irrigated area” as a proportion of total cultivated area; length of metalled road as a proportion of the district total; female literacy; and proportion of non-agricultural workers to total workers. Finally, the Block quota is allocated among Gram Panchayats on the basis of population. This is rationalized as follows: “We are assuming here that within a Block there would be uniformity of infrastructure etc. and the number of poor per hundred population will not vary from panchayat to panchayat. However, the decision to do further sophisticated disaggregation could be left to the Collectors, or district panchayats, if they wish to”.
18
Census process and blow the whistle in the event of any mistakes or cheating, since
illegitimate inclusion of any household automatically leads to the exclusion of another
household. Note that for this process to work, the caps have to be applied at the Gram
Panchayat level, and not just at the District or Block levels. If the cap is, say, at the District
level, each Gram Panchayat would stand to gain from claiming that most of its members are
BPL households. It is at the Gram Panchayat level that a cap would lead to some “peer
monitoring” of the BPL Census.26
Needless to say, imposing caps at the Gram Panchayat level is quite problematic. Indeed, the
incidence of poverty varies a great deal between Gram Panchayats, even within relatively
small areas such as a Block, and there is no reliable way of distributing (say) the Block-level
quota between different Gram Panchayats according to poverty rates. Instead, proxy
indicators are typically used for this purpose, or even just population ratios, in the absence of
other useful data. As a result, there is absolutely no guarantee that Gram Panchayats with
high proportions of poor households will get a fair share of BPL cards, and “exclusion errors”
in these Gram Panchayats are likely to be large. The fierce competition for BPL cards in
these Gram Panchayats is also likely to generate conflict, resentment, and inequity.
In the scoring approach, the need to prevent cheating is fairly strong, because it is quite easy
for households to “misreport” the underlying indicators. This is all the more so when non-
transparent and non-verifiable indicators are used, as happened in the 2002 BPL Census.
Even the improved scoring method proposed by the Saxena Committee uses some
problematic indicators of this type, such as “any member of the household has TB, leprosy,
disability, mental illness or HIV/AIDS”.
In the alternative approach explored here, based on simple exclusion and inclusion criteria,
these issues take a somewhat different form. On the one hand, caps are, in some ways,
particularly problematic in this approach. This is because they may conflict with the rights of
26 The first argument for caps (consistency with a national target) does not require caps at the Gram Panchayat level: scores can be used to “rank” all households within, say, a Block or distrct, and then the cut-off score (below which households are included in the BPL list) can be set in such a way that the BPL coverage matches the pre-specified caps.

19
the “priority groups” for automatic inclusion.27 In principle, there are ways around that. For
instance, each Gram Panchayat could have a “baseline quota” for SAB households, and these
quotas could be adjusted upward whenever required to accommodate priority groups. Since
we have some idea, from secondary data, of the size of priority groups in different states and
districts, prior provision could be made for the required adjustments. But this adjustment
process would certainly be a major complication.28
On the other hand, in this alternative approach, there is a real possibility of doing away with
caps altogether. This is because, as discussed earlier, the primary method is likely to be less
vulnerable to cheating. Unlike scores, the proposed inclusion and exclusion criteria are
transparent and verifiable, and a matter of common knowledge within Gram Panchayats. This
makes it possible to invoke various transparency measures, such as those mentioned in the
preceding section, as well as participatory verification processes, say through the Gram
Sabhas. Also, cases of gross cheating in specific Gram Panchayats are likely to “show” in the
data, since there is a fair amount of secondary data (e.g. from the decennial Censuses) on
many of the proposed criteria. It is, thus, possible to envisage a situation where the coverage
of the SAB list is “self-generated”, based on the inclusion and exclusion criteria, rather than
determined by top-down caps. This hypothesis, at any rate, is worth testing on the ground.
This leaves the first argument for caps: the possible need to meet a national target. If the
primary method is adopted, however, it would be possible to meet a national target (if
required) without imposing caps at the state level or below. This is because the outcome of
the primary method, in terms of aggregate coverage of the SAB list, can be anticipated from
secondary data. A national target could therefore be met by suitable choice of inclusion and
exclusion criteria. But more importantly, the national target could be waived altogether, and
give room to a self-generated SAB list. This would be hard to do with a scoring method.
27 This problem is not addressed in the Saxena Committee report. Perhaps it is to avoid this tension that priority groups are defined quite narrowly in the report (if priority groups are a small minority, their inclusion is unlikely to conflict with the caps). 28 Another complication is that, unlike the scoring method, the primary method does not yield a full “ranking” of households. The scoring method makes it relatively easy (in principle!) to impose caps, in so far as it produces a full ranking of households (in terms of aggregate scores), so that, for instance, a cap of 25 per cent can be applied simply by picking the bottom 25 per cent of households in terms of that ranking. But the alternative approach explored here could be extended to produce a ranking of households. For instance, land ownership could be used as a ranking variable within the SAB list, after the SAB list has been constructed using one of the approaches discussed earlier.

20
Whether caps can be actually be dispensed with under the primary method, and if not,
whether the primary method can be reconciled with “caps”, are two questions that call for
further enquiry. If the answer to both questions is “no”, then it is not clear that there is any
“alternative to the BPL Census” – other than a universal system.
7. An Intermediate Approach: Binary Scoring
One possible argument against the primary method explored here is that it is too rigid, in so
far as it does not allow for any weighing and aggregation of different criteria, as in the
scoring method. For instance, a household that meets multiple inclusion criteria (say, a
landless Dalit household) is treated in much the same way as a household that meets any of
these inclusion criteria (say, a landless household or a Dalit household). It could be argued
that more flexible approaches are possible, with the same information.
One possibility here is “binary scoring”, with a score of 0 or 1 being assigned for each of
inclusion criterion, and the scores being aggregated, with or without weighing. For instance,
one simple scoring method, proposed to the Saxena Committee at one stage, was based on the
following binary scores:
1 if the household is SC or ST (and 0 otherwise);
1 if the household is landless (and 0 otherwise);
1 if the household has no adult member educated beyond Class 5 (and 0 otherwise);
1 if the household is headed by a single woman (and 0 otherwise);
1 if the household is engaged in agricultural labour (and 0 otherwise).
In the absence of weighing, the aggregate score would then take discrete values between 0
and 5. One proposal was that households with an aggregate score of at least 1 should get a
BPL card, and those with an aggregate score of at least 2 should get an Antyodaya card (the
implications have already been illustrated in Table 5). But other formulas could also be
considered.29
29 Binary scoring arranges all households in a few discrete “slabs” (in this case, those with an aggregate score taking values 0, 1, 2, 3, 4 or 5). However, as mentioned in the preceding footnote, it is
21
Interesting theoretical arguments for binary scoring are presented in Alkire and Foster (2009),
along with possible variants and extensions of this approach. It can be argued that binary
scoring imparts flexibility to the approaches explored earlier, without detracting in a major
way from their transparency and simplicity. Here again, however, detailed investigation and
testing would be required to ascertain the actual feasibility and usefulness of this approach.
8. Concluding Remarks
In this note, we have explored possible uses of simple exclusion and inclusion criteria for the
purpose of identifying households eligible for social support (a “social assistance base”, of
which the BPL list can be seen as a particular case). We began by considering the possibility
of a quasi-universal approach, whereby all households are eligible unless they meet pre-
specified exclusion criteria. Next, we examined inclusion criteria, and different ways of
combining them with exclusion criteria.
This exploration remains tentative, if only because of the data limitations. With richer data,
the boundaries of this enquiry could be usefully extended. For instance, it would be useful to
examine the possibility of more extensive use of occupation-based inclusion and exclusion
criteria. There is a good case for including, say, all rickshaw-pullers in the SAB list, and
perhaps also for excluding permanent government employees.30 The idea is not that a full-
fledged method of SAB identification could be worked out from secondary data, but that
careful analysis of secondary data would shed light on the credibility and potential of
different approaches. Detailed field tests would be required to take this further and develop a
specific identification method.31
Meanwhile, an important message emerges from this enquiry: it may well be possible to
dispense with scoring methods, and to replace them with simple combinations of exclusion possible to convert this discrete grouping into a continuous ranking by using a “ranking variable” (e.g. land ownership) to sort households within each slab. 30 Some use is made of occupation categories in the methodology proposed by the Saxena Committee (Government of India, 2009). 31 In this respect, the Saxena Committee report is rather weak. The proposed method does not draw on any data analysis or field testing, and even its conceptual foundations are far from clear. It is largely based on informed guesses about appropriate scoring formulas.

22
and inclusion criteria. This applies particularly in the quasi-universal approach, which relies
entirely on exclusion criteria. But even if this approach is rejected in favour of a targeted
approach, simple combinations of exclusion and inclusion criteria are likely to be preferable,
in many respects, to scoring methods. While this is not a definitive conclusion, there is a case
for further exploration of this alternative to the scoring method.
Finally, we reiterate that nothing in this paper should be construed as a justification for a
targeted (or even quasi-universal) approach as opposed to a universal approach. On the
contrary, some of our findings can be sensibly read as a reinforcement of the case for a
universal approach.32 Indeed, the search for a “safe” way of excluding privileged households,
without significant risk of exclusion for poor households, remains somewhat elusive.33 This
is an important argument for the universal approach, expensive as it may be – especially in
the context of the proposed Right to Food Act, which derives from a universal and
fundamental right to life.
32 On the general arguments for universalization, see Khera (2009). 33 As one commentator puts it: “It is a little bit like requiring people to identify themselves for execution which, if there were no other way, would be a good argument for not executing people!” (Angus Deaton, personal communication).

23
References Alkire, S., and Foster, J. (2009), “Counting and Multidimensional Poverty Measurement”,
mimeo, Queen Elizabeth House, University of Oxford. Alkire, S., and Seth, S. (2008), “Determining BPL Status: Some Methodological
Improvements”, Indian Journal of Human Development, 2(3):407-424. Anon (2009), “Identifying the Poor”, Economic and Political Weekly, 18 July. Bose, Ashish (2009), “Census and the Aam Aadmi”, Economic and Political Weekly, 16
May. Chen, Marty (ed.) (1998), Widows in India: Social Neglect and Public Action (New Delhi:
Sage). Chen, M., and Drèze, J. (1995), “'Recent Research on Widows in India”, Economic and
Policital Weekly, September. Drèze, Jean (1990), “Widows in Rural India”, Discussion Paper No.26, Development
Economics Research Programme, London School of Economics. Drèze, Jean (2002), “Ending Destitution”, The Hindu, 29 July. Government of India (2005), Performance Evaluation of Targeted Public Distribution
System, Report No. 189, Programme Evaluation Organisation, Planning Commission, New Delhi.
Government of India (2009), Report of the Expert Group to Advise the Ministry of Rural
Development on the Methodology for Conducting the Below Poverty Line (BPL) Census for 11th Five Year Plan (New Delhi: Ministry of Rural Development); available at http://www.rural.nic.in.
Hirway, Indira (2003), “Identification of BPL Households for Poverty Alleviation
Programmes”, Economic and Political Weekly, 14 November. International Institute for Population Sciences (2000), National Family Health Survey 1998-9
(NFHS-2): India (Mumbai: IIPS). International Institute for Population Sciences (2007), National Family Health Survey 2005-
06 (NFHS-3): India (Mumbai: IIPS). Jain, J., and Shah, M. (2005), “Antyodaya Ann Yojana and Mid-Day Meals in MP”,
Economic and Political Weekly, 2 December. Jain, Sachin (2004), “Identification of the Poor”, Economic & Political Weekly, 20
November. Khera, Reetika (2008), “Access to the Targeted Public Distribution System: A Case Study in
Rajasthan”, Economic and Political Weekly, 1 November.

24
Khera, Reetika (2009), “Right to Food Act: Beyond Cheap Promises”, Economic and
Political Weekly, 18 July. Kumar, Nitish (2007), Keynote Address delivered at a seminar on “Revisiting the Poverty Issue”,
convened by the Institute of Human Development and held at the A.N. Sinha Institute of Social Studies, Patna, 20-22 July.
Mander, Harsh and Mehrotra, Santosh (2009), “How to Identify the Poor? A Proposal”,
Economic and Political Weekly, 9-15 May. Mukherjee, Neela (1992a), "Rural Communities' Perceptions of Poverty and Well Being:
Some Case Studies in a Participatory Framework", paper presented at a workshop on "Meanings of Agriculture" held at the South-Asian Centre, School of Oriental and African Studies, London, 13-15 July.
Mukherjee, Neela (1992b), "Villagers' Perceptions of Rural Poverty through the Mapping
Technique of PRA", RRA Notes 15, International Institute for Environment and Development, London.
National Sample Survey Organisation (2003), “Disabled Persons in India, NSS 58th round,
July-December 2002”, Report No. 485, NSSO, New Delhi. Ram, F., Mohanty, S.K., and Ram, U. (2009), “Understanding the Distribution of BPL Cards:
All India and Selected States”, Economic and Political Weekly, 14 February. Right to Food Campaign Secretariat (2008), Supreme Court Orders on the Right to Food: A
Tool for Action (New Delhi: Secretariat of the Right to Food Campaign). Saxena, N.C., et al (various years), Reports of the Commissioners of the Supreme Court in
the “Right to Food” Case (PUCL vs Union of India and Others, Civil Writ Petition 195 of 2001); available at www.righttofoodindia.org.
Sinha, Ajay (1996), "A Profile of the Poorest among Poor: Missing Link in the Development
Strategy", mimeo, Village Study Unit, LBS National Academy of Administration, Mussoorie.
Sundaram, K. (2003), “On the Identification of Households Below Poverty Line in BPL
Census 2002”, Economic and Political Weekly, 1 March. Swaminathan, Madhura (2008), “Public Distribution System and Social Exclusion”, The
Hindu, 7 May.
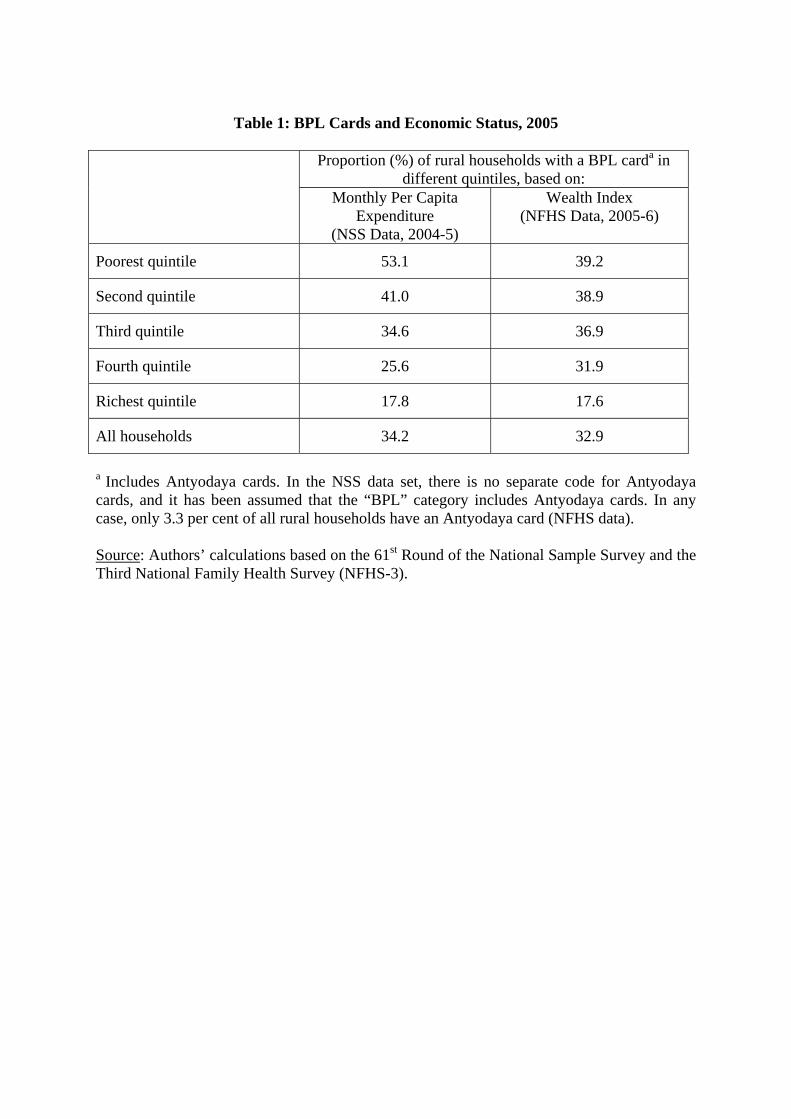
Table 1: BPL Cards and Economic Status, 2005
Proportion (%) of rural households with a BPL carda in
different quintiles, based on:
Monthly Per Capita Expenditure
(NSS Data, 2004-5)
Wealth Index (NFHS Data, 2005-6)
Poorest quintile 53.1 39.2
Second quintile 41.0 38.9
Third quintile 34.6 36.9
Fourth quintile 25.6 31.9
Richest quintile 17.8 17.6
All households 34.2 32.9
a Includes Antyodaya cards. In the NSS data set, there is no separate code for Antyodaya cards, and it has been assumed that the “BPL” category includes Antyodaya cards. In any case, only 3.3 per cent of all rural households have an Antyodaya card (NFHS data). Source: Authors’ calculations based on the 61st Round of the National Sample Survey and the Third National Family Health Survey (NFHS-3).

26
Table 2a: Asset Ownership among Rural households
Proportion (%) of rural
households owning Baseline assets
Car
1.0 Amenities a 5.0 Fridge 6.6 Phone 8.0 Scooter 10.8 Colour TV 12.5
Pucca home 28.9
Pucca home with more than one room for sleeping 16.1
More than 3 acres of irrigated-equivalent land 10.7 a Electricity, piped water and flush toilet (all three). Source: Calculated from NFHS-3 data (rural India, 2005-6).
Table 2b: Potential Exclusion Criteria
Proportion (%) of
excluded households, based on alternative sets
of exclusion criteriaa
Set 1 (baseline criteria) 22.6 (8.8)
Set 2 (baseline criteria or pucca house) 36.7 (11.9)
Set 3 (baseline criteria or multi-room pucca house) 28.7 (10.6)
Set 4 (baseline criteria or 3 acres of irrigated-equivalent land) 28.3 (11.1)
a In brackets, the corresponding figures when “inclusion criteria” override exclusion criteria (see discussion further in the text). Source: Calculated from NFHS-3 data (rural India, 2005-6). “Baseline criteria” refers to ownership of any of the baseline assets.

27
Table 3: Proportion (%) of Excluded Households, State-Wise
Set 1 Set 2 Set 3 Set 4 Jharkhand 9 15 13 10 Bihar 10 18 15 16 West Bengal 12 23 18 13 Chhattisgarh 12 16 15 18 Orissa 13 30 23 15 Madhya Pradesh 13 17 15 21 Assam 14 19 18 16 Uttar Pradesh 14 21 19 23 Rajasthan 20 42 31 28 Andhra Pradesh 25 52 32 30 North-eastern region 28 32 30 31 Karnataka 28 49 35 33 Maharashtra 29 42 34 36 Jammu and Kashmir 33 50 46 36 Tamil Nadu 31 66 39 33 Uttaranchal 38 49 45 44 Gujarat 42 58 46 48 Haryana 44 63 54 50 Himachal Pradesh 58 68 64 58 Punjab 65 74 69 67 Kerala 67 88 82 67 ALL INDIA 23 37 29 28
Source: Calculated from NFHS-3 data (rural India, 2005-6). Delhi and Goa are excluded from the table, but included in the last (“all India”) row. “North-eastern region” consists of Arunachal Pradesh, Manipur, Meghalaya, Mizoram, Nagaland, Sikkim and Tripura. States are arranged in ascending order of the proportion of excluded households under Set 1 (first column).

28
Table 4: Proportion (%) of Excluded Households in Different Reference Groups
Proportion (%) of excluded households in
the reference group, based on: Reference group
Set 1 Set 2 Set 3 Set 4
Poorest households (based on wealth index) a
Households with “low SLI”b Scheduled Castes Scheduled Tribes Landless households Households with no educated adult Households headed by single women:
Nuclear households Non-nuclear households
“Agricultural labour” householdsc
0.7 1.2 13.8 10.4 20.1 6.1 12.8 26.5 12.1
0.8 8.0 27.9 17.0 36.1 18.1 28.6 41.0 24.6
0.7 2.6 18.8 13.4 25.6 9.6 17.0 34.7 17.1
4.2 2.3 16.5 16.4 20.1 9.9 14.9 30.9 17.6
All rural households
22.6
36.7
28.6
28.3
a Lowest quintile of the “wealth index” scale (see text for details). b In rural areas, 45 per cent of all households belong to this category (see text for details). c Households with at least one adult member working as an agricultural labourer (for further discussion, see Section 3). Source: Calculated from NFHS-3 data (rural India, 2005-6).

29
Table 5: Potential Inclusion Criteria
Proportion (%) of rural households meeting the specified inclusion criteria
Single inclusion criteria:
SC/ST households
Landless households
Households with no educated adulta
Households headed by single women
Agricultural labour households
31.8
41.5
38.4
14.9
32.9
Any of the above criteria 78.9
Any two of the above criteria 47.5
a No adult attended school beyond Class 5. Source: Calculated from NFHS-3 data (rural India, 2005-6). For further details of the inclusion criteria, see text.
30
Table 6: Proportion (%) of SAB Households in Different Groups
Proportion (%) of Households in the SAB List Restrictive approach
Exclusion Approach
Inclusion Approach
Play-safe Approach
Proportion (%) of households with a BPL card, 2005-6
SC/ST households 87.4 87.4 100 100 41.2
Landless households 79.9 79.9 100 100 38.1
Households with no educated adult
93.9 93.9 100 100 39.6
Households headed by single women
82.2 82.2 100 100 34.8
Agricultural labour households
87.9 87.9 100 100 38.9
Households with low “SLI”
94.0 98.8 95.1 99.9 40.3
All rural householdsa 65.1
(54.1)
77.4
(63.3)
78.9
(78.9)
91.2
(88.1)
32.9
a In brackets, the corresponding figures when “pucca home” is added to the list of exclusion criteria (i.e. “Set 2” is used instead of “Set 1”). Source: Calculated from NFHS-3 data (rural India, 2005-6). The figures in the first panel indicate the proportion of households that would be selected into the SAB list based on combining the “baseline exclusion criteria” with the five inclusion criteria introduced in Section 3 (for the definition of different approaches, see text). The last column shows the proportion of households that actually had a BPL card in 2005-6.

31
Table 7: SAB Selection and Economic Status
Proportion (%) of Households in the SAB List, in Different Quintiles of the “Wealth Index” Scale
Restrictive approach
Exclusion approach
Inclusion approach
Play-safe approach
Poorest quintile 92.9 99.3 93.5 100
Second 79.3 95.1 83.0 98.8
Third 60.8 80.6 74.0 93.8
Fourth 23.4 35.7 65.2 74.5
Richest quintile 0.9 1.6 54.5 55.1
All households 65.1 77.4 78.9 91.2
Source: Calculated from NFHS-3 data (rural India, 2005-6).


![Constitution Order 19 - CONSTITUTION (SCHEDULED … Order 19 - CONSTITUTION (SCHEDULED CASTES) ORDER, 1950 THE CONSTITUTION (SCHEDULED CASTES) ORDER, 1950]1 (C.O.19) In exercise of](https://img.dokumen.tips/doc/110x75/5ab18ff97f8b9ad9788c72f0/constitution-order-19-constitution-scheduled-order-19-constitution-scheduled.jpg)