Embed Size (px)
Citation preview

Making Ontario’s electricity market work for your business
THE BOTTOM LINE ON ENERGY MANAGEMENT
18519.418374.718037.917778.917919.2
18838.220189.620968.121121.421392.2
21342.221253.421206.521271.221323.7
21518.422022.722738.523057.922668.6
22531.721487.620415.519381.418092.6
17703.517348.117118.317513.518437.8
20321.820842.921120.321278.821476.0
21413.220991.920824.821040.322284.6
22637.822424.722072.421429.820568.9
19927.017204.317294.817019.016893.8
17219.917971.719082.919960.720172.7
20225.719981.519751.419817.019711.7

Table of contents
1 WHAT’S INSIDE?
2 MARKET FUNDAMENTALS
Changes in Ontario’s electricity marketHow electricity pricing worksMaking the market work for your business
ENERGY MANAGEMENT TOOLS THAT WORK
4 INTERVAL METERS: Region of Peel6 CONSERVATION: Unilever Canada 8 RETAIL CONTRACTS: Confederation Freezers
10 LOAD SHIFTING: Oxford Properties
12 SUMMING UP

1
If you were looking for ways to increase your company’s profitability, chances are the first place you’d go to trimunnecessary waste would be your operating expenses – inareas such as wages, benefits, taxes and raw materials. But what about your electricity costs?
WHAT’S INSIDE?
For many managers, electricity is seen as a fixedcost – something they depend on to keep their production lines moving, but that can also take a sizable chunk out of overall profits. While they may regret the impact on the bottom line, there is certainly no way around it. Or so they think.
Increasingly, smart companies are beginning to understand that electricity costs are actually controllable costs. They are even finding that energy efficiency is good for business, good for the environment, and is particularly well-received by their company’s shareholders. In 2002, Canadianbusinesses actually saved $3.4 billion in purchasedenergy, simply by managing their energy use more effectively.(1) That’s money they were able to re-invest in their plants, in customer service and in their employees. Money that helped them stay competitive.
It might also surprise you to know that for somecompanies, a 20 per cent reduction in energy use is roughly equivalent to a 5 per cent increase in sales.(2) That’s a significant impact on any company’s bottom line. And given how far technology has come in improving the efficiency of industrial lighting, heating and cooling systems, 20 per cent is certainly a realistic energy management target for many businesses.
Ontario’s electricity market, opened in May 2002,provides new opportunities for companies to take control of their energy costs. This brochure,created by Ontario’s Independent Electricity System Operator (www.ieso.ca) – the not-for-profitentity entrusted with managing the province’s power system and wholesale electricity market –provides basic information about four such options, including:
• interval meters• conservation• retail contracts• load shifting
Through a series of real-life examples, this brochure will show you how four Ontario businessesare making the market work in their favour, with positive results measured on their bottom line, in overall competitiveness and in their corporate reputation.
We hope this brochure will guide you toward greater understanding of the market and that, going forward, every dollar you spend on managingelectricity is a dollar well-invested in your company’s future.
(1) Energy Ideas at Work, 2002/2003 Annual Report of Canadian
Industry Program for Energy Conservation, Office of Energy Efficiency,
Natural Resources Canada
(2) Why Energy Efficiency?, 2005 Briefing, Conference Board of Canada

2
Electricity is a controllable expense. The trick is in knowing how the market works and using thisinformation to your advantage.
But first, a little history. Faced with the prospect ofa significant long-term supply shortage, the OntarioGovernment passed Bill 100, the Ontario ElectricityRestructuring Act, in December 2004. The primarypurpose of the legislation was to reorganizeOntario’s electricity system to more effectivelyaddress the critical need for new supply, to encourage electricity conservation and to ensure
greater price stability for consumers across Ontario.There was also a need to encourage investment innew sources of electricity.
For businesses, the result is a market structurethat offers a combination of regulated, contract andcompetitive market prices for electricity, which provides them with the flexibility to better managetheir electricity costs. Overseeing this market is theOntario Energy Board – the provincial watchdog.
MARKET FUNDAMENTALS
A number of businesses pay the Hourly OntarioEnergy Price (HOEP) for electricity. This price –which is determined through a competitive processof generators bidding to supply electricity into themarket – fluctuates throughout the day according to supply and demand.
There are many factors that influence pricing. One isthe season in which electricity is used – prices aregenerally higher in winter and summer than they arein the spring and fall. Another is the time of day –prices tend to be higher in late afternoon and earlyevening. And still another is the source of electricity,some being much more expensive to run than others.When demand for electricity is high, more expensivegeneration is needed to meet that demand, drivingup the cost of power.
In the wholesale electricity market, interval meters –devices that measure and record electricity use over a given period of time – play a key role. If yourbusiness has an interval meter, you can monitor the data it gathers to determine exactly how muchelectricity is used at any given time of day. With thisinformation in hand, you can determine how muchyou are paying for each kilowatt-hour you use. You might decide that it makes economic sense tostagger your production when prices are high and tostart it up again when prices are low. Or you mightschedule plant maintenance during the hot summermonths, when prices are typically higher, rather than during milder springtime months when pricesmay be lower. If you do not have an interval meter,you are paying based on the consumption pattern ofyour area, rather than your own. Your Local
Changes in Ontario’s electricity market
How electricity pricing works

3
January 6.95¢/kWh
February 5.43¢/kWh
March 5.02¢/kWh
April 4.73¢/kWh
May 5.05¢/kWh
June 4.94¢/kWh
July 4.78¢/kWh
August 4.55¢/kWh
September 5.13¢/kWh
October 5.04¢/kWh
November 5.38¢/kWh
December 5.28¢/kWh
Monthly Average Wholesale Prices (2004)(Weighted*)
Making the market work for your business
What can you do to make Ontario’s wholesale electricity market work for you? Here are some considerations for ensuring your electricity budget is invested wisely.
Watch the clock… and the calendar. Because theprice for electricity fluctuates, it pays to understandthe electricity needs of your business on any givenday, throughout the year, and to plan accordingly.This is simple to do if your business has an intervalmeter. If it doesn’t, your local utility can help you to evaluate whether or not it makes sense to haveone installed so that you can begin to monitor andmanage your usage.
Know your threshold for risk. Some businesses –such as Confederation Freezers in Brampton (seepage 8) – prefer the security of knowing exactly whatall their fixed costs will be from one month to thenext. For them, fixed price retail contracts are asound choice. All electricity retailers are licensed by the Ontario Energy Board. For a list of approvedretailers, visit http://www.oeb.gov.on.ca/html/en/licen-ces/licensedmarketparticipants.htm.
Consider conservation. It may seem simple, but conservation still works. It works on the bottom linebecause you don’t pay for what you don’t use.
And it works for the environment because using less electricity results in fewer emissions and less waste.
Energy-efficient light bulbs such as compact fluorescent lights, modern heating and air conditioning systems and equipment upgrades areall effective ways to save money. Unilever Canadabegan implementing a company-wide conservationplan in 1999, and the full story on the financialbenefits of this energy management strategy can be found on page 6.
The following pages will highlight four ways to start managing your company’s electricity costs.Knowing which option to choose will depend on the nature of your business and its long-term goals. We hope these examples will begin to answer someof the questions you may have about Ontario’swholesale electricity market and, more importantly,how to make it work for you. If you decide to lookinto energy management further, you can turn to the inside back cover of this brochure for a list ofresources. To learn more about the electricity market, how it works, and the price at any time, visit the Independent Electricity System Operator’swebsite at www.ieso.ca.
Distribution Company (LDC) can help you to determine if it makes financial sense to invest in aninterval meter based on your consumption pattern.
Interval meters, along with the data they provide,and the ability to shift your electricity use from onetime of day to another (called load shifting), are justtwo energy management strategies at your disposal.The pros and cons of each will be discussed in thisbrochure starting on page 4.
Still other electricity users may choose a fixed pricecontract which means that they purchase short-or long-term contracts with electricity retailers who provide them with a fixed price per kilowatt-hour.Retail electricity contracts are like mortgages withfixed terms. Customers benefit from the security ofknowing exactly what their electricity will cost themper kilowatt-hour, without having to worry about theups and downs of the wholesale electricity market.
*Weighted based on Ontario Demand.

4
The Region of Peel is the second-largest municipality in Ontario, with a population of one million people. It includes the cities ofBrampton and Mississauga, west of Toronto, and the Town of Caledon,to the northwest.
“ …the Region of Peel has shaved more than $6 million from its energy budget, netting a total
savings of 15 per cent.”
Steve Hall, Director of Corporate Energy, Region of Peel
Who takes advantage of interval meters?
5
INTERVALMETERS
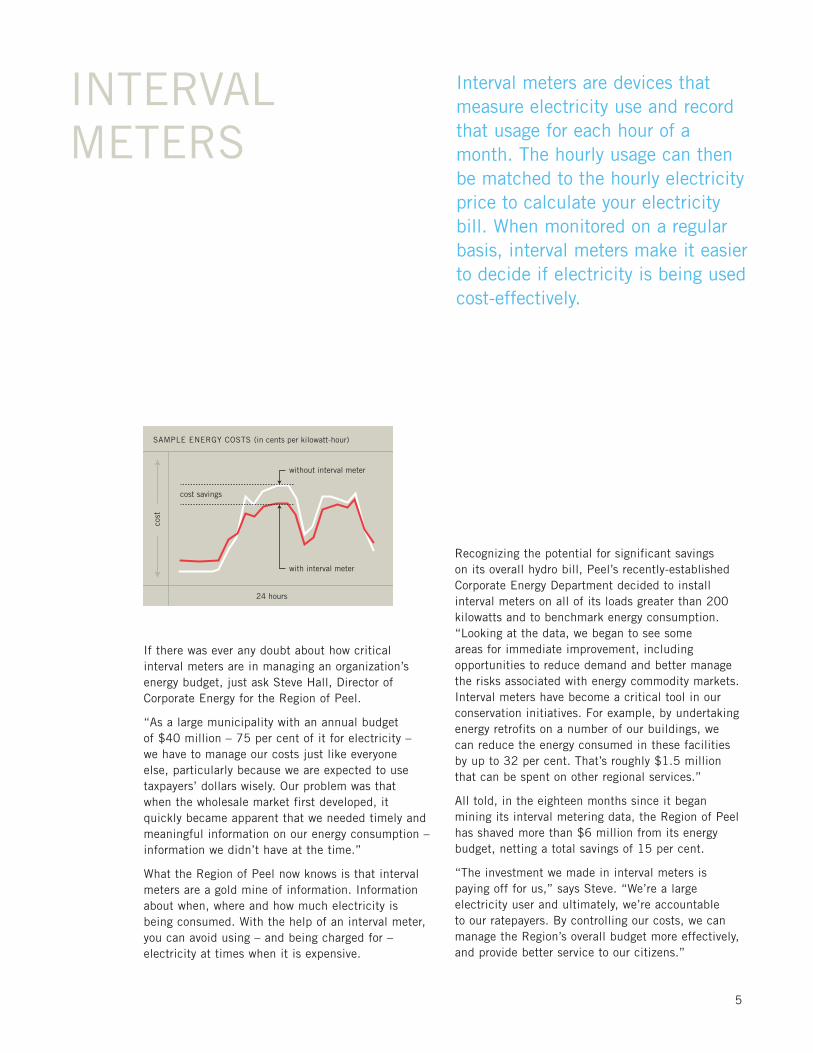
If there was ever any doubt about how critical interval meters are in managing an organization’senergy budget, just ask Steve Hall, Director ofCorporate Energy for the Region of Peel.
“As a large municipality with an annual budget of $40 million – 75 per cent of it for electricity –we have to manage our costs just like everyone else, particularly because we are expected to usetaxpayers’ dollars wisely. Our problem was that when the wholesale market first developed, it quickly became apparent that we needed timely and meaningful information on our energy consumption –information we didn’t have at the time.”
What the Region of Peel now knows is that intervalmeters are a gold mine of information. Informationabout when, where and how much electricity isbeing consumed. With the help of an interval meter,you can avoid using – and being charged for – electricity at times when it is expensive.
Recognizing the potential for significant savings on its overall hydro bill, Peel’s recently-establishedCorporate Energy Department decided to installinterval meters on all of its loads greater than 200kilowatts and to benchmark energy consumption.“Looking at the data, we began to see some areas for immediate improvement, including opportunities to reduce demand and better managethe risks associated with energy commodity markets.Interval meters have become a critical tool in ourconservation initiatives. For example, by undertakingenergy retrofits on a number of our buildings, wecan reduce the energy consumed in these facilitiesby up to 32 per cent. That’s roughly $1.5 millionthat can be spent on other regional services.”
All told, in the eighteen months since it began mining its interval metering data, the Region of Peelhas shaved more than $6 million from its energybudget, netting a total savings of 15 per cent.
“The investment we made in interval meters is paying off for us,” says Steve. “We’re a large electricity user and ultimately, we’re accountable to our ratepayers. By controlling our costs, we canmanage the Region’s overall budget more effectively,and provide better service to our citizens.”
SAMPLE ENERGY COSTS (in cents per kilowatt-hour)
24 hours
without interval meter
with interval meter
cost savings
6
4.5
3
1.5
0
cost
Interval meters are devices thatmeasure electricity use and recordthat usage for each hour of amonth. The hourly usage can thenbe matched to the hourly electricityprice to calculate your electricitybill. When monitored on a regularbasis, interval meters make it easierto decide if electricity is being usedcost-effectively.

6
Nobody knows better than Doug Dittburner, ChiefEngineer for Unilever Canada’s manufacturing plantin Rexdale, Ontario, that energy conservation is firstand foremost a numbers game. Get the numbersright, and the bottom-line and environmental benefits will follow.
Six years ago, 15 per cent of the plant’s total operating costs were consumed by electricity. “In 1999, our electricity costs were already high and we knew they would only get higher, so wedecided to try to wrestle that 15 per cent to the ground by conserving energy. It meant lookingcritically at all of our systems to see where we could improve,” says Doug.
With the full backing of Unilever Canada’s seniormanagement team and a corporate culture committed to continuous improvement, Doug and his energy team began to meet their conservationchallenge by setting measurable targets. “In the first year, our goal was a 6 per cent reduction inoverall energy costs. To our surprise, we achieved a solid 11 per cent result.”
In the intervening years, plant staff installed energy-efficiency equipment such as new lightingand temperature controls. Motion sensors now flip
lights on only as needed. Pumps work moreefficiently to deliver just the right amount of lift.Maintenance is scheduled on a regular basis. Theresult is that natural gas consumption at the planthas decreased by 39 per cent; electricity use hasfallen by 24 per cent; and steam, by 50 per cent.The plant uses 52 per cent less water, capturesalmost all of its cardboard for recycling, and sends468 metric tonnes less waste to landfill.
“What began as a plan to save on our electricity bill has ended up yielding $4 million in savingsevery year, at an overall cost of $2.7 million,” says Doug. “The impact on our bottom line has been phenomenal.”
While targets are a necessary part of any conservation strategy, Doug is adamant that toachieve sustained results requires careful monitoringof each new procedure or piece of equipment. At his plant, employees know exactly which conservation measures work and which do not contribute to the overall target.
They also know that for each kilowatt-hour of energy they don’t use, their plant is managing itsenvironmental footprint. “That makes a world of difference for our local community, who see us asresponsible corporate citizens, but it also means alot to our shareholders. They look at the bottom line,but they also need to know that we achieved ourresults in a responsible manner.”
ELECTRICITY CONSUMPTION (in kWh)
5 years
load increased during off-peak hours
load decreased during peak hours
elec
tric
ity
cons
umpt
ion
average consumption indicating results ofconservation measures
CONSERVATION Energy conservation refers to practices that help companies useless energy without compromisingproduction, and reduce greenhousegas emissions that contribute toglobal climate change. For somebusinesses, the best way to saveelectricity is to turn off the lightswhen leaving the room or to shutdown computers at night. For others, it involves a comprehensiveenergy plan that might call for the installation of energy-efficientlighting and more streamlined manufacturing processes.
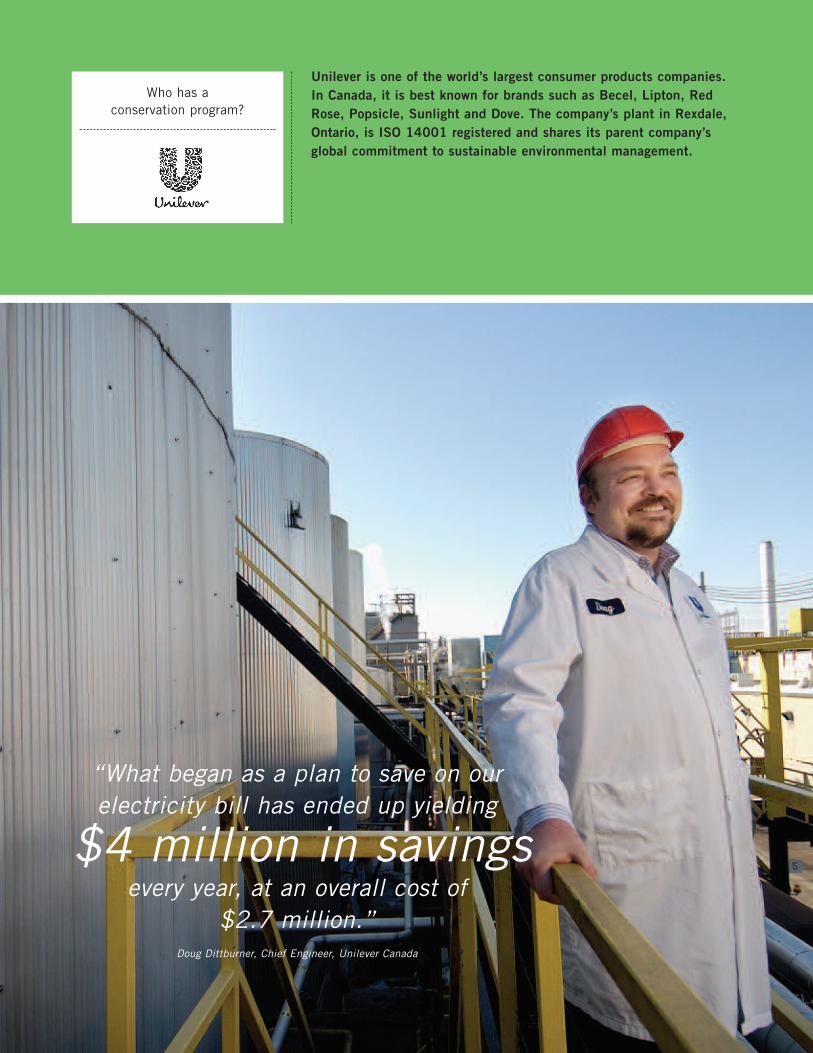
“What began as a plan to save on our electricity bill has ended up yielding
$4 million in savingsevery year, at an overall cost of
$2.7 million.”Doug Dittburner, Chief Engineer, Unilever Canada
Unilever is one of the world’s largest consumer products companies.In Canada, it is best known for brands such as Becel, Lipton, RedRose, Popsicle, Sunlight and Dove. The company’s plant in Rexdale,Ontario, is ISO 14001 registered and shares its parent company’sglobal commitment to sustainable environmental management.
Who has a conservation program?

Who uses retail contracts?Confederation Freezers is one of the largest public refrigerated warehousing, cold storage and blast freezing companies in SouthernOntario. To keep its 19 million cubic feet of warehousing space cold – sometimes as low as - 40 ºC – requires significant amounts ofelectricity, and operating the plant’s refrigeration systems efficiently is critical. In this highly competitive business, the company’s biggestchallenge since the electricity market opened in 2002 has been todevelop a plan to deal with volatile spot market prices – costs thatcannot be passed on to customers.
“There is no way I would have been able to evaluate their offerings – whether
simple or structuredblocks of power – had I not become an
informed consumer first.” Fred Leonenko, Chief Operating Engineer, Confederation Freezers

9
Retail electricity contracts offercustomers one major benefit:peace of mind from the certaintyof knowing they are paying a fixed price for electricity over the duration of the contract. Customers know the cost is fixedand will not change no matterhow volatile the market becomes.
RETAIL CONTRACTS
Fred Leonenko, Chief Operating Engineer, atConfederation Freezers in Brampton, Ontario, says that as the market opened, the senior management team knew there would be new complexities and dynamics at play, and that to stay competitive they would need to understand the new rules of the game.
Prior to May 2002, when the Government of Ontario opened the electricity market to competition,Fred’s job consisted of managing ConfederationFreezers’ four warehousing facilities, ensuring theequipment was keeping customers’ frozen productsat the right temperature for storage. However,overnight, his job description expanded. He had tostart learning how the new electricity market worked,how electricity was priced, who sold it and how itwas produced, so that he would be able to help his company to weather the price spikes that werehaving a significant impact on the bottom line.
After teaching himself the basics, Fred contactedseveral electricity retailers for advice. “It was a bit like the Wild West out there, in the early days of retail contracts. I wanted someone who wouldpartner with us, understand our business, recognizehow competitive it is and recommend a solution that was tailored to our needs. I remember it beingreally confusing.”
After careful consideration of its load profile – theamount of electricity used at certain times of theday and at specific times of the year – ConfederationFreezers’ solution was to purchase a short-termretail contract. The fixed-price contract wasdesigned to cover 60 per cent of Confederation’selectricity requirements. Fred reasoned that if thebulk of Confederation’s electricity needs were lockedinto a fixed-price contract – much like purchasing afixed mortgage – the company would have peace ofmind most of the time. For the remainder, he knewthat as an engineer, he could keep costs down byensuring his equipment ran as smoothly and as efficiently as possible. It was cost containmentbased on his philosophy of not being wasteful.
“I couldn’t have made a decision about which retailcontract was better than the next if I hadn’t done my homework first,” says Fred. “I needed to knowhow our business operated – when we used moreelectricity, when we used less. With that informationin hand, I went to retailers to see if they had thetype of contracts we needed. There is no way Iwould have been able to evaluate their offerings –whether simple or structured blocks of power – had I not become an informed consumer first.”
Fred says Confederation Freezers is encouraged bythe results of its decision to manage its electricitycosts with retail contracts. “We didn’t go into this tosave money. We signed these contracts so we wouldbe able to forecast and plan better. I’m very happywith the results so far.”
HOURLY ONTARIO ENERGY PRICE (HOEP)
1 month
pric
efl
uctu
atio
n
fixed price

10
LOAD SHIFTING
In the highly competitive world of corporate realestate and property management, competitivenesscomes down to costs per square foot. Keep the costslow and tenants are attracted; raise them and whenthey’re thinking of renewing their lease, they maystart to look around at the competition.
Bill Braun manages Oxford Properties’ Bell TrinitySquare – a one million square foot property locatedin downtown Toronto. The building has been rankedone of the most energy efficient in its peer group of buildings and, in 2002 it won the BuildingOwners and Managers Association (BOMA) Canada’sCertificate of Building Excellence.
How does Oxford maintain a target of 24 kilowatt-hours of electricity per square foot, when otherbuildings of a similar size use 23 per cent more?
“We need to make every cent we spend on electricitywork as hard as it can for us,” says Bill. “That’s why we installed variable-speed drives on our HVACsystems and motion sensors on our lighting systems.We also have a thermal water storage tank in thebasement of the building. It allows us to cool waterat night and store it so that during the daytime,when tenants are at work, it can be circulated tocondition air and supply chilled water. Because electricity costs less at night than during the day,
this giant tank allows us to achieve tremendous savings. The minute we have to rely on our chillersto cool the building during the day, I know we willexceed our energy budget for the month.”
Load shifting is an integral part of Oxford Properties’ energy management strategy. And itmeans that Bill and his team have to constantly beon the alert. They need to understand exactly howmuch electricity is used when, and for what purpose,at any point during the day. And know what to turn off, or on, if it looks like the buildings’ systems are using too much electricity.
While load shifting is not a new concept – somecompanies do it, for instance, by scheduling electricity-intensive activities in the evening whenelectricity is less expensive – it has become morecommon since Ontario’s electricity market wasrestructured. As a result of these changes, smartcompanies are learning to manage their consumptionduring ‘peak’ (more expensive) and ‘off-peak’ (less expensive) times. They want to avoid expensiveprice spikes and try to keep their costs as close to level as they can.
“This building is one finely-tuned machine,” says Bill. “Our tenants sign leases based on a projected cost per square foot. We can’t change the conditions of the lease just because electricitycosts more. What we can change is the way we manage our costs. Our challenge, every day, is to get as much out of every dollar we spend on electricity as possible.”
Load shifting refers to the practice of rescheduling operations to periods of the daywhen the cost of electricity ischeaper. Since interval meters are the only way to determineexactly how much electricity isused at any given time of day, theprerequisite for load shifting is an interval meter. (Using intervalmeter data to shift your load may help reduce the electricitycomponent of your bill).
TYPICAL AVERAGE LOAD (in kWh)
24 hours
load increased in off-peak hours
typical load profile
load decreased inpeak hours
cost savings
6
4.5
3
1.5
0
elec
tric
ity
cons
umpt
ion
TYPICAL AVERAG
load increased during off-hours
t
elec
tric
ity
cons
umpt
ion

Oxford Properties owns 44 million square feet of commercial spaceacross Canada, half of it in Toronto and surrounding areas. One of itslandmark buildings is Royal Bank Plaza in the city’s financial core. Oxford also manages about 40 million square feet of commercial,retail and industrial property Canada-wide.
“We need to make
every cent we spend on electricity work as hard as
it can for us.”Bill Braun, Property Manager, Oxford Properties’ Bell Trinity Square
Who takes advantage ofload shifting?

12
With the changes introduced three years ago to Ontario’s wholesale electricity market, businesses have been given a challenging but potentially rewarding opportunity: managing the bottom-line impact of a commodity whose price fluctuates according to the laws of supply and demand. A commodity that may be more expensive at certain times of the day, or during certain months of the year. A commodity whose price they never had much control over… until now.
Electricity costs can be managed, just like any other operating expense. Whetheryou choose to level out your costs by signing up with an energy retailer, by shiftingyour production from peak hours to off-peak hours, or by implementing energy-conservation measures such as turning your company’s computers off at night when they’re not in use, the point is that you are now in the driver’s seat.
Managing your electricity costs starts with monitoring your usage. Know how much electricity you use, know when you use it, know why you use it. Your LocalDistribution Company (LDC) can help you with this. By developing an energy planthat’s tailor-made for your business, you can then begin to monitor your plan’sprogress, take corrective measures as required and reap the rewards of knowing that you invested your electricity budget wisely.
To learn more about energy efficiency, here is a list of additional resources you may wish to consult:
Natural Resources Canadawww.oee.nrcan.gc.ca/english/index.cfm
Ministry of Energywww.energy.gov.on.ca
Ontario Energy Boardwww.oeb.gov.on.ca
Your Local Distribution Company www.ieso.ca/imoweb/siteshared/local_dist.asp
SUMMING UP

This brochure was prepared by Ontario’s Independent ElectricitySystem Operator (IESO) – a not-for-profit entity established by theGovernment of Ontario to manage the province’s power system so that Ontarians receive power when and where they need it. Ontario’sIESO balances demand for electricity against available supply throughthe wholesale market and directs the flow of electricity across the transmission system. To find out more about the IESO, visit our website at www.ieso.ca.

18519.418374.718037.917778.917919.2
18838.220189.620968.121121.421392.2
21342.221253.421206.521271.221323.7
21518.422022.722738.523057.922668.6
22531.721487.620415.519381.418092.6
17703.517348.117118.317513.518437.8
20321.820842.921120.321278.821476.0
21413.220991.920824.821040.322284.6
22637.822424.722072.421429.820568.9
19927.017204.317294.817019.016893.8
17219.917971.719082.919960.720172.7
20225.719981.519751.419817.019711.7